Embed Size (px)
Citation preview
C:Fo
odCh
emist
ry&
Toxic
ology
JFS C: Food Chemistry and Toxicology
Carotenoids and Color of Fruit Juiceand Milk Beverage MixturesA. ZULUETA, M.J. ESTEVE, AND A. FRIGOLA
ABSTRACT: Seventeen commercially available, “ready to drink” fortified beverages consisting of mixtures of fruitjuices and milk were analyzed to evaluate their carotenoid profile (including their Z/E stereoisomers) and colorduring their commercial shelf life. Lightness (L*) was found to be correlated with the content of milk in the mix-tures (r = 0.649) whereas red-yellow colors were correlated with the contents of α-carotene, β-cryptoxanthin, andβ-carotene supplied by the fruit. The beverages stored under refrigeration (4 ± 2 ◦C) showed higher luminosity (L*)and higher saturation of color (C*) and yellowness (b*). Differences (P < 0.05) in the levels of carotenoids were foundamong the beverages. Common fruits such as apple, lemon, pear, strawberry, kiwifruit, pineapple, and banana werelow in carotenoids. However, orange, apricot, mango, and peach contributed significantly (P < 0.05) to increasingβ-cryptoxanthin and β-carotene concentrations. Passion fruit supplied ζ -carotene, and the presence of carrot in-creased the levels of α-carotene and β-carotene. Conversion of all-E β-carotene and β-cryptoxanthin to their Z iso-mers took place in 8 of the 17 samples containing α-carotene and in 9 of the 13 samples containing β-cryptoxanthin,respectively, which resulted in some loss of provitamin A activity and nutritional value.
Keywords: color, carotenoids, fruit juice–milk beverages, provitamin A, Z/E isomers
Introduction
Current developments in new ready-to-drink beverages arebased on drinks containing combinations of milk and fruit
juices, which have been receiving considerable attention as theirmarket potential is growing (Sharma 2005). Mixed fruit juice andmilk beverages fortified with vitamins, minerals, and fibers areamong the most widely consumed functional foods (Pszczola2005). Consumption of these products has increased by 30% inEurope in the last 10 y (MAPA 2003). Despite the growing con-sumption of nutritional supplements (Kuzminski 1999) and forti-fied foods such as ATBC drinks (supplemented with vitamins A, C,and E as protective micronutrients) (Carle 1999; Marx and others2000; Schieber and others 2002), little attention has so far been paidto the carotenoid stereoisomers present in these types of food andto the amounts that finally reach the consumer.
The importance of carotenoids is mainly based on theirprovitamin A activity and their antioxidant capacity (Britton 1995),although not all the carotenoids present in fruits and vegetables areprecursors of vitamin A. Certain carotenoids, including α-carotene,β-carotene, and β-cryptoxanthin, have provitamin A activity, be-ing transformed into retinol by mammals (Simpson and Chichester1981). Carotenoids predominantly occur in the thermodynamicallyfavored all-E isomers (Rodriguez-Amaya 2001). As they are highlyunsaturated, the application of some industrial treatments leads tothe formation of Z isomers, which do not possess the same provi-tamin activity as E isomers. Heat, light, oxygen, and the presence ofelectrophilic compounds are the factors that mostly cause degrada-tion of carotenoids in foods (Dugave and Demange 2003).
The stability of carotenoids during their commercial shelf life isvery important if the final product is to be attractive and accept-able. The isomerization and oxidation of carotenoids result in a loss
MS 20070168 Submitted 3/7/2007, Accepted 8/7/2007. Authors are with Areade Nutricion y Bromatologıa, Facultat de Farmacia, Univ. de Valencia, Ave.Vicent Andres Estelles s/n, 46100 Burjassot (Valencia), Spain. Direct in-quiries to author Frıgola (E-mail: [email protected]).
of color, which is one of the most important attributes related toquality affecting choice of purchase (Calvo and others 2001; Bakerand Gunter 2004). Color is, alongside freshness, one of the maincriteria for food selection by the consumer. For this reason, color-ings are added to many foods to make them appear healthier andmore appealing. The objective of the present study was to evalu-ate the quality of commercial beverage mixtures of fruit juices andmilk in terms of their total carotenoid content, provitamin A, andcolor.
Materials and Methods
Chemicals and reagentsβ-Carotene, lutein, and butylated hydroxytoluene (BHT) (special
grade) were purchased from Sigma (Steinheim, Germany). Zeaxan-thin was purchased from Fluka (Steinheim, Germany). Ammoniumacetate (LC grade), petroleum ether, hexane (LC grade), potas-sium hydroxide (85%), and tert-butyl methyl ether (TBME) (LCgrade) were purchased from Scharlau (Barcelona, Spain). Magne-sium hydroxide carbonate (40% to 45%) was purchased from Pan-reac (Barcelona, Spain); ethanol, acetonitrile (special grade), di-ethyl ether, methanol, and sodium chloride (special grade) werepurchased from Baker (Deventer, The Netherlands); and chloro-form was obtained from Merck (Darmstadt, Germany).
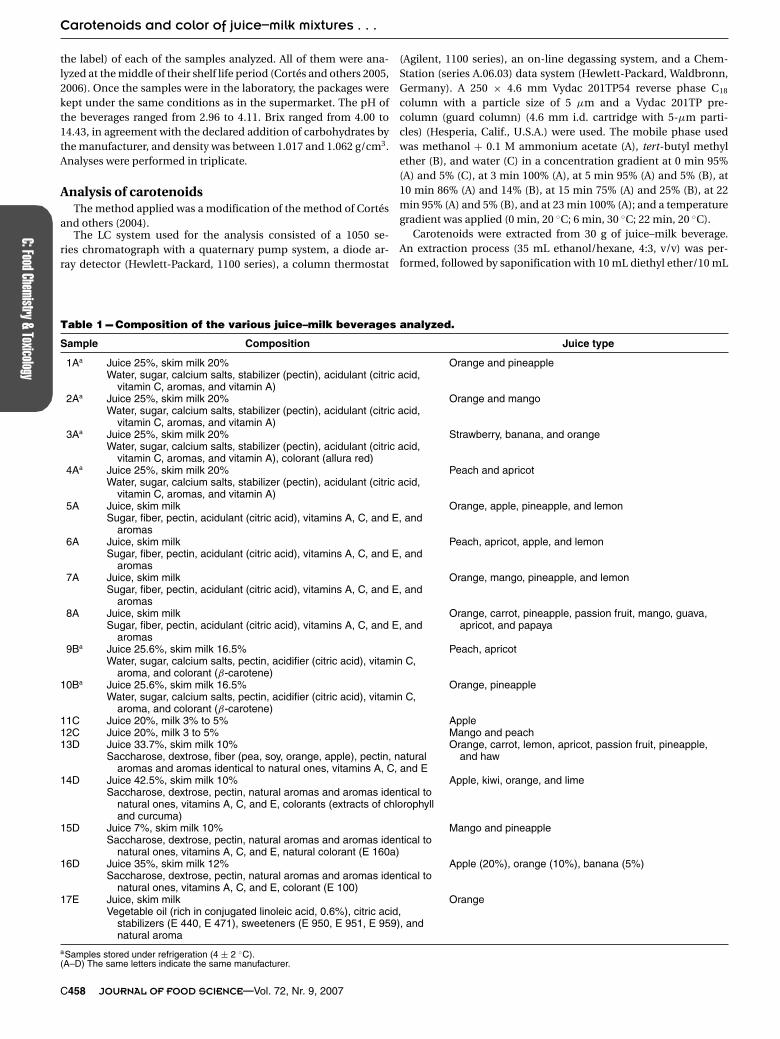
SamplesTwo batches of 17 different juice–milk beverages made by 5 dif-
ferent manufacturers were purchased from a local supermarket(Valencia, Spain) and were coded as A, B, C, D, and E (same letterindicates same manufacturer). All of them were packaged in TetraBrik cartons. Eleven of them had been processed by UHT and werekept in the supermarket at room temperature (20 ± 2 ◦C), havinga shelf life of up to 12 mo. Six of them (1A, 2A, 3A, 4A, 9B, 10B)had been processed by pasteurization and were kept under refrig-eration (4 ± 2 ◦C), having a shelf life of up to 2 mo as declared onthe label by the producer. Table 1 gives the details (as indicated on
C© 2007 Institute of Food Technologists Vol. 72, Nr. 9, 2007—JOURNAL OF FOOD SCIENCE C457doi: 10.1111/j.1750-3841.2007.00550.xFurther reproduction without permission is prohibited
C:FoodChemistry&Toxicology
Carotenoids and color of juice–milk mixtures . . .
the label) of each of the samples analyzed. All of them were ana-lyzed at the middle of their shelf life period (Cortes and others 2005,2006). Once the samples were in the laboratory, the packages werekept under the same conditions as in the supermarket. The pH ofthe beverages ranged from 2.96 to 4.11. Brix ranged from 4.00 to14.43, in agreement with the declared addition of carbohydrates bythe manufacturer, and density was between 1.017 and 1.062 g/cm3.Analyses were performed in triplicate.
Analysis of carotenoidsThe method applied was a modification of the method of Cortes
and others (2004).The LC system used for the analysis consisted of a 1050 se-
ries chromatograph with a quaternary pump system, a diode ar-ray detector (Hewlett-Packard, 1100 series), a column thermostat
Table 1 --- Composition of the various juice–milk beverages analyzed.
Sample Composition Juice type
1Aa Juice 25%, skim milk 20% Orange and pineappleWater, sugar, calcium salts, stabilizer (pectin), acidulant (citric acid,
vitamin C, aromas, and vitamin A)2Aa Juice 25%, skim milk 20% Orange and mango
Water, sugar, calcium salts, stabilizer (pectin), acidulant (citric acid,vitamin C, aromas, and vitamin A)
3Aa Juice 25%, skim milk 20% Strawberry, banana, and orangeWater, sugar, calcium salts, stabilizer (pectin), acidulant (citric acid,
vitamin C, aromas, and vitamin A), colorant (allura red)4Aa Juice 25%, skim milk 20% Peach and apricot
Water, sugar, calcium salts, stabilizer (pectin), acidulant (citric acid,vitamin C, aromas, and vitamin A)
5A Juice, skim milk Orange, apple, pineapple, and lemonSugar, fiber, pectin, acidulant (citric acid), vitamins A, C, and E, and
aromas6A Juice, skim milk Peach, apricot, apple, and lemon
Sugar, fiber, pectin, acidulant (citric acid), vitamins A, C, and E, andaromas
7A Juice, skim milk Orange, mango, pineapple, and lemonSugar, fiber, pectin, acidulant (citric acid), vitamins A, C, and E, and
aromas8A Juice, skim milk Orange, carrot, pineapple, passion fruit, mango, guava,
apricot, and papayaSugar, fiber, pectin, acidulant (citric acid), vitamins A, C, and E, andaromas
9Ba Juice 25.6%, skim milk 16.5% Peach, apricotWater, sugar, calcium salts, pectin, acidifier (citric acid), vitamin C,
aroma, and colorant (β-carotene)10Ba Juice 25.6%, skim milk 16.5% Orange, pineapple
Water, sugar, calcium salts, pectin, acidifier (citric acid), vitamin C,aroma, and colorant (β-carotene)
11C Juice 20%, milk 3% to 5% Apple12C Juice 20%, milk 3 to 5% Mango and peach13D Juice 33.7%, skim milk 10% Orange, carrot, lemon, apricot, passion fruit, pineapple,
and hawSaccharose, dextrose, fiber (pea, soy, orange, apple), pectin, naturalaromas and aromas identical to natural ones, vitamins A, C, and E
14D Juice 42.5%, skim milk 10% Apple, kiwi, orange, and limeSaccharose, dextrose, pectin, natural aromas and aromas identical to
natural ones, vitamins A, C, and E, colorants (extracts of chlorophylland curcuma)
15D Juice 7%, skim milk 10% Mango and pineappleSaccharose, dextrose, pectin, natural aromas and aromas identical to
natural ones, vitamins A, C, and E, natural colorant (E 160a)16D Juice 35%, skim milk 12% Apple (20%), orange (10%), banana (5%)
Saccharose, dextrose, pectin, natural aromas and aromas identical tonatural ones, vitamins A, C, and E, colorant (E 100)
17E Juice, skim milk OrangeVegetable oil (rich in conjugated linoleic acid, 0.6%), citric acid,
stabilizers (E 440, E 471), sweeteners (E 950, E 951, E 959), andnatural aroma
aSamples stored under refrigeration (4 ± 2 ◦C).(A–D) The same letters indicate the same manufacturer.
(Agilent, 1100 series), an on-line degassing system, and a Chem-Station (series A.06.03) data system (Hewlett-Packard, Waldbronn,Germany). A 250 × 4.6 mm Vydac 201TP54 reverse phase C18
column with a particle size of 5 µm and a Vydac 201TP pre-column (guard column) (4.6 mm i.d. cartridge with 5-µm parti-cles) (Hesperia, Calif., U.S.A.) were used. The mobile phase usedwas methanol + 0.1 M ammonium acetate (A), tert-butyl methylether (B), and water (C) in a concentration gradient at 0 min 95%(A) and 5% (C), at 3 min 100% (A), at 5 min 95% (A) and 5% (B), at10 min 86% (A) and 14% (B), at 15 min 75% (A) and 25% (B), at 22min 95% (A) and 5% (B), and at 23 min 100% (A); and a temperaturegradient was applied (0 min, 20 ◦C; 6 min, 30 ◦C; 22 min, 20 ◦C).
Carotenoids were extracted from 30 g of juice–milk beverage.An extraction process (35 mL ethanol/hexane, 4:3, v/v) was per-formed, followed by saponification with 10 mL diethyl ether/10 mL
C458 JOURNAL OF FOOD SCIENCE—Vol. 72, Nr. 9, 2007
C:Fo
odCh
emist
ry&
Toxic
ology
Carotenoids and color of juice–milk mixtures . . .
methanolic KOH (0.1%, w/v, BHT) (1:1, v/v) for 0.5 h at room tem-perature.
Identification and quantification of carotenoids. Thecarotenoids (including geometrical isomers) in the beveragesanalyzed were identified and quantified by UV-vis spectra andretention times in HPLC using the HP ChemStation A.06.03 sys-tem. The different Z isomers were identified using the Q ratio =DIImax/DB, which is the quotient between band II (normally λmax)and the cis peak band (Saleh and Tan 1991; Chen and Chen 1994;Chen and others 1995).
We quantified the different carotenoids in accordance with theirsimilarity in terms of chemical-structural behavior and polarity,with respect to the validated standards for which we had a cali-bration curve: lutein, zeaxanthin, and β-carotene. Accordingly, forthe quantification we proceeded as follows: the chromatogram wasseparated into 3 parts; all of the carotenoids up to and includinglutein were quantified as such, and the remaining xanthophyllswere quantified as zeaxanthin. The carotenoids were quantifiedwith the β-carotene standard. Each carotenoid was quantified inaccordance with whether its maximum λ was close to 290, 350, 430,or 450 nm (Cortes and others 2004).
Color measurementThe color of the different beverages was measured with a
Hunter Labscan II spectrophotometric colorimeter (Hunter As-sociates Laboratory Inc., Reston, Va., U.S.A.) controlled by acomputer that calculated color coordinates from the reflectancespectrum (Calvo and Duran 1997). The results were expressed inaccordance with the CIELAB system with reference to illuminantD65 and with a visual angle of 10◦. The samples were placed in anoptical glass tray, using the white plate of the colorimeter as thebackground (standard white plate nr LS 13681 11/86, X = 78.50,Y = 83.32, Z = 87.94). This background was used to standardizethe measurements. The results were expressed as tristimulus val-ues corresponding to the CIELAB uniform color space (CIE 1978)(L∗: lightness [0 = black, 100 = white], a∗ [–a∗ = greenness, +a∗ =redness], and b∗ [–b∗ = blueness, +b∗ = yellowness]). Three consec-utive measurements of each sample were taken.
These values were then used to calculate hue degree (h0 = arctangent [b∗/a∗]) and chroma [C = (a∗2 + b∗2)1/2], which is the in-tensity or color saturation.
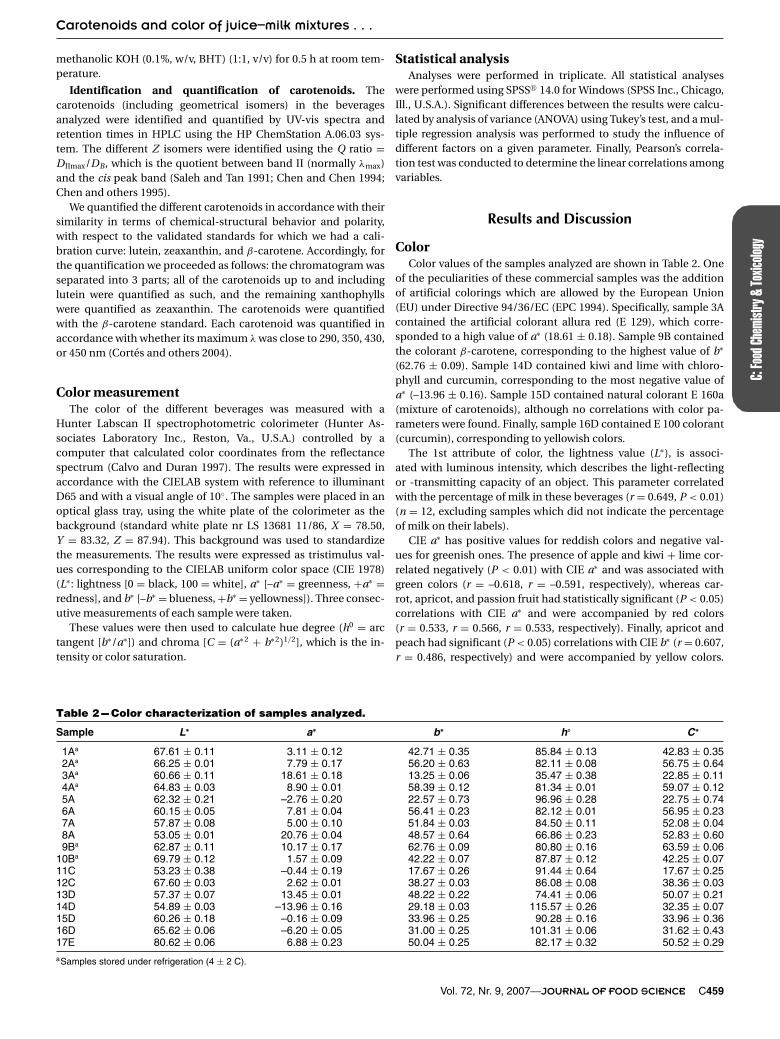
Table 2 --- Color characterization of samples analyzed.
Sample L∗ a∗ b∗ h◦ C∗
1Aa 67.61 ± 0.11 3.11 ± 0.12 42.71 ± 0.35 85.84 ± 0.13 42.83 ± 0.352Aa 66.25 ± 0.01 7.79 ± 0.17 56.20 ± 0.63 82.11 ± 0.08 56.75 ± 0.643Aa 60.66 ± 0.11 18.61 ± 0.18 13.25 ± 0.06 35.47 ± 0.38 22.85 ± 0.114Aa 64.83 ± 0.03 8.90 ± 0.01 58.39 ± 0.12 81.34 ± 0.01 59.07 ± 0.125A 62.32 ± 0.21 –2.76 ± 0.20 22.57 ± 0.73 96.96 ± 0.28 22.75 ± 0.746A 60.15 ± 0.05 7.81 ± 0.04 56.41 ± 0.23 82.12 ± 0.01 56.95 ± 0.237A 57.87 ± 0.08 5.00 ± 0.10 51.84 ± 0.03 84.50 ± 0.11 52.08 ± 0.048A 53.05 ± 0.01 20.76 ± 0.04 48.57 ± 0.64 66.86 ± 0.23 52.83 ± 0.609Ba 62.87 ± 0.11 10.17 ± 0.17 62.76 ± 0.09 80.80 ± 0.16 63.59 ± 0.06
10Ba 69.79 ± 0.12 1.57 ± 0.09 42.22 ± 0.07 87.87 ± 0.12 42.25 ± 0.0711C 53.23 ± 0.38 –0.44 ± 0.19 17.67 ± 0.26 91.44 ± 0.64 17.67 ± 0.2512C 67.60 ± 0.03 2.62 ± 0.01 38.27 ± 0.03 86.08 ± 0.08 38.36 ± 0.0313D 57.37 ± 0.07 13.45 ± 0.01 48.22 ± 0.22 74.41 ± 0.06 50.07 ± 0.2114D 54.89 ± 0.03 –13.96 ± 0.16 29.18 ± 0.03 115.57 ± 0.26 32.35 ± 0.0715D 60.26 ± 0.18 –0.16 ± 0.09 33.96 ± 0.25 90.28 ± 0.16 33.96 ± 0.3616D 65.62 ± 0.06 –6.20 ± 0.05 31.00 ± 0.25 101.31 ± 0.06 31.62 ± 0.4317E 80.62 ± 0.06 6.88 ± 0.23 50.04 ± 0.25 82.17 ± 0.32 50.52 ± 0.29
aSamples stored under refrigeration (4 ± 2 C).
Statistical analysisAnalyses were performed in triplicate. All statistical analyses
were performed using SPSS� 14.0 for Windows (SPSS Inc., Chicago,Ill., U.S.A.). Significant differences between the results were calcu-lated by analysis of variance (ANOVA) using Tukey’s test, and a mul-tiple regression analysis was performed to study the influence ofdifferent factors on a given parameter. Finally, Pearson’s correla-tion test was conducted to determine the linear correlations amongvariables.
Results and Discussion
ColorColor values of the samples analyzed are shown in Table 2. One
of the peculiarities of these commercial samples was the additionof artificial colorings which are allowed by the European Union(EU) under Directive 94/36/EC (EPC 1994). Specifically, sample 3Acontained the artificial colorant allura red (E 129), which corre-sponded to a high value of a∗ (18.61 ± 0.18). Sample 9B containedthe colorant β-carotene, corresponding to the highest value of b∗
(62.76 ± 0.09). Sample 14D contained kiwi and lime with chloro-phyll and curcumin, corresponding to the most negative value ofa∗ (–13.96 ± 0.16). Sample 15D contained natural colorant E 160a(mixture of carotenoids), although no correlations with color pa-rameters were found. Finally, sample 16D contained E 100 colorant(curcumin), corresponding to yellowish colors.
The 1st attribute of color, the lightness value (L∗), is associ-ated with luminous intensity, which describes the light-reflectingor -transmitting capacity of an object. This parameter correlatedwith the percentage of milk in these beverages (r = 0.649, P < 0.01)(n = 12, excluding samples which did not indicate the percentageof milk on their labels).
CIE a∗ has positive values for reddish colors and negative val-ues for greenish ones. The presence of apple and kiwi + lime cor-related negatively (P < 0.01) with CIE a∗ and was associated withgreen colors (r = –0.618, r = –0.591, respectively), whereas car-rot, apricot, and passion fruit had statistically significant (P < 0.05)correlations with CIE a∗ and were accompanied by red colors(r = 0.533, r = 0.566, r = 0.533, respectively). Finally, apricot andpeach had significant (P < 0.05) correlations with CIE b∗ (r = 0.607,r = 0.486, respectively) and were accompanied by yellow colors.
Vol. 72, Nr. 9, 2007—JOURNAL OF FOOD SCIENCE C459
C:FoodChemistry&Toxicology
Carotenoids and color of juice–milk mixtures . . .
Hue value (h◦) corresponds to whether the object is red, orange,yellow, green, blue, or violet. The h◦ value of the fruit juice–milkbeverages ranged from 35.47 to 115.57, owing to the high variabil-ity in color among the samples. Typically yellow-red fruits and veg-etables present in these beverages, such as peach, apricot, carrot,guava, papaya, and passion fruit, were associated with h0 < 90◦,whereas apple, lemon, lime, and kiwi fruits in the juices were as-sociated with h0 > 90◦. On the other hand, chroma (C∗) describesthe degree of saturation, purity, or intensity of color. There was astatistically significant correlation (P < 0.05) between the chromavalue and the presence of apricot (r = 0.646) or peach (r = 0.464),indicating a high intensity of color.
With regard to storage conditions, samples stored under re-frigeration had greater lightness (L∗) than those stored at roomtemperature (65.33 ± 3.28 and 59.24 ± 4.71, respectively), greateryellowness (45.92 ± 17.25 and 38.88 ± 12.64, respectively),and higher color saturation (47.88 ± 14.36 and 39.92 ± 13.00,respectively).
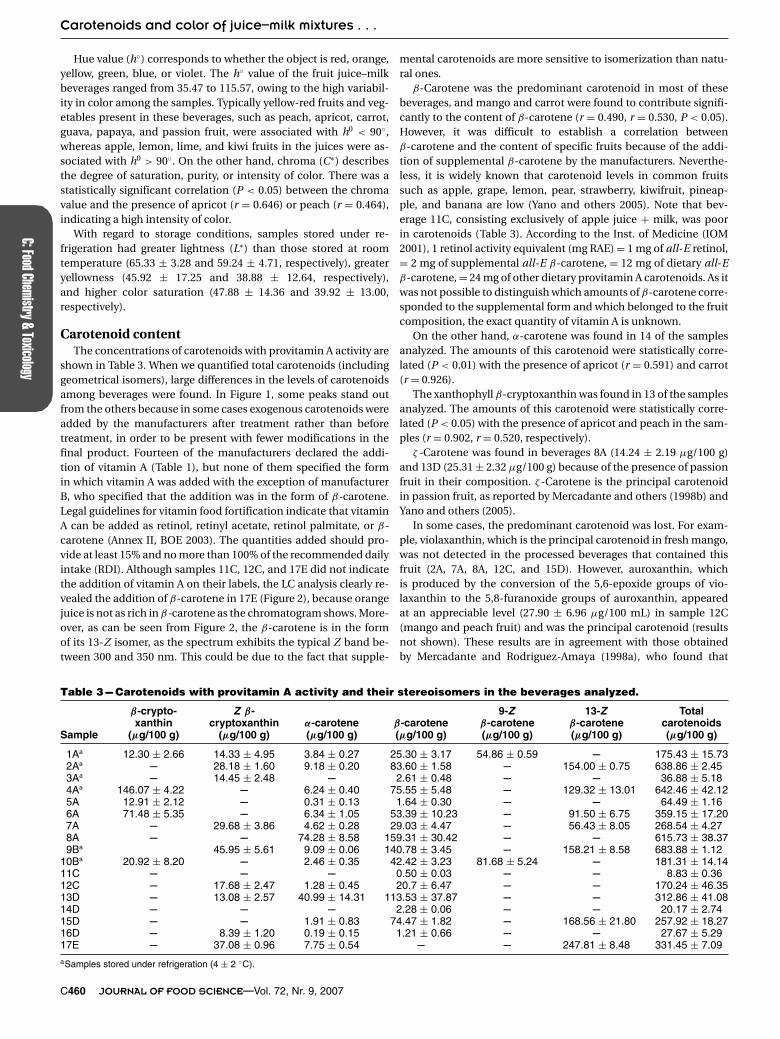
Carotenoid contentThe concentrations of carotenoids with provitamin A activity are
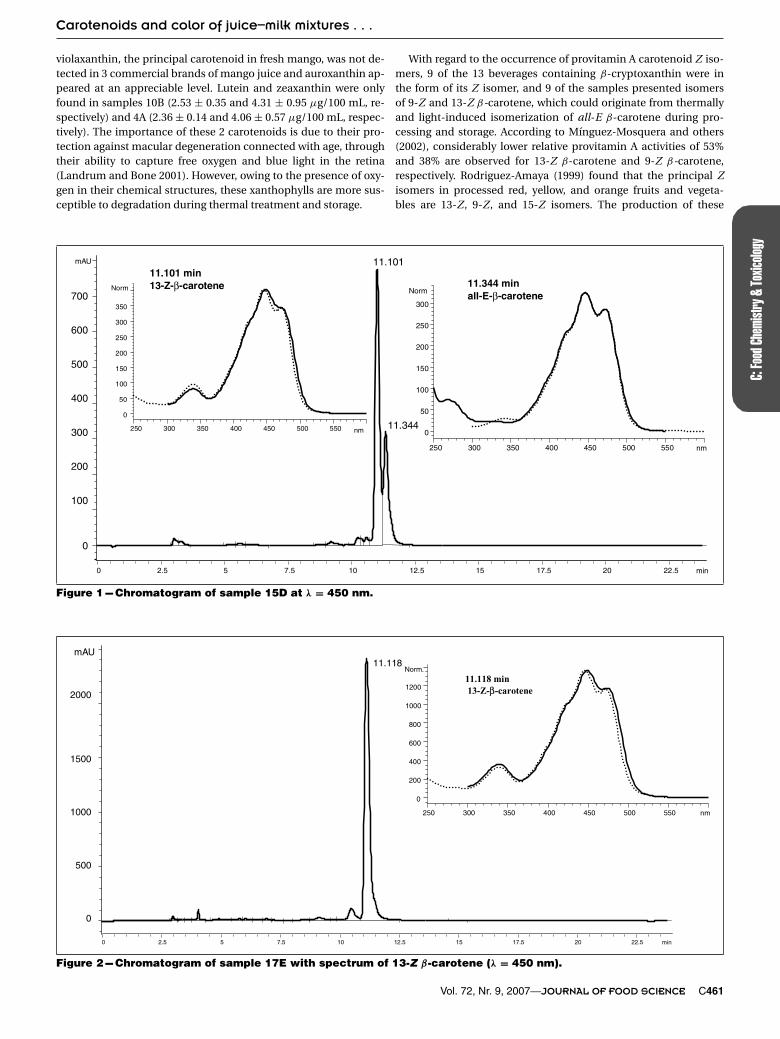
shown in Table 3. When we quantified total carotenoids (includinggeometrical isomers), large differences in the levels of carotenoidsamong beverages were found. In Figure 1, some peaks stand outfrom the others because in some cases exogenous carotenoids wereadded by the manufacturers after treatment rather than beforetreatment, in order to be present with fewer modifications in thefinal product. Fourteen of the manufacturers declared the addi-tion of vitamin A (Table 1), but none of them specified the formin which vitamin A was added with the exception of manufacturerB, who specified that the addition was in the form of β-carotene.Legal guidelines for vitamin food fortification indicate that vitaminA can be added as retinol, retinyl acetate, retinol palmitate, or β-carotene (Annex II, BOE 2003). The quantities added should pro-vide at least 15% and no more than 100% of the recommended dailyintake (RDI). Although samples 11C, 12C, and 17E did not indicatethe addition of vitamin A on their labels, the LC analysis clearly re-vealed the addition of β-carotene in 17E (Figure 2), because orangejuice is not as rich in β-carotene as the chromatogram shows. More-over, as can be seen from Figure 2, the β-carotene is in the formof its 13-Z isomer, as the spectrum exhibits the typical Z band be-tween 300 and 350 nm. This could be due to the fact that supple-
Table 3 --- Carotenoids with provitamin A activity and their stereoisomers in the beverages analyzed.
β-crypto- Z β- 9-Z 13-Z Totalxanthin cryptoxanthin α-carotene β-carotene β-carotene β-carotene carotenoids
Sample (µg/100 g) (µg/100 g) (µg/100 g) (µg/100 g) (µg/100 g) (µg/100 g) (µg/100 g)
1Aa 12.30 ± 2.66 14.33 ± 4.95 3.84 ± 0.27 25.30 ± 3.17 54.86 ± 0.59 --- 175.43 ± 15.732Aa --- 28.18 ± 1.60 9.18 ± 0.20 83.60 ± 1.58 --- 154.00 ± 0.75 638.86 ± 2.453Aa --- 14.45 ± 2.48 --- 2.61 ± 0.48 --- --- 36.88 ± 5.184Aa 146.07 ± 4.22 --- 6.24 ± 0.40 75.55 ± 5.48 --- 129.32 ± 13.01 642.46 ± 42.125A 12.91 ± 2.12 --- 0.31 ± 0.13 1.64 ± 0.30 --- --- 64.49 ± 1.166A 71.48 ± 5.35 --- 6.34 ± 1.05 53.39 ± 10.23 --- 91.50 ± 6.75 359.15 ± 17.207A --- 29.68 ± 3.86 4.62 ± 0.28 29.03 ± 4.47 --- 56.43 ± 8.05 268.54 ± 4.278A --- --- 74.28 ± 8.58 159.31 ± 30.42 --- --- 615.73 ± 38.379Ba 45.95 ± 5.61 9.09 ± 0.06 140.78 ± 3.45 --- 158.21 ± 8.58 683.88 ± 1.12
10Ba 20.92 ± 8.20 --- 2.46 ± 0.35 42.42 ± 3.23 81.68 ± 5.24 --- 181.31 ± 14.1411C --- --- --- 0.50 ± 0.03 --- --- 8.83 ± 0.3612C --- 17.68 ± 2.47 1.28 ± 0.45 20.7 ± 6.47 --- --- 170.24 ± 46.3513D --- 13.08 ± 2.57 40.99 ± 14.31 113.53 ± 37.87 --- --- 312.86 ± 41.0814D --- --- --- 2.28 ± 0.06 --- --- 20.17 ± 2.7415D --- --- 1.91 ± 0.83 74.47 ± 1.82 --- 168.56 ± 21.80 257.92 ± 18.2716D --- 8.39 ± 1.20 0.19 ± 0.15 1.21 ± 0.66 --- --- 27.67 ± 5.2917E --- 37.08 ± 0.96 7.75 ± 0.54 --- --- 247.81 ± 8.48 331.45 ± 7.09
aSamples stored under refrigeration (4 ± 2 ◦C).
mental carotenoids are more sensitive to isomerization than natu-ral ones.
β-Carotene was the predominant carotenoid in most of thesebeverages, and mango and carrot were found to contribute signifi-cantly to the content of β-carotene (r = 0.490, r = 0.530, P < 0.05).However, it was difficult to establish a correlation betweenβ-carotene and the content of specific fruits because of the addi-tion of supplemental β-carotene by the manufacturers. Neverthe-less, it is widely known that carotenoid levels in common fruitssuch as apple, grape, lemon, pear, strawberry, kiwifruit, pineap-ple, and banana are low (Yano and others 2005). Note that bev-erage 11C, consisting exclusively of apple juice + milk, was poorin carotenoids (Table 3). According to the Inst. of Medicine (IOM2001), 1 retinol activity equivalent (mg RAE) = 1 mg of all-E retinol,= 2 mg of supplemental all-E β-carotene, = 12 mg of dietary all-Eβ-carotene, = 24 mg of other dietary provitamin A carotenoids. As itwas not possible to distinguish which amounts of β-carotene corre-sponded to the supplemental form and which belonged to the fruitcomposition, the exact quantity of vitamin A is unknown.
On the other hand, α-carotene was found in 14 of the samplesanalyzed. The amounts of this carotenoid were statistically corre-lated (P < 0.01) with the presence of apricot (r = 0.591) and carrot(r = 0.926).
The xanthophyll β-cryptoxanthin was found in 13 of the samplesanalyzed. The amounts of this carotenoid were statistically corre-lated (P < 0.05) with the presence of apricot and peach in the sam-ples (r = 0.902, r = 0.520, respectively).
ζ -Carotene was found in beverages 8A (14.24 ± 2.19 µg/100 g)and 13D (25.31 ± 2.32 µg/100 g) because of the presence of passionfruit in their composition. ζ -Carotene is the principal carotenoidin passion fruit, as reported by Mercadante and others (1998b) andYano and others (2005).
In some cases, the predominant carotenoid was lost. For exam-ple, violaxanthin, which is the principal carotenoid in fresh mango,was not detected in the processed beverages that contained thisfruit (2A, 7A, 8A, 12C, and 15D). However, auroxanthin, whichis produced by the conversion of the 5,6-epoxide groups of vio-laxanthin to the 5,8-furanoxide groups of auroxanthin, appearedat an appreciable level (27.90 ± 6.96 µg/100 mL) in sample 12C(mango and peach fruit) and was the principal carotenoid (resultsnot shown). These results are in agreement with those obtainedby Mercadante and Rodriguez-Amaya (1998a), who found that
C460 JOURNAL OF FOOD SCIENCE—Vol. 72, Nr. 9, 2007
C:Fo
odCh
emist
ry&
Toxic
ology
Carotenoids and color of juice–milk mixtures . . .
violaxanthin, the principal carotenoid in fresh mango, was not de-tected in 3 commercial brands of mango juice and auroxanthin ap-peared at an appreciable level. Lutein and zeaxanthin were onlyfound in samples 10B (2.53 ± 0.35 and 4.31 ± 0.95 µg/100 mL, re-spectively) and 4A (2.36 ± 0.14 and 4.06 ± 0.57 µg/100 mL, respec-tively). The importance of these 2 carotenoids is due to their pro-tection against macular degeneration connected with age, throughtheir ability to capture free oxygen and blue light in the retina(Landrum and Bone 2001). However, owing to the presence of oxy-gen in their chemical structures, these xanthophylls are more sus-ceptible to degradation during thermal treatment and storage.
min0 2.5 5 7.5 10 12.5 15 17.5 20 22.5
mAU
0
100
200
300
400
500
600
700
11.101
11.344nm250 300 350 400 450 500 550
Norm .
0
50
100
150
200
250
300
350
11.101 min 13-Z-β-carotene
nm250 300 350 400 450 500 550
Norm
0
50
100
150
200
250
300
11.344 minall-E-β-carotene
Figure 1 --- Chromatogram of sample 15D at λ = 450 nm.
min0 2.5 5 7.5 10 12.5 15 17.5 20 22.5
mAU
0
500
1000
1500
2000
11.118
nm250 300 350 400 450 500 550
Norm.
0
200
400
600
800
1000
120011.118 min 13-Z-β-carotene
Figure 2 --- Chromatogram of sample 17E with spectrum of 13-Z β-carotene (λ = 450 nm).
With regard to the occurrence of provitamin A carotenoid Z iso-mers, 9 of the 13 beverages containing β-cryptoxanthin were inthe form of its Z isomer, and 9 of the samples presented isomersof 9-Z and 13-Z β-carotene, which could originate from thermallyand light-induced isomerization of all-E β-carotene during pro-cessing and storage. According to Mınguez-Mosquera and others(2002), considerably lower relative provitamin A activities of 53%and 38% are observed for 13-Z β-carotene and 9-Z β-carotene,respectively. Rodriguez-Amaya (1999) found that the principal Zisomers in processed red, yellow, and orange fruits and vegeta-bles are 13-Z , 9-Z , and 15-Z isomers. The production of these
Vol. 72, Nr. 9, 2007—JOURNAL OF FOOD SCIENCE C461
C:FoodChemistry&Toxicology
Carotenoids and color of juice–milk mixtures . . .
beverages involves various technological steps that may affecttheir carotenoid contents and isomeric composition. The tem-peratures reached during the concentration of the juice and theimpact of light on the product are 2 important factors that in-fluence the formation of Z isomers. Lessin and others (1997)found an increase of 10% to 39% in the percentage of total Zisomers of provitamin A carotenoids in various fruits and veg-etables as a consequence of thermal treatment. Marx and others(2000) found large relative amounts of 9-Z and 13-Z β-carotene(31.8% and 44.5%, respectively) in juices supplemented with syn-thetic β-carotene, compared with 6.7% to 13.6% of these stereoiso-mers in natural carrot juices. This is in agreement with our re-sults, as samples 9B and 15D, which declare the addition ofcolorings (consisting of carotenoids), showed high levels of Zisomers.
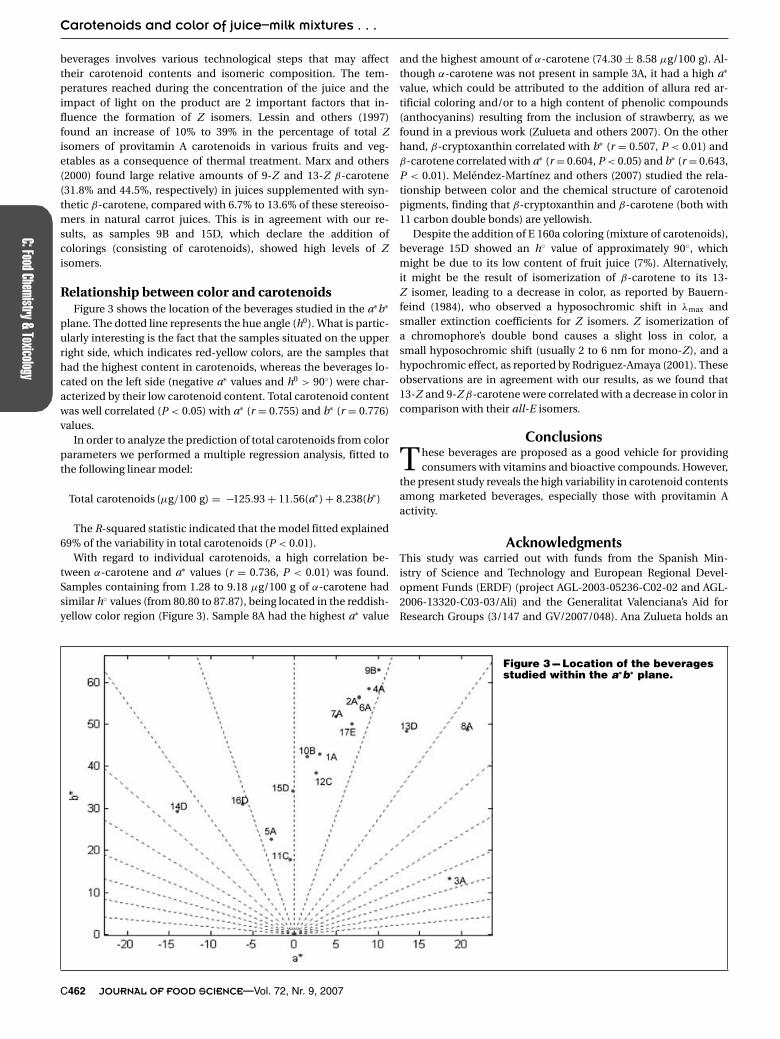
Relationship between color and carotenoidsFigure 3 shows the location of the beverages studied in the a∗b∗
plane. The dotted line represents the hue angle (h0). What is partic-ularly interesting is the fact that the samples situated on the upperright side, which indicates red-yellow colors, are the samples thathad the highest content in carotenoids, whereas the beverages lo-cated on the left side (negative a∗ values and h0 > 90◦) were char-acterized by their low carotenoid content. Total carotenoid contentwas well correlated (P < 0.05) with a∗ (r = 0.755) and b∗ (r = 0.776)values.
In order to analyze the prediction of total carotenoids from colorparameters we performed a multiple regression analysis, fitted tothe following linear model:
Total carotenoids (µg/100 g) = −125.93 + 11.56(a∗) + 8.238(b∗)
The R-squared statistic indicated that the model fitted explained69% of the variability in total carotenoids (P < 0.01).
With regard to individual carotenoids, a high correlation be-tween α-carotene and a∗ values (r = 0.736, P < 0.01) was found.Samples containing from 1.28 to 9.18 µg/100 g of α-carotene hadsimilar h◦ values (from 80.80 to 87.87), being located in the reddish-yellow color region (Figure 3). Sample 8A had the highest a∗ value
Figure 3 --- Location of the beveragesstudied within the a∗b∗ plane.
and the highest amount of α-carotene (74.30 ± 8.58 µg/100 g). Al-though α-carotene was not present in sample 3A, it had a high a∗
value, which could be attributed to the addition of allura red ar-tificial coloring and/or to a high content of phenolic compounds(anthocyanins) resulting from the inclusion of strawberry, as wefound in a previous work (Zulueta and others 2007). On the otherhand, β-cryptoxanthin correlated with b∗ (r = 0.507, P < 0.01) andβ-carotene correlated with a∗ (r = 0.604, P < 0.05) and b∗ (r = 0.643,P < 0.01). Melendez-Martınez and others (2007) studied the rela-tionship between color and the chemical structure of carotenoidpigments, finding that β-cryptoxanthin and β-carotene (both with11 carbon double bonds) are yellowish.
Despite the addition of E 160a coloring (mixture of carotenoids),beverage 15D showed an h◦ value of approximately 90◦, whichmight be due to its low content of fruit juice (7%). Alternatively,it might be the result of isomerization of β-carotene to its 13-Z isomer, leading to a decrease in color, as reported by Bauern-feind (1984), who observed a hyposochromic shift in λmax andsmaller extinction coefficients for Z isomers. Z isomerization ofa chromophore’s double bond causes a slight loss in color, asmall hyposochromic shift (usually 2 to 6 nm for mono-Z), and ahypochromic effect, as reported by Rodriguez-Amaya (2001). Theseobservations are in agreement with our results, as we found that13-Z and 9-Z β-carotene were correlated with a decrease in color incomparison with their all-E isomers.
Conclusions
These beverages are proposed as a good vehicle for providingconsumers with vitamins and bioactive compounds. However,
the present study reveals the high variability in carotenoid contentsamong marketed beverages, especially those with provitamin Aactivity.
AcknowledgmentsThis study was carried out with funds from the Spanish Min-istry of Science and Technology and European Regional Devel-opment Funds (ERDF) (project AGL-2003-05236-C02-02 and AGL-2006-13320-C03-03/Ali) and the Generalitat Valenciana’s Aid forResearch Groups (3/147 and GV/2007/048). Ana Zulueta holds an
C462 JOURNAL OF FOOD SCIENCE—Vol. 72, Nr. 9, 2007
C:Fo
odCh
emist
ry&
Toxic
ology
Carotenoids and color of juice–milk mixtures . . .
award from this project. We are grateful to Pau Arce Vila for his tech-nical assistance.
ReferencesBaker R, Gunter C. 2004. The role of carotenoids in consumer choice and the likely
benefits from their inclusion into products for human consumption. Trends FoodSci Technol 15(10):484–8.
Bauernfeind JC. 1984. Natural food colors. In: Bauernfeind JC, editor. Carotenoids ascolorants and vitamin A precursors. New York: Academic Press. p 1–37.
[BOE] Boletın Oficial del Estado. 2003. 14 Octubre. Real Decreto 1275/2003 de 10 deoctubre relativo a los complementos alimenticios. Madrid.
Britton G. 1995. Structure and properties of carotenoids in relation to function. FASEBJ 9:1551–8.
Calvo C, Duran L. 1997. Propiedades fısicas. II. Opticas y color. In: Temas en tec-nologıa de alimentos.: Programa iberoamericano de ciencia y tecnologıa para eldesarrollo (CYTED). Mexico, DF: Instituto Politecnico Nacional.
Calvo C, Salvador A, Fiszman SM. 2001. Influence of colour intensity on the percep-tion of colour and sweetness in various fruit flavoured yoghurts. Eur Food Res Tech-nol 213(2):99–103.
Carle R. 1999. Physical and chemical stability of ATBC drinks. Fruit Processing 9:342–9.
Chen BH, Peng HY, Chen BH. 1995. Change of carotenoids, color, and vitamin A con-tents during processing of carrot juice. J Agric Food Chem 43(7):1912–8.
Chen TM, Chen BH. 1994. Optimization of mobile phases for HPLC of cis-transcarotene isomers. Chromatographia 39(6):346–54.
[CIE] Commission Intl de l’Eclairage. 1978. Recommendations on uniform colorspaces, color-difference equations, psychometric color terms. CIE publication no.15 (E-1.3.1), Supplement 2. Vienna: Bureau Central de la CIE.
Cortes C, Esteve MJ, Frıgola A, Torregrosa F. 2004. Identification and quantificationof carotenoids including geometrical isomers in fruit and vegetable juices by liq-uid chromatography with ultraviolet-diode array detection. J Agric Food Chem52(8):2203–12.
Cortes C, Esteve MJ, Frıgola A, Torregrosa F. 2005. Changes in carotenoids includ-ing geometrical isomers and ascorbic content in orange-carrot juice during frozenstorage. Eur Food Res Technol 221(1–2):125–31.
Cortes C, Torregrosa F, Esteve MJ, Frıgola A. 2006. Carotenoid profile modificationduring refrigerated storage in untreated and pasteurized orange juice and or-ange juice treated with high-intensity pulsed electric fields. J Agric Food Chem54(17):6247–54.
Dugave C, Demange L. 2003. Cis-trans isomerization of organic molecules andbiomolecules: implications and applications. Chem Rev 103(7):2475–532.
[EPC] European Parliament and Council. 1994. Directive 94/36/EC of 30 June 1994on colours for use in foodstuffs. OJ No. L237, European Parliament and Council. p13–29.
[IOM] Institute of Medicine. 2001. Dietary reference intakes for vitamin A, vitamin K,arsenic, boron, chromium, copper, iodine, iron, manganese, molybdenum, nickel,silicon, vanadium, and zinc. Washington, D.C.: Natl. Academy Press.
Kuzminski LN. 1999. Issues and pressures for food and beverage researchand development in the 21st century. Crit Rev Food Sci Nutr 39(1):1–11.
Landrum JT, Bone RA. 2001. Lutein, zeaxanthin, and the macular pigment. ArchBiochem Biophys 385(1):28–40.
Lessin WJ, Catignani GL, Schwartz SJ. 1997. Quantification of cis-trans isomers ofprovitamin A carotenoids in fresh and processed fruits and vegetables. J Agric FoodChem 45(10):3728–32.
Marx M, Schieber A, Reinhold C. 2000. Quantitative determination of carotenestereoisomers in carrot juices and vitamin supplemented (ATBC) drinks. FoodChem 70(3):403–8.
Melendez-Martınez A, Britton G, Vicario I, Heredia F. 2007. Relationship be-tween colour and the chemical structure of carotenoid pigments. Food Chem101(1):1145–50.
Mercadante AZ, Rodriguez-Amaya DB. 1998a. Effects of ripening, cultivar differences,and processing on the carotenoid composition of mango. J Agric Food Chem46(1):128–30.
Mercadante AZ, Britton G, Rodriguez-Amaya DB. 1998b. Carotenoids fromyellow passion fruit (Passiflora edulis). J Agric Food Chem 46(10):4102–6.
Mınguez-Mosquera MI, Hornero-Mendez D, Perez-Galvez A. 2002. Carotenoids andprovitamin A in functional foods. In: Hurst WJ, editor. Methods of analysis for func-tional foods and nutraceuticals. Boca Raton, London, New York, Washington, D.C.:CRC Press. p 101–57.
Ministerio de Agricultura, Pesca y Alimentacion (MAPA) of Spain. 2003. Spain totalcitric transformation 2002–2003 campaign.
Pszczola DE. 2005. Ingredients. Making fortification. Food Technol 59(4):44–61.
Rodriguez-Amaya DB. 1999. Changes in carotenoids during processing and storage offoods. Arch Latinoam Nutr 49(3 Suppl 1):38S–47S.
Rodrıguez-Amaya DB. 2001. A guide to carotenoid analysis in foods. Washington,D.C.: ILSI Press.
Saleh MH, Tan B. 1991. Separation and identification of cis/trans carotenoid isomers.J Agric Food Chem 39(8):1438–43.
Schieber A, Marx M, Reinhold C. 2002. Simultaneous determination of carotenes andtocopherols in ATBC drinks by high-performance liquid chromatography. FoodChem 76(3):357–62.
Sharma R. 2005. Market trends and opportunities for functional dairy beverages. AustrJ Dairy Technol 60:195–8.
Simpson KL, Chichester CO. 1981. Metabolism and nutritional significance ofcarotenoids. Annu Rev Nutr (1):351–71.
Yano M, Kato M, Ikoma Y, Kawasaki A, Fukazawa Y, Sugiura M, Matsumoto H, OoharaY, Nagao A, Kazunori O. 2005. Quantitation of carotenoids in raw and processedfruits in Japan. Food Sci Technol Res 11(1):13–8.
Zulueta A, Esteve MJ, Frasquet I, Frıgola A. 2007. Vitamin C, vitamin A, phenolic com-pounds and total antioxidant capacity of new fruit juice and skim milk mixture bev-erages marketed in Spain. Food Chem 103(4):1365–74.
Vol. 72, Nr. 9, 2007—JOURNAL OF FOOD SCIENCE C463