Embed Size (px)
Citation preview

Carotenoid and chlorophyll content of Vitis vinifera cv. Merlot grapes during ripening with reference to
variability in grapevine water status and vigour
By
Zindi Kamffer
Thesis presented in partial fulfilment of the requirements for the degree of Master of Agricultural Sciences
at Stellenbosch University
Department of Viticulture and Oenology, Faculty of AgriSciences
Supervisor: Dr Anita Oberholster Co-supervisor: Dr Keren Bindon
December 2009
Declaration
By submitting this thesis electronically, I declare that the entirety of the work contained therein is my own, original work, that I am the owner of the copyright thereof (unless to the extent explicitly otherwise stated) and that I have not previously in its entirety or in part submitted it for obtaining any qualification. Date: 16 November 2009
Copyright © 2010 Stellenbosch University All rights reserved
Summary
Previous research has shown that carotenoids are precursors of C13-norisoprenoid aroma
compounds in wine. C13-norisoprenoids have low threshold values in wine with the most
prominent C13-norisoprenoids being β-damascanone and β-ionone which contribute honey and
floral like aroma to wine. Chlorophyll and its derivates have also been detected in wine with
potential to be precursors to aroma compounds.
Apart from the contribution of these pigments to wine aroma and quality they are vital role
players in photosynthesis and are widely found in plants and plant products. The main functions
of these pigments in plants are light collection and light-protection.
Research has shown that environmental conditions, climate, light exposure of bunches and
soil water deficit influence the carotenoid content of grape berries. Furthermore the
concentration of carotenoids and chlorophylls has also been shown to differ between cultivars.
No research in this regard has been done on Merlot grape berries.
With this in mind, the aim of this study was to evaluate the effect of vigour and soil water
content on the evolution of carotenoids and chlorophylls through ripening of grape berries from
the cv. Merlot. However, when looking at methods to analyse carotenoids and chlorophylls in
berry tissue, especially lyophilised tissue, there were no readily available methods. Thus, an
extraction method to identify and quantify the carotenoid and chlorophyll profile of lyophilised
tissue from unripe (green) to ripe (red) Merlot grape berries was needed. In this study the RP-
HPLC method of Taylor et al. (2006) for carotenoids and the extraction method of Mendes-Pinto
et al. (2004) were adapted to analyse both carotenoids and chlorophylls in lyophilised grape
tissue. The RP-HPLC method baseline separated all the carotenoids and chlorophylls and their
derivatives. Recovery of standards from mock extractions was high, indicating that the
extraction procedure was acceptable. However, extraction recovery tested in the matrix of the
grape tissue showed less promising results due to the high acid content of grape tissue.
Violaxanthin, neoxanthin and the chlorophylls were especially sensitive to low pH conditions
which facilitated their degradation. The degradation products of these compounds under acidic
conditions were identified as pheophytin a, b, chlorophillide a, pyropheophytin b, cis-
violaxanthin, cis-neoxanthin, neochrome, mutatoxanthin and luteoxanthin. There is a possibility
that some degradation products were already present in the tissue due to lyophilisation (since
the water in the berry was then removed and the acid concentrated). More work is needed to
investigate the effect of lyophilisation and storage on the composition of grape tissue of different
maturity. The extraction method for grape berry tissue at different ripening stages should also
be optimised further to effectively neutralise tissue acidity, without compromising the extraction
of carotenoids significantly, in especially green berry tissue. The question as to whether cis-
isomers and chlorophyll degradation products are naturally present in grape berries or are
formed during sampling and processing remains unanswered in the current study.

This study confirmed that in general carotenoids and chlorophylls decrease on a per berry
(µg/berry) and concentration (µg/g) basis from veraison to harvest. Furthermore, this study was
inconclusive in showing that vigour differences have an effect on the rate of
synthesis/degradation of carotenoids, chlorophyll and some other ripening parameters, namely
malic acid, total glucose and fructose, total tannin and total anthocyanin, from pre-veraison (pea
size) to harvest. Additionally, no significant effect of soil water content on carotenoids,
chlorophylls and ripeness parameters was found in this study, most likely due the fact that high
soil water capacity was found in lower soil layers which may have prevented significant
differences in grapevine water status. Experimental plots selected for vigour differences based
on normalised difference vegetation index (NDVI) images, pruning mass and soil water
measurements by means of a neutron probe, showed significant differences in soil water
content in only the first 30 cm of the soil for the ripening seasons studied. Predawn plant water
potential measurements, however, indicated that none of the experimental vines experienced
severe water stress which was previously shown to effect carotenoid content of grapes.
The carotenoid 5,8-epoxy--carotene was quantified for the first time in grapes and
represents a significant amount of the total carotenoids present at harvest. All the carotenoids
and chlorophylls except -carotene appeared to be sensitive to seasonal variation in climatic
conditions. Lutein and β-carotene were found to be the most abundant carotenoids present in
Merlot grape berries together with chlorophyll a for both seasons studied. The values of these
carotenoids also correlated well with previous research. However, chlorophyll a was found in
much larger quantities in Merlot berries compared to reported data. This is possibly because in
this study the chlorophyll degradation products were included in the calculation of chlorophyll a.
Multivariate analysis showed promising preliminary prediction models (with correlation
values of above 0.8 for both seasons analysed) for the prediction of the concentration of
ripeness parameters (glucose, fructose, malic acid, total tannins and anthocyanins) with
carotenoid and chlorophyll content. This result highlights the opportunity for the development of
a rapid non-destructive method to measure carotenoids and chlorophylls in berries which in turn
can predict optimal ripeness. Furthermore, since carotenoids are the precursors to C13-
norisoprenoid aroma compounds in wine a preview of the potential contribution of these aromas
to wine might be evaluated. Further research is necessary to investigate the possibility of
building and validating such models.

Opsomming Vorige navorsing het getoon dat karotenoïede die voorlopers is van C13-norisoprenoïed
aromaverbindings in wyn. C13-norisoprenoïede het lae drempelwaardes in wyn, met β-
damassenoon en β-jonoon as die prominentste C13-norisoprenoïede wat ‘n bydrae tot die
heuning en blomagtige aroma van die wyn maak. Chlorofil en sy derivate is ook reeds in wyn
bespeur, met die potensiaal om voorlopers van aromaverbindings te wees.
Buiten die bydrae van hierdie pigmente tot wynaroma en -kwaliteit is hulle ook belangrike
rolspelers in fotosintese en kom hulle wydverspreid in plante en plantprodukte voor. Die
vernaamste funksies van hierdie pigmente in plante is om lig te versamel en om as beskerming
teen lig op te tree.
Navorsing het getoon dat omgewingstoestande, klimaat, ligblootstelling van die trosse en
grondwatertekorte die karotenoïedinhoud van druiwekorrels beïnvloed. Verder is ook getoon dat
die konsentrasie van karotenoïede en chlorofille tussen kultivars verskil. Geen navorsing is al in
hierdie opsig op Merlot-druiwekorrels gedoen nie.
Met hierdie aspek in gedagte was die doelwit van hierdie studie om die effek van groeikrag
en grondwaterinhoud op die evolusie van karotenoïede en chlorofille tydens die rypwording van
druiwekorrels van die cv. Merlot te evalueer. Wanneer mens egter kyk na die metodes
waarvolgens die karotenoïede en chlorofille in korrelweefsel geanaliseer word, is daar geen
geredelik beskikbare metodes nie. ‘n Ekstraksiemetode om die karotenoïed- en chlorofilprofiel
van geliofiliseerde weefsel van onryp (groen) tot ryp (rooi) Merlot-bessies te identifiseer en
kwantifiseer was dus nodig. In hierdie studie is die RP-HPLC metode van Taylor et al. (2006) vir
karotenoïede en die ekstraksiemetode van Mendes-Pinto et al. (2004) aangepas om beide
karotenoïede en chlorofille in geliofiliseerde druiweweefsel te analiseer. Die basislyn van die
RP-HPLC metode het all karotenoïede en chlorofille en hul derivate geskei. Herwinning van die
standaarde vanaf skynekstraksies was hoog, wat aandui dat die ekstraksieprosedure
aanvaarbaar was. Ekstraksieherwinning wat in die matriks van die druiweweefsel getoets is, het
egter minder belowende resultate getoon as gevolg van die hoë suurinhoud van die
druifweefsel. Violaxantien, neoxantien en die chlorofille was veral sensitief vir toestande van lae
pH, wat hulle afbreking gefasiliteer het. Die afbrekingsprodukte van hierdie verbindings onder
suurtoestande is geïdentifiseer as feofitien a en b, chlorofillied a, pirofeofitien b, cis-violaxantien,
cis-neoxantien, neochroom, mutatoxantien en luteoxantien. Daar is ‘n moontlikheid dat
sommige afbreekprodukte reeds in die weefsel teenwoordig was as gevolg van liofilisering
(aangesien die water in die korrel reeds verwyder was en die suur gekonsentreerd was). Meer
werk is nodig om die effek van liofilisering en berging op die samestelling van druifweefsel van
verskillende rypheid te bepaal. Die ekstraksiemetode vir druifkorrelweefsel op verskillende

stadia van rypwording moet ook verder geoptimaliseer word om weefselsuurheid doeltreffend te
neutraliseer, sonder om die ekstraksie van karotenoïede noemenswaardig te kompromitteer,
veral in groen korrelweefsel. Die vraag of cis-isomere en chlorofil afbreekprodukte natuurlik in
die druifkorrels teenwoordig is en of hulle tydens monsterneming en prosessering gevorm word,
kon nie in hierdie studie beantwoord word nie.
Hierdie studie het bevestig dat karotenoïede en chlorofille oor die algemeen op ‘n korrel
(µg/korrel) en konsentrasie (µg/g) basis afneem vanaf deurslaan tot oes. Hierdie studie het nie
daarin geslaag om te toon dat groeikragverskille vanaf voor-deurslaan (ertjiekorrelgrootte) tot
oes ‘n effek het op die tempo van sintese/afbreking van karotenoïede, chlorofil en ander
rypwordingsparameters nie, naamlik op appelsuur, totale glukose en fruktose, totale tannien en
totale antosianien. Daar is ook in hierdie studie geen noemenswaardige effek van
grondwaterinhoud op karotenoïede, chlorofille en rypheidsparameters gevind nie, heel moontlik
as gevolg van die feit dat hoë grondwaterkapasiteit in die laer grondlae gevind is, wat
betekenisvolle verskille in wingerdwaterstatus kon verhoed het. Eksperimentele persele wat
gekies is vir groeikragverskille op grond van genormaliseerde verskil plantegroei indeks (NDVI)
beelde, snoeimassa en grondwatermetings met ‘n neutronvogmeter het net in die eerste 30 cm
van die grond noemenswaardige verskille in grondwaterinhoud getoon vir die
rypwordingseisoene wat bestudeer is. Voor-sonopkoms plantwaterpotensiaalmetings het egter
aangedui dat geen van die eksperimentele wingerdstokke ernstige waterstres ervaar het nie.
Sulke stres is voorheen aangedui om ‘n effek op die karotenoïedinhoud van druiwe te hê.
Die karotenoïed 5,8-epoksi--karoteen is vir die eerste keer in druiwe gekwantifiseer en
verteenwoordig ‘n noemenswaardige hoeveelheid van die totale karotenoïede wat met oes
teenwoordig is. Al die karotenoïede en chlorofille behalwe -karoteen blyk sensitief vir
seisoenale verskille in klimaatstoestande te wees. Luteïen en β-karoteen was die volopste
karotenoïede in die Merlot-druifkorrels, tesame met chlorofil a, vir beide seisoene wat bestudeer
is. Die waardes van hierdie karotenoïede was ook goed gekorreleer met vorige navorsing.
Chlorofil a is egter in baie groter hoeveelhede in Merlot-korrels gevind in vergelyking met dít wat
in die data gerapporteer is. Die rede hiervoor is moontlik dat die chlorofil-afbreekprodukte in
hierdie studie in die berekening van chlorofil a ingesluit is.
Meerveranderlikeontleding het belowende voorlopige voorspellingsmodelle getoon (met
korrelasiewaardes van meer as 0.8 vir beide die seisoene wat geanaliseer is) vir die
voorspelling van die konsentrasie van rypheidsparameters (glukose, fruktose, appelsuur, totale
tanniene en antosianiene) met karotenoïed- en chlorofilinhoud. Hierdie resultaat beklemtoon die
geleentheid vir die ontwikkeling van ‘n vinnige, nie-destruktiewe metode om karotenoïede en
chlorofille in korrels te meet, wat op sy beurt optimate rypheid kan voorspel. Aangesien
karotenoïede die voorlopers van C13-norisoprenoïed aromaverbindings in wyn is, kan ‘n
voorskou van die potensiële bydrae van hierdie aromas tot wyn moontlik verder evalueer word.

Verdere navorsing is nodig om die moontlikheid van die bou en geldigheidsbepaling van sulke
modelle te ondersoek.

This thesis is dedicated to Stellenbosch and all its happy student memories

Biographical sketch Zindi Kamffer was born in Evander on 1 December 1984. She matriculated at Duineveld High
School in Upington in 2002. Zindi enrolled at Stellenbosch University in 2003 and obtained the
degree BScAgric in Viticulture and Oenology in December of 2006. In 2007 she enrolled for the
degree MScAgric in Viticulture, also at the Stellenbosch University.

Acknowledgements I wish to express my sincere gratitude and appreciation to the following persons and institutions:
Dr Keren Bindon, Department of Viticulture and Oenology, Stellenbosch University, who initiated the project, her guidance and critical reading of the manuscript.
Dr Anita Oberholster, Department of Viticulture and Oenology, Stellenbosch University, for her guidance, encouragement, invaluable discussions and critical reading of the manuscript.
Mr Albert Strever, Department of Viticulture and Oenology, Stellenbosch University, for his guidance on the viticultural side.
Prof Martin Kidd at the Centre of Statistical Consultation, Stellenbosch University, for his assistance with statistical analysis of data.
Albertus van Zyl and Corné Boshoff who managed the irrigation and soil water measurements of the project and their help with other measurements.
Raphael Angelo Dornier, where this study was conducted, for the use of their vineyard for research and as well as donating grapes for the study.
The staff at the Department of Viticulture and Oenology, Stellenbosch University, for their friendliness and assistance through the project.
Fellow students at the Department of Viticulture and Oenology, Stellenbosch University, for their friendliness and assistance.
Department of Agriculture and Department of Viticulture and Oenology for financial support.
Mieder for all his help and encouragement and my mother and friends for all their prayers, love and motivation.
The Lord Jesus Christ whom without I would never have been capable.

Preface This thesis is presented as a compilation of five chapters and appendixes. Each chapter is introduced separately, with the results presented in chapters’ three to four and concluded in chapter five. Chapter 1 General Introduction and project aims Chapter 2 Literature review A review of the viticultural control of carotenoids and chlorophyll biochemistry
in grape berry ripening Chapter 3 Technical report Optimization of a method for the extraction and quantification of chlorophyll
and carotenoids in grape berries (Vitis vinifera) cv. Merlot Chapter 4 Research results Influence of grapevine vigour and soil moister on the carotenoid profile of cv.
Merlot grape berries Chapter 5 General discussion and conclusions
Contents
CHAPTER 1. GENERAL INTRODUCTION AND PROJECT AIMS 1
1.1 INTRODUCTION 2 1.2 SPECIFIC PROJECT AIMS 2 1.3 LITERATURE CITED 3
CHAPTER 2. LITERATURE REVIEW – A REVIEW OF CAROTENOID AND CHLOROPHYLL BIOCHEMISTRY IN GRAPE BERRY RIPENING WITH REFERENCE TO ITS SIGNIFICANCE FOR VITICULTURE 6
2.1 INTRODUCTION 7 2.2 LOCATION, ROLE AND STRUCTURE OF CAROTENOIDS AND CHLOROPHYLL 8 2.2.1 Location of carotenoids and chlorophylls in higher plants and grape berries 8 2.2.2 The role of carotenoids and chlorophylls in higher plants and grape berries 10 2.2.3 Structure of carotenoid and chlorophyll molecules 11 2.3 BIOSYNTHESIS AND DEGRADATION OF CAROTENOIDS AND CHLOROPHYLLS 13 2.3.1 Biosynthesis and degradation of carotenoids 13 2.3.2 Biosynthesis and degradation of chlorophylls 15 2.4 GRAPE BERRY DEVELOPMENT AND MATURATION 18 2.4.1 Ripening cycle and behaviour of important compounds 18 2.4.2 Ripening hormones 19 2.4.3 Biosynthesis and degradation of carotenoids in grape berries 20 2.4.4 Biosynthesis and degradation of chlorophylls in grape berries 22 2.5 VITICULTURAL INFLUENCES ON CAROTENOIDS AND CHLOROPHYLL
CONTENTS OF GRAPE BERRIES 23 2.5.1 The effect of sunlight and temperature 23 2.5.1.1 The effect of sunlight and temperature on carotenoids and its C13-
norisoprenoid degradation products 23 2.5.1.2 The effect of sunlight and temperature on chlorophyll content of grape
berries 25 2.5.2 The effect of vigour, plant water status and soil type 25 2.5.3 The effect of terroir and cultivar selection 29 2.6 RECENT ADVANCES OF ANALYTICAL TOOLS AND TECHNIQUES TO ASSESS
AND MEASURE GRAPE RIPENESS 31 2.7 CONCLUSION 35 2.8 LITERATURE CITED 37
CHAPTER 3. INVESTIGATION AND OPTIMIZATION OF A METHOD FOR THE EXTRACTION AND QUANTIFICATION OF CHLOROPHYLLS AND CAROTENOIDS IN GRAPE BERRIES (VITIS VINIVERA CV. MERLOT) 47
3.1 INTRODUCTION 48 3.2 MATERIALS AND METHODS 49 3.2.1 Plant material and growth conditions 49 3.2.2 Analytical materials 50 3.2.3 Preparation of standards 50 3.2.4 Sample preparation 51 3.2.5 Extraction 51 3.2.6 Chromatographic conditions 52 3.2.7 Identification and quantification of carotenoids 52 3.2.8 Limit of detection and quantification 53 3.2.9 Selectivity and recovery 53 3.3 RESULTS AND DISCUSSION 53 3.3.1 Identification and quantification of carotenoids and chlorophylls in grape berries 53 3.3.2 Extraction of carotenoids and chlorophylls from grape berries 58 3.3.3 Investigation of extraction solvents, sample processing and storage 60 3.3.4 Effect of pH and light on extraction efficiency 62 3.4 CONCLUSION 65 3.5 LITERATURE CITED 65
CHAPTER 4. RESEARCH RESULTS: QUANTITATIVE ANALYSIS OF GRAPE CAROTENOID AND CHLOROPHYLL PROFILES DURING RIPENING WITH REFERENCE TO GRAPEVINE VIGOUR AND WATER STATUS 69
4.1 INTRODUCTION 70 4.2 MATERIALS AND METHODS 72 4.2.1 Plant material and growth conditions 72 4.2.2 Plot description and layout 73 4.2.3 Climatic measurements 76 4.2.4 Canopy measurements 77 4.2.5 Vine water status measurements 78 4.2.6 Yield measurements, bunch and berry mass 78 4.2.7 Grape ripeness monitoring, sampling and analysis 78 4.2.8 Berry sampling and processing for analysis of carotenoids, chlorophylls and
some ripeness parameters 79 4.2.9 Chemical analysis on lyophilised berry tissue 79 4.2.10 Data analysis 80 4.2.10.1 Statistical analysis 80 4.2.10.2 Multivariate analysis 80 4.3 RESULTS AND DISCUSSION 81 4.3.1 Mesoclimatic data for the vineyard site 81 4.3.2 Plot description 84 4.3.2.1 Descriptive comparison of two extreme plots 92 4.3.2.2 Descriptive comparison of ripening parameters in two extreme plots 94

4.3.3 Effect of vigour and soil water content on the carotenoid and chlorophyll content of grapes 98
4.3.3.1 PCA analysis of pigment profiles in grapes from all plots 98 4.3.3.2 Descriptive comparison of pigment profiles during ripening in grapes
from two extreme plots 102 4.3.3.3 Changes in ripening parameters carotenoid and chlorophyll content
during ripening 103 4.3.5 Prediction and exploration of carotenoid and chlorophyll concentration in grapes
with regards to ripening measurements 110 4.4 CONCLUSION 114 4.5 LITERATURE CITED 115
CHAPTER 5. GENERAL DISCUSSIONS AND CONLUSIONS 122
5.1 GENERAL DISCUSSIONS AND CONCLUSIONS 122 5.2 LITERATURE CITED 125
APPENDIX A APPENDIX B

CChhaapptteerr 11
General Introduction and
Project aims

1
GENERAL INTRODUCTION AND PROJECT AIMS
1.1 INTRODUCTION
In recent years increasing attention in viticultural research has been given to grape
berry carotenoids since they have been identified as potential precursors to a group of
potent aroma compounds in wine, the C13-norisoprenoids (Baumes et al. 2002). The
C13-norisoprenoids can make a positive contribution to the complexity and quality of
wine, contributing their floral and honey like notes to wine aroma (Kanasawud and
Cruzet 1990; Kovats 1987; Ohloff 1978). In order to optimise the concentration of these
compounds in grapes the viticultural factors which influence their metabolism in grape
berries needs to be better understood.
Carotenoids in unripe grape berries function as light-harvesters and quenchers of
excess light in the photosynthetic systems of the chloroplast together with chlorophyll
(Van den Berg et al. 2000; Krinsky 1979). It has been shown that variation in the level of
light incident on a grape cluster may have an effect on berry carotenoids in experiments
comparing sun-exposed and shaded grape bunches (Razungles et al. 1998; Bureau et
al. 1998; Bindon 2004; Bureau et al. 2000; Oliveira et al. 2004). There is also evidence
that vigorously growing grapevines with denser canopies may have altered light and
temperature conditions of the bunch zone, or canopy microclimate. This, in turn, might
directly or indirectly affect carotenoid synthesis and breakdown. As yet, no research has
given clear direction to this question. Apart from the effect of sunlight on the carotenoid
composition of grapes, research has not thoroughly addressed the effects of other
environmental conditions or vine management practices on the grape carotenoid profile.
It has been speculated that vine water deficit might directly or indirectly affect the
carotenoid content of grapes since some studies have shown that water deficit in
grapevines can elevate the level of carotenoids in grapes (Oliveira et al. 2004; Bindon et
al. 2007). This is conceivable, since the plant hormone abscisic acid (ABA), which
controls both stress signalling and regulates ripening in grapevines is closely related to
the carotenoid metabolic pathway (Cutler and Krochko 1999; Liotenberg 1999; Taylor et
al. 2000; Antolin 2003).
Analysis of carotenoids and chlorophylls is not an easy task since they are
susceptible to degradation and structural alteration in the presence of acids, heat
treatment and exposure to light (Rodriguez-Amaya et al. 2008; Van den Berg et al.
2000; Oliver and Palou et al. 2000). Methods available for analysing carotenoids and
chlorophylls are time consuming and relatively expensive, involving both spectroscopic
and chromatographic methods. Various high-performance-liquid-chromatography
(HPLC) techniques have been used for the identification and quantification of grape
carotenoids (Bindon 2004; Oliveira et al. 2004; Steel and Keller 2000) but as yet, no
method has reported the simultaneous measurement of carotenoids and chlorophylls.
The development of a robust analytical method is important for a number of reasons.
Since carotenoids and chlorophylls may serve as potential ripeness indicators, as well

2
as markers for wine quality (aroma and phenolic potential), the development of a rapid
and non-destructive technique for the measurement of these pigments in situ (vineyard)
could be a valuable tool for grape and wine producers. Non-destructive assessment of
chlorophyll, carotenoid and anthocyanin content in higher plant leaves has been studied
by Gitelson et al. (2002) whereby the relationship between reflectance and pigment
content were established and quantitative techniques for pigment estimation in various
leaf species with diverse pigment content and composition were developed. Chlorophyll
fluorescence measurements have been found to be well-suited to non-invasively
determine sugar accumulation in white grape berries cv. Bacchus and Silvaner (Kolb et
al. 2006). The assessment of anthocyanins in whole grape bunches via chlorophyll
fluorescence imaging has also been developed by Agati et al. (2008), allowing for the
non-invasive assessment of phenolic maturity in the vineyard. Other technologies exist
which may allow for the prediction of pigments in grapes, namely NIR spectroscopy,
which has the added advantage of being transportable.
However, before any such rapid techniques can be implemented, a robust,
validated analytical method is necessary, such as RP-HPLC analysis. Furthermore, the
validity of taking a non-destructive approach needs to be evaluated by application to a
vineyard scenario, over multiple seasons. By this approach, the potential relationships
of fluorescent pigments to other more traditionally used ripening parameters for grape
maturity can be evaluated. Following this, the relevance of using pigments such as
chlorophylls and carotenoids as indicators of 1) grape ripeness relative to other ripeness
parameters; and 2) vineyard variability, can be determined.
This study has undertaken the approach of developing a method to accurately and
reproducibly quantify the content of carotenoids and chlorophylls in grape berries using
cv. Merlot as an example. Additional to this, the potential effects of grapevine vigour and
soil moisture on grape carotenoid and chlorophyll levels are explored during berry
development within a single vineyard over two seasons. Preliminary work on the
relationship between berry ripeness parameters such as total grape anthocyanins,
tannin, malic acid, and total sugars with the profile of chlorophylls and carotenoids in
grape berries has been done using multivariate statistics, and will be discussed.
1.2 SPECIFIC PROJECT AIMS
This study aimed to explore the changes in the carotenoid and chlorophyll content of
grape berries during ripening, using field measurements of grapevine vigour and soil
moisture in order to observe differences in the pigment profile in response to these
factors, if any. As a prerequisite to this, a method was developed for the simultaneous
extraction and quantification of carotenoids and chlorophylls in Merlot grape berries,
using RP-HPLC. Furthermore, the study aimed to explore the relationship between
carotenoid and chlorophyll content and traditional grape berry ripeness parameters such
as total sugar, malic acid, anthocyanin and tannin content, determined per berry.
3
These goals were achieved using the following objectives:
i) To optimise an extraction method for both carotenoids and chlorophylls in
lyophilised grape berry tissue.
ii) To explore the changes in the content of carotenoids and chlorophylls during
grape ripening from pre-veraison to harvest by quantifying these pigments at
different ripening stages via RP-HPLC.
iii) To quantify grapevine responses to differences in vigour and soil moisture in
terms of pruning weight, bunch exposure, shoot growth, leaf water potential
and neutron probe measurements, and explore the relationship between
these, and iii), if any, using multivariate analytical techniques (PCA).
iv) To explore the potential relationship, if any, on carotenoid and chlorophyll
content on grapes to standard measures of grape ‘ripeness’, namely malic
acid, total sugar (glucose and fructose) and anthocyanin content of grapes,
using Merlot berries from a single vineyard as the study sample.
v) To build prediction models with chemometric software to explore the potential
prediction of ripening parameters total glucose and fructose, total tannins,
total anthocyanin and malic acid per berry fresh weight from carotenoid and
chlorophyll content per berry fresh weight using multivariate analysis (PLS2).
1.3 LITERATURE CITED
Antolin, M.; Ayari, M.; Sanchez-Diaz, M. Effect of partial root zone drying on yield, ripening and berry ABA in potted Tempranillo grapevines with split roots. Aust. J. Grape Wine Res. 2003, 12, 13-20.
Agati, G.; Traversi, M. L.; Cerovic, Z. G. Chlorophyll Fluorescence Imaging for the Non-invasive of Anthocyanin in Whole Grape (Vitis vinifera L.) Bunches. Photochem. Photobiol. 2008, 84, 1431-1434
Baumes, R.; Wirth, J.; Bureau, S.; Gunata, Y.; Razungles, A. Bio-generation of C13-norisoprenoid compounds: experiments supportive for an apo-carotenoid pathway in grapevines. Anal. Chim. Acta. 2002, 458, 3-14.
Bindon, K. Influence of Partial Root zone Drying on Aspects of Grape and Wine Quality. The University of Adelaide. 2004, Chapter 9, 182-204.
Bureau, S.M., Razungles, A.J.; Baumes, R.L.; Bayonove, C.L. Effect of qualitative modification of light on the carotenoid contents in Vitis vinifera L. cv. Syrah berries. Sci. Aliment. 1998, 18, 485-495.
Bureau, S.M., Razungles, A.J., Baumes, R.L. The aroma of Muscat of Frontignan grapes: effect of the light environment of vine or bunch on volatile and glycoconjugates. J Sci Food Agri. 2000, 80, 2012-2020.

4
Cutler, A.; Krochko, J.E.; Formation and breakdown of ABA. Trends Plant Sci. 1999, 4, 472-478.
Gitelson, A. A.; Zur, Y.; Chivkunova, O. B.; Merzlyak, M. N. Assessing Carotenoid Content in Plant Leaves with Reflectance Spectroscopy. Photochem. Photobiol. 2002, 75, 3, 272-281.
Kanasawud, P.; Crouzet, J.C. Mechanism of formation of volatile compounds by thermal degradation. J. Agric. Food Chem. 1990, 38, 237-243.
Kolb, C. A.; Wirth, E.; Kaiser, W. M.; Meister, A.; Riederer, M.; Pfündel, E. E. Non-invasive Evaluation of the Degree of Ripeness in Grape Berries (Vitis Vinifera L. Cv. Bacchus and Silvaner) by Chlorophyll Fluorescence. J. Agric. Food Chem. 2006, 54, 299-305.
Kovats, E. Composition of essential oils : Part 7. Bulgarian oil of rose (Rosa damascene – Mil.). J. Chromatogr. A. 1987, 406,185-222.
Krinksky, N.I; Carotenoid protection against oxidation. Pure Appl. Chem. 1979, 51, 649-660.
Liotenberg, S.; North, H.; Marion-Poll, A. Molecular biology and regulation of abscisic acid biosynthesis in plants. Plant Phys. Biochem. 1999, 37, 341-350.
Ohloff, G. Importance of minor components in flavours and fragrances. Perf. Flavor. 1978, 3, 11-22.
Oliver, J.; Palou, A.; Chromatographic determination of carotenoids in foods. J. Chromatogr. A. 2000, 881, 543-555.
Oliveira, C.; Ferreira, A.C.; Costa, P.; Guerra, J.; Guedes de Pinho, P. Effect of some viticultural parameters on the grape carotenoid profile. J. Agric. Food Chem. 2004, 52, 4178-4184.
Razungles, A.J., Baumes, R.L., Dufour, C., Sznaper, C.N. and Bayonove, C.L. Effect of sun exposure on carotenoids and C13-norisoprenoid glycosides in Syrah berries (Vitis vinifera L.). Sci. Aliment. 1998, 18, 361-373.
Rodriguez-Amaya, D. B., Kimura, M.; Godoy, H. T.; Amaya-Farfan, J. Updated Brazilian database on food carotenoids: Factors affecting carotenoid composition. J. Food Comp. Anal. 2008, 21, 445-463.
Steel, C.C., Keller, M., Influence of UV-B radiation on the carotenoid content of Vitis vinifera tissues. Biochem. Soc. T. 2000, 28, 883-885.
Taylor, I.B.; Butbidge, A.; Thomson, A.J. Control of abscisic acid synthesis. J. Exp. Bot. 2000, 51, 1563-1574.
Van den Berg, H.; Faulks, R.; Fernando Granado, H.; Hirschberg, Olmedilla, B.; Sandmann, G.; Southon, S.; Stahl, W. The potential for the improvement of carotenoid levels in food and the likely systemic effects. J. Sci. Food Agric. 2000, 80, 880-912.

CChhaapptteerr 22
Literature review
A review of carotenoid and chlorophyll biochemistry in grape berry ripening with reference to its significance for viticulture

6
2.1 INTRODUCTION
Wine aroma is one of the most important aspects of wine quality since it contributes to the
first perception of the wine consumer. Viticultural practices to improve aroma in order to
make better, more strongly preferred and higher quality wine is an important research field
for the grape and wine industry. Aroma in wine is formed and manipulated at many stages
of the wine production process: it is influenced by the aroma formed by yeast, aromas
extracted from oak and the aromas derived from precursors in the grape itself. Aromas
originating from the grape berries make a large contribution to the aroma and complexity
of the final product. This is especially evident in the case of cultivar wines where the
cultivar-specific aroma or precursor originates in the grapes of a particular variety
(genotype). Thus, to study the effect of viticultural practices on the profile of precursor
compounds to aroma is of utmost importance, particularly when considering the optimal
production of aroma-rich, cultivar-specific wines.
It is currently thought that carotenoids make an important contribution with regards to
grape-derived wine aroma, especially to the typical aroma of some cultivars (Ferreira et al.
2008). Sefton et al. (1993) studied the volatile composition of cv. Chardonnay and
identified 108 compounds from which more than 70% of the total concentration of volatile
secondary metabolites comprised C13-norisoprenoids. Research has shown that
carotenoids are the likely precursors to C13-norisoprenoids which is a very significant
group of aroma compounds in wine because they have low olfactory threshold values
(Etievant et al. 1991). Chlorophylls and their derivatives are also reported to be found in
wine (De Pinho et al. 2001) and have potential in being precursors to aroma compounds
(Sefton et al. 1993).
As a class of compounds, carotenoids are closely related to chlorophyll with regards to
their function in photosynthesis but are structurally different . Carotenoids act as accessory
pigments in light-harvesting antennae by transferring energy to the photosystem reaction
centres and also acting as quenchers of triplet excited states in chlorophyll molecules
generated during photosynthesis (Demmig-Adams et al. 1996).
One of the important C13-norisoprenoids which contributes to wine aroma is β-ionone
with a low threshold value of 90 ng/L (in a model base wine) (Kotseridis et al. 1999b). β-
ionone has a violet like aroma and can be formed as a cleavage product of the carotenoid
β-carotene (Kanasawud and Crouzet 1990) and zeaxanthin, a xanthophyll (Mathieu et al.
2005). β-damascenone is another C13-norisoprenoid found in wine, with a threshold value
of 50 ng/L in 10% alcohol (Guth 1997), its aroma notes have been described as honey-like

7
(Kovats 1987), flowery and ionone-like (Ohloff 1978). Recently it was demonstrated that
β-damascanone can be formed directly from the carotenoid neoxanthin (Bezman et al.
2005). Other examples of C13-norisoprenoids found in wine are, 1,1,6-trimethyl-1,2-
dihydronaphthalene (TDN), and vitispirane (Oliveira et al. 2006). As a point of interest,
carotenoids have potential medical benefits for humans in preventing cancer and
cardiovascular related diseases (Cooper 2004; Krinsky and Johnson, 2005).
In this chapter, the chemical structure, biosynthesis, degradation and major roles of
carotenoids and chlorophyll in grapes are discussed, with specific reference to changes
occurring through grape maturation. Secondly, research that has been done on the
viticultural control of the carotenoid and chlorophyll profile in relation to other important
compounds through ripening in grape berries will follow. The interactive effects of sunlight,
terroir, cultivar selection, soil type and water stress will be discussed. Carotenoid
biochemistry, however, will be the main focus of this literature review in order to gain a
better understanding of above-mentioned impacting factors.
2.2 LOCATION, ROLE AND STRUCTURE OF CAROTENOIDS AND CHOROPHYLL
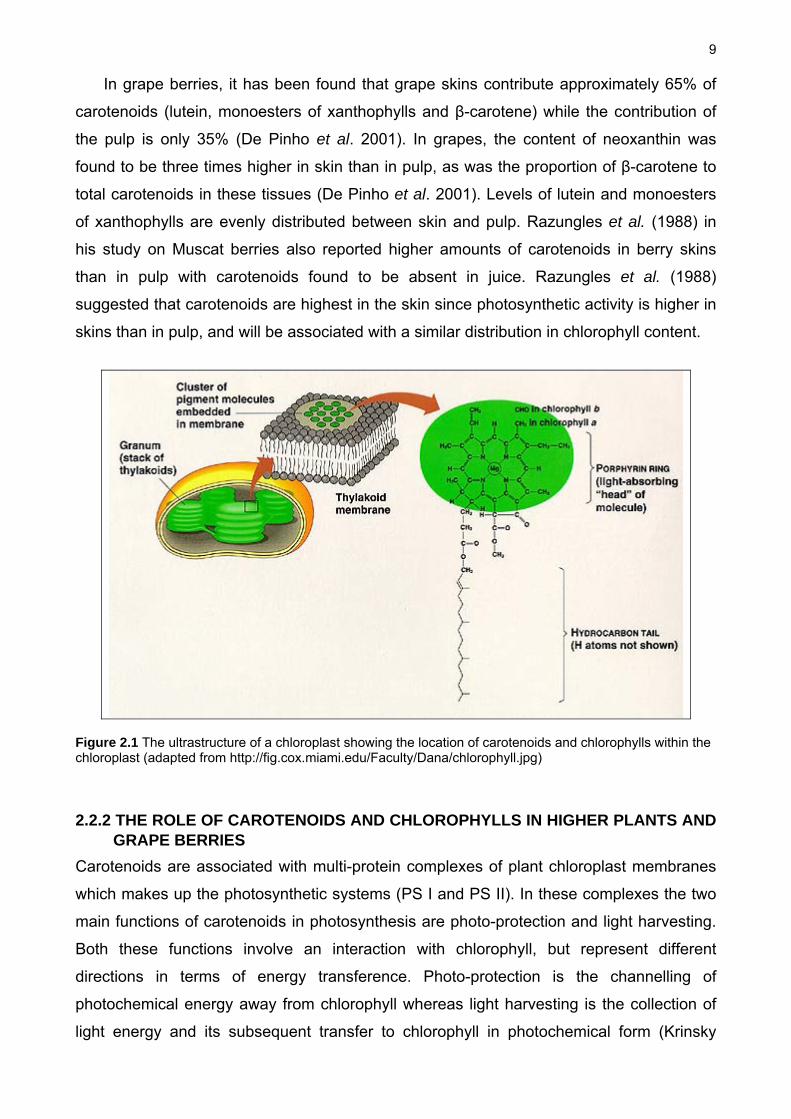
2.2.1 LOCATION OF CAROTENOIDS AND CHLOROPHYLLS IN HIGHER PLANTS AND GRAPE BERRIES
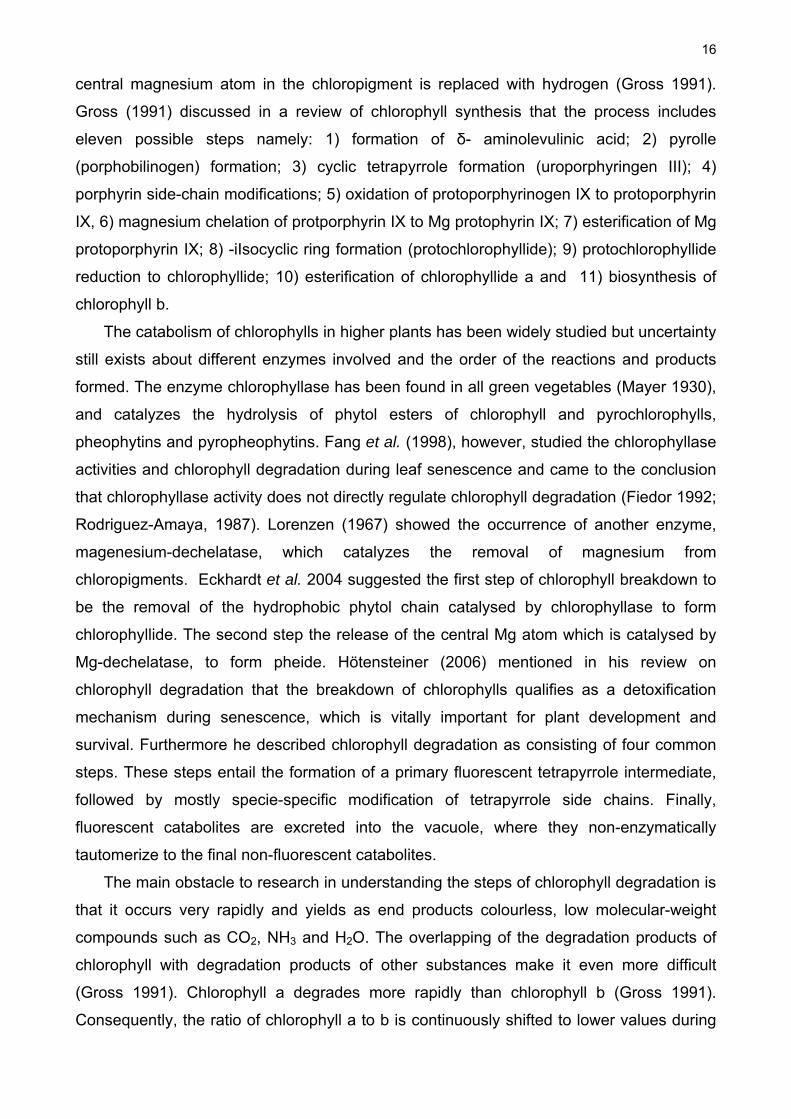
In fruit and flowers, carotenoids are located in chromoplasts (Goodwin 1980). A
chromoplast is a plastid located in plant cells where carotenoids are synthesised and
stored (Deli et al.1992; Minguez-Mosquera et al. 1994). However, carotenoids are also
present in plastids called chloroplasts (Figure 2.1). Work by Camara and Moneger (1978)
confirmed that carotenoids and chlorophylls are synthesised in chloroplasts but
carotenoids are additionally synthesised in chromoplasts (Britten 1979; Deli et al. 1992;
Minguez-Mosquera et al. 1994; Rabinowitch et al. 1975).
It has been found that carotenoids located in the chloroplast are synthesised as part of
an integrated system which underpins processes associated with plastid development
(Goodwin 1993). An etioplast is a chloroplast which has not been exposed to light. During
light-dependent transitions of etioplasts to chloroplasts, massive structural and
biochemical modifications appear as well as pigment (carotenoids and chlorophylls)
changes (Van den Berg et al. 2000).
In maize leaves more carotenoids have been found in mature chloroplasts than in
etioplasts and the conversion of etioplasts to chloroplasts by light stimulates the synthesis
of carotenoids in parallel to the biosynthesis of chlorophyll (Albrecht and Sandmann 1994).

8
It is evident that the regulation of carotenoids is linked to the development and
transformation of plastids, and that light is key in regulating this process.
Plastids continue to divide in developing tissues that are no longer meristematic. Many
early studies demonstrated that the plastid number per cell varies considerably depending
on the cell type, developmental stage, and environmental conditions which the cells are
subjected to (Boffey and Lloyd 1988; Pyke 1999). In spite of these observations, little is
understood about how plastid number per cell is controlled at the molecular level, or how it
is related to the rate of plastid division (Boffey and Lloyd 1988; Pyke 1999). Neither
chromoplasts nor etioplasts have been reported in Vitis vinifera (Hardie et al. 1996). Thus
it appears that carotenoid and chlorophyll synthesis and breakdown in the grape berry is
primarily located in the chloroplast. Chlorophylls and carotenoids are situated in the
thylakoid membranes within the chloroplast (Figure 2.1).
Carotenoids are bound mostly to specific chlorophyll/carotenoid-binding protein
complexes of the two photo systems, namely photosystem I and photosystem II (PSI and
PSII) (Yamamoto and Bassi 1996). Between PSI, PSII and among the different protein
complexes, carotenoids are unevenly distributed. Furthermore within each photosystem
carotenoids are also unevenly distributed, with PSI enriched in β-carotene and PSII
enriched in lutein. In PSII, most of the carotenoid β-carotene is present in the core
complexes closely surrounding the reaction centre. The rest of the carotenoids present are
in the remaining light-harvesting antennae that are made up of several functional
components (Demmig-Adams et al. 1996). In the chloroplast, the carotenoids are masked
by the presence of chlorophylls. The pattern of chloroplast carotenoids has been found to
be universally uniform and contains four basic carotenoids, namely one carotene and three
xanthophylls. Additional minor pigments like α-carotene, α- and β-cryptoxanthin, isolutein
(lutein 5,6-epoxide), zeaxanthin and antheraxanthin (zeaxanthin 5,6-epoxide) were also
found. The approximate levels of chloroplast carotenoids found were as follows: lutein,
which predominates, 40-57%; β-carotene 25-40%; violaxanthin 9-20%; and neoxanthin 5-
15% (Gross 1991).
In grapes, the total level of carotenoids in chloroplasts declines from veraison onward
with a significant reduction when the colour, size and texture of the berries change
(Razungles et al. 1987). This decline of carotenoids from the time of veraison corresponds
with the disappearance of chlorophyll in the chloroplast. The decline of carotenoids may
potentially be part of the catabolism pathway of chlorophyll since both molecules form part
of the photosynthetic apparatus in the chloroplasts, which are not functional without the
presence of chlorophyll (Hardie et al. 1996).
9
In grape berries, it has been found that grape skins contribute approximately 65% of
carotenoids (lutein, monoesters of xanthophylls and β-carotene) while the contribution of
the pulp is only 35% (De Pinho et al. 2001). In grapes, the content of neoxanthin was
found to be three times higher in skin than in pulp, as was the proportion of β-carotene to
total carotenoids in these tissues (De Pinho et al. 2001). Levels of lutein and monoesters
of xanthophylls are evenly distributed between skin and pulp. Razungles et al. (1988) in
his study on Muscat berries also reported higher amounts of carotenoids in berry skins
than in pulp with carotenoids found to be absent in juice. Razungles et al. (1988)
suggested that carotenoids are highest in the skin since photosynthetic activity is higher in
skins than in pulp, and will be associated with a similar distribution in chlorophyll content.
Figure 2.1 The ultrastructure of a chloroplast showing the location of carotenoids and chlorophylls within the chloroplast (adapted from http://fig.cox.miami.edu/Faculty/Dana/chlorophyll.jpg)
2.2.2 THE ROLE OF CAROTENOIDS AND CHLOROPHYLLS IN HIGHER PLANTS AND GRAPE BERRIES
Carotenoids are associated with multi-protein complexes of plant chloroplast membranes
which makes up the photosynthetic systems (PS I and PS II). In these complexes the two
main functions of carotenoids in photosynthesis are photo-protection and light harvesting.
Both these functions involve an interaction with chlorophyll, but represent different
directions in terms of energy transference. Photo-protection is the channelling of
photochemical energy away from chlorophyll whereas light harvesting is the collection of
light energy and its subsequent transfer to chlorophyll in photochemical form (Krinsky
10
1979). Carotenoids are essential to higher plants as photo-protectors since the transfer of
energy to chlorophylls converts them to a higher energy (excited) state. These excited
molecules can cause some lethal mutations in carotenoid synthesis which could damage
the photosynthetic apparatus (Van den Berg et al. 2000; Krinsky 1979).
During photosynthesis the xanthophylls lutein, violaxanthin, neoxanthin and to a lesser
extent β-carotene operate as accessory light harvesting pigments. The xanthophyll,
zeaxanthin is primarily responsible for the safe dissipation of excess light energy as heat
via the xanthophyll cycle whereas β-carotene is a potent antioxidant amongst others
(Packer and Douce 1987).
In grape berries the physiological role of carotenoids in photosynthesis has not been
widely studied. Potentially, they play the same role as in leaves in the early stages of fruit
development and ripening by harvesting light and protecting the photosynthetic apparatus
against excess sunlight energy. However, it is well known that carotenoids are the
precursors to some grape aroma compounds (C13-norisoprenoids) (Baumes et al. 2002)
and absicic acid, formed via the carotenoid biosynthetic pathway (Marin et al. 1996) is a
hormonal signal controlling the onset of berry ripening (Coombe and Hale 1973).
Chlorophyll is the main photoreceptor in photosynthesis, the light-driven process in
which carbon dioxide is fixed to yield carbohydrates and oxygen (Quach et al. 2004).
Limited data is available on the antioxidant capacity of chlorophyll (Buratti et al. 2001).
More data on the antioxidant capacity of chlorophyll in grapes could add value to grape
products in regards to their health benefits (Razungles et al. 1996; Endo 1985).
2.2.3 STRUCTURE OF CAROTENOID AND CHLOROPHYLL MOLECULES
Carotenoid structure consists of a system of long, aliphatic conjugated double bonds which
are responsible for the various physical, biochemical and chemical properties they impart
to the molecule (Van den Berg et al. 2000). These extended systems of conjugated bonds
designate carotenoids as a group of deeply red or yellow pigments with absorption
maxima of between 400 and 500 nm, the range of which is dependent upon the amount of
conjugated double bonds per molecule (Van den Berg et al. 2000). The carbon-carbon
double bonds can exist in the cis- or trans- isomer configurations depending on the
arrangement of substitutes (Weedon and Moss 1995; Zechmeister and Polgar 1943). In
natural sources, carotenoids occur mainly in the all-trans configuration (Chandler and
Schwartz 1987). Isomerisation of all-trans-carotenoids to cis-isomers is promoted by
contact with acids, heat treatment and exposure to light (Rodriguez-Amaya et al. 2008;
Van den Berg et al. 2000; Oliver and Palou 2000). Additionally, these alterations can affect

11
the configuration and structure of these lipophilic pigments. Most of the carotenoids are
composed of eight isoprene units with the molecular formula C40H56 (Armstrong and
Hearst 1996).
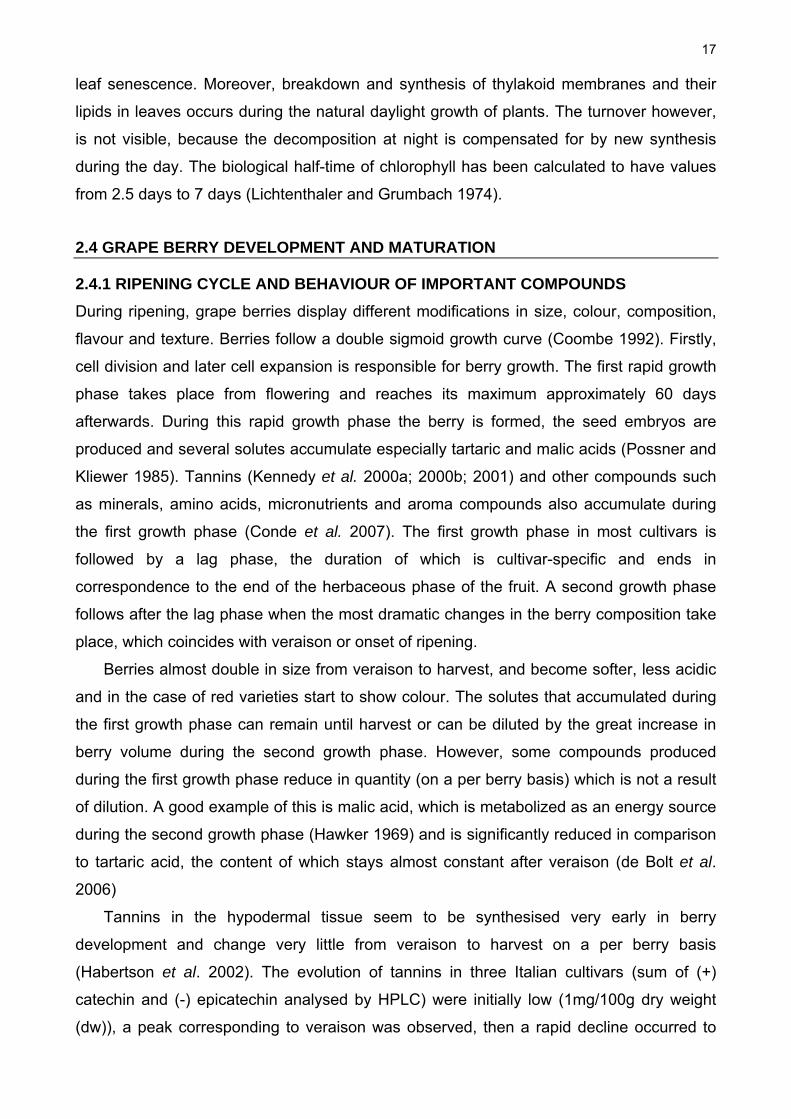
There are two classes of carotenoids based on their structure, namely carotenes and
xanthophylls (Figure 2.2). Oxygenated carotenes are called xanthophylls and can have
various combinations of e.g. hydroxyl-, epoxy-, alcohol-, aldehyde-, keto-, lactone-,
carboxylic acid-, ester or phenolic functional groups (Felt et al. 2005). In mature grapes the
most common carotenes are β-carotene and lutein, representing almost 85% of the total.
They are accompanied by minor xanthophylls such as neoxanthin, violaxanthin, lutein-5,6-
epoxide, zeaxanthin, neochrome, flavoxanthin and luteoxanthin (Baumes et al. 2002).
Most of the carotenoids reported to be found in berries are in the trans-configuration.
However cis-isomers of lutein, β-carotene and neoxanthin have been reported by Mendes-
Pinto et al. (2004, 2005). It is not certain if these isomers do exist in grape berries or if it is
an artefact of sample processing.
Figure 2.2 The structure of A: β-carotene an example of the carotene group. B: Zeaxanthin an example of the xanthophylls group of carotenoids (Van den Berg et al. 2000).
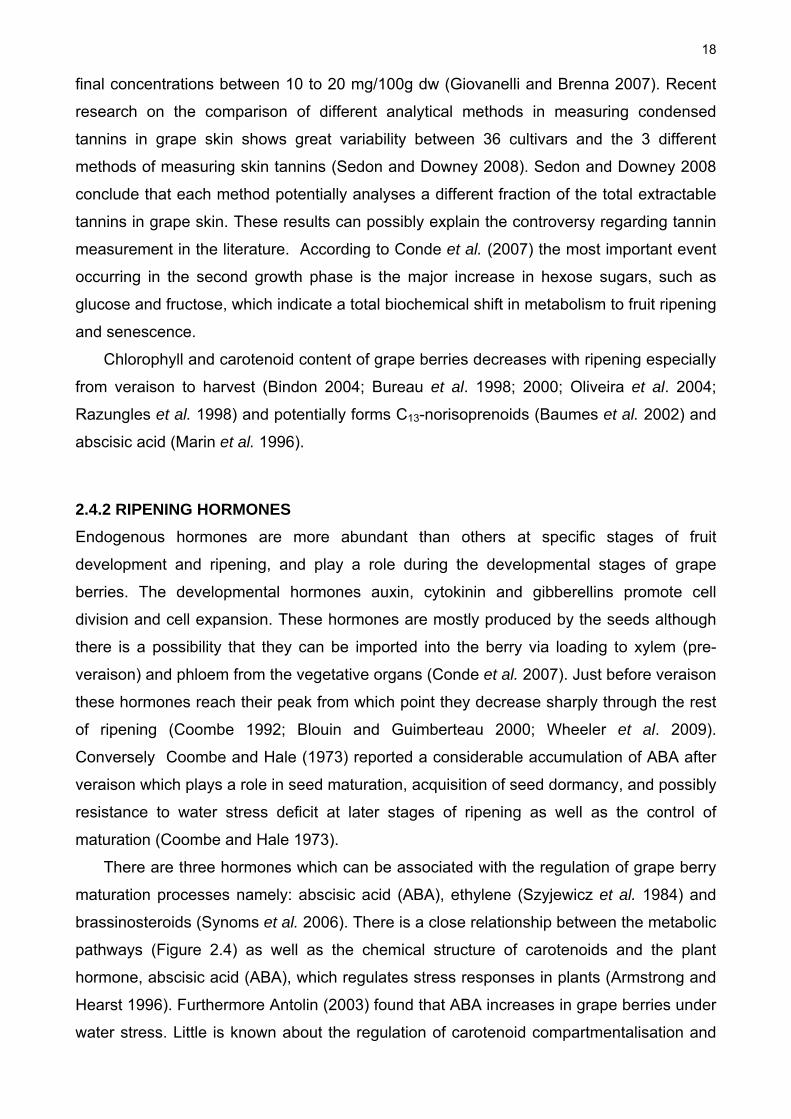
Chlorophyll is a cyclic tetrapyrolle with a structure similar to the heme group of globins
(hemoglobin, myglobin) and cytochromes (Figure 2.3). The central metal ion in chlorophyll
is magnesium. Although several types of chlorophyll exist, chlorophyll a is the major
pigment and chlorophyll b is accessory pigments which exist in a ratio of approximately 3
to 1 in higher plants (Gross 1991). The difference between chlorophyll a and chlorophyll b
is a methyl side-chain in chlorophyll a which is substituted with a formyl group in
chlorophyll b (Gross 1991). Chlorophylls are green in colour because they absorb strongly
in the red and blue regions of the visible spectrum. Small differences in the structures of
the two chlorophylls produce differences in the absorption maxima of chlorophyll a and
chlorophyll b.
A B

12
Figure 2.3 The structure of A: chlorophyll a and B: chlorophyll b (adapted from Schoefs (2002))
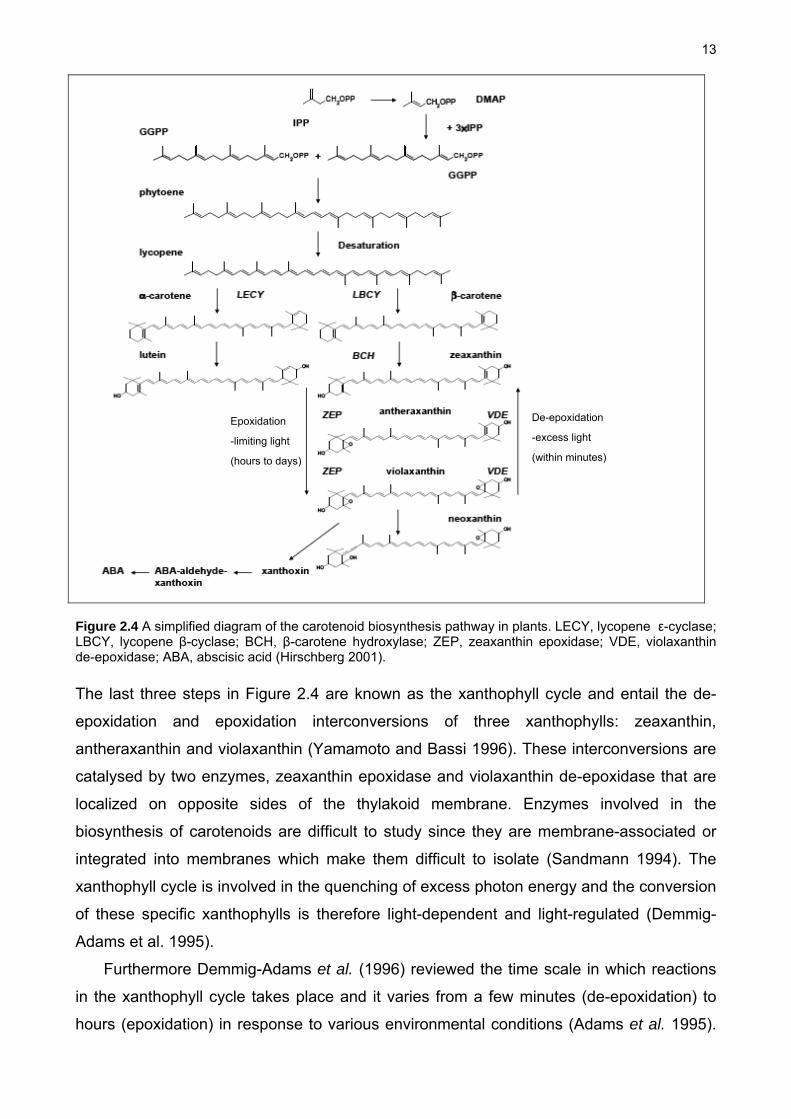
2.3 BIOSYNTHESIS AND DEGRADATION OF CAROTENOIDS AND CHLOROPHYLLS
2.3.1 BIOSYNTHESIS AND DEGRADATION OF CAROTENOIDS
The biosynthesis of carotenoids follows the non-melavonate pathway (Britten 1979) via
isopentyl diphosphate (IPP) as a precursor, obtained by condensation of pyruvate and
glyceraldehyde-3-phophate via 1-deoxy-D-xylulose-5-phophate (Figure 2.3) (Lichtenthaler
et al. 1997). According to research it is not yet certain whether the plastids can synthesise
carotenoids directly from isopentyl diphosphate (IPP) or whether IPP is imported to the
plastid (chloroplast) but it does appear that the site of synthesis of the early precursors
depends upon the developmental stage of the chloroplast (Goodwin 1993). Furthermore
Britton et al. (1982) reported that biogenesis of carotenoids takes place in the chloroplast
and are an integral part of the chloroplast development. Carotenoid synthesis is also
closely linked to biosynthesis of other chloroplast components like pigment complexes,
lipids and other material which forms part of the thylakoid membranes. If one component is
not available, the entire chloroplast construction is disrupted. Gross (1991) discussed
carotenoid biosynthesis involving six stages namely: i) formation of mevalonic acid ii)
formation of geranylgeranyl pyrophosphate iii) formation of phytoene iv) desaturation of
phytoene v) cyclization vi) formation of xanthopylls.
A B
13
Figure 2.4 A simplified diagram of the carotenoid biosynthesis pathway in plants. LECY, lycopene ε-cyclase; LBCY, lycopene β-cyclase; BCH, β-carotene hydroxylase; ZEP, zeaxanthin epoxidase; VDE, violaxanthin de-epoxidase; ABA, abscisic acid (Hirschberg 2001).
The last three steps in Figure 2.4 are known as the xanthophyll cycle and entail the de-
epoxidation and epoxidation interconversions of three xanthophylls: zeaxanthin,
antheraxanthin and violaxanthin (Yamamoto and Bassi 1996). These interconversions are
catalysed by two enzymes, zeaxanthin epoxidase and violaxanthin de-epoxidase that are
localized on opposite sides of the thylakoid membrane. Enzymes involved in the
biosynthesis of carotenoids are difficult to study since they are membrane-associated or
integrated into membranes which make them difficult to isolate (Sandmann 1994). The
xanthophyll cycle is involved in the quenching of excess photon energy and the conversion
of these specific xanthophylls is therefore light-dependent and light-regulated (Demmig-
Adams et al. 1995).
Furthermore Demmig-Adams et al. (1996) reviewed the time scale in which reactions
in the xanthophyll cycle takes place and it varies from a few minutes (de-epoxidation) to
hours (epoxidation) in response to various environmental conditions (Adams et al. 1995).
De-epoxidation
-excess light
(within minutes)
Epoxidation
-limiting light
(hours to days)

14
Changes in the pH within the thylakoid membrane facilitate the typical biochemical
conversions in the xanthophyll cycle over the course of minutes up to a day. Variation in
seasonal and weather conditions come in to play during periods when the rates of
photosynthesis, and thus the rates of utilization of absorbed light, are low throughout the
day e.g. in cloudy winter periods (Demmig-Adams et al. 1996).
Little information is available about the turnover of carotenoids within the xanthophyll
cycle. Several oxidative cleavage reactions of carotenoids are known. Scission of epoxy-
carotenoids such as violaxanthin and neoxanthin initiates the synthesis of abscisic acid
(ABA). The abscisic acid-deficient mutant aba2 of Nicotiana plumbaginifolia is blocked in
the epoxidation reaction of zeaxanthin to violaxanthin indicating that carotenoid precursors
are essential for ABA biosynthesis (Nussaume et al. 1996).
2.3.2 BIOSYNTHESIS AND DEGRADATION OF CHLOROPHYLLS
Chlorophyll is formed as part of a network of pathways which forms various tetrapyrroles
and can be subdivided into three parts, i) formation of 5-aminolevulinic acid (ALA), the
committed step for all tetrapyrroles, ii) formation of protoporphyrin IX (Proto) from eight
molecules of ALA and iii) formation of chlorophyll in the magnesium branch (Figure 2.5)
(Eckhardt et al. 2004). The enzymes which contribute to chlorophyll synthesis correspond
to the biochemical nature of the metabolic intermediates. The early steps in chlorophyll
synthesis are catalysed by highly soluble enzymes which are located mostly in the
chloroplast stroma. The later steps are associated with thylakoid or inner envelope
membranes of the chloroplast (Eckhardt et al. 2004).
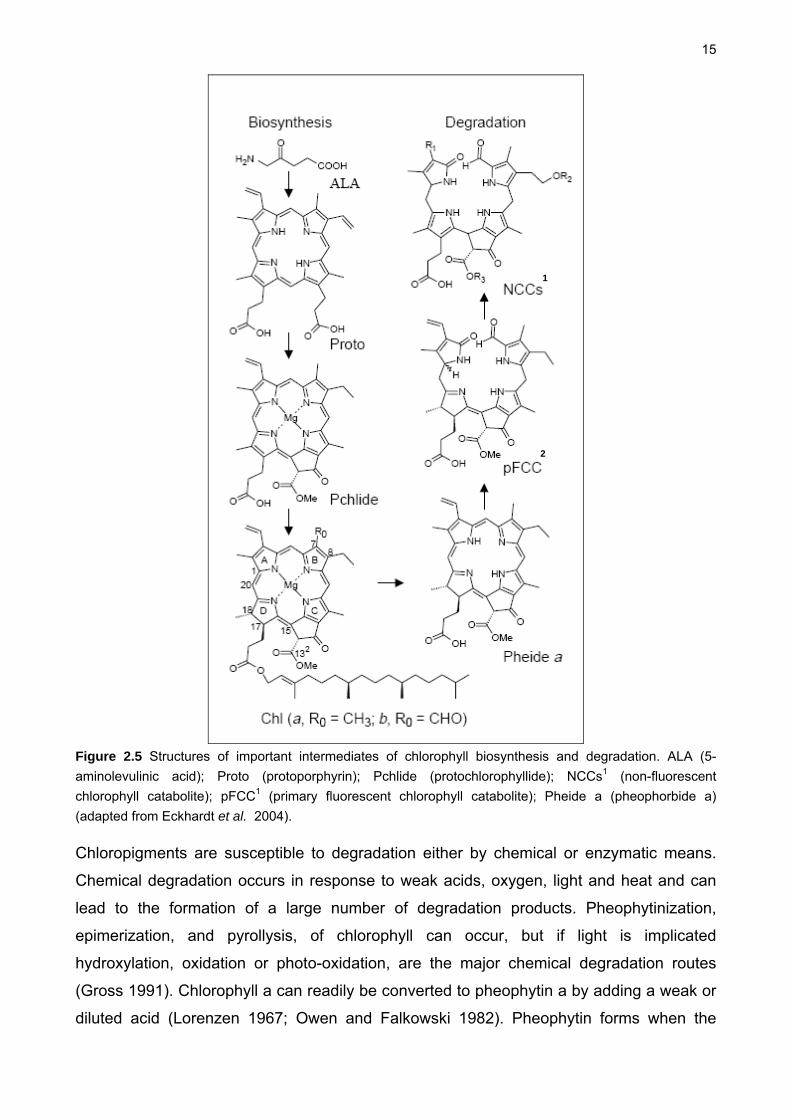
15
Figure 2.5 Structures of important intermediates of chlorophyll biosynthesis and degradation. ALA (5-
aminolevulinic acid); Proto (protoporphyrin); Pchlide (protochlorophyllide); NCCs1 (non-fluorescent
chlorophyll catabolite); pFCC1 (primary fluorescent chlorophyll catabolite); Pheide a (pheophorbide a)
(adapted from Eckhardt et al. 2004).
Chloropigments are susceptible to degradation either by chemical or enzymatic means.
Chemical degradation occurs in response to weak acids, oxygen, light and heat and can
lead to the formation of a large number of degradation products. Pheophytinization,
epimerization, and pyrollysis, of chlorophyll can occur, but if light is implicated
hydroxylation, oxidation or photo-oxidation, are the major chemical degradation routes
(Gross 1991). Chlorophyll a can readily be converted to pheophytin a by adding a weak or
diluted acid (Lorenzen 1967; Owen and Falkowski 1982). Pheophytin forms when the
1
2
16
central magnesium atom in the chloropigment is replaced with hydrogen (Gross 1991).
Gross (1991) discussed in a review of chlorophyll synthesis that the process includes
eleven possible steps namely: 1) formation of δ- aminolevulinic acid; 2) pyrolle
(porphobilinogen) formation; 3) cyclic tetrapyrrole formation (uroporphyringen III); 4)
porphyrin side-chain modifications; 5) oxidation of protoporphyrinogen IX to protoporphyrin
IX, 6) magnesium chelation of protporphyrin IX to Mg protophyrin IX; 7) esterification of Mg
protoporphyrin IX; 8) -iIsocyclic ring formation (protochlorophyllide); 9) protochlorophyllide
reduction to chlorophyllide; 10) esterification of chlorophyllide a and 11) biosynthesis of
chlorophyll b.
The catabolism of chlorophylls in higher plants has been widely studied but uncertainty
still exists about different enzymes involved and the order of the reactions and products
formed. The enzyme chlorophyllase has been found in all green vegetables (Mayer 1930),
and catalyzes the hydrolysis of phytol esters of chlorophyll and pyrochlorophylls,
pheophytins and pyropheophytins. Fang et al. (1998), however, studied the chlorophyllase
activities and chlorophyll degradation during leaf senescence and came to the conclusion
that chlorophyllase activity does not directly regulate chlorophyll degradation (Fiedor 1992;
Rodriguez-Amaya, 1987). Lorenzen (1967) showed the occurrence of another enzyme,
magenesium-dechelatase, which catalyzes the removal of magnesium from
chloropigments. Eckhardt et al. 2004 suggested the first step of chlorophyll breakdown to
be the removal of the hydrophobic phytol chain catalysed by chlorophyllase to form
chlorophyllide. The second step the release of the central Mg atom which is catalysed by
Mg-dechelatase, to form pheide. Hötensteiner (2006) mentioned in his review on
chlorophyll degradation that the breakdown of chlorophylls qualifies as a detoxification
mechanism during senescence, which is vitally important for plant development and
survival. Furthermore he described chlorophyll degradation as consisting of four common
steps. These steps entail the formation of a primary fluorescent tetrapyrrole intermediate,
followed by mostly specie-specific modification of tetrapyrrole side chains. Finally,
fluorescent catabolites are excreted into the vacuole, where they non-enzymatically
tautomerize to the final non-fluorescent catabolites.
The main obstacle to research in understanding the steps of chlorophyll degradation is
that it occurs very rapidly and yields as end products colourless, low molecular-weight
compounds such as CO2, NH3 and H2O. The overlapping of the degradation products of
chlorophyll with degradation products of other substances make it even more difficult
(Gross 1991). Chlorophyll a degrades more rapidly than chlorophyll b (Gross 1991).
Consequently, the ratio of chlorophyll a to b is continuously shifted to lower values during
17
leaf senescence. Moreover, breakdown and synthesis of thylakoid membranes and their
lipids in leaves occurs during the natural daylight growth of plants. The turnover however,
is not visible, because the decomposition at night is compensated for by new synthesis
during the day. The biological half-time of chlorophyll has been calculated to have values
from 2.5 days to 7 days (Lichtenthaler and Grumbach 1974).
2.4 GRAPE BERRY DEVELOPMENT AND MATURATION
2.4.1 RIPENING CYCLE AND BEHAVIOUR OF IMPORTANT COMPOUNDS
During ripening, grape berries display different modifications in size, colour, composition,
flavour and texture. Berries follow a double sigmoid growth curve (Coombe 1992). Firstly,
cell division and later cell expansion is responsible for berry growth. The first rapid growth
phase takes place from flowering and reaches its maximum approximately 60 days
afterwards. During this rapid growth phase the berry is formed, the seed embryos are
produced and several solutes accumulate especially tartaric and malic acids (Possner and
Kliewer 1985). Tannins (Kennedy et al. 2000a; 2000b; 2001) and other compounds such
as minerals, amino acids, micronutrients and aroma compounds also accumulate during
the first growth phase (Conde et al. 2007). The first growth phase in most cultivars is
followed by a lag phase, the duration of which is cultivar-specific and ends in
correspondence to the end of the herbaceous phase of the fruit. A second growth phase
follows after the lag phase when the most dramatic changes in the berry composition take
place, which coincides with veraison or onset of ripening.
Berries almost double in size from veraison to harvest, and become softer, less acidic
and in the case of red varieties start to show colour. The solutes that accumulated during
the first growth phase can remain until harvest or can be diluted by the great increase in
berry volume during the second growth phase. However, some compounds produced
during the first growth phase reduce in quantity (on a per berry basis) which is not a result
of dilution. A good example of this is malic acid, which is metabolized as an energy source
during the second growth phase (Hawker 1969) and is significantly reduced in comparison
to tartaric acid, the content of which stays almost constant after veraison (de Bolt et al.
2006)
Tannins in the hypodermal tissue seem to be synthesised very early in berry
development and change very little from veraison to harvest on a per berry basis
(Habertson et al. 2002). The evolution of tannins in three Italian cultivars (sum of (+)
catechin and (-) epicatechin analysed by HPLC) were initially low (1mg/100g dry weight
(dw)), a peak corresponding to veraison was observed, then a rapid decline occurred to
18
final concentrations between 10 to 20 mg/100g dw (Giovanelli and Brenna 2007). Recent
research on the comparison of different analytical methods in measuring condensed
tannins in grape skin shows great variability between 36 cultivars and the 3 different
methods of measuring skin tannins (Sedon and Downey 2008). Sedon and Downey 2008
conclude that each method potentially analyses a different fraction of the total extractable
tannins in grape skin. These results can possibly explain the controversy regarding tannin
measurement in the literature. According to Conde et al. (2007) the most important event
occurring in the second growth phase is the major increase in hexose sugars, such as
glucose and fructose, which indicate a total biochemical shift in metabolism to fruit ripening
and senescence.
Chlorophyll and carotenoid content of grape berries decreases with ripening especially
from veraison to harvest (Bindon 2004; Bureau et al. 1998; 2000; Oliveira et al. 2004;
Razungles et al. 1998) and potentially forms C13-norisoprenoids (Baumes et al. 2002) and
abscisic acid (Marin et al. 1996).
2.4.2 RIPENING HORMONES
Endogenous hormones are more abundant than others at specific stages of fruit
development and ripening, and play a role during the developmental stages of grape
berries. The developmental hormones auxin, cytokinin and gibberellins promote cell
division and cell expansion. These hormones are mostly produced by the seeds although
there is a possibility that they can be imported into the berry via loading to xylem (pre-
veraison) and phloem from the vegetative organs (Conde et al. 2007). Just before veraison
these hormones reach their peak from which point they decrease sharply through the rest
of ripening (Coombe 1992; Blouin and Guimberteau 2000; Wheeler et al. 2009).
Conversely Coombe and Hale (1973) reported a considerable accumulation of ABA after
veraison which plays a role in seed maturation, acquisition of seed dormancy, and possibly
resistance to water stress deficit at later stages of ripening as well as the control of
maturation (Coombe and Hale 1973).
There are three hormones which can be associated with the regulation of grape berry
maturation processes namely: abscisic acid (ABA), ethylene (Szyjewicz et al. 1984) and
brassinosteroids (Synoms et al. 2006). There is a close relationship between the metabolic
pathways (Figure 2.4) as well as the chemical structure of carotenoids and the plant
hormone, abscisic acid (ABA), which regulates stress responses in plants (Armstrong and
Hearst 1996). Furthermore Antolin (2003) found that ABA increases in grape berries under
water stress. Little is known about the regulation of carotenoid compartmentalisation and
19
metabolism towards ABA production under stress conditions. Hypothetically, under
conditions where ABA is actively synthesised in plant tissue, carotenoid pools may be
increased.
Lund et al. (2008) demonstrated via real-time RT-PCR analyses that up-regulation of
a 9-cis-epoxycarotenoid gene family member, VvNCED2, in grape seed and pericarp and
a putative ortholog to a reported abscisic acid receptor, VvGCR2, are correlated with
ripening initiation. In higher plants, ABA is derived from C40-cis-epoxycarotenoids, either
9'-cis-neoxanthin or 9-cis-violaxanthin or both, which are cleaved by 9-cis-epoxycarotenoid
dioxygenase (NCED) to produce xanthoxin, the direct C15 precursor of ABA (Cutler and
Krochko, 1999; Liotenberg 1999; Taylor et al. 2000). The abscisic acid-deficient mutant
aba2 of Nicotiana plumbaginifolia is blocked in the epoxidation reaction of zeaxanthin to
violaxanthin, indicating that carotenoid precursors are essential for abscisic acid
biosynthesis (Marin et al. 1996). However, this has not yet been studied in relation to
carotenoid and C13-norisoprenoid metabolism in grapes. A more recent study on the
relationship between expression of abscisic acid biosynthesis genes, and berry ripening
reported that berries may have the potential to synthesise ABA in situ. However, the
expression profile of the genes (VvCED1, VvNCED2, VvZEP) studied did not correlate well
with ABA levels indicating that ABA accumulation is under more complex control (Wheeler
et al. 2009). Furthermore ABA appears to influence the expression of genes in the
anthocyanin pathway and the transcription of genes and activity of proteins involved in
sugar accumulation and metabolism during ripening are also influenced by ABA (Cakir et
al. 2003; Pan et al. 2005; Yu et al. 2006)
Coombe (1989) found that endogenous ABA concentration rises coincidentally with
sugar increase and berry softening and when berries were treated with ABA the onset of
ripening was hastened. These results are good evidence in favour of ABA as a hormonal
trigger of ripening in grapes.
2.4.3 BIOSYNTHESIS AND DEGRADATION OF CAROTENOIDS IN GRAPE BERRIES
Several oxidative cleavage reactions of carotenoids are known in higher plants. Cleavage
of epoxy-carotenoids such as violaxanthin and neoxanthin initiates the synthesis of
abscisic acid (ABA). The ABA-deficient mutant aba2 of Nicotiana plumbaginifolia is
blocked in the epoxidation reaction of zeaxanthin to violaxanthin indicating that carotenoid
precursors are essential for ABA biosynthesis (Nussaume et al. 1996). In grape berries
there is a close relationship between the rate of carotenoid degradation and the generation
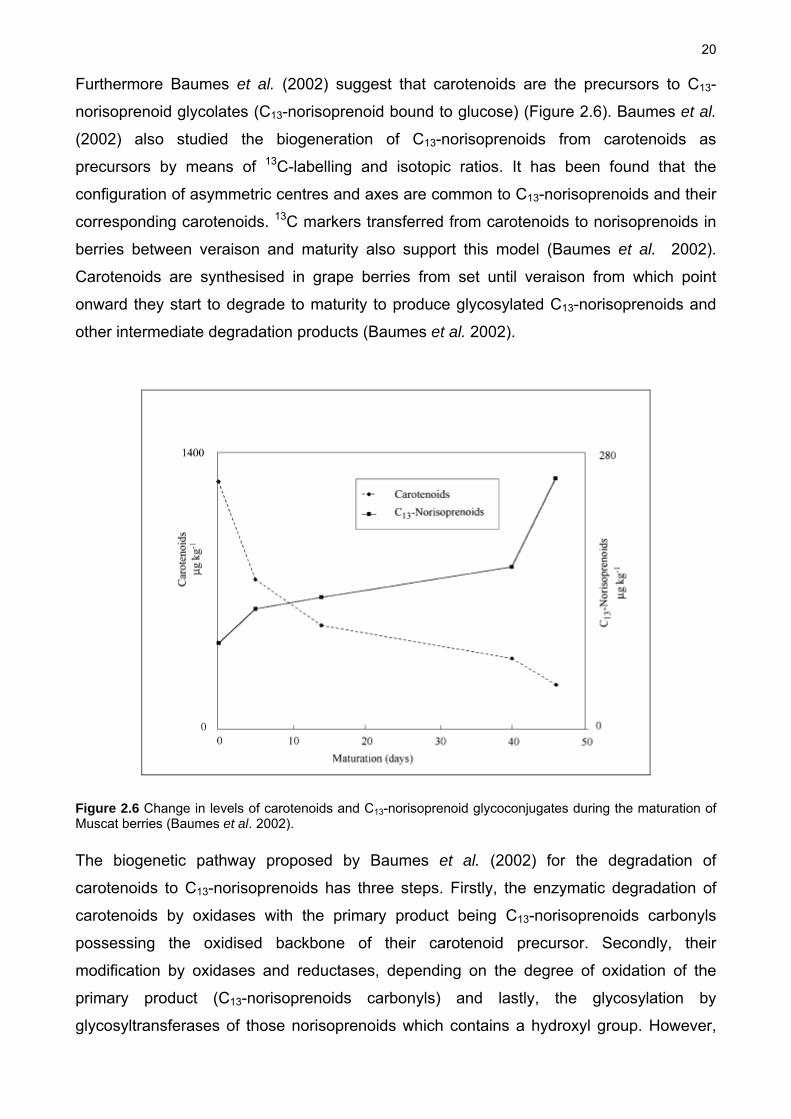
of C13-norisoprenoids with the onset of grape maturity (Figure 2.6) (Baumes et al. 2002).
20
Furthermore Baumes et al. (2002) suggest that carotenoids are the precursors to C13-
norisoprenoid glycolates (C13-norisoprenoid bound to glucose) (Figure 2.6). Baumes et al.
(2002) also studied the biogeneration of C13-norisoprenoids from carotenoids as
precursors by means of 13C-labelling and isotopic ratios. It has been found that the
configuration of asymmetric centres and axes are common to C13-norisoprenoids and their
corresponding carotenoids. 13C markers transferred from carotenoids to norisoprenoids in
berries between veraison and maturity also support this model (Baumes et al. 2002).
Carotenoids are synthesised in grape berries from set until veraison from which point
onward they start to degrade to maturity to produce glycosylated C13-norisoprenoids and
other intermediate degradation products (Baumes et al. 2002).
Figure 2.6 Change in levels of carotenoids and C13-norisoprenoid glycoconjugates during the maturation of Muscat berries (Baumes et al. 2002).
The biogenetic pathway proposed by Baumes et al. (2002) for the degradation of
carotenoids to C13-norisoprenoids has three steps. Firstly, the enzymatic degradation of
carotenoids by oxidases with the primary product being C13-norisoprenoids carbonyls
possessing the oxidised backbone of their carotenoid precursor. Secondly, their
modification by oxidases and reductases, depending on the degree of oxidation of the
primary product (C13-norisoprenoids carbonyls) and lastly, the glycosylation by
glycosyltransferases of those norisoprenoids which contains a hydroxyl group. However,
21
no such systems are yet described for grapes. A more recent discovery indicated the
potential generation of β-ionone from zeaxanthin following cleavage of the latter by a
characterized cv. Shiraz carotenoid cleavage dioxygenase (Mathieu et al. 2005). Marais et
al. (1992) showed that the carotenoid lutein might be an original precursor of TDN in his
study of the breakdown of lutein in a heated model wine solution. Oliveira et al. (2006)
shown in his work on eight cultivars from the Douro Valley in Portugal that cultivars with
low carotenoid content correspond to wines with higher levels of the grape-derived C13-
norisoprenoid volatiles β-ionone, TDN and vitispirane. In grape berries the xanthophyll
cycle was initially thought to be active only after veraison since violaxanthin could not be
detected before veraison (Razungles et al. 1996). However later research where sun-
exposed and shaded grapes were studied before and after veraison, it has been found that
the carotenoid pool size adjusts sensitively to ambient conditions before veraison. The
xanthophyll cycle potentially loses this sensitivity to ambient conditions and therefore
potentially its importance with the onset of ripening (Düring and Davtyan 2002).
2.4.4 BIOSYNTHESIS AND DEGRADATION OF CHLOROPHYLLS IN GRAPE
BERRIES
In grape berries, Downey et al. (2004) found that chlorophyll starts to decrease per berry
from two weeks after veraison until the fourth week post veraison to approximately 50% of
the original concentration and remains at this level until harvest. Degradation products of
chlorophyll, pheophytin a and pheophytin b in grapes are reported by Mendes-Pinto et al.
(2005). It is unsure if these chlorophyll breakdown products of chlorophyll do exist in grape
berries or if they are artefacts of berry sample processing. Giovanelli and Brenna (2007)
found in their study on three Italian grape varieties that chlorophyll decreased in all
cultivars and almost disappeared in mature white grapes. However, in red grapes a level
of 14 to 20% of the initial concentration was found at maturation.
In Shiraz grape berries, Downey et al. (2004) found less chlorophyll in berries
excluded from sunlight throughout the ripening season compared to berries exposed to
sunlight showing that chlorophyll synthesis in grape berries is light-induced (Zucker 1972;
Raven 1992). Plant species exposed to sun tend to have a higher chlorophyll a/b ratio (3.2
to 4) compared to shaded plants (2.6 to 3.2) (Lichtenthaler 1971, Lichtenthaler et al. 1981).
The increased proportion of chlorophyll b in shade plants is due to its absorption
properties. Since chlorophyll b absorbs strongly in the 450-480 nm range, it can captures
light at low intensity effectively, partially filling the gap in the chlorophyll a spectrum.

22
2.5 VITICULTURAL INFLUENCES ON CAROTENOIDS AND CHLOROPHYLL CONTENT OF GRAPE BERRIES
2.5.1 THE EFFECT OF SUNLIGHT AND TEMPERATURE
2.5.1.1 The effect of sunlight and temperature on carotenoids and its C13-norisoprenoid degradation products
A significant amount of research has been done on the effect of sunlight on grape berry
composition through maturation. Sunlight enhances carotenoid degradation (Razungles et
al. 1998; Bureau et al. 1998; Bindon 2004; Bureau et al. 2002; Oliveira et al. 2004). Light
utilization and thermal dissipation of field-grown sun- and shade-adapted/exposed berries
of cvs. Kerner (white) and Porugieser (red) were studied by Düring and Davtyan (2002).
This study showed significant divergence of the pool size of the xanthophyll cycle
pigments during the development of sun- and shade-adapted berries pre-veraison. Under
clear, warm-weather conditions in shade-adapted/exposed berries the xanthophyll pool
size decreased to low levels, while in sun-adapted/exposed berries it increased to
maximum values shortly before (cv. Kerner) or at veraison (cv. Portugieser) and
subsequently declined. The xanthophyll pool size decreased for both cultivars during a rain
period suggesting that the xanthophyll pool size varies according to ambient conditions. It
was concluded that unripe, sun-exposed berries are better adapted to higher light
intensities than shade adapted berries due to their higher capacity for photosynthetic
energy consumption and thermal energy dissipation. At the onset of ripening these photo-
protective mechanisms appear to lose importance (Düring and Davtyan 2002).
In a study by Steel and Keller (2000) grape berries of cv. Cabernet Sauvignon covered
by a UV-B screen which reduced UV light by 98% showed a more pronounced
degradation of β-carotene from veraison onward, compared to the same berries under
normal light conditions. In this study, lutein also decreased when fruit development
occurred under the UV-B screen compared to normal light conditions. Tevini and
Teramura (1989) reported in their work, that it is generally accepted that increasing UV-B
levels will lead to enhanced overall carotenoid levels in plants, but it is possible that the
relative amounts of individual carotenoids can be altered.
Considering the strong relationship between carotenoid degradation and C13-
norisoprenoid production, it is conceivable that where environmental factors have an
impact on the carotenoid metabolism, C13-norisoprenoid formation would be influenced in
likewise manner. Increased light at the bunch zone has been correlated with the increase
in the C13-norisoprenoid content of berries and the corresponding wines in some studies
23
(Baumes et al. 2002; Bureau et al. 1998; Razungles et al. 1998; Marais 1992b; Bureau et
al. 2000; Ristic et al. 2007).
The content of hydrolytically-released C13-norisoprenoids measured in totally shaded
(bunches covered with boxes from set to harvest) fruit were decreased in comparison to
sun-exposed fruit (Bindon 2004). The decrease of C13-norisoprenoids compared to the
sun-exposed fruit correlated with a decreased content of β-carotene and lutein in the
berries, showing that shade inhibited carotenoid accumulation, and therefore possibly the
pool available for degradation to C13-norisoprenoids. However, since light is known to
accelerate carotenoid breakdown after veraison, this result most likely reflects reduced
carotenoid synthesis (Bindon 2004).
A study by Bureau et al. (2000) on cv. Muscat compared artificially shaded bunches
covered with shade cloths to berries under naturally shaded or sun-exposed ambient
conditions. The artificially shaded fruit showed a decrease in free and glycolysated C13-
norisoprenoids when compared to naturally shaded and sun-exposed berries, which had
similar levels of C13-norisoprenoids. Another study which looked at whole-vine shading
showed changes in the relative composition of bound C13-norisoprenoids as a proportion
of the total C13–norisoprenoids, without affecting the total concentration of C13-
norisoprenoids (Bureau et al. 2002). However, in the same study, when sun-exposed
bunches during set to veraison were compared to the treatment where only bunches were
directly shaded, an increase was seen in the total concentration of C13–norisoprenoids in
sun-exposed matured berries. The increase of C13–norisoprenoids was 16-36% for sun
exposed fruit compared to fruit grown under conditions of extreme shade (10% sun)
(Bureau et al. 2002). This shows that the clear effect of sunlight on carotenoid catabolism
and C13-norisoprenoid production was only evident when comparing extreme conditions of
sunlight and of shade. In general, the literature shows variable results in terms of C13-
norisoprenoid generation and sun-exposure when intermediate levels of shade and sun-
exposure are compared, and a clear relationship between the two factors under ambient
conditions has not been observed to date. However Marais et al. (1992a) studied the effect
of sun-exposed and natural shaded grape bunches on the C13-norisoprenoid content of
cvs. Chenin blanc and Weisser Riesling. Marais conclude that with a few exceptions,
norisoprenoids concentrations were significantly higher in sun-exposed grapes than in the
shaded grapes.
Ristic et al. (2007) studied the effect of extreme, artificial shading on anthocyanin,
tannin and some C13-norisoprenoids in cv. Shiraz berries and the corresponding wines.
Bunches were enclosed with boxes just after flowering, and little effect on the timing of
24
berry ripening and accumulation of sugar was found. However at harvest the shaded
bunches had smaller berries and higher seed weight, juice pH and titratable acidity. When
sunlight was excluded from Shiraz berries the amount of anthocynin was not significantly
altered, although the composition was shifted towards dioxygeneated anthocyanins
(glycosides of cyanidin and peonidin derivatives). However a decrease in skin tannins and
an increase of seed tannins were observed. The wines made from the shaded grapes had
decreased levels of glycosylated β-damascanone and TDN (C13-norisoprenoids), less
anthocyanins and tannins, and altered sensory attributes. A similar study by Downey et al.
(2004) on cv. Shiraz berries showed the same results for anthocyanin but no significant
difference in seed and skin tannin was observed.
From these experiments it seems clear that sunlight may influence the formation
and degradation of carotenoids and C13–norisoprenoids, mainly when extremes in the
levels of sun-exposure are evaluated.
2.5.1.2 The effect of sunlight and temperature on chlorophyll content of grape berries
Chlorophyll content of berries influenced by sunlight and temperature has received
less attention in grapes than has carotenoids with only a few studies to date. Downey et al.
(2004) studied the effect of shading on berry development and flavonoid accumulation in
Shiraz berries by enclosing bunches one week after flowering. It was found that the
concentration of chlorophyll when expressed as mg/g fresh weight of berry was higher
earlier in berry development and then decreased as the berry ripened in both shaded and
sun-exposed fruit. Total chlorophyll per berry increased from flowering until one week
before veraison for the exposed fruit, which coincided with the first phase of berry growth.
Until two weeks post-veraison the chlorophyll content per berry remained relatively
constant, where after chlorophyll decreased approximately 50% to the fourth week post-
veraison, and remained at this level until harvest. The chlorophyll concentration in shaded
fruit was substantially lower than in the sun-exposed fruit throughout berry development.
Moreover, in shaded fruit there was only a slight increase in chlorophyll during the period
corresponding to chlorophyll accumulation in the exposed fruit and a decrease post-
veraison to almost zero. Less chlorophyll would be expected in shaded fruit since
chlorophyll synthesis is light-induced (Zucker 1972, Raven 1992).
2.5.2 THE EFFECT OF VIGOUR, PLANT WATER STATUS AND SOIL TYPE
Winkler (1974) gave the following definition for grapevine vigour as:

25
“the quality or condition that is expressed in rapid growth of a part of the vine. It refers essentially to the rate of growth.…the vigour of shoots of a grapevine varies inversely with the number of shoot and with the amount of crop.…the quantity of action with respect to the total growth and total crop of which the vine or a part of it is capable.” Dry and Loveys (1998) stated that low vigour on a single shoot basis can be considered
when a shoot is thin and short and has few and small leaves. On the other hand when
shoots tend to have rapid shoot growth in spring which may be prolonged well in to the
growing season, often extending post-veraison they can be considered as having high
vigour. Huglin (1986) recommended pruning mass as a measure of vigour.
Excess vigour can be problematic especially in mature vines trained on a restrictive
trellis system since these vines have dense canopies which result in high within-canopy
shading (Dry and Loveys 1998). These conditions can have a detrimental effect on fruit
quality and composition, and in turn affect crop load (Dry and Loveys 1998). Furthermore,
reduced fruit initiation in the buds can occur (May 1965) as well as development of early
bunch stem necrosis (Jackson 1991). In berries, high vigour can result in reduced sugar
and tartrate concentrations, with higher malate and increased potassium concentration
which leads to higher pH, and potentially lowered phenolic and flavour compounds in wine
(Rojas-Lara and Morrison 1989; Dokoozlian and Kliewer 1995). Undesirable ‘vegetative‘
character in wines made from Cabernet Sauvignon and Sauvignon blanc grapes can be
the due to unbalanced high vigour vines (Allen et al. 1996).
The amount of sunlight infiltrating the canopy of a grapevine is closely related to
vigour, since high vigour vines which are not well accommodated by their trellis system will
have denser canopies. This is in particular reflected in the amount of light which infiltrates
to the bunch zone, which is less in high vigour vines when compared to less vigorous
vines. Irrigation can induce excessive vigour if irrigation is not well scheduled and
managed according to soil moisture. However, Dry and Loveys (1998) state that excessive
vigour cannot be successfully managed by deficit irrigation strategies alone. The
application of deficit irrigation seems to significantly reduce yield and the minor
improvement in fruit quality which may be reflected in increased berry anthocyanins may
not be sufficient to increase, or even maintain, economic return. Goodwin and Jerie (1992)
studied regulated deficit irrigation and stated that the main yield component affected was
berry weight and in the cases of no significant reduction there was little or no effect in
vegetative growth (vigour). Post-veraison water deficit has little or no effect on shoot
growth (Matthews and Anderson 1989; Poni 1994; Noar 1993) because the canopy
development is largely complete by veraison (Sommer and Clingeleffer 1996). The correct

26
combination of soil, rootstock and cultivar can be an important aspect to prevent excessive
vigour on certain terroirs with fertile soil.
Little research has been done on the effect of vigour on carotenoids and chlorophyll
content of berries per se, although inferences can be made as to the potential effects of
vigour on their metabolism based on vine microclimatic effects. Oliveira et al. (2004) found
that grapes grown with higher vegetative height appear to have higher carotenoid levels
while grapes from grapevines with lower vegetative height had berries which were heavier
and contained more sugar. It is explained by Oliveira et al. (2004) that higher vegetative
height canopies are denser and allow less sunlight into the bunch zone than lower
vegetative height canopies. However, higher sugar levels may also reflect a later
developmental stage, or accelerated ripening, which would in turn reflect lower carotenoid
levels, so the results cannot be interpreted conclusively.
As discussed previously, a component of vigour is reflected in the plant water status of
the grapevine. Most studies on grapevine water status compare deficit irrigation strategies
or non-irrigated vines with irrigated grapevines. Post-veraison water deficit has little or no
effect on shoot growth (Matthews and Anderson 1989; Poni 1994; Noar 1993) because the
canopy development is largely complete by veraison (Sommer and Clingeleffer 1996).
Excessive stress imposed after veraison may lead to reduced sugar accumulation and
increased pH (Williams and Matthews 1990) as well as a decrease in yield (Naor 1993).
Furthermore Koundouras et al. (2006) showed that differences in vine water status
(measured through predawn leaf water potential) were highly correlated with the earliness
of shoot growth cessation and veraison.
Through historical research, it is widely acknowledged that smaller berry size can be
achieved through deficit irrigation which can play a role in wine quality, based on the
concept that surface area/volume ratio of the berries decreases with the increase of berry
size (Ojeda et al. 2002). A restriction in cell wall development, and thus the growth of
berries post-veraison is inhibited when subjected to water deficit resulting in smaller
berries. Many important compounds which contribute to wine quality are situated in the
grape skin, tannins, athocyanins, carotenoids, chlorophylls and many aroma precursors,
such that smaller berries induced by water deficit have a potentially greater relative solute
to solvent ratio than larger berries (Ojeda et al. 2002). However Roby (2004) came to the
conclusion that the effect of vine water status on the concentration of skin tannins and
anthocyanins is greater than the effect of fruit size per se. Skin and inner mesocarp tissue
respond to water deficit in terms of their differential growth, although there may be a direct
stimulation of phenolic biosynthesis (Roby, 2004). Thus, the response of grape berry

27
secondary metabolites to water deficit can be two fold: an indirect and positive response
due to the effect of berry size (a concentration effect) and a direct response on the
biosynthesis that can be either positive or negative, depending on the type of secondary
compound, degree of water deficit, and the period during which it is applied (Ojeda et al.
2002).
Sugar accumulation and the onset of anthocyanin synthesis can be accelerated by
early water deficit (before veraison). Gene expression profiling showed that an increase in
anthocyanin accumulation results from earlier and greater expression of some genes in
response to water deficit, those which control flux through the anthocyanin biosynthetic
pathway (Castellarin et al. 2007). When excessive water deficit occur post-veraison, fruit
sugar is often reduced (Noar et al. 1993). Koundouras et al. (2006) also found in their
study on a Greek cv. Agiorgitiko grapevine cultivar that early water deficit during the
growth period has beneficial effects on the concentration of anthocyanins and total
phenolics in berry skins. Koundouras et al. (2006) found that water deficit accelerates
sugar accumulation and malic breakdown in juice. Sugar unloading in berries is inhibited
in ripening berries during water deficiency stress (Wang et al. 2003).
Oliveira et al. (2003) studied the effect of water deficit on carotenoids in the grapevine
cv. Touriga Nacional. This experiment compared the carotenoid composition of fruit from
non-irrigated versus irrigated vines on a high water-retention capacity soil and a low water
retention capacity soil. The deficit treatment caused a reduction in fruit weight that was
independent of soil type. Oliveira et al. (2003) stated that the reduction in berry weight can
be due to less sugar in the berries or due to restriction in cell expansion. Oliveira et al.
(2003) found that berry carotenoid content was increased up to 60% by the non-irrigated
treatment when the soil had a low water-retention capacity. On the high water-retention
capacity soil, there was no effect on carotenoid content comparing irrigated and non-
irrigated treatments, albeit an observed reduction in berry size. Water stress caused an
increase in carotenoid content for all the carotenoids analysed: lutein, β-carotene,
neoxanthin, violaxanthin and luteoxanthin (Oliveira et al. 2003). Oliveira et al. (2003)
showed that the response of the carotenoids to water stress occurred in fruit from an early
stage of development, and the effect on carotenoid content was retained as the fruit
matured.
PRD-irrigation (partial root zone drying) influences on carotenoids in Cabernet
Sauvignon were studied by Bindon et al. (2007). Fruit weight decreased 10-20% in
response to PRD treatment for both seasons studied, and was found to be associated with
small increases in the concentration of the carotenoids -carotene and lutein either at

28
certain stages during grape ripening or at harvest. An increase in concentrations of TDN
and β-damascenone, both C13-norisoprenoid degradation products of carotenoids, were
observed over two seasons of the study. Carotenoids and C13-norisoprenoids are
concentrated in the berry skin (Razungles et al. 1988) that a change in skin to fruit ratio
could increase the relative concentration of these compounds per gram in smaller fruit.
Bindon et al. (2007) concluded that biochemical changes as result of PRD caused an
increase in the C13-norisoprenoids concentration and were most likely indirectly related to
increased biosynthesis of carotenoid precursors, and not just to a change in berry weight
alone (Bindon et al. 2007). Bindon et al. (2007) showed that a deficit irrigation treatment
(PRD) could result in an increase in both carotenoids and C13-norisoprenoids in Cabernet
Sauvignon berries. In the current research record, there is no report on the effect of
grapevine water deficit on chlorophyll content of grape berries.
2.5.3 THE EFFECT OF TERROIR AND CULTIVAR SELECTION
"Terroir can be defined as a spatial and temporal entity, which is characterized by homogeneous or dominant features that are of significance for grape and/or wine; i.e. soil, landscape and climate, at a given scale-duration, within a territory that has been found…..and genotype related technical choices" (Vaudour 2001). The effect of altitude (terroir) and different cultivars (Tinta Amarela, Tinta Barroca, Souzão,
Touriga Franca, Touriga Nacional, Tinta Roriz, Tinto Cão, Touriga Fêmea) on the
carotenoid content of grape berries in the Douro Valley Portugal has been studied by
Oliveira et al. (2004). Oliveira et al. (2004) I found that high-elevation terraces, which
present lower temperature and higher humidity during the maturation period, produce
grapes with higher carotenoid content. The cultivars Touriga Brasileira and Tinta Amarela
produced higher concentrations of carotenoids for the two seasons studied, although other
cultivars (Tinta Barroca, Souzão, Touriga Franca, Touriga Nacional, Tinta Roriz, Tinto
Ca˜o) were not consistent in their response to elevation relative to one other. The variance
between cultivars may have been due to differences in climate for the two seasons, or the
combined effect of climate (sun-exposure, temperature, wind and rainfall), soil type and
vigour. In a later study by Oliveira et al. (2006), the same cultivars were studied for three
consecutive vintages and showed differences in berry carotenoid content between
cultivars and for the same cultivar between vintages. Cultivars Touriga Fêmea, Tinta
Amarela and Tinta Barocca were found to have higher carotenoid content than cvs.
Touriga Nacional, Souzão and Tinto Cão.
Limited research has been done on the effect of terroir and cultivar on carotenoid
content in grape berries therefore the impact on the C13-norisoprenoids will be discussed.

29
The influence of the climate and the soil (terroir) on C13-norisoprenoids profile of two white
varieties Alvarinho and Loureiro, in two sub-regions were studied by Araujo (2004). Araujo
(2004) calculated the different climate indexes for each year of study from which some of
the plots fell into different categories for the different seasons. By this, he showed how
dramatically climate can differ from season to season. The individual C13-norisoprenoids
differed greatly between seasons. Principal component analysis showed that global
temperature had the strongest influence on the volatile compounds of grapes and soil to a
lesser extent (Araujo 2004). It is most likely if the individual C13-norisoprenoids differed
greatly between seasons that their precursors (carotenoid) synthesis or breakdown were
also greatly affected, although this is speculative.
The effect of different terroirs in the Rhone Valley on the volatile compounds of cv.
Grenache wines were studied by Sabon et al. (2002). The findings suggested two major
groups of wine: firstly the wines from the southern zone with warmer climate where
maturation occurs early which contains the highest amount of β-damascenone and sugar
but low total acidity. The other group consist of wines from soils producing grapes that
mature later, and wines with higher amounts of β-ionone and total acidity and lower levels
of sugar and β-damascenone Differences in the C13-norisoprenoids β-damascenone and
β-ionone for different cultivars, terroirs and vintages in wine were observed by Kotseridis et
al. (1999a, 1999b). It is suggested that the influence of climate or global temperature of the
specific vintage may be responsible for this variance. Oliveira et al. (2006) studied the C13-
norisoprennoids TCH, β-damascenone, TDN, vitispirane and β-ionone, and related
carotenoid content of berries of eight representative Portugese grape varieties (Tinta
Amarela, Tinta Barroca, Souzão, Touriga Franca, Touriga Nacional, Tinta Roriz, Tinto
Cão, Touriga Fêmea) of the Douro Region in Portugal for three consecutive years.
Different amounts of C13-norisoprenoids for the same cultivar between vintages were
observed as well as between cultivars. Specific cultivars showed higher amounts of some
of the C13-norisoprenoids than others, for example Touriga Nacional, Sousao and Tinta
Cao appear to have higher content of free norisoprenoids, namely β-ionone for Touriga
Nacional and conversely vitispirane and TDN predominate in Sousão and Tinto Cão. Since
the C13-norisoprenoid derivatives may reflect a variation in the content of their parent
carotenoid precursor in grapes, this shows that there may be a potential influence of grape
carotenoid profile on cultivar-specific wine aroma as it relates to isoprenoids.
Marais et al. (1992) studied the effect of different cultivars, vintages and regions on the
TDN content of wines. It was found that cv. Chenin blanc and Cape Riesling contained
relatively low TDN concentrations compared to Kerner. Weisser Riesling from Italy

30
contained lower concentrations of TDN compared to Weisser Riesling from Germany.
While South Africa, a warm climate country, had an average of 78% higher TDN
concentrations in the wine compared to the cool climate European countries. These results
suggested that there is a difference in the rate of development in TDN precursors of these
countries due to the combined effect of climatic conditions and viticultural practices.
Temperature has an influence on the C13-norisoprenoid content of grapes, but this is
difficult to separate from light since sun-exposed berry temperatures will potentially differ
from those in the shade. Smart and Sinclaire (1976) found that berries exposed to direct
sunlight during the day can be up to 15 ºC warmer than the ambient temperature, and
decrease up to three degrees lower than ambient temperature at night. However, Coombe
and Iland (1987) came to the conclusion that temperature is the most important
environmental factor influencing grapevine cultivation. The effect of climate has the
greatest effect on grape composition followed by soil and cultivar (Van Leeuwen 2004).
The effect of climate and soil on vine development and grape composition can largely be
explained by their influence on vine water status through rainfall (climate) and water
holding capacity (soil). Giovanelli and Brenna (2007) studied the evolution of some
phenolic components, carotenoids and chlorophyll during the ripening of three Italian
grape varieties (Barbera, Nebbiolo– red and Erbaluce- white) and observed very similar
profiles of the studied compounds for all three cultivars. This observation implies that
climatic conditions and sun exposure play an important role in the evolution of these
compounds.
2.6 RECENT ADVANCES OF ANALYTICAL TOOLS AND TECHNIQUES TO ASSESS AND MEASURE GRAPE RIPENESS
Up to now spectrophotometric and liquid chromatographic methods have been mainly
used for plant pigment analyses (Schoefs 2002; Sander et al. 2000; Cserhati and Fogacs
2001). HPLC is mostly used to analyse plant pigments due to its high reproducibility and
low detection limit (Breithaupt 2004; Belie et al. 2003; Taylor et al. 2006; Van den Berg et
al. 2000). So far the best separation of various carotenoids and their isomers (Emenhiser
et al. 1999) has been attained on a C-30 chemically-bonded phase. For carotenoid RP-
HPLC, mixtures of organic solvents are used with methanol and acetonitrile or mixtures
thereof as main components (Van den Berg et al. 2000). However, HPLC methods require
extensive sample preparation, including solvent extraction of the pigments, which are
usually strongly bonded to other plant constituents (e.g. proteins). Therefore the analysis
31
results may not represent the actual carotenoid content. Furthermore, pigments are
sensitive to certain solvents, high temperature, light and acidity that may cause the
formation of cis-isomers of carotenoid and the degradation of chlorophyll to chlorophyll
derivatives (Rodriguez-Amaya et al. 2008; Van den Berg et al. 2000; Oliver and Palou
2000; Gross 1991).
Since grape pigments make an important contribution to wine colour (anthocyanins)
(Ribereau-Gayon and Glories 1986) and aroma (carotenoids and chlorophylls as aroma
precursors) (Baumes et al. 2002; Sefton et al. 1993), instant analyses of these pigments
can be valuable for rapid determination of optimal ripeness of these pigments, assessment
of grape quality and potential wine quality. Techniques like NIR spectroscopy and
chlorophyll fluorescence show potential for rapid analysis of carotenoids and chlorophylls...
For example research has shown that NIR-FT-Raman (near infrared fourier transform
spectroscopy) can give a sensitive detection of the individual carotenoids by Raman
Resonance in the visible region when the wave number of the laser excitation coincides
with an electronic transition (Withnall et al. 2003; Veronelli et al. 1995). Raman is a
spectroscopic technique used in condensed matter physics and chemistry to study the
vibration, rotation, and other low-frequency modes in a system (Gardiner 1989). FT-
Raman spectroscopy also gives a strong enhancement of carotenoids due to the known
pre-resonance effect; furthermore the disturbing fluorescence effect of biological material
usually observed when laser excitation is performed in the visible wavelength range can
be avoided (Ozaki et al. 1992). Strong bands of carotenoids are observed in the Raman
spectrum within the 1500-1550 and 1150-1170 cm-1 range due to in-phase C=C and C-C
stretching vibrations of the polyene chain (Withnall et al. 2003; Veronelli et al. 1995). It has
been found that FT-Raman spectroscopy can be successfully applied for the identification
of carotenoids directly in the plant tissue without any preliminary sample preparation.
Furthermore, FT-Raman mapping is able to show the location of carotenoids in the surface
layer of the plant tissue and perform semi-quantitative measurements of these carotenoids
(Schultz et al. 2005).
Furthermore Davey et al. (2009) showed in his work on lyophilised banana pulp that
it is possible to develop predictive models with visible and near infrared reflectance
spectroscopy to determine total carotenoid and β-carotene fractions with r2 values of 0.84
and 0.89 respectively. However the evaluation of colour measurements with a colorimeter
(using visible spectra 380-770nm), FT-NIR and FT-MIR (Ruiz et al. 2008) showed better
results for developing a prediction model to predict β-carotene in apricots, although low r2
values with high prediction errors where obtained with FT-NIR and FT-MIR data. In a

32
further studied Baranska et al. (2006) found attenuated total reflection infrared
spectroscopy (ATR-IR) recording the range between 650 and 4000 cm-1 the most sufficient
for predicting lycopene and β-carotene content of tomato homogenate. Accurate prediction
(r2=0.98 and RMSECV of 3.15) of lycopene was obtained by scanning whole tomatoes
with visible NIR using the spectra range from 400 to 1500nm-1. It is most likely with the
development of new technology and the improvement in these research fields that portable
devices for measuring pigments in the field will become more available in the near future.
However, for the validation of new, rapid, non-destructive measures, an accurate and
reproducible analytical method is required.
A portable device using Raman scattering spectroscopy to determine carotenoid levels as
an indication of oxidative deterioration is already patented. This device can give an
indication of the general health or stress status in living plants and plant products
(Gellerman et al. 2004).
Kolb et al. (2006) found that chlorophyll florescence measurements are well-suited
to determine non-invasively sugar accumulation in white grape berries cv. Bacchus and
Silvaner. Studies by Agati et al. 2008 included the assessment of anthocyanin in whole
grape bunches via chlorophyll fluorescence imaging and showed that a chlorophyll
fluorescence imaging method based on pigment screening of excitation is able to
determine the distribution of anthocyanins in whole grape bunches. On this basis the
assessment of phenolic maturity in the vineyard can be foreseen. This might be a new
rapid and non-invasive technique for the assessment of grape ripening and to determine
the appropriate time to harvest for optimal colour in grapes. Gitelson and Merzlyak (2002)
did non-destructive assessments of chlorophyll, carotenoid and anthocyanin content in
higher plant leaves by using reflectance spectroscopy. They established relationships
between reflectance and pigment content as well as quantitative techniques for pigment
estimation in leaves of different non-related species with a wide range of pigment content
and composition. However the applicability of these proposed algorithms to grapes
remains to be verified.
Portable colorimeters also showed promise in rapid measurements of chlorophyll in
intact leaves since it correlated well with extracted chlorophyll (Yadava 1986; Marquad and
Tipton 1987). The use of colorimeters for measuring grape pigments however still needs to
be verified. Another technology has been developed by Vivelys society in partnership with
Montpellier SupAgro (France), which can assist on profiling berry maturation and
determining optimal ripeness. This technology is based on the evolution of the berry tint
angle (berry colour evolution), which is determined using optical technologies, as an
33
indicator of berry ripening versus wine aromatic profile (Deloire et al. 2008; Brenon et al.
2005). This method is based on an indirect relationship between the evolution of the berry
tint angle (according to the HSL model – hue, saturation and luminescence). This
technology is currently being used and tested at the commercial level in the Northern and
Southern Hemispheres.
Chemometrics is a valuable tool in combination with pigment measurements to explore
the relationships of pigments and ripeness parameters in grapes and the viticultural
parameters affecting these parameters. Furthermore the potential of pigments to predict
other important variables can be evaluated. Many variables can be accommodated in one
analysis which presents the data visually making it easier to interpret. Chemometric
techniques which can be used to discriminate between samples and explore potential
relationships are principle component analyses (PCA) and partial least square (PLS)
analysis. PCA and PLS analysis describe sample clustering and detect compounds
responsible for the separation of samples (Kemsley 1998). PCA is essentially a descriptive
method used to visualise samples present in an n-dimensional space of a set of inter-
correlated variables into a smaller number of dimensions, called principle components
(PCs), where each principle component (PC) account for a portion of the total variance of
the data set (Kemsley 1996; Summer et al. 2003). PLS is based on multivariate
regression, taking into account the covariance between variables. PLS is regularly used to
predict quantitative variables using spectroscopic measurements. PLS regression, like
PCA, identifies synthetic variables (scores) that describe the variance in a sample set, but
PLS uses additional information: a priori definition of the sample groups. Another output is
to reveal the most effective variables that allow the groups to be separated (Kemsley
1998; Roussel et al. 2003; Ergon 2004).
Work by Le Moinge et al. (2008) is an example of a study that made use of these
techniques these authors showed that front face fluorescence spectroscopy and visible
spectroscopy coupled with chemometrics had the potential to characterise ripening of
Cabernet Franc grapes. Le Moigne et al. (2008) stated that visible spectroscopy however
appeared to be more appropriate when predicting technological indicators and
anthocyanins. These two spectroscopic methods have the advantage to be rapid and
could be non-destructive. Moreover, the whole spectrum is analysed and instead of single
wavelengths unlike the chlorophyll fluorescence method and thus can detect more ripening
changes.
Given that multiple technologies exist, which allow the rapid, non-destructive
measurement of grape analytes in situ, the possibility exists for calibrations to be
34
developed for important predictors of grape ripeness, namely carotenoids and
chlorophylls, amongst others. However, in order for this research to progress, a robust
method for validation of non-destructive measures is needed. A second requirement is for
the importance of the target compounds to be evaluated in relation to known viticultural
parameters, namely vineyard variability (vigour, soil water) and other significant ripeness
measures such as hexose sugars, malic acid and anthocyanins. The current study will
outline a research exercise which will evaluate both a HPLC analytical method, as well as
the application of this method to an experimental dataset.
2.7 CONCLUSION
The biosynthesis, degradation, structure, location and role of carotenoids and chlorophyll
are well studied. Demmig-Adams et al. (1996) discussed in his review the time scale in
which reactions in the xanthophyll cycle takes place and it varies from a few minutes (de-
epoxidation) to hours (epoxidation) in response of various environmental conditions. These
sudden fluctuations make it difficult to study individual carotenoids and this factor is
important when samples are collected in the field. A record of environmental conditions
such as weather conditions, during sample collection needs to be kept.
The effect of viticultural parameters such as soil type, irrigation, vigour and climate on
the composition of grapes needs to be studied in more depth - although a lot of research
has been done in this field, a lot of uncertainty remains. In this research the main focus will
be to explore the changes in the carotenoids profile of grapes during ripening and to
attempt to draw correlations with some viticultural factors which could potentially influence
carotenoid synthesis and degradation.
A lot of field research has been done on different cultivars and the effect of sunlight on
the carotenoid composition of the grape berry and it is clear that sunlight has an enhanced
effect on the degradation of carotenoids after veraison to C13-norisoprenoids. Bureau et al.
(2000) showed that only the comparison of extreme light and shaded conditions had
significant differences in carotenoid and C13-norisoprenoid content of cv. Muscat berries.
Shaded berries had less initial chlorophyll than berries in direct sunlight and decrease to
zero at maturity while chlorophyll was still present in sunlight exposed berries. More
research is needed on individual carotenoids and chlorophylls and their response to
different light conditions in the canopy as well as the effect of temperature on chlorophyll
and carotenoid content.
35
Different vine vigour levels and canopy densities can imply different intensities of
sunlight reaching the bunches which can increase the bunch temperature. No research is
currently available on this subject regarding carotenoid and chlorophyll content of grapes.
One of the aims of this study is to investigate the difference in berry chlorophyll and
carotenoid levels of different vigour level vines of cv. Merlot by monitoring both light
infiltration and temperature in the canopy. The effect of water deficit on berry composition
is clearly a decrease in berry size and an increase in skin to pulp ratio and thus a
concentration effect of compounds situated in the berry skin. Water deficit can also
influence the biosynthesis and degradation of some important compounds. More research
is necessary to understand the degree of water deficit as well as optimal irrigation times to
alter the synthesis and degradation of important compounds in berries. In this study
different water deficit levels will be applied to vines to study the response of berry
composition. There is a lack of research on carotenoid profiles of specific cultivars on
different terroirs. The current study will give an indication of the carotenoid and chlorophyll
profile of cv. Merlot and the content per berry of individual carotenoids and chlorophylls
through ripening. It has been stated that the annual climate for one region can differ so
dramatically that it can fall into two different climate indexes (Araujo 2004).
Current research on simpler, less expensive and reliable methods for analysing
carotenoid and chlorophyll content of berries as potential ripening and quality parameters
can be valuable. Correlation of carotenoids and chlorophyll content of grape berries with
other important ripening parameters will be explored. The possibility of predicting other
ripening parameters from carotenoid and chlorophyll content of grape berries will be
investigated.
In the current study, the optimisation of an HPLC technique for the combined analysis
of grape carotenoids and chlorophylls will be detailed and discussed. This will be followed
by application of the analytical method to a limited dataset of grape samples from a single
vineyard. The response of the grape carotenoid and chlorophyll profiles to some selected
vineyard variables will be explored using chemometric analyses. From this, some general
observations relating to the experimental data will be discussed, and the relevance of
carotenoid and chlorophyll analysis as valuable ripening predictors will be evaluated. With
the availability of new technologies, allowing the rapid, non-destructive measure of grape
analytes in situ, the potential for further research in this direction will be discussed in the
final chapter.

36
2.8 LITERATURE CITED
Adams, W., Demmig-Adams, B., Verhoeven, A.S., Barker, D.H., “Photo-inhibition” during winter stress: Involvement of sustained xanthophyll cycle-dependent energy dissipation. Aust. J. Plant Physiol. 1995, 22, 261-276
Agati,G., Traversi, M.L., Cerovic, Z.G., Chlorophyll Fluorescence Imaging for the Non-invasive Assessment of Anthocyanin in Whole Grape ( Vitis vinifera L.) Bunches. Photochem. Photobiol. 2008, 84, 1431-1434
Albrecht, M., Sandmann, G., Light-Stimulated Carotenoid Biosynthesis during Transformation of Maize Etioplast Is Regulated by Increased Activity of Isopentenyl Pyrophosphate Isomerase. Plant Physiol.1994, 105, 529-534.
Allen, M. S., Lacey, M. J.; Boyd, S. J. Methoxypyrazines of grapes and wines – differences of origin and behaviour. In: Proceedings 9th Aust. Wine. Ind. Techn. Conf., Adelaide Eds. Stockly, C. S.; Sas, A. N.; Johnstone, R. S.; Lee, T. H.; (Winetitles: Adelaide), 1996, 83-86.
Antolin, M., Ayari, M., Sanchez-Diaz, M. Effect of partial root zone drying on yield, ripening and berry ABA in potted Tempranillo grapevines with split roots. Aust. J. Grape Wine Res. 2003, 12, 13-20.
Araujo, M., Oliveira, J.M., Maia M.O., Soil and Climatic Influence on the Free and Glycosidically Bound Volatiles of Grapes from Two White Varieties from Vinho Verdes Region. Acta Hort. 2004, 652, 205-212.
Armstrong, G.A., Hearst, J.E. Genetics and molecular biology of carotenoid pigment biosynthesis. FASEB J. 1996, 10, 228-237.
Baranska, M., Schutze, W., Schulz, H., Determination of Lycopene and ß-carotene Content in Tamato Fruits and Related Products: Comparison of FT-Raman, ATR-IR, and NIR Spectroscopy. Anal. Chem. 2006, 78, 8456-8461.
Baumes, R., Wirth, J., Bureau, S., Gunata, Y., Razungles, A., Bio-generation of C13-norisoprenoid compounds:experiments supportive for an apo-carotenoid pathway in grapevines. Anal. Chim. Acta. 2002, 458, 3-14.
Belie, N. D., Pedersen, D. K., Martens, M., Bro, R., Munck, L., Baerdemaeker, J. Biosystems. Eng. 2003, 85, 213-225.
Bezman, Y., Bilkis, I., Winterhalter, P., Fleischmann, P., Rouseff, R., Balderdann, S., Thermal oxidation of 9’-cis neoxanthin in a model system containing peroxyacetic acid leads to the potent odorant ß-damascanone. J. Agric. Food Chem. 2005, 53, 9199-9206
Bindon, K., Influence of Partial Rootzone Drying on Aspects of Grape and Wine Quality. The University of Adelaide. 2004, Chapter 9, 182-204.
Bindon, K., Dry, P.R., Loveys, B.R., Influence of Plant Water Status on the Production of C13-Norisoprenoids Precursors in Vitis vinifera L. cv. Cabernet Sauvignon Grape Berries. J. Agric. Food Chem. 2007, 55, 4493-4500.
Blouin, J., Guimberteau, G., Maturation et Maturité des Raisins., Féret, Bordeaux, France. 2000, p. 151.
Boffey, S.A., Lloyd D., Division and Segregation of Organelles. Cambridge, UK: Cambridge University Press. 1988.
Breithaupt, D.E., Simultaneous HPLC determination of carotenoids used as food colouring additives: applicability of accelerated solvent extraction. Food Chem. 2004, 449-456.

37
Brenon, E., Bernard, N., Zebic, O., Deloire, A., Maturite du raisin: Proposition d'une methode utilisant le volume des baies comme indicateur. Revue des oenologues, 2005, 117, 1-3.
Britten, G., Carotenoid biosynthesis –a target for herbicide activity. Z. Naturforsch. 1979, 979-985.
Britton, G., Carotenoids in higher plants. Physiol. Veg. 1982, 20, 735-755.
Buratti, S., Pellegrini, N., Brenna, O.V., Mannino, S., Rapid Electrochemical Method for the Evaluation of the Antioxidant Power of Some Lipophillic Food Extracts. J. Agric. Food Chem. 2001, 49, 5136-5141.
Bureau, S., Baumes, R., Razungles, A., Effects of vine or bunch shading on the glycosylated flavor precursors of Vitis vinifera L. cv. Syrah. J. Agric. Food Chem. 2000, 48, 1290-1297.
Bureau, S.M., Razungles, A.J., Baumes, R.L., Bayonove, C.L. Effect of qualitative modification of light on the carotenoid contents in Vitis vinifera L. cv. Syrah berries. Sci. Aliment. 1998, 18, 485-495.
Cakir, B., Agasse, A., Gaillard, C., Saumonneau, A., Delrot, S., Atanassova, R. A grape ASR protein involved in sugar and abscisic acid signalling. The Plant Cell, 2003, 15, 2165-2180.
Camara, B., Moneger, R., Free and esterified carotenoids in green and red fruits of Capsicum annuum. Phytochem. 1978, 17, 91-93.
Castellarin, S.D., Matthews, M.A., Di Gaspero, G., Gambetta, G.A., Water deficits accelerate ripening and induce changes in gene expression regulating flavonoid biosynthesis in grape berries. Planta. 2007, 227, 101-112.
Chandler, L.A., Schwartz, S.J., HPLC separation of cis-trans carotene isomers in fresh and processed fruits and vegetables. J. Food Sci. 1987, 52, 669-672.
Conde, C., Silva, P., Fontes, N., Dias, A.C.P., Tavares, R.M., Sousa, M.J., Agasse, A., Delrot, S., Geros, H., Biochemical Changes throughout Grape Berry Development and Fruit and Wine Quality. Food. 2007, 1, 1, 1-22.
Coombe, B., Hale, C., The hormone content of ripening grape berries and the effect of growth substance treatment. Plant Phys. 1973, 51, 629-634.
Coombe, B. G., Research on development and ripening of the grape berry. Am. J. Enol. Vitic. 1992, 43, 1, 101-110.
Coombe, B. G., The grape berry as a sink. Acta Hort. 1989, 239, 149-158.
Coombe, B.G. Iland, P.G., Grape berry development. Lee, T. (ed). Proc 6th Austr. Wine Indus. Techn. Conf., Adelaide, South Australia. 1987, 50-54.
Cooper, D. A., Carotenoids in health and disease: resent scientific evaluations, research recommendations and the consumer. J. Nutr. 2004, 134, 221S-224S.
Cserhati, T.; Forgacs, E. Liquid chromatographic separation of terpenoid pigments in foods and food products. J. Chromtogr. A. 2001, 936, 119-137.
Cutler, A.; Krochko, J.E.; Formation and breakdown of ABA. Trends in Plant Sci. 1999, 4, 472-478.
Davey, M.W.; Saeys, W.; Hof, E.; Ramon, H.; Swennen, R. L.; Keulemans, J. Application of Visible and Near-Infrared Reflectance Spectroscopy (Vis/NIRS) to Determine Carotenoid Content in Banana (Musa spp.) Fruit Pulp. J. Agric. Food. Chem. 2009, 57, 1742-1751.
De Bolt, S., Cook, D.R., Ford, C.M., L-Tartaric acid synthesis from vitamin C in higher plants. Proceedings of the National Academy of Sciences USA. 2006, 103, 5608-5613.

38
De Pinho, P.G., Ferreira, A.C.S., Pinto, M.M., Benitez J.G., Hogg, T.A., Determination of Carotenoid Profiles in Grapes, Musts and Fortified Wines from Douro Varieties of Vitis Vinifera. J. Agric. Food Chem. 2001, 49, 5484-5488.
Deli, J., Matus, Z., Szabolcs, J., Carotenoid Composition in the Fruit Black Paprika (Capsicum annuum Variety lingum nigrum) during Ripening. J. Agric. Food Chem. 1992, 40, 2072-2076.
Deloire, A., Kelly, M., Bernard, N., Managing the harvest potential: Navigation between terroir and the market. 31st conference of the South African Society for Enology and Viticulture. Somerset West, 11-14 November 2008.
Demmig-Adams, B., Adams III W.W., Logan, B.A., Verhoeven, A.S., Xanthophyll cycle-dependent energy dissipation and flexible photo-system II efficiency in plants accimilated to light stress. J. Plant Physiol. 1995, 22, 249-260.
Demmig-Adams, B., Gilmore, A.M., Adams, W.W. Carotenoids 3: In vivo function of carotenoids in higher plants. FASEB J. 1996, 10, 403-412.
Dokoozlian, N.K., Kliewer, W.M., The light environment within grapevine canopies. I. Description and seasonal changes during fruit development. Am. J. Enol. Vitic. 1995, 46, 209-218.
Downey, M.O., Harvey, J.S., Robinson, S.P., The effect of bunch shading on berry development and flavonoid accumulation in Shiraz grapes. Aus. J. Grape Wine Res. 2004, 55-73.
Dry, P.R. and Loveys, B.R., Factors influencing grapevine vigour and the potential for control with partial root zone drying. Aust. J. Grape Wine Res. 1998, 4, 140-148.
Düring, H., Davtyan, A., Developmental changes of primary processes of photosynthesis in sun- and shade-adapted berries of two grapevine cultivars. Vitis. 41. 2002, 63-67.
Eckhardt, U., Grimm, B., Hörtensteiner, S. Recent advances in chlorophyll biosynthesis and breakdown in higher plants. Plant Mol. Biol. 2004, 56, 1-14.
Emenhiser, C., Sander, L. C., Schwartz, S. J., Capability of a polymeric C30 stationary phase to resolve cis-trans carotenoid isomers in reversed-phase liquid chromatography. J. Chromatogr. A. 1999, 707,205-216.
Endo, Y., Usuki, R., Kaneda, T., Antioxidant effects of chlorophyll and pheophytin on the autoxidation of oils in the dark. I. Comparison of the inhibitory effects. J. Am. Oil Chem. Soc. 1985, 62, 1375-1378.
Ergon, R., Informative PLS score-loading plots for process understanding and monitoring. J. Process Contr. 2004, 14, 889-897.
Etievant, P.X., Volatile compounds in food and beverages. Wine, 1991, In Henks Maarse (Ed.), Zeist, Netherlands: TNO-CIVO Food Analysis Institude.
Fang, Z., Bouwkamp, J.C., Solomos, T., Chlorophyllase activities and chlorophyll degradation during leaf senescence in non-yellowing mutant and wild type of Phaseolus vulgaris L. J. Exp. Bot. 49, 503-510.
Felt, L., Pacakova, V., Stulik, K., Volka, K., Reliability of Carotenoids Analyses: A Review. Curr. Anal. Chem. 2005, 1, 93-102.
Ferreira, A.C.S., Monteiro, J., Oliveira, C., Guedes de Pinho, P., Study of major aromatic compounds in port wines from carotenoid degradation. Food Chem. 2008,110, 83-87.
Fiedor, L., Rosenbach-Belkin, V., Scherz, A., The Stereo specific Interaction between Chlorophylls and Chlorophyllase. J. Bio. Chem. 1992, 267, 30, 22043-22047.

39
Gellerman, W., McClane, R., Bernstein, P.S., Optical Method and Apparatus for Determining Status of Agricultural Products. United States Patent Application Publication. Pub. No. US 2004/0130714 A1. 2004.
Giovanelli, G., Brenna, O.V., Evolution of some phenolic components, carotenoids and chlorophylls during ripening of three Italian grape varieties. Eur. Food Res. Technol. 2007, 225, 145-150.
Goodwin, T.W., The Biochemistry of the Carotenoids, Vol I: Plants, Chapman and Hall, New York. 1980, 1-377.
Goodwin, I., Jerie, P., Regulated deficit irrigation: from concept to practice. Aust. New Z. Wine Indus. J. 1992, 7, 258-261.
Goodwin, T.W., Biosynthesis of Carotenoids: Overview. In: Packer, L. (ed). Methods in Enzymology, Vol 214. Academic Press Inc. California. 1993 pp 330-340.
Gross, J., Pigments in Vegetables: Chlorophylls and Carotenoids. New York: Van Nostrand Reinhold, 1991.
Guth, H., Quantitation and sensory studies of character impact odorants of different white wine varieties. J. Agric. Food Chem. 1997, 45, 3027-3032.
Habertson, J. F., Kennedy, J. A., Adams, D. O., Tannin in skins and seeds of Cabernet Sauvignon, Syrah and Pinot noir berries during ripening. Am. J. Enol. Vitic. 2002, 53, 54-59.
Hardie, W. J., Aggenbach, S. J., Jaudzems, V.G., The plastids of the grape pericarp and their significance in isoprenoid synthesis. Aust. J. Grape Wine Res. 2. 1996, 144-154.
Hawker, J. S., Changes in the activities of malic enzyme, malic dehydrogenase, phosphopyruvate carboxylase and pyruvate decarboxylase during the development of non-climacteric fruit (the grape). Phytochem. 1969, 8, 19-23.
Hirschberg, J., Carotenoid biosynthesis in flowering plants. Curr. Opin. Plant Biol. 2001, 4, 210-218.
Huglin, P., Biologie et Ecologie de la Vigne. Editions Payot Lausanne, Paris. 1986.
Hötensteiner, S., Chlorophyll degradation during senescence. Annu. Rev. Plant. Biol. 2006, 57, 55-77.
Jackson, D.I., Environmental and hormonal effects on development of early bunch-stem necrosis. Am. J. Enol. Vitic. 1991, 42, 290-294.
Johnson, L.F., Lobitz, B. Armstrong, R., Baldy, R., Weber, E., De Benedictis, J., Bosch, D.F., Airborne imaging aids vineyard canopy evaluation. Calif. Agric. 1996, 50, 14-18.
Kanasawud, P., Crouzet, J.C., Mechanism of formation of volatile compounds by thermal degradation. J. Agric. Food Chem. 1990, 38, 237-243.
Kemsley, E.K., Discriminant Analysis of Spectroscopic Data, John Wiley and Sons, 1998.
Kemsley, E.K., Discriminant analysis of high-dimensional data: a comparison of principle component analysis and partial least square data reduction methods. Chem. Intell. Lab. Syst. 1996, 33, 47-61.
Kennedy, J. A., Hayasaka, Y., Vidal, S., Waters, E. J., Jones, G.P., Composition of grape skin proanthocyanidins at different stages of berry development. J. Agric. Food Chem. 2001, 49, 5348-5355.
Kennedy, J.A., Matthews, M.A., Waterhouse, A. L., Changes in grape seed polyphenols during fruit ripening. Phytochem. 2000a, 55, 77-85.
40
Kennedy, J.A., Troup, G.J., Pilbrow, J.R., Hutton, D.R., Hewitt, D., Hunter, C.R., Ristic, R., Iland, P.G., Jones, G.P., Development of seed polyphenols in berries from Vitis vinifera L. cv. Shiraz. Aus. J. Grape Wine Res. 2000b, 6, 244-254.
Kolb, C.A., Wirth, E., Kaiser, W.M., Meister, A., Riederer, M., Pfündel, E.E., Noninvasive Evaluation of the Degree of Ripeness in Grape Berries (Vitis Vinifera L. cv. Bacchus and Silvaner) by Chlorophyll Fluorescence. J. Agric. Food Chem. 2006, 54, 299-305.
Kotseridis, Y., Baumes, R.L., Skouroumounis, G.K., Quantitative determination of free and hydrolytically liberated ß-damascenone in red grapes and wines using a stable isotope dilution assay. J. Chromatogr. A. 1999a, 849, 245-254.
Kotseridis, Y., Baumes, R.L., Bertrand, A., Skouroumounis, G.K., Quantitative determination of ß-ionone in red wines and grapes of Bordeaux using a stable isotope dilution assay. J. Chromatogr. A. 1999b, 848, 317-325.
Koundouras, S., Marinos, V., Gkoulioti, A., Kotseridis, Y., Van Leeuwen, C., Influence of Vineyard Location and Vine Water Status on Fruit Maturation of Nonirrigated cv. Agiorgitiko (Vitis vinifera L.). Effect on Wine Phenolic and Aroma Component. J. Agric. Food Chem. 2006, 54, 5077-5088.
Kovats, E., Composition of essential oils : Part 7. Bulgarian oil of rose (Rosa damascene – Mil.). J. Chromatogr. A. 1987, 406,185-222.
Krinksky, N.I., Carotenoid protection against oxidation. Pure Appl. Chem. 1979, 51, 649-660.
Krinksky, N.I., Johnson, E.J., Carotenoid actions and their relation to health and disease. Molec. Asp. Med. 2005, 26, 459-516.
Le Moinge, M., Dufour, E., Bertrand, D., Maury, C., Seraphin, D., Jourjon, F., Front face fluorescence spectroscopy and visible spectroscopy coupled with chemometrics have the potential to characterise ripening of Cabernet Franc grapes. Anal. Chim. 2008, 621, 8-18.
Lichtenthaler, H. K., Bukhardt, G., Kuhn, G., Prenzel, U., Light induced accumulation and stability of chlorophylls and chlorophyll-protein during chloroplast development in radish seedlings. Z. Naturforsch. 1981, 36c, 421-430.
Lichtenthaler, H.K., Grumbach, K.H., Kinetic of lipoquinone and pigments synthesis in green Hordeum seedlings during an artificial day-night rhythm with a prolonged dark phase. Z. Naturforsch.1974, 29c, 533-540.
Lichtenthaler, H.K., The unequal synthesis of the lipophilic plastid quinones in sun and shade leaves of Fungus silvatica L. Z. Naturforsch. 1971, 26b, 832-841.
Lichtenthaler, H.K., Schwender, J., Disch, A., Rohmer, M. FEBS Lett. 1997, 400, 271-274.
Liotenberg, S., North, H., Marion-Poll, A., Molecular biology and regulation of abscisic acid biosynthesis in plants. Plant Phys. Biochem. 1999, 37, 341-350.
Lorenzen, C.J., Determination of Chlorophyll and Pheo-Pigments: Spectrophotometric Equations. Limn. Oceanogr.1967, 12, 2, 343-346.
Lund, S., Peng, F.Y., Nayar, T., Reid, K.E., Schlosser J., Gene expression analyses in individual grape (Vitis vinifera L.) berries during ripening initiation reveal that pigmentation intensity is a valid indicator of developmental staging within the cluster. Plant Mol. Bio. 2008, 68, 301-315.
Marais, J., 1,1,6-Trimethyl-1,2-dihydronaphthalene (TDN): a possible degradation product of lutein and beta-carotene. S. Afr. J. Enol. Vitic. 1992 13, 52-55.

41
Marais, J., van Wyk, C., Rapp, A., Effect of sunlight and shade on norisoprenoids levels in maturing Weisser Riesling and Chenin blanc grapes and Weisser Riesling wines. S. Afr. J. Enol. Vitic. 1992a, 13, 23-32.
Marais, J., Versini, G., Van Wyk, C., Rapp, A., Effect of region on free and bound monoterpene and C13-norisoprenoid concentration in Weisser Riesling wines. S. Afr. J. Enol. Vitic. 1992b, 13, 71-77.
Marin, E., Nussaume, L., Quesada, A., Gonneau, M., Sotta B, Hugueney, P., Frey, A., Marion-Poll, A., Molecular identification of zeaxanthin epoxidase of Nicotiana plumbagifolia, a gene involved in abscisic acid biosynthesis and corresponding to the ABA locus of Arabidopsis thaliana. EMBO J. 1996, 15, 2331-2342.
Marquad, R.D., Tipton, T.L., Relationship between extractable chlorophyll and an in situ method to estimate leaf greenness. Hort. Sci.1987, 22, 1327
Mathieu, S., Terrier, N., Proccureur, J., Bigey, F., Günata, Z.A., Carotenoid Cleavage Dioxygenase from Vitis vinifera L.: functional caracterization and expression during grape berry development in relation to C13-norisoprenoids accumulation. J. Exp. Bot. 2005, 56, 420, 2721-2731.
Matthews, M.A., Anderson M.M., Fruit Ripening in Vitis vinifera L: Responses to Seasonal Water Deficit. Am. J. Enol. Vitic. 1988, 39, 4, 313-320.
Mayer, H., Untersuchungen über die Chlorophyllase. Planta. 1930, 11, 294-330.
Mendes-Pinto, M.M., Ferreira, A.C.S., Oliveira, M.B.P.P., De Pinho, P.G., Evaluation of Some Carotenoids in Grape by Reversed- and Normal-Phase Liquid Chromatography: A Qualitative Analysis. J. Agric. Food Chem. 2004, 52, 3182-3188.
Mendes-Pinto, M.M., Ferreira, A.C.S., Caris-Veyrat, C., De Pinho, G.P., Carotenoids, Chlorophyll, and Chlorophyll-Derived Compounds in Grapes and Port Wines. J. Agric. Food Chem. 2005, 53, 10034-10041.
Merzlyak, M.N., Solovchenko, A.E., Chivkunova, O.B., Patterns of pigments changes in apple fruit during adaption to high sunlight and sunscald development. Plant Phys. Biochem. 2002, 40, 679-684.
Minguez-Mosquera, M.I., Jaren-Galan, M., Garrido-Fernandez, J., Influence of Industrail Drying Process of Pepper Fruit (Capsicum annuum cv. Bola) for Paprika on the Carotenoid Content. J. Agric. Food Chem. 1994, 42,1190-1193.
Naor, A., Bravdo, B., Hepner, Y., Effect of Post-Veraison Irrigation Level on Sauvignon blanc Yield, Juice Qaulity and Water Relation. S. Afr. J. Enol. Vitic. 1993, 14, 2, 19-25.
Nussaume, M.E., Quesada, A., Gonneau, M., Scotta, B., Hugueney, P., Frey, A., Marion-Poll, A., Molecular identification of zeaxanthin epoxidase of Nicotiana plumbaginifolia, a gene involved in abscisic acid biosynthesis and corresponding to the ABA locus of Arabidopsis thaliana. EMBO J. 1996, 15, 2331-2342.
Ohloff, G., Importance of minor components in flavours and fragrances. Perf. Flavor. 1978, 3, 11-22.
Ojeda, H., Andary, C., Kraeva, E., Carbonneau, A., Deloire, A., Influence of pre- and postveraison water deficit on synthesis and concentration of skin phenolic compounds during berry growth of Vitis vinifera cv. Shiraz. Am. J. Enol. Vitic. 2002, 53:4, 261-267.
Ozaki, Y., Cho, R., Ikegawa, K., Muraishi, S., Kawauchi, K., Potential of near-infrared Fourier transform Raman spectroscopy in food analysis. Appl. Spectrosc. 1992, 46, 1503-1507.
42
Oliveira, C., Barbosa, A., Ferreira, A.C.S., Guerra, J., De Pinho, P.G., Carotenoids Profile in Grape Related to Aromatic Compounds in Wine from Douro Region. J. Food Sci. 2006, 71, 1, S1-S7.
Oliveira, C., Ferreira, A.C., Costa, A., Guerra, J., De Pinho, P.G., Effect of some viticultural parameters on the grape carotenoids profile. J. Agric. Food Chem, 2004, 52, 4178-4184.
Oliveira, C., Silva Ferreira, A.C., Mendes Pinto, M., Hogg, T., Alves, F., Guedes de Pinho, P., Carotenoid compounds in grapes and their relationship to plant water status. J. Agric. Food Chem. 2003, 51, 5967-5971.
Oliver, J., Palou, A., Chromatographic determination of carotenoids in foods. J. Chromatogr. A. 2000, 881, 543-555.
Owen, T.G., Falkowski, P.G., Enzymatic degradation of chlorophyll a by marine phytoplankton in vitro. Phytochem. 1982, 21, 979-84.
Packer, L., Douce, R., (Eds), Plant Cell Membranes, Academic Press, San Diego, CA. 1987. p350.
Pan, Q.H., Li, M.J., Peng, C.C., Zhang, N., Zou, X., Zou, K.Q., Wang, X.L., Yu, X.C., Wang, X.F., Zhang, D.P., Abscisic acid activates acid invertases in developing grape berry. Phys. Plant. 2005, 125, 157-170.
Pereira, G.E., Gaudillere; J.P., Van Leeuwen, C., Hilbert, G., Maucourt, M., Deborde, C., Moing, A., Rolin, D., 1H NMR metabolite fingerprints of grape berry: Comparison of vintage and soil effects in Bordeaux grapevine growing areas. Anal. Chim. Acta, 2006, 563, 346-352.
Poni, S., Intrier, C., Silvestroni, O., Interaction of Leaf Age, Fruiting, and Exogenous Cytokinins in Sangiovese Grapevines Under Non-Irrigated Conditions. II. Chlorophyll and Nitrogen Content. Am. J. Enol. Vitic. 1994, 45, 3, 278-284.
Possner, D.R.E., Kliewer, W.M., The localisation of acid, sugars, potassium and calcium into developing grape berries. Vitis. 1985, 24, 229-240.
Pyke, K.A., Plastid division and development. Plant Cell. 1999, 11, 549-556.
Quach, H.T., Steeper, R. L., Griffin, G. W., An Improved Method for the Extraction and Thin-Layer Chromatography of Chlorophyll a and b from Spinach. J. Chem. Educ. 2004, 81, 385.
Rabinowitch, H. D., Budowski, P., Kedar, N., Carotenoids and epoxide cycles in mature-green tomatoes. Planta. 1975, 122, 1, 91-97.
Raven, P.H., Evert, R.F., Eichhorn, S.E., Biology of Plants, Worth Publishers: New York, 1992
Razungles, A., Bayonove, C., Cordonnier, R., Baumes, R., Etude des carotenoids du raisin a maturite. Vitis. 1987, 26, 183-191.
Razungles, A.J., Babic, I., Sapis, J.C., Bayonove, C.L., Particular Behaviour of Epoxy Xanthophylls during Veraison and Maturation of Grape. J. Agric. Food Chem. 1996, 44, 3821-3825.
Razungles, A., Bayonove, C., Cordonnier, R., Sapis, J., Grape carotenoids: changes during the maturation period and localization in mature berries. Am. J. Enol. Vitic. 1988, 39, 44-48.
Razungles, A.J., Baumes, R.L., Dufour, C., Sznaper, C.N., Bayonove, C.L., Effect of sun exposure on carotenoids and C13-norisoprenoid glycosides in Syrah berries (Vitis vinifera L.). Sci. Aliment. 1998, 18, 361-373.
Ribereau-Gayon, P., Glories, Y., Phenolics in grape and wine In: Proceedings of the 6th Australian Wine Industry Technical Conference. (Winetitles: Adelaide). 1986.

43
Ristic, R., Downey, M.O., Iland, P.G., Bindon, K., Francis, I.L., Herderich, M., Robinson, S.P. Exclusion of sunlight from Shiraz grapes alters wine colour, tannin and sensory properties. Aust. J. Grape Wine Res. 2007, 13, 53-65.
Roby, G., Harbertson, J.F., Adams, D.A., Matthews, M.A., Berry size and vine water deficits as factors in wine grape composition: Anthocyanin and tannins. Aust. J. of Grape Wine Res. 2004, 10, 100-107.
Rodriguez-Amaya, D.B., Kimura, M., Godoy, H.T., Amaya-Farfan, J., Updated Brazilian database on food carotenoids: Factors affecting carotenoid composition. J. Food Comp. Anal. 2008, 21, 445-463.
Rojas-Lara, B.A., Morrison, J.C., Differential effects of shading fruit or foliage on the development and composition of grape berries. Vitis. 1989, 28, 199-208.
Roussel, S., Bellon-Maurel, V., Roger, J.M., Grenier, P., Authenticating white grape must variety with classification models based on aroma sensors, FT-IR and UV spectrometry. J. Food Eng. 2003, 60, 407-419.
Ruiz, D., Reich, M., Bureau, S., Renard, C.M.G.C., Audergon, J.M., Application of Reflectance Colorimeter Measurements and Infrared Spectroscopy Methods to Rapid and Non-destructive Evaluation of Carotenoid Content of Apricot (Prunus armeniaca L.). J. Agric. Food Chem. 2008, 56, 4916-4922.
Sabon, I., De Revel, G., Koteridis, Bertrand, A., Determination of Volatile Compounds in Grenach Wines in Relation with Different Terroirs in the Rhone Valley. J. Agric. Food Chem. 2002, 50, 22, 6341-6345.
Sander, L.C., Sharpless, K.E.; Pursch, M., C30 Stationary phases for the analysis of food by liquid chromatography. J. Chrom. A. 2000, 189-202.
Sandmann, G., Carotenoid biosynthesis in microorganisms and plants. Eur. J. Biochem. 1994, 223, 7-24.
Schoefs, B., Chlorophyll and carotenoid analysis in food products. Properties of pigment and methods of analysis. Trends Food. Sci. Technol. 2002, 13, 361-371.
Schultz, H., Baranska, M., Baranski, R., Potential of NIR-FT-Raman Spectroscopy in Natural Carotenoid Analysis. W. InterSci. 2005, 77, 212-221.
Sedon, T.J., Downey, M.O., Comparison of analytical methods for the determination of condensed tannins in grape skin. Aust. J. Grape Wine Res. 2008, 14, 54-61.
Sefton, M.A., Francis, I.L., Williams, P.J., The volatile composition of Chardonnay juice: A study by flavor precursor analysis. Am. J. Enol. Vitic. 1993, 44: 359-370.
Smart, R.E., Sinclaire, T.R., Solar heating of grape berries and other spherical fruits. Agric. Meteor. 1976, 17, 241-259.
Sommer, K.J., Clingeleffer, P.R., Shulman, Y., Comparative study of vine morphology, growth and canopy development in cane-pruned and minimal-pruned Sultana. Aust. J. Exp. Agric. 1995, 35, 265-273.
Steel, C.C., Keller, M., Influence of UV-B radiation on the carotenoid content of Vitis vinifera tissues. Biochem. Soc. T. 2000, 28, 883-885.
Summer, L.W., Mendes, P., Richard, A.D., Plant metabolomics: large scale phytochemistry in the functional genomics era. Phytochem. 2003, 62, 817-836.
Synoms, G., Davies, C., Shavrukov, Y., Dry, I., Reid, J., Thomas, M. Grape on steroids. Brassinosterols are involved in grape berry ripening. Plant Phys. 2006, 140, 150-158.
44
Szyjewicz, E., Rosner, N., Kliewer, W.M., Ethephon (2-chloroethyl)phosphonic acid, Etherel, CEPA) in viticultural - A review. Am. J. Enol. Vitic. 1984, 35, 117-123.
Taylor, I.B., Butbidge, A., Thomson, A.J., Control of abscisic acid synthesis. J. Exp. Bot. 2000, 51, 1563-1574.
Taylor, K.L., Brackenridge, A.E., Vivier, M.A., Oberholster, A., High-performance liquid chromatography profiling of the major carotenoids in Arabidopsis thaliana leaf tissue. J. Chromatgr. A. 2006, 1121, 83-91.
Tevini, M., Teramura, A.H., UV-B Effects on Terrestrial Plants. Phytochem. Photobiol. 1989, 50, 4, 479-487.
Van Leeuwen, C., Friant, P., Choné, X., Tregoat, O., Koundouras, S., Dubourdieu, D., Influence of Climate, Soil and Cultivar on Terroir. Am. J. Enol. Vitic. 2004, 55, 3, 207-217.
Van den Berg, H., Faulks, R., Fernando Granado, H., Hirschberg, Olmedilla, B., Sandmann, G., Southon, S., Stahl, W., The potential for the improvement of carotenoid levels in food and the likely systemic effects. J. Sci. Food Agric. 2000, 80, 880-912.
Vaudour, E., Diversite des notions de terroir: pour un concept de terroir operationnel. Revue des Enologues. 2001, 101, 39-41.
Veronelli, M., Zerbi, G., Stradi, J., In situ resonance Raman spectra of carotenoids in bird's feathers. Raman Spectrosc. 1995, 26, 66-73.
Wang, Z. P., Deloir, A., Carbonneau, A., Federspiel, B., Lopez, F., An in vivo Experimental system to Study Sugar Phloem Unloading in Ripening Grape Berries during Water Deficiency Stress. Ann. Bot. 2003, 92, 523-528.
Weedon, B.C.L., Moss, G.P., Structure and nomenclature, in Carotenoids, Vol 1a, Isolation and Analysis, Ed by Britton G., Liaaen-Jensen S. and Pfander H., Birkhauser, Basle, pp, 27-69. 1995.
Wheeler, S., Loveys, B., Ford, C., Davies, C., The relationship between the expression of abscisic acid biosynthesis genes, accumulation of abscisic acid and the promotion of Vitis vinifera L. berry ripening by abscisic acid. Aust. J. Grape Wine Res. 2009, 1-10.
Williams, L. E., Matthews, M. A., Grapevine. In Irrigation of Agriculture Crops. Eds. B. A. Stewart and D.R. Nielsen (American Society of Agronomy: Madison, WI) pp. 1019-1055.
Winkler, A. J., Cook, J. A., Kliewer, W. M., Lider, L. A., General viticulture. University of California Press, Bekerley, 1974.
Withnall, R., Chowdhry, B. Z., Silver, J., Edwards, H.G.M., Oliveira, L.F.C., Raman spectra of carotenoids in natural products. Spectrochim. Acta Part A. 2003, 59, 2207-2212.
Yadava, U.L., A rapid and non-destructive method to determine chlorophyll in intact leaves. HortScience.1986, 21, 1449-1950.
Yamamoto, H.Y., Bassi, R., Carotenoids: localization and function. In Oxygenic Photosynthesis: The Light Reactions (D. R. Ort and C. F. Yocum, eds.) Advances in Photosynthesis 4, Kluwer, Dordrecht. 1996.
Yu, X.C., Li, M.J., Gao, G.F., Peng, C.C., Zhu, S.Y., Wang, X.J., Shen,Y. Y., Zhang, D. P., Abscisic acid stimulates a calcium-dependent protein kinase in grape berry. Plant Phys. 2006, 140, 558-579.
Zechmeister, L., Polgar, A., Cis-trans isomerization and spectral characteristics of carotenoids and some related compounds. J. Am. Chem. Soc. 1943, 1522-1528.

45
Zucker, M., Light and enzymes. Ann. Rev. Plant. Phys. 1972, 23, 133-156.

CChhaapptteerr 33
Technical report
Investigation and optimisation of a method for the extraction and quantification of chlorophylls and carotenoids in grape
berries (Vitis vinifera cv. Merlot).

47
INVESTIGATION AND OPTIMISATION OF A METHOD FOR THE EXTRACTION AND QUANTIFICATION OF CHLOROPHYLLS AND CAROTENOIDS IN GRAPE
BERRIES (VITIS VINIFERA CV. MERLOT).
3.1 INTRODUCTION
Carotenoids and chlorophylls can be widely found in plants, microorganisms, and as by-
products of digestion in animals and humans, with more than 700 natural carotenoids
known today.
Plants and some micro-organisms can synthesize carotenoids and chlorophylls
while animals and humans are incapable of their de novo synthesis but take them in
through their diet (Felt et al. 2005). Carotenoids have two main functions in the
photosynthetic pathway of higher plants: photo-protection and light harvesting. Photo-
protection is the channelling of photochemical energy away from chlorophyll whereas
light harvesting is the collection and subsequent transfer of light on to chlorophyll via
photochemical transduction (Krinsky 1979). These functions are crucial for plant survival
since excited triplet molecules can damage the photosynthetic apparatus, and thus
requires both the effective transduction of light energy and dissipation of excess
photochemical energy. The most common carotenoids present in mature (ripe) grapes
are β-carotene and lutein, representing almost 85% of the total carotenoid content
(Baumes et al. 2002). They are accompanied by minor xanthophylls such as
neoxanthin, violaxanthin, lutein-5,6-epoxide, zeaxanthin, neochrome, flavoxanthin and
luteoxanthin which make up the remaining proportion of total carotenoids (Baumes et al.
2002).
Carotenoids belong to the group of red or yellow pigments which absorb light
between 450 – 570 nm in the visible light range (Van den Berg et al. 2000). The
structure of carotenoids consists of a system of long, aliphatic conjugated double bonds
responsible for the biochemical reactivity of these compounds (Van den Berg et al.
2000). In natural sources, carotenoids occur mainly in the all-trans (all-E) configuration
(Chandler and Schwartz 1987). Isomerization of trans-carotenoids to cis-isomers (all-Z)
is promoted by contact with acids, heat treatment and exposure to light (Oliver and
Palou 2000; Rodriguez-Amaya et al. 2008; Van den Berg et al. 2000). These alterations
can have profound effects on the configuration and structure of these lipophilic
pigments.

48
The unique role of chlorophyll in photosynthetic light harvesting and energy
transduction in higher plants is well known and documented in the literature (Gross
1991). The structure of chlorophyll is a cyclic tetrapyrrole with a structure similar to the
heme group of globins (hemoglobin, myglobin) and cytochromes. Chloropigments are
susceptible to degradation either chemically or enzymatically. Enzymes, weak acids,
oxygen, light and heat can lead to the formation of a large number of degradation
products (Gross 1991). Although several types of chlorophyll exist, chlorophyll a is the
major pigment in higher plants and chlorophyll b is an accessory pigment. Chlorophyll a
and chlorophyll b exist in a ratio of approximately 3:1 in higher plants (Gross 1991).
Extensive research has been done on the carotenoid and chlorophyll content of
food products and plants (Taylor and Ramsay 2005). During these studies different
analysis techniques, solvents and extraction methods were used (Felt et al. 2005;
Mendes-Pinto et al. 2004; Taylor et al. 2006).
The analysis and study of carotenoids in grape berries are important for the wine
and grape industry since they were found to be precursors of important (C13-
norisoprenoid) aroma compounds (C13-norisoprenoids) present in wine. Furthermore,
carotenoids and chlorophylls were found to be potential indicators of berry ripeness
(Baume et al. 2002; Ferreira et al. 2008; Lund et al. 2008). Kolb et al. (2006)
demonstrated that the chlorophyll content of grape berries might be used to predict
berry ripeness through chlorophyll fluorescence non-invasive measurements. Thus, it is
evident that the analyses of carotenoids and chlorophylls in berries are an important
research field for the wine industry.
A method to evaluate both the carotenoid and chlorophyll profiles of lyophilised
grape tissue was however not readily available at the outset of the current study.
In this chapter, an existing method for HPLC analysis of carotenoids in Arabidopsis
thaliana leaf tissue (Taylor et al. 2006) together with a combination of the extraction
methods used by Oliveira et al. (2003) and Mendes-Pinto et al. (2005) was optimised for
the analysis of carotenoids and chlorophylls in green and red lyophilised berry tissue.
Additionally, suggestions for further optimisation and pitfalls of this method will also be
discussed.

49
3.2 MATERIALS AND METHODS
3.2.1 PLANT MATERIAL AND GROWTH CONDITIONS
Plant material used in this study was grape berries sourced from a nine-year-old
commercial Vitis vinifera L. cv. Merlot vineyard (clone MO 9 clone grafted on Richter
110 rootstock) located in the Stellenbosch region, South Africa. Berries were harvested
at different stages of ripening. For later sections, ‘green’ berry tissue represents berries
collected pre-veraison, and ‘red’ berry tissue represents grapes at harvest (23 to 24
°Brix).
3.2.2 ANALYTICAL MATERIALS
The following solvents were purchased from Sigma-Aldrich (Steinheim, Germany):
methyl tertiary butyl ether (MTBE), ethyl acetate, diethyl ether, methanol, hexane, tri-
ethylamine and 2, 6-di-tert-butyl-4-methylphenol (BHT). All the chemicals used were of
HPLC grade with the exception of sodium chloride (Fluka Chemie) and Tris base
(Roche Diagnostics, Manheim, Germany) which were of analytical grade. The authentic
standards β-apo-caroten-8-al (purity ≥ 96%), zeaxanthin (purity ≥ 96%), β-carotene
(purity ≥ 95%), violaxanthin (purity ≥ 90.5%), neoxanthin (purity ≥ 88%), antheraxanthin
(purity ≥ 88.4%) and lutein (purity ≥ 94%) were obtained from CaroteNature (Lupsingen,
Switzerland). Chlorophyll a (purity ≥ 96%) and chlorophyll b (purity ≥ 94%), were
acquired from Sigma-Aldrich (Steinheim, Germany). All the ratios and percentages of
solvents are indicated as volume per volume (v/v), unless otherwise stated.
3.2.3 PREPARATION OF STANDARDS
The authentic standards detailed in Table 3.1 were dissolved in their respective solvents
with the addition of 0.1% (w/v) BHT. The stock solutions were divided in 1 ml aliquots in
to small amber high performance liquid chromatography (HPLC) vials and dried under a
stream of nitrogen gas to prevent isomerisation prior to storage at -80ºC (Felt et al.
2005). These standards were re-dissolved in the appropriate solvent prior to use. The
concentrations of the stock solutions for HPLC analysis are listed in Table 3.1. All
dilutions were made in ethyl acetate: methanol (1:4) containing 0.1% (w/v) BHT. All
dilutions were kept at -20ºC for no longer than 48 hours and allowed to reach room
temperature before analysis.

50
Table 3.1 The authentic standards used and their solvents.
Authentic standard Solvent for stock solution Stock
concentration μg/ml
Zeaxanthin chloroform 100 Violaxanthin chloroform 100 Antheraxanthin chloroform 100 Neoxanthin chloroform 100 Lutein chloroform 100 β-apo-carotenol-8-al Ethylacetate:methanol (1:4) 100 β-carotene Chloroform:hexane (1:9) 100 Chlorophyll a methanol 50 Chlorophyll b methanol 50
3.2.4 SAMPLE PREPARATION
Merlot berries were sampled at different stages of ripening (pre-veraison, veraison, post
veraison and harvest) from the experimental vineyard (described in detail in chapter 4,
section 4.2.8). Berries were immediately frozen after collection in liquid nitrogen to
prevent any enzymatic or photo- degradation. While berries were still frozen, their seeds
were removed. The berry pericarps were ground under liquid nitrogen to a fine powder
with an IKA A11 basic grinder (IKA®-Werke GMBH & CO.KG, Staufen, Germany),
where after tissue was lyophilised and kept at -80ºC prior to extraction and reverse
phase (RP)-HPLC analysis. Sample preparation was done under subdued light at all
times.
3.2.5 EXTRACTION
Extraction for RP-HPLC analysis was done on 100 mg red and 50 mg green tissue to
which 500 µl millipore water and 10 µl internal standard (β-apo-caroten-8-al 200 ng/µl)
was added prior to extraction. In the final extraction protocol, the carotenoids and
chlorophylls were extracted twice with 500 µl diethyl ether: hexane (1:1). With each
extraction the sample was vortexed for 30 min in a 2 ml micro-centrifuge tube after
which it was centrifuged at 12 000 rpm for 2 min. The upper organic phase of each
extraction was collected, pooled and dried under a stream of nitrogen. Dried samples
were stored under a nitrogen atmosphere at -20ºC. Prior to RP-HPLC analysis, samples
were dissolved in 200 µl of a 1:4 ethyl acetate, methanol solution containing 0.1% (w/v)
BHT and centrifuged for 2 min at 12 000 rpm. Samples were shielded from strong light
and kept on ice during all procedures.
Additionally, different solvents and extraction times were investigated. Acetone and
diethyl ether:hexane (1:1) were tested as a possible extraction solvent comparing 5 min
and 30 min extraction times.

51
The effects of normal laboratory light conditions (± 32 000 lumens) and pH on
carotenoid and chlorophyll degradation during the extraction procedure were also
investigated. The standard extraction procedure using subdued light conditions were
compared with normal laboratory (±32 000 lumens fluorescent light) light conditions.
The effect of pH, (since green berry tissue has a lower pH than red berry tissue), was
evaluated by comparing the extraction procedure as mentioned above to an extraction
procedure where the 500 µl millipore water added in the first step of extraction was
replaced by 500 µl of a 50 mM Tris–HCl (pH 7.5) solution containing 1 M NaCl.
3.2.6 CHROMATOGRAPHIC CONDITIONS
The carotenoid and chlorophyll pigments were separated by RP-HPLC on an Agilent
1100 series HPLC system (Agilent Technologies, Palo Alto, CA, USA) equipped with a
DAD system. An YMC30 column (250 mm x 4.6 mm; particle size 5μm) and YMC30
guard cartridge (10 mm x 4 mm, particle size 5 µm), both from YMC Europe
(Schermbeck, Germany) were used. The C30 column has been shown to provide
excellent resolution of photo-isomerised standards of various carotenoids (Emenhiser et
al. 1996a, 1995). Chemstation software for LC3D (Rev.A.10.01[1635]; Hewlett-Packard,
Waldborn, Germany) was used for data processing.
RP-HPLC chromatography conditions similar to Taylor et al. (2006) were used with
small alterations. Binary solvents consisting of 3% ddH2O in methanol containing 0.05
M ammonium acetate (Solvent A) and 100% MTBE (Solvent B) were used, where both
solvents contained 0.1% (w/v) triethylamine. A flow rate of 1 ml/min was used at 25 ºC
with an injection volume of 20 µl. Elution was according to the following program:
isocratic at 20% B for 20 min followed by a linear gradient from 20% B to 50% B in 4
min, isocratic at 50% B for 4 min followed by a linear increase to 68% B in 2 min,
isocratic at 68% B for 2 min followed by a linear decrease to 20% B. The column was
equilibrated for 15 min at the starting conditions before each injection.
3.2.7 IDENTIFICATION AND QUANTIFICATION OF CAROTENOIDS
Identification of carotenoids and chlorophylls in Merlot grape samples was achieved by
comparing retention times and visible spectra with authentic standards and published
literature (De Rossa and Mercadante 2007; Dugo et al. 2008; Mendes-Pinto et al. 2005;
Taylor et al. 2006; Van Breemen et al. 1991). The elution of the various carotenoid and
chlorophyll pigments was followed at 420 nm, 450 nm and 470 nm with a constant
reference wavelength at 800 nm (Taylor et al. 2006). Standard curves for the
quantification of carotenoids and chlorophylls were obtained by plotting amount (ng)
52
against area which was obtained by triplicate injections. Liquid chromatography mass
spectrometry (LC-MS) was performed using a Waters API Q-TOF Ultima connected to a
Waters UPLC (Waters Corporation, Massachusetts, USA) system. The same conditions
used before were employed except the mobile phases were slightly changed. Solvent A
was 3% ddH2O in methanol and Solvent B was 100% MTBE. The chlorophylls and
carotenoids were detected with atmospheric pressure chemical ionization (APCI)
system in the positive mode. A cone voltage of 35 V was used with the Q-TOF Ultima
MS system. A capillary voltage of 3.5 kV with a desolvation temperature of 350ºC was
also employed. The LC-MS analyses were performed to confirm identification of
chlorophyll and carotenoid derivatives for which authentic standards were not available.
3.2.8 LIMIT OF DETECTION AND QUANTIFICATION
The LOD (limit of detection) was defined as the amount that results in a peak with a
height three times that of the baseline noise. The LOQ (limit of quantification) was
defined as the lowest injected amount which could be reproducibly quantified (STDEV ≤
5%).
3.2.9 SELECTIVITY AND RECOVERY
The extraction method efficiency was evaluated by doing mock extractions with
mixtures of the authentic standards. In a mock extraction the extraction protocol is
followed except that no grape tissue is present in the matrix. Recovery of individual
carotenoids from the sample matrix was determined according to the amount extracted
from the matrix spiked with known concentration of a mix of authentic standards minus
the extract from the matrix alone. The normal extraction protocol was followed for all the
samples.
3.3 RESULTS AND DISCUSSION
3.3.1 IDENTIFICATION AND QUANTIFICATION OF CAROTENOIDS AND
CHLOROPHYLLS IN GRAPE BERRIES
The following carotenoids could be separated and identified by RP-HPLC comparing
spectra and retention times of cv. Merlot grape sample peaks with those of authentic
standards: neoxanthin, lutein, chlorophyll b, zeaxanthin, chlorophyll a and β-carotene. In
Figure 3.1 the HPLC chromatograms of red and green tissue are shown. It was
observed that chlorophyll derivatives and degradation products, particularly in the green
berry tissue, were present in fairly high amounts. These derivatives and degradation
53
products were identified as chlorophyllide a, chlorophyll a’, pheophytin a,
pyropheophorbide b, chlorophyll b’, pheophorbide b, pyropheophytin b and pheophytin b
in comparison with authentic standards (chl a and b), elution time, spectra according to
literature (Canjura and Schwartz 1991; Van Breemen et al. 1991) and molecular
masses obtained by MS (Table 3.2). Unknown carotenoid-like compounds were
identified in comparison with the literature (De Rossa and Mercadante 2007; Faria et al.
2009; Zepka and Mercadante 2009) and LC-MS as cis-violaxanthin, neochrome, cis-
neoxanthin, luteoxanthin, flavoxanthin, auroxanthin, mutatoxanthin, cis-β-carotene and
5,8-poxy-β-carotene (Table 3.2). 5,8-Epoxy--carotene was identified according to its
elution time, maximum absorbance and fine structure in the methanol/MTBE mobile
phase (De Rosso and Mercadante, 2007; Zepka and Mercadante 2009). Cis-neoxanthin
was identified by the hypsochromic shift of 18 nm compared to all-trans-neoxanthin and
the high intensity of the cis peak (Britton et al. 1995) (Table 3.2). Similarly cis-
violaxanthin was identified by the hypsochromic shift of 8 nm and the intensity of the cis
peak (Britton et al. 1995). The cis-isomer of -carotene was identified by comparison to
literature (De Rosso and Mercadante, 2007; Faria et al. 2009; Zepka and Mercadante,
2009) retention time and taking into account the hypsochromic shift of 6 nm and
increased intensity of the cis-peak (%AB/AII) (Britton et al. 1995) as well as by MS
(Table 3.2). Mutatoxanthin was identified according to absorbance and retention time in
similar mobile phase separations (De Rosso and Mercadante, 2007, Zepka and
Mercadante, 2009;) and its molecular ion and fragment ions by MS (Table 3.2).
Luteoxanthin and auroxanthin were identified according to their spectra and formation
from violaxanthin when acidified with 0.1M HCl (Mínguez-Mosquera and Gandul-Rogas,
1994). Violaxanthin has two 5,6-epoxide groups in its molecule, which can transform at
low pH to luteoxanthin with one 5,6-epoxide and one 5,8-furanoid group. Finally, both of
these gave rise to the isomer auroxanthin. Similarly, neoxanthin changed into
mutatoxanthin with one 5,8-furanoid and then neochrome with two 5,8-furanoid groups
under low pH conditions.
Other breakdown products were also observed, but in smaller quantities, including
chlorophyllide a, chlorophyll a’ and pyropheophytin (Figure 3.2). Chlorophyllides are
formed when the phytyl group of the chlorophyll is cleaved. This is usually catalyzed
enzymatically by the endogenous enzyme, chlorophyllase. Chlorophyll a’ is formed
through epimerization of the C-10 centre of the chlorophyll. Several studies have shown
that heating causes isomerisation of chlorophyll (Schwartz et al. 1981). Pyropheophytin
is formed through decarbomethoxylation of the C-10 centre of pheophytin (Figure 3.2).

54
A
1 2 47
8
9
12
14
1617 18
21
23
24
25
26
271 2 47
8
9
12
14
1617 18
21
23
24
25
26
27
B
2 4 14
1617
18
21
23
24
25
262 4 14
1617
18
21
23
24
25
26
300 400 500 600 700
4
300 400 500 600 700
4
nm300 400 500 600 700
9
nm300 400 500 600 700 nm300 400 500 600 700
9
300 400 500 600 700
12
300 400 500 600 700
12
300 400 500 600 700
14
300 400 500 600 700
14
300 400 500 600 700
17
300 400 500 600 700
17
300 400 500 600 700
18
300 400 500 600 700
18
300 400 500 600 700
21
300 400 500 600 700
21
nm300 400 500 600 700
23
nm300 400 500 600 700
23
300 400 500 600 700
24
300 400 500 600 700
24
300 400 500 600 700
25
300 400 500 600 700
25
300 400 500 600 700
26
300 400 500 600 700
26
Figure 3.1 RP-HPLC profiles of the major carotenoids and chlorophylls in Merlot grape pre-veraison (A) and post-veraison (B) berries (1) cis-violaxanthin; (2) neochrome; (4) cis-neoxanthin; (7) luteoxanthin; (8) chlorophyllide a (9) pyropheophorbide b; (12) chlorophyll b; (14) lutein; (16) mutatoxanthin; (17)
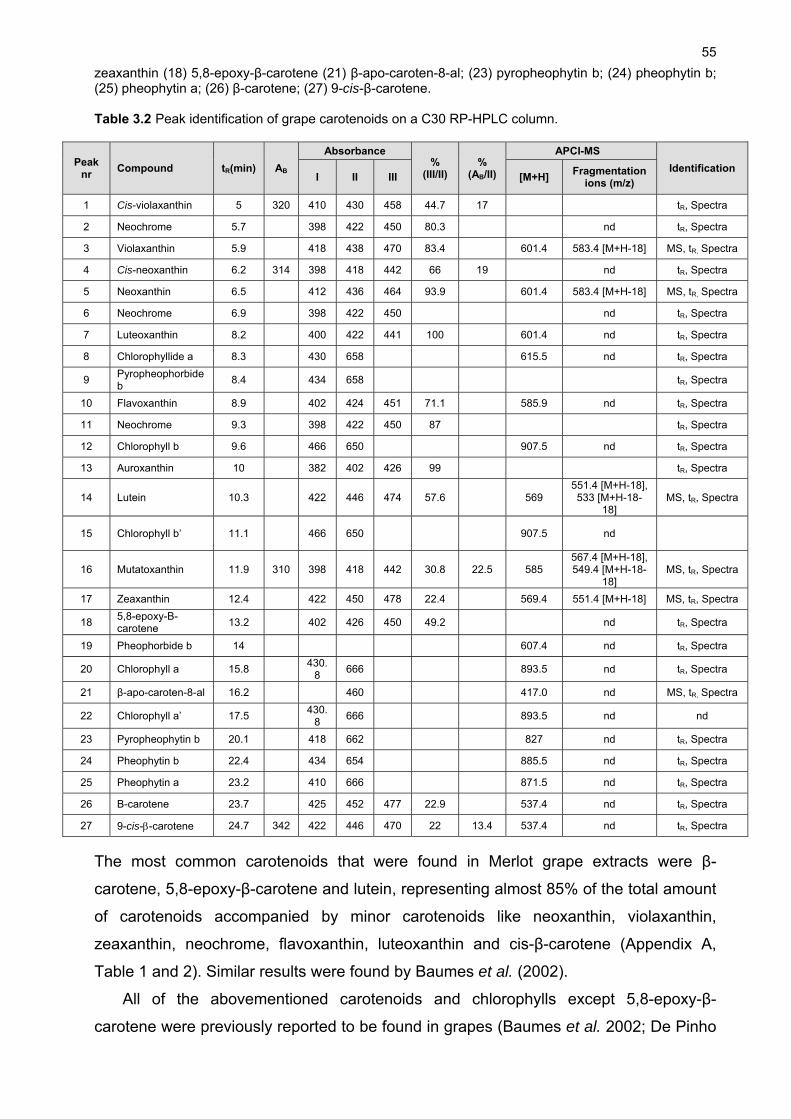
55
zeaxanthin (18) 5,8-epoxy-β-carotene (21) β-apo-caroten-8-al; (23) pyropheophytin b; (24) pheophytin b; (25) pheophytin a; (26) β-carotene; (27) 9-cis-β-carotene. Table 3.2 Peak identification of grape carotenoids on a C30 RP-HPLC column.
Peak nr
Compound tR(min) AB
Absorbance %
(III/II) %
(AB/II)
APCI-MS
Identification I II III [M+H]
Fragmentation ions (m/z)
1 Cis-violaxanthin 5 320 410 430 458 44.7 17 tR, Spectra
2 Neochrome 5.7 398 422 450 80.3 nd tR, Spectra
3 Violaxanthin 5.9 418 438 470 83.4 601.4 583.4 [M+H-18] MS, tR, Spectra
4 Cis-neoxanthin 6.2 314 398 418 442 66 19 nd tR, Spectra
5 Neoxanthin 6.5 412 436 464 93.9 601.4 583.4 [M+H-18] MS, tR, Spectra
6 Neochrome 6.9 398 422 450 nd tR, Spectra
7 Luteoxanthin 8.2 400 422 441 100 601.4 nd tR, Spectra
8 Chlorophyllide a 8.3 430 658 615.5 nd tR, Spectra
9 Pyropheophorbide b
8.4 434 658 tR, Spectra
10 Flavoxanthin 8.9 402 424 451 71.1 585.9 nd tR, Spectra
11 Neochrome 9.3 398 422 450 87 tR, Spectra
12 Chlorophyll b 9.6 466 650 907.5 nd tR, Spectra
13 Auroxanthin 10 382 402 426 99 tR, Spectra
14 Lutein 10.3 422 446 474 57.6 569 551.4 [M+H-18], 533 [M+H-18-
18] MS, tR, Spectra
15 Chlorophyll b’ 11.1 466 650 907.5 nd
16 Mutatoxanthin 11.9 310 398 418 442 30.8 22.5 585 567.4 [M+H-18], 549.4 [M+H-18-
18] MS, tR, Spectra
17 Zeaxanthin 12.4 422 450 478 22.4 569.4 551.4 [M+H-18] MS, tR, Spectra
18 5,8-epoxy-B-carotene
13.2 402 426 450 49.2 nd tR, Spectra
19 Pheophorbide b 14 607.4 nd tR, Spectra
20 Chlorophyll a 15.8 430.
8 666 893.5 nd tR, Spectra
21 β-apo-caroten-8-al 16.2 460 417.0 nd MS, tR, Spectra
22 Chlorophyll a’ 17.5 430.
8 666 893.5 nd nd
23 Pyropheophytin b 20.1 418 662 827 nd tR, Spectra
24 Pheophytin b 22.4 434 654 885.5 nd tR, Spectra
25 Pheophytin a 23.2 410 666 871.5 nd tR, Spectra
26 B-carotene 23.7 425 452 477 22.9 537.4 nd tR, Spectra
27 9-cis--carotene 24.7 342 422 446 470 22 13.4 537.4 nd tR, Spectra
The most common carotenoids that were found in Merlot grape extracts were β-
carotene, 5,8-epoxy-β-carotene and lutein, representing almost 85% of the total amount
of carotenoids accompanied by minor carotenoids like neoxanthin, violaxanthin,
zeaxanthin, neochrome, flavoxanthin, luteoxanthin and cis-β-carotene (Appendix A,
Table 1 and 2). Similar results were found by Baumes et al. (2002).
All of the abovementioned carotenoids and chlorophylls except 5,8-epoxy-β-
carotene were previously reported to be found in grapes (Baumes et al. 2002; De Pinho
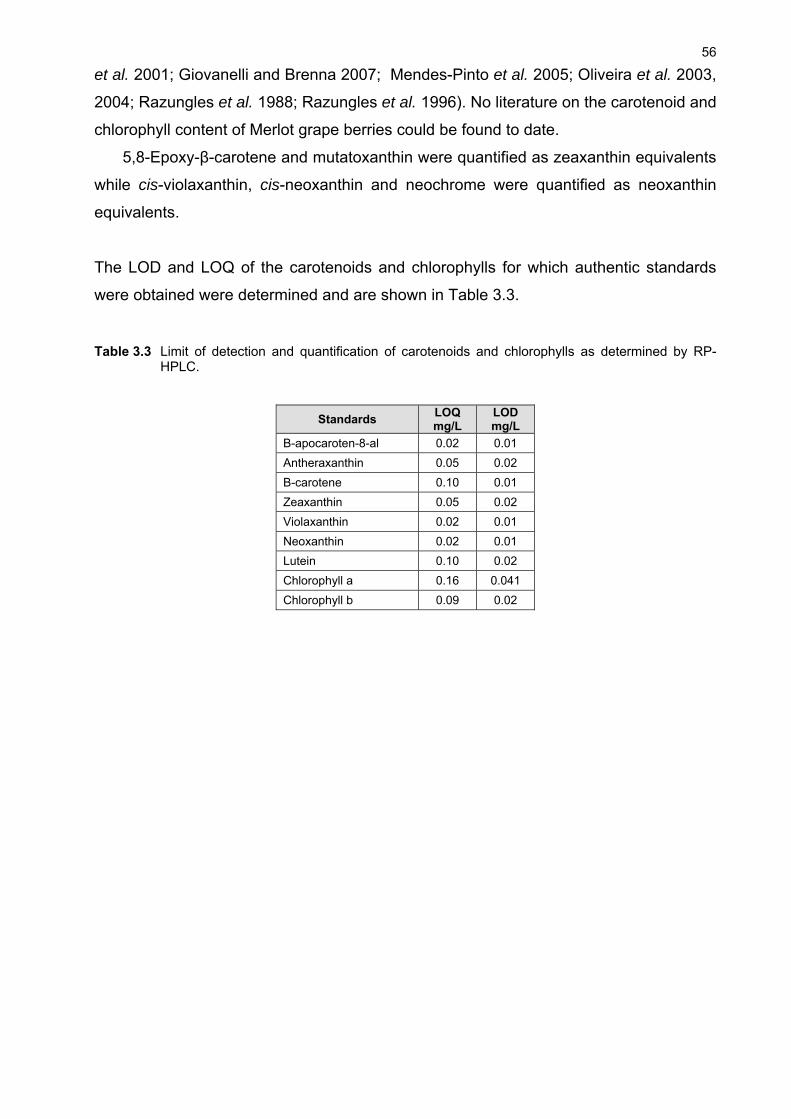
56
et al. 2001; Giovanelli and Brenna 2007; Mendes-Pinto et al. 2005; Oliveira et al. 2003,
2004; Razungles et al. 1988; Razungles et al. 1996). No literature on the carotenoid and
chlorophyll content of Merlot grape berries could be found to date.
5,8-Epoxy-β-carotene and mutatoxanthin were quantified as zeaxanthin equivalents
while cis-violaxanthin, cis-neoxanthin and neochrome were quantified as neoxanthin
equivalents.
The LOD and LOQ of the carotenoids and chlorophylls for which authentic standards
were obtained were determined and are shown in Table 3.3.
Table 3.3 Limit of detection and quantification of carotenoids and chlorophylls as determined by RP-
HPLC.
Standards LOQ mg/L
LOD mg/L
B-apocaroten-8-al 0.02 0.01
Antheraxanthin 0.05 0.02
B-carotene 0.10 0.01
Zeaxanthin 0.05 0.02
Violaxanthin 0.02 0.01
Neoxanthin 0.02 0.01
Lutein 0.10 0.02
Chlorophyll a 0.16 0.041
Chlorophyll b 0.09 0.02

57
Compound Mg* R1 R2 Isocyclic Ring (V) Chlorophyll a + CH3 Phytyl 1 Chlorophyll b + CHO Phytyl 1 Chlorophyll a’ + CH3 Phytyl 2 Chlorophyll b’ + CHO Phytyl 2 Chlorophyllide a + CH3 H 1 Chlorophyllide b + CHO H 1 Pheophytin a - CH3 Phytyl 1 Pheophytin b - CHO Phytyl 1 Pheophorbide a - CH3 H 1 Pheophorbide b - CHO H 1 Chlorophyll a -1 + CH3 Phytyl 3 Pyropheophytin a - CH3 Phytyl 4 * In pheophytins and pheophorbides, Mg is replaced by 2H. Figure 3.2 Structural formulas and nomenclature of chlorophyll a and b and their various derivatives adapted from Gross (1991).
3.3.2 EXTRACTION OF CAROTENOIDS AND CHLOROPHYLLS FROM GRAPE
BERRIES
The selectivity and recovery of the RP-HPLC and extraction method were evaluated.
The recoveries of all authentic standards were 79% from the mock extraction, which
indicated that the extraction methodology was appropriate for the extractions of
carotenoids and chlorophylls. The recovery of the authentic standards from red grape
tissue was very good (77), except for violaxanthin (49%) (Table 3.4) but was improved
to 63% when degradation products (cis-violaxanthin) were included. The recovery of
chlorophyll a, chlorophyll b, violaxanthin and neoxanthin however, were very poor from

58
green berry tissue. This result was found to be mainly due to the low pH of the tissue
which facilitates the degradation of chlorophyll a and b to pheophytin a and b
respectively; and violaxanthin and neoxanthin respectively degraded to auroxanthin and
luteoxanthin and neochrome and mutatoxanthin. Cis-violaxanthin and cis-neoxanthin
were also formed from violaxanthin and neoxanthin respectively (Canjura and Schwartz
1991; Minguex-Mosquera and Gandul-Rojas 1994; Van Breemen et al. 1991). Cis-trans
isomerisation has been shown to be mainly mediated by heat (Mínguez-Mosquera and
Gandul-Rogas, 1994). When the pheophytin a and b and pyropheophytin b forms were
included in recovery calculations, recovery improved to 67% for chlorophyll a and 113%
for chlorophyll b. Poor recovery of both violaxanthin and neoxanthin from green tissue,
resulted in unreliable quantification of these compounds and were therefore not
quantified further in the experimental section (Chapter 4). The green and red berry
tissues were investigated because it represented the extreme stages of development in
the different grape tissues analysed. The differences in recovery between the green and
red berry tissue were due to matrix differences, by which the pH differences between
the tissue extracts would have made an important contribution to the recovery of
pigments. There was a significant variance in recovery of compounds such as
chlorophyll a, b and lutein between the red and green grape tissue matrix. This
extraction method was, however, used to obtain a profile of the carotenoid and
chlorophyll pigments in grape tissue of different maturities and was not optimized for the
extraction of a specific compound in a specific grape matrix.
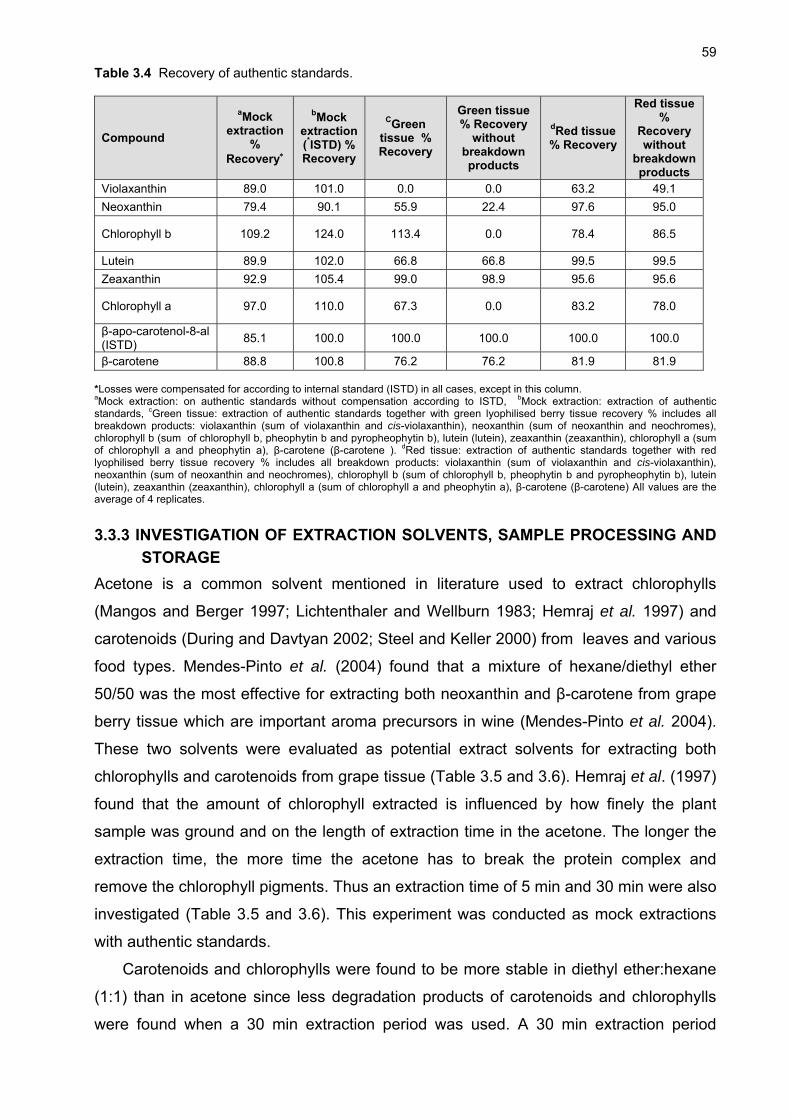
59
Table 3.4 Recovery of authentic standards.
Compound
aMock extraction
% Recovery
bMock extraction (*ISTD) % Recovery
CGreen tissue % Recovery
Green tissue % Recovery
without breakdown products
dRed tissue % Recovery
Red tissue%
Recovery without
breakdown products
Violaxanthin 89.0 101.0 0.0 0.0 63.2 49.1
Neoxanthin 79.4 90.1 55.9 22.4 97.6 95.0
Chlorophyll b 109.2 124.0 113.4 0.0 78.4 86.5
Lutein 89.9 102.0 66.8 66.8 99.5 99.5
Zeaxanthin 92.9 105.4 99.0 98.9 95.6 95.6
Chlorophyll a 97.0 110.0 67.3 0.0 83.2 78.0
β-apo-carotenol-8-al (ISTD)
85.1 100.0 100.0 100.0 100.0 100.0
β-carotene 88.8 100.8 76.2 76.2 81.9 81.9 *Losses were compensated for according to internal standard (ISTD) in all cases, except in this column. aMock extraction: on authentic standards without compensation according to ISTD, bMock extraction: extraction of authentic standards, cGreen tissue: extraction of authentic standards together with green lyophilised berry tissue recovery % includes all breakdown products: violaxanthin (sum of violaxanthin and cis-violaxanthin), neoxanthin (sum of neoxanthin and neochromes), chlorophyll b (sum of chlorophyll b, pheophytin b and pyropheophytin b), lutein (lutein), zeaxanthin (zeaxanthin), chlorophyll a (sum of chlorophyll a and pheophytin a), β-carotene (β-carotene ). dRed tissue: extraction of authentic standards together with red lyophilised berry tissue recovery % includes all breakdown products: violaxanthin (sum of violaxanthin and cis-violaxanthin), neoxanthin (sum of neoxanthin and neochromes), chlorophyll b (sum of chlorophyll b, pheophytin b and pyropheophytin b), lutein (lutein), zeaxanthin (zeaxanthin), chlorophyll a (sum of chlorophyll a and pheophytin a), β-carotene (β-carotene) All values are the average of 4 replicates.
3.3.3 INVESTIGATION OF EXTRACTION SOLVENTS, SAMPLE PROCESSING AND
STORAGE
Acetone is a common solvent mentioned in literature used to extract chlorophylls
(Mangos and Berger 1997; Lichtenthaler and Wellburn 1983; Hemraj et al. 1997) and
carotenoids (During and Davtyan 2002; Steel and Keller 2000) from leaves and various
food types. Mendes-Pinto et al. (2004) found that a mixture of hexane/diethyl ether
50/50 was the most effective for extracting both neoxanthin and β-carotene from grape
berry tissue which are important aroma precursors in wine (Mendes-Pinto et al. 2004).
These two solvents were evaluated as potential extract solvents for extracting both
chlorophylls and carotenoids from grape tissue (Table 3.5 and 3.6). Hemraj et al. (1997)
found that the amount of chlorophyll extracted is influenced by how finely the plant
sample was ground and on the length of extraction time in the acetone. The longer the
extraction time, the more time the acetone has to break the protein complex and
remove the chlorophyll pigments. Thus an extraction time of 5 min and 30 min were also
investigated (Table 3.5 and 3.6). This experiment was conducted as mock extractions
with authentic standards.
Carotenoids and chlorophylls were found to be more stable in diethyl ether:hexane
(1:1) than in acetone since less degradation products of carotenoids and chlorophylls
were found when a 30 min extraction period was used. A 30 min extraction period
60
increased the extraction of most carotenoids without an increase in degradation
products and was chosen as the optimal extraction time (Table 3.5 and 3.6).
Table 3.5 The efficiency of ethylether:hexane (1:1) as extraction solvent for carotenoids and chlorophylls
in lyophilised grape tissue during two different extraction times.
Compound
Ethylether:hexane 30 min extraction 5 min extraction
Amount recovered (ng)
% Recovery Amount recovered
(ng) % Recovery
Violaxanthin 58.62 1.59 100.97 59.50 1.03 102.48
Neoxanthin 54.48 1.72 95.61 55.17 2.55 96.83
Antheraxanthin 84.07 2.01 100.39 84.87 0.50 101.83
Chlorophyll b 244.55 6.62 101.45 247.44 0.99 102.65
Lutein 168.93 4.67 102.70 168.61 1.05 102.50
Zeaxanthin 69.22 2.93 102.40 68.83 1.21 101.82
Chlorophyll a 129.00 4.90 102.58 129.58 3.55 103.04
β-carotene 117.45 1.90 122.89 114.56 0.69 119.87
Amount recovered was calculated as the average of 3 replications.
Table 3.6 The efficiency of acetone as extraction solvent for carotenoids and chlorophylls in lyophilised
grape tissue during two different extraction times.
Compound
Acetone
30 min extraction 5 min extraction
Amount recovered (ng) %
Recovery Amount
recovered (ng) %
Recovery
Violaxanthin 56.73 0.46 97.72 55.45 0.52 95.51
Neoxanthin 53.62 0.29 94.11 53.02 0.38 93.06
Antheraxanthin 81.79 1.28 97.67 79.24 1.03 94.62
Chlorophyll b 235.81 3.36 97.83 228.52 4.98 94.80
Lutein 163.55 1.92 99.43 154.77 2.47 94.09
Zeaxanthin 62.73 0.74 92.80 60.96 1.08 90.17
Chlorophyll a 125.78 2.08 100.02 123.86 0.55 98.49
B-carotene 119.37 1.02 124.91 115.75 1.60 121.12
Amount recovered was calculated as the average of 3 replications.
Lyophilisation of plant tissue is a well known practice to preserve plant tissue samples
and has been used widely to preserve grape tissue samples for the evaluation of
carotenoid content (During and Davtyan 2002; De Pinho et al. 2001, Razungles et al.
1988; Steel and Keller 2000). Craft et al. (1993) reported in his work that the
hydrocarbon carotenoids (carotenes) showed some degradation and xanthophylls
increased when tissue was lyophilised which might be due to the more efficient
hydrolysis of xanthophyll esters. Degradation of carotenoids in vegetables during
lyophilisation was also reported by Park (1987). We suggest that degradation of
chlorophyll is also possible during lyophilisation since the water is removed from the
tissue concentrating the acid in the matrix which might facilitate chlorophyll degradation.
61
Van den Berg et al. suggested, in his review on the potential of improvement in the
carotenoid levels in food, the storage of food samples at -20ºC and for long term
storage at a temperature of -70ºC. Craft et al. (1988) reported that carotenoids in serum
samples stored at -70ºC were stable for at least 2 years. Van den Berg et al. (2000)
also recommended that when samples are stored for long periods before analyses, it is
necessary to store samples together with reference samples from which the carotenoid
content is known to compensate for degradation losses and to identify breakdown
products easily. We found that dried aliquots of standards, especially chlorophyll a and
violaxanthin was unstable and almost immediately started degrading. For this reason
samples were not stored for longer then 48 hours at -20ºC.
3.3.4 EFFECT OF pH AND LIGHT ON EXTRACTION EFFICIENCY
The effect of light and pH (respectively) during the extraction method used in this study
was evaluated by adding a buffer solution which replaced the water in the extraction
method (50 mM Tris-HCl 7.5 pH containing 1 M NaCl) and working under subdued light
conditions instead of normal laboratory light conditions (Table 3.7). The effect on
carotenoids and chlorophylls were calculated with and without their degradation
products.
More chlorophyll b and neoxanthin were recovered from green tissue in the
presence of the buffer (Table 3.8) although lutein, β-carotene, and zeaxanthin were
recovered in lower amounts. Moreover in the red tissue, chlorophyll a, chlorophyll b and
zeaxanthin showed higher recovery while lutein, β-carotene, and neoxanthin were
recovered in lower amounts. In the case of the green tissue where the chlorophylls and
carotenoids during the extraction process and analysis were protected from light higher
recovery of all the carotenoids and chlorophylls were evident (Table 3.7). Almost a 30%
increase in the extraction of lutein, zeaxanthin and β-carotene were found in green
tissue under subdued light conditions compared to normal laboratory light conditions
during extraction. For the red tissue subdued light only improved the recovery of
neoxanthin, chlorophyll b and β-carotene (Table 3.7). Working under subdued light
conditions is a common practice when working with carotenoids and chlorophylls and is
suggested to prevent cis/trans isomerisation and degradation (Van den Berg et al.
2000).

62
Table 3.7 The effect of light on the extraction of carotenoids and chlorophylls (pigments) from red and
green berry tissue.
Compound
% More pigments without light exposure
Red tissue Green tissue Without
breakdown products
aWith breakdown products
Without breakdown products
aWith breakdown products
Violaxanthin 0.0 0.0
Neoxanthin 0.0 15.8 0.0 15.8
Chlorophyll b -7.2 31.8 -7.2 31.8
Lutein 31.5 31.5 31.5 31.5
Zeaxanthin 33.3 33.3 33.3 33.3
Chlorophyll a 0.0 29.8 0.0 29.8
β-carotene 30.6 30.6 30.6 30.6
aWith breakdown products: recovery % includes all breakdown products: violaxanthin (sum of violaxanthin and cis-violaxanthin), neoxanthin (sum of neoxanthin and neochromes), chlorophyll b (sum of chlorophyll b, pheophytin b and pyropheophytin b), lutein (lutein), zeaxanthin (zeaxanthin), chlorophyll a (sum of chlorophyll a and pheophytin a), β-carotene (β-carotene). All values are the average of 4 replicates.
Table 3.8 The effect of pH on the extraction of carotenoids and chlorophylls (pigments) from red and
green berry tissue.
Compound
% More pigments with buffer
Red tissue Green tissue
aWithout breakdown products
With breakdown products
aWithout breakdown products
With breakdown products
Violaxanthin 0.0 0.0 0.0 0.0
Neoxanthin -17.3 -81.8 100.0 -18.8
Chlorophyll b 40.2 18.6 5.4 -32.5
Lutein -15.1 -15.1 -26.3 -26.3
Zeaxanthin 19.8 19.8 -29.1 -29.1
Chlorophyll a 100.0 -13.0 0.0 -34.6
B-carotene -23.7 -23.7 -60.7 -26.7
aWith breakdown products: recovery % includes all breakdown products: violaxanthin (sum of violaxanthin and cis-violaxanthin), neoxanthin (sum of neoxanthin and neochromes), chlorophyll b (sum of chlorophyll b, pheophytin b and pyropheophytin b), lutein (lutein), zeaxanthin (zeaxanthin), chlorophyll a (sum of chlorophyll a and pheophytin a), β-carotene (β-carotene). All values are the average of 4 replicates. .
It is evident that the low pH of the berries especially green berries (pH < 3.15)
compared to red berries (pH ≥ 3.5) facilitated the transition of chlorophyll a and b to
pheophytin a and b. The pheophytins are formed when the central Mg atom of the
chlorophyll are replaced with a hydrogen ion (Schwartz and Lorenzo 1990), especially in
the presence of plant acids from the vacuoles of extracted plant material (Schwartz et
al. 1981; Ferruzzi and Schwartz 2005). The addition of salts during grinding of tissue
has been recommended to prevent the formation of pheophytins, especially in plants
with acidic cytoplasm. However Strain et al. (1971) has found that addition of neither

63
CaCO3 nor MgCO3 could totally prevent the formation of pheophytins in the extraction of
chlorophyll from acidic tissue. In green tissue, even when extracted in the presence of a
buffer, all the chlorophyll a was already converted to pheophytin a, which indicates that
degradation already took place during lyophilisation of tissue and/or during storage
(Table 3.8). In the red berry tissue extracts, there were also pheophytins present even
when it was protected against the pH effect during extraction (Table 3.8). The amounts
present in red tissue were however much less compared to green tissue. It is evident
that although the addition of a 50 mM Tris–HCl (pH 7.5) buffer to the extraction solvent
decreased the formation of pheophytins significantly, it also decreased the extraction of
carotenoids. The percentage increase of chlorophyll extraction in the presence of the
buffer determined with breakdown products included was actually negative, because the
formation and extraction of the breakdown products decreased significantly in the
presence of the buffer. In the lyophilized green tissue there was no chlorophyll a present
and the buffer could thus only influence the extraction of pheophytin a, not its formation.
In the green berry tissue only 25% less pheophytin a and b were formed with the
addition of the buffer during extraction, while in the red berry tissue 184 and 86% less
pheophytin a and b were respectively formed. This indicates that the buffer was not
strong enough to neutralize the acid in the green tissue.
Although the extraction method used in this study was similar to those used by
other authors (Mendes-Pinto et al. 2004; Oliveira et al. 2003) for grape berries, it is clear
that it should be further optimized for the extraction of both carotenoids and chlorophylls
and to minimize the effect of pH during extraction. Razungles et al. (1996) mentioned
the addition of 3 g of magnesium hydroxyl carbonate to the homogenate of mature
berries and 6 g to green berries during extraction in his study on carotenoids during
maturation of grape berries. Razungles et al. (1996) did not identify or report any cis-
isomers of carotenoids, but also did not include the evaluation of chlorophyll in grape
berries.
Another study reporting the use of a buffer during carotenoid extraction is Dias et al.
(2009) on Portuguese fruit and vegetables. The addition of sodium, magnesium or
calcium carbonate (0.10 g per gram of sample) to neutralize acids in tissue samples
when extracting carotenoids have been suggested to avoid cis/trans isomeration
(Mangels et al. 1993; Van den Berg et al. 2000; Zakaria et al. 1979).
It is interesting to note that changes in pH within the thylakoid membrane (where
carotenoids and chlorophylls are located) facilitate these typical biochemical
conversions in the xanthophyll cycle (Demmig-Adams et al. 1996).
64
3.4 CONCLUSION
The RP-HPLC method baseline separated all the carotenoids and chlorophylls and their
derivatives. Recovery of standards from mock extractions was high, indicating that the
extraction procedure was acceptable. However, it is clear that when the extraction
recovery of the standards were tested in the matrix of the grape tissue the situation is
less promising due to the high acid content of grape tissue. Violaxanthin, neoxanthin
and the chlorophylls were especially sensitive to low pH conditions which facilitated their
degradation. The degradation products of these compounds under acidic conditions
were identified as pheophytin a, b, chlorophillide a, pyropheophytin b, cis-violaxanthin,
cis-neoxanthin, neochrome, mutatoxanthin and luteoxanthin. There is a possibility that
some degradation products were already present in the tissue due to lyophilisation
(since the water in the berry was then removed and the acid concentrated). More work
is needed to investigate the effect of lyophilisation and storage on the composition of
grape tissue of different maturity. The extraction method for grape berry tissue at
different ripening stages should also be optimised further too effectively neutralise
tissue acidity, without compromising the extraction of carotenoids significantly, in
especially green berry tissue. The question as to whether cis-isomers and chlorophyll
degradation products are naturally present in grape berries or are formed during
sampling and processing remains unanswered in the current study.
3.5 LITERATURE CITED
Baumes, R., Wirth, J., Bureau, S., Gunata, Y., Razungles, A., Bio-generation of C13-norisoprenoid compounds: experiments supportive for an apo-carotenoid pathway in grapevines. Anal. Chim. Acta. 2002, 458, 3-14.
Britton G., Liaaen-Jensen S., Pfander H. (Eds) 1995,’Carotenoids Volume 1B: Spectroscopy.' (Birkhäuser Verlag: Basel).
Canjura, F.L., Schwartz, S.J., Separation of chlorophyll compounds and their polar derivatives by high performance liquid chromatography. J. Agric. Food Chem. 1991, 39, 1102-1105.
Chandler, L.A., Schwartz, S.J., HPLC separation of cis-trans carotene isomers in fresh and processed fruits and vegetables. J. Food Sci. 1987, 52, 669-672.
Craft, N.E., Brown, E. D., Smith, J. C., Effect of storage and handling conditions on concentrations individual carotenoids, retinol, and tocopherol in plasma. Clin. Chem. 1988, 34, 44-48.
Craft, N.E., Wise, A.S., Soares, J.H., Individual carotenoid content of SRM 1548 total diet and influence of storage temperature, lyophilisation, and irradiation on dietary carotenoids. J. Agric. Food Chem. 1993, 41, 208-213.
65
Demmig-Adams, B., Gilmore, A.M., Adams, W.W., Carotenoids 3: In vivo function of carotenoids in higher plants. 1996, FASEB J 10, 403-412.
De Pinho, P.G., Ferreira, A.C.S., Pinto, M.M., Benitez J.G., Hogg, T.A., Determination of Carotenoid Profiles in Grapes, Musts and Fortified Wines from Douro Varieties of Vitis Vinifera. J. Agric. Food Chem. 2001, 49, 5484-5488.
De Rosso, V.V., Mercadante, A.Z., Identification and quantification of carotenoids, by HPLC-PDA-MS/MS, from Amazonian fruits. J. Agric. Food Chem. 2007a, 55, 5062-5072.
Dias, M. G., Camões, M.F.G.F.C., Oliveira, L., Carotenoids in traditional Portuguese fruit and vegetables. Food Chem. 2009, 113, 808-815.
Dugo, P., Herrero, M., Kumm, T., Giuffrida, D., Dugo, G., Mondello, L., Comprehensive normal-phase x reversed-phase liquid chromatography coupled to photodiode array and mass spectrometry detection for the analysis of free carotenoids and caroteniod esters from mandarin. J. Chromatogr. A. 2008, 1189, 196-206.
Düring, H., Davtyan, A., Development changes of primary processes of photosynthesis in sun- and shade-adapted berries of two grapevine cultivars. Vitis. 2002, 2, 63-67.
Emenhiser, C., Sander, L.C., Schwartz, S.J., Capability of a polymeric C30 stationary phase to resolve cis-trans carotenoid isomers in reversed-phase liquid chromatography. J. Chromatogr. A. 1995, 707,205-216.
Emenhiser, C., Englert, G., Sander, L.C., Isolation and structural elucidation of the predominant geometrical isomers of α-carotene. J. Chromatogr. A. 1996a, 719, 333-343.
Faria, A.F., de Rosso, V.V., Mercadante, A.Z., Carotenoids Composition of Jackfruit (Artocarpus heterophyllus), Determined by HPLC-PDA-MS/MS. Plant Food Hum. Nutr. 2009, DOI 10.1007/sl 1130-009-0111-6.
Felt, L., Pacakova, V., Stulik, K., Volka, K. Reliability of Carotenoids Analyses: A Review Cur. Anal. Chem. 2005, 1, 93-102.
Ferreira, A.C.S., Monteiro, J., Oliveira, C., Guedes de Pinho, P., Study of major aromatic compounds in port wines from carotenoid degradation. Food Chem. 2008,110, 83-87.
Ferruzzi, M.G., Schwartz, S.J., Thermal Degradation of Commercial Grade Sodium Copper Chlorophyllin. J. Agric. Food Chem. 2005, 53, 7098-7102.
Giovanelli, G., Brenna, O.V., Evolution of some phenolic components, carotenoids and chlorophylls during ripening of three Italian grape varieties. Eur. Food Res. Technol. 2007, 225, 145-150.
Gross, J., Pigments in Vegetables: Chlorophylls and Carotenoids. New York: Van Nostrand Reinhold, 1991.
Hemraj, I., Rineer, C., Kurapati, S., Clement, M., Absorption Spectrum of Chlorophyll, Group R1, BE 210, 1997, 1-46.
Krinksky, N.I., Carotenoid protection against oxidation. Pure Appl. Chem. 1979, 51, 649-660.
Kolb, C.A., Wirth, E., Kaiser, W.M., Meister, A., Riederer, M., Pfündel, E.E., Noninvasive Evaluation of the Degree of Ripeness in Grape Berries (Vitis Vinifera L. Cv. Bacchus and Silvaner) by Chlorophyll Fluorescence. J. Agric. Food Chem. 2006, 54, 299-305.
Lund, S., Peng, F. Y., Nayar, T., Reid, K. E., Schlosser J., Gene expression analyses in individual grape (Vitis vinifera L.) berries during ripening initiation reveal that pigmentation intensity is a valid indicator of developmental staging within the cluster. Plant Mol. Bio. 2008, 68, 301-315.

66
Mangels, A. R., Holden, J. M., Beecher, G. R., Forman, M. R., Lanza, E., Carotenoid content of fruits and vegetables: An evaluation of analytic data. J. Am. Diet Assoc. 1993, 93, 284.
Mangos, T.J., Berger, R.G., Determination of major chlorophyll degradation products. Z Lebensm. Unters. Forsh. A. 1997, 204, 345-350.
Mendes-Pinto, M.M., Ferreira, A.C.S., Oliveira, M.B.P.P., De Pinho, P.G., Evaluation of Some Carotenoids in Grape by Reversed- and Normal-Phase Liquid Chromatography: A Qualitative Analysis. J. Agric. Food Chem. 2004, 52, 3182-3188.
Mendes-Pinto, M.M., Ferreira, A.C.S., Caris-Veyrat, C., De Pinho, G.P. Carotenoids, Chlorophyll, and Chlorophyll-Derived Compounds in Grapes and Port Wines. J. Agric. Food Chem. 2005, 53, 10034-10041.
Minguez-Mosquera, M. I., Jaren-Galan, M., Garrido-Fernandez, J., Influence of Industrail Drying Process of Pepper Fruit (Capsicum annuum Cv. Bola) for Paprika on the Carotenoid Content. J. Agic. Food Chem. 1994, 42,1190-1193.
Oliveira, C., Ferreira, A.C., Costa, P., Guerra, J., Guedes de Pinho, P., Effect of some viticultural parameters on the grape carotenoid profile. J. Agric. Food Chem. 2004, 52, 4178-4184.
Oliveira, C., Silva Ferreira, A.C., Mendes Pinto, M., Hogg, T., Alves, F., Guedes de Pinho, P., Carotenoid compounds in grapes and their relationship to plant water status. J. Agric. Food Chem. 2003, 51, 5967-5971.
Oliver, J., Palou, A., Chromatographic determination of carotenoids in foods. J. Chromatogr. A. 2000, 881, 543-555.
Park, Y.W., Effect of freezing, thawing, drying, and cooking on carotene retention in carrots, broccoli and spinach. J. Food Sci. 1987, 52, 1022-1025.
Razungles, A., Bayonove, C., Cordonnier, R., Sapis, J., Grape carotenoids: changes during the maturation period and localization in mature berries. Am. J. Enol. Vitic. 1988, 39, 44-48.
Razungles, A.J., Babic, I., Sapis, J.C., Bayonove, C.L., Particular Behaviour of Epoxy Xanthophylls during Veraison and Maturation of Grape. J. Agric. Food Chem. 1996, 44, 3821-3825.
Rodriguez-Amaya, D.B., Kimura, M., Godoy, H.T., Amaya-Farfan, J., Updated Brazilian database on food carotenoids: Factors affecting carotenoid composition. J. Food Comp. Anal. 2008, 21, 445-463.
Schwartz, S.J., Woo, S.L., Von Elbe, J.H., High performance liquid chromatography and their derivatives in fresh and processed spinach. J. Agric. Food Chem. 1981, 29, 533-537.
Schwartz, S.J., Lorenzo, T V., Chlorophyll in foods. In Critical Reviews in Food Science and Nutrition, Clydesdale, F. M., Ed.; CRC Press: Boca Raton, FL, 1990.
Steel, C.C., Keller, M., Influence of UV-B radiation on the carotenoid content of Vitis vinifera tissues. Biochem. Soc. T. 2000, 28, 883-885.
Strain, H.H., Cope, B. T., Svec, W.A., Analytical procedures for the isolation, estimation and identification of the chlorophylls. Meth. Enzym. 1971, 23A, 452-476.
Taylor, K.L., Brackenridge, A.E., Vivier, M.A., Oberholster, A., High-performance liquid chromatography profiling of the major carotenoids in Arabidopsis thaliana leaf tissue. J. Chromatogr. A. 2006, 1121, 83-91.
Taylor, M., Ramsay, G., Carotenoid biosynthesis in plant storage organs: recent advances and prospects for improving plant food quality. Phys. Plant. 2005, 124, 143-151.

67
Van Breemen, R. B., Canjura, F.L., Schwartz, S.J., Identification of Chlorophyll Derivatives by Mass Spectrometry. J. Agric. Food Chem. 1991, 39, 1452-1456.
Van den Berg, H., Faulks, R., Fernando Granado, H., Hirschberg, Olmedilla, B., Sandmann, G., Southon, S., Stahl, W., The potential for the improvement of carotenoid levels in food and the likely systemic effects. J. Sci. Food Agric. 2000, 80, 880-912.
Zakaria, M., Simpson, K., Brown, P.R., Krstulovic, A., Use of reversed-phase high-performance liquid chromatographic analysis for the determination of provitamin A carotenes in tomatoes. J. Chromatogr. 1979, 1,176, 109-117.
Zepka, L.Q., Mercadante, A.Z., Degradation compounds of carotenoids formed during heating of a simulated cashew apple juice. Food Chem. 2009, article in press
CChhaapptteerr 44
RESEARCH RESULTS
Quantitative analysis of grape carotenoid
and chlorophyll profiles during ripening
with reference to grapevine vigour and
water status

69
Research Results
4.1 INTRODUCTION
Research has shown that carotenoids are the likely precursors to C13-norisoprenoids which
is thought to be a significant group of aroma compounds in wine due to their low olfactory
threshold values (Etievant et al. 1991). Photosynthetic pigments such as carotenoids and
chlorophylls, and their derivatives, are also reported to be found in wine (De Pinho et al.
2001) and have the potential to contribute as precursors to aroma compounds (Sefton et
al. 1993).
One of the important C13-norisoprenoids which contributes to wine aroma is β-ionone
with a low threshold value of 90 ng/L (in a model base wine) (Kotseridis et al. 1999b). β-
ionone has a violet-like aroma and can be formed as a cleavage product of the carotenoid
β-carotene (Kanasawud and Cruzet 1990) and zeaxanthin, a xanthophyll (Mathieu et al.
2005). β-damascenone is another C13-norisoprenoid found in wine, with a threshold value
of 50 ng/L in 10% alcohol (Guth 1997), its aroma notes have been described as honey-like
(Kovats 1987) and flowery, ionone-like (Ohloff 1978). Due to the fact that the precursors to
these aroma compounds are grape-derived, they are an important research field for
viticulturists, since they can potentially be altered by viticultural practices and influence the
perception of the end product.
Viticultural factors which can influence carotenoid and chlorophyll content in grapes
are, for example, sunlight and plant water deficit (Bindon 2004; Bureau et al. 1998; Bureau
et al. 2000; Oliveira et al. 2003; Oliveira et al. 2004; Razungles et al. 1998). These factors
can be managed by viticulturists through the manipulation of vigour through canopy
management and irrigation scheduling, giving an opportunity for viticultural research.
Additionally, the advance in technology to develop non-invasive techniques to monitor
vineyard progression in ripening, for example via chlorophyll measurements (Kolb et al.
2006) creates further possibilities for the viticulturist. Kolb et al. (2006) found that non-
invasive chlorophyll fluorescence measurements are well suited to determine sugar
accumulation in grape berries during ripening. Since pigmentation has been demonstrated
to be a statistically significant indicator of transcriptional state of genes during the initiation
of ripening (Lund et al. 2008), the non-invasive monitoring of grape pigments can provide
the viticulturist with information regarding the timing of key metabolic events which can be

70
used to predict optimal ripeness. Given that grape pigments, namely carotenoids and
chlorophylls, respond sensitively to metabolic events and grapevine physiology, the
possibility exists that the monitoring of these pigments can be used in building a within-
vineyard model to predict ripeness using non-invasive measurements such as near infra-
red (NIR) radiation or chlorophyll fluorescence (Agati et al. 2008; Baranska et al. 2006;
Davey et al. 2009; Kolb et al. 2006; Ruiz et al. 2008).
However, before research is initiated to develop non-invasive methods for pigment
monitoring in the vineyard, two key questions need to be addressed. Firstly, a reliable
analytical method is required for validation and calibration of the non-invasive measure
(Agati et al. 2007; Gitelson and Merzlyak 2002). Secondly, the factors influencing these
pigment concentrations need to be evaluated in greater depth. These factors are diverse,
and include temperature, soil water content, sunlight penetration, cultivar, terroir, clone and
climate (Bindon 2004; Bindon et al. 2007; Bureau et al. 1998; Bureau et al. 2000;
Giovanelli and Brenna 2007; Marais et al. 1992a; Oliveira et al. 2003; Oliveira et al. 2004;
Oliveira et al. 2006; Razungles et al. 1998). However, for regional or localised vineyards,
small variations in grapevine vigour, microclimate or soil type can alter the timing of
phenology, and thus harvest. On a small scale, the monitoring of pigment changes during
grape development can be determined relative to other ripeness parameters e.g. sugars,
organic acids and colour in order to explore these relationships statistically. To date, little
work has been done on carotenoids and chlorophylls in relation to the above-mentioned
ripeness parameters in grapes.
Chemometrics is a valuable tool to explore relationships of grape composition and the
viticultural parameters which can potentially affect them since many variables can be
accommodated in one analysis. Chemometric techniques that can be used to discriminate
between samples and explore potential relationships are principle component analyses
(PCA) and partial least square (PLS) analysis. PCA and PLS analysis describe sample
clustering and detect compounds responsible for the separation of samples (Kemsley
1998). PCA is essentially a descriptive method used to visualise samples present in an n-
dimensional space of a set of inter-correlated variables into a smaller number of
dimensions, called principle components (PCs), where each principle component (PC)
account for a portion of the total variance of the data set (Kemsley 1996; Summer et al.
2003). PLS is based on multivariate regression, taking into account the covariance
between variables. PLS is regularly used to predict quantitative variables using

71
spectroscopic measurements. These techniques form the starting point for an exploratory
study, and can serve as a guideline to test the validity of hypotheses using large datasets,
as well as the foundation to generate statistical models.
In one study, Pereira et al. (2006) showed by using 1H NMR spectroscopy
(fingerprinting of metabolites in grape skins) together with chemometric data analyses that
vintage effects on grape metabolic profiles prevail over soil effect. In a later study, Le
Moigne et al. (2008) showed that front face fluorescence spectroscopy and visible
spectroscopy coupled with chemometrics had the potential to characterise ripening of
Cabernet Franc grapes. For the viticultural scientist, the limitations of this type of study are
that models can be built only with data from multiple seasons, and tested with data from
diverse regions. To generate this type of data requires the use of rapid, non-invasive field
measurements. As a preliminary study, this project has undertaken a study of the
chlorophyll and carotenoid concentration of Merlot grape berries within a single vineyard.
Using defined plots from variable regions within the vineyard, the vigour and soil water
content of each plot was monitored in order to potentially correlate changes in grape
pigments to viticultural parameters using PCA analysis. As a second question, the general
trends of individual carotenoids and chlorophylls from pre-veraison to harvest are shown
with reference to possible influence of seasonal variation on these profiles. Finally, some
preliminary work has been done using PLS analysis, on the relationship between
carotenoid and chlorophyll content and selected ripening parameters.
4.2 MATERIALS AND METHODS
4.2.1 PLANT MATERIAL AND GROWTH CONDITIONS
A commercial vineyard Merlot Clone MO 9 vines (Vitis vinifera L. cv. Merlot) grafted on
Richter 110 (Vitis berlandieri x Vitis rupestris) rootstocks was used in this experiment. The
vineyard is situated in the Stellenbosch region, South Africa on the Dornier wine estate
181-188 m above sea level with a slope of 12.1% over a distance of 174 m south to north.
The area has a Mediterranean climate with dry and warm summers and cold, rainy winters.
The annual rainfall for the Stellenbosch region is between 600 to 800 mm and the average
temperature 18 to 19ºC. The vine spacing was 2.7 x 1.5 m in an east-west direction on a 6
wire movable hedge trellis system and planted in oakleaf soil. Sporadic occurrences of leaf
roll virus and Eutypa dieback (Eutypa lata) disease were found at the vineyard site.

72
However, these vines were excluded from the experimental plots. No other diseases or rot
has been detected. The vineyard is surrounded by mountains on the north and north-east
side causing reduced sunshine hours in the morning. Canopy management included shoot
positioning and mechanical shoot topping on some plots are indicated in Appendix B, Table
3a.
4.2.2 PLOT DESCRIPTION AND LAYOUT
The plot layout was based on normalized difference vegetation index (NDVI) images taken
in January of each season (2006/2007 and 2007/2008). These images were used to select
regions of vigour variability in the experimental vineyard. The NDVI images were based on
the reflectance ratio between the far red and near infrared radiation reflected by the plant.
Previous research has shown that the NDVI index is well correlated with biomass and
pruning mass (Tucker 1979; Asrar et al. 1984; Daughtry et al. 1992; Johnson et al. 2001b;
Nemani et al. 2001). Various researchers have reported positive correlations between
pruning mass and vigour level (Johnson et al. 2001a; Johnson et al. 1996; Baldy et al.
1996a). High (blue), medium (green) and low (white) vigour areas were identified using the
NDVI images and the plot layout was chosen accordingly (Figure 4.1 and 4.2). High,
medium and low vigour plots each received two irrigation treatments, namely dry land
(minimal to no irrigation) or wet (irrigated) (Appendix B, Table 1 and 2). The selected plots
consisted of 24 vines each which were subdivided into 4 subplots of 6 vines each (Figure
4.3).

73
8A12
1
3
A2
A4
8A12
1
3
A2
A4
Figure 4.1 NDVI image of the experimental vineyard 2006/2007 season with plot layout: 1 (high vigour, dry); A2 (high vigour, irrigated); 3 (medium vigour, wet); A4 (medium vigour, dry); 8 (low vigour, dry); A12 (low vigour, wet).
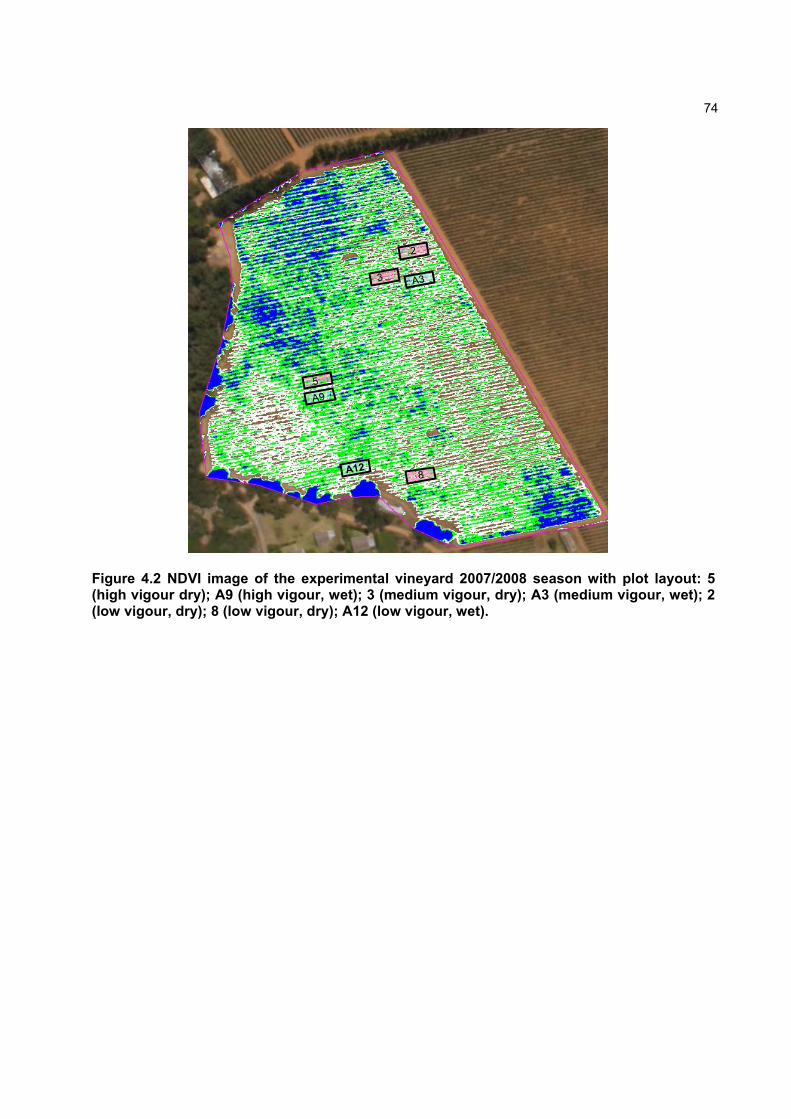
74
3
2
8A12
A3
5
A9
3
2
8A12
A3
5
A9
Figure 4.2 NDVI image of the experimental vineyard 2007/2008 season with plot layout: 5 (high vigour dry); A9 (high vigour, wet); 3 (medium vigour, dry); A3 (medium vigour, wet); 2 (low vigour, dry); 8 (low vigour, dry); A12 (low vigour, wet).
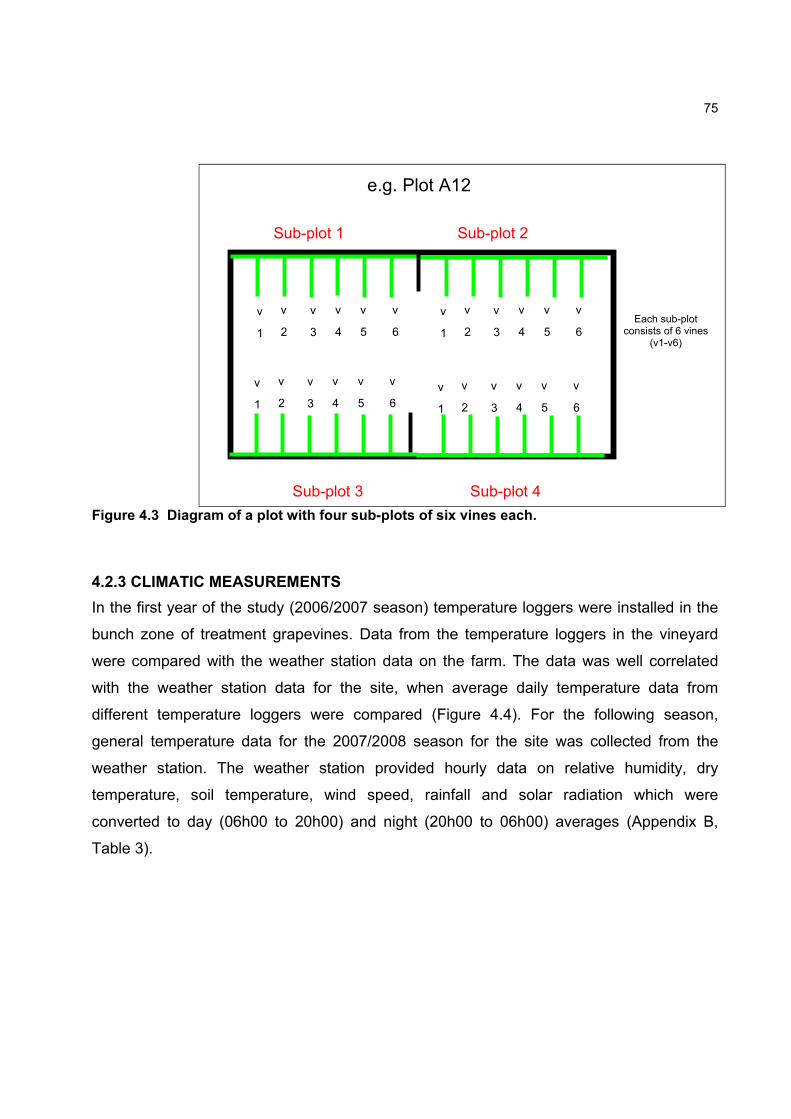
75
Figure 4.3 Diagram of a plot with four sub-plots of six vines each.
4.2.3 CLIMATIC MEASUREMENTS
In the first year of the study (2006/2007 season) temperature loggers were installed in the
bunch zone of treatment grapevines. Data from the temperature loggers in the vineyard
were compared with the weather station data on the farm. The data was well correlated
with the weather station data for the site, when average daily temperature data from
different temperature loggers were compared (Figure 4.4). For the following season,
general temperature data for the 2007/2008 season for the site was collected from the
weather station. The weather station provided hourly data on relative humidity, dry
temperature, soil temperature, wind speed, rainfall and solar radiation which were
converted to day (06h00 to 20h00) and night (20h00 to 06h00) averages (Appendix B,
Table 3).
Sub-plot 3
Sub-plot 2
Sub-plot 4
Sub-plot 1
v
1
v
2
v
3
v
4
v
5
v
6
v
1
v
2
v
3
v
4
v
5
v
6
v
1
v
2
v
3
v
4
v
5
v
6
v
1
v
2
v
3
v
4
v
5
v
6
e.g. Plot A12
Each sub-plot consists of 6 vines
(v1-v6)

76
Av erage bunch zone temp (TT) Av erage daily temp (DW)
8-Ja
n
18-J
an
28-J
an
7-F
eb
17-F
eb
27-F
eb
9-M
ar
19-M
ar
Date
12
14
16
18
20
22
24
26
28
30
Tem
pera
ture
(ºC
)
Figure 4.4 Average daily temperature measured by Dornier weather station (DW) compared to the average bunch zone temperature measured by tiny tag (TT) loggers installed in the bunch zone of a vine canopy for the 2006/2007 growing season.
4.2.4 CANOPY MEASUREMENTS
Photosynthetically active radiation (PAR) within the grapevine canopy was measured with
a sun fleck ceptometer (Decagon Device, Inc. Pullman, Washington) for the 2007/2008
season. Measurements were taken post-veraison (29 Feb 08) on a cloudless day at solar
noon between 09h00 and 10h00 in the morning. The ceptometer was placed horizontally in
the bunch zone of the canopy to obtain measurements representative of the PAR reaching
the bunches. PAR measurements were adjusted according to ambient light conditions
(measured at each plot) and expressed as a ratio of PAR of bunch zone: PAR ambient.
Shoot length was measured from representative shoots of each plot collected after
pruning. Main and lateral shoot length were measured and the number of nodes and lateral
shoots counted. Shoot diameter was measured at the base, middle and tip of each
representative shoot respectively and expressed as the average of these three diameter
measurements. The number of shoots on each vine was determined as well as the number
of shoots on spur positions which were potential grape bearers. Furthermore, the pruning
mass of each experimental vine was weighed (Appendix B, Table 3a).
77
4.2.5 VINE WATER STATUS MEASUREMENTS
Pre-dawn leaf water potential was measured weekly from veraison to harvest at 04h00
prior to an irrigation event on all experimental plots using a pressure chamber (PMS
Instrument Co., Corvallis, Oregon) supplied with a compressed air cylinder (Scholander et
al. 1965). Four young fully expanded leaves per plot were used for measurements. Leaves
were cut and inserted into the pressure chamber. Measurement was within 15 sec after the
leaf was cut.
Soil water content was measured for each plot at 30 cm, 60 cm and 90 cm depths with
a calibrated neutron probe (Hydro probe, model 503DR, 130 So Buchanan Pacheco, CA
USA) for both seasons of the study. An average of these three depths was used as
indicator of the wetness of the soil expressed as neutron count ratios (Appendix B, Table
3b). The instrument was calibrated against a 200 L water barrel incorporating a PVC
access tube similar to the field-installed ones. The neutron count ratio was determined from
the field measured values divided by the water drum count average.
4.2.6 YIELD MEASUREMENTS, BUNCH AND BERRY MASS
Bunch mass and the number of bunches per vine was recorded for each plot at harvest
from which average bunch mass per vine was determined. Bunch mass, berry mass and
the number of berries per bunch were measured from twelve representative typical
bunches of each plot (selected at random down the row) at harvest (Appendix B, Table 3b).
4.2.7 GRAPE RIPENESS MONITORING, SAMPLING AND ANALYSIS
Samples were taken weekly from pre-veraison to harvest for each experimental plot.
Samples consisted of approximately 160 berries from each plot which were taken
randomly. One hundred berries of the 160 berries were weighed and the volume
determined by using a volumetric cylinder filled with water. Juice was pressed manually
from these 160 berries. Total soluble solids (TSS), pH and total titratable acid (TA) were
determined using the juice from the berries. TSS was determined with a digital
refractometer (Atago Pocket PAL-1) which was zeroed with distilled water. TA was
determined using an automatic titrater (Metrohm 785 DMP Tritino) with sodium (NaOH) at
a dilution of 0.33 N. The pH of the juice was determined with a pH meter (Crison, Basic 20,
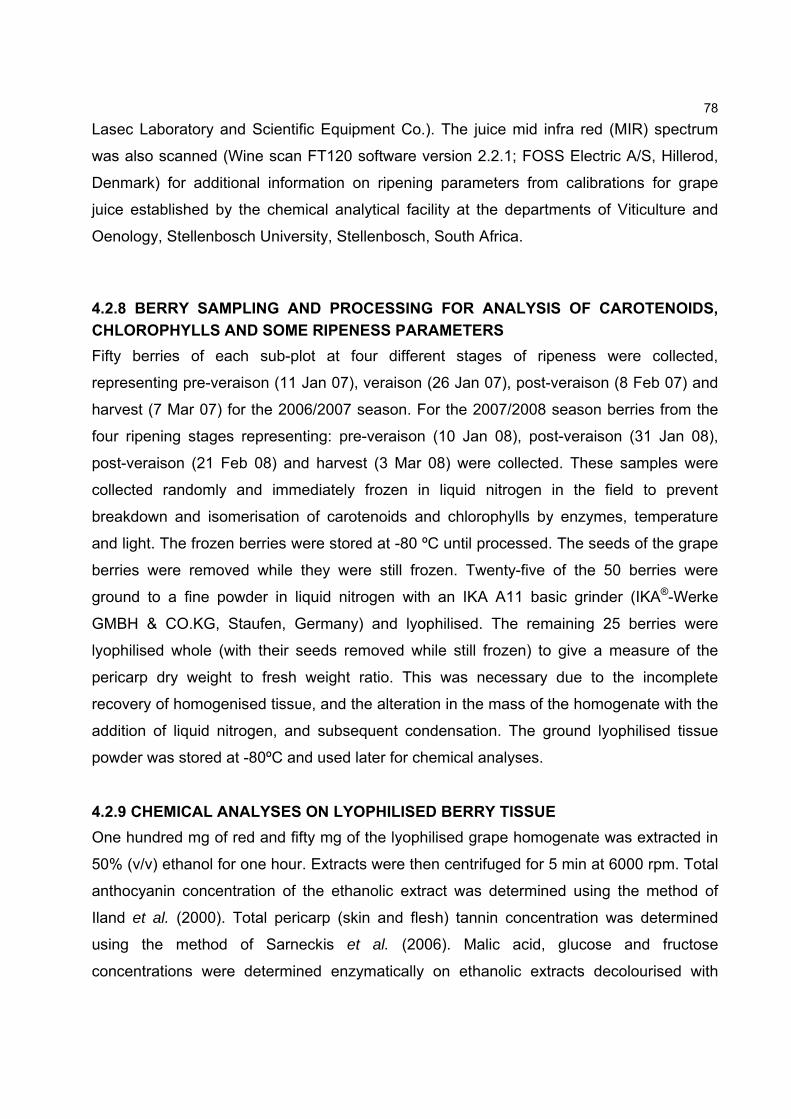
78
Lasec Laboratory and Scientific Equipment Co.). The juice mid infra red (MIR) spectrum
was also scanned (Wine scan FT120 software version 2.2.1; FOSS Electric A/S, Hillerod,
Denmark) for additional information on ripening parameters from calibrations for grape
juice established by the chemical analytical facility at the departments of Viticulture and
Oenology, Stellenbosch University, Stellenbosch, South Africa.
4.2.8 BERRY SAMPLING AND PROCESSING FOR ANALYSIS OF CAROTENOIDS,
CHLOROPHYLLS AND SOME RIPENESS PARAMETERS
Fifty berries of each sub-plot at four different stages of ripeness were collected,
representing pre-veraison (11 Jan 07), veraison (26 Jan 07), post-veraison (8 Feb 07) and
harvest (7 Mar 07) for the 2006/2007 season. For the 2007/2008 season berries from the
four ripening stages representing: pre-veraison (10 Jan 08), post-veraison (31 Jan 08),
post-veraison (21 Feb 08) and harvest (3 Mar 08) were collected. These samples were
collected randomly and immediately frozen in liquid nitrogen in the field to prevent
breakdown and isomerisation of carotenoids and chlorophylls by enzymes, temperature
and light. The frozen berries were stored at -80 ºC until processed. The seeds of the grape
berries were removed while they were still frozen. Twenty-five of the 50 berries were
ground to a fine powder in liquid nitrogen with an IKA A11 basic grinder (IKA®-Werke
GMBH & CO.KG, Staufen, Germany) and lyophilised. The remaining 25 berries were
lyophilised whole (with their seeds removed while still frozen) to give a measure of the
pericarp dry weight to fresh weight ratio. This was necessary due to the incomplete
recovery of homogenised tissue, and the alteration in the mass of the homogenate with the
addition of liquid nitrogen, and subsequent condensation. The ground lyophilised tissue
powder was stored at -80ºC and used later for chemical analyses.
4.2.9 CHEMICAL ANALYSES ON LYOPHILISED BERRY TISSUE
One hundred mg of red and fifty mg of the lyophilised grape homogenate was extracted in
50% (v/v) ethanol for one hour. Extracts were then centrifuged for 5 min at 6000 rpm. Total
anthocyanin concentration of the ethanolic extract was determined using the method of
Iland et al. (2000). Total pericarp (skin and flesh) tannin concentration was determined
using the method of Sarneckis et al. (2006). Malic acid, glucose and fructose
concentrations were determined enzymatically on ethanolic extracts decolourised with
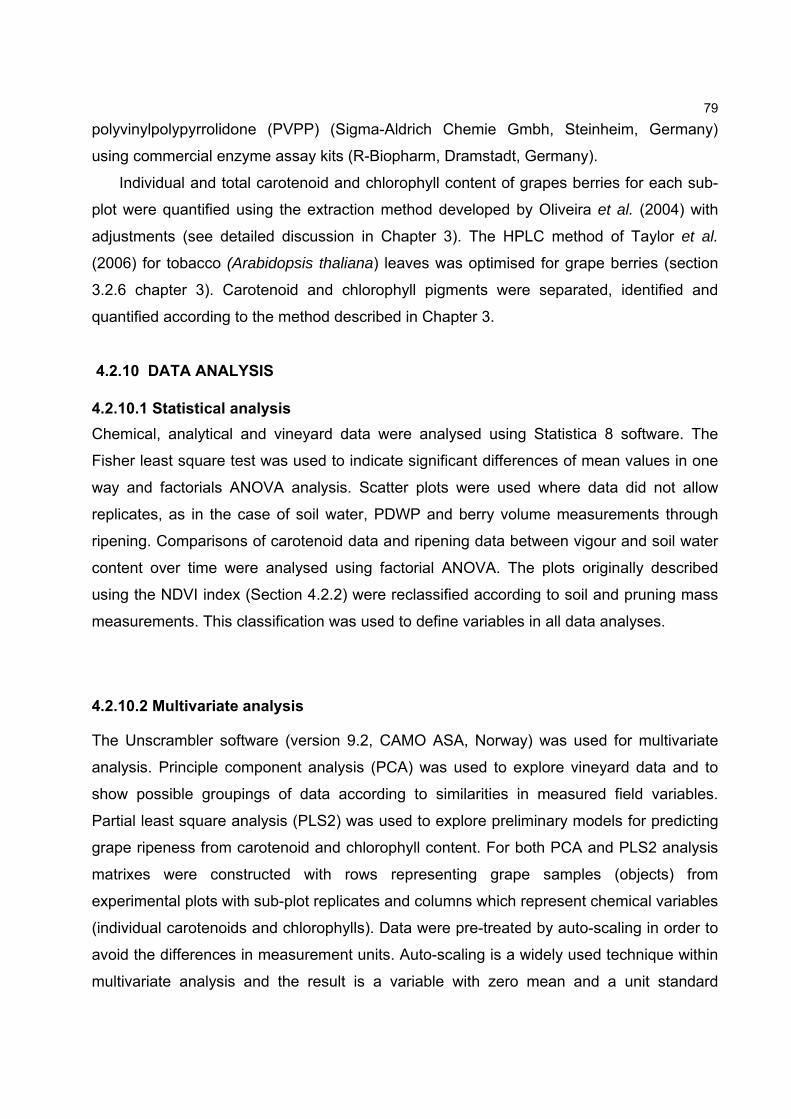
79
polyvinylpolypyrrolidone (PVPP) (Sigma-Aldrich Chemie Gmbh, Steinheim, Germany)
using commercial enzyme assay kits (R-Biopharm, Dramstadt, Germany).
Individual and total carotenoid and chlorophyll content of grapes berries for each sub-
plot were quantified using the extraction method developed by Oliveira et al. (2004) with
adjustments (see detailed discussion in Chapter 3). The HPLC method of Taylor et al.
(2006) for tobacco (Arabidopsis thaliana) leaves was optimised for grape berries (section
3.2.6 chapter 3). Carotenoid and chlorophyll pigments were separated, identified and
quantified according to the method described in Chapter 3.
4.2.10 DATA ANALYSIS
4.2.10.1 Statistical analysis
Chemical, analytical and vineyard data were analysed using Statistica 8 software. The
Fisher least square test was used to indicate significant differences of mean values in one
way and factorials ANOVA analysis. Scatter plots were used where data did not allow
replicates, as in the case of soil water, PDWP and berry volume measurements through
ripening. Comparisons of carotenoid data and ripening data between vigour and soil water
content over time were analysed using factorial ANOVA. The plots originally described
using the NDVI index (Section 4.2.2) were reclassified according to soil and pruning mass
measurements. This classification was used to define variables in all data analyses.
4.2.10.2 Multivariate analysis
The Unscrambler software (version 9.2, CAMO ASA, Norway) was used for multivariate
analysis. Principle component analysis (PCA) was used to explore vineyard data and to
show possible groupings of data according to similarities in measured field variables.
Partial least square analysis (PLS2) was used to explore preliminary models for predicting
grape ripeness from carotenoid and chlorophyll content. For both PCA and PLS2 analysis
matrixes were constructed with rows representing grape samples (objects) from
experimental plots with sub-plot replicates and columns which represent chemical variables
(individual carotenoids and chlorophylls). Data were pre-treated by auto-scaling in order to
avoid the differences in measurement units. Auto-scaling is a widely used technique within
multivariate analysis and the result is a variable with zero mean and a unit standard

80
deviation (Kowalski and Bender, 1972). Cross validation was used in all analysis and no
outliers were removed if not specifically mentioned. The reclassified plots according to soil
and pruning mass measurements were used to define variables for all data analysis (Table
4.2).
4.3 RESULTS AND DISCUSSION
4.3.1 MESOCLIMATIC DATA FOR THE VINEYARD SITE
The average day and night temperature data (from Dornier weather station) were divided
according to the different block periods defined by grape ripeness stage, namely pre-
veraison, veraison, post-veraison and harvest. The dates for these ripeness stages were
very similar for both seasons studied. The climatic conditions for each of these ripening
periods for the 2006/2007 and 2007/2008 seasons were compared (Table 4.1 a, b).

81
Table 4.1a Mean day and night climate differences during four ripening stages (pre-veraison; veraison; post-veraison; harvest) for the 2006/2007 and 2007/2008 ripening seasons (significant differences are only valid for each season comparing the same ripeness stage, significant differences are indicated with abcd if not bearing the same letter indicating significant difference with p ≤ 0.05). .
Ripening stage Date Average day Temperature
(°C)
Average night Temperature
(°C)
Soil day Temperature
(°C)
Soil Temperature at
night (°C)
Solar Radiation (KW/h/m2)
Average Sun shine per hour (%)
Rain (mm)
Pre‐veraison 1‐11 Jan 07 22.50ab 16.14ab 19.23a 20.16ab 1.43a 73a 0.00a 1‐11 Jan 08 22.38ab 17.23ab 19.22a 19.53b 1.36ab 68abc 0.06a
Veraison 12‐25 Jan 07 25.95c 19.08c 21.54b 22.22c 1.35ab 70ab 0.00a 12‐25 Jan 08 25.12cd 17.92bc 20.12c 20.84ad 1.34ab 72a 0.01a
Post‐veraison 26 Jan ‐ 8 Feb 07 24.91ac 17.37abc 22.07b 22.37c 1.33ab 70ab 0.00a 26 Jan ‐ 8 Feb 08 26.06cd 17.90bc 20.75cd 21.32d 1.39a 74a 0.02a
Harvest 9 Feb ‐ 7 Mar 07 21.47b 16.08a 20.21c 20.42a 1.17bc 60bc 0.09a 9 Feb ‐ 7 Mar 08 23.52ad 17.12ab 20.68d 21.04d 1.06c 58c 0.07a
Table 4.1b Mean seasonal climate differences during four ripening stages (pre-veraison; veraison; post-veraison; harvest) for the 2006/2007 and 2007/2008 seasons (significant differences are only valid for each season comparing the same ripeness stage, significant differences are indicated with abcd if not bearing the same letter indicating significant difference with p ≤ 0.05).
Ripening stage Date Daily Wind
Speed (km/h) Wind Speed at night (km/h)
Daily Maximum
Wind (km/h)
Maximum wind at night
(km/h)
Daily relative humidity (%)
Relative humidity at night (%)
Pre‐veraison 1‐11 Jan 07 1.96ab 1.32ab 3.25ab 2.26abc 58.63ab 82.43ab 1‐11 Jan 08 2.13a 1.71c 3.61a 2.97d 55.30acd 72.95c
Veraison 12‐25 Jan 07 1.93ab 1.23ab 3.30a 2.14ac 51.38ac 75.15c 12‐25 Jan 08 2.10a 1.50ac 3.41a 2.66bd 54.34acd 75.73c
Post‐veraison 26 Jan ‐ 8 Feb 07 2.01a 1.44ac 3.39a 2.47abd 53.90ac 79.23ac 26 Jan ‐ 8 Feb 08 2.08a 1.52ac 3.33a 2.59abd 47.81c 74.94c
Harvest 9 Feb ‐ 7 Mar 07 1.91ab 1.28ab 3.21ab 2.19ac 61.39bd 81.20ab 9 Feb ‐ 7 Mar 08 1.68b 1.15b 2.88b 1.97c 63.56b 84.85b
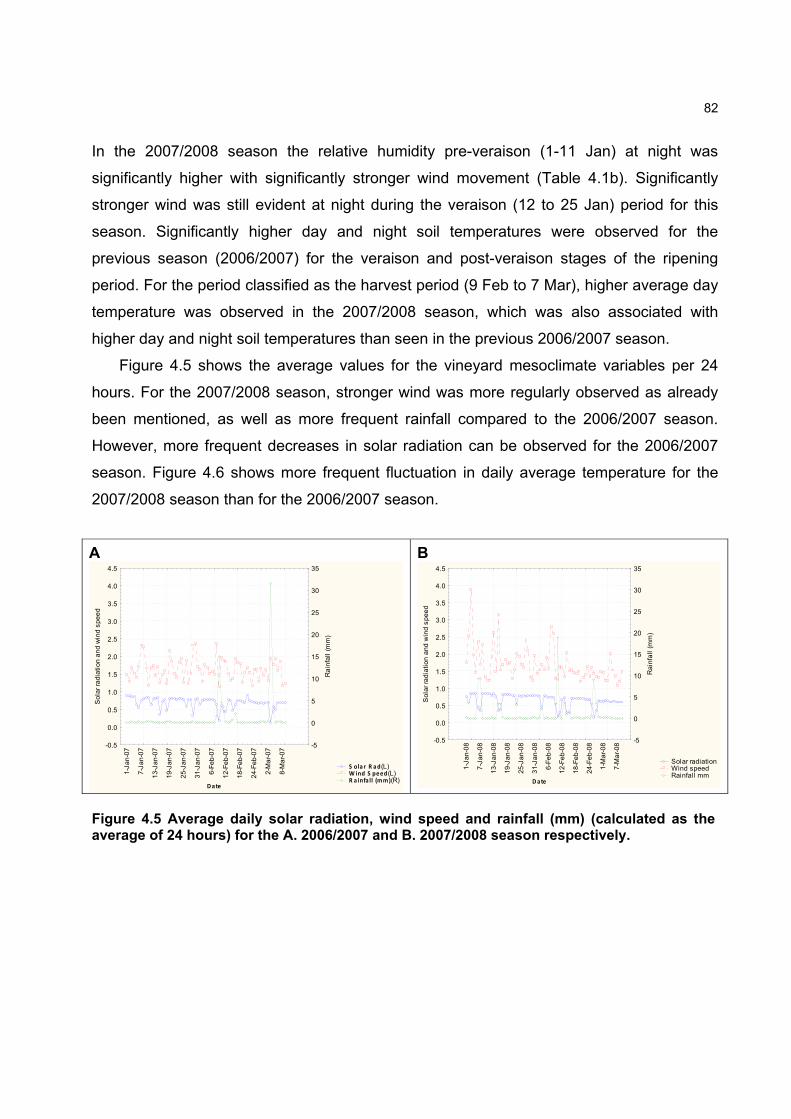
82
In the 2007/2008 season the relative humidity pre-veraison (1-11 Jan) at night was
significantly higher with significantly stronger wind movement (Table 4.1b). Significantly
stronger wind was still evident at night during the veraison (12 to 25 Jan) period for this
season. Significantly higher day and night soil temperatures were observed for the
previous season (2006/2007) for the veraison and post-veraison stages of the ripening
period. For the period classified as the harvest period (9 Feb to 7 Mar), higher average day
temperature was observed in the 2007/2008 season, which was also associated with
higher day and night soil temperatures than seen in the previous 2006/2007 season.
Figure 4.5 shows the average values for the vineyard mesoclimate variables per 24
hours. For the 2007/2008 season, stronger wind was more regularly observed as already
been mentioned, as well as more frequent rainfall compared to the 2006/2007 season.
However, more frequent decreases in solar radiation can be observed for the 2006/2007
season. Figure 4.6 shows more frequent fluctuation in daily average temperature for the
2007/2008 season than for the 2006/2007 season.
A
S ola r R ad(L) W ind S peed(L) R a infa ll (mm)(R)
1-J
an
-07
7-J
an
-07
13
-Ja
n-0
7
19
-Ja
n-0
7
25
-Ja
n-0
7
31
-Ja
n-0
7
6-F
eb
-07
12
-Fe
b-0
7
18
-Fe
b-0
7
24
-Fe
b-0
7
2-M
ar-
07
8-M
ar-
07
Date
-0.5
0.0
0.5
1.0
1.5
2.0
2.5
3.0
3.5
4.0
4.5
So
lar
rad
iati
on
an
d w
ind
sp
ee
d
-5
0
5
10
15
20
25
30
35
Ra
infa
ll (
mm
)
B
Solar radiation Wind speed Rainfall mm
1-J
an
-08
7-J
an
-08
13
-Ja
n-0
8
19
-Ja
n-0
8
25
-Ja
n-0
8
31
-Ja
n-0
8
6-F
eb
-08
12
-Fe
b-0
8
18
-Fe
b-0
8
24
-Fe
b-0
8
1-M
ar-
08
7-M
ar-
08
Date
-0.5
0.0
0.5
1.0
1.5
2.0
2.5
3.0
3.5
4.0
4.5
So
lar
rad
iati
on
an
d w
ind
sp
ee
d
-5
0
5
10
15
20
25
30
35
Ra
infa
ll (
mm
)
Figure 4.5 Average daily solar radiation, wind speed and rainfall (mm) (calculated as the average of 24 hours) for the A. 2006/2007 and B. 2007/2008 season respectively.

83
A
Daily temperature ºC Soil temperature ºC Relative humidity %
1-J
an
-07
7-J
an
-07
13
-Ja
n-0
7
19
-Ja
n-0
7
25
-Ja
n-0
7
31
-Ja
n-0
7
6-F
eb
-07
12
-Fe
b-0
7
18
-Fe
b-0
7
24
-Fe
b-0
7
2-M
ar-
07
8-M
ar-
07
D ate
12
14
16
18
20
22
24
26
28
30
Te
mp
era
ture
(ºC
)
30
40
50
60
70
80
90
Re
lati
ve
hu
mid
ity
(%
)
B
Daily temperature ºC Soil temperature ºC Relative humidity %
1-J
an
-08
7-J
an
-08
13
-Ja
n-0
8
19
-Ja
n-0
8
25
-Ja
n-0
8
31
-Ja
n-0
8
6-F
eb
-08
12
-Fe
b-0
8
18
-Fe
b-0
8
24
-Fe
b-0
8
1-M
ar-
08
7-M
ar-
08
D ate
12
14
16
18
20
22
24
26
28
30
Te
mp
era
ture
(ºC
)
30
40
50
60
70
80
90
Re
lati
ve
hu
mid
ity
(%
)
Figure 4.6 Average daily temperature, soil temperature and percentage relative humidity (calculated as the average of 24 hours) for the A. 2006/2007 and B. 2007/2008 ripening season respectively.
In conclusion, it appears that the 2006/2007 was a drier season pre-veraison since no
rainfall was observed early in the season although more frequent decreases in solar
radiation possibly indicates more regular cloudy weather conditions through the season
with higher rainfall just before harvest compared to the latter season. The 2007/2008
season appears to be a wetter season with rainfall distributed throughout ripening but with
less rainfall before harvest, which was also associated with higher temperatures.
4.3.2 PLOT DESCRIPTION
The soil water content of the different experimental plots measured with a neutron probe
(Figure 4.7A and B) did not reflect the irrigation treatments applied (Appendix B, Tables 1
and 2). Lateral water movement as well as differences in the water holding capacity of the
soils in different regions of the experimental site might be responsible for these conflicting
results. Therefore, instead of using the original plots, the plots were reclassified according
to field measurement of seasonal soil water content and pruning mass measurements to
ensure greater accuracy in multivariate analyses, and discussed accordingly (Table 4.2
and Appendix B, Table 3a and 3b). Due to an error in irrigation scheduling, plot Mw 3 and
Ld 1 received an unscheduled additional 44 litres water per dripper pre-veraison (11 Jan
07) in the 2006/2007 season (Appendix B, Table 1). This sudden increase in soil water can
be seen in Figure 4.7A. After this additional irrigation, the soil water content of plot Mw 3

84
and Ld 1 decreased, and plot Ld 1 remained the plot with the lowest soil moisture content
through the 2006/2007 and plot Ld 2 through the 2007/2008 season. Appendix B, Figure 1
shows the soil water content of the different experimental plots measured at 3 different
depths (30 cm; 60 cm; 90 cm). From this figure it appears that maximum differences were
in the 30 cm soil layer where the Ld 1 and Ld 2 plots were dryer than all the other plots
throughout both ripening seasons.
A
Total CR/3 1 (Hw 1) Total CR/3 A2 (Hw 2)
Total CR/3 3 (Mw 1) Total CR/3 8 (Mw 3) Total CR/3 A4 (Mw 2)
Total CR/3 A12 (Ld 1)
29
-De
c-0
6
5-J
an
-07
12
-Ja
n-0
7
18
-Ja
n-0
7
28
-Ja
n-0
7
7-F
eb
-07
16
-Fe
b-0
7
23
-Fe
b-0
7
9-M
ar-
07
16
-Ma
r-0
7
Date
0.36
0.38
0.40
0.42
0.44
0.46
0.48
0.50
0.52
0.54
0.56
0.58
0.60
0.62
0.64
Ne
utr
on
pro
be
co
un
t ra
tio
B
Tot CR/3 A9 (Hw 3) Tot CR/3 5 (Hw 4) Tot CR/3 3 (Hw 5)
Tot CR/3 A3 (Mw 4) Tot CR/3 8 (Mw 5)Tot CR/3 2 (Mw 6)
Tot CR/3 A12 (Ld 2)
3-J
an
-08
11
-Ja
n-0
8
17
-Ja
n-0
8
23
-Ja
n-0
8
1-F
eb
-08
12
-Fe
b-0
8
19
-Fe
b-0
8
27
-Fe
b-0
8
13
-Ma
r-0
8
20
-Ma
r-0
8
Date
0.36
0.38
0.40
0.42
0.44
0.46
0.48
0.50
0.52
0.54
0.56
0.58
0.60
0.62
0.64
Ne
utr
on
pro
be
co
un
t ra
tio
Figure 4.7 Neutron probe soil water content measurements (the sum of 3 soil depths measurements: 30, 60, 90 cm (count ratios) divided by 3 (CR/3)) for the A. 2006/2007 and B. 2007/2008 seasons respectively. Plots classified as high vigour, wet plots (Hw 1 to Hw 5); plots classified as medium vigour, wet plots (Mw 1 to Mw 6); plots classified as low vigour, dry plots (Ld 1 and Ld 2).
The PDWP of the experimental plots did not react linearly to their soil water content (Figure
4.7A, B and 4.8A, B) similar to findings by Jensen et al. (1998) and Carbonneau and
Deloire (2001) which found that PDWP is not reduced linearly with the reduction of water
availability. Ojeda et al. (2002) described intermediate levels of grapevine water deficit as
PDWP measurements from -0.4 to -0.6 MPa.

85
According to this classification none of the experimental vines experienced extended
periods of either severe or intermediate water stress in either season of the current study.
Except for plot Mw 1 which showed intermediate stress, with PDWP measurements
between 0.4 to 0.6 Mpa, on all three dates it was sampled in the 2006/2007 season (Figure
4.8A). Plot Hw 1 approached the intermediate water stress category on one of the
sampling dates. For the 2007/2008 season plot Mw 6, Hw 5 and Mw 5 approached the
intermediate water stress category on a post-veraison sampling date (Figure 4.8B).
Figure 4.8 Predawn plant water potential (PDWP) for the A. 2006/2007 and B. 2007/2008 ripening seasons respectively. Plots classified as high vigour wet plots (Hw 1 to Hw 5); plots classified as medium vigour wet plots (Mw 1 to Mw 6); plots classified as low vigour dry plots (Ld 1 and Ld 2).
A
PDWP 1 (Hw 1) PDWP A2 (Hw 2)
PDWP 3 (Mw 1) PDWP A4 (Mw 2) PDWP 8 (Mw 3)
PDWP A12 (Ld 1)
28-
Jan
-07
2-F
eb-0
7
7-F
eb-0
7
12-
Fe
b-0
7
17-
Fe
b-0
7
22-
Fe
b-0
7
27-
Fe
b-0
7
4-M
ar-0
7
Date
-0.6
-0.5
-0.4
-0.3
-0.2
-0.1
0.0
Pre
-da
wn
pla
nt w
ate
r p
ress
ure
(M
Pa)
B Scatterplot of multiple variables against Date
PDWP 2008 23v*35c
PDWP A9 (Hw 3) PDWP 5 (Hw 4) PDWP 3 (Hw 5)
PDWP A3 (Mw 4) PDWP 8 (Mw 5) PDWP 2 (Mw 6)
PDWP A12 (Ld 2)
13
-Ja
n-0
8
23
-Ja
n-0
8
2-F
eb
-08
12
-Fe
b-0
8
22
-Fe
b-0
8
3-M
ar-
08
13
-Ma
r-0
8
23
-Ma
r-0
8
Date
-0.6
-0.5
-0.4
-0.3
-0.2
-0.1
0.0
Pre
-da
wn
pla
nt
wa
ter
pre
ss
ure
(M
Pa
)

86
Table 4.2 Plot codes and description alterations.
2007 Original
plot codes
2007 Original plot classification and
treatments
2007 New description
according to soil moisture and pruning
mass measurements
2007 New plot code
2008 Original
plot codes
2008 Original plot classification and
treatments
2008 New description
according to soil moisture and pruning
mass measurements
2008 New plot code
1 High vigour dry land High vigour wet Hw 1 A9 High vigour irrigated High vigour wet Hw 3
A2 High vigour irrigated High wet Hw 2 5 High vigour dry land High vigour wet Hw 4
3 Medium vigour dry
land High vigour wet Hw 5
3 Medium vigour dry
land Medium vigour
wet Mw 1 A3
Medium vigour irrigated
Medium vigour wet
Mw 4
A4 Medium vigour
irrigated Medium wet Mw 2 8 Low vigour dry land
Medium vigour wet
Mw 5
8 Low vigour dry land Medium vigour
wet Mw 3 2 Low vigour dry land
Medium vigour wet
Mw 6
A12 Low vigour irrigated Low vigour dry Ld 1 A12 Low vigour irrigated Low vigour dry Ld 2
Multivariate analysis (PCA) was used to evaluate the variance between plots according to
vineyard variables for each season. A data matrix was constructed, for PCA analysis, with
experimental plots (and sub-plot samples as replicates) of the 2006/2007 season as
objects and the variables: average predawn measurement of season (pdwp); average
shoot diameter (~sh d); average internode length (int l); average number of shoots per vine
(# sh); average number of lateral shoots (# l sh); average shoot length ( sh l); average
lateral shoot length ( l sh); average fresh weight per berry (fw/b); average bunch mass
(bu/m); yield per vine at harvest (harv); average soil water content (cr/3); average pruning
mass per vine (pru/v).
The PCA analysis indicated that the model generated using the vineyard data
described only 47% of the variance using two principal components (not shown). After low
impact variables on the model, int l and #sh/v, were removed the model improved slightly,
describing 53% of the variance using two principal components (Figure 4.9B). Essentially,
the low variance in the data means that there was a high similarity between the plots in
terms of the selected variables. The variables with the highest loading on PC1 were
average PDWP for the season, average mass per bunch, fresh weight per berry and
average yield per vine at harvest. For PC2, a higher loading on PC2 was the average
number of internodes per shoot and shoot length for the season. These variables on PC1
and PC2 respectively are the variables which could potentially make the biggest
contribution in separating plots (Figure 4.9A, B).

87
Average PDWP, bunch mass and bunch mass per vine at harvest are described by PC
1 which separates Ld 1 and Mw 1 from the rest of the plots. Ld 1 and Mw 1 had lower
PDWP values, mass per bunch and bunch mass per vine at harvest. All the other plots did
not clearly discriminate from each other in this regard (Appendix B, Table 3a and 3b). PC 2
is defined by number of internodes, shoot length and partially by average shoot diameter.
Ld 1, Mw 2 and Mw 3 are separated by PC 2 because of their thinner, longer shoots with
more internodes. This result might be explained by shoot topping on most of the remaining
plots which resulted in about shorter and thicker shoots (Appendix B, Table 3a). The high
vigour plots appear to correlate with higher soil water content, pruning mass per vine and
pruning mass per shoot and these variables are partially described by PC1 and PC2.
However, the medium vigour plots Mw 2 and Mw 3 showed larger values of lateral shoot
length and number of lateral shoots.

88
A
B
Figure 4.9 PCA analysis to discriminate between plots based on vine measurements for the 2006/2007 season. A. Scores: high vigour wet plots (Hw 1; Hw 2; Hw 3); medium vigour wet plots (Mw 1; Mw 2; Mw 3), low vigour plot (Ld 1), (a, b, c and d; indicate the four replicates from sub–plots). Red circles indicate grouping between samples. B. Correlation loadings (X): average predawn measurement of season (pdwp); average shoot diameter with pruning (~sh d); average amount of shoots per vine (# sh); average number of later shoots per shoot (# l sh); average lateral shoot length (l sh); average fresh weight per berry (fw/b); average bunch mass (bu/m); average yield per vine at harvest (harv); average soil water content (cr/3); average pruning mass per vine (pru/v average number of internodes (#int); shoot length (sh l); average mass per shoot (m/sh).
A data matrix for PCA analysis was constructed for the 2007/2008 in a similar manner
to that for the previous season, but with an additional variable: average (PAR) light
infiltration into the bunch zone (E/s). As with the PCA analysis of the 2006/2007 season, a
poor model was generated, and the total variance described by two principal components

89
did not exceed 47% (model not shown). Removal of some of the poorly correlated
variables with PC 1 and 2, fw/b; #bu/v; #sh and harv, improved the model, giving a total
variance of 59% described (Figure 4.10B).
Higher loading weight variables on PC1 are PDWP, lateral shoot length, number of
internodes, number of lateral shoots and average shoot diameter. PC1 separates plot Mw
6 and Mw 5 which has low PDWP and the least amount of lateral shoots with the shortest
length (Table 3a). Higher loading weight variables on PC2 are soil water which has the
highest loading weight followed by bunch mass and light measurements. On PC2, Ld 2 had
the lowest soil water content and bunch mass, with all the other plots not clearly separated
on PC2 (Figure 4.10B and Appendix B, Table 3a and 3b). The high vigour plots Hw 3 and
Hw 4 appear to have higher values for internode length, pruning mass per vine and
average shoot mass while the medium vigour plots Mw 5 and Mw 6 appears to have longer
shoots.
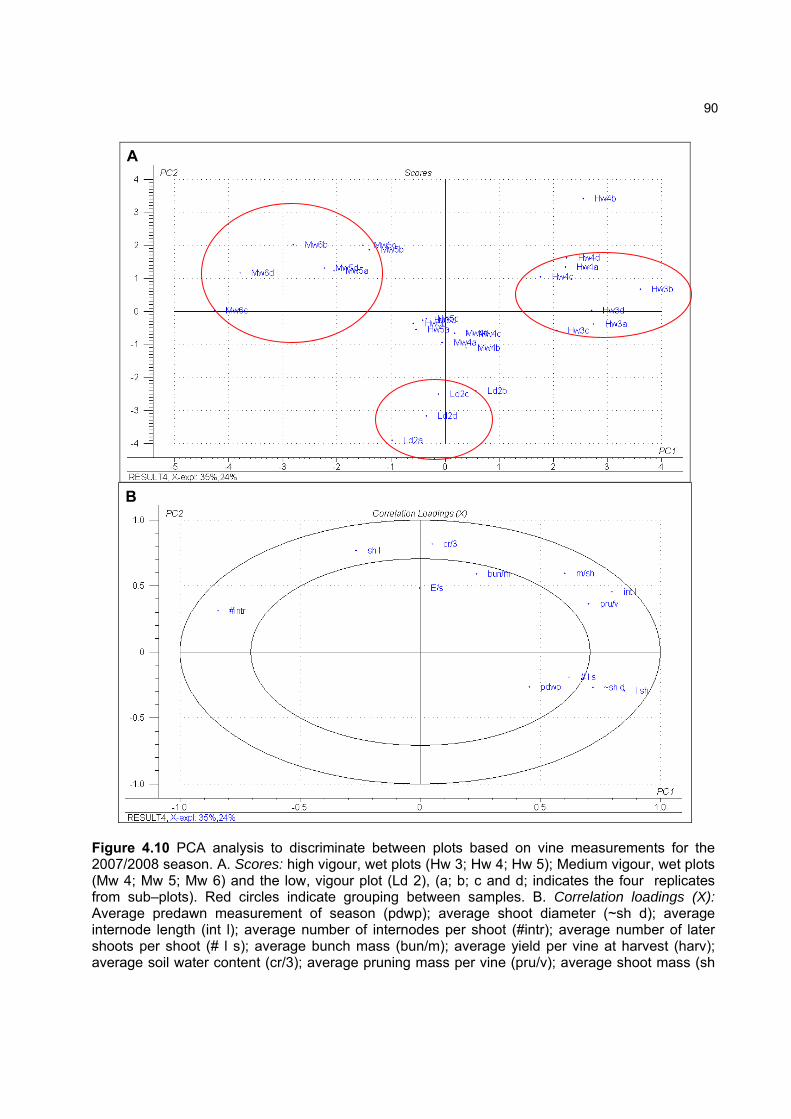
90
A
B
Figure 4.10 PCA analysis to discriminate between plots based on vine measurements for the 2007/2008 season. A. Scores: high vigour, wet plots (Hw 3; Hw 4; Hw 5); Medium vigour, wet plots (Mw 4; Mw 5; Mw 6) and the low, vigour plot (Ld 2), (a; b; c and d; indicates the four replicates from sub–plots). Red circles indicate grouping between samples. B. Correlation loadings (X): Average predawn measurement of season (pdwp); average shoot diameter (~sh d); average internode length (int l); average number of internodes per shoot (#intr); average number of later shoots per shoot (# l s); average bunch mass (bun/m); average yield per vine at harvest (harv); average soil water content (cr/3); average pruning mass per vine (pru/v); average shoot mass (sh
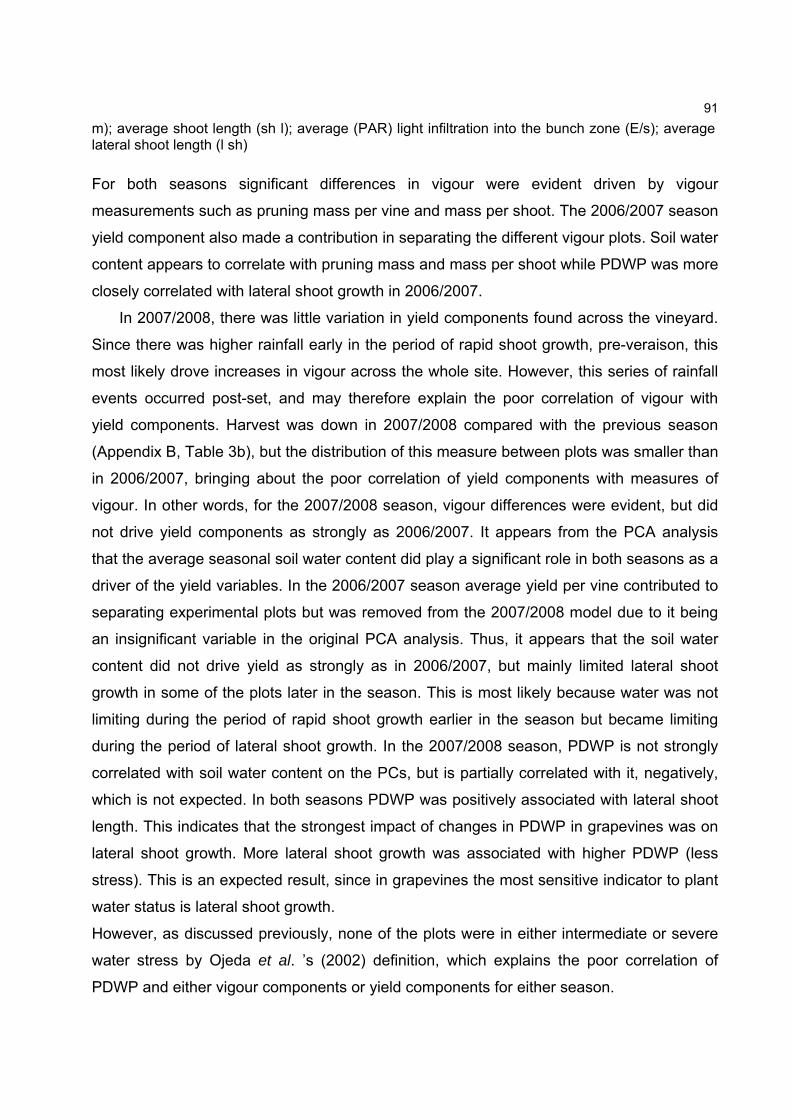
91
m); average shoot length (sh l); average (PAR) light infiltration into the bunch zone (E/s); average lateral shoot length (l sh)
For both seasons significant differences in vigour were evident driven by vigour
measurements such as pruning mass per vine and mass per shoot. The 2006/2007 season
yield component also made a contribution in separating the different vigour plots. Soil water
content appears to correlate with pruning mass and mass per shoot while PDWP was more
closely correlated with lateral shoot growth in 2006/2007.
In 2007/2008, there was little variation in yield components found across the vineyard.
Since there was higher rainfall early in the period of rapid shoot growth, pre-veraison, this
most likely drove increases in vigour across the whole site. However, this series of rainfall
events occurred post-set, and may therefore explain the poor correlation of vigour with
yield components. Harvest was down in 2007/2008 compared with the previous season
(Appendix B, Table 3b), but the distribution of this measure between plots was smaller than
in 2006/2007, bringing about the poor correlation of yield components with measures of
vigour. In other words, for the 2007/2008 season, vigour differences were evident, but did
not drive yield components as strongly as 2006/2007. It appears from the PCA analysis
that the average seasonal soil water content did play a significant role in both seasons as a
driver of the yield variables. In the 2006/2007 season average yield per vine contributed to
separating experimental plots but was removed from the 2007/2008 model due to it being
an insignificant variable in the original PCA analysis. Thus, it appears that the soil water
content did not drive yield as strongly as in 2006/2007, but mainly limited lateral shoot
growth in some of the plots later in the season. This is most likely because water was not
limiting during the period of rapid shoot growth earlier in the season but became limiting
during the period of lateral shoot growth. In the 2007/2008 season, PDWP is not strongly
correlated with soil water content on the PCs, but is partially correlated with it, negatively,
which is not expected. In both seasons PDWP was positively associated with lateral shoot
length. This indicates that the strongest impact of changes in PDWP in grapevines was on
lateral shoot growth. More lateral shoot growth was associated with higher PDWP (less
stress). This is an expected result, since in grapevines the most sensitive indicator to plant
water status is lateral shoot growth.
However, as discussed previously, none of the plots were in either intermediate or severe
water stress by Ojeda et al. ’s (2002) definition, which explains the poor correlation of
PDWP and either vigour components or yield components for either season.
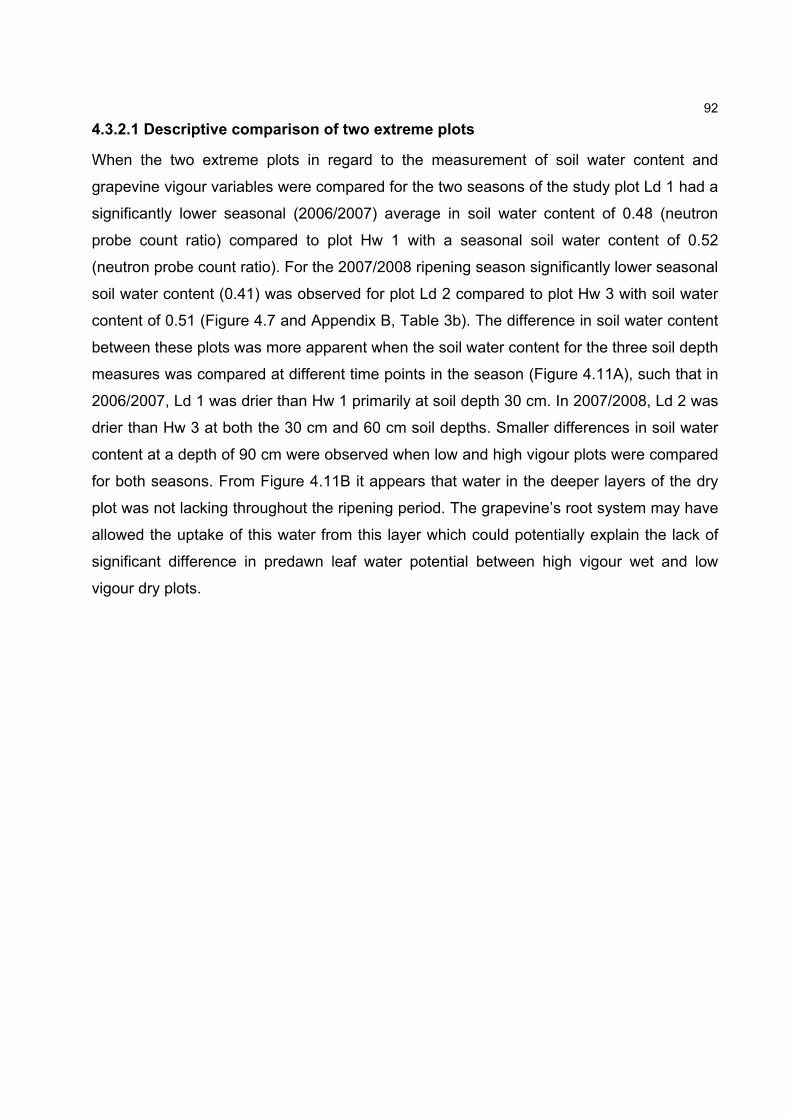
92
4.3.2.1 Descriptive comparison of two extreme plots
When the two extreme plots in regard to the measurement of soil water content and
grapevine vigour variables were compared for the two seasons of the study plot Ld 1 had a
significantly lower seasonal (2006/2007) average in soil water content of 0.48 (neutron
probe count ratio) compared to plot Hw 1 with a seasonal soil water content of 0.52
(neutron probe count ratio). For the 2007/2008 ripening season significantly lower seasonal
soil water content (0.41) was observed for plot Ld 2 compared to plot Hw 3 with soil water
content of 0.51 (Figure 4.7 and Appendix B, Table 3b). The difference in soil water content
between these plots was more apparent when the soil water content for the three soil depth
measures was compared at different time points in the season (Figure 4.11A), such that in
2006/2007, Ld 1 was drier than Hw 1 primarily at soil depth 30 cm. In 2007/2008, Ld 2 was
drier than Hw 3 at both the 30 cm and 60 cm soil depths. Smaller differences in soil water
content at a depth of 90 cm were observed when low and high vigour plots were compared
for both seasons. From Figure 4.11B it appears that water in the deeper layers of the dry
plot was not lacking throughout the ripening period. The grapevine’s root system may have
allowed the uptake of this water from this layer which could potentially explain the lack of
significant difference in predawn leaf water potential between high vigour wet and low
vigour dry plots.
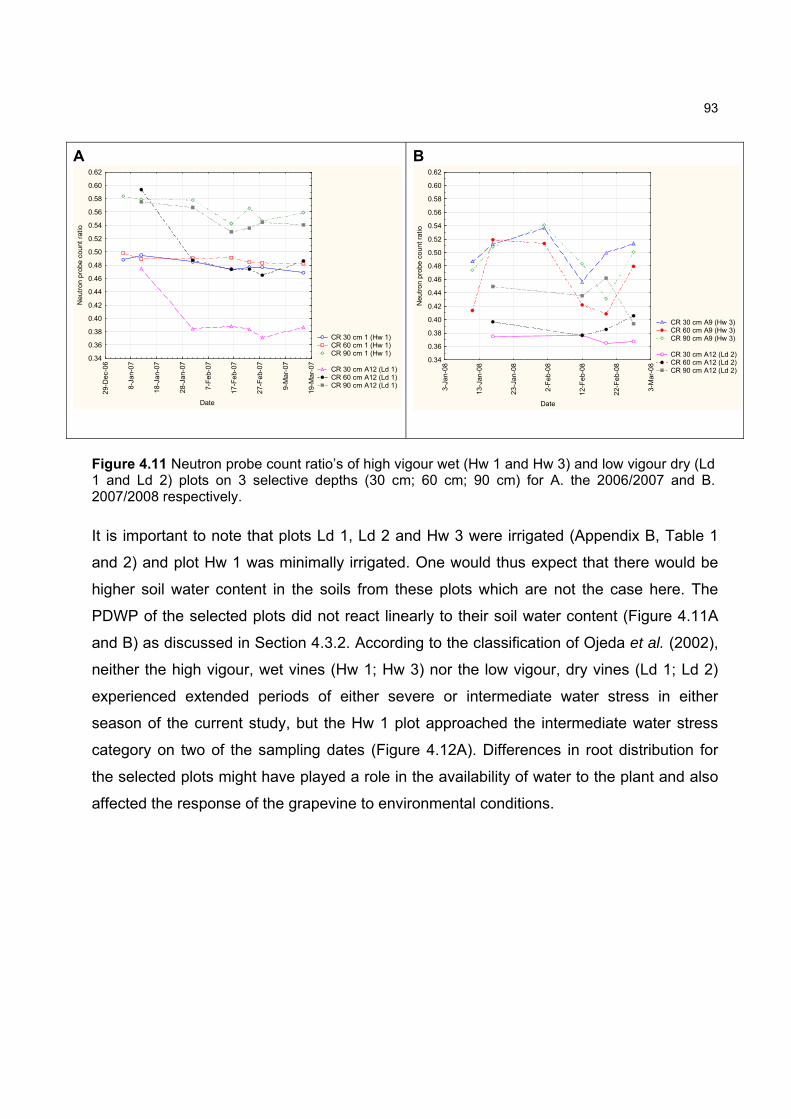
93
A
CR 30 cm 1 (Hw 1) CR 60 cm 1 (Hw 1) CR 90 cm 1 (Hw 1)
CR 30 cm A12 (Ld 1) CR 60 cm A12 (Ld 1) CR 90 cm A12 (Ld 1)
29
-De
c-0
6
8-J
an-
07
18-
Jan-
07
28-
Jan-
07
7-F
eb-
07
17-
Fe
b-07
27-
Fe
b-07
9-M
ar-
07
19-
Ma
r-07
Date
0.34
0.36
0.38
0.40
0.42
0.44
0.46
0.48
0.50
0.52
0.54
0.56
0.58
0.60
0.62
Ne
utro
n p
rob
e c
ou
nt r
atio
B
CR 30 cm A9 (Hw 3) CR 60 cm A9 (Hw 3) CR 90 cm A9 (Hw 3)
CR 30 cm A12 (Ld 2) CR 60 cm A12 (Ld 2) CR 90 cm A12 (Ld 2)
3-J
an
-08
13
-Ja
n-0
8
23
-Ja
n-0
8
2-F
eb
-08
12
-Fe
b-0
8
22
-Fe
b-0
8
3-M
ar-0
8
Date
0.34
0.36
0.38
0.40
0.42
0.44
0.46
0.48
0.50
0.52
0.54
0.56
0.58
0.60
0.62
Neu
tro
n pr
ob
e co
unt
ratio
Figure 4.11 Neutron probe count ratio’s of high vigour wet (Hw 1 and Hw 3) and low vigour dry (Ld 1 and Ld 2) plots on 3 selective depths (30 cm; 60 cm; 90 cm) for A. the 2006/2007 and B. 2007/2008 respectively.
It is important to note that plots Ld 1, Ld 2 and Hw 3 were irrigated (Appendix B, Table 1
and 2) and plot Hw 1 was minimally irrigated. One would thus expect that there would be
higher soil water content in the soils from these plots which are not the case here. The
PDWP of the selected plots did not react linearly to their soil water content (Figure 4.11A
and B) as discussed in Section 4.3.2. According to the classification of Ojeda et al. (2002),
neither the high vigour, wet vines (Hw 1; Hw 3) nor the low vigour, dry vines (Ld 1; Ld 2)
experienced extended periods of either severe or intermediate water stress in either
season of the current study, but the Hw 1 plot approached the intermediate water stress
category on two of the sampling dates (Figure 4.12A). Differences in root distribution for
the selected plots might have played a role in the availability of water to the plant and also
affected the response of the grapevine to environmental conditions.
94
A date*treatment; LS Means
Current effect: F(4, 40)=4.7055, p=.00331
Type III decomposition
Vertical bars denote 0.95 confidence intervals
PDWP 1 (Hw 1) PDWP A12 (Ld 1)
30
Ja
n 0
7
2 F
eb
07
16
Fe
b 0
7
23
Fe
b 0
7
2 M
ar
07
date
-0.6
-0.5
-0.4
-0.3
-0.2
-0.1
0.0
Pre
-da
wn
pla
nt
wa
ter
pre
ss
ure
(M
Pa
)
B Date*treat; LS Means
Current effect: F(6, 55)=21.353, p=.00000
Type III decomposition
Vertical bars denote 0.95 confidence intervals
PDWP A9 (Hw 3) PDWP A12 (Ld 2)
24
Ja
n 0
8
21
Ja
n 0
8
7 F
en
08
14
Fe
b 0
8
21
Fe
b 0
8
29
Fe
b 0
8
19
Ma
r 0
8
Date
-0.6
-0.5
-0.4
-0.3
-0.2
-0.1
0.0
Pre
-da
wn
pla
nt
wa
ter
pre
ss
ure
(M
Pa
)
Figure 4.12 Predawn plant water pressure (PDWP) of selected high vigour wet (Hw 1 and Hw 3) and low vigour dry plots (Ld 1 and Ld 2) for the A. 2006/2007 and B. 2007/2008 season respectively.
Plot Ld 1 had a pruning mass of 0.63 kg per vine which is significantly lower than the high
vigour plot Hw 1 with a pruning mass of 1.01 kg in the 2006/2007 season. In the 2007/2008
season the low vigour plot Ld 2 had a pruning mass of 0.95 kg per vine compared to the
significantly higher pruning mass of the high vigour plot Hw 3 of 1.31 kg per vine. Plots Ld
1 and Hw 1 in the 2006/2007 season and Ld 2 and Hw 3 in the 2007/2008 season showed
significant differences in vigour and total soil water content throughout the ripening period.
Therefore, these plots were selected to explore the influence of vigour differences and soil
water content on pigment development and other ripening parameters in berries of two
extremes: high vigour, wet and low vigour, dry plots. Differences in grapevine water status
were absent as indicated by changes in PDWP.
4.3.2.2 Descriptive comparison of ripening parameters in two extreme plots
The weight, volume and soluble solids of grape berries from the selected extreme plots are
shown in figure 4.13. It is evident from figure 4.13a that the total soluble solids were
decreased “diluted” only at one sample stage post-veraison (7 to 15 February 07) for plot
Hw 1. This increase in berry size correlated with a large amount of rain more than 15 mm
for the first time in the season and little irrigation before hand (Appendix B, Table 1).
However, berry weight did not linearly correlate with the berry volume for the low vigour
plot for one sample post veraison just before harvest in the 2006/2007 season which
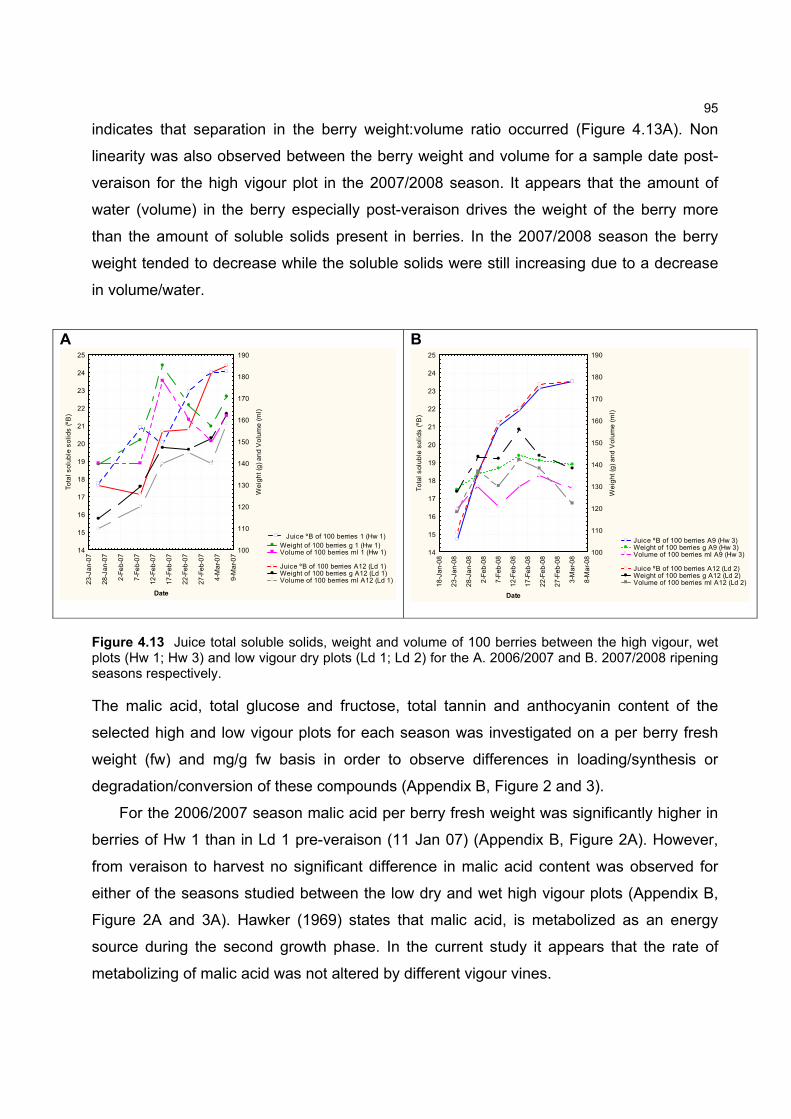
95
indicates that separation in the berry weight:volume ratio occurred (Figure 4.13A). Non
linearity was also observed between the berry weight and volume for a sample date post-
veraison for the high vigour plot in the 2007/2008 season. It appears that the amount of
water (volume) in the berry especially post-veraison drives the weight of the berry more
than the amount of soluble solids present in berries. In the 2007/2008 season the berry
weight tended to decrease while the soluble solids were still increasing due to a decrease
in volume/water.
A
Juice ºB of 100 berries 1 (Hw 1) Weight of 100 berries g 1 (Hw 1) Volume of 100 berries ml 1 (Hw 1)
Juice ºB of 100 berries A12 (Ld 1) Weight of 100 berries g A12 (Ld 1) Volume of 100 berries ml A12 (Ld 1)2
3-J
an
-07
28
-Ja
n-0
7
2-F
eb
-07
7-F
eb
-07
12
-Fe
b-0
7
17
-Fe
b-0
7
22
-Fe
b-0
7
27
-Fe
b-0
7
4-M
ar-
07
9-M
ar-
07
Date
14
15
16
17
18
19
20
21
22
23
24
25
To
tal
so
lub
le s
oli
ds
(ºB
)
100
110
120
130
140
150
160
170
180
190
We
igh
t (g
) a
nd
Vo
lum
e (
ml)
B
Juice ºB of 100 berries A9 (Hw 3) Weight of 100 berries g A9 (Hw 3) Volume of 100 berries ml A9 (Hw 3)
Juice ºB of 100 berries A12 (Ld 2) Weight of 100 berries g A12 (Ld 2) Volume of 100 berries ml A12 (Ld 2)1
8-J
an
-08
23
-Ja
n-0
8
28
-Ja
n-0
8
2-F
eb
-08
7-F
eb
-08
12
-Fe
b-0
8
17
-Fe
b-0
8
22
-Fe
b-0
8
27
-Fe
b-0
8
3-M
ar-
08
8-M
ar-
08
Date
14
15
16
17
18
19
20
21
22
23
24
25
To
tal
so
lub
le s
oli
ds
(ºB
)
100
110
120
130
140
150
160
170
180
190
We
igh
t (g
) a
nd
Vo
lum
e (
ml)
Figure 4.13 Juice total soluble solids, weight and volume of 100 berries between the high vigour, wet plots (Hw 1; Hw 3) and low vigour dry plots (Ld 1; Ld 2) for the A. 2006/2007 and B. 2007/2008 ripening seasons respectively.
The malic acid, total glucose and fructose, total tannin and anthocyanin content of the
selected high and low vigour plots for each season was investigated on a per berry fresh
weight (fw) and mg/g fw basis in order to observe differences in loading/synthesis or
degradation/conversion of these compounds (Appendix B, Figure 2 and 3).
For the 2006/2007 season malic acid per berry fresh weight was significantly higher in
berries of Hw 1 than in Ld 1 pre-veraison (11 Jan 07) (Appendix B, Figure 2A). However,
from veraison to harvest no significant difference in malic acid content was observed for
either of the seasons studied between the low dry and wet high vigour plots (Appendix B,
Figure 2A and 3A). Hawker (1969) states that malic acid, is metabolized as an energy
source during the second growth phase. In the current study it appears that the rate of
metabolizing of malic acid was not altered by different vigour vines.

96
For both seasons the high vigour wet plots showed a significantly higher per berry fw
content of total glucose and fructose post-veraison (8 Feb 07, 21 Feb 08) compared to the
low vigour dry plots although no difference between berries were observed at harvest.
However, for the 2006/2007 season, berries of Hw 1 reached their maximum total glucose
and fructose concentration immediately post-veraison while the total glucose and fructose
concentration per berry for berries from plot Ld 1 continued to increase until harvest
(Appendix B, Figure 2B). For both seasons the high vigour wet plot berries reached their
final total glucose and fructose concentration earlier than the low vigour plots, and then
stabilised (Appendix B, Figure 4B). Although, in the 2007/2008 season, unlike the
2006/2007 season, berries from the Ld 2 plot stabilised at a maximum in total hexose
sugars post-veraison (31 Jan 08). Wang et al. (2003) found that sugar unloading in berries
is inhibited in ripening berries during water deficiency stress. But as already discussed in
this section, water was not limiting in these grapevines. Rather, it is possible that a
reduction in the leaf area:crop load ratio caused a delay in sugar accumulation in the lower
vigour vines (Bindon 2008 a, b).
Total tannin per berry fw was significantly lower in plot Ld 1 post-veraison (8 Feb 07)
compared to plot Hw 1 (Appendix B, Figure 2C). The total pericarp tannin content in the
berries of both plots decreased post-veraison with no significant differences observed at
harvest. Total tannin was lower post-veraison (31 Jan 08), in the berries of plot Ld 2, but
increased to significantly higher concentration (mg/berry fw) post-veraison (21 Feb 08)
compared to the berries of the high vigour wet plot (Hw 3) (Appendix B, Figure 3C). It
seems that the increase of tannin for the berries of the Ld 2 plot was triggered later (from
31 Jan 08 to 21 Feb 08) although to higher levels, compared to the Hw 3 plot. After 21 Feb
08, both plots showed decreases in extractable tannin towards harvest with no differences
evident by harvest (Appendix B, Figure 3C). Since this study is one of few which have
reported viticultural data using the methyl cellulose precipitate (MCP) method of Sarneckis
et al. (2006), the increase in tannin post-veraison is difficult to interpret in the light of other
studies. Randomisation of the samples during analysis meant that differences in extraction
conditions or the method itself would have been detected, and as such, the observed
increase in MCP tannin was accurate.
The total anthocyanin concentration per berry fw from plot Ld 1 increased significantly
from non detected pre-veraison (11 Jan 07) to harvest (7 Mar 07) while berries from plot
Hw 1 only showed significant increases until shortly post-veraison (8 Feb 07) (Appendix B,
97
Figure 2D). However, no significant differences in total anthocyanin content per berry fw
were observed between plots Ld 1 and Hw 1 through ripening. Comparing concentrations
of berries from the high vigour plot and low vigour plot no significant differences on a mg/g
basis for any of the respective ripening stages were observed in either the 2006/2007 or
2007/2008 season. These results can be explained by the PDWP data which indicated that
none of the experimental vines experienced water stress. Thus the soil water effect did not
transfer through to give alterations in berry weight that were highly significant.
From the results in this descriptive comparison of two extreme plots representing
differences in grapevine vigour it is evident that the vigour and the soil water conditions in
this study did not significantly alter ripeness parameters on a per berry fw basis at harvest.
The most apparent alteration between the plots was the rate of sugar loading measured as
hexoses per berry.
98
4.3.3 EFFECT OF VIGOUR AND SOIL WATER CONTENT ON THE CAROTENOID AND
CHLOROPHYLL CONTENT OF GRAPES
Based on the plot description and comparisons detailed in section 4.3.2, a guideline for the
interpretation of pigment profile analytical data in grapes was generated. For this section of
the chapter, a general PCA analysis of grape pigments at different ripeness stages and
from different plots will be discussed. Based on the results of section 4.3.2, a poor
separation in plot characteristics was achieved using PCA analysis. As a result of this
limitation in the study, a descriptive comparison of the pigment analysis of the two extreme
plots will also be discussed.
4.3.3.1 PCA analysis of pigment profiles in grapes from all plots
PCA analysis was conducted to evaluate differences, if any, in the carotenoid pigment
profile, chlorophylls and other ripening parameters expressed as content per berry fw. In
other words, PCA analysis was used to evaluate any clustering of ripening parameters
(data not shown), carotenoid and chlorophyll data according to variation in the
experimental plots.
A data matrix was constructed for PCA analysis with grape samples of each plot as
objects and the individual carotenoids and chlorophylls in µg per berry fresh weight at
different ripening stages of the 2006/2007 season (pre-veraison 11 Jan 07; veraison 26
Jan 07; post-veraison 8 Feb 07; harvest 7 Mar 07) as variables.
High loading weights for the variables on PC1 are all the individual carotenoids and
chlorophylls (total chlorophyll and chlorophyll a) except for the carotenoid 5,8-epoxy--
carotene and chlorophyll b (Figure 4.14B and Appendix B, Table 5). PC2 describes 5,8-
epoxy--carotene as high loading variable. The model describes 78% of the total variance
in the data when two PCs are used. The PCA analysis indicates a high level of correlation
between all pigments with the exception of 5,8-epoxy--carotene. The results indicate that
the strongest driver within the data was changes in the variables following the progression
in ripening with no clustering of data according to experimental plots. The observed trend
was higher amounts of chlorophyll a, β-carotene and cis-β-carotene pre-veraison, all of
which decreased with increasing ripeness. Conversely, the carotenoid 5,8-epoxy--
carotene had higher concentrations per berry in later ripening stages with the highest
content post-veraison 8 Feb 07 (Figure 4.14).

99
A
B
Figure 4.14 PCA analyses of carotenoid and chlorophyll per µg/berry fresh weight. A. Scores: high vigour wet plots (Hw 1;Hw 2); medium vigour wet plots (Mw 1; Mw 2; Mw 3) and low vigour plot (Ld 1), (a; b; c and d; indicates the four replicates from sub-plots) of four ripening stages during the 2006/2007 season: pre-veraison 11 Jan 07 (1); veraison 26 Jan 07 (2); post-veraison 8 Feb 07) (3); harvest 7 Mar 07 (4). B. X-loadings: 5,8-epoxy--carotene (ep-B); lutein (lut); β-carotene (B-car); chlorophyll a (chl a); cis- β-carotene (cis-B); zeaxanthin (zea); chlorophyll b (chl b); Total carotenoids (T car); Total chlorophyll (T chl).
The same multivariate analysis was conducted on the 2007/2008 season ripening
parameters (data not shown), carotenoid and chlorophyll data (Figure 4.14).

100
Similar results were obtained as for the 2006/2007 season with the high loading variables
on PC1 being all the individual carotenoids and chlorophylls except 5,8-epoxy--carotene
and differently to the 2006/2007 season, zeaxanthin. PC2 describes 5,8-epoxy--carotene,
and zeaxanthin as loading variables. The PCA analysis shows the progression in ripening
with higher amounts of most of the carotenoids and chlorophylls pre-veraison and
decreases in these components with ripening. Again, no clustering was observed
according to experimental plots. Zeaxanthin had higher concentrations earlier in the
ripening season, while 5,8-epoxy--carotene, had higher concentration per berry in the
later stages of ripening, with the highest content post-veraison (21 Feb 08) (Figure 4.14
and Appendix B, Table 6.
A
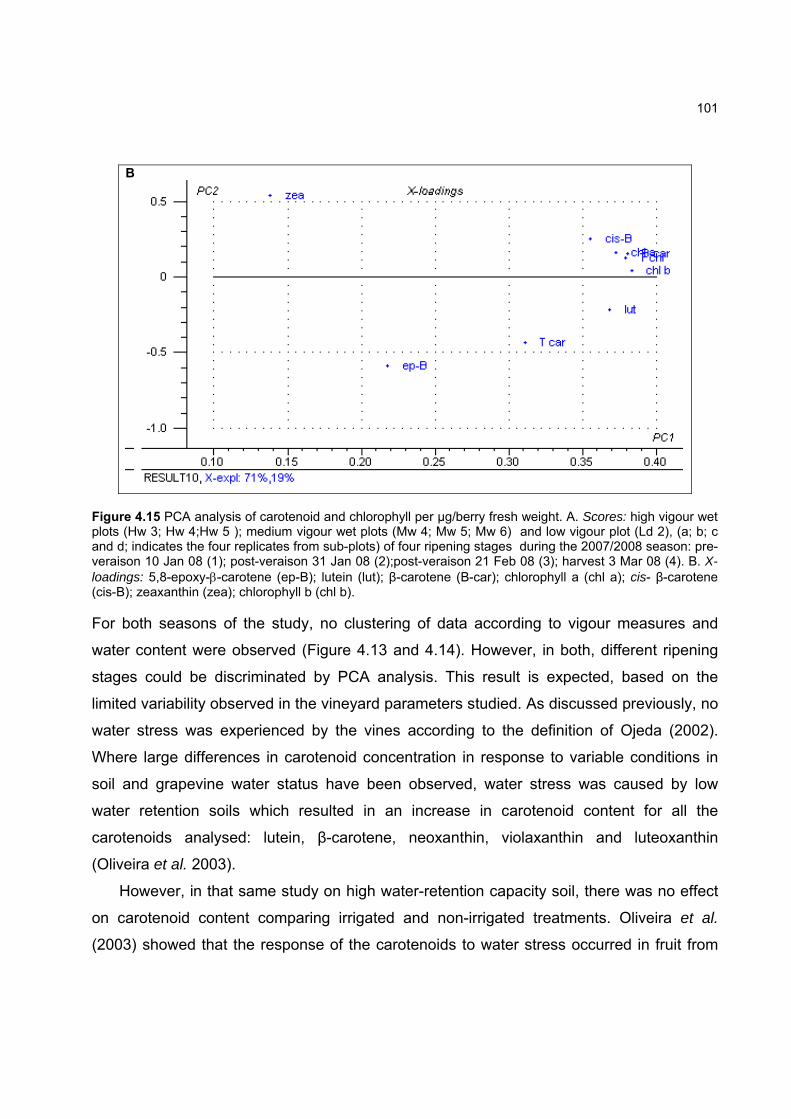
101
B
Figure 4.15 PCA analysis of carotenoid and chlorophyll per µg/berry fresh weight. A. Scores: high vigour wet plots (Hw 3; Hw 4;Hw 5 ); medium vigour wet plots (Mw 4; Mw 5; Mw 6) and low vigour plot (Ld 2), (a; b; c and d; indicates the four replicates from sub-plots) of four ripening stages during the 2007/2008 season: pre-veraison 10 Jan 08 (1); post-veraison 31 Jan 08 (2);post-veraison 21 Feb 08 (3); harvest 3 Mar 08 (4). B. X-loadings: 5,8-epoxy--carotene (ep-B); lutein (lut); β-carotene (B-car); chlorophyll a (chl a); cis- β-carotene (cis-B); zeaxanthin (zea); chlorophyll b (chl b). For both seasons of the study, no clustering of data according to vigour measures and
water content were observed (Figure 4.13 and 4.14). However, in both, different ripening
stages could be discriminated by PCA analysis. This result is expected, based on the
limited variability observed in the vineyard parameters studied. As discussed previously, no
water stress was experienced by the vines according to the definition of Ojeda (2002).
Where large differences in carotenoid concentration in response to variable conditions in
soil and grapevine water status have been observed, water stress was caused by low
water retention soils which resulted in an increase in carotenoid content for all the
carotenoids analysed: lutein, β-carotene, neoxanthin, violaxanthin and luteoxanthin
(Oliveira et al. 2003).
However, in that same study on high water-retention capacity soil, there was no effect
on carotenoid content comparing irrigated and non-irrigated treatments. Oliveira et al.
(2003) showed that the response of the carotenoids to water stress occurred in fruit from
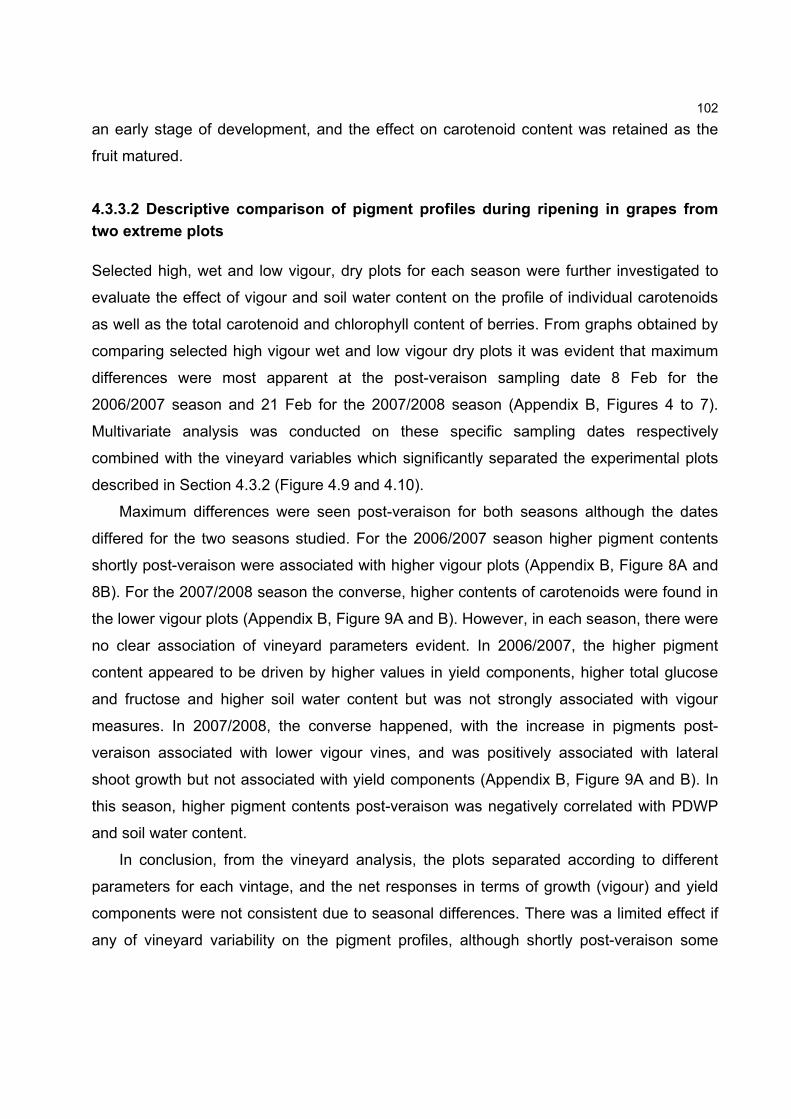
102
an early stage of development, and the effect on carotenoid content was retained as the
fruit matured.
4.3.3.2 Descriptive comparison of pigment profiles during ripening in grapes from
two extreme plots
Selected high, wet and low vigour, dry plots for each season were further investigated to
evaluate the effect of vigour and soil water content on the profile of individual carotenoids
as well as the total carotenoid and chlorophyll content of berries. From graphs obtained by
comparing selected high vigour wet and low vigour dry plots it was evident that maximum
differences were most apparent at the post-veraison sampling date 8 Feb for the
2006/2007 season and 21 Feb for the 2007/2008 season (Appendix B, Figures 4 to 7).
Multivariate analysis was conducted on these specific sampling dates respectively
combined with the vineyard variables which significantly separated the experimental plots
described in Section 4.3.2 (Figure 4.9 and 4.10).
Maximum differences were seen post-veraison for both seasons although the dates
differed for the two seasons studied. For the 2006/2007 season higher pigment contents
shortly post-veraison were associated with higher vigour plots (Appendix B, Figure 8A and
8B). For the 2007/2008 season the converse, higher contents of carotenoids were found in
the lower vigour plots (Appendix B, Figure 9A and B). However, in each season, there were
no clear association of vineyard parameters evident. In 2006/2007, the higher pigment
content appeared to be driven by higher values in yield components, higher total glucose
and fructose and higher soil water content but was not strongly associated with vigour
measures. In 2007/2008, the converse happened, with the increase in pigments post-
veraison associated with lower vigour vines, and was positively associated with lateral
shoot growth but not associated with yield components (Appendix B, Figure 9A and B). In
this season, higher pigment contents post-veraison was negatively correlated with PDWP
and soil water content.
In conclusion, from the vineyard analysis, the plots separated according to different
parameters for each vintage, and the net responses in terms of growth (vigour) and yield
components were not consistent due to seasonal differences. There was a limited effect if
any of vineyard variability on the pigment profiles, although shortly post-veraison some

103
differences could be observed, but these appeared to be associated with the timing of
carotenoid and chlorophyll degradation since levels were similar by harvest.
4.3.3.3 Changes in ripening parameters carotenoid and chlorophyll content during
ripening
From the PCA analysis shown in section 4.3.3.1 it is evident that the ripeness stage was
responsible for driving most of the variation in the data, describing more than 78% of the
variation in the data. Significant differences at harvest between the two ripening seasons
are shown in Table 4.3.
Table 4.3 Significant differences of individual and total carotenoids, chlorophylls and ripening parameters at harvest for the 2006/2007 and 2007/2008 seasons.
Date Maturation
stage Zea Lut
ep- β-car
β-car Cis β-car
Total Car
Chl a Chl b Total Chl
Malic acid
Tot (Glucose
+ Fructose)
Total Tannin
Total Anthocyanin
**Average ug/berry fresh weight **Average mg/berry fresh weight
7-Mar-07 harvest 0.01a 1.55a 0.28a 0.62a 0.05a 2.61a 11.74a 2.50a 16.13a 0.85a 148.77a 0.95a 21.15a
3-Mar-08 harvest 0.03b 1.72b 1.55b 0.62a 0.08b 4.49b 9.02b 3.84b 13.26b 2.74b 146.66a 0.70b 18.42a
**Average (Ave) calculated from all experimental plots including their four biological replicates and three analytical replicates for each season respectively. Carotenoids: Zeaxanthin (Zea); Lutein (Lut); 5,8-epoxy--carotene (ep-β-car); β-carotene (β-car); cis β-carotene (cis β-car); Total carotenoids (Total car) calculated as the sum of all detected carotenoid like compounds. Chlorophylls: Chlorophyll a (Chl a); Chlorophyll b (Chl b); Total chlorophyll (Tot chl) calculated as the sum of all chlorophylls and detected chlorophyll derivatives. Significant differences: indicated with ab when not bearing the same letter indicating significant difference with p ≤ 0.05 between seasons.
Individual ripening parameters, carotenoids and chlorophylls determined on a per berry
basis were investigated for both ripening seasons studied, with reference to the possible
effect of climatic variation between seasons. It is important to take note that the dates
indicated on the graphs Figure 4.16 - 4.19 do not represent the same ripening stages for
both seasons.
Malic acid decreased significantly from pre-veraison to harvest on a per berry basis in
both seasons (2006/2007 and 2007/2008) (Figure 4.16). Hawker (1969) stated that malic
acid, is metabolized as an energy source during the second growth phase. A significant
difference at harvest were observed when the two seasons were compared with 0.85
mg/berry malic acid for the 2006/2007 season compared to the 2.74 mg/berry malic acid at
harvest for the berries of the 2007/2008 season (Table 4.3). Ruffner et al. (1976) reported
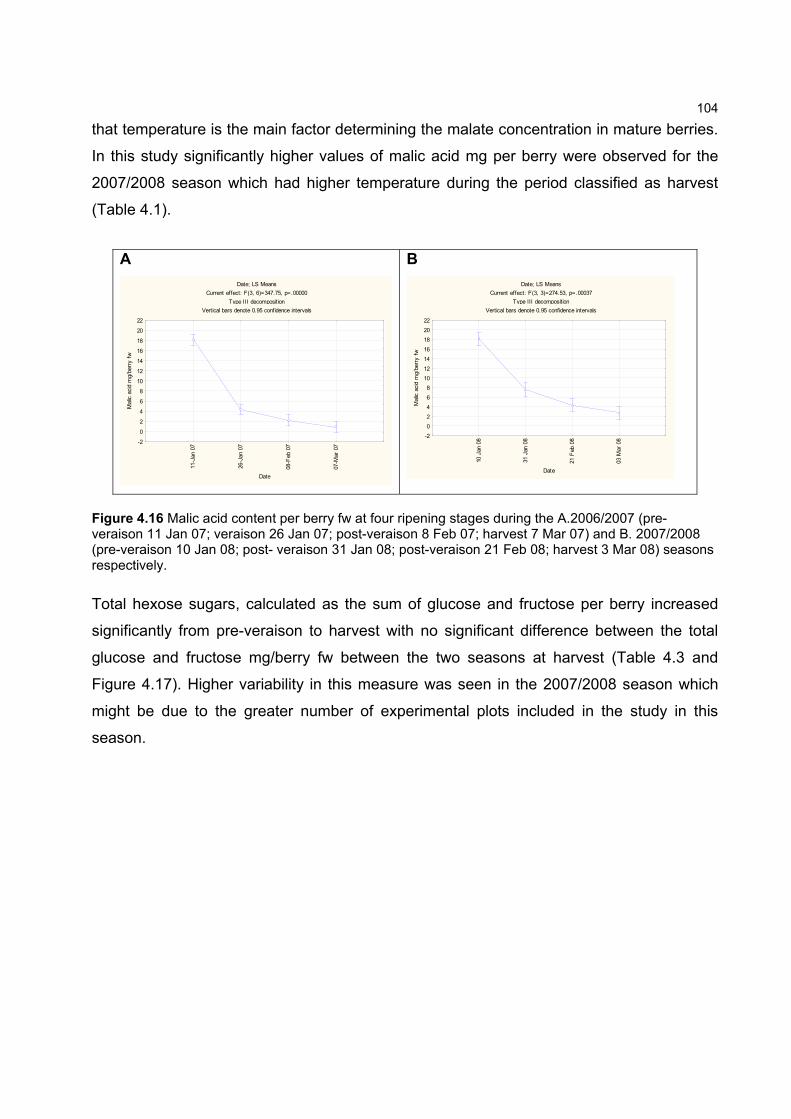
104
that temperature is the main factor determining the malate concentration in mature berries.
In this study significantly higher values of malic acid mg per berry were observed for the
2007/2008 season which had higher temperature during the period classified as harvest
(Table 4.1).
A
Date; LS Means
Current effect: F(3, 6)=347.75, p=.00000
Type III decomposition
Vertical bars denote 0.95 confidence intervals
11-J
an 0
7
26-J
an 0
7
08-F
eb 0
7
07-M
ar 0
7
Date
-2
0
2
4
6
8
10
12
14
16
18
20
22
Mal
ic a
cid
mg/
berr
y fw
B
Date; LS Means
Current effect: F(3, 3)=274.53, p=.00037
Type III decomposition
Vertical bars denote 0.95 confidence intervals
10 J
an 0
8
31 J
an 0
8
21 F
eb 0
8
03 M
ar 0
8
Date
-2
0
2
4
6
8
10
12
14
16
18
20
22
Mal
ic a
cid
mg/
berr
y fw
Figure 4.16 Malic acid content per berry fw at four ripening stages during the A.2006/2007 (pre-veraison 11 Jan 07; veraison 26 Jan 07; post-veraison 8 Feb 07; harvest 7 Mar 07) and B. 2007/2008 (pre-veraison 10 Jan 08; post- veraison 31 Jan 08; post-veraison 21 Feb 08; harvest 3 Mar 08) seasons respectively.
Total hexose sugars, calculated as the sum of glucose and fructose per berry increased
significantly from pre-veraison to harvest with no significant difference between the total
glucose and fructose mg/berry fw between the two seasons at harvest (Table 4.3 and
Figure 4.17). Higher variability in this measure was seen in the 2007/2008 season which
might be due to the greater number of experimental plots included in the study in this
season.
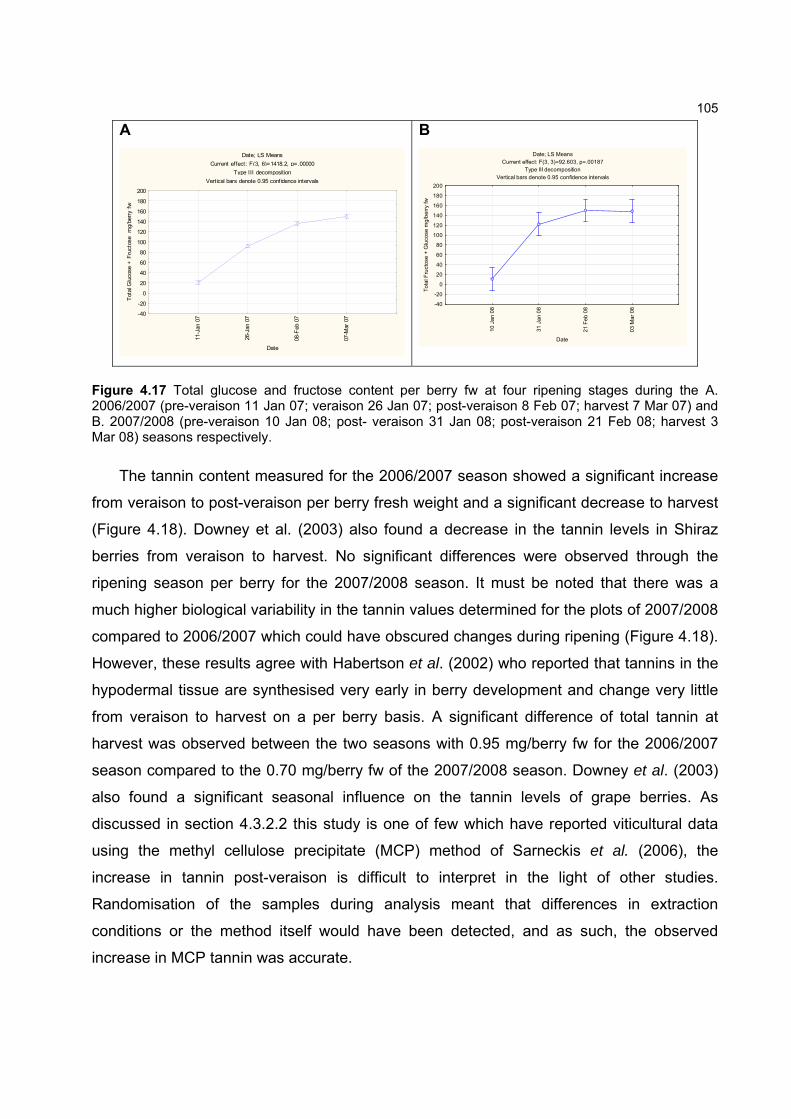
105
A
Date; LS Means
Current effect: F(3, 6)=1418.2, p=.00000
Type III decomposition
Vertical bars denote 0.95 confidence intervals
11-J
an 0
7
26-J
an 0
7
08-F
eb 0
7
07-M
ar 0
7Date
-40
-20
0
20
40
60
80
100
120
140
160
180
200
Tot
al G
luco
se +
Fru
ctos
e m
g/be
rry
fwB
Date; LS MeansCurrent effect: F(3, 3)=92.603, p=.00187
Type III decompositionVertical bars denote 0.95 confidence intervals
10 J
an 0
8
31 J
an 0
8
21 F
eb
08
03
Ma
r 08
Date
-40
-20
0
20
40
60
80
100
120
140
160
180
200
To
tal F
ruct
ose
+ G
luco
se m
g/b
erry
fw
Figure 4.17 Total glucose and fructose content per berry fw at four ripening stages during the A. 2006/2007 (pre-veraison 11 Jan 07; veraison 26 Jan 07; post-veraison 8 Feb 07; harvest 7 Mar 07) and B. 2007/2008 (pre-veraison 10 Jan 08; post- veraison 31 Jan 08; post-veraison 21 Feb 08; harvest 3 Mar 08) seasons respectively. The tannin content measured for the 2006/2007 season showed a significant increase
from veraison to post-veraison per berry fresh weight and a significant decrease to harvest
(Figure 4.18). Downey et al. (2003) also found a decrease in the tannin levels in Shiraz
berries from veraison to harvest. No significant differences were observed through the
ripening season per berry for the 2007/2008 season. It must be noted that there was a
much higher biological variability in the tannin values determined for the plots of 2007/2008
compared to 2006/2007 which could have obscured changes during ripening (Figure 4.18).
However, these results agree with Habertson et al. (2002) who reported that tannins in the
hypodermal tissue are synthesised very early in berry development and change very little
from veraison to harvest on a per berry basis. A significant difference of total tannin at
harvest was observed between the two seasons with 0.95 mg/berry fw for the 2006/2007
season compared to the 0.70 mg/berry fw of the 2007/2008 season. Downey et al. (2003)
also found a significant seasonal influence on the tannin levels of grape berries. As
discussed in section 4.3.2.2 this study is one of few which have reported viticultural data
using the methyl cellulose precipitate (MCP) method of Sarneckis et al. (2006), the
increase in tannin post-veraison is difficult to interpret in the light of other studies.
Randomisation of the samples during analysis meant that differences in extraction
conditions or the method itself would have been detected, and as such, the observed
increase in MCP tannin was accurate.
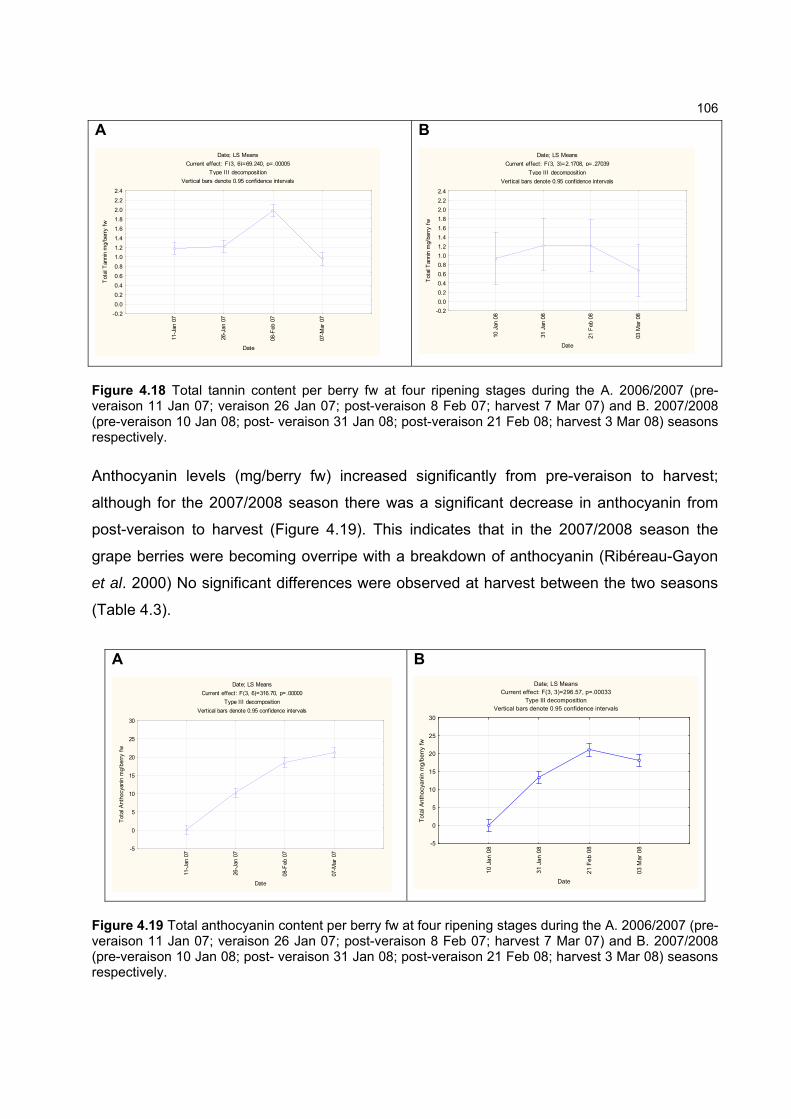
106
A
Date; LS Means
Current effect: F(3, 6)=69.240, p=.00005
Type III decomposition
Vertical bars denote 0.95 confidence intervals11
-Jan
07
26-J
an 0
7
08-F
eb 0
7
07-M
ar 0
7
Date
-0.2
0.0
0.2
0.4
0.6
0.8
1.0
1.2
1.4
1.6
1.8
2.0
2.2
2.4
Tot
al T
anni
n m
g/be
rry
fw
B
Date; LS Means
Current effect: F(3, 3)=2.1708, p=.27039
Type III decomposition
Vertical bars denote 0.95 confidence intervals
10 J
an 0
8
31 J
an 0
8
21 F
eb 0
8
03 M
ar 0
8
Date
-0.2
0.0
0.2
0.4
0.6
0.8
1.0
1.2
1.4
1.6
1.8
2.0
2.2
2.4
Tot
al T
anni
n m
g/be
rry
fw
Figure 4.18 Total tannin content per berry fw at four ripening stages during the A. 2006/2007 (pre-veraison 11 Jan 07; veraison 26 Jan 07; post-veraison 8 Feb 07; harvest 7 Mar 07) and B. 2007/2008 (pre-veraison 10 Jan 08; post- veraison 31 Jan 08; post-veraison 21 Feb 08; harvest 3 Mar 08) seasons respectively. Anthocyanin levels (mg/berry fw) increased significantly from pre-veraison to harvest;
although for the 2007/2008 season there was a significant decrease in anthocyanin from
post-veraison to harvest (Figure 4.19). This indicates that in the 2007/2008 season the
grape berries were becoming overripe with a breakdown of anthocyanin (Ribéreau-Gayon
et al. 2000) No significant differences were observed at harvest between the two seasons
(Table 4.3).
A
Date; LS Means
Current effect: F(3, 6)=316.70, p=.00000
Type III decomposition
Vertical bars denote 0.95 confidence intervals
11-J
an 0
7
26-J
an 0
7
08-F
eb 0
7
07-M
ar 0
7
Date
-5
0
5
10
15
20
25
30
Tot
al A
ntho
cyan
in m
g/be
rry
fw
B Date; LS Means
Current effect: F(3, 3)=296.57, p=.00033Type III decomposition
Vertical bars denote 0.95 confidence intervals
10
Ja
n 0
8
31
Ja
n 0
8
21
Fe
b 0
8
03
Ma
r 0
8
Date
-5
0
5
10
15
20
25
30
Tot
al A
nth
ocy
an
in m
g/b
err
y fw
Figure 4.19 Total anthocyanin content per berry fw at four ripening stages during the A. 2006/2007 (pre-veraison 11 Jan 07; veraison 26 Jan 07; post-veraison 8 Feb 07; harvest 7 Mar 07) and B. 2007/2008 (pre-veraison 10 Jan 08; post- veraison 31 Jan 08; post-veraison 21 Feb 08; harvest 3 Mar 08) seasons respectively.

107
It appears that the tannin and malic acid content of berries were more sensitive to the
influence of the different climatic conditions between the two seasons studied. With more
malic acid present in the berries of the 2007/2008 ripening season which was a wetter
season with more frequent rain and higher temperatures closer to harvest. On the other
hand higher concentrations of tannin were observed for the 2006/2007 ripening season
which was a dryer season pre-veraison with large amounts of rain close to harvest.
Regarding the carotenoid content for the seasons studied, the carotenoid zeaxanthin was
present in very small amounts in grape berries and degraded as ripening progressed. Pre-
veraison zeaxanthin was present in berries at levels of 0.15 to 0.3 µg/berry fw and
decreased to negligible amounts to 0.050 µg/berry at harvest (Appendix B, Figure 10A).
Significant differences were observed at harvest between the two seasons studied with an
average value of 0.01 µg/berry for the 2006/2007 season while the 2007/2008 had an
average value of 0.03 µg/berry fw (Table 4.3).
5,8-Epoxy--carotene, an oxidation product of -carotene, accumulated from pre-
veraison to post-veraison where after it decreased as ripening progressed. 5,8-Epoxy--
carotene behaved differently to most of the other carotenoids and chlorophylls which
decreased from earlier in the season until harvest. This carotenoid appears to be very
sensitive to climatic differences. The grape berries from the 2007/2008 season contained
(1.55 µg/berry) five times more 5,8-epoxy--carotene compared to the berries of the
2006/2007 (0.28 µg/berry) season at harvest (Appendix B, Figure 10B). 5,8-Epoxy--
carotene represents approximately 30% of the total concentration of carotenoids per berry
fw in the 2007/2008 season at harvest. In the 2006/2007 season only 12% of the total
carotenoid concentration was presented by 5,8-epoxy--carotene at harvest. This
compound has been detected previously by Mendes-Pinto et al. (2004) as an unknown
compound in grape extracts from cvs. Tinta Barroca, Touriga Francesa and Tinta Roriz but
has not been quantified.
Lutein, a well know carotenoid present in grape berries showed an increase in the first
part of the ripening (pre-veraison to post-veraison) season starting at levels of 1.6 to 2.6
µg/berry pre-veraison, peaking at 2 to 3 µg/berry and decreasing to 1.0 to 1.8 µg/berry at
harvest (Appendix B, Figure 10C). The 2006/2007 season had significantly lower levels of
lutein (1.55 µg/berry fw) compared to the 2007/2008 season average of 1.72 µg/berry at

108
harvest. Similar amounts of lutein in grape berries were found by De Pinho et al. (2001).
Razungles et al. (1988, 1996) found a decrease in lutein content of berries from veraison to
harvest.
β-carotene appears to be less sensitive to differences in climatic conditions since no
significant differences in β-carotene per berry fw were observed at harvest between the
two seasons studied (Table 4.3). No significant increases of β-carotene concentration per
berry fresh weight were observed during the ripening seasons but significant decreases
were evident from post-veraison to harvest as found by Razungles et al. (1988, 1996). At
harvest an average β-carotene concentration of 0.62 µg/berry fw was found for the Merlot
berries for both seasons studied. Similar concentrations of β-carotene were also found by
De Pinho et al. (2001) in grape berries.
The cis-isomer of β-carotene was present in approximately ten times smaller quantities
per berry fw at harvest than β-carotene. Cis β-carotene showed significantly different
concentrations per berry fw at harvest between the two seasons studied. Grape berries
from the 2006/2007 season contained 0.05 µg/berry fw cis β-carotene while the latter
season’s berries contained an average value of 0.08 µg/berry fw. Cis-isomers of β-
carotene have been reported in grapes previously although it is still uncertain if they are an
artefact of sample preparation and analysis (Mendes-Pinto 2004).
β-carotene and lutein were the most common carotenoids found in mature Merlot
berries representing more than 80% of the total portion of carotenoids analysed per berry
fresh weight in the 2006/2007 season. This is in agreement with what other researchers
have found (Baumes et al. 2002; Marais et al. 1990, Oliveira et al. 2004; Razungles et al.
1988, 1998). However in the 2007/2008 season β-carotene and lutein represented only
approximately 50% of the total carotenoids at harvest because of the high contribution of
5,8-epoxy--carotene.
The total carotenoid levels for the 2007/2008 season (4.49 µg/berry) at harvest was
almost double the content found for the 2006/2007 season (2.61 µg/berry) (Table 4.3). This
result is mainly due to the significant increase of 5,8-epoxy--carotene in the 2007/2008
season.
One would expect a decrease in total carotenoids in the 2007/2008 season because of
the higher temperature during the harvest period which might have favoured degradation of
carotenoids, but this was not the case. However Rodriguez-Amaya et al. (2008) stated that

109
warmer temperatures and greater exposure to sunlight increase cartenogenesis (synthesis
of carotenoids), but may also promote carotenoid photo-degradation. It was found from
studies in Brazil that papayas, cherries and mangoes of the same cultivars produced in hot
regions contained distinctly higher carotenoid concentrations than those in temperate
climates (Rodriguez-Amaya et al. 2008).
Although no significant difference in the amount of rainfall between the seasons was
measured it is evident from figure 4.13 that small amounts of rain fell more frequently in the
2007/2008 ripening season compared to the 2006/2007 season. For the 2006/2007
ripening season more frequent decreases in solar radiation was evident which might be
due to more cloudy weather conditions (Figure 4.5). Düring and Davtyan (2002) showed in
their work that the xanthophyll pool size decreased for both cultivars Kerner and
Portugieser during a rain period. It was suggested that the xanthophyll pool size adjusted
according to the ambient conditions.
Moreover, Demmig-Adams et al. (1996) discussed in his review the time scale in which
reactions in the xantophyll cycle takes place and it varied from a few minutes (de-
epoxidation) to hours (epoxidation) in response to various environmental conditions. Thus
the environmental conditions under which grape samples were collected might have had
an effect on the carotenoid content of the berries which were analysed.
Chlorophyll a (sum of chlorophyll a and pheophytin a), was found to be the most
abundant pigment present in Merlot grape berries throughout the ripening season.
However significant decreases could be observed from post-veraison to harvest (Appendix
B, Figure 11A). Pre-veraison, chlorophyll a was present in concentrations of 20 to 30
µg/berry and degraded towards harvest to 0.6 to 10 µg/berry (Appendix B, Figure 11A).
Significant differences between the chlorophyll a content for the berries from the 2006/2007
(11.74 µg/berry) and 2007/2008 (9.02 µg/berry) seasons were observed. The chlorophyll a
concentrations found in this study was 60 times more compared to chlorophyll a
concentrations reported by Oliveira et al. (2003) in berries of cv. Touriga Nacional. These
large differences can be explained by cultivar and terroir differences as well as the fact that
in the current study chlorophyll a concentration was determined by sum of chlorophyll a
and its derivatives. This was performed because it was shown that chlorophyll a is
degraded by low pH of berries during extraction, as discussed in Chapter 3.
Chlorophyll b (sum of chlorophyll b, pheophytin b and pyropheophytin b) was present in
berries in the beginning of the season at values of 5 to 8 µg/berry and degraded to 1 to 3
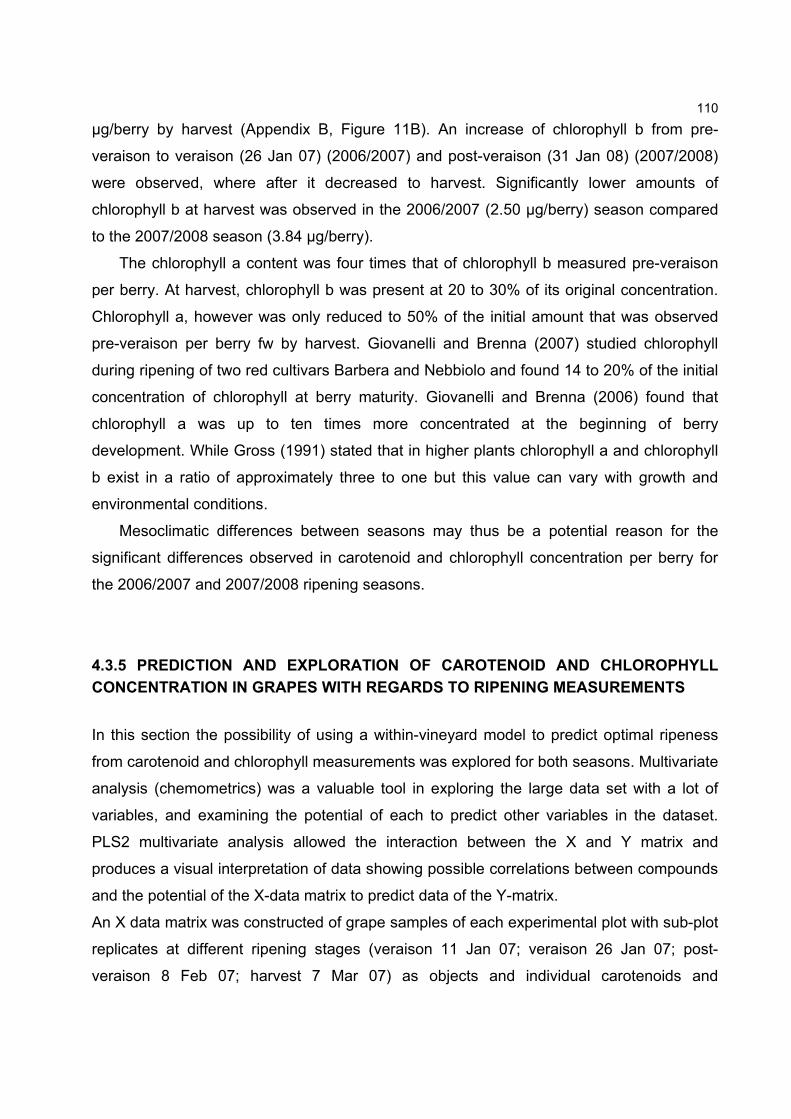
110
µg/berry by harvest (Appendix B, Figure 11B). An increase of chlorophyll b from pre-
veraison to veraison (26 Jan 07) (2006/2007) and post-veraison (31 Jan 08) (2007/2008)
were observed, where after it decreased to harvest. Significantly lower amounts of
chlorophyll b at harvest was observed in the 2006/2007 (2.50 µg/berry) season compared
to the 2007/2008 season (3.84 µg/berry).
The chlorophyll a content was four times that of chlorophyll b measured pre-veraison
per berry. At harvest, chlorophyll b was present at 20 to 30% of its original concentration.
Chlorophyll a, however was only reduced to 50% of the initial amount that was observed
pre-veraison per berry fw by harvest. Giovanelli and Brenna (2007) studied chlorophyll
during ripening of two red cultivars Barbera and Nebbiolo and found 14 to 20% of the initial
concentration of chlorophyll at berry maturity. Giovanelli and Brenna (2006) found that
chlorophyll a was up to ten times more concentrated at the beginning of berry
development. While Gross (1991) stated that in higher plants chlorophyll a and chlorophyll
b exist in a ratio of approximately three to one but this value can vary with growth and
environmental conditions.
Mesoclimatic differences between seasons may thus be a potential reason for the
significant differences observed in carotenoid and chlorophyll concentration per berry for
the 2006/2007 and 2007/2008 ripening seasons.
4.3.5 PREDICTION AND EXPLORATION OF CAROTENOID AND CHLOROPHYLL
CONCENTRATION IN GRAPES WITH REGARDS TO RIPENING MEASUREMENTS
In this section the possibility of using a within-vineyard model to predict optimal ripeness
from carotenoid and chlorophyll measurements was explored for both seasons. Multivariate
analysis (chemometrics) was a valuable tool in exploring the large data set with a lot of
variables, and examining the potential of each to predict other variables in the dataset.
PLS2 multivariate analysis allowed the interaction between the X and Y matrix and
produces a visual interpretation of data showing possible correlations between compounds
and the potential of the X-data matrix to predict data of the Y-matrix.
An X data matrix was constructed of grape samples of each experimental plot with sub-plot
replicates at different ripening stages (veraison 11 Jan 07; veraison 26 Jan 07; post-
veraison 8 Feb 07; harvest 7 Mar 07) as objects and individual carotenoids and
111
chlorophylls per berry fresh weight as variables. The Y-data matrix consisted of grape
samples of each plot with sub-plot replicates at the same ripening stages as for the X-
matrix as objects and the ripening parameters (total glucose and fructose, malic acid, total
tannin and total anthocyanin) as variables. Two outliers on PC 3 were removed from the
model for the 2006/2007 season (sample replicate 2 and 3 of plot Mw 2 post-veraison).
The PLS2 model using PC 1 and PC 2 explain 86% of the variance of the X matrix
(chlorophyll and carotenoid data) data and 61% of the Y matrix (ripening parameters) data
for the 2006/2007 model (Figure 4.15). This model shows good potential to predict ripening
parameters over time with a correlation of 0.84 in Merlot berries per berry fresh weight for
the 2006/2007 season.
A B
C D
Figure 4.15 Preliminary model for the prediction of ripening parameters per berry fresh weight from chlorophyll and carotenoid content per berry for the 2006/2007 season. A. Scores: 1 (pre-veraison, 11 Jan 07); 2 (veraison, 26 Jan 07); 3 (post-veraison, 8 Feb 07); 4 (harvest, 7 Mar 07). B. X and Y loadings weights: 5,8-epoxy--carotene (ep-B); lutein (lut); β-carotene (B-car); chlorophyll a (chl a); cis- β-carotene (cis-B); zeaxanthin (zea); chlorophyll b (chl b); anthocyanin (anth); Total tannin (tann); Total glucose and fructose (g+f); malic acid (malic). C. Residual Validation Variance. D. Predicted Y.

112
A similar ripening model to the 2006/2007 season model was constructed for the
2007/2008 season. PC 1 and PC 2 explain 90% of the X matrix variance (carotenoid and
chlorophyll data) and 48% of the Y matrix (ripening parameters) variance (Figure 4.16).
The model shows potential similar to the 2006/2007 season to predict ripening parameters
over time with a correlation of 0.84 in Merlot berries per berry fresh weight.
A B
C D
Figure 4.16 Preliminary model for the prediction of ripening parameters per berry fresh weight from chlorophyll and carotenoid content per berry for the 2008 season. A. Scores: 1 (pre-veraison, 10 Jan 08); 2 (post-veraison, 31 Jan 08); 3 (post-veraison, 21 Feb 08); 4 (harvest, 3 Mar 08). B. X and Y loading weights: 5,8-epoxy--carotene (ep-B); lutein (lut); β-carotene (B-car); chlorophyll a (chl a); cis- β-carotene (cis-B); zeaxanthin (zea); chlorophyll b (chl b); Total carotenoids (T car); Total; chlorophyll (T chl); anthocyanin (anth); Total tannin (tann); Total glucose and fructose (g+f); malic acid (malic). C. Residual Validation Variance. D. Predicted Y.
These results thus indicate the great potential of carotenoids and chlorophylls to be used
in the future to predict optimal ripeness. However a lot of research is still necessary to
elucidate on the application of such models.
Moreover, correlations between individual carotenoids, chlorophylls and ripening
parameters determined as content per berry fw were evaluated by normal regression
113
statistics which showed only a few significant (r≥0.5) correlations (Appendix B, Table 10
and 11). Zeaxanthin showed for both seasons a positive correlation with malic acid with r
values of 0.5 and negative correlations with total glucose and fructose and anthocyanin
with r values greater than -0.6 for the 2006/2007 season and -0.5 for the 2007/2008
season respectively. However, from the preliminary prediction models (Figure 4.15 and
4.16) it appears that the profile of carotenoids and chlorophylls in berries together describe
(predict) the concentrations of ripening parameters through ripening without strong
correlations between individual compounds. For these results to take application in the
industry a suitable device to accurately and non-destructively measure the carotenoid and
chlorophyll content of berries will be needed.
Research by Kolb et al. (2006) indicated that chlorophyll fluorescence measurements
are well-suited to determine non-invasively sugar accumulation in white grape berries cv.
Bacchus and Silvaner. Furthermore, Agati et al. (2008) showed that a chlorophyll
fluorescence imaging method based on pigment screening of excitation is able to
determine the distribution of anthocyanin in whole grape bunches. These studies show the
potential of using chlorophyll fluorescence measurements to predict ripening. Furthermore
such measurements coupled with chemometric analysis can generate valuable visual
interpretations of the relation of pigment data with ripening variables. For example Le
Moinge et al. (2008) showed in his study, that front face fluorescence spectroscopy and
visible spectroscopy coupled with chemometrics has the potential to characterise ripening
of Cabernet Franc grapes. Pereira et al. (2006) showed by using 1H NMR spectroscopy
together with chemometric data analyses that vintage effects on grape metabolic profiles
prevail over soil effects.
Another technique to measure pigments is near infrared spectroscopy (NIR). Research
has shown that NIR-FT-Raman (near infrared fourier transform) spectroscopy can give a
sensitive detection of the individual carotenoids by Raman Resonance in the visible region
(Withnall et al. 2003; Veronelli et al. 1995). Raman is a spectroscopic technique used in
condensed matter physics and chemistry to study the vibration, rotation, and other low-
frequency modes in a system (Gardiner 1989). FT-Raman spectroscopy can also gives a
strong enhancement of carotenoids due to the known pre-resonance effects. In addition the
disturbing fluorescence effect of biological material usually observed when laser excitation
is performed in the visible wavelength range can be avoided (Ozaki et al. 1992). Strong
bands of carotenoids are observed in the Raman spectrum within the 1500-1550 and 1150-

114
1170 cm-1 range due to in-phase C=C and C-C stretching vibrations of the polyene chain
(Withnall et al. 2003; Veronelli et al. 1995). It has been found that FT-Raman spectroscopy
can be successfully applied for the identification of carotenoids directly in the plant tissue
without any preliminary sample preparation. Furthermore, FT-Raman mapping is able to
show the location of carotenoids in the surface layer of the plant tissue and perform semi-
quantitative measurements of these carotenoids (Schultz et al. 2005).
4.4 CONCLUSION
This study confirmed that in general carotenoids and chlorophylls decrease on a per berry
(µg/berry) and concentration (µg/g) basis from veraison to harvest. However this study also
found that vigour differences might have an effect on the rate of synthesis/degradation of
carotenoids, chlorophylls and some other ripening parameters (malic acid, total glucose
and fructose, total tannin and total anthocyanin from pre-veraison (pea size) to harvest in
berries on a per berry basis not necessarily causing significant differences in content at
harvest. The effect of soil water content, and other field variables influenced by this
measure on carotenoids, chlorophylls and ripeness parameters were not significant in this
study because of high soil water capacity of lower soil layers which prevented significant
differences in water deficits. 5,8-Epoxy--carotene was quantified for the first time in
grapes and represents a significant amount of total carotenoids at harvest. All the
carotenoids and chlorophylls except -carotene seemed to be sensitive to annual climate
condition differences. Lutein and β-carotene were found to be the most abundant
carotenoids present in Merlot grape berries together with chlorophyll a for both seasons
studied. The values of these carotenoids also correlated well with previous research.
However, chlorophyll a was found in much larger quantities in Merlot berries compared to
previous research. This is possibly because in this study the chlorophyll degradation
products where included in the calculation of chlorophyll a.
Multivariate analysis showed promising preliminary prediction models (with correlation
values of above 0.8 for both seasons analysed) for the prediction of the concentration of
ripeness parameters (glucose, fructose, malic acid, total tannins and anthocyanins) with
carotenoids and chlorophyll content. This result highlights the opportunity for the
development of a rapid non-destructive method to measure carotenoids and chlorophylls in

115
berries which in turn can predict optimal ripeness. Furthermore since carotenoids are the
precursors to C13-norisoprenoid aroma compounds in wine a preview of the potential
contribution of these aromas to wine might be evaluated. Further research is necessary to
investigate the possibility of building and validating such models.
4.5 LITERATURE CITED
Agati, G, Meyer, S., Matteini, P., Cerovic, Z.G., Assessment of Anthocyanins in Grape (Vitis vinifera L.) Berries Using a Non-invasive Chlorophyll Fluorescence Method. J. Agric. Food Chem. 2007, 55, 1053-1061.
Agati, G., Traversi, M.L.; Cerovic, Z.G., Chlorophyll Fluorescence Imaging for the Non-invasive Assessment of Anthocyanin in Whole Grape ( Vitis vinifera L.) Bunches. Photochem. Photobiol. 2008, 84, 1431-1434.
Asrar, G., Fuchs, M., Kanemasu, E.T., Hatfield, J.L., Estimating absorbed photosynthetic radiation and leaf area index from spectral reflectance in wheat. Agronomy J. 1984, 300-306.
Baldy, R., Baldy, M., De Benedicts, J., Granett, J., Osborn, B., Blendsoe, A., Bosch, D., Hlavka, C., Johnson, L., Weber, E., Assessment of leaf area, vine vigour, and grape yield and quality of phylloxera infested and non-invested grapevines in Napa County and their relationship to leaf reflectance, chlorophyll, and mineral content. Final report: NASA/Ames Research Centre Joint Research Interchange, NCC2-5062. 1996a.
Baranska, M., Schutze, W., Schulz, H., Determination of Lycopene and β-carotene Content in Tamato Fruits and Related Products: Compariston of FT-Raman, ATR-IR, and NIR Spectroscopy. Anal. Chem. 2006, 78, 8456-8461.
Baumes, R., Wirth, J., Bureau, S., Gunata, Y., Razungles, A. Bio-generation of C13-norisoprenoid compounds:experiments supportive for an apo-carotenoid pathway in grapevines. Anal. Chim. Acta. 2002, 458, 3-14.
Bindon, K., Influence of Partial Root zone Drying on Aspects of Grape and Wine Quality. The University of Adelaide. 2004, Chapter 9, 182-204.
Bindon, K., Dry, P.R., Loveys, B.R., Influence of Plant Water Status on the Production of C13-Norisoprenoids Precursors in Vitis vinifera L. Cv. Cabernet Sauvignon Grape Berries. J. Agric. Food Chem. 2007, 55, 4493-4500
Bindon, K.A., Dry, P.R., Loveys, B.R., The Interactive Effect of Pruning Level and Irrigation Strategy on Water Use Efficiency of Vitis vinifera L. cv. Shiraz. S. Afr. J. Enol. Vitic. 2008a, 29, 2, 59-70.
Bindon, K.A., Dry, P.R., Loveys, B.R., The Interactive Effect of Pruning Level and Irrigation Strategy
on Grape Berry Ripening and Composition in Vitis vinifera L. cv. Shiraz. S. Afr. J. Enol. Vitic. 2008b, 29, 2, 71-78.
116
Bureau, S.M., Razungles, A.J., Baumes, R.L., Bayonove, C.L., Effect of qualitative modification of light on the carotenoid contents in Vitis vinifera L. cv. Syrah berries. Sci. Aliment. 1998, 18, 485-495.
Bureau, S., Baumes, R., Razungles, A., Effects of vine or bunch shading on the glycosylated flavor precursors of Vitis vinifera L. cv. Syrah. J. Agric. Food Chem. 2000, 48, 1290-1297.
Carbonneau, A., Deloire, A., Plant organization based on source-sink relationships: New findings on developmental, biochemical and molecular responses to environment. In: Molecular Biology and Biotechnology of the Grapevine. K.A. Roubelakis-Angelakis (Ed.), pp. 263-268. Kluwer Academic, Dordrecht, Netherlands. 2001.
Daughtry, C.S.T., Gailo, K.P., Goward, S.N., Prince, S.D., Kustas, W. P. Spectral estimates of absorbed radiation and phytomass production in corn and soybean canopies. Rem. Sen. Env. 1992, 39, 141-152.
Davey, M.W., Saeys, W., Hof, E.; Ramon, H., Swennen, R.L., Keulemans, J., Application of Visible and Near-Infrared Reflectance Spectroscopy (Vis/NIRS) to Determine Carotenoid Content in Banana (Musa spp.) Fruit Pulp. J. Agric. Food Chem. 2009, 57, 1742-1751.
De Pinho, P.G., Ferreira, A.C.S., Pinto, M.M., Benitez J.G., Hogg, T.A., Determination of Carotenoid Profiles in Grapes, Musts and Fortified Wines from Douro Varieties of Vitis Vinifera. J. Agric. Food Chem. 2001, 49, 5484-5488.
Demmig-Adams, B., Gilmore, A.M., Adams, W.W., Carotenoids 3: In vivo function of carotenoids in higher plants. FASEB J. 1996, 10, 403-412.
Downey, M.O., Harvey, J.S., Robinson, S.P., Analysis of tannins in seeds and skins of Shiraz grapes throughout berry development. Aust. J. Grape Wine Res. 2003, 9:15-27.
Düring, H., Davtyan, A., Development changes of primary processes of photosynthesis in sun- and shade-adapted berries of two grapevine cultivars. Vitis. 2002, 2, 63-67.
Etievant, P.X., Volatile compounds in food and beverages. Wine, 1991, In Henks Maarse (Ed.), Zeist, Netherlands: TNO-CIVO Food Analysis Institute.
Gitelson, A.A., Merzlyak, M.N., Non-destructive assessment of chlorophyll, carotenoids and anthocyanin content in higher plant leaves: Principles and algorithms. Presented at the workshop "Remote Sensing for Agriculture and the Environment", Organization for Economic operation and Development (OECD), Kiffisia, Greece, 17-20 September 2002.
Giovanelli, G., Brenna, O.V., Evolution of some phenolic components, carotenoids and chlorophylls
during ripening of three Italian grape varieties. Eur. Food Res. Technol. 2007, 225, 145-150. Gross, J., Pigments in Vegetables: Chlorophylls and Carotenoids. New York: Van Nostrand Reinhold, 1991.

117
Guth, H., Quantitation and sensory studies of character impact odorants of different white wine varieties. J. Agric. Food Chem. 1997, 45, 3027-3032.
Habertson, J.F., Kennedy, J.A., Adams, D.O., Tannin in skins and seeds of Cabernet Sauvignon, Syrah and Pinot noir berries during ripening. Am. J. Enol. Vitic. 2002, 53, 54-59.
Hawker, J.S., Changes in the activities of malic enzyme, malic dehydrogenase, phosphopyruvate carboxylase and pyruvate decarboxulase during the development of non-climacteric fruit (the grape). Phytochem. 1969, 8, 19-23.
Iland, P.G., Cynkar, W., Williams, P.J., Coombe, B.G., Optimisation of methods for the
determination of total and red free glycoslyl-glucos in black grape berries of Vitis vinifera. Austr. J. Grape Wine Res. 2000, 2,171-178.
Jensen, C.R., Mogensen, V.O., Pousen, H.H., Henson, S., I.E., Aagot, S., Hansen, E., Ali, A.., Wollunweber, B., Soil water matrix potential rather than water content determines drought responses in field-grown lupin (Lupisnus angustifolius). Aust. J. Plant. Physiol. 1998, 25, 353-363.
Johnson, L.F., Lobitz, B., Armstrong, R., Baldy, R., Weber, E., De Benedictis, J, Bosch, D.F. Airborne imaging aids vineyard canopy evaluation. Calif. Agric. 1996, 50, 14-18.
Johnson, L.F., Bosch, D.F., Williams, D.C., Lobitz, B.M., Remote sensing of vineyard management zones: implications for wine quality. Appl. Eng. Agric. 2001a, 17, 557-560.
Johnson, L.F., Roczen, D., Youkana, S., Vineyard canopy density mapping with IKONOS satellite imagery. Third international conference on geospatial information in agriculture and forestry. Denver, Colorado, 5-7 November 2001b.
Kanasawud, P., Crouzet, J.C., Mechanism of formation of volatile compounds by thermal degradation. J. Agric. Food Chem. 1990, 38, 237-243.
Kemsley, E.K., Discriminant analysis of high-dimensional data: a comparison of principle component analysis and partial least square data reduction methods. Chem. Intell. Lab. Syst. 1996, 33, 47-61.
Kemsley, E.K., Discriminant Analysis of Spectroscopic Data, John Wiley and Sons, 1998.
Kolb, C. A., Wirth, E., Kaiser, W.M., Meister, A., Riederer, M., Pfündel, E.E., Non-invasive Evaluation of the Degree of Ripeness in Grape Berries (Vitis Vinifera L. Cv. Bacchus and Silvaner) by Chlorophyll Fluorescence. J. Agric. Food Chem. 2006, 54, 299-305.
Kotseridis, Y., Baumes, R.L., Skouroumounis, G.K. Quantitative determination of free and hydrolytically liberated ß-damascenone in red grapes and wines using a stable isotope dilution assay. J. Chromatogr. A. 1999a, 849, 245-254.
Koteridis, Y., Baumes, R.L., Bertrand, A., Skouroumounis, G.K., Quantitative determination of ß-ionone in red wines and grapes of Bordeaux using a stable isotope dilution assay. J. Chromatogr. A. 1999b, 848, 317-325.
118
Kovats, E., Composition of essential oils: Part 7. Bulgarian oil of rose (Rosa damascene – Mil.). J. Chromatogr. A. 1987, 406,185-222.
Kowalski, B.R., Bender, C.F., Pattern Recognition. A Powerful Approach to Interpreting Chemical Data, J. Am. Chem. Soc. 1971, 94, 16, 5632-5639.
Le Moinge, M., Dufour, E., Bertrand, D., Maury, C., Seraphin, D., Jourjon, F., Front face fluorescence spectroscopy and visible spectroscopy coupled with chemometrics have the potential to characterise ripening of Cabernet Franc grapes. Anal. Chim. 2008, 621, 8-18.
Lund, S., Peng, F.Y., Nayar, T., Reid, K.E., Schlosser J. Gene expression analyses in individual grape (Vitis vinifera L.) berries during ripening initiation reveal that pigmentation intensity is a valid indicator of developmental staging within the cluster. Plant Mol. Bio. 2008, 68, 301-315.
Marais, J., Van Wyk, C.J., Rapp, A., Carotenoids in grapes. In Flavors and Off-Flavors. G. Charalambous (Ed.), pp. 71-85. Elsevier, Amsterdam. 1990. Marais, J., van Wyk, C., Rapp, A., Carotenoid levels in maturing grapes as affected by climatic
regions, sunlight and shade. S. Afr. J. Enol. Vitic. 1992a, 12, 64-69.
Mathieu, S., Terrier, N., Proccureur, J., Bigey, F., Günata, Z., A Carotenoid Cleavage Di-oxygenase from Vitis vinifera L.: functional characterization and expression during grape berry development in relation to C13-norisoprenoids accumulation. J. Exp. Bot. 2005, 56, 420, 2721-2731.
Mendes-Pinto, M.M., Ferreira, A.C.S., Oliveira, M.B.P.P., De Pinho, P.G., Evaluation of Some Carotenoids in Grape by Reversed- and Normal-Phase Liquid Chromatography: A Qualitative Analysis. J. Agric. Food Chem. 2004, 52, 3182-3188.
Nemani, R., Johnson, L. F., White, M., Adding science to intuition: application of remote sensing and ecosystem modelling to vineyard management. Aust. Grape Growers Winemaker. Annual technical issue. 2001, 45-47.
Ohloff, G., Importance of minor components in flavours and fragrances. Perf. Flavor. 1978, 3, 11-22.
Ojeda, H., Andary, C., Kraeva, E., Carbonneau, A., Deloire, A., Influence of Pre- and Post-veraison Water Deficit on Synthesis and Concentration of skin Phenolic Compounds during Berry Growth of Vitis vinifera cv. Shiraz. Am. J. Enol. Vitic. 2002, 53:4, 261-267.
Oliveira, C., Silva Ferreira, A.C., Mendes Pinto, M., Hogg, T., Alves, F., Guedes de Pinho, P., Carotenoid compounds in grapes and their relationship to plant water status. J. Agric. Food Chem. 2003, 51, 5967-5971.
Oliveira, C., Ferreira, A.C., Costa, P., Guerra, J., Guedes de Pinho, P., Effect of some viticultural parameters on the grape carotenoid profile. J. Agric. Food Chem. 2004, 52, 4178-4184.
Oliveira, C., Barbosa, A., Ferreira, A.C.S., Guerra, J., De Pinho, P.G., Carotenoids Profile in Grape Related to Aromatic Compounds in Wine from Douro Region. J. Food Sci. 2006, 71, 1, S1-S7.
119
Pereira, G.E.; Gaudillere; J.P., Van Leeuwen, C., Hilbert, G., Maucourt, M., Deborde, C., Moing, A., Rolin, D., 1H NMR metabolite fingerprints of grape berry: Comparison of vintage and soil effects in Bordeaux grapevine growing areas. Anal. Chim. Acta, 2006, 563, 346-352.
Razungles, A., Bayonove, C., Cordonnier, R., Sapis, J., Grape carotenoids: changes during the maturation period and localization in mature berries. Am. J. Enol. Vitic. 1988, 39, 44-48.
Razungles, A.J., Babic, I., Sapis, J.C., Bayonove, C.L., Particular Behaviour of Epoxy Xantophylls during Veraison and Maturation of Grape. J. Agric. Food Chem. 1996, 44, 3821-3825.
Razungles, A.J., Baumes, R.L., Dufour, C., Sznaper, C.N., Bayonove, C.L., Effect of sun exposure on carotenoids and C13-norisoprenoid glycosides in Syrah berries (Vitis vinifera L.). Sci. Aliment. 1998, 18, 361-373.
Ribereau-Gayon, P., Glories, Y., Maujean, A., Dubordieu, D., Handbook of Enology Volume 2: The Chemistry of Wine Stabilization and Treatments. John Wiley and Sons Ltd. 2000 pp.187-203.
Rodriguez-Amaya, D.B., Kimura, M., Godoy, H.T., Amaya-Farfan, J., Updated Brazilian database on food carotenoids: Factors affecting carotenoid composition. J. Food Comp. Anal. 2008, 21, 445-463.
Ruffner, H.P., Hawker; J.S., Hale, C.R., Temperature and enzymatic control of malate metabolism in berries Vitis vinifera. Phytochem. 1976, 15, 1977-1880.
Ruiz, D., Reich, M., Bureau, S., Renard, C.M.G.C., Audergon, J.M., Application of Reflectance
Colorimeter Measurements and Infrared Spectroscopy Methods to Rapid and Non-destructive Evaluation of Carotenoid Content of Apricot (Prunus armeniaca L.). J. Agric. Food Chem. 2008, 56, 4916-4922.
Sarneckis, C.J., Dambergs, R.G., Jones, P., Mercurio, M., Herderich, M.J., Smith, P.A.,
Quantification of condensed tannins by precipitation with methyl cellulose: development and validation of an optimised tool for grape and wine analysis. Aust. J. Grape Wine Res. 2006, 12, 39-49.
Scholander, P.F., Hammel, H.T., Bradstreet, E.D., Hemmingsen, E.A., Sap pressure in vascular plants. Science 1965,148, 339-346.
Sefton, M.A., Francis, I.L., Williams, P.J., The volatile composition of Chardonnay juice: A study by flavour precursor analysis. Am. J. Enol. Vitic. 1993, 44: 359-370.
Strever, A.E., A Study of within-vineyard variability with conventional and remote sensing technology. The University of Stellenbosch 2003. Chapter 5, 122-127.
Summer, L.W., Mendes, P., Richard, A.D., Plant metabolomics: large scale phytochemistry in the functional genomics era. Phytochem. 2003, 62, 817-836.
Taylor, K.L., Brackenridge, A.E., Vivier, M.A., Oberholster, A., High-performance liquid chromatography profiling of the major carotenoids in Arabidopsis thaliana leaf tissue. J. Chromatogr. A. 2006, 1121, 83-91.

120
Tucker, C.J., Red and photographic infrared linear combinations for monitoring vegetation. Rem. Sen. Env. 1979, 8, 127-150.
Wang, Z.P., Deloir, A., Carbonneau, A., Federspiel, B., Lopez, F., An in vivo Experimental system to Study Sugar Phloem Unloading in Ripening Grape Berries during Water Deficiency Stress. Ann. Bot. 2003, 92, 523-528.

`
CChhaapptteerr 55
General Discussion and Conclusions
122
`
GENERAL DISCUSSION AND CONCLUSIONS
5.1 GENERAL DISCUSSIONS AND CONCLUSIONS
In this study, some important contributions have been made regarding the conditions for
the extraction of carotenoids and chlorophylls from grape tissues, as well as
optimisation of the HPLC method for the simultaneous detection and quantitation of
these pigments in extracts. For the extraction of chlorophylls and carotenoids, the
importance of pH was highlighted in this study, and significant degradation of both
pigment types was observed under low pH. This was found to be more significant for
green grape berry tissue when compared to red berry tissue, and was due to higher
acid levels in the former. A thorough review of the literature to date showed that few
studies have mentioned the use of buffer solutions during carotenoid and chlorophyll
extraction. The results of this study have shown that this can cause incorrect
interpretation analytical data if the pH of the final extract was not considered. The
experimental results showed that the use of TRIS buffer limited the extractability of
certain carotenoids which were of interest to the research question at hand. As such,
the extraction conditions were not buffered for the experiments performed, but it is
proposed that in future research the extraction method for grape berry tissue at different
stages of ripeness should be optimised further to effectively neutralise tissue acidity,
without compromising the extraction of carotenoids. A further question raised by the
research results was as to whether cis-isomers and chlorophyll degradation products
are naturally present in grape berries, or are formed during sampling and processing.
This was not addressed in the current study.
A significant finding was that 5,8-epoxy-β-carotene was identified in grape berry
tissue for the first time, thus broadening the range of detectable compounds in grape
berries. However, previous research has shown unidentified compounds with similar
spectra and elution times in grape berries (Mendes-Pinto et al. 2005, Mendes-Pinto et
al. 2004). 5,8-epoxy-β-carotene is also present in a Brazilian tropical fruit camu-camu
(Myrciaria dubia) (Zanatta and Mercadante 2007). Additionally, 5,8-epoxy-β-carotene
and its 5,6-epoxide isomers can be found in a variety of plants, although it is not certain
if 5,8-poxy-β-carotene is an artefact formed from 5,6-epoxide via epoxide-furanoid
rearrangement during the extraction process (Deli and Ozs 2004). Little is known and
reported on the evolution of 5,8-epoxy-β-carotene in fruits during ripening. However 5,8-
epoxy-β-carotene differed from the other grape carotenoids in this study since this

123
compound increased with berry ripening while the other grape carotenoids decreased
with maturity. 5,6–epoxides can rearrange to form 5,8-epoxy-β-carotene in vitro on
treatment with diluted acids (Deli and Ozs 2004). This might be an indication as to why
this compound was present in green berry tissue which contains a higher relative acidity
than ripe grape tissue. However, 5,8-epoxy-β-carotene showed an increase with
ripening although the acid concentration decreased. Its presence may therefore not be
due to the acidic extraction conditions alone, but this was not conclusively shown within
the scope of this study. More research is necessary in order to understand the evolution
and in vitro rearrangement of this compound during grape maturation.
Furthermore, this research has confirmed previous observations that, in general,
carotenoids and chlorophylls decrease on a per berry (µg/berry) and concentration
(µg/g) basis from veraison to harvest. The research results were inconclusive in
addressing the research question, such that vigour differences had little effect on the
rate of synthesis and/or degradation of carotenoids, chlorophyll and some other ripening
parameters, namely malic acid, hexose sugars, tannin and anthocyanin from pre-
veraison (pea size) to full ripeness. Additionally, no significant effect of soil water
content on carotenoids, chlorophylls and ripeness parameters was found in this study,
most likely due to the fact that high soil water capacity was found in lower soil layers
which minimized differences in grapevine water status although the irrigation water
applied was varied significantly in the field experiment. According to the literature to
date, under warmer conditions, with higher sunlight intensity, less dense grapevine
canopies will obtain unripe, sun-exposed berries which are better adapted to higher light
intensities than shade-adapted berries due to their higher capacity for photosynthetic
energy consumption and thermal energy dissipation (Düring and Davtyan 2002).
Furthermore, a higher xanthophyll pool can be expected under clear, warm-weather
conditions before or at veraison while in shade-adapted/exposed berries the xanthophyll
pool size can decrease to lower initial pool levels before or at veraison (Düring and
Davtyan 2002). Under lowered soil water conditions with low soil water-retention (sandy
soil) carotenoid content can increase up to 60% while high water-retention capacity soil,
shows no effect (Oliveira et al. 2003). The response of carotenoids to water stress
occurs in fruit from an early stage of development, and the effect on carotenoid content
can be retained as the fruit matures (Oliveira et al. 2003). To summarise, it appears
that a warmer climate with higher amount of sunlight incidence and low water-capacity
soils might lead to berries with a greater pre-veraison xanthophyll pool size. However
more research is necessary to evaluate the threshold values when these occurrences
124
take effect together with the impact on other significant compounds with respect to
grape aroma potential, namely the C13-norisoprenoids.
Due to the sensitivity of carotenoids and chlorophylls to degradation, uncertainties
exist as to whether analysis of these compounds with current HPLC methods, which
require extensive sample processing and extraction, are entirely representative of the in
vivo content of these compounds in grape berries. In addition, this labour-intensive and
expensive process limits the extent to which photosynthetic pigments can be monitored
in response to viticultural research questions. A possible solution would be the
development of a device to non-invasively and accurately quantify carotenoids and
chlorophyll in berries. Furthermore, viticulturists might benefit from such a device to
monitor ripeness since it has been shown that carotenoids and chlorophylls are
potential ripeness indicators, and may be more sensitive indicators of the progress of
ripening than traditional measures such as titratable acidity, pH, total soluble solids or
anthocyanin (Lund et al. 2008). Preliminary work on the relation of some individual
carotenoids and chlorophylls with other ripeness parameters has been shown in this
study. Zeaxanthin determined as content per berry fresh weight showed for both
seasons a positive correlation with malic acid with r values of 0.5 and negative
correlations with total glucose and fructose and anthocyanin with r values greater than -
0.6 for the 2006/2007 season and -0.5 for the 2007/2008 season respectively. However,
from the preliminary prediction models (Figure 4.15 and 4.16) it appears that the profile
of carotenoids and chlorophylls in berries together describe (predict) the concentrations
of ripening parameters through ripening without strong correlations between individual
compounds. The potential of carotenoids and chlorophylls to predict berry ripeness
were investigated with multivariate analyses and showed correlations of more than 0.8
for both seasons studied. However, extensive research is still necessary to evaluate
such an application. A suitable device to accurately and non-destructively measure the
carotenoid and chlorophyll content of berries will be needed for these results to take
application in the industry. The relationship of carotenoid and chlorophyll profiles to
ripeness also needs to be established further since little research has been done in this
field also evaluating different cultivars and climates.
Carotenoids degrade during berry ripening, and the current theory suggests that
they are enzymatically cleaved to give rise to C13-norisoprenoid precursors in grape
tissue (Baumes et al. 2002). Under low pH conditions during vinification, C13-
norisoprenoids are generated from their carotenoid precursors and, contribute floral
(Kanasawud and Crouzet 1990; Kovats 1987; Ohloff 1978) and honey-like aromas to

125
the wine. Since these volatile aroma compounds (C13-norisoprenoids) can not be
measured directly in grapes during maturation, and previous research has correlated
the rate of carotenoid degradation to the evolution of C13-norisoprenoid precursors,
carotenoids might give a valuable indication of their rate of formation. This connection
between the degradation of carotenoids and the formation of flavour compounds has
been partially studied and needs to be established in the future. However, a significant
limitation in this research direction is the analytical methods required, which are costly
and labour intensive.
A non-invasive device to measure carotenoids in fruit was already patented in 2004
by Gellerman et al. (2004). This portable non-invasive device uses Raman scattering
spectroscopy of carotenoids as indication of oxidative deterioration which gives an
indication of the general health status of higher plants. Unfortunately no no-invasive
devices are currently availably to accurately quantify carotenoids and chlorophyll
content of berries. Thus, there is scope for further research to improve the analytical
measurement of carotenoids and chlorophylls to obtain maximum information from
these pigments in relation to viticultural variables, and to serve as a basis for the
calibration and validation of non-invasive methods for pigment detection and
quantitation.
5.2 LITERATURE CITED
Baumes, R., Wirth, J., Bureau, S., Gunata, Y., Razungles, A., Bio-generation of C13-norisoprenoid compounds:experiments supportive for an apo-carotenoid pathway in grapevines. Anal. Chim. Acta. 2002, 458, 3-14.
Bindon, K., Influence of Partial Rootzone Drying on Aspects of Grape and Wine Quality. The University of Adelaide. 2004, Chapter 9, 182-204.
Bindon, K., Dry, P.R., Loveys, B.R., Influence of Plant Water Status on the Production of C13-Norisoprenoids Precursors in Vitis vinifera L. Cv. Cabernet Sauvignon Grape Berries. J. Agric. Food Chem. 2007, 55, 4493-4500.
Bureau, S.M., Razungles, A.J., Baumes, R.L., Bayonove, C.L. Effect of qualitative modification of light on the carotenoid contents in Vitis vinifera L. cv. Syrah berries. Sci. Aliment. 1998, 18, 485-495.
Bureau, S.M., Razungles, A.J., Baumes, R.L., The aroma of Muscat of Frontignan grapes: effect of the light environment of vine or bunch on volatile and glycoconjugates. J Sci Food Agri. 2000, 80, 2012-2020.
Deli, J., Õsz, E., Carotenoid 5,6-, 5,8- and 3,6-epoxides, ARKIVO, 2004, 1424, 150-168.
Düring, H., Davtyan, A., Development changes of primary processes of photosynthesis in sun- and shade-adapted berries of two grapevine cultivars. Vitis. 2002, 2, 63-67.

126
Etievant, P.X., Volatile compounds in food and beverages. Wine, 1991, In Henks Maarse (Ed.),
Zeist, Netherlands: TNO-CIVO Food Analysis Institute.
Gellerman, W., McClane, R., Bernstein, P.S., Optical Method and Apparatus for Determining Status of Agricultural Products. United States Patent Application Publication. Pub. No. US 2004/0130714 A1. 2004.
Giovanelli, G., Brenna, O.V., Evolution of some phenolic components, carotenoids and chlorophylls during ripening of three Italian grape varieties. Eur Food Res Technol. 2007, 225, 145-150.
Hirschberg, J., Carotenoid biosythesis in flowering plants. Curr. Opin. Plant. Biol. 2001, 4, 210-218.
Kanasawud, P., Crouzet, J.C., Mechanism of formation of volatile compounds by thermal degradation. J. Agric. Food Chem. 1990, 38, 237-243.
Kovats, E., Composition of essential oils : Part 7. Bulgarian oil of rose (Rosa damascene – Mil.). J. Chromatogr. A. 1987, 406,185-222.
Marais, J., van Wyk, C., Rapp, A., Carotenoid levels in maturing grapes as affected by climatic regions, sunlight and shade. S. Afr. J. Enol. Vitic. 1992a, 12, 64-69.
Mendes-Pinto, M.M., Ferreira, A.C.S., Oliveira, M.B.P.P., De Pinho, P.G., Evaluation of Some Carotenoids in Grape by Reversed- and Normal-Phase Liquid Chromatography: A Qualitative Analysis. J. Agric. Food Chem. 2004, 52, 3182-3188.
Mendes-Pinto, M.M., Ferreira, A.C.S., Caris-Veyrat, C., De Pinho, G.P. Carotenoids, Chlorophyll, and Chlorophyll-Derived Compounds in Grapes and Port Wines. J. Agric. Food Chem. 2005, 53, 10034-10041.
Lund, S., Peng, F.Y., Nayar, T., Reid, K.E., Schlosser J., Gene expression analyses in individual grape (Vitis vinifera L.) berries during ripening initiation reveal that pigmentation intensity is a valid indicator of developmental staging within the cluster. Plant Mol Bio. 2008, 68, 301-315.
Ohloff, G., Importance of minor components in flavours and fragrances. Perf. Flavor. 1978, 3, 11-22.
Oliveira, C., Silva Ferreira, A.C., Mendes Pinto, M., Hogg, T., Alves, F., Guedes de Pinho, P., Carotenoid compounds in grapes and their relationship to plant water status. J. Agr. Food Chem. 2003, 51, 5967-5971.
Oliveira, C., Ferreira, A.C., Costa, P., Guerra, J., Guedes de Pinho, P., Effect of some viticultural parameters on the grape carotenoid profile. J. Agr. Food Chem. 2004, 52, 4178-4184.
Oliveira, C., Barbosa, A., Ferreira, A.C.S., Guerra, J., De Pinho, P.G., Carotenoids Profile in Grape Related to Aromatic Compounds in Wine from Douro Region. J. Food Sci. 2006, 71, 1, S1-S7.
Razungles, A.J., Baumes, R.L., Dufour, C., Sznaper, C.N. and Bayonove, C.L., Effect of sun exposure on carotenoids and C13-norisoprenoid glycosides in Syrah berries (Vitis vinifera L.). Sci. Aliment. 1998, 18, 361-373.
Zanatta, C.F., Carotenoid composition from the Brazilian tropical fruit camu camu (Myrciaria dubia). Food Chem. 2007, 101, 1526-1532.

AAppppeennddiixx AA
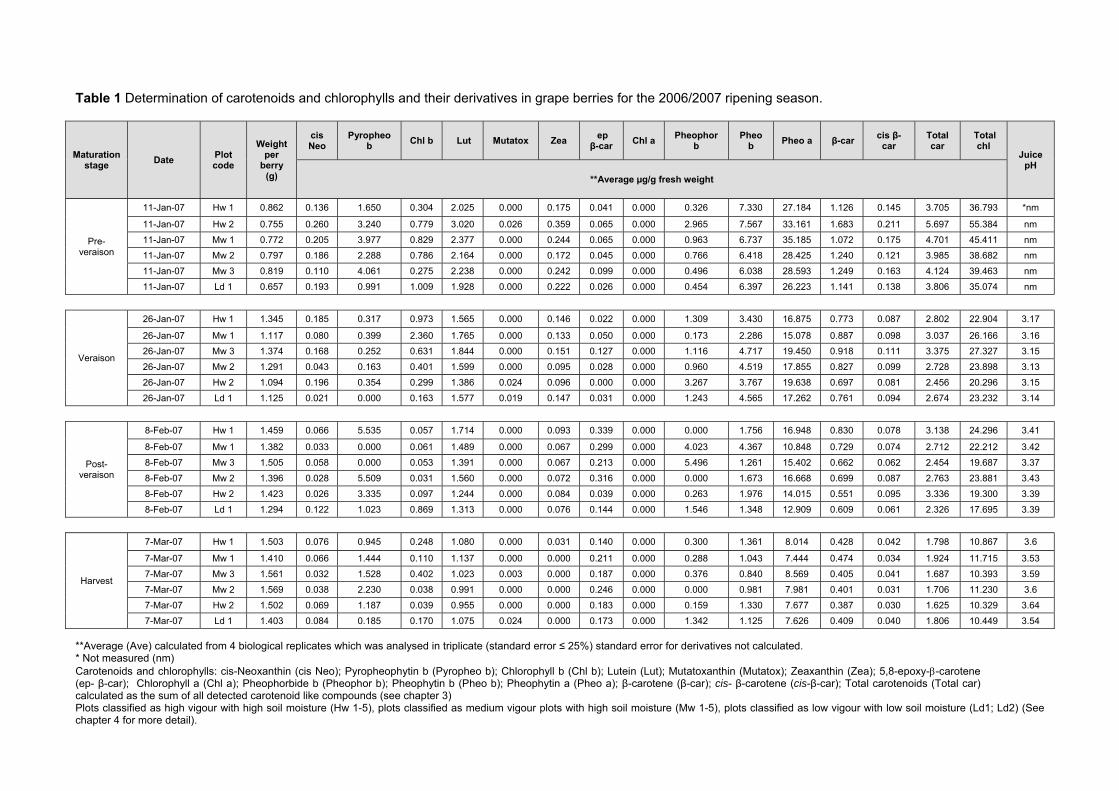
Table 1 Determination of carotenoids and chlorophylls and their derivatives in grape berries for the 2006/2007 ripening season.
Maturation stage
Date Plot code
Weight per
berry (g)
cis Neo
Pyropheo b
Chl b Lut Mutatox Zea ep β-car
Chl a Pheophor
b Pheo
b Pheo a β-car
cis β-car
Total car
Total chl
Juice pH
**Average µg/g fresh weight
Pre- veraison
11-Jan-07 Hw 1 0.862 0.136 1.650 0.304 2.025 0.000 0.175 0.041 0.000 0.326 7.330 27.184 1.126 0.145 3.705 36.793 *nm
11-Jan-07 Hw 2 0.755 0.260 3.240 0.779 3.020 0.026 0.359 0.065 0.000 2.965 7.567 33.161 1.683 0.211 5.697 55.384 nm
11-Jan-07 Mw 1 0.772 0.205 3.977 0.829 2.377 0.000 0.244 0.065 0.000 0.963 6.737 35.185 1.072 0.175 4.701 45.411 nm
11-Jan-07 Mw 2 0.797 0.186 2.288 0.786 2.164 0.000 0.172 0.045 0.000 0.766 6.418 28.425 1.240 0.121 3.985 38.682 nm
11-Jan-07 Mw 3 0.819 0.110 4.061 0.275 2.238 0.000 0.242 0.099 0.000 0.496 6.038 28.593 1.249 0.163 4.124 39.463 nm
11-Jan-07 Ld 1 0.657 0.193 0.991 1.009 1.928 0.000 0.222 0.026 0.000 0.454 6.397 26.223 1.141 0.138 3.806 35.074 nm
Veraison
26-Jan-07 Hw 1 1.345 0.185 0.317 0.973 1.565 0.000 0.146 0.022 0.000 1.309 3.430 16.875 0.773 0.087 2.802 22.904 3.17
26-Jan-07 Mw 1 1.117 0.080 0.399 2.360 1.765 0.000 0.133 0.050 0.000 0.173 2.286 15.078 0.887 0.098 3.037 26.166 3.16
26-Jan-07 Mw 3 1.374 0.168 0.252 0.631 1.844 0.000 0.151 0.127 0.000 1.116 4.717 19.450 0.918 0.111 3.375 27.327 3.15
26-Jan-07 Mw 2 1.291 0.043 0.163 0.401 1.599 0.000 0.095 0.028 0.000 0.960 4.519 17.855 0.827 0.099 2.728 23.898 3.13
26-Jan-07 Hw 2 1.094 0.196 0.354 0.299 1.386 0.024 0.096 0.000 0.000 3.267 3.767 19.638 0.697 0.081 2.456 20.296 3.15
26-Jan-07 Ld 1 1.125 0.021 0.000 0.163 1.577 0.019 0.147 0.031 0.000 1.243 4.565 17.262 0.761 0.094 2.674 23.232 3.14
Post- veraison
8-Feb-07 Hw 1 1.459 0.066 5.535 0.057 1.714 0.000 0.093 0.339 0.000 0.000 1.756 16.948 0.830 0.078 3.138 24.296 3.41
8-Feb-07 Mw 1 1.382 0.033 0.000 0.061 1.489 0.000 0.067 0.299 0.000 4.023 4.367 10.848 0.729 0.074 2.712 22.212 3.42
8-Feb-07 Mw 3 1.505 0.058 0.000 0.053 1.391 0.000 0.067 0.213 0.000 5.496 1.261 15.402 0.662 0.062 2.454 19.687 3.37
8-Feb-07 Mw 2 1.396 0.028 5.509 0.031 1.560 0.000 0.072 0.316 0.000 0.000 1.673 16.668 0.699 0.087 2.763 23.881 3.43
8-Feb-07 Hw 2 1.423 0.026 3.335 0.097 1.244 0.000 0.084 0.039 0.000 0.263 1.976 14.015 0.551 0.095 3.336 19.300 3.39
8-Feb-07 Ld 1 1.294 0.122 1.023 0.869 1.313 0.000 0.076 0.144 0.000 1.546 1.348 12.909 0.609 0.061 2.326 17.695 3.39
Harvest
7-Mar-07 Hw 1 1.503 0.076 0.945 0.248 1.080 0.000 0.031 0.140 0.000 0.300 1.361 8.014 0.428 0.042 1.798 10.867 3.6
7-Mar-07 Mw 1 1.410 0.066 1.444 0.110 1.137 0.000 0.000 0.211 0.000 0.288 1.043 7.444 0.474 0.034 1.924 11.715 3.53
7-Mar-07 Mw 3 1.561 0.032 1.528 0.402 1.023 0.003 0.000 0.187 0.000 0.376 0.840 8.569 0.405 0.041 1.687 10.393 3.59
7-Mar-07 Mw 2 1.569 0.038 2.230 0.038 0.991 0.000 0.000 0.246 0.000 0.000 0.981 7.981 0.401 0.031 1.706 11.230 3.6
7-Mar-07 Hw 2 1.502 0.069 1.187 0.039 0.955 0.000 0.000 0.183 0.000 0.159 1.330 7.677 0.387 0.030 1.625 10.329 3.64
7-Mar-07 Ld 1 1.403 0.084 0.185 0.170 1.075 0.024 0.000 0.173 0.000 1.342 1.125 7.626 0.409 0.040 1.806 10.449 3.54
**Average (Ave) calculated from 4 biological replicates which was analysed in triplicate (standard error ≤ 25%) standard error for derivatives not calculated. * Not measured (nm) Carotenoids and chlorophylls: cis-Neoxanthin (cis Neo); Pyropheophytin b (Pyropheo b); Chlorophyll b (Chl b); Lutein (Lut); Mutatoxanthin (Mutatox); Zeaxanthin (Zea); 5,8-epoxy--carotene (ep- β-car); Chlorophyll a (Chl a); Pheophorbide b (Pheophor b); Pheophytin b (Pheo b); Pheophytin a (Pheo a); β-carotene (β-car); cis- β-carotene (cis-β-car); Total carotenoids (Total car) calculated as the sum of all detected carotenoid like compounds (see chapter 3) Plots classified as high vigour with high soil moisture (Hw 1-5), plots classified as medium vigour plots with high soil moisture (Mw 1-5), plots classified as low vigour with low soil moisture (Ld1; Ld2) (See chapter 4 for more detail).

Table 2 Determination of carotenoids and chlorophylls and their derivatives in grape berries for the 2007/2008 ripening season.
Maturation stage
Date Plot code
Weight per
berry (g)
cis Neo
Pyropheo b
Chl b Lut Mutatox Zea ep
β-car Chl a
Pheophor b
Pheo b
Pheo a β-car cis β-
car Tot car
Tot chl
Juice pH
Average µg/g fresh weight
Pre-veraison
10-Jan-08 Hw 3 0.730 0.463 1.362 4.992 2.874 0.042 0.320 0.333 0.678 0.926 4.616 25.523 1.576 0.218 6.021 38.097 *nm
10-Jan-08 Hw 4 0.782 0.357 1.108 2.966 2.505 0.072 0.430 0.212 0.199 0.788 5.560 17.919 1.414 0.228 4.037 26.531 nm
10-Jan-08 Hw 5 0.681 0.437 1.538 4.859 2.990 0.052 0.127 0.215 0.542 0.827 5.306 26.929 1.679 0.220 5.890 40.000 nm
10-Jan-08 Mw 4 0.746 0.355 0.968 3.497 2.613 0.050 0.170 0.209 0.239 0.774 6.420 25.497 1.479 0.213 4.103 37.396 nm
10-Jan-08 Mw 5 0.724 0.483 1.707 5.141 3.171 0.123 0.544 0.309 0.596 0.983 5.448 29.440 1.763 0.258 6.801 43.315 nm
10-Jan-08 Mw 6 0.751 0.576 1.992 6.169 3.438 0.061 0.204 0.281 1.187 1.244 5.577 31.903 1.933 0.263 6.936 48.073 nm
10-Jan-08 Ld 2 0.773 0.299 0.599 2.670 1.975 0.099 0.360 0.195 0.331 0.642 5.596 21.573 1.304 0.177 4.502 31.412 nm
Post-veraison
31-Jan-08 Hw 3 1.315 0.140 0.827 0.845 2.638 0.270 0.110 2.697 0.000 6.433 3.055 21.399 1.209 0.172 7.600 32.558 3.37
31-Jan-08 Hw 4 1.227 0.155 0.765 0.989 1.865 0.092 0.089 1.000 0.000 2.733 2.479 14.359 0.870 0.112 4.601 21.326 3.29
31-Jan-08 Hw 5 1.203 0.134 1.570 1.901 2.248 0.106 0.121 1.220 0.000 2.258 2.120 16.847 1.053 0.143 5.327 24.696 3.19
31-Jan-08 Mw 4 1.272 0.091 0.398 0.199 2.038 0.166 0.085 1.765 0.000 4.378 2.479 15.359 0.878 0.126 5.439 22.812 3.23
31-Jan-08 Mw 5 1.277 0.127 0.610 0.399 2.275 0.177 0.090 2.006 0.000 5.209 2.149 16.747 0.995 0.129 6.106 25.114 3.49
31-Jan-08 Mw 6 1.170 0.109 0.902 1.839 2.348 0.215 0.120 1.828 0.424 4.607 1.265 16.939 0.990 0.147 6.122 25.975 3.27
31-Jan-08 Ld 2 1.268 0.102 0.831 0.285 2.527 0.237 0.097 2.359 0.000 5.823 2.867 19.689 1.150 0.151 6.967 29.494 3.21
Post-veraison
21-Feb-08 Hw 3 1.474 0.079 0.637 0.749 1.613 0.056 0.072 0.961 0.000 1.199 2.221 10.168 0.686 0.092 3.834 14.973 26.6
21-Feb-08 Hw 4 1.335 0.024 0.767 0.116 1.664 0.118 0.068 1.478 0.000 3.187 1.786 10.325 0.660 0.084 4.396 16.181 3.53
21-Feb-08 Hw 5 1.265 0.052 0.448 0.309 1.510 0.053 0.056 0.815 0.000 2.031 1.706 8.952 0.583 0.073 3.865 13.446 3.51
21-Feb-08 Mw 4 1.301 0.010 0.455 0.133 2.722 0.648 0.061 5.831 0.000 6.746 1.102 15.927 0.992 0.119 11.02
6 24.362 3.54
21-Feb-08 Mw 5 1.303 0.053 0.444 0.147 1.925 0.245 0.057 1.257 0.000 3.778 1.432 11.507 0.745 0.094 4.762 17.309 3.54
21-Feb-08 Mw 6 1.242 0.008 0.076 0.065 1.575 0.145 0.075 2.298 0.000 2.691 1.434 8.862 0.588 0.085 5.142 13.128 3.48
21-Feb-08 Ld 2 1.339 0.075 0.725 0.159 2.468 0.441 0.071 4.430 0.000 6.212 1.380 15.374 0.986 0.121 9.088 23.849 3.45
Harvest
3-Mar-08 Hw 3 1.389 0.145 0.770 1.533 1.279 0.035 0.023 0.620 0.000 0.475 0.792 7.529 0.531 0.066 2.853 11.100 3.56
3-Mar-08 Hw 4 1.367 0.016 0.083 0.066 1.225 0.087 0.034 0.907 0.000 1.813 1.318 6.712 0.424 0.049 2.956 9.992 3.56
3-Mar-08 Hw 5 1.236 0.010 0.116 0.085 1.597 0.134 0.000 1.549 0.000 2.440 1.197 7.975 0.557 0.068 4.230 11.813 3.56
3-Mar-08 Mw 4 1.302 0.070 0.494 0.455 1.342 0.099 0.000 1.419 0.000 1.091 0.985 6.624 0.497 0.063 3.751 9.649 3.63
3-Mar-08 Mw 5 1.307 0.073 0.435 0.504 1.274 0.078 0.059 1.264 0.000 0.906 1.062 6.549 0.456 0.061 3.480 9.455 3.57
3-Mar-08 Mw 6 1.316 0.009 0.072 0.076 1.189 0.145 0.024 1.488 0.000 1.605 0.945 5.663 0.401 0.054 3.575 8.361 3.52
3-Mar-08 Ld 2 1.422 0.008 0.069 0.064 1.218 0.063 0.025 1.159 0.000 1.619 1.489 6.880 0.443 0.053 3.168 10.122 3.51
**Average (Ave) calculated from 4 biological replicates which was analysed in triplicate (standard error ≤ 25%) standard error for derivatives not calculated. * Not measured (nm) Carotenoids and chlorophylls: cis-Neoxanthin (cis Neo); Pyropheophytin b (Pyropheo b); Chlorophyll b (Chl b); Lutein (Lut); Mutatoxanthin (Mutatox); Zeaxanthin (Zea); 5,8-epoxy--carotene (ep- β-car); Chlorophyll a (Chl a); Pheophorbide b (Pheophor b); Pheophytin b (Pheo b); Pheophytin a (Pheo a); β-carotene (β-car); cis- β-carotene (cis-β-car); Total carotenoids (Total car) calculated as the sum of all detected carotenoid like compounds (see chapter 3) Plots classified as high vigour with high soil moisture (Hw 1-5), plots classified as medium vigour plots with high soil moisture (Mw 1-5), plots classified as low vigour with low soil moisture (Ld1; Ld2) (See chapter 4 for more detail).

AAppppeennddiixx BB
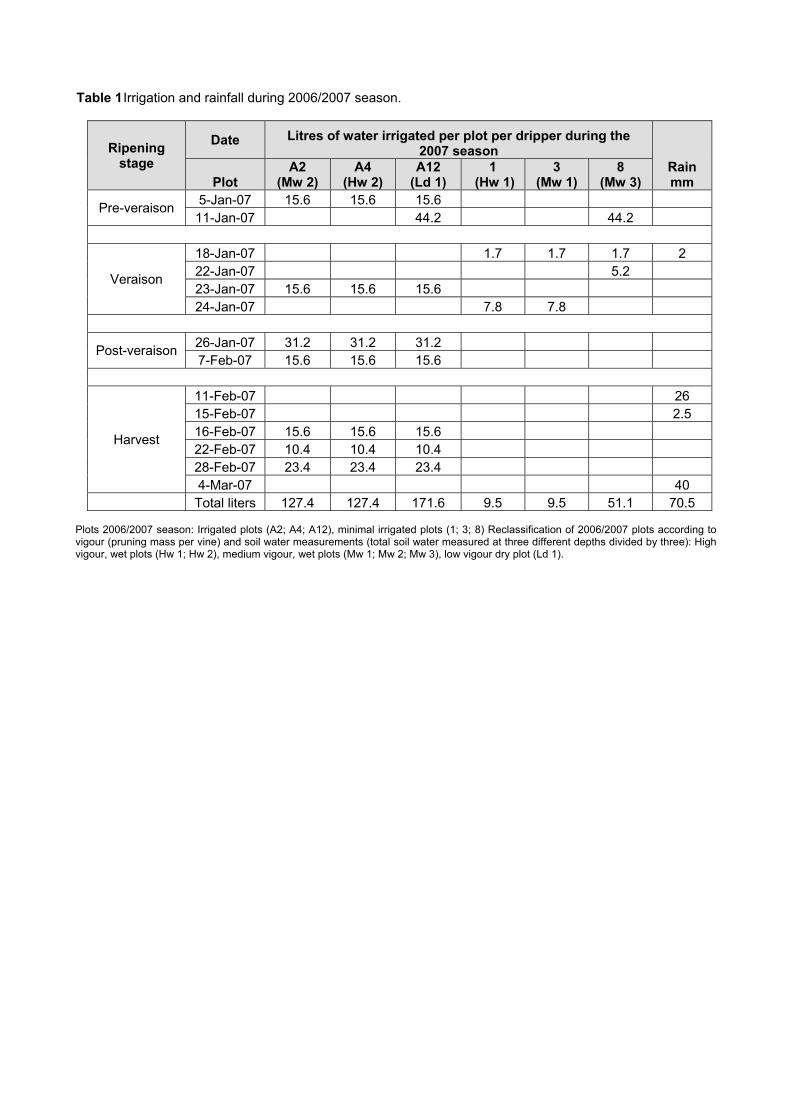
Table 1 Irrigation and rainfall during 2006/2007 season.
Ripening stage
Date Litres of water irrigated per plot per dripper during the 2007 season
Rain mm Plot
A2 (Mw 2)
A4 (Hw 2)
A12 (Ld 1)
1 (Hw 1)
3 (Mw 1)
8 (Mw 3)
Pre-veraison 5-Jan-07 15.6 15.6 15.6 11-Jan-07 44.2 44.2
Veraison
18-Jan-07 1.7 1.7 1.7 2 22-Jan-07 5.2 23-Jan-07 15.6 15.6 15.6 24-Jan-07 7.8 7.8
Post-veraison 26-Jan-07 31.2 31.2 31.2 7-Feb-07 15.6 15.6 15.6
Harvest
11-Feb-07 26 15-Feb-07 2.5 16-Feb-07 15.6 15.6 15.6 22-Feb-07 10.4 10.4 10.4 28-Feb-07 23.4 23.4 23.4 4-Mar-07 40
Total liters 127.4 127.4 171.6 9.5 9.5 51.1 70.5
Plots 2006/2007 season: Irrigated plots (A2; A4; A12), minimal irrigated plots (1; 3; 8) Reclassification of 2006/2007 plots according to vigour (pruning mass per vine) and soil water measurements (total soil water measured at three different depths divided by three): High vigour, wet plots (Hw 1; Hw 2), medium vigour, wet plots (Mw 1; Mw 2; Mw 3), low vigour dry plot (Ld 1).

Table 2 Irrigation and rainfall during 2007/2008 season.
Ripening stage Date
Litres of water irrigated per plot per dripper during the 2008 season
Rain mm Plot
A3 (Mw 4)
A9 (Hw 3)
A12 (Ld 2)
2 (Mw 6)
3 ( Hw 5)
5 (Hw 4)
8 (Mw 5)
Veraison
18-Jan-08 15.6 15.6 15.6
19-Jan-08 15.6 15.6 15.6 15.6
22-Jan-08 18.2 18.2 18.2
23-Jan-08 18.2 18.2 18.2 18.2
Post-veraison 29-Jan-08 7.8 7.8 7.8 7.8
30-Jan-08 15.6 15.6 15.6 7.8 7.8 7.8 7.8
6-Feb-08 26 26 26 2.6 2.6 2.6 2.6
Harvest
9-Feb-08 28
13-Feb-08 20.8 20.8 20.8 5.2 5.2 5.2 5.2
16-Feb-08 5
20-Feb-08 15.6 15.6 15.6 2.6 2.6 2.6 2.6
27-Feb-08 18 Total liters 111.8 111.8 111.8 59.8 59.8 59.8 59.8 51
Plots 2007/2008 season: Irrigated plots (A3; A9; A12), minimal irrigated (2; 3; 5; 8) Reclassification of 2007/2008 plots according to vigour (pruning mass per vine) and soil water measurements (total soil water measured at three different depths divided by three): High vigour, wet plots (Hw 3; Hw 4; Hw 5), medium vigour, wet plots (Mw 4; Mw 5; Mw 6), low vigour dry plot (Ld 2).

Table 3a Mean grapevine response data per plot (24 vines) for the 2006/2007 and 2007/2008 seasons.
Season Plot Plot code
Pruning
mass per
vine kg
Mass per
shoot g
Inter- node
length (cm)
Shoot diameter
(mm)
vNumber of lateral
shoots per main shoot
vLateral shoot length per main shoot
(cm)
Main shoot length (cm)
Number of
shoots per vine
Canopy management
practice
2006/2007 1 Hw 1 1.01ab 64.48a 8.14a 7.84b 0.21a 5.58a 87.79a 16.47ab topped 2006/2007 A2 Hw 2 1.03b 63.78a 7.57ab 5.05c 0.17a 3.25a 146.46c 16.25ab topped 2006/2007 3 Mw 1 0.91abc 58.49a 7.36b 7.01a 0.58a 12.04ab 124.76b 16.22ab none 2006/2007 A4 Mw 2 0.89ac 59.94a 8.09a 6.44a 0.25a 5.46a 96.27a 14.96b topped 2006/2007 8 Mw 3 0.81c 48.96b 7.21b 6.72a 0.50a 8.81ab 132.82b 16.96a none 2006/2007 A12 Ld 1 0.63d 40.38c 7.02b 6.83a 1.63b 18.21b 121.19b 15.58ab none
2007/2008 A9 Hw 3 1.31b 69.14cd 8.21a 5.67c 1.67ab 24.75a 156.00a 17.64ab none 2007/2008 5 Hw 4 1.22bc 74.81c 9.42ab 9.00ab 1.67ab 36.79a 113.00a 19.14ab none 2007/2008 3 Hw 5 1.13ab 65.41ac 9.08b 9.33b 2.33a 57.92a 118.00a 18.33b none 2007/2008 A3 Mw 4 1.09ac 60.39abd 7.47ab 6.33a 0.83b 19.88a 127.00a 17.68ab none 2007/2008 8 Mw 5 1.04ac 58.95abd 7.75b 6.67ab 2.00a 47.96a 124.00a 16.86a none 2007/2008 2 Mw 6 0.99a 57.67ab 8.40ab 8.33ab 1.50ab 54.63a 126.00a 17.83ab none 2007/2008 A12 Ld 2 0.95a 51.31b 6.97a 8.33ab 2.00a 55.58a 132.50a 18.05ab none
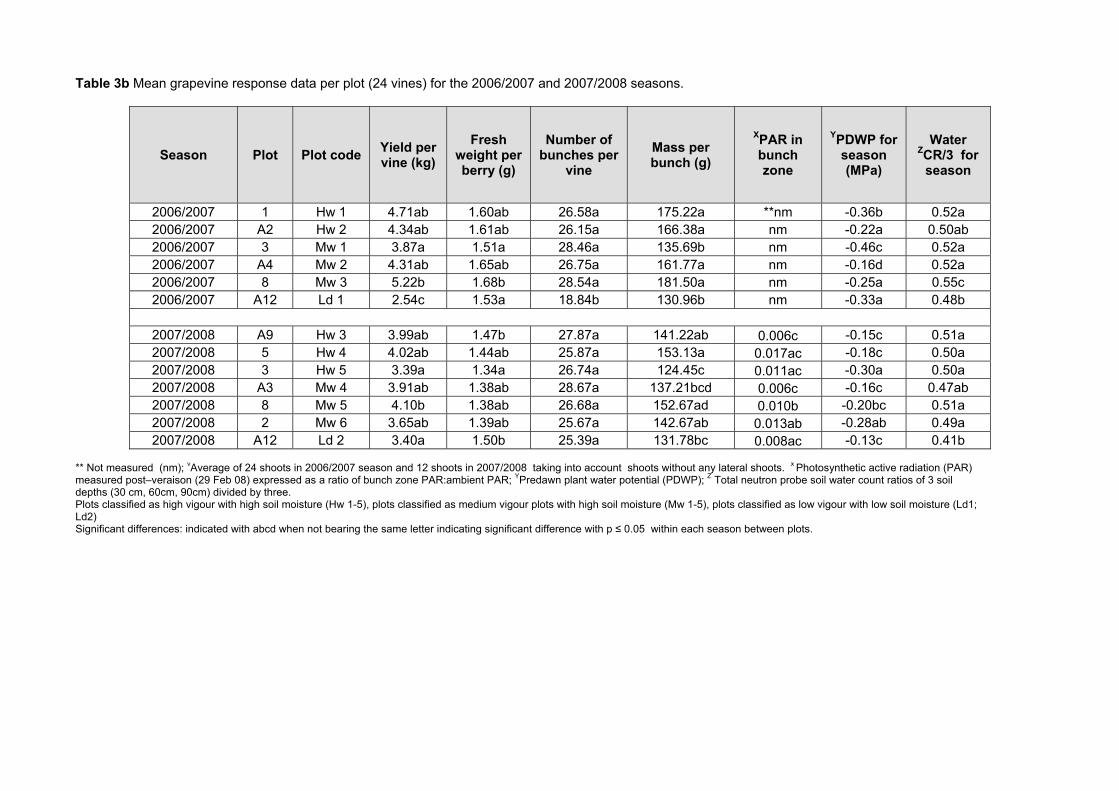
Table 3b Mean grapevine response data per plot (24 vines) for the 2006/2007 and 2007/2008 seasons.
Season Plot Plot code Yield per vine (kg)
Fresh weight per berry (g)
Number of bunches per
vine
Mass per bunch (g)
XPAR in bunch zone
YPDWP for season (MPa)
Water ZCR/3 for
season
2006/2007 1 Hw 1 4.71ab 1.60ab 26.58a 175.22a **nm -0.36b 0.52a 2006/2007 A2 Hw 2 4.34ab 1.61ab 26.15a 166.38a nm -0.22a 0.50ab 2006/2007 3 Mw 1 3.87a 1.51a 28.46a 135.69b nm -0.46c 0.52a 2006/2007 A4 Mw 2 4.31ab 1.65ab 26.75a 161.77a nm -0.16d 0.52a 2006/2007 8 Mw 3 5.22b 1.68b 28.54a 181.50a nm -0.25a 0.55c 2006/2007 A12 Ld 1 2.54c 1.53a 18.84b 130.96b nm -0.33a 0.48b
2007/2008 A9 Hw 3 3.99ab 1.47b 27.87a 141.22ab 0.006c -0.15c 0.51a 2007/2008 5 Hw 4 4.02ab 1.44ab 25.87a 153.13a 0.017ac -0.18c 0.50a 2007/2008 3 Hw 5 3.39a 1.34a 26.74a 124.45c 0.011ac -0.30a 0.50a 2007/2008 A3 Mw 4 3.91ab 1.38ab 28.67a 137.21bcd 0.006c -0.16c 0.47ab 2007/2008 8 Mw 5 4.10b 1.38ab 26.68a 152.67ad 0.010b -0.20bc 0.51a 2007/2008 2 Mw 6 3.65ab 1.39ab 25.67a 142.67ab 0.013ab -0.28ab 0.49a 2007/2008 A12 Ld 2 3.40a 1.50b 25.39a 131.78bc 0.008ac -0.13c 0.41b
** Not measured (nm); vAverage of 24 shoots in 2006/2007 season and 12 shoots in 2007/2008 taking into account shoots without any lateral shoots. x Photosynthetic active radiation (PAR) measured post–veraison (29 Feb 08) expressed as a ratio of bunch zone PAR:ambient PAR; YPredawn plant water potential (PDWP); Z Total neutron probe soil water count ratios of 3 soil depths (30 cm, 60cm, 90cm) divided by three. Plots classified as high vigour with high soil moisture (Hw 1-5), plots classified as medium vigour plots with high soil moisture (Mw 1-5), plots classified as low vigour with low soil moisture (Ld1; Ld2) Significant differences: indicated with abcd when not bearing the same letter indicating significant difference with p ≤ 0.05 within each season between plots.

Table 4 Mean values of individual carotenoids and chlorophylls per berry fresh weight (fw) of four stages (pre-veraison, veraison, post-veraison, harvest) of ripening during the 2006/2007 ripening season.
Maturation
Stage Date Code
Plot
Weight per
berry
without
seed (g)
Zea Lut ep-
β-car β-car
cis β-
car
Tot
Car Chl a Chl b
Total
Chl
Malic
acid
Total
(Glucose
+
Fructose)
Total
Tannin
Total
Anthocyanin
**Average µg/berry fresh weight **Average mg/berry fresh weight
Pre-
veraison
11-Jan-07 1 Hw 1 0.86a 0.15ab 1.75ab 0.04ab 0.97ab 0.13ab 3.21ab 23.51ab 6.88ab 31.82ab 21.33a 25.53b 1.34a 0.03ab
11-Jan-07 A2 Hw 2 0.76ab 0.27b 2.30b 0.05ab 1.29b 0.16b 4.34b 30.83b 8.55b 42.45b 16.74ab 16.07a 1.04a 0.00b
11-Jan-07 3 Mw 1 0.77a 0.19a 1.83ab 0.05a 0.82ab 0.13ab 3.62ab 19.09ab 6.59ab 35.02a 18.61ab 14.54a 1.04a 0.01ab
11-Jan-07 A4 Mw 2 0.80a 0.14a 1.72ab 0.04a 0.99ab 0.10a 3.17ab 22.60ab 6.35ab 30.75a 20.07ab 21.20bc 1.25a 0.05ab
11-Jan-07 8 Mw 3 0.82a 0.20ab 1.83ab 0.08b 1.02ab 0.13ab 3.38ab 23.39ab 5.58a 32.28a 17.28ab 24.24b 1.35a 0.06ab
11-Jan-07 A12 Ld 1 0.66b 0.15a 1.28a 0.02a 0.76a 0.09a 2.55a 17.56a 5.25a 23.49a 14.53b 16.80ac 1.04a 0.20a
Veraison
26-Jan-07 1 Hw 1 1.34a 0.20ac 2.11a 0.03b 1.04a 0.12ab 3.77a 22.73a 7.70a 30.85a 3.33b 93.37ab 1.35ab 11.98a
26-Jan-07 A2 Hw 2 1.09b 0.11b 1.51c 0.00d 0.76c 0.09c 2.68c 16.46c 5.26c 22.16c 3.41bc 82.99b 1.16ab 8.07a
26-Jan-07 3 Mw 1 1.12b 0.15ab 1.93ab 0.06a 0.97ab 0.11abc 3.32ab 21.35ab 7.11a 28.71ab 5.00a 89.74ab 0.96a 9.81a
26-Jan-07 A4 Mw 2 1.29a 0.12bc 2.06ab 0.04ab 1.07a 0.13b 3.51ab 23.02a 7.58a 30.78a 4.85ac 91.31ab 1.47b 10.35a
26-Jan-07 8 Mw 3 1.37a 0.21a 2.53d 0.17c 1.26d 0.15d 4.62d 26.93d 10.07b 37.47d 5.15a 106.41a 1.30ab 10.57a
26-Jan-07 A12 Ld 1 1.13b 0.17ab 1.77bc 0.04ab 0.85bc 0.11ac 3.00bc 19.37bc 6.70a 26.07bc 4.32ab 86.60ab 1.08ab 10.24a
Post-
veraison
8-Feb-07 1 Hw 1 1.46a 0.14a 2.50c 0.49a 1.21a 0.11abc 4.57a 24.68a 2.65b 35.37a 2.44a 149.52a 2.40c 19.36a
8-Feb-07 A2 Hw 2 1.42ab 0.12d 1.77bd 0.06d 0.78b 0.13c 4.77a 15.36b 12.09a 27.45bc 2.50a 132.67ab 2.14ac 16.46a
8-Feb-07 3 Mw 1 1.38ab 0.09ab 2.05ab 0.41ab 1.01ab 0.10ab 3.73a 21.22ab 9.38a 30.60ab 2.27ab 130.08ab 1.59ab 18.76a
8-Feb-07 A4 Mw 2 1.40ab 0.10ab 2.18ac 0.44ab 0.97ab 0.12bc 3.85a 23.28ac 2.34b 33.38ab 2.40ab 142.10ab 1.32b 19.75a
8-Feb-07 8 Mw 3 1.51a 0.10b 2.09ad 0.32b 1.00ab 0.09ad 3.69a 21.07ab 3.51b 29.60ab 2.29ab 138.10ab 2.45c 18.53a
8-Feb-07 A12 Ld 1 1.29b 0.10c 1.69b 0.19c 0.78b 0.08d 2.99a 16.61bc 4.89b 22.78c 1.58b 124.22b 1.98ac 17.86a
Harvest
7-Mar-07 1 Hw 1 1.50a 0.05 1.63a 0.21a 0.65a 0.06bc 2.71a 12.13a 2.89a 16.44a 1.25b 154.46ab 0.85ab 22.27a
7-Mar-07 A2 Hw 2 1.50a nd* 1.43a 0.27ab 0.58a 0.05a 2.43a 11.17a 2.16ab 15.50a 0.60a 142.57a 0.98ab 21.10a
7-Mar-07 3 Mw 1 1.41a nd 1.59a 0.29ab 0.66a 0.05a 2.70a 12.05a 2.29ab 16.47a 0.65a 139.86a 0.71a 21.34a
7-Mar-07 A4 Mw 2 1.57a nd 1.53a 0.39b 0.62a 0.05ac 2.65a 12.36a 1.57b 17.41a 1.06ab 135.92a 0.90ab 23.28a
7-Mar-07 8 Mw 3 1.56a nd 1.60a 0.29ab 0.63a 0.06b 2.64a 11.98a 2.38a 16.22a 1.04ab 172.48b 1.20b 21.03a
7-Mar-07 A12 Ld 1 1.40a nd 1.51a 0.24ab 0.58a 0.06ab 2.54a 10.76a 3.72c 14.75a 0.52a 147.32a 1.10b 21.47a **Average (Ave) calculated from 4 biological replicates each analysed in triplicate * Not detected (nd) Carotenoids: Zeaxanthin (Zea); Lutein (Lut); 5,8-epoxy--carotene (ep-β-car); β-carotene (β-car); cis β-carotene (cis β-car); Total carotenoids (Total car) calculated as the sum of all detected carotenoid like compounds (see chapter 3) Chlorophyll: Chlorophyll a (Chl a); Chlorophyll b (Chl b); Total chlorophyll (Tot chl) calculated as the sum of all chlorophylls and detected chlorophyll derivatives (see chapter 3) Significant differences: indicated with abcd when not bearing the same letter indicating significant difference with p ≤ 0.05 between plots for specific maturation stage. Plots classified as high vigour with high soil moisture (Hw 1-5), plots classified as medium vigour plots with high soil moisture (Mw 1-5), plots classified as low vigour with low soil moisture (Ld1; Ld2)
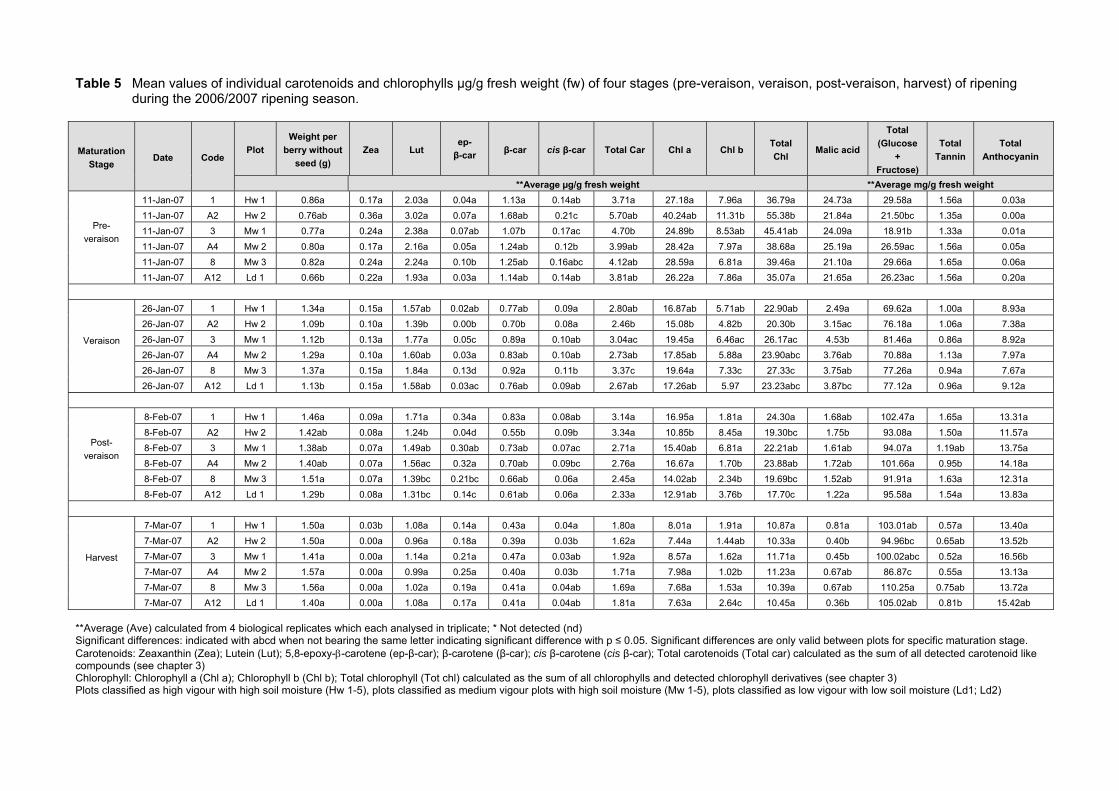
Table 5 Mean values of individual carotenoids and chlorophylls µg/g fresh weight (fw) of four stages (pre-veraison, veraison, post-veraison, harvest) of ripening during the 2006/2007 ripening season.
Maturation
Stage Date Code
Plot
Weight per
berry without
seed (g)
Zea Lut ep-
β-car β-car cis β-car Total Car Chl a Chl b
Total
Chl Malic acid
Total
(Glucose
+
Fructose)
Total
Tannin
Total
Anthocyanin
**Average µg/g fresh weight **Average mg/g fresh weight
Pre-
veraison
11-Jan-07 1 Hw 1 0.86a 0.17a 2.03a 0.04a 1.13a 0.14ab 3.71a 27.18a 7.96a 36.79a 24.73a 29.58a 1.56a 0.03a
11-Jan-07 A2 Hw 2 0.76ab 0.36a 3.02a 0.07a 1.68ab 0.21c 5.70ab 40.24ab 11.31b 55.38b 21.84a 21.50bc 1.35a 0.00a
11-Jan-07 3 Mw 1 0.77a 0.24a 2.38a 0.07ab 1.07b 0.17ac 4.70b 24.89b 8.53ab 45.41ab 24.09a 18.91b 1.33a 0.01a
11-Jan-07 A4 Mw 2 0.80a 0.17a 2.16a 0.05a 1.24ab 0.12b 3.99ab 28.42a 7.97a 38.68a 25.19a 26.59ac 1.56a 0.05a
11-Jan-07 8 Mw 3 0.82a 0.24a 2.24a 0.10b 1.25ab 0.16abc 4.12ab 28.59a 6.81a 39.46a 21.10a 29.66a 1.65a 0.06a
11-Jan-07 A12 Ld 1 0.66b 0.22a 1.93a 0.03a 1.14ab 0.14ab 3.81ab 26.22a 7.86a 35.07a 21.65a 26.23ac 1.56a 0.20a
Veraison
26-Jan-07 1 Hw 1 1.34a 0.15a 1.57ab 0.02ab 0.77ab 0.09a 2.80ab 16.87ab 5.71ab 22.90ab 2.49a 69.62a 1.00a 8.93a
26-Jan-07 A2 Hw 2 1.09b 0.10a 1.39b 0.00b 0.70b 0.08a 2.46b 15.08b 4.82b 20.30b 3.15ac 76.18a 1.06a 7.38a
26-Jan-07 3 Mw 1 1.12b 0.13a 1.77a 0.05c 0.89a 0.10ab 3.04ac 19.45a 6.46ac 26.17ac 4.53b 81.46a 0.86a 8.92a
26-Jan-07 A4 Mw 2 1.29a 0.10a 1.60ab 0.03a 0.83ab 0.10ab 2.73ab 17.85ab 5.88a 23.90abc 3.76ab 70.88a 1.13a 7.97a
26-Jan-07 8 Mw 3 1.37a 0.15a 1.84a 0.13d 0.92a 0.11b 3.37c 19.64a 7.33c 27.33c 3.75ab 77.26a 0.94a 7.67a
26-Jan-07 A12 Ld 1 1.13b 0.15a 1.58ab 0.03ac 0.76ab 0.09ab 2.67ab 17.26ab 5.97 23.23abc 3.87bc 77.12a 0.96a 9.12a
Post-
veraison
8-Feb-07 1 Hw 1 1.46a 0.09a 1.71a 0.34a 0.83a 0.08ab 3.14a 16.95a 1.81a 24.30a 1.68ab 102.47a 1.65a 13.31a
8-Feb-07 A2 Hw 2 1.42ab 0.08a 1.24b 0.04d 0.55b 0.09b 3.34a 10.85b 8.45a 19.30bc 1.75b 93.08a 1.50a 11.57a
8-Feb-07 3 Mw 1 1.38ab 0.07a 1.49ab 0.30ab 0.73ab 0.07ac 2.71a 15.40ab 6.81a 22.21ab 1.61ab 94.07a 1.19ab 13.75a
8-Feb-07 A4 Mw 2 1.40ab 0.07a 1.56ac 0.32a 0.70ab 0.09bc 2.76a 16.67a 1.70b 23.88ab 1.72ab 101.66a 0.95b 14.18a
8-Feb-07 8 Mw 3 1.51a 0.07a 1.39bc 0.21bc 0.66ab 0.06a 2.45a 14.02ab 2.34b 19.69bc 1.52ab 91.91a 1.63a 12.31a
8-Feb-07 A12 Ld 1 1.29b 0.08a 1.31bc 0.14c 0.61ab 0.06a 2.33a 12.91ab 3.76b 17.70c 1.22a 95.58a 1.54a 13.83a
Harvest
7-Mar-07 1 Hw 1 1.50a 0.03b 1.08a 0.14a 0.43a 0.04a 1.80a 8.01a 1.91a 10.87a 0.81a 103.01ab 0.57a 13.40a
7-Mar-07 A2 Hw 2 1.50a 0.00a 0.96a 0.18a 0.39a 0.03b 1.62a 7.44a 1.44ab 10.33a 0.40b 94.96bc 0.65ab 13.52b
7-Mar-07 3 Mw 1 1.41a 0.00a 1.14a 0.21a 0.47a 0.03ab 1.92a 8.57a 1.62a 11.71a 0.45b 100.02abc 0.52a 16.56b
7-Mar-07 A4 Mw 2 1.57a 0.00a 0.99a 0.25a 0.40a 0.03b 1.71a 7.98a 1.02b 11.23a 0.67ab 86.87c 0.55a 13.13a
7-Mar-07 8 Mw 3 1.56a 0.00a 1.02a 0.19a 0.41a 0.04ab 1.69a 7.68a 1.53a 10.39a 0.67ab 110.25a 0.75ab 13.72a
7-Mar-07 A12 Ld 1 1.40a 0.00a 1.08a 0.17a 0.41a 0.04ab 1.81a 7.63a 2.64c 10.45a 0.36b 105.02ab 0.81b 15.42ab
**Average (Ave) calculated from 4 biological replicates which each analysed in triplicate; * Not detected (nd) Significant differences: indicated with abcd when not bearing the same letter indicating significant difference with p ≤ 0.05. Significant differences are only valid between plots for specific maturation stage. Carotenoids: Zeaxanthin (Zea); Lutein (Lut); 5,8-epoxy--carotene (ep-β-car); β-carotene (β-car); cis β-carotene (cis β-car); Total carotenoids (Total car) calculated as the sum of all detected carotenoid like compounds (see chapter 3) Chlorophyll: Chlorophyll a (Chl a); Chlorophyll b (Chl b); Total chlorophyll (Tot chl) calculated as the sum of all chlorophylls and detected chlorophyll derivatives (see chapter 3) Plots classified as high vigour with high soil moisture (Hw 1-5), plots classified as medium vigour plots with high soil moisture (Mw 1-5), plots classified as low vigour with low soil moisture (Ld1; Ld2)

Table 6 Mean values of individual carotenoids and chlorophylls per berry fresh weight (fw) of four (pre-veraison, veraison, post-veraison, harvest) stages of ripening during the 2007/2008 ripening season.
Maturation
Stage Date Code Plot
Weight
per
berry
without
seed (g)
Zea Lut ep-
β-car β-car cis β-car Tot Car Chl a Chl b Tot Chl
Malic
acid
Total
(glucose
+
fructose)
Total
Tannin
Tot
Anthocyanin
**Average µg/berry fresh weight **Average mg/berry fresh weight
Pre-
veraison
10-Jan-08 A9 Hw 3 0.73ab 0.24abc 2.10b 0.24a 1.15ab 0.16bcd 4.40bc 19.13ab 7.68ab 27.80bc 15.01a 8.20c 0.91a 0.00a
10-Jan-08 5 Hw 4 0.78b 0.33bc 1.95b 0.17a 1.10a 0.18ab 4.19b 14.39b 7.25ac 21.08b 19.94a 13.78b 0.92a 0.00a
10-Jan-08 3 Hw 5 0.68a 0.09a 2.03b 0.15a 1.14ab 0.15bc 4.00bc 18.67bc 7.47ab 27.19bc 16.39a 8.87ac 0.87a 0.00a
10-Jan-08 A3 Mw 3 0.75ab 0.13ab 1.94bc 0.16a 1.10a 0.16bcd 3.89bc 19.11ab 7.94bc 27.99bc 19.60a 13.76b 0.98a 0.00a
10-Jan-08 8 Mw 4 0.72ab 0.40c 2.30ab 0.23a 1.27b 0.19ad 4.95ac 21.79ac 8.40b 31.43ac 19.90a 11.51abc 1.11a 0.00a
10-Jan-08 2 Mw 5 0.75ab 0.16ab 2.58a 0.21a 1.45c 0.20a 5.21a 24.81a 9.75d 36.05a 20.22a 12.46ab 0.82a 0.00a
10-Jan-08 A12 Ld 2 0.77b 0.28abc 1.53c 0.15a 1.01a 0.14c 3.48bc 16.91bc 6.87 24.25bc 17.77a 9.47ac 0.97a 0.00a
Post-
veraison
31-Jan-08 A9 Hw 3 1.32b 0.14a 3.45b 3.47a 1.58b 0.22b 9.88b 27.96b 13.52c 42.55b 9.44b 124.10a 1.44a 12.11c
31-Jan-08 5 Hw 4 1.23ab 0.11a 2.30a 1.25a 1.07a 0.14a 5.69a 17.69a 7.64a 26.27a 7.90ab 105.60a 1.10ab 12.35ac
31-Jan-08 3 Hw 5 1.20ab 0.14a 2.70ab 1.46a 1.26ab 0.17ab 6.38a 20.23a 7.54a 29.64a 7.00a 127.23a 1.37a 14.85ab
31-Jan-08 A3 Mw 3 1.27ab 0.11a 2.58ab 2.21a 1.11a 0.16a 6.87a 19.46a 8.93ab 28.90a 7.33ab 134.46a 1.46a 15.00b
31-Jan-08 8 Mw 4 1.28ab 0.12a 2.90ab 2.52a 1.27ab 0.16a 7.75ab 21.36ab 9.87ab 32.02ab 5.97a 124.80a 0.65b 13.09abc
31-Jan-08 2 Mw 5 1.17a 0.14a 2.72ab 2.10a 1.15a 0.17ab 7.08a 20.15a 8.95ab 30.14a 7.27ab 129.52a 1.44a 14.20abc
31-Jan-08 A12 Ld 2 1.27ab 0.12a 3.21ab 3.00a 1.46ab 0.19ab 8.86ab 25.04ab 11.4bc 37.52ab 7.11ab 115.17a 0.94b 12.47ac
Post-
veraison
21-Feb-08 A9 Hw 3 1.47c 0.13a 2.39a 1.37bcd 0.99b 0.13bcd 5.58a 14.83a 6.13a 21.68a 4.89bc 175.60b 0.82a 22.44a
21-Feb-08 5 Hw 4 1.33b 0.09a 2.41a 2.42ab 0.96ab 0.12ab 6.67a 15.00a 6.80a 23.67a 5.14b 169.03ab 0.78a 22.47a
21-Feb-08 3 Hw 5 1.26ab 0.08a 1.99a 1.19a 0.77a 0.10a 4.55a 11.86a 5.12a 17.82a 3.11a 137.13a 1.51b 20.74a
21-Feb-08 A3 Mw 3 1.30ab 0.08a 3.44b 7.16cd 1.21c 0.15cd 13.73b 19.71b 10.37b 30.29b 4.77ab 158.04ab 0.90a 22.08a
21-Feb-08 8 Mw 4 1.30ab 0.07a 2.62a 1.75abc 1.00ab 0.13abc 6.56a 15.51a 6.97a 23.52a 3.65ac 153.83ab 1.56bc 18.90a
21-Feb-08 2 Mw5 1.24a 0.09a 1.93a 2.78ab 0.72a 0.10ab 6.27a 10.87a 5.14a 16.10a 4.22ab 141.63a 0.85a 20.62a
21-Feb-08 A12 Ld 2 1.34b 0.12a 3.40b 5.97d 1.38c 0.17d 12.40b 21.62b 10.39b 33.54b 3.96ab 125.08a 2.00c 19.99a
Harvest
3-Mar-08 A9 Hw 3 1.39b 0.03a 1.75a 0.85a 0.73b 0.09a 3.91b 10.32b 3.84ab 15.22b 2.79ab 167.86b 0.52a 15.83a
3-Mar-08 5 Hw 4 1.37ab 0.05a 1.65a 1.19a 0.57ab 0.07a 3.95ab 9.08ab 4.32ac 13.52ab 2.32a 169.72b 0.53a 18.28a
3-Mar-08 3 Hw 5 1.24a 0.00b 1.97a 1.90a 0.69ab 0.08a 5.21ab 9.85ab 4.59a 14.58ab 3.17ab 155.40ab 0.75ab 20.95a
3-Mar-08 A3 Mw 3 1.30ab 0.00b 1.74a 1.84a 0.65ab 0.08a 4.86ab 8.59ab 3.28bc 12.51ab 2.01a 126.62ab 0.54a 15.50a
3-Mar-08 8 Mw 4 1.25a 0.07c 1.63a 1.60a 0.59ab 0.08a 4.51ab 8.22ab 3.00b 11.89ab 3.73b 159.52ab 0.94b 21.53a
3-Mar-08 2 Mw 5 1.32ab 0.03a 1.53a 1.85a 0.52a 0.07a 4.52a 7.30a 3.40ab 10.80a 2.13a 110.40a 0.73ab 17.86a
3-Mar-08 A12 Ld 2 1.42b 0.04a 1.73a 1.63a 0.63ab 0.07a 4.48ab 9.74ab 4.49ac 14.33ab 3.03ab 137.10ab 0.90ab 19.01a **Average (Ave) calculated from 4 biological replicates each analysed in triplicate Carotenoids: Zeaxanthin (Zea); Lutein (Lut); 5,8-epoxy--carotene (ep-β-car); β-carotene (β-car); cis β-carotene (cis β-car); Total carotenoids (Total car) calculated as the sum of all detected carotenoid like compounds (see chapter 3) Chlorophyll: Clorophyll a (Chl a); Chlorophyll b (Chl b); Total chlorophyll (Tot chl) calculated as the sum of all chlorophylls and detected chlorophyll derivatives (see chapter 3) Significant differences: indicated with abcd when not bearing the same letter indicating significant difference with p ≤ 0.05 between plots for specific maturation stage. Plots classified as high vigour with high soil moisture (Hw 1-5), plots classified as medium vigour plots with high soil moisture (Mw 1-5), plots classified as low vigour with low soil moisture (Ld1; Ld2)

Table 7 Mean values of individual carotenoids and chlorophylls µg/g fresh weight (fw) of four (pre-veraison, veraison, post-veraison, harvest) stages of ripening during the 2007/2008 ripening season.
Maturation Stage
Date Code Plot
Weight per berry without seed (g)
Zea Lut ep- β-car
β-car cis β-car Tot Car Chl a Chl b Total Chl
Malic acid
Total Glucose + Fructose)
Total Tannin
Total Athocyanin
**Average µg/g fresh weight **Average mg/g fresh weight
Pre-veraison
10-Jan-08 A9 Hw 3 0.73ab 0.32abc 2.87bc 0.33b 1.58bce 0.22bc 6.02ab 26.20ab 10.53ac 38.10bd 20.51a 11.28c 1.24ab 0.00a
10-Jan-08 5 Hw 4 0.78b 0.43bc 2.50b 0.21ab 1.41de 0.23abd 4.04b 18.12c 9.31bc 26.53c 25.53a 17.62b 1.18ab 0.00a
10-Jan-08 3 Hw 5 0.68a 0.13a 2.99ab 0.21ab 1.68bc 0.22bc 5.89ab 27.47ab 10.99a 40.00ab 24.13a 12.94ac 1.27ab 0.00a
10-Jan-08 A3 Mw 4 0.75ab 0.17ab 2.61b 0.21a 1.48cd 0.21cd 4.10b 25.74bd 10.69a 37.40bd 26.23a 18.31b 1.30ab 0.00a
10-Jan-08 8 Mw 5 0.72ab 0.54c 3.17ac 0.31ab 1.76ab 0.26ab 6.80a 30.04ad 11.57a 43.32ad 27.38a 15.90b 1.50b 0.00a
10-Jan-08 2 Mw 6 0.75ab 0.20ab 3.44a 0.28ab 1.93a 0.26a 6.94a 33.09a 12.99d 48.07a 26.97a 16.43ab 1.10a 0.00a
10-Jan-08 A12 Ld 2 0.77b 0.36abc 1.97d 0.20a 1.30d 0.18c 4.50b 21.90bc 8.91b 31.41bc 23.11a 12.16ac 1.27ab 0.00a
Post-veraison
31-Jan-08 A9 Hw 3 1.32b 0.11a 2.64a 2.70a 1.21a 0.17b 7.60a 21.40b 10.33b 32.56b 7.17a 94.43ab 1.09a 9.24b
31-Jan-08 5 Hw 4 1.23ab 0.09a 1.87a 1.00a 0.87a 0.11a 4.60a 14.36a 6.20ac 21.33a 6.47a 86.00b 0.90ab 10.05bc
31-Jan-08 3 Hw 5 1.20ab 0.12a 2.25a 1.22a 1.05a 0.14ab 5.33a 16.85ab 6.28a 24.70ab 5.81ab 105.69ab 1.14aa 12.36a
31-Jan-08 A3 Mw 4 1.27ab 0.08a 2.04a 1.76a 0.88a 0.13ab 5.44a 15.36a 7.06ac 22.81a 5.74ab 105.38ab 1.14a 11.74ac
31-Jan-08 8 Mw 5 1.28ab 0.09a 2.28a 2.01a 1.00a 0.13ab 6.11a 16.75ab 7.76ab 25.11ab 4.64b 96.75ab 0.50c 10.24bc
31-Jan-08 2 Mw 6 1.17a 0.12a 2.35a 1.83a 0.99a 0.15ab 6.12a 17.36ab 7.71ab 25.98ab 6.22ab 110.61a 1.23a 12.17a
31-Jan-08 A12 Ld 2 1.27ab 0.10a 2.53a 2.36a 1.15a 0.15ab 6.97a 19.69ab 8.97bc 29.49ab 5.57ab 90.62ab 0.74bc 9.86b
Post-veraison
21-Feb-08 A9 Hw 3 1.47c 0.08a 1.60a 0.91ab 0.66a 0.09a 3.73a 9.90a 4.17a 14.48a 3.23ab 117.10a 0.54a 14.91a
21-Feb-08 5 Hw 4 1.33b 0.07a 1.80a 1.81ab 0.72a 0.09a 5.00a 11.23a 5.09a 17.75a 3.86b 126.77a 0.59a 16.90a
21-Feb-08 3 Hw 5 1.26ab 0.06a 1.56a 0.93b 0.61a 0.07a 3.57a 9.30a 4.05a 13.98a 2.44a 107.55a 1.19b 16.31a
21-Feb-08 A3 Mw 4 1.30ab 0.06a 2.65b 5.51d 0.93b 0.11b 10.56b 15.16b 7.98b 23.30b 3.65ab 121.60a 0.69a 16.97a
21-Feb-08 8 Mw 5 1.30ab 0.05a 2.03a 1.35ab 0.77a 0.10a 5.07a 12.01a 5.36a 18.21a 2.83ab 119.35a 1.21bc 14.65a
21-Feb-08 2 Mw 6 1.24a 0.08a 1.57a 2.30a 0.59a 0.08a 5.14a 8.86a 4.19a 13.13a 3.43ab 114.61a 0.69a 16.74a
21-Feb-08 A12 Ld 2 1.34b 0.09a 2.49b 4.38c 1.01b 0.13b 9.10b 15.86b 7.75b 24.60b 2.90ab 91.50a 1.47c 14.65a
Harvest
3-Mar-08 A9 Hw 3 1.39b 0.02a 1.28a 0.62a 0.53a 0.07a 2.85a 7.53a 2.80ab 11.10a 2.02ab 121.51ab 0.38a 11.56b
3-Mar-08 5 Hw 4 1.37ab 0.03a 1.22a 0.91a 0.42a 0.05a 2.96a 6.71a 3.20ab 9.99a 1.70ab 124.91ab 0.39a 13.47ab
3-Mar-08 3 Hw 5 1.24a 0.00b 1.60a 1.55a 0.56a 0.07a 4.23a 7.98a 3.72b 11.81a 2.56bc 125.84bc 0.60ab 16.98a
3-Mar-08 A3 Mw 4 1.30ab 0.00b 1.34a 1.42a 0.50a 0.06a 3.75a 6.62a 2.53a 9.65a 1.52a 96.65a 0.41a 11.82ab
3-Mar-08 8 Mw 5 1.25a 0.06c 1.30a 1.28a 0.47a 0.06a 3.60a 6.56a 2.40a 9.49a 2.98c 127.33c 0.75b 17.17a
3-Mar-08 2 Mw 6 1.32ab 0.02a 1.19a 1.49a 0.40a 0.05a 3.57a 5.66a 2.63a 8.36a 1.63a 86.40a 0.58ab 13.89ab
3-Mar-08 A12 Ld 2 1.42b 0.02a 1.22a 1.16a 0.44a 0.05a 3.17a 6.88a 3.17ab 10.12a 2.14abc 96.68abc 0.64ab 13.35ab **Average (Ave) calculated from 4 biological replicates each analysed in triplicate Carotenoids: Zeaxanthin (Zea); Lutein (Lut); 5,8-epoxy--carotene (ep-β-car); β-carotene (β-car); cis β-carotene (cis β-car); Total carotenoids (Total car) calculated as the sum of all detected carotenoid like compounds (see chapter 3) Chlorophyll: Clorophyll a (Chl a); Chlorophyll b (Chl b); Total chlorophyll (Tot chl) calculated as the sum of all chlorophylls and detected chlorophyll derivatives (see chapter 3) Significant differences: indicated with abcd when not bearing the same letter indicating significant difference with p ≤ 0.05 between plots for specific maturation stage. Plots classified as high vigour with high soil moisture (Hw 1-5), plots classified as medium vigour plots with high soil moisture (Mw 1-5), plots classified as low vigour with low soil moisture (Ld1; Ld2)
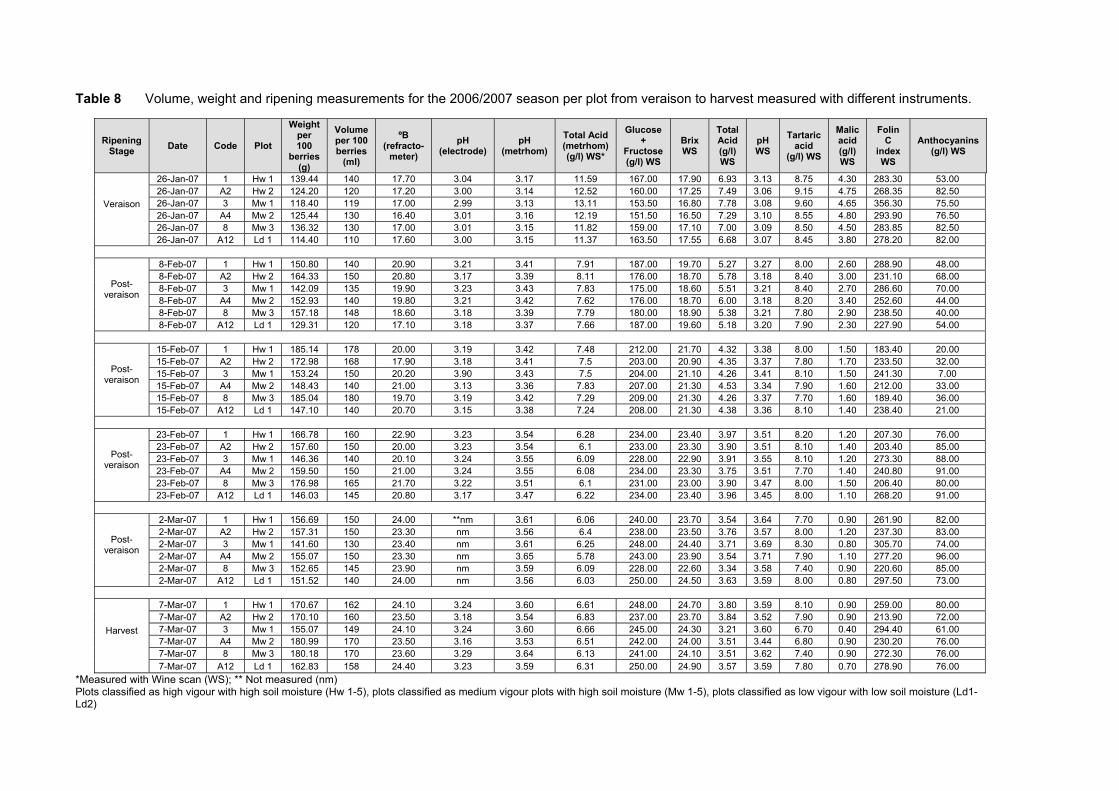
Table 8 Volume, weight and ripening measurements for the 2006/2007 season per plot from veraison to harvest measured with different instruments.
Ripening Stage
Date Code Plot
Weight per 100
berries (g)
Volume per 100 berries
(ml)
ºB (refracto-
meter)
pH (electrode)
pH (metrhom)
Total Acid (metrhom) (g/l) WS*
Glucose +
Fructose (g/l) WS
Brix WS
Total Acid (g/l) WS
pH WS
Tartaric acid
(g/l) WS
Malic acid (g/l) WS
Folin C
index WS
Anthocyanins (g/l) WS
Veraison
26-Jan-07 1 Hw 1 139.44 140 17.70 3.04 3.17 11.59 167.00 17.90 6.93 3.13 8.75 4.30 283.30 53.00 26-Jan-07 A2 Hw 2 124.20 120 17.20 3.00 3.14 12.52 160.00 17.25 7.49 3.06 9.15 4.75 268.35 82.50 26-Jan-07 3 Mw 1 118.40 119 17.00 2.99 3.13 13.11 153.50 16.80 7.78 3.08 9.60 4.65 356.30 75.50 26-Jan-07 A4 Mw 2 125.44 130 16.40 3.01 3.16 12.19 151.50 16.50 7.29 3.10 8.55 4.80 293.90 76.50 26-Jan-07 8 Mw 3 136.32 130 17.00 3.01 3.15 11.82 159.00 17.10 7.00 3.09 8.50 4.50 283.85 82.50 26-Jan-07 A12 Ld 1 114.40 110 17.60 3.00 3.15 11.37 163.50 17.55 6.68 3.07 8.45 3.80 278.20 82.00
Post-veraison
8-Feb-07 1 Hw 1 150.80 140 20.90 3.21 3.41 7.91 187.00 19.70 5.27 3.27 8.00 2.60 288.90 48.00 8-Feb-07 A2 Hw 2 164.33 150 20.80 3.17 3.39 8.11 176.00 18.70 5.78 3.18 8.40 3.00 231.10 68.00 8-Feb-07 3 Mw 1 142.09 135 19.90 3.23 3.43 7.83 175.00 18.60 5.51 3.21 8.40 2.70 286.60 70.00 8-Feb-07 A4 Mw 2 152.93 140 19.80 3.21 3.42 7.62 176.00 18.70 6.00 3.18 8.20 3.40 252.60 44.00 8-Feb-07 8 Mw 3 157.18 148 18.60 3.18 3.39 7.79 180.00 18.90 5.38 3.21 7.80 2.90 238.50 40.00 8-Feb-07 A12 Ld 1 129.31 120 17.10 3.18 3.37 7.66 187.00 19.60 5.18 3.20 7.90 2.30 227.90 54.00
Post-veraison
15-Feb-07 1 Hw 1 185.14 178 20.00 3.19 3.42 7.48 212.00 21.70 4.32 3.38 8.00 1.50 183.40 20.00 15-Feb-07 A2 Hw 2 172.98 168 17.90 3.18 3.41 7.5 203.00 20.90 4.35 3.37 7.80 1.70 233.50 32.00 15-Feb-07 3 Mw 1 153.24 150 20.20 3.90 3.43 7.5 204.00 21.10 4.26 3.41 8.10 1.50 241.30 7.00 15-Feb-07 A4 Mw 2 148.43 140 21.00 3.13 3.36 7.83 207.00 21.30 4.53 3.34 7.90 1.60 212.00 33.00 15-Feb-07 8 Mw 3 185.04 180 19.70 3.19 3.42 7.29 209.00 21.30 4.26 3.37 7.70 1.60 189.40 36.00 15-Feb-07 A12 Ld 1 147.10 140 20.70 3.15 3.38 7.24 208.00 21.30 4.38 3.36 8.10 1.40 238.40 21.00
Post-veraison
23-Feb-07 1 Hw 1 166.78 160 22.90 3.23 3.54 6.28 234.00 23.40 3.97 3.51 8.20 1.20 207.30 76.00 23-Feb-07 A2 Hw 2 157.60 150 20.00 3.23 3.54 6.1 233.00 23.30 3.90 3.51 8.10 1.40 203.40 85.00 23-Feb-07 3 Mw 1 146.36 140 20.10 3.24 3.55 6.09 228.00 22.90 3.91 3.55 8.10 1.20 273.30 88.00 23-Feb-07 A4 Mw 2 159.50 150 21.00 3.24 3.55 6.08 234.00 23.30 3.75 3.51 7.70 1.40 240.80 91.00 23-Feb-07 8 Mw 3 176.98 165 21.70 3.22 3.51 6.1 231.00 23.00 3.90 3.47 8.00 1.50 206.40 80.00 23-Feb-07 A12 Ld 1 146.03 145 20.80 3.17 3.47 6.22 234.00 23.40 3.96 3.45 8.00 1.10 268.20 91.00
Post-veraison
2-Mar-07 1 Hw 1 156.69 150 24.00 **nm 3.61 6.06 240.00 23.70 3.54 3.64 7.70 0.90 261.90 82.00 2-Mar-07 A2 Hw 2 157.31 150 23.30 nm 3.56 6.4 238.00 23.50 3.76 3.57 8.00 1.20 237.30 83.00 2-Mar-07 3 Mw 1 141.60 130 23.40 nm 3.61 6.25 248.00 24.40 3.71 3.69 8.30 0.80 305.70 74.00 2-Mar-07 A4 Mw 2 155.07 150 23.30 nm 3.65 5.78 243.00 23.90 3.54 3.71 7.90 1.10 277.20 96.00 2-Mar-07 8 Mw 3 152.65 145 23.90 nm 3.59 6.09 228.00 22.60 3.34 3.58 7.40 0.90 220.60 85.00 2-Mar-07 A12 Ld 1 151.52 140 24.00 nm 3.56 6.03 250.00 24.50 3.63 3.59 8.00 0.80 297.50 73.00
Harvest
7-Mar-07 1 Hw 1 170.67 162 24.10 3.24 3.60 6.61 248.00 24.70 3.80 3.59 8.10 0.90 259.00 80.00 7-Mar-07 A2 Hw 2 170.10 160 23.50 3.18 3.54 6.83 237.00 23.70 3.84 3.52 7.90 0.90 213.90 72.00 7-Mar-07 3 Mw 1 155.07 149 24.10 3.24 3.60 6.66 245.00 24.30 3.21 3.60 6.70 0.40 294.40 61.00 7-Mar-07 A4 Mw 2 180.99 170 23.50 3.16 3.53 6.51 242.00 24.00 3.51 3.44 6.80 0.90 230.20 76.00 7-Mar-07 8 Mw 3 180.18 170 23.60 3.29 3.64 6.13 241.00 24.10 3.51 3.62 7.40 0.90 272.30 76.00 7-Mar-07 A12 Ld 1 162.83 158 24.40 3.23 3.59 6.31 250.00 24.90 3.57 3.59 7.80 0.70 278.90 76.00
*Measured with Wine scan (WS); ** Not measured (nm) Plots classified as high vigour with high soil moisture (Hw 1-5), plots classified as medium vigour plots with high soil moisture (Mw 1-5), plots classified as low vigour with low soil moisture (Ld1- Ld2)

Table 9 Volume, weight and ripening measurements for the 2007/2008 season per plot from veraison to harvest measured with different instruments.
Ripening Stage
Date Code Plot
Weight per 100
berries (g)
Volume per 100 berries
(ml)
ºB (refracto-
meter
pH (electrode)
pH (metrhom)
Total Acid (g/l)
Glucose +
Fructose *WS
Brix WS
Total Acid WS
pH WS
Tartaric Acid WS
Malic Acid WS
Folin C
index WS
Anthocyanins WS
Veraison
24-Jan-08 A9 Hw 3 128.38 120 14.7 2.74 2.96 14.42 146.00 15.40 9.40 3.00 8.90 7.10 316.20 90.00
24-Jan-08 5 Hw 4 128.30 119 15.9 2.90 2.91 14.13 155.00 16.20 8.66 3.05 8.60 6.20 328.60 80.00
24-Jan-08 3 Hw 5 121.66 113 16.5 2.94 2.86 13.82 161.00 16.70 8.50 3.01 8.80 5.70 306.10 77.00
24-Jan-08 A3 Mw 3 137.68 122 15.9 2.96 2.88 13.2 156.00 16.20 8.20 3.03 8.10 5.70 276.80 75.00
24-Jan-08 2 Mw 5 128.38 120 14.6 2.94 2.87 13.3 157.00 16.20 8.46 3.01 8.80 5.50 315.20 78.00
24-Jan-08 8 Mw 4 128.90 120 14.8 2.91 2.83 13.2 147.00 15.40 8.14 3.00 8.30 5.40 282.70 100.00
24-Jan-08 A12 Ld 2 127.51 118 15.1 2.88 2.82 15.37 147.00 15.50 9.70 2.94 9.10 7.00 302.80 80.00
Post-veraison
31-Jan-08 A9 Hw 3 135.89 130 18.4 3.08 3.19 11.2 178.00 18.30 6.81 3.21 8.00 4.00 295.00 58.00
31-Jan-08 5 Hw 4 141.50 136 18.9 3.08 3.49 11.62 185.00 19.00 6.72 3.19 8.20 3.90 240.20 57.00
31-Jan-08 3 Hw 5 131.30 125 19.5 3.07 3.23 10.46 194.00 19.60 6.25 3.20 8.40 2.80 255.10 63.00
31-Jan-08 A3 Mw 3 140.90 150 20 3.10 3.29 10.12 195.00 19.70 6.06 3.21 7.70 3.20 220.30 64.00
31-Jan-08 2 Mw 5 134.40 128 19.6 3.08 3.37 10.51 193.00 19.50 6.20 3.20 8.30 2.90 232.90 47.00
31-Jan-08 8 Mw 4 138.70 132 18.6 6.06 3.27 10.6 182.00 18.60 6.06 3.18 7.80 2.90 231.10 74.00
31-Jan-08 A12 Ld 2 143.30 137 18.4 3.03 3.21 11.1 179.00 18.30 6.65 3.15 8.10 3.50 224.50 63.00
Post-veraison
7-Feb-08 A9 Hw 3 138.26 121 21 3.19 3.39 8.97 208.00 21.00 5.38 3.35 7.30 2.60 294.40 79.00
7-Feb-08 5 Hw 4 139.90 128 21.6 3.19 3.39 8.94 212.00 21.30 5.32 3.37 7.30 2.50 267.60 37.00
7-Feb-08 3 Hw 5 131.12 125 22.7 3.20 3.40 8.39 224.00 22.40 5.04 3.35 7.60 1.80 236.80 48.00
7-Feb-08 A3 Mw 3 132.38 121 22.6 3.20 3.46 8.56 222.00 22.30 5.06 3.36 7.50 1.90 216.00 48.00
7-Feb-08 2 Mw 5 137.22 128 22 3.20 3.39 8.19 216.00 21.60 4.78 3.34 7.40 1.60 217.90 56.00
7-Feb-08 8 Mw 4 137.22 130 20.8 3.14 3.33 8.59 202.00 20.40 5.23 3.31 7.60 2.10 248.10 68.00
7-Feb-08 A12 Ld 2 142.64 130 21.2 3.16 3.36 8.94 209.00 21.00 5.40 3.33 7.70 2.40 306.10 81.00
Post-veraison
14-Feb-08 A9 Hw 3 143.95 130 21.9 3.30 3.47 7.92 217.00 21.70 4.44 3.44 7.10 1.60 263.30 89.00
14-Feb-08 5 Hw 4 152.79 135 22.3 3.33 3.49 7.5 222.00 22.20 4.21 3.45 6.80 1.40 239.30 79.00
14-Feb-08 3 Hw 5 134.82 120 23.1 3.32 3.48 7.29 230.00 23.00 4.15 3.48 7.40 0.90 217.00 80.00
14-Feb-08 A3 Mw 3 157.51 140 22.8 3.32 3.50 7.39 226.00 22.60 4.15 3.48 7.00 1.10 250.70 72.00
14-Feb-08 2 Mw 5 138.52 128 22.5 3.29 3.53 7.45 228.00 22.80 4.17 3.43 7.30 0.90 248.60 120.00
14-Feb-08 8 Mw 4 147.50 135 21.9 3.28 3.45 7.34 214.00 21.50 4.10 3.40 7.10 1.00 243.80 114.00
14-Feb-08 A12 Ld 2 155.81 142 22 3.29 3.45 7.65 218.00 21.90 4.28 3.42 7.00 1.40 227.80 89.00
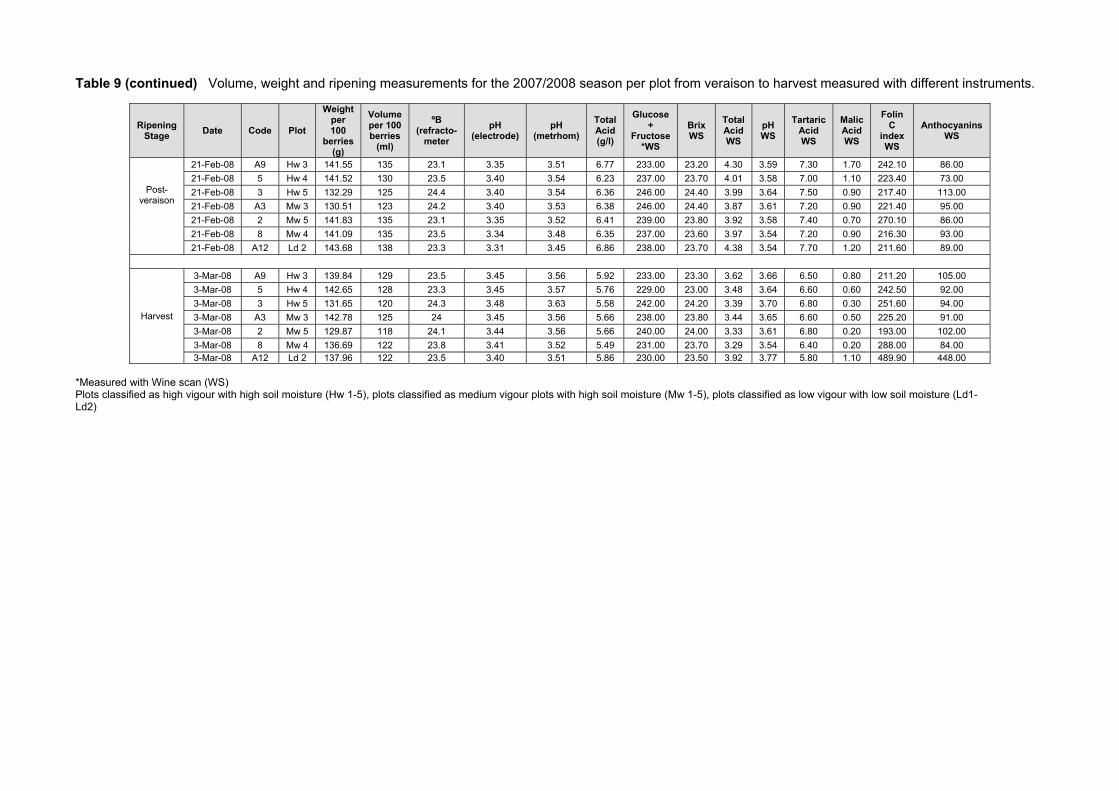
Table 9 (continued) Volume, weight and ripening measurements for the 2007/2008 season per plot from veraison to harvest measured with different instruments.
Ripening Stage
Date Code Plot
Weight per 100
berries (g)
Volume per 100 berries
(ml)
ºB (refracto-
meter
pH (electrode)
pH (metrhom)
Total Acid (g/l)
Glucose +
Fructose *WS
Brix WS
Total Acid WS
pH WS
Tartaric Acid WS
Malic Acid WS
Folin C
index WS
Anthocyanins WS
Post-veraison
21-Feb-08 A9 Hw 3 141.55 135 23.1 3.35 3.51 6.77 233.00 23.20 4.30 3.59 7.30 1.70 242.10 86.00
21-Feb-08 5 Hw 4 141.52 130 23.5 3.40 3.54 6.23 237.00 23.70 4.01 3.58 7.00 1.10 223.40 73.00
21-Feb-08 3 Hw 5 132.29 125 24.4 3.40 3.54 6.36 246.00 24.40 3.99 3.64 7.50 0.90 217.40 113.00
21-Feb-08 A3 Mw 3 130.51 123 24.2 3.40 3.53 6.38 246.00 24.40 3.87 3.61 7.20 0.90 221.40 95.00
21-Feb-08 2 Mw 5 141.83 135 23.1 3.35 3.52 6.41 239.00 23.80 3.92 3.58 7.40 0.70 270.10 86.00
21-Feb-08 8 Mw 4 141.09 135 23.5 3.34 3.48 6.35 237.00 23.60 3.97 3.54 7.20 0.90 216.30 93.00
21-Feb-08 A12 Ld 2 143.68 138 23.3 3.31 3.45 6.86 238.00 23.70 4.38 3.54 7.70 1.20 211.60 89.00
Harvest
3-Mar-08 A9 Hw 3 139.84 129 23.5 3.45 3.56 5.92 233.00 23.30 3.62 3.66 6.50 0.80 211.20 105.00
3-Mar-08 5 Hw 4 142.65 128 23.3 3.45 3.57 5.76 229.00 23.00 3.48 3.64 6.60 0.60 242.50 92.00
3-Mar-08 3 Hw 5 131.65 120 24.3 3.48 3.63 5.58 242.00 24.20 3.39 3.70 6.80 0.30 251.60 94.00
3-Mar-08 A3 Mw 3 142.78 125 24 3.45 3.56 5.66 238.00 23.80 3.44 3.65 6.60 0.50 225.20 91.00
3-Mar-08 2 Mw 5 129.87 118 24.1 3.44 3.56 5.66 240.00 24.00 3.33 3.61 6.80 0.20 193.00 102.00
3-Mar-08 8 Mw 4 136.69 122 23.8 3.41 3.52 5.49 231.00 23.70 3.29 3.54 6.40 0.20 288.00 84.00 3-Mar-08 A12 Ld 2 137.96 122 23.5 3.40 3.51 5.86 230.00 23.50 3.92 3.77 5.80 1.10 489.90 448.00
*Measured with Wine scan (WS) Plots classified as high vigour with high soil moisture (Hw 1-5), plots classified as medium vigour plots with high soil moisture (Mw 1-5), plots classified as low vigour with low soil moisture (Ld1-Ld2)
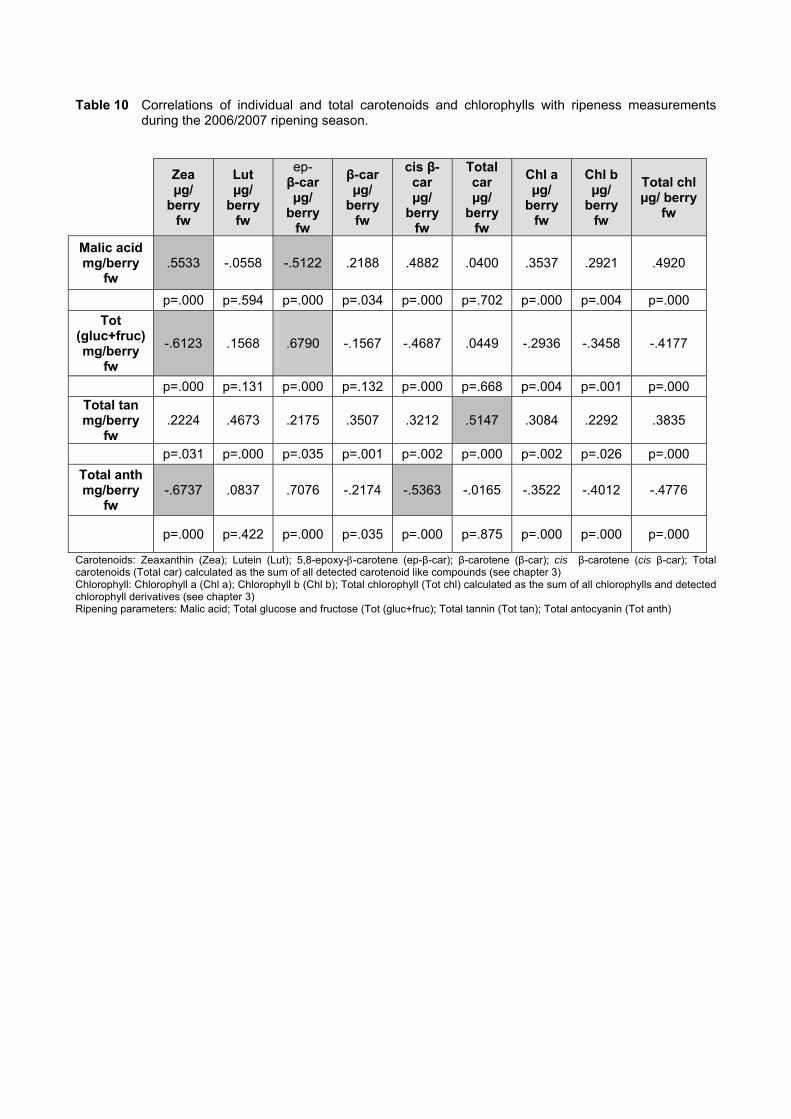
Table 10 Correlations of individual and total carotenoids and chlorophylls with ripeness measurements during the 2006/2007 ripening season.
Zea µg/
berry fw
Lut µg/
berry fw
ep- β-car µg/
berry fw
β-car µg/
berry fw
cis β-car µg/
berry fw
Total car µg/
berry fw
Chl a µg/
berry fw
Chl b µg/
berry fw
Total chl µg/ berry
fw
Malic acid mg/berry
fw .5533 -.0558 -.5122 .2188 .4882 .0400 .3537 .2921 .4920
p=.000 p=.594 p=.000 p=.034 p=.000 p=.702 p=.000 p=.004 p=.000
Tot (gluc+fruc) mg/berry
fw
-.6123 .1568 .6790 -.1567 -.4687 .0449 -.2936 -.3458 -.4177
p=.000 p=.131 p=.000 p=.132 p=.000 p=.668 p=.004 p=.001 p=.000 Total tan mg/berry
fw .2224 .4673 .2175 .3507 .3212 .5147 .3084 .2292 .3835
p=.031 p=.000 p=.035 p=.001 p=.002 p=.000 p=.002 p=.026 p=.000
Total anth mg/berry
fw -.6737 .0837 .7076 -.2174 -.5363 -.0165 -.3522 -.4012 -.4776
p=.000 p=.422 p=.000 p=.035 p=.000 p=.875 p=.000 p=.000 p=.000
Carotenoids: Zeaxanthin (Zea); Lutein (Lut); 5,8-epoxy--carotene (ep-β-car); β-carotene (β-car); cis β-carotene (cis β-car); Total carotenoids (Total car) calculated as the sum of all detected carotenoid like compounds (see chapter 3) Chlorophyll: Chlorophyll a (Chl a); Chlorophyll b (Chl b); Total chlorophyll (Tot chl) calculated as the sum of all chlorophylls and detected chlorophyll derivatives (see chapter 3) Ripening parameters: Malic acid; Total glucose and fructose (Tot (gluc+fruc); Total tannin (Tot tan); Total antocyanin (Tot anth)
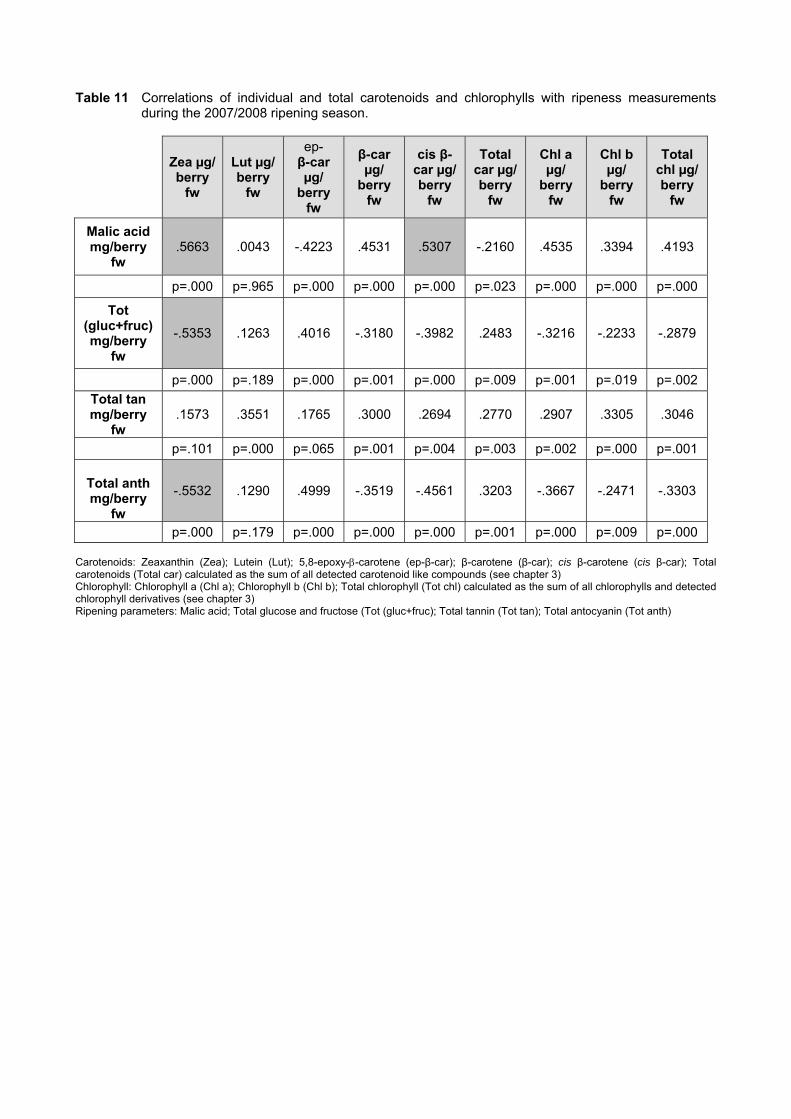
Table 11 Correlations of individual and total carotenoids and chlorophylls with ripeness measurements
during the 2007/2008 ripening season.
Zea µg/ berry
fw
Lut µg/ berry
fw
ep- β-car µg/
berry fw
β-car µg/
berry fw
cis β-car µg/ berry
fw
Total car µg/ berry
fw
Chl a µg/
berry fw
Chl b µg/
berry fw
Total chl µg/ berry
fw
Malic acid mg/berry
fw .5663 .0043 -.4223 .4531 .5307 -.2160 .4535 .3394 .4193
p=.000 p=.965 p=.000 p=.000 p=.000 p=.023 p=.000 p=.000 p=.000
Tot (gluc+fruc) mg/berry
fw
-.5353 .1263 .4016 -.3180 -.3982 .2483 -.3216 -.2233 -.2879
p=.000 p=.189 p=.000 p=.001 p=.000 p=.009 p=.001 p=.019 p=.002
Total tan mg/berry
fw .1573 .3551 .1765 .3000 .2694 .2770 .2907 .3305 .3046
p=.101 p=.000 p=.065 p=.001 p=.004 p=.003 p=.002 p=.000 p=.001
Total anth mg/berry
fw
-.5532 .1290 .4999 -.3519 -.4561 .3203 -.3667 -.2471 -.3303
p=.000 p=.179 p=.000 p=.000 p=.000 p=.001 p=.000 p=.009 p=.000 Carotenoids: Zeaxanthin (Zea); Lutein (Lut); 5,8-epoxy--carotene (ep-β-car); β-carotene (β-car); cis β-carotene (cis β-car); Total carotenoids (Total car) calculated as the sum of all detected carotenoid like compounds (see chapter 3) Chlorophyll: Chlorophyll a (Chl a); Chlorophyll b (Chl b); Total chlorophyll (Tot chl) calculated as the sum of all chlorophylls and detected chlorophyll derivatives (see chapter 3) Ripening parameters: Malic acid; Total glucose and fructose (Tot (gluc+fruc); Total tannin (Tot tan); Total antocyanin (Tot anth)
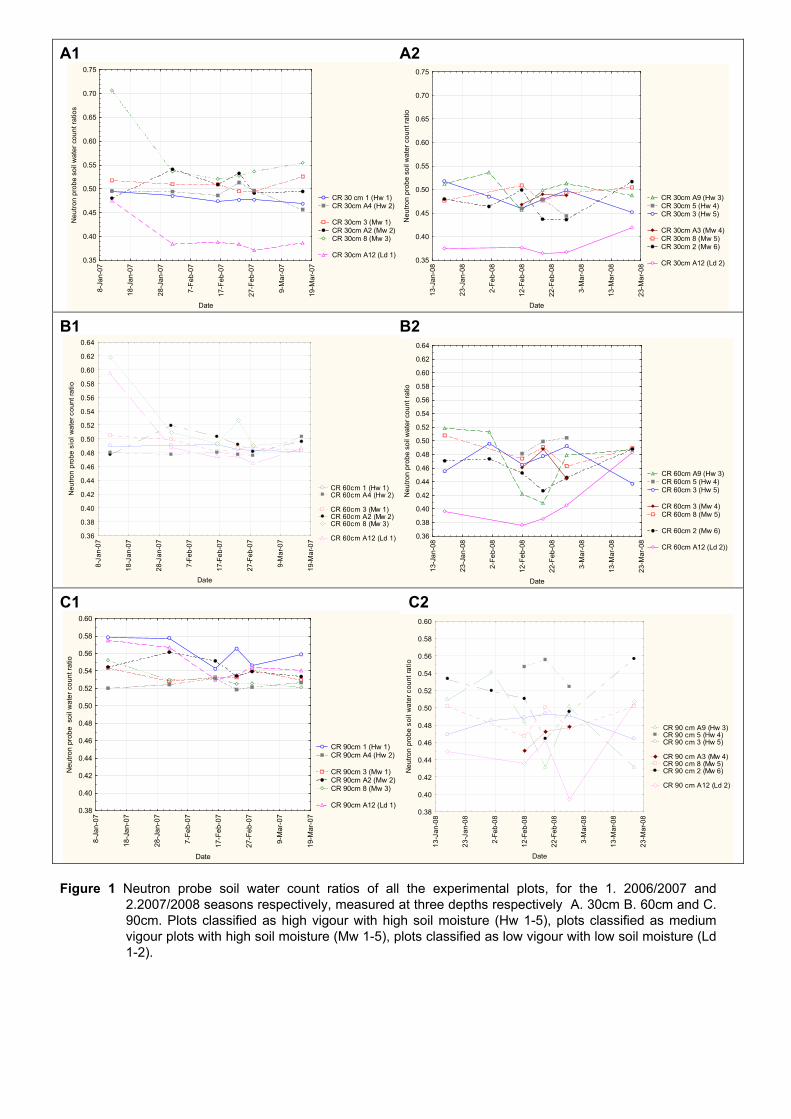
A1 A2
CR 30 cm 1 (Hw 1) CR 30cm A4 (Hw 2)
CR 30cm 3 (Mw 1) CR 30cm A2 (Mw 2) CR 30cm 8 (Mw 3)
CR 30cm A12 (Ld 1)
8-J
an
-07
18
-Ja
n-0
7
28
-Ja
n-0
7
7-F
eb
-07
17
-Fe
b-0
7
27
-Fe
b-0
7
9-M
ar-
07
19
-Ma
r-0
7Date
0.35
0.40
0.45
0.50
0.55
0.60
0.65
0.70
0.75N
eu
tro
n p
rob
e s
oil
wa
ter
cou
nt r
atio
s
CR 30cm A9 (Hw 3) CR 30cm 5 (Hw 4) CR 30cm 3 (Hw 5)
CR 30cm A3 (Mw 4) CR 30cm 8 (Mw 5) CR 30cm 2 (Mw 6)
CR 30cm A12 (Ld 2)
13
-Ja
n-0
8
23
-Ja
n-0
8
2-F
eb
-08
12
-Fe
b-0
8
22
-Fe
b-0
8
3-M
ar-
08
13
-Ma
r-0
8
23
-Ma
r-0
8
Date
0.35
0.40
0.45
0.50
0.55
0.60
0.65
0.70
0.75
Ne
utr
on
pro
be
so
il w
ate
r co
un
t ra
tio
B1 B2
CR 60cm 1 (Hw 1) CR 60cm A4 (Hw 2)
CR 60cm 3 (Mw 1) CR 60cm A2 (Mw 2) CR 60cm 8 (Mw 3)
CR 60cm A12 (Ld 1)
8-J
an
-07
18
-Ja
n-0
7
28
-Ja
n-0
7
7-F
eb
-07
17
-Fe
b-0
7
27
-Fe
b-0
7
9-M
ar-
07
19
-Ma
r-0
7
Date
0.36
0.38
0.40
0.42
0.44
0.46
0.48
0.50
0.52
0.54
0.56
0.58
0.60
0.62
0.64
Ne
utr
on
pro
be
sio
l w
ate
r c
ou
nt
rati
o
CR 60cm A9 (Hw 3) CR 60cm 5 (Hw 4) CR 60cm 3 (Hw 5)
CR 60cm 3 (Mw 4) CR 60cm 8 (Mw 5)
CR 60cm 2 (Mw 6)
CR 60cm A12 (Ld 2)) 1
3-J
an
-08
23
-Ja
n-0
8
2-F
eb
-08
12
-Fe
b-0
8
22
-Fe
b-0
8
3-M
ar-
08
13
-Ma
r-0
8
23
-Ma
r-0
8
Date
0.36
0.38
0.40
0.42
0.44
0.46
0.48
0.50
0.52
0.54
0.56
0.58
0.60
0.62
0.64
Ne
utr
on
pro
be
so
il w
ate
r co
un
t ra
tio
C1 C2
CR 90cm 1 (Hw 1) CR 90cm A4 (Hw 2)
CR 90cm 3 (Mw 1) CR 90cm A2 (Mw 2) CR 90cm 8 (Mw 3)
CR 90cm A12 (Ld 1)
8-J
an
-07
18
-Ja
n-0
7
28
-Ja
n-0
7
7-F
eb
-07
17-
Fe
b-0
7
27-
Fe
b-0
7
9-M
ar-
07
19-
Ma
r-0
7
Date
0.38
0.40
0.42
0.44
0.46
0.48
0.50
0.52
0.54
0.56
0.58
0.60
Ne
utr
on
pro
be
so
il w
ate
r co
unt r
atio
CR 90 cm A9 (Hw 3) CR 90 cm 5 (Hw 4) CR 90 cm 3 (Hw 5)
CR 90 cm A3 (Mw 4) CR 90 cm 8 (Mw 5) CR 90 cm 2 (Mw 6)
CR 90 cm A12 (Ld 2)
13
-Ja
n-0
8
23
-Ja
n-0
8
2-F
eb
-08
12
-Fe
b-0
8
22
-Fe
b-0
8
3-M
ar-
08
13
-Ma
r-0
8
23
-Ma
r-0
8
Date
0.38
0.40
0.42
0.44
0.46
0.48
0.50
0.52
0.54
0.56
0.58
0.60
Ne
utr
on
pro
be
so
il w
ate
r c
ou
nt
rati
o
Figure 1 Neutron probe soil water count ratios of all the experimental plots, for the 1. 2006/2007 and
2.2007/2008 seasons respectively, measured at three depths respectively A. 30cm B. 60cm and C. 90cm. Plots classified as high vigour with high soil moisture (Hw 1-5), plots classified as medium vigour plots with high soil moisture (Mw 1-5), plots classified as low vigour with low soil moisture (Ld 1-2).
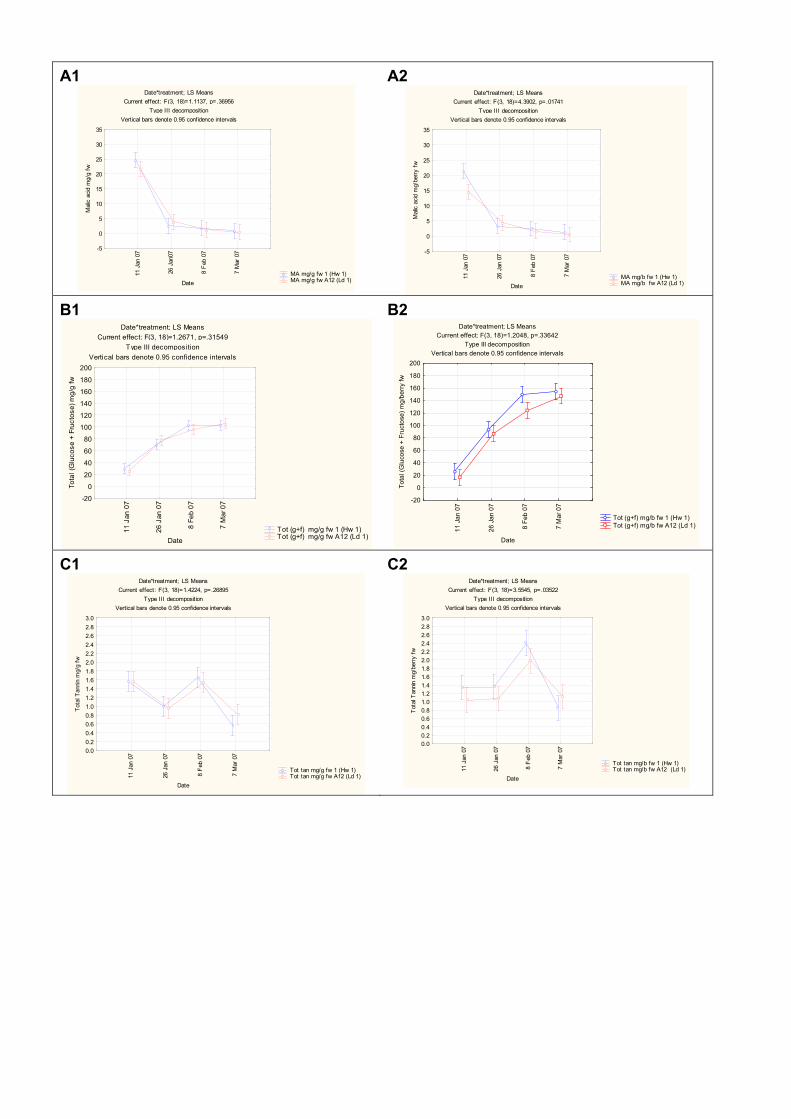
A1 Date*treatment; LS Means
Current effect: F(3, 18)=1.1137, p=.36956
Type III decomposition
Vertical bars denote 0.95 confidence intervals
MA mg/g fw 1 (Hw 1) MA mg/g fw A12 (Ld 1)
11 J
an 0
7
26 J
an07
8 F
eb 0
7
7 M
ar 0
7
Date
-5
0
5
10
15
20
25
30
35
Mal
ic a
cid
mg/
g fw
A2 Date*treatment; LS Means
Current effect: F(3, 18)=4.3902, p=.01741
Type III decomposition
Vertical bars denote 0.95 confidence intervals
MA mg/b fw 1 (Hw 1) MA mg/b fw A12 (Ld 1)
11 J
an 0
7
26 J
an 0
7
8 F
eb 0
7
7 M
ar 0
7
Date
-5
0
5
10
15
20
25
30
35
Mal
ic a
cid
mg/
berr
y fw
B1 Date*treatment; LS Means
Current effect: F(3, 18)=1.2671, p=.31549
Type III decomposition
Vertical bars denote 0.95 confidence intervals
Tot (g+f) mg/g fw 1 (Hw 1) Tot (g+f) mg/g fw A12 (Ld 1)
11
Ja
n 0
7
26
Ja
n 0
7
8 F
eb
07
7 M
ar
07
Date
-20
0
20
40
60
80
100
120
140
160
180
200
To
tal
(Glu
co
se
+ F
ruc
tos
e)
mg
/g f
w
B2 Date*treatment; LS Means
Current effect: F(3, 18)=1.2048, p=.33642Type III decomposition
Vertical bars denote 0.95 confidence intervals
Tot (g+f) mg/b fw 1 (Hw 1) Tot (g+f) mg/b fw A12 (Ld 1)
11
Ja
n 0
7
26
Ja
n 0
7
8 F
eb
07
7 M
ar
07
Date
-20
0
20
40
60
80
100
120
140
160
180
200
To
tal (
Glu
cose
+ F
ruct
ose
) m
g/b
err
y fw
C1 Date*treatment; LS Means
Current effect: F(3, 18)=1.4224, p=.26895
Type III decomposition
Vertical bars denote 0.95 confidence intervals
Tot tan mg/g fw 1 (Hw 1) Tot tan mg/g fw A12 (Ld 1)11
Jan
07
26 J
an 0
7
8 F
eb 0
7
7 M
ar 0
7
Date
0.0
0.2
0.4
0.6
0.8
1.0
1.2
1.4
1.6
1.8
2.0
2.2
2.4
2.6
2.8
3.0
Tot
al T
anni
n m
g/g
fw
C2 Date*treatment; LS Means
Current effect: F(3, 18)=3.5545, p=.03522
Type III decomposition
Vertical bars denote 0.95 confidence intervals
Tot tan mg/b fw 1 (Hw 1) Tot tan mg/b fw A12 (Ld 1)11
Jan
07
26 J
an 0
7
8 F
eb 0
7
7 M
ar 0
7
Date
0.0
0.2
0.4
0.6
0.8
1.01.2
1.4
1.6
1.8
2.0
2.2
2.4
2.6
2.8
3.0
Tot
al T
anni
n m
g/be
rry
fw
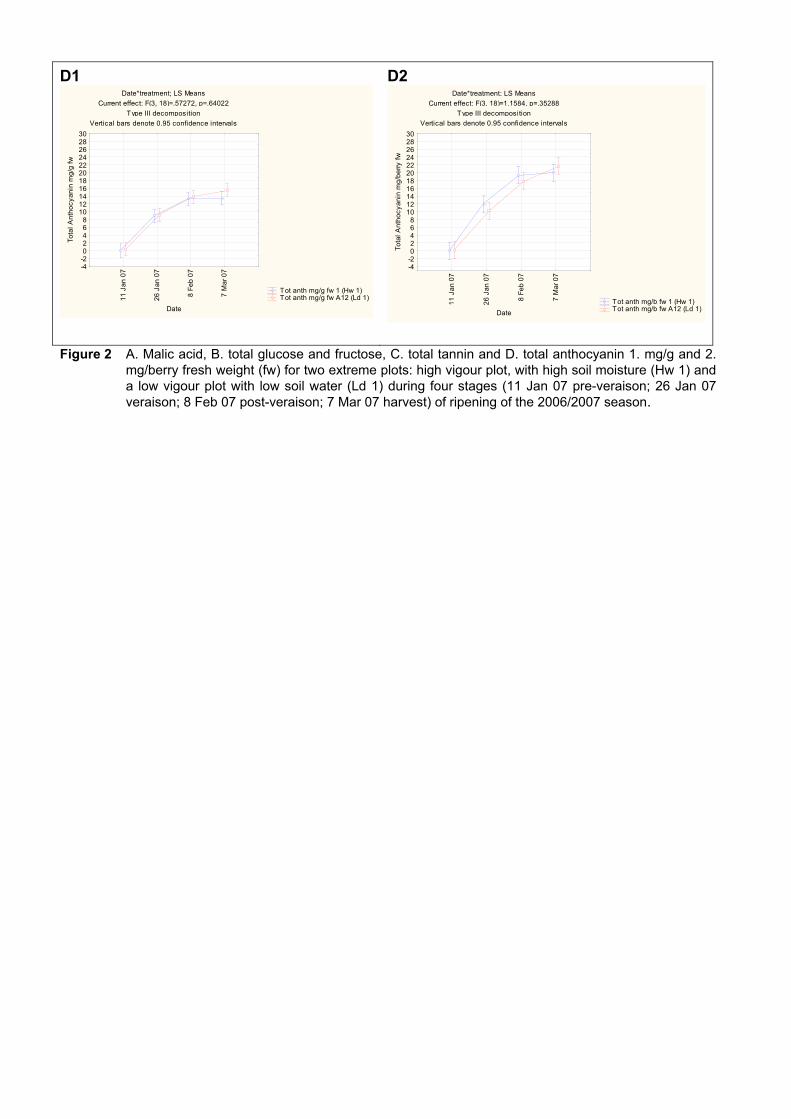
D1 Date*treatment; LS Means
Current effect: F(3, 18)=.57272, p=.64022
Type III decomposition
Vertical bars denote 0.95 confidence intervals
Tot anth mg/g fw 1 (Hw 1) Tot anth mg/g fw A12 (Ld 1)1
1 J
an
07
26
Ja
n 0
7
8 F
eb
07
7 M
ar
07
Date
-4-202468
1012141618202224262830
To
tal
An
tho
cy
an
in m
g/g
fw
D2 Date*treatment; LS Means
Current effect: F(3, 18)=1.1584, p=.35288
Type III decomposition
Vertical bars denote 0.95 confidence intervals
Tot anth mg/b fw 1 (Hw 1) Tot anth mg/b fw A12 (Ld 1)
11
Ja
n 0
7
26
Ja
n 0
7
8 F
eb
07
7 M
ar
07
Date
-4-202468
1012141618202224262830
To
tal
An
tho
cy
an
in m
g/b
err
y f
w
Figure 2 A. Malic acid, B. total glucose and fructose, C. total tannin and D. total anthocyanin 1. mg/g and 2.
mg/berry fresh weight (fw) for two extreme plots: high vigour plot, with high soil moisture (Hw 1) and a low vigour plot with low soil water (Ld 1) during four stages (11 Jan 07 pre-veraison; 26 Jan 07 veraison; 8 Feb 07 post-veraison; 7 Mar 07 harvest) of ripening of the 2006/2007 season.

A1 Date*treat; LS Means
Current effect: F(3, 24)=.47351, p=.70361Type III decomposition
Vertical bars denote 0.95 confidence intervals
MA mg/g fw A9 (Hw 3) MA mg/g fw A12 (Ld 2)
10
Ja
n 0
8
31
Ja
n 0
8
21
Fe
b 0
8
3 M
ar
08
Date
-5
0
5
10
15
20
25
30
Ma
lic a
cid
mg
/g fw
A2 Date*treat; LS Means
Current effect: F(3, 24)=1.1010, p=.36799
Type III decomposition
Vertical bars denote 0.95 confidence intervals
MA mg/b fw A9 (Hw 3) MA mg/b fw A12 (Ld 2)
10
Ja
n 0
8
31
Ja
n 0
8
21
Fe
b 0
8
3 M
ar
08
Date
-5
0
5
10
15
20
25
30
Ma
lic
ac
id m
g/b
err
y f
w
B1 Date*treat; LS Means
Current effect: F(3, 24)=.97544, p=.42068Type III decomposition
Vertical bars denote 0.95 confidence intervals
Tot (g+f) mg/g fw A9 (Hw 3) Tot (g+f) mg/g fw A12 (Ld 2)
10
Ja
n 0
8
31
Ja
n 0
8
21
Fe
b 0
8
3 M
ar
08
Date
-40
-20
0
20
40
60
80
100
120
140
160
180
200
220
240
To
tal
(Glu
cose
+ F
ruct
ose
) m
g/g
fw
B2 Date*treat; LS Means
Current effect: F(3, 24)=1.4430, p=.25501
Type III decomposition
Vertical bars denote 0.95 confidence intervals
Tot (g+f) mg/b fw A9 (Hw 3) Tot (g+f) mg/b fw A12 (Ld 2)
10
Ja
n 0
8
31
Ja
n 0
8
21
Fe
b 0
8
31
Ma
r 0
8
Date
-40-20
020406080
100120140160180200220240
To
tal
(Fru
cto
se
+ G
luc
os
e)
mg
/be
rry
fw
C1 Date*treat; LS Means
Current effect: F(3, 24)=14.869, p=.00001
Type III decomposition
Vertical bars denote 0.95 confidence intervals
Tot tan mg/g A9 (Hw 3) Tot tan mg/g A12 (Ld 2)
10 J
an 0
8
31 J
an 0
8
21 F
eb 0
8
3 M
ar 0
8
Date
0.00.2
0.4
0.60.8
1.0
1.2
1.4
1.6
1.8
2.0
2.2
2.42.6
Tot
al T
anni
n m
g/g
fw
C2 Date*treat; LS Means
Current effect: F(3, 24)=16.028, p=.00001
Type III decomposition
Vertical bars denote 0.95 confidence intervals
Tot tan mg/b fw A9 (Hw 3) Tot tan mg/b fw A12 (Ld 2)
10 J
an 0
8
31 J
an 0
8
21 F
eb 0
8
3 M
ar 0
8
Date
0.0
0.2
0.4
0.6
0.8
1.0
1.2
1.4
1.6
1.8
2.0
2.2
2.4
2.6
Tot
al T
anni
n m
g/be
rry
fw

D1Date*treat; LS Means
Current effect: F(3, 24)=.33325, p=.80138
Type III decomposition
Vertical bars denote 0.95 confidence intervals
Tot anth mg/g fw A9 (Hw 3) Tot anth mg/g fw A12 (Ld 2)
10 J
an 0
8
31 J
an 0
8
21 F
eb 0
8
3 M
ar 0
8
Date
-4
-2
0
2
4
6
8
10
12
14
16
18
20
22
24
26
Tot
al A
ntho
cyan
in m
g/g
fw
D2 Date*treat; LS Means
Current effect: F(3, 24)=1.2347, p=.31890
Type III decomposition
Vertical bars denote 0.95 confidence intervals
Tot anth mg/b fw A9 (Hw 3) Tot anth mg/b fw A12 (Ld 2)
10 J
an 0
8
31 J
an 0
8
21 F
eb 0
8
3 M
ar 0
8
Date
-4
-2
0
2
4
6
8
10
12
14
16
18
20
22
24
26
Tot
al A
ntho
cyan
in m
g/be
rry
fw
Figure 3 A. Malic acid, B. total glucose and fructose, C. total tannin, D. total anthocyanin 1. mg/g and 2. mg/berry fresh weight (fw) for two extreme plots: high vigour plot, with high soil moisture (Hw 3) and a low vigour plot with low soil water (Ld 2) during four stages (10 Jan 08 pre-veraison; 31 Jan 08 post-veraison; 21 Feb 08 post-veraison; 7 Mar 08 harvest) of ripening of the 2007/2008 season.

A1 Date*treatment; LS Means
Current effect: F(3, 18)=1.2981, p=.30560Type III decomposition
Vertical bars denote 0.95 confidence intervals
Zea ug/g fw 1 (Hw 1) Zea ug/g fw A12 (Ld 1)11
Jan
07
26
Ja
n0
7
8 F
eb
07
7 M
ar
07
Date
-0.10
-0.05
0.00
0.05
0.10
0.15
0.20
0.25
0.30
0.35
Ze
axa
nth
in µ
g/g
fw
A2 Date*treatment; LS Means
Current effect: F(3, 18)=.43216, p=.73253
Type III decomposition
Vertical bars denote 0.95 confidence intervals
Zea ug/b fw 1 (Hw 1) Zea ug/b fw A12 (Ld 1)
11 J
an 0
7
26 J
an 0
7
8 F
eb 0
7
7 M
ar 0
7
Date
-0.10
-0.05
0.00
0.05
0.10
0.15
0.20
0.25
0.30
0.35
Zea
xant
hin
µg/b
erry
fw
B1 Date*treatment; LS Means
Current effect: F(3, 18)=1.2011, p=.33771
Type III decomposition
Vertical bars denote 0.95 confidence intervals
Lut ug/g fw 1 (Hw 1) Lut ug/g fw A12 (Ld 1)11
Jan
07
26 J
an 0
7
8 F
eb 0
7
7 M
ar 0
7
Date
0.6
0.8
1.0
1.2
1.4
1.6
1.8
2.0
2.2
2.4
2.6
2.8
3.0
Lute
in µ
g/g
fw
B2 Date*treatment; LS Means
Current effect: F(3, 18)=2.7017, p=.07624
Type III decomposition
Vertical bars denote 0.95 confidence intervals
Lut ug/b fw 1 (Hw 1) Lut ug/b fw A12 (Ld 1)11
Jan
07
26 J
an 0
7
8 F
eb 0
7
7 M
ar 0
7
Date
0.6
0.8
1.0
1.2
1.4
1.6
1.8
2.0
2.2
2.4
2.6
2.8
3.0
Lute
in µ
g/be
rry
fw
C1 Date*treatment; LS Means
Current effect: F(3, 18)=8.0851, p=.00128
Type III decomposition
Vertical bars denote 0.95 confidence intervals
cis- Vio ug/g 1 (Hw 1) cis- Vio ug/g A12 (Ld 1)
11 J
an 0
7
26 J
an 0
7
8 F
eb 0
7
7 M
ar 0
7
Date
-0.2
-0.1
0.0
0.1
0.2
0.3
0.4
0.5
0.6
0.7
5,8-
epox
y--
caro
tene
µg/
g fw
C2 Date*treatment; LS Means
Current effect: F(3, 18)=9.7200, p=.00049
Type III decomposition
Vertical bars denote 0.95 confidence intervals
cis- Vio ug/b fw 1 (Hw 1) cis- Vio ug/b fw A12 (Ld 1)
11 J
an 0
7
26 J
an 0
7
8 F
eb 0
7
7 M
ar 0
7
Date
-0.2
-0.1
0.0
0.1
0.2
0.3
0.4
0.5
0.6
0.7
5,8-
epox
y--
caro
tene
µg/
berr
y fw
Figure 4a Individual (A to E) and (F) total carotenoid 1. µg/g and 2. µg/berry fresh weight (fw) for two
extreme plots: high vigour plot, with high soil moisture (Hw 1) and a low vigour plot with low soil water (Ld 1) during four stages (11 Jan 07 pre-veraison; 26 Jan 07 veraison; 8 Feb 07; post-veraison; 7 Mar 07 harvest) of ripening of the 2006/2007 season.

D1 Date*treatment; LS Means
Current effect: F(3, 18)=1.2732, p=.31352
Type III decomposition
Vertical bars denote 0.95 confidence intervals
B-car ug/g fw 1 (Hw 1) B-car ug/g fw A12 (Ld 1)
11 J
an 0
7
26 J
an 0
7
8 F
eb 0
7
7 M
ar 0
7
Date
0.1
0.2
0.3
0.4
0.5
0.6
0.7
0.8
0.9
1.0
1.1
1.2
1.3
1.4
1.5
β-c
arot
ene
µg/
g fw
D2 Date*treatment; LS Means
Current effect: F(3, 18)=2.2038, p=.12283
Type III decomposition
Vertical bars denote 0.95 confidence intervals
B-car ug/b fw 1 (Hw 1) B-car ug/b fw A12 (Ld 1)11
Jan
07
26 J
an 0
7
8 F
en 0
7
7 M
ar 0
7
Date
0.1
0.2
0.3
0.4
0.5
0.6
0.7
0.8
0.9
1.0
1.1
1.2
1.3
1.4
1.5
β-c
arot
ene
µg/b
erry
fw
E1 Date*treatment; LS Means
Current effect: F(3, 18)=.49408, p=.69089Type III decomposition
Vertical bars denote 0.95 confidence intervals
cis- B-car ug/g fw 1 (Hw 1) cis- B-car ug/g fw A12 (Ld 1)
11
Ja
n 0
7
26
Ja
n 0
7
8 F
eb
07
7 M
ar
07
Date
0.00
0.02
0.04
0.06
0.08
0.10
0.12
0.14
0.16
0.18
0.20
cis-
β-c
aro
ten
e u
n µ
g/g
fw
E2 Date*treatment; LS Means
Current effect: F(3, 18)=1.1628, p=.35129
Type III decomposition
Vertical bars denote 0.95 confidence intervals
cis- B-car ug/b fw 1 (Hw 1) cis- B-car ug/b fw A12 (Ld 1)1
1 J
an
07
26
Ja
n 0
7
8 F
eb
07
7 M
ar
07
Date
0.00
0.02
0.04
0.06
0.08
0.10
0.12
0.14
0.16
0.18
0.20c
is- β
-ca
rote
ne
µ
g/b
err
y f
w
F1 Date*treatment; LS Means
Current effect: F(3, 18)=1.2481, p=.32173
Type III decomposition
Vertical bars denote 0.95 confidence intervals
Tot car g/g fw 1 (Hw 1) Tot car g/g fw A12 (Ld 1)1
1 J
an
07
26
Ja
n 0
7
8 F
eb
07
7 M
ar
07
Date
1.0
1.5
2.0
2.5
3.0
3.5
4.0
4.5
5.0
5.5
To
tal
Ca
rote
no
ids
µg
/g f
w
F2 Date*treatment; LS Means
Current effect: F(3, 18)=2.6601, p=.07928Type III decomposition
Vertical bars denote 0.95 confidence intervals
Tot car ug/b fw 1 (Hw 1) Tot car ug/b fw A12 (Ld 1)
11
Ja
n 0
7
26
Ja
n 0
7
8 F
eb
07
7 M
ar
07
Date
1.0
1.5
2.0
2.5
3.0
3.5
4.0
4.5
5.0
5.5
To
tal C
aro
ten
oid
s µ
g/b
err
y fw
Figure 4b Individual (A to E) and total (F) carotenoid 1. µg/g and 2. µg/berry fresh weight (fw) for two extreme
plots: high vigour plot, with high soil moisture (Hw 1) and a low vigour plot with low soil water (Ld 1) during four stages (11 Jan 07 pre-veraison; 26 Jan 07 veraison; 8 Feb 07; post-veraison; 7 Mar 07 harvest) of ripening of the 2006/2007 season.

A1 Date*treatment; LS Means
Current effect: F(3, 18)=.72394, p=.55078
Type III decomposition
Vertical bars denote 0.95 confidence intervals
Chl a ug/g fw 1 (Hw 1) Chla a ug/g A12 (Ld 1)
11
Ja
n 0
7
26
Ja
n 0
7
8 F
eb
07
7 M
ar
07
Date
02468
101214161820222426283032
Ch
loro
ph
yll
a µ
g/g
fw
A2 Date*treatment; LS Means
Current effect: F(3, 18)=1.5837, p=.22810
Type III decomposition
Vertical bars denote 0.95 confidence intervals
Chl a ug/b fw 1 (Hw 1) Chl a ug/b fw A12 (Ld 1)
11
Ja
n 0
7
26
Ja
n 0
7
8 F
eb
07
7 M
ar
07
Date
02468
101214161820222426283032
Ch
loro
ph
yll
a µ
g/b
err
y f
w
B1 Date*treatment; LS Means
Current effect: F(3, 24)=1.6643, p=.20120
Type III decomposition
Vertical bars denote 0.95 confidence intervals
Chl b ug/g fw 1 (Hw 1) Chl b ug/g fw A12 (Ld 1)
11
Ja
n 0
7
26
Ja
n 0
7
8 F
eb
07
7 M
ar
07
Date
0
1
2
3
4
5
6
7
8
9
10
Ch
loro
ph
yll
b u
g/g
fw
B2 Date*treatment; LS Means
Current effect: F(3, 24)=5.2134, p=.00649Type III decomposition
Vertical bars denote 0.95 confidence intervals
Chl b ug/berry 1 (Hw 1) Chl b ug/berry A12 (Ld 1)1
1 J
an
07
26
Ja
n 0
7
8 F
eb
07
7 M
ar
07
Date
0
1
2
3
4
5
6
7
8
9
10
Ch
loro
ph
yll b
ug
/be
rry
fw
C1 Date*treatment; LS Means
Current effect: F(3, 18)=.99110, p=.41931
Type III decomposition
Vertical bars denote 0.95 confidence intervals
Tot chl ug/g fw 1 (Hw 1) Tot chl ug/g fw A12 (Ld 1)11
Jan
07
26 J
an 0
7
8 F
eb 0
7
7 M
ar 0
7
Date
0
5
10
15
20
25
30
35
40
45
Tot
al C
hlor
ophy
ll µg
/g f
w
C2 Date*treatment; LS Means
Current effect: F(3, 18)=2.0890, p=.13747
Type III decomposition
Vertical bars denote 0.95 confidence intervals
Tot chl ug/b fw 1 (Hw 1) Tot chl ug/b fw A12 (Ld 1)1
1 J
an
07
26
Ja
n 0
7
8 F
eb
07
7 M
ar
07
Date
0
5
10
15
20
25
30
35
40
45
To
tal
Ch
loro
ph
yll
µg
/be
rry
fw
Figure 5 Individual (A and B) and C. total chlorophyll 1. µg/g and 2. µg/berry fresh weight (fw) for two extreme
plots: high vigour plot, with high soil moisture (Hw 1) and a low vigour plot with low soil water (Ld 1) during four stages (11 Jan 07 pre-veraison; 26 Jan 07 veraison; 8 Feb 07; post-veraison; 7 Mar 07 harvest) of ripening of the 2006/2007 season.
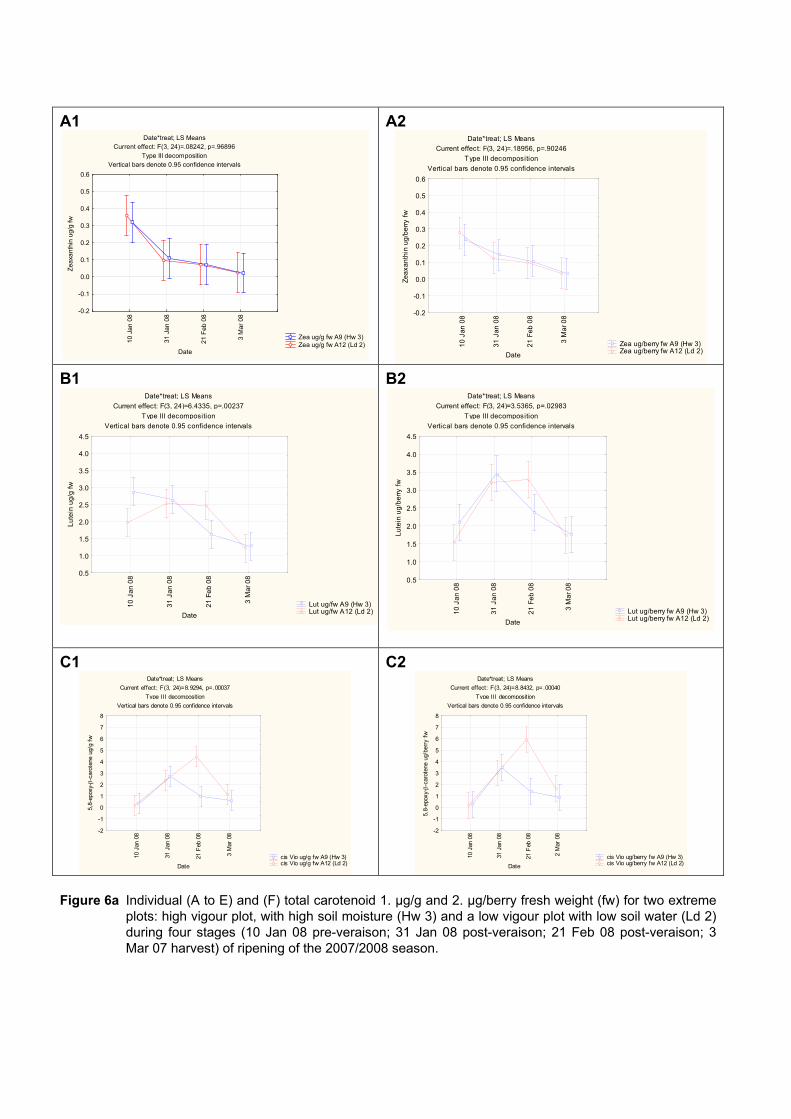
A1 Date*treat; LS Means
Current effect: F(3, 24)=.08242, p=.96896Type III decomposition
Vertical bars denote 0.95 confidence intervals
Zea ug/g fw A9 (Hw 3) Zea ug/g fw A12 (Ld 2)
10
Ja
n 0
8
31
Ja
n 0
8
21
Fe
b 0
8
3 M
ar
08
Date
-0.2
-0.1
0.0
0.1
0.2
0.3
0.4
0.5
0.6
Ze
axa
nth
in u
g/g
fw
A2 Date*treat; LS Means
Current effect: F(3, 24)=.18956, p=.90246
Type III decomposition
Vertical bars denote 0.95 confidence intervals
Zea ug/berry fw A9 (Hw 3) Zea ug/berry fw A12 (Ld 2)
10
Ja
n 0
8
31
Ja
n 0
8
21
Fe
b 0
8
3 M
ar
08
Date
-0.2
-0.1
0.0
0.1
0.2
0.3
0.4
0.5
0.6
Ze
ax
an
thin
ug
/be
rry
fw
B1 Date*treat; LS Means
Current effect: F(3, 24)=6.4335, p=.00237
Type III decomposition
Vertical bars denote 0.95 confidence intervals
Lut ug/fw A9 (Hw 3) Lut ug/fw A12 (Ld 2)
10
Ja
n 0
8
31
Ja
n 0
8
21
Fe
b 0
8
3 M
ar
08
Date
0.5
1.0
1.5
2.0
2.5
3.0
3.5
4.0
4.5
Lu
tein
ug
/g f
w
B2 Date*treat; LS Means
Current effect: F(3, 24)=3.5365, p=.02983
Type III decomposition
Vertical bars denote 0.95 confidence intervals
Lut ug/berry fw A9 (Hw 3) Lut ug/berry fw A12 (Ld 2)
10
Ja
n 0
8
31
Ja
n 0
8
21
Fe
b 0
8
3 M
ar
08
Date
0.5
1.0
1.5
2.0
2.5
3.0
3.5
4.0
4.5
Lu
tein
ug
/be
rry
fw
C1 Date*treat; LS Means
Current effect: F(3, 24)=8.9294, p=.00037
Type III decomposition
Vertical bars denote 0.95 confidence intervals
cis Vio ug/g fw A9 (Hw 3) cis Vio ug/g fw A12 (Ld 2)
10 J
an 0
8
31 J
an 0
8
21 F
eb 0
8
3 M
ar 0
8
Date
-2
-1
0
1
2
3
4
5
6
7
8
5,8-
epox
y--
caro
tene
ug/
g fw
C2 Date*treat; LS Means
Current effect: F(3, 24)=8.8432, p=.00040
Type III decomposition
Vertical bars denote 0.95 confidence intervals
cis Vio ug/berry fw A9 (Hw 3) cis Vio ug/berry fw A12 (Ld 2)
10 J
an 0
8
31 J
an 0
8
21 F
eb 0
8
2 M
ar 0
8
Date
-2
-1
0
1
2
3
4
5
6
7
8
5,8-
epox
y--
caro
tene
ug/
berr
y fw
Figure 6a Individual (A to E) and (F) total carotenoid 1. µg/g and 2. µg/berry fresh weight (fw) for two extreme
plots: high vigour plot, with high soil moisture (Hw 3) and a low vigour plot with low soil water (Ld 2) during four stages (10 Jan 08 pre-veraison; 31 Jan 08 post-veraison; 21 Feb 08 post-veraison; 3 Mar 07 harvest) of ripening of the 2007/2008 season.
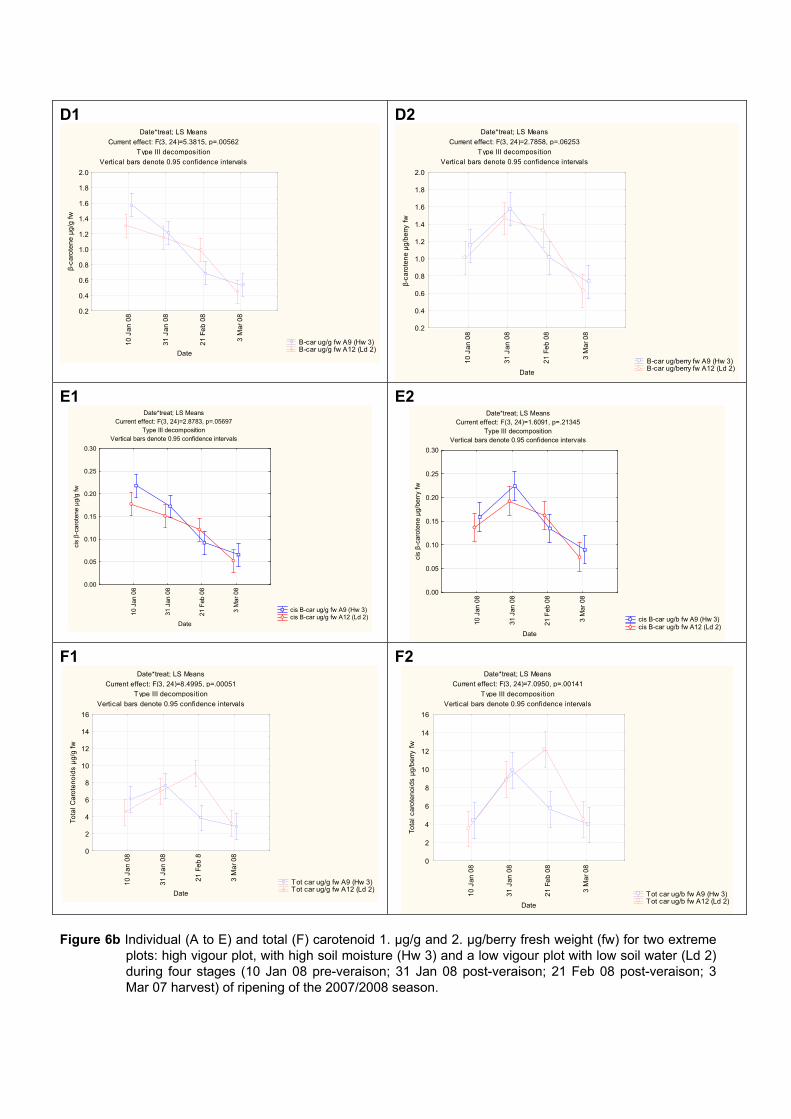
D1 Date*treat; LS Means
Current effect: F(3, 24)=5.3815, p=.00562
Type III decomposition
Vertical bars denote 0.95 confidence intervals
B-car ug/g fw A9 (Hw 3) B-car ug/g fw A12 (Ld 2)
10
Ja
n 0
8
31
Ja
n 0
8
21
Fe
b 0
8
3 M
ar
08
Date
0.2
0.4
0.6
0.8
1.0
1.2
1.4
1.6
1.8
2.0
β-c
aro
ten
e µ
g/g
fw
D2 Date*treat; LS Means
Current effect: F(3, 24)=2.7858, p=.06253
Type III decomposition
Vertical bars denote 0.95 confidence intervals
B-car ug/berry fw A9 (Hw 3) B-car ug/berry fw A12 (Ld 2)
10
Ja
n 0
8
31
Ja
n 0
8
21
Fe
b 0
8
3 M
ar
08
Date
0.2
0.4
0.6
0.8
1.0
1.2
1.4
1.6
1.8
2.0
β-c
aro
ten
e µ
g/b
err
y f
w
E1 Date*treat; LS Means
Current effect: F(3, 24)=2.8783, p=.05697Type III decomposition
Vertical bars denote 0.95 confidence intervals
cis B-car ug/g fw A9 (Hw 3) cis B-car ug/g fw A12 (Ld 2)
10 J
an 0
8
31 J
an 0
8
21 F
eb 0
8
3 M
ar 0
8
Date
0.00
0.05
0.10
0.15
0.20
0.25
0.30
cis β
-car
oten
e µ
g/g
fw
E2 Date*treat; LS Means
Current effect: F(3, 24)=1.6091, p=.21345Type III decomposition
Vertical bars denote 0.95 confidence intervals
cis B-car ug/b fw A9 (Hw 3) cis B-car ug/b fw A12 (Ld 2)
10 J
an 0
8
31 J
an 0
8
21 F
eb 0
8
3 M
ar 0
8
Date
0.00
0.05
0.10
0.15
0.20
0.25
0.30
cis β
-car
oten
e µ
g/be
rry
fw
F1 Date*treat; LS Means
Current effect: F(3, 24)=8.4995, p=.00051
Type III decomposition
Vertical bars denote 0.95 confidence intervals
Tot car ug/g fw A9 (Hw 3) Tot car ug/g fw A12 (Ld 2)
10
Ja
n 0
8
31
Ja
n 0
8
21
Fe
b 8
3 M
ar
08
Date
0
2
4
6
8
10
12
14
16
To
tal
Ca
rote
no
ids
µg
/g f
w
F2 Date*treat; LS Means
Current effect: F(3, 24)=7.0950, p=.00141
Type III decomposition
Vertical bars denote 0.95 confidence intervals
Tot car ug/b fw A9 (Hw 3) Tot car ug/b fw A12 (Ld 2)
10
Ja
n 0
8
31
Ja
n 0
8
21
Fe
b 0
8
3 M
ar
08
Date
0
2
4
6
8
10
12
14
16
To
tal
ca
rote
no
ids
µg
/be
rry
fw
Figure 6b Individual (A to E) and total (F) carotenoid 1. µg/g and 2. µg/berry fresh weight (fw) for two extreme
plots: high vigour plot, with high soil moisture (Hw 3) and a low vigour plot with low soil water (Ld 2) during four stages (10 Jan 08 pre-veraison; 31 Jan 08 post-veraison; 21 Feb 08 post-veraison; 3 Mar 07 harvest) of ripening of the 2007/2008 season.
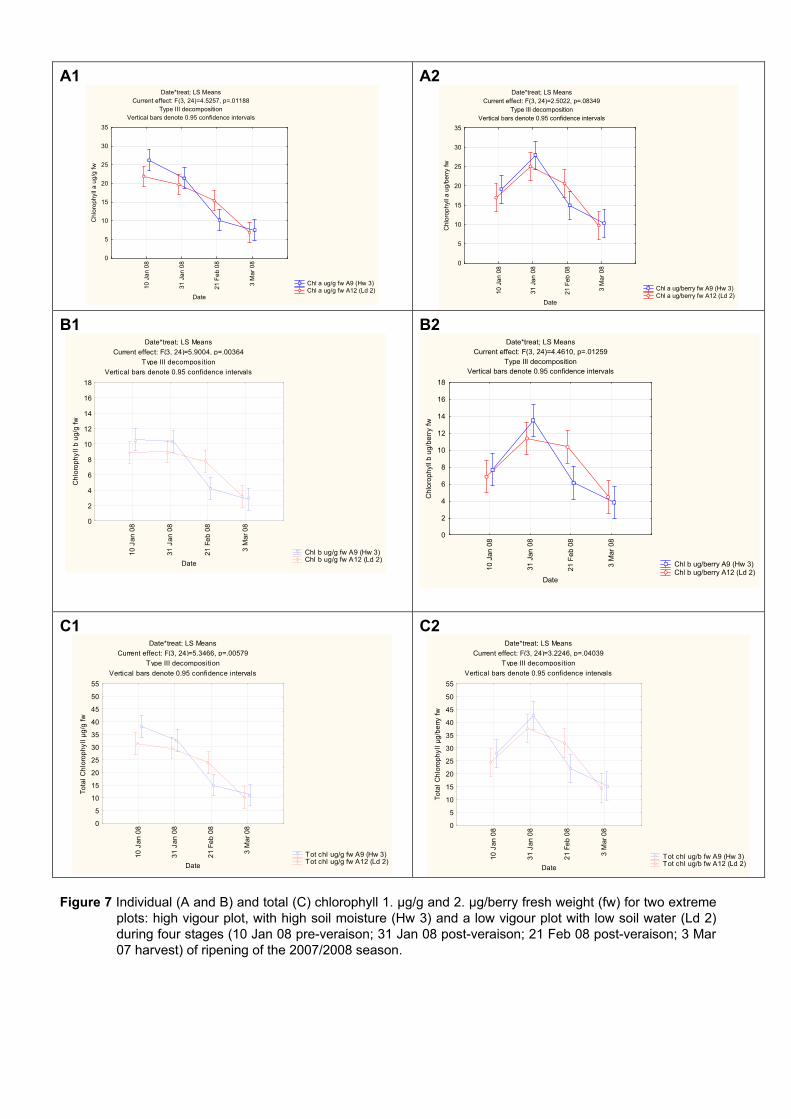
A1 Date*treat; LS Means
Current effect: F(3, 24)=4.5257, p=.01188Type III decomposition
Vertical bars denote 0.95 confidence intervals
Chl a ug/g fw A9 (Hw 3) Chl a ug/g fw A12 (Ld 2)
10
Ja
n 0
8
31
Ja
n 0
8
21
Fe
b 0
8
3 M
ar
08
Date
0
5
10
15
20
25
30
35
Ch
loro
phyl
l a u
g/g
fw
A2 Date*treat; LS Means
Current effect: F(3, 24)=2.5022, p=.08349Type III decomposition
Vertical bars denote 0.95 confidence intervals
Chl a ug/berry fw A9 (Hw 3) Chl a ug/berry fw A12 (Ld 2)
10 J
an 0
8
31 J
an 0
8
21
Feb
08
3 M
ar
08
Date
0
5
10
15
20
25
30
35
Chl
orop
hyll
a ug
/ber
ry fw
B1 Date*treat; LS Means
Current effect: F(3, 24)=5.9004, p=.00364
Type III decomposition
Vertical bars denote 0.95 confidence intervals
Chl b ug/g fw A9 (Hw 3) Chl b ug/g fw A12 (Ld 2)
10
Ja
n 0
8
31
Ja
n 0
8
21
Fe
b 0
8
3 M
ar
08
Date
0
2
4
6
8
10
12
14
16
18
Ch
loro
ph
yll
b u
g/g
fw
B2 Date*treat; LS Means
Current effect: F(3, 24)=4.4610, p=.01259Type III decomposition
Vertical bars denote 0.95 confidence intervals
Chl b ug/berry A9 (Hw 3) Chl b ug/berry A12 (Ld 2)
10 J
an 0
8
31 J
an 0
8
21 F
eb
08
3 M
ar 0
8
Date
0
2
4
6
8
10
12
14
16
18
Chl
orop
hyll
b ug
/ber
ry f
w
C1 Date*treat; LS Means
Current effect: F(3, 24)=5.3466, p=.00579
Type III decomposition
Vertical bars denote 0.95 confidence intervals
Tot chl ug/g fw A9 (Hw 3) Tot chl ug/g fw A12 (Ld 2)
10
Ja
n 0
8
31
Ja
n 0
8
21
Fe
b 0
8
3 M
ar
08
Date
0
5
10
15
20
25
30
35
40
45
50
55
To
tal
Ch
loro
ph
yll
µg
/g f
w
C2 Date*treat; LS Means
Current effect: F(3, 24)=3.2246, p=.04039
Type III decomposition
Vertical bars denote 0.95 confidence intervals
Tot chl ug/b fw A9 (Hw 3) Tot chl ug/b fw A12 (Ld 2)
10
Ja
n 0
8
31
Ja
n 0
8
21
Fe
b 0
8
3 M
ar
08
Date
0
5
10
15
20
25
30
35
40
45
50
55
To
tal
Ch
loro
ph
yll
µg
/be
rry
fw
Figure 7 Individual (A and B) and total (C) chlorophyll 1. µg/g and 2. µg/berry fresh weight (fw) for two extreme
plots: high vigour plot, with high soil moisture (Hw 3) and a low vigour plot with low soil water (Ld 2) during four stages (10 Jan 08 pre-veraison; 31 Jan 08 post-veraison; 21 Feb 08 post-veraison; 3 Mar 07 harvest) of ripening of the 2007/2008 season.

A
B
Figure 8 PCA analysis of vineyard variables, ripening parameters and carotenoids and chlorophyll content of
berries post-veraison (8 Feb 07) 2006/2007 season. A. Scores: high vigour wet plots (Hw 1;Hw 2); medium vigour wet plots (Mw 1; Mw 2; Mw 3) and low vigour plot (Ld 1), (a; b; c and d; indicates the four replicates from sub-plots). B. Correlation loadings (X): average seasonal predawn plant water potential (pdwp); average seasonal soil water content (cr/3) later shoot length (l sh); pruning mass per vine (pru/v); average number of shoots per vine (# sh); number of lateral shoots (#l sh); average shoot diameter (~sh d) bunch mass (bu/m); yield per vine (harv); fresh weight per berry (fw/b) malic acid (malic); total glucose and fructose (g+f); total anthocyanin (anth) 5,8-epoxy--carotene (ep-B); lutein (lut); β-carotene (B-car); chlorophyll a (chl a); cis- β-carotene (cis-B); zeaxanthin (zea); chlorophyll b (chl b); Total carotenoids (T car); Total chlorophyll (T chl).
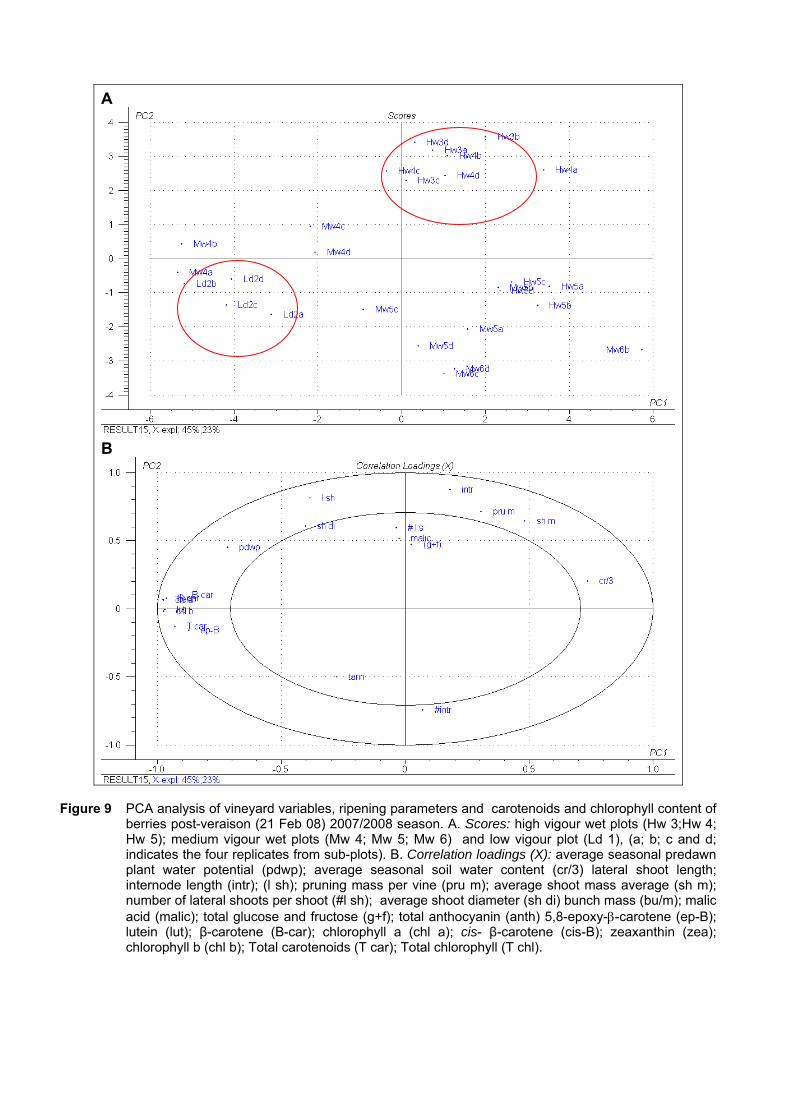
A
B
Figure 9 PCA analysis of vineyard variables, ripening parameters and carotenoids and chlorophyll content of
berries post-veraison (21 Feb 08) 2007/2008 season. A. Scores: high vigour wet plots (Hw 3;Hw 4; Hw 5); medium vigour wet plots (Mw 4; Mw 5; Mw 6) and low vigour plot (Ld 1), (a; b; c and d; indicates the four replicates from sub-plots). B. Correlation loadings (X): average seasonal predawn plant water potential (pdwp); average seasonal soil water content (cr/3) lateral shoot length; internode length (intr); (l sh); pruning mass per vine (pru m); average shoot mass average (sh m); number of lateral shoots per shoot (#l sh); average shoot diameter (sh di) bunch mass (bu/m); malic acid (malic); total glucose and fructose (g+f); total anthocyanin (anth) 5,8-epoxy--carotene (ep-B); lutein (lut); β-carotene (B-car); chlorophyll a (chl a); cis- β-carotene (cis-B); zeaxanthin (zea); chlorophyll b (chl b); Total carotenoids (T car); Total chlorophyll (T chl).

A1 Date; LS Means
Current effect: F(3, 90)=66.537, p=0.0000
Effective hypothesis decomposition
Vertical bars denote 0.95 confidence intervals
11-J
an-0
7
26-J
an-0
7
8-F
eb-0
7
7-M
ar-0
7
Date
-0.04
-0.02
0.00
0.02
0.04
0.06
0.08
0.10
0.12
0.14
0.16
0.18
0.20
0.22
0.24
0.26
0.28
Zea
xant
hin
µg/b
erry
fw
A2 Date; LS Means
Current effect: F(3, 106)=25.150, p=.00000
Effective hypothesis decomposition
Vertical bars denote 0.95 confidence intervals
10
-Ja
n-0
8
31
-Ja
n-0
8
21
-Fe
b-0
8
3-M
ar-
08
Date
-0.04-0.020.000.020.040.060.080.100.120.140.160.180.200.220.240.260.28
Ze
ax
an
thin
µg
/be
rry
fw
B1 Date; LS Means
Current effect: F(3, 90)=39.933, p=.00000
Effective hypothesis decomposition
Vertical bars denote 0.95 confidence intervals
11-J
an-0
7
26-J
an-0
7
8-F
eb-0
7
7-M
ar-0
7
Date
-1.0
-0.5
0.0
0.5
1.0
1.5
2.0
2.5
3.0
3.5
4.0
4.5
5,8-
epox
y--
caro
tene
µg
/ber
ry f
w
B2 Date; LS Means
Current effect: F(3, 106)=17.739, p=.00000
Effective hypothesis decomposition
Vertical bars denote 0.95 confidence intervals
10-J
an-0
8
31-J
an-0
8
21-F
eb-0
8
3-M
ar-0
8
Date
-1.0
-0.5
0.0
0.5
1.0
1.5
2.0
2.5
3.0
3.5
4.0
4.5
5,8-
epox
y--
caro
tene
µg
/ber
ry f
w
C1 Date; LS Means
Current effect: F(3, 90)=13.283, p=.00000Effective hypothesis decomposition
Vertical bars denote 0.95 confidence intervals
11
-Ja
n-0
7
26
-Ja
n-0
7
8-F
eb-0
7
7-M
ar-0
7
Date
1.2
1.4
1.6
1.8
2.0
2.2
2.4
2.6
2.8
3.0
3.2
3.4
Lu
tein
µg
/be
rry
fw
C2 Date; LS Means
Current effect: F(3, 106)=23.105, p=.00000
Effective hypothesis decomposition
Vertical bars denote 0.95 confidence intervals
10
-Ja
n-0
8
31
-Ja
n-0
8
21
-Fe
b-0
8
3-M
ar-
08
Date
1.2
1.4
1.6
1.8
2.0
2.2
2.4
2.6
2.8
3.0
3.2
3.4
Lu
tein
µg
/be
rry
fw
Figure 10a Individual (A to E) and total (F) carotenoid content µg/berry of Merlot berries of four ripening stages
during the 1. 2006/2007 (pre-veraison 11 Jan 07; veraison 26 Jan 07; post-veraison 8 Feb 07; harvest 7 Mar 07) and 2. 2007/2008 (pre-veraison 10 Jan 08; post- veraison 31 Jan 08; post-veraison 21 Feb 08; harvest 3 Mar 08) seasons respectively.

D1 Date; LS Means
Current effect: F(3, 90)=20.826, p=.00000
Effective hypothesis decomposition
Vertical bars denote 0.95 confidence intervals
11-J
an-0
7
26-J
an-0
7
8-F
eb-0
7
7-M
ar-0
7
Date
0.4
0.5
0.6
0.7
0.8
0.9
1.0
1.1
1.2
1.3
1.4
1.5
β-c
aror
tene
µg/
berr
y fw
D2 Date; LS Means
Current effect: F(3, 106)=44.842, p=0.0000
Effective hypothesis decomposition
Vertical bars denote 0.95 confidence intervals
10-J
an-0
8
31-J
an-0
8
21-F
eb-0
8
3-M
ar-0
8
Date
0.4
0.5
0.6
0.7
0.8
0.9
1.0
1.1
1.2
1.3
1.4
1.5
β-c
arot
ene
µg/b
erry
fw
E1 Date; LS Means
Current effect: F(3, 90)=40.602, p=.00000
Effective hypothesis decomposition
Vertical bars denote 0.95 confidence intervals
11-J
an-0
7
26-J
an-0
7
8-F
eb-0
7
7-M
ar-0
7
Date
0.02
0.04
0.06
0.08
0.10
0.12
0.14
0.16
0.18
0.20
0.22
cis-
β-c
arot
ene
un µ
g/be
rry
fw
E2 Date; LS Means
Current effect: F(3, 106)=56.492, p=0.0000
Effective hypothesis decomposition
Vertical bars denote 0.95 confidence intervals
10-J
an-0
8
31-J
an-0
8
21-F
eb-0
8
3-M
ar-0
8
Date
0.02
0.04
0.06
0.08
0.10
0.12
0.14
0.16
0.18
0.20
0.22
cis-
β-c
arot
ne
µg/b
erry
fw
F1 Date; LS Means
Current effect: F(3, 90)=9.8676, p=.00001
Effective hypothesis decomposition
Vertical bars denote 0.95 confidence intervals
11-J
an-0
7
26-J
an-0
7
8-F
eb-0
7
7-M
ar-0
7
Date
1
2
3
4
5
6
7
8
9
10
Tot
al c
arot
enoi
ds µ
g/be
rry
fw
F2 Date; LS Means
Current effect: F(3, 106)=16.387, p=.00000
Effective hypothesis decomposition
Vertical bars denote 0.95 confidence intervals
10-J
an-0
8
31-J
an-0
8
21-F
eb-0
8
3-M
ar-0
8
Date
1
2
3
4
5
6
7
8
9
10
Tot
al c
arot
enoi
ds µ
g/be
rry
fw
Figure 10b Individual (A to E) and total (F) carotenoid content µg/berry of Merlot berries of four ripening stages
during the 1. 2006/2007 (pre-veraison 11 Jan 07; veraison 26 Jan 07; post-veraison 8 Feb 07; harvest 7 Mar 07) and 2. 2007/2008 (pre-veraison 10 Jan 08; post- veraison 31 Jan 08; post- veraison 21 Feb 08; harvest 3 Mar 08) seasons respectively.

A1 Date; LS Means
Current effect: F(3, 90)=34.813, p=.00000
Effective hypothesis decomposition
Vertical bars denote 0.95 confidence intervals
11-J
an-0
7
26-J
an-0
7
8-F
eb-0
7
7-M
ar-0
7
Date
4
6
8
10
12
14
16
18
20
22
24
26
28
Chl
orop
hyll
a µg
/ber
ry f
w
A2 Date; LS Means
Current effect: F(3, 106)=46.475, p=0.0000Effective hypothesis decomposition
Vertical bars denote 0.95 confidence intervals
10-J
an-0
8
31-J
an-0
8
21-F
eb-0
8
3-M
ar-
08
Date
4
6
8
10
12
14
16
18
20
22
24
26
28
Chl
oro
phyl
l a µ
g/b
erry
fw
B1 Date; LS Means
Current effect: F(3, 90)=17.790, p=.00000
Effective hypothesis decomposition
Vertical bars denote 0.95 confidence intervals
11
-Ja
n-0
7
26
-Ja
n-0
7
8-F
eb
-07
7-M
ar-
07
Date
0
1
2
3
4
5
6
7
8
9
10
11
12
Ch
loro
ph
yll
b µ
g/b
err
y f
w
B2 Date; LS Means
Current effect: F(3, 106)=42.326, p=0.0000
Effective hypothesis decomposition
Vertical bars denote 0.95 confidence intervals
10-J
an-0
8
31-J
an-0
8
21-F
eb-0
8
3-M
ar-0
8
Date
0
1
2
3
4
5
6
7
8
9
10
11
12
Chl
orop
hyll
b µg
/ber
ry f
w
C1 Date; LS Means
Current effect: F(3, 90)=41.185, p=.00000
Effective hypothesis decomposition
Vertical bars denote 0.95 confidence intervals
11
-Ja
n-0
7
26
-Ja
n-0
7
8-F
eb
-07
7-M
ar-
07
Date
5
10
15
20
25
30
35
40
To
tal
ch
loro
ph
yll
s µ
g/b
err
y f
w
C2 Date; LS Means
Current effect: F(3, 106)=45.126, p=0.0000Effective hypothesis decomposition
Vertical bars denote 0.95 confidence intervals
10-J
an-0
8
31-J
an-0
8
21-F
eb-0
8
3-M
ar-0
8
Date
5
10
15
20
25
30
35
40
Tot
al c
hlor
ophy
lls µ
g/be
rry
fw
Figure 11 Individual (A and B) and total (C) chlorophyll content of Merlot berries of four ripening stages
during the 1. 2006/2007 (pre-veraison 11 Jan 07; veraison 26 Jan 07; post-veraison 8 Feb 07; harvest 7 Mar 07) and 2. 2007/2008 (pre-veraison 10 Jan 08; post- veraison 31 Jan 08; post-veraison 21 Feb 08; harvest 3 Mar 08) seasons respectively.