Embed Size (px)
Citation preview

DMD Manuscript #78220
1
Journal: Drug Metabolism and Disposition
Metabolism and Disposition of Verinurad, a Uric Acid Reabsorption Inhibitor, in Humans
Caroline A. Lee, Chun Yang, Vishal Shah, Zancong Shen, David M. Wilson, Traci
M. Ostertag, Jean-Luc Girardet, Jesse Hall and Michael Gillen
Preclinical & Clinical DMPK (CAL, CY, VS, ZS), Bioanalytical (DMW), Biology (TMO),
Chemistry (J-LG), Clinical Development (JH) Ardea Biosciences, Inc., San Diego, CA and Early
Clinical Development, IMED Biotech Unit, Quantitative Clinical Pharmacology (MG)
AstraZeneca LP, Gaithersburg, MD
This article has not been copyedited and formatted. The final version may differ from this version.DMD Fast Forward. Published on February 28, 2018 as DOI: 10.1124/dmd.117.078220
at ASPE
T Journals on February 2, 2020
dmd.aspetjournals.org
Dow
nloaded from

DMD Manuscript #78220
2
Running Title: Verinurad Human Metabolism
Corresponding Author:
Caroline A. Lee
Ardea Biosciences, Inc.,
9390 Towne Centre Drive
San Diego, CA 92121
Phone: 858-449-1797
e-mail: [email protected]
Number pages: 50
Number of Tables: 3
Number of Figures: 8
Number of References: 30
Abstract word count: 249
Introduction word count: 643
Discussion word count: 1410
This article has not been copyedited and formatted. The final version may differ from this version.DMD Fast Forward. Published on February 28, 2018 as DOI: 10.1124/dmd.117.078220
at ASPE
T Journals on February 2, 2020
dmd.aspetjournals.org
Dow
nloaded from

DMD Manuscript #78220
3
Abbreviations:
ADME, absorption, distribution, metabolism, and excretion; AME, absorption, metabolism and
excretion, AUClast, area under the plasma concentration-time curve from zero to last quantifiable
timepoint; AUC∞, area under the plasma concentration-time curve from zero to infinity; CL/F,
oral clearance corrected by bioavailability F; Cmax, maximum observed concentration; CI95%,
confidence interval; t1/2, half-life; CYP, cytochrome P450; HLM, human liver microsomes;
LC/MS/MS, liquid chromatography-tandem mass spectrometry; LSC, liquid scintillation
counting; [M+H+], protonated molecular ion; ng-eq, nanogram equivalents; PK,
pharmacokinetics; sUA, serum uric acid; Tmax, time of occurrence of maximum observed
concentration; UGT, glucuronyltransferase; Vss/F: volume of distribution at equilibrium
corrected by bioavailability F
This article has not been copyedited and formatted. The final version may differ from this version.DMD Fast Forward. Published on February 28, 2018 as DOI: 10.1124/dmd.117.078220
at ASPE
T Journals on February 2, 2020
dmd.aspetjournals.org
Dow
nloaded from

DMD Manuscript #78220
4
ABSTRACT
Verinurad (RDEA3170) is a second generation selective uric acid reabsorption inhibitor for the
treatment of gout and asymptomatic hyperuricemia. Following a single oral solution of 10 mg
dose of [14C]verinurad (500 μCi), verinurad was rapidly absorbed with a median Tmax of 0.5 hour
and terminal half-life of 15 hours. In plasma, verinurad constituted 21% of total radioactivity.
Recovery of radioactivity in urine and feces was 97.1%. Unchanged verinurad was the
predominant component in the feces (29.9%) while levels were low in the urine (1.2% excreted).
Acylglucuronide metabolites M1 (direct glucuronidation) and M8 (glucuronidation of N-oxide)
were formed rapidly after absorption of verinurad with terminal half-lives of approximately 13
and 18 hours, respectively. M1 and M8 constituted 32% and 31% of total radioactivity in plasma
and were equimolar to verinurad based on AUC ratios. M1 and M8 formed in the liver were
biliary cleared with complete hydrolysis in the GI tract as metabolites were not detected in the
feces and/or efflux across the sinusoidal membrane as M1 and M8 accounted for 29.2% and
32.5% of the radioactive dose in urine, respectively. In vitro studies demonstrated that CYP3A4
mediated the formation of the N-oxide metabolite (M4) which was further metabolized by
glucuronyl transferases (UGTs) to form M8 as M4 was absent in plasma and only trace levels
present in the urine. Several UGTs mediated the formation of M1 which could also be further
metabolized by CYP2C8. Overall, the major clearance route of verinurad is metabolism via
UGTs, and CYP3A4 and CYP2C8.
This article has not been copyedited and formatted. The final version may differ from this version.DMD Fast Forward. Published on February 28, 2018 as DOI: 10.1124/dmd.117.078220
at ASPE
T Journals on February 2, 2020
dmd.aspetjournals.org
Dow
nloaded from

DMD Manuscript #78220
5
Introduction
Gout is a metabolic condition that, in most patients, is attributed to inadequate uric acid
excretion leading to hyperuricemia and subsequent deposition of urate crystals in tissues of the
body. These crystals can form in and around the joints (resulting in recurrent attacks of
inflammatory arthritis), kidney vasculature and tissues (resulting in decreased kidney function
and the formation of kidney stones). In 2013, the estimated 12-month prevalence of chronic gout
was approximately 6.3 million people in Europe (France, Germany, Italy, Spain, and the United
Kingdom), 6.2 million people in the United States, and 2.8 million people in Japan (Heap and
Sosa, 2012). Gout is approximately 3 times more common in men than in women (Zhu et al.,
2011) with the greatest gender disparity in subjects under the age of 60. However, the disparity
lessens as the prevalence in women increases with age (Mikuls et al., 2005; Bhole et al., 2010).
The treatment of gout requires both acute and chronic management in which rapid pain relief is
needed for acute gout attacks while long-term treatment is achieved by keeping sUA levels
below 6 mg/dL in order to dissolve the monosodium urate crystal deposits (Bardin and Richette,
2014; Diaz-Torne et al., 2015).
First line treatment of gout utilizes urate-lowering therapy (ULT), allopurinol or
febuxostat, which are inhibitors of xanthine oxidase (XOI). Clinical trials have shown that many
patients fail to attain target sUA using a single ULT alone (Becker et al., 2005; Becker et al.,
2015; Singh et al., 2015). In 2015, lesinurad (ZURAMPIC®) an inhibitor of the uric acid
reabsorption transporter 1 (URAT1) was approved in combination with an XOI to treat chronic
gout and asymptomatic hyperuricemia for patients who fail to attain target sUA using a single
This article has not been copyedited and formatted. The final version may differ from this version.DMD Fast Forward. Published on February 28, 2018 as DOI: 10.1124/dmd.117.078220
at ASPE
T Journals on February 2, 2020
dmd.aspetjournals.org
Dow
nloaded from
DMD Manuscript #78220
6
ULT alone. URAT1 is responsible for the reabsorption of filtered uric acid from the renal
tubular lumen. By inhibiting URAT1, lesinurad increases uric acid excretion and thereby lowers
serum uric acid (sUA). The combination of lesinurad and a xanthine oxidase inhibitor provides
gout patients with a new therapy that works to reduce the production of uric acid as well as to
increase its renal excretion thereby lowering sUA to a greater extent than xanthine oxidase
inhibitor alone (Perez-Ruiz et al., 2011; Shen et al., 2011; Saag et al., 2014; Saag et al., 2015;
Perez-Ruiz et al., 2016).
Verinurad (formerly RDEA3170) is a second generation selective uric acid reabsorption
inhibitor that inhibits URAT1 being developed for the treatment of chronic gout and
asymptomatic hyperuricemia. Verinurad is currently in Phase 2 development. In comparison to
lesinurad, verinurad shows improved potency towards URAT1 (25 nM vs 7.3 µM) in the kidney
proximal tubules, thereby increasing the excretion of uric acid and lowering sUA (Tan et al.,
2011; Girardet and Miner, 2014; Diaz-Torne et al., 2015; Tan et al., 2017) as well as improved
half-life compared to lesinurad (13 vs 6 hr respectively) (Shen et al., 2017). Like lesinurad,
verinurad is highly protein bound with free fraction of 2%. Due to the greater potency of
verinurad, the proposed effective therapeutic dose of verinurad is significantly lower than that for
lesinurad (10 mg compared to 200 mg, respectively) (Bardin et al., 2015; Shen et al., 2017).
To date, verinurad has been evaluated in single and multiple dose ascending clinical
studies with favorable safety and tolerability, and with linear pharmacokinetics up to and
including 40 mg following single dose (Gillen et al., 2017). Slight accumulation (~30% Cmax
and AUC) was observed when verinurad was dosed at 10 mg. Reported herein is the absorption,
This article has not been copyedited and formatted. The final version may differ from this version.DMD Fast Forward. Published on February 28, 2018 as DOI: 10.1124/dmd.117.078220
at ASPE
T Journals on February 2, 2020
dmd.aspetjournals.org
Dow
nloaded from
DMD Manuscript #78220
7
metabolism and excretion of a single 10 mg oral dose of [14C]verinurad in 8 healthy male
subjects. The purpose of the study was to assess the disposition of verinurad, identify and
quantify the exposure of circulating metabolites in human plasma, determine the metabolite
profiles in excreta, and understand the enzymes involved in the metabolic disposition of
verinurad in humans.
This article has not been copyedited and formatted. The final version may differ from this version.DMD Fast Forward. Published on February 28, 2018 as DOI: 10.1124/dmd.117.078220
at ASPE
T Journals on February 2, 2020
dmd.aspetjournals.org
Dow
nloaded from

DMD Manuscript #78220
8
Materials and Methods
Radiolabeled Drug and Reagents
Unlabeled verinurad (2-(3-(4-cyanonaphthalen-1-yl)pyridin-4-ylthio)-2-methylpropanoic
acid) for clinical studies was synthesized at Piramal Pharma Solutions (Torcan, Canada)
following the synthetic route described in the patent (Ouk et al., 2013). [14C] verinurad was
synthesized by Moravek Biochemicals (Brea, CA) and method is provided in supplemental file
(Supplemental Material). The four 14C atoms are present in the naphthalene ring (see Figure 1).
The radiochemical purity of [14C] verinurad was 99.3% and the specific activity of the isolated
compound was 57.1 mCi/mmol. Verinurad acyl glucuronide (M1), verinurad N-oxide (M4),
verinurad N-oxide acyl glucuronide (M8) and [D6] stable label metabolites for M1, M4, and M8
for clinical analysis were synthesized by Syncom BV (Groningen, The Netherlands). Verinurad,
M1, M4 and M8 for in vitro studies were synthesized by Ardea Biosciences (San Diego, CA).
Synthesis of metabolites are described in the supplemental file (Supplemental Material).
Recombinant human CYP and UGTs (SupersomesTM) and ultra- pooled human liver
microsomes (HLM) for CYP and UGT reaction phenotyping were purchased from Corning Life
Sciences (Tewksbury, MA). Pooled HLM for determination of UGT and CYP contribution and
Michaelis-Menten kinetics was purchased from Sekisui Xenotech (Lenexa, KS). All other
materials were of HPLC or analytical grade.
Clinical Study
The clinical study was conducted at Covance Clinical Research Unit (Madison, WI) and
This article has not been copyedited and formatted. The final version may differ from this version.DMD Fast Forward. Published on February 28, 2018 as DOI: 10.1124/dmd.117.078220
at ASPE
T Journals on February 2, 2020
dmd.aspetjournals.org
Dow
nloaded from

DMD Manuscript #78220
9
approved by institutional review board (Schulman associates IRB, Cincinnati, OH). This was a
Phase 1, open-label, single-dose absorption, metabolism, and excretion (AME) study in healthy
adult male subjects. Eight healthy adult male subjects received a single 10 mg dose of verinurad
on Day 1 in the fasted state. Verinurad was provided as an oral solution (0.34 mg/g verinurad
prepared in tri-sodium citrate dehydrate and water) containing [14C]verinurad (15.61 µCi/g), with
each subject receiving approximately 500 µCi( based on rat pharmacokinetic and dosimetry).
Subjects were confined to the study site for a minimum of 4 days (96 hours postdose), and up to
13 days (312 hours postdose). Discharge of a subject is based on Discharge Criteria which were:
1) a minimum of 90% of the administered radioactive dose was recovered in urine and feces, or
2) total recovery from urine and feces was less than 90%, and < 1% of the administered
radioactive dose was recovered in excreta on each of 2 consecutive days. If neither of the
Discharge Criteria were met, subjects were discharged from the clinical research unit (CRU) on
Day 14 (312 hours post dose).
Sample Collection
For pharmacokinetic analysis, blood samples were collected for determination of total
radioactivity in whole blood and plasma, and plasma verinurad concentrations using two 10-mL
tripotassium ethylenediaminetetraacetic acid (K3EDTA) Vacutainer® evacuated collection tubes.
Samples were collected at the following time points in relation to dosing on Day 1: predose
(within 30 minutes prior to dosing); 15, 30, and 45 minutes, 1, 1.5, 2, 2.5, 3, 4, 5, 6, 8, 10, 12, 24,
30, 36, 48, 54, 60, and 72 hours postdose; and subsequently at 24-hour intervals until the subject
was discharged from the CRU. For metabolic profiling, an additional20 mL of blood was
This article has not been copyedited and formatted. The final version may differ from this version.DMD Fast Forward. Published on February 28, 2018 as DOI: 10.1124/dmd.117.078220
at ASPE
T Journals on February 2, 2020
dmd.aspetjournals.org
Dow
nloaded from

DMD Manuscript #78220
10
collected on Day 1 predose, and at 1, 3, 6, 12, and 24 hours postdose. All blood samples were
maintained on ice until centrifuged at 1500 × g for 10 minutes at 4 °C within 45 minutes of
collection. The separated plasma was divided equally, with half of the aliquots acidified by
addition of one volume of 85% phosphoric acid to 100 volumes of plasma prior to storage.
Samples were stored at approximately -70 °C.
Urine samples were collected to determine urinary concentrations of verinurad and
metabolites, total radioactivity, and metabolite profiling. Samples were collected at the following
intervals in relation to dosing on Day 1: -12 to 0, 0 to 6, 6 to 12, and 12 to 24 hours postdose, and
subsequently pooled at 24-hour intervals until the subject was discharged from the CRU. The
samples were refrigerated (2 °C to 8 °C) upon collection. Following completion of a collection
interval, the samples were well mixed and aliquots (approximately 50 mL each) of urine were
transferred into polypropylene storage tubes. For metabolite profiling, urine samples were
acidified by addition of 0.5% of phosphoric acid (85%) (v/v) prior to storage. All urine samples
were stored frozen at approximately -70°C until further analysis.
Fecal samples were collected to determine total radioactivity and metabolite profiling for
the following intervals in relation to dosing on Day 1: -12 to 0, 0 to 6, 6 to 12, and 12 to 24 hours
postdose, and subsequently pooled at 24-hour intervals until the subject was discharged from the
CRU.
For the determination of column recovery, extract of pooled plasma, pooled urine and
pooled feces homogenates were injected separately onto the HPLC-radioactive detection system
with and without a column. HPLC column recovery was determined by comparing the total
This article has not been copyedited and formatted. The final version may differ from this version.DMD Fast Forward. Published on February 28, 2018 as DOI: 10.1124/dmd.117.078220
at ASPE
T Journals on February 2, 2020
dmd.aspetjournals.org
Dow
nloaded from
DMD Manuscript #78220
11
radioactivity of sample injected into the HPLC system with column to the total radioactivity of
the same amount of sample without column analyzed by the online radio-detector, νARC™
Radio-LC system (AIM Research Company).
Measurements of Total Radioactivity, Verinurad and Metabolites in Plasma, Urine and
Feces
Total radioactivity was determined in blood, plasma, urine and feces. Blood samples
were mixed and combusted using a Model 307 Sample Oxidizer (Packard Instrument Company).
The resulting 14CO2 was trapped in Carbo-Sorb and mixed with Perma Fluor and then analyzed
for radioactivity using a Model2900TR liquid scintillation counter (LSC) for at least 5 min or
100,000 counts. Plasma or urine samples were mixed with Ecolite (+) scintillation cocktail and
analyzed directly by LSC. Fecal samples were combined at 24 hr intervals. A weighed
amount (approximately 3 times the sample weight) of 1% phosphoric acid (85%) in 1:1
ethanol:water (v/v) was added to the fecal samples and then homogenized using a probe-type
homogenizer. The sample was then combusted (as described for blood) and analyzed by LSC.
For all matrices, analysis was performed in duplicate weighed aliquots (approximately 0.2 g).
For quantitative determination of verinurad in plasma and in urine, 40 µL aliquots of
unacidified plasma samples or 25 µL of unacidified urine were precipitated with 200 µL
acetonitrile containing [D6]verinurad (2 ng/mL) as internal standard (IS). The samples were
vortexed for 5 min at maximum speed. Samples were then centrifuged at 3300 rpm for 10 min at
4°C. The supernatant (150 µL) was transferred to 1-mL Nunc 96-well plate containing 150 µL
This article has not been copyedited and formatted. The final version may differ from this version.DMD Fast Forward. Published on February 28, 2018 as DOI: 10.1124/dmd.117.078220
at ASPE
T Journals on February 2, 2020
dmd.aspetjournals.org
Dow
nloaded from
DMD Manuscript #78220
12
water and mixed. Sample volume of 20 µL was injected for LC/MS/MS analysis.
Chromatographic separation was performed on an Agilent 1100 liquid chromatographic system
(Agilent Technologies) running a mobile phase gradient consisting of A) water with 0.1% formic
acid (v/v, aqueous phase) and B) acetonitrile with 0.1% formic acid (v/v, organic phase), at a
flow rate of 0.9 mL/min through a Zorbax SB-C18, 4.6 x 50 mm, 3.5μm HPLC column (Agilent
Technologies) for plasma or Synergi Polar-RP, 4.6 x 50 mm, 4μm HPLC column (Phenomenex)
for urine samples. The gradient from 0-2 min was 50% A and 50% B, 2-3 min was 5% A and
95% B, 3-3.01 min was 50% A and 50% B and maintained at 50% A and 50% B to 5 min. The
column effluent was delivered to an API 5000 mass spectrometer (AB Sciex) operated in
positive TurboIonSpray® mode. Mass spectrometric analysis of verinurad and IS was done in
selected reaction monitoring (SRM) mode with the precursor to product ion transitions of m/z
349 → 263 and 355 → 264, respectively, dwell times of 150 ms for each transition, and at unit
mass resolution for the first quadrupole and low mass resolution for the third quadrupole. A
dummy ion transition was included with a 30 ms dwell time to reduce potential for cross-talk.
Methodology was validated according to the US FDA Bioanalytical Method Validation (BMV)
Guidance (2001). The lower limit of quantification (LLOQ) for verinurad in plasma and urine
was 0.100 ng/mL and 2 ng/mL, respectively.
Plasma, Urine, and Feces Sample Preparation for Metabolite Profiling
Acidified plasma samples from 1, 3, 6, 12 and 24 hr postdose were thawed on ice. Per
This article has not been copyedited and formatted. The final version may differ from this version.DMD Fast Forward. Published on February 28, 2018 as DOI: 10.1124/dmd.117.078220
at ASPE
T Journals on February 2, 2020
dmd.aspetjournals.org
Dow
nloaded from

DMD Manuscript #78220
13
time point, an aliquot of 0.5 mL from each subject were pooled together for a final volume of 4
mL. The pooled plasma was extracted with 8 mL of chilled acetonitrile. The precipitated
proteins were removed by centrifuge at 3660 rpm (Beckman Coulter™ Allegra™ 6R Centrifuge)
and 5 °C for 15 min. The supernatant fractions were transferred to glass tubes, dried down under
N2 stream at room temperature, and reconstituted with acetonitrile/water mixture (1:2) for HPLC
injection.
Acidified urine samples were thawed on ice and urine samples collected from 0‒6 hr, 6‒
12 hr, and 12‒24 hr were pooled together as a single 0‒24 hr sample from all eight subjects
according to equal percentage (by weight) of each sample. Similarly, urine samples collected
from 24‒48 hr were thawed on ice and pooled together from all eight subjects to form a single
24-48 hr sample. Other urine samples were not processed for metabolite profiling due to the
sample radioactivity less than 1% of dose. The pooled 0-24 hr urine sample was analyzed by
HPLC with radioactive detection and mass spectrometric detection without further sample
preparation. The pooled 24‒48 hr sample was concentrated down to approximately 50% under
N2 stream at room temperature before HPLC injection.
The feces homogenates from each subject collected from 0 to 120 hr post dose were
thawed on ice and pooled by 24-hr interval according to approximately equal percentage (by
weight) of each fecal sample. Samples with radioactivity less than 1% of dose were excluded
from pooling. The pooled feces homogenates were centrifuged at ~3000 ×g for 15 min at 4 °C.
The supernatant fraction was transferred to a separate container. The precipitates were extracted
with approximately two sample volume of ethanol/water (2:1) containing 1% of phosphoric acid
This article has not been copyedited and formatted. The final version may differ from this version.DMD Fast Forward. Published on February 28, 2018 as DOI: 10.1124/dmd.117.078220
at ASPE
T Journals on February 2, 2020
dmd.aspetjournals.org
Dow
nloaded from
DMD Manuscript #78220
14
(v/v). After vortexing for 30 seconds, the mixture was centrifuged again. The extraction step was
repeated once more. The supernatant fractions were combined, concentrated down under N2
stream at room temperature, and then filtered through 0.22 µm cellulose acetate membrane prior
to HPLC injection.
HPLC radio-analyses of urine, plasma and feces extracts was carried out using the Q-
TRAP API4000 LC/MS/MS system coupled to νARC™ Radio-LC system. Separation of
verinurad and its metabolites following a 100 µL injection was achieved by using a reverse phase
C8 analytical column (Agilent Eclipse XDB-C8 5 μm, 4.60 × 250 mm) running a mobile phase
gradient consisting of water with 0.1% formic acid (v/v, aqueous phase) and acetonitrile with
0.1% formic acid (v/v, organic phase), at a flow rate of 1.0 mL/min. Run time was 45 min. The
gradient from 0-3 min was 90% A and 10% B, 3-30 min was 90% A and 10% B, 30-35 min was
5% A and 95% B, 35-39 min was 5% A and 95% B, 39-39.5 min 90% A and 10% B and
maintained at 90% A and 10% B to 45 min.
Quantitation of Metabolites (M1 and M8) in Plasma and Urine for Pharmacokinetic
Analysis
Prior to the 14C-AME metabolite processing, M1 was found to be stable in plasma and
urine without acidification. For quantification of M1 in plasma, 100 µL aliquots of plasma were
precipitated with 0.500 mL acetonitrile with 0.2% formic acid, v/v, containing 0.600 ng/mL
internal standard ([D6]verinurad-M1, M1-IS). The supernatant was evaporated and the
remaining residue reconstituted with 0.150 mL of 0.2% formic acid in 1:9 acetonitrile/water
This article has not been copyedited and formatted. The final version may differ from this version.DMD Fast Forward. Published on February 28, 2018 as DOI: 10.1124/dmd.117.078220
at ASPE
T Journals on February 2, 2020
dmd.aspetjournals.org
Dow
nloaded from

DMD Manuscript #78220
15
(v/v). For urine samples, 50 µL were precipitated with 0.150 mL of acetonitrile with 0.2%
formic acid, v/v, containing 200 ng/mL M1-IS. Then a 25 µL aliquot of the supernatant was
diluted with 0.2 mL of 0.2% formic acid in water, v/v. Sample volume of 20 µL (plasma extract)
or 10 µL (urine extract) was injected for LC/MS/MS analysis. Chromatographic separation was
performed on an Agilent 1100 liquid chromatographic system (Agilent Technologies) running a
mobile phase gradient consisting of water with 0.1% formic acid (v/v, aqueous phase) and
acetonitrile with 0.1% formic acid (v/v, organic phase), at a flow rate of 0.9 mL/min through a
Kinetex C18, 4.6 x 50 mm, 2.6 μm HPLC column (Phenomenex). The gradient from 0-5 min
was 80% to 70% A, then from 5-6 min was 70 to 5% A, then maintained at 5% A for 1 min, and
finally back to 80% A at 7.01 min. The column effluent was delivered to an API 5000 mass
spectrometer (AB Sciex) for plasma or API 4000 mass spectrometer (AB Sciex) for urine
operated in positive TurboIonSpray® mode. Mass spectrometric analysis of M1 and M1-IS was
done in SRM mode with the precursor to product ion transitions of m/z 525 → 263 and 531→
263, respectively, dwell times of 200 ms for M1 and 70 ms for M1-IS, and at unit mass
resolution for the first quadrupole and low mass resolution for the third quadrupole. A dummy
ion transition was included with a 30 ms dwell time. Under reverse-phase chromatographic
conditions, both compounds separate into two diastereomeric peaks, which were both used for
quantitation (i.e. both chromatographic peaks were integrated and then summed). Methodology
was validated according to the US FDA BMV Guidance (2001). The LLOQ for M1 in plasma
and urine was 0.05 ng/mL and 10.0 ng/mL, respectively.
For quantification of M8, human plasma and urine samples were acidified with
This article has not been copyedited and formatted. The final version may differ from this version.DMD Fast Forward. Published on February 28, 2018 as DOI: 10.1124/dmd.117.078220
at ASPE
T Journals on February 2, 2020
dmd.aspetjournals.org
Dow
nloaded from

DMD Manuscript #78220
16
phosphoric acid to limit acyl-migration and back conversion of M8 to its aglycone M4, an N-
oxide metabolite of verinurad. Because M4 levels were not present in plasma and negligible
amounts present in urine, an indirect assay was developed to quantify M8 through total M4. Fifty
(50) μL acidified plasma samples were alkalized with 20 µL of 2M potassium hydroxide solution
and incubated at room temperature to completely convert M8 to its aglycone counterpart (M4).
The samples were then precipitated with 0.200 mL of 2% formic acid in acetonitrile, v/v,
containing 4.00 ng/mL [D6]verinurad-M4 as internal standard (M4-IS) and 80 µL of supernatant
was then diluted with 0.200 mL water. Sample volume of 20 µL was injected for LC/MS/MS
analysis. Similarily, 25 μL of acidified urine samples were alkalized with 10 µL of 2M
potassium hydroxide solution and incubated at room temperature to completely convert M8 to
M4. The samples were then precipitated with 0.200 mL of 2% formic acid in acetonitrile, v/v,
containing 250 ng/mL M4-IS and 20 µL of the supernatants were then diluted with 0.280 mL of
1:2 acetonitrile/water. Sample volume of 10 µL was injected for LC/MS/MS analysis.
Chromatographic separation was performed on an Agilent 1100 liquid chromatographic system
(Agilent Technologies) running a mobile phase gradient consisting of water with 0.1% formic
acid (v/v, aqueous phase) and acetonitrile with 0.1% formic acid (v/v, organic phase), at a flow
rate of 0.9 mL/min through a Kinetex C18, 4.6 x 50 mm, 2.6 μm HPLC column (Phenomenex).
The gradient from 0-2 min was 65% to 5% A, then maintained at 5% A for 1 min, and back to
65% A at 3.01 min. The column effluent was delivered to an API 5000 mass spectrometer
(plasma) or API 4000 mass spectrometer (urine) (AB Sciex) operated in positive
TurboIonSpray® mode. Mass spectrometric analysis of M4 and M4-IS was done in SRM mode
This article has not been copyedited and formatted. The final version may differ from this version.DMD Fast Forward. Published on February 28, 2018 as DOI: 10.1124/dmd.117.078220
at ASPE
T Journals on February 2, 2020
dmd.aspetjournals.org
Dow
nloaded from
DMD Manuscript #78220
17
with the precursor to product ion transitions of m/z 365 → 279 and 371→ 280, respectively,
dwell times of 150 ms for M4 and 30 ms for M4-IS, and at unit mass resolution for the first
quadrupole and low mass resolution for the third quadrupole. A dummy ion transition was
included with a 20 ms dwell time. Methodology was validated according to the US FDA BMV
Guidance (2001). The LLOQ for M4 in plasma and urine was 0.100 ng/mL and 10.0 ng/mL,
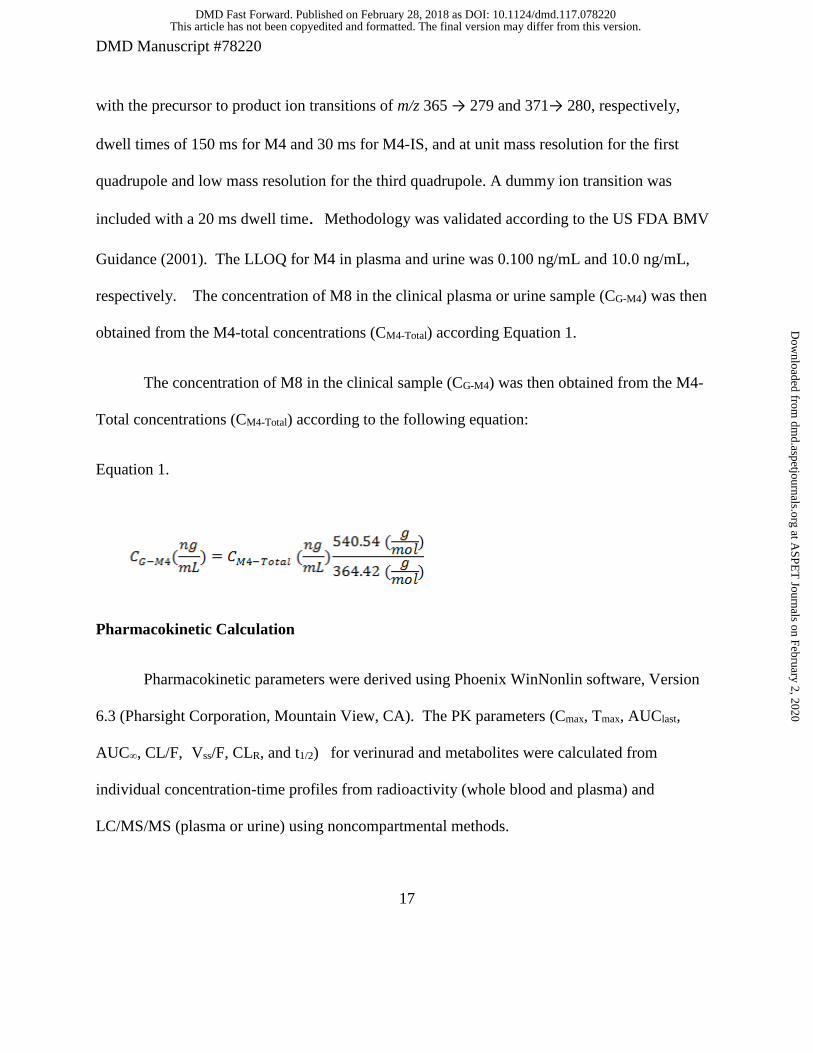
respectively. The concentration of M8 in the clinical plasma or urine sample (CG-M4) was then
obtained from the M4-total concentrations (CM4-Total) according Equation 1.
The concentration of M8 in the clinical sample (CG-M4) was then obtained from the M4-
Total concentrations (CM4-Total) according to the following equation:
Equation 1.
Pharmacokinetic Calculation
Pharmacokinetic parameters were derived using Phoenix WinNonlin software, Version
6.3 (Pharsight Corporation, Mountain View, CA). The PK parameters (Cmax, Tmax, AUClast,
AUC∞, CL/F, Vss/F, CLR, and t1/2) for verinurad and metabolites were calculated from
individual concentration-time profiles from radioactivity (whole blood and plasma) and
LC/MS/MS (plasma or urine) using noncompartmental methods.
This article has not been copyedited and formatted. The final version may differ from this version.DMD Fast Forward. Published on February 28, 2018 as DOI: 10.1124/dmd.117.078220
at ASPE
T Journals on February 2, 2020
dmd.aspetjournals.org
Dow
nloaded from

DMD Manuscript #78220
18
CYP Phenotyping with Recombinant CYPs and Human Liver Microsomes and Chemical
Inhibitors
CYP Isoform Incubations. Verinurad (10 μM) was incubated with individual CYP enzyme
(100 pmols/mL), FMO3 (0.5 mg/mL) or HLM (0.5 mg/mL) in a final volume of 200 μL. The
experiment was performed in triplicate and zero-time incubations served as negative controls.
The mixture contained enzymes, potassium phosphate buffer (100 mM, pH 7.4), and magnesium
chloride (3 mM). The reaction was initiated by the addition of NADPH (final concentration of 1
mM). The incubation at 37 °C was stopped by the addition of 300 μL of acetonitrile containing
internal standard ([D6] verinurad at 40 ng/mL) at 60 minutes.
Incubation with Human Liver Microsomes and Chemical Inhibitors. CYP confirmation
studies were conducted in HLM and selective chemical inhibitor. Verinurad (1 μM) was
incubated with HLM (0.5 mg protein/mL) in a final volume of 200 μL. The mixture contained
HLM, potassium phosphate buffer (100 mM, pH 7.4), magnesium chloride (3 mM), and the
CYP2C9 inhibitor sulfaphenazole (10 μM) or CYP3A4 inhibitor ketoconazole (1 μM). The
experiment was performed in duplicate and zero-time incubations served as negative controls.
The reaction was initiated by the addition of NADPH (final concentration of 1 mM) and
incubated for 15, 30, 45, 60, and 90 minutes at 37 °C. The reaction was terminated by the
addition of 300 μL of acetonitrile containing internal standard ([D6]verinurad at 40 ng/mL).
UGT Isoform Profiling
UGT Supersome Incubation. To identify the UGT isoforms involved in the formation of M1,
This article has not been copyedited and formatted. The final version may differ from this version.DMD Fast Forward. Published on February 28, 2018 as DOI: 10.1124/dmd.117.078220
at ASPE
T Journals on February 2, 2020
dmd.aspetjournals.org
Dow
nloaded from

DMD Manuscript #78220
19
the following procedure was used. A 0.2-mL reaction mixture containing alamethicin (25 μg/mg
protein), UGT (0.5 mg/mL), UDPGA(5 mM), magnesium chloride (10 mM), and [14H]verinurad
(10 μM, 2.5 μCi/mL ) in 50 mM Tris (pH 7.4) was incubated at 37 °C for 60 min. The
experiment was performed in triplicate. Zero-time incubations served as negative controls. The
reaction was initiated by the addition of UDPGA solution and terminated by the addition of 0.2-
mL of chilled acetonitrile-containing 100 ng/mL [D6] verinurad M1 as internal standard. The
precipitated proteins were removed by centrifuge at 3300 × g for 10 min and the supernatant was
analyzed by LC with radio and mass spectrometric detection for the formation of M1 metabolite.
To identify the UGT isoforms involved in the formation of M8 from M4, the following
procedure was followed. A 0.5 mL reaction mixture with M4 (2 μM), alamethicin (50 μg/mL),
D-saccharic acid-1,4-lactone (3 mM), UGT (0.5 mg/mL), UDPGA (2 mM), and magnesium
chloride (10 mM) in 50 mM phosphate buffer (pH 7.4) was incubated at 37 °C for 60 min. The
experiment was performed in triplicate and incubations with UGT control supersomes served as
negative controls. The reaction was initiated by the addition of UDPGA solution and terminated
by the addition of 0.5 mL of ice-cold acetonitrile-containing 100 ng/mL [D6] verinurad M4
(internal standard) and 0.1% of formic acid.
Incubation with HLM and chemical inhibitor. To confirm the UGT isoforms involved in the
formation of M1, an UGT chemical inhibition study was conducted. Currently, the availability
of selective UGT inhibitor is limited and only UGT2B7 was confirmed using a chemical
inhibitor. Fluconazole, a moderately selective competitive inhibitor of UGT2B7, was used to
confirm the role of this isoform. Pooled HLM (2 mg/mL) was incubated with alamethicin (25
This article has not been copyedited and formatted. The final version may differ from this version.DMD Fast Forward. Published on February 28, 2018 as DOI: 10.1124/dmd.117.078220
at ASPE
T Journals on February 2, 2020
dmd.aspetjournals.org
Dow
nloaded from

DMD Manuscript #78220
20
μg/mg protein), UDPGA (5 mM), [14H]verinurad (10 μM, 2.5 μCi/mL ), MgCl2 (10 mM), D-
saccharic acid-1,4-lactone (5 mM), and fluconazole (5 mM) at 37 °C for 60 min. The experiment
was performed in triplicate. Zero-time incubations served as negative controls. The reaction was
initiated by the addition of UDPGA (5 mM final concentration) solution and terminated by the
addition of 200 μL of ice-cold acetonitrile-containing [D6] verinurad (100 ng/mL) as an internal
standard.
Chemical Stability of M1 and M8
The chemical stability of M1 and M8 in potassium phosphate buffer, pH 7.4 (KPB) was
assessed at 37°C. KPB was pre-warmed at 37°C for 5 minutes. The incubation was initiated
with the addition of M1 or M8 at a final concentration of 10 µM, final volume of 1 mL. An
aliquot of 50 µL was removed at 0, 0.5, 1, 1.5, 2, 3, 4,6,8 and 24 hour and transferred to a 96
well HPLC plate well containing 50 µL ice cold acetonitrile containing internal standard, M1-
[D6] and 2% formic acid. Samples were further diluted with the addition of 300 µL of water and
vortexed before LC/MS/MS analysis to determine concentration of M1 or M8 at each time point.
The slope of the linear regression for the log transformed concentration versus incubation time of
M1 or M8 was used for the determination of the first-order degradation rate constant and half-
life.
URAT1 Activity
HEK293 human embryonic kidney cells stably over-expressing human URAT1 were seeded
This article has not been copyedited and formatted. The final version may differ from this version.DMD Fast Forward. Published on February 28, 2018 as DOI: 10.1124/dmd.117.078220
at ASPE
T Journals on February 2, 2020
dmd.aspetjournals.org
Dow
nloaded from

DMD Manuscript #78220
21
into 96-well poly-D-lysine coated tissue culture plates at a density of 1.5 x 10⁵ cells per well and
grown at 37°C and 5% CO2 overnight. The next day the cell culture was washed once with
Wash Buffer (125 mM sodium gluconate, 25 mM MES pH 5.5). Compounds diluted in Assay
Buffer (125 mM sodium gluconate, 4.8 mM potassium gluconate, 1.2 mM potassium phosphate
monobasic, 1.2 mM magnesium sulfate, 5.6 mM glucose and 25 mM MES pH 5.5) with 1
percent DMSO were pre-incubated with the cells (triplicate wells per condition) for 5 minutes at
room temperature in a volume of 20 µL, then 20 µL of 200 µM 14C-uric acid (American
Radiolabeled Chemicals, St. Louis, MO) diluted in Assay Buffer was added to the plate and
incubated for 10 minutes at room temperature. Free 14C-uric acid was removed by washing cells
3 times with Wash Buffer. Cells were lysed by adding 100 µL of Ultima Gold scintillation fluid
(PerkinElmer) to each well and radioactivity was counted using a MicroBeta2 plate reader.
For calculating percent inhibition, each plate contained triplicate wells of both the empty
vector control and human URAT1 stable cells treated with vehicle (DMSO) only. Using the cpm
values obtained from the plate reader, percent inhibitions were calculated as follows:
Percent Inhibition = 100-((100*(Test - Basal)/(Control - Basal))) (Equation 2)
where Basal and Control are the median cpm values of the vehicle treated control and URAT1
wells, respectively. IC50 values were calculated using GraphPad Prism and the sigmoidal dose
response (variable slope) equation.
This article has not been copyedited and formatted. The final version may differ from this version.DMD Fast Forward. Published on February 28, 2018 as DOI: 10.1124/dmd.117.078220
at ASPE
T Journals on February 2, 2020
dmd.aspetjournals.org
Dow
nloaded from
DMD Manuscript #78220
22
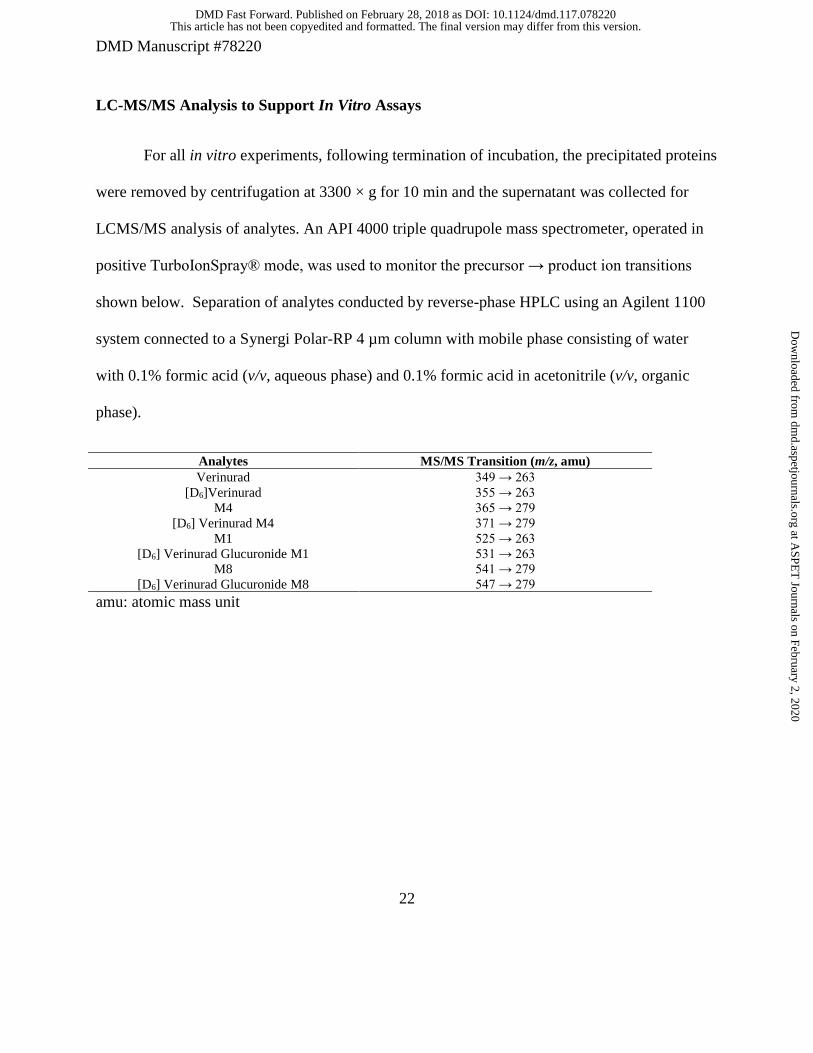
LC-MS/MS Analysis to Support In Vitro Assays
For all in vitro experiments, following termination of incubation, the precipitated proteins
were removed by centrifugation at 3300 × g for 10 min and the supernatant was collected for
LCMS/MS analysis of analytes. An API 4000 triple quadrupole mass spectrometer, operated in
positive TurboIonSpray® mode, was used to monitor the precursor → product ion transitions
shown below. Separation of analytes conducted by reverse-phase HPLC using an Agilent 1100
system connected to a Synergi Polar-RP 4 µm column with mobile phase consisting of water
with 0.1% formic acid (v/v, aqueous phase) and 0.1% formic acid in acetonitrile (v/v, organic
phase).
Analytes MS/MS Transition (m/z, amu)
Verinurad 349 → 263
[D6]Verinurad 355 → 263
M4 365 → 279
[D6] Verinurad M4 371 → 279
M1 525 → 263
[D6] Verinurad Glucuronide M1 531 → 263
M8 541 → 279
[D6] Verinurad Glucuronide M8 547 → 279
amu: atomic mass unit
This article has not been copyedited and formatted. The final version may differ from this version.DMD Fast Forward. Published on February 28, 2018 as DOI: 10.1124/dmd.117.078220
at ASPE
T Journals on February 2, 2020
dmd.aspetjournals.org
Dow
nloaded from

DMD Manuscript #78220
23
Results
HPLC Column Recovery and Sample Extraction Efficiency
Extraction efficiency of pooled plasma and feces samples was greater than 90%. The
pooled urine samples were analyzed directly without sample extraction. HPLC column recovery
was greater than 92% for plasma, urine and feces samples, indication of adequate recovery of
radioactivity in the HPLC sample analysis.
Urinary and Fecal Recovery
Urine and fecal samples were collected up to 144 hours from 8 subjects that met the
discharge criteria. The cumulative excretion of radioactivity in urine and feces from all subjects
was measured and is shown graphically in Figure 2. An average (± SD) 97.1 ± 1.58% of the
administered 10 mg dose of [14C]verinurad was recovered in total over the 144-hour collection
period, with recovery in individual subjects ranging from 93.8% to 99.0%. Extraction efficiency
of feces samples was greater than 90%.
Pharmacokinetics of Verinurad and Total Radioactivity
Verinurad was rapidly absorbed with median Tmax of 0.5 hour postdose (Figure 3)
following oral administration. Following oral administration, verinurad exhibits a biphasic
concentration time profile. Plasma terminal half-life based on total radioactivity was 35 hours
(Table 1) while the plasma terminal half-life of verinurad was 15 hours (Table 1). Geometric
mean AUC∞ values based on total radioactivity in blood and plasma were 556 and 906 ng-
This article has not been copyedited and formatted. The final version may differ from this version.DMD Fast Forward. Published on February 28, 2018 as DOI: 10.1124/dmd.117.078220
at ASPE
T Journals on February 2, 2020
dmd.aspetjournals.org
Dow
nloaded from

DMD Manuscript #78220
24
eq.·hr/mL, respectively. Blood-to-plasma ratios based on total radioactivity for Cmax and AUC∞
were 0.551 and 0.614, respectively (Table 1), indicating no preferential distribution of the drug
into the red blood cells; the majority of circulating radioactivity was associated with plasma. The
plasma verinurad-to-total radioactivity ratios for Cmax and AUC were 0.464 and 0.213,
respectively, indicating that metabolites are the predominant component in the circulation.
After absorption, verinurad plasma Cmax and AUC∞ were 160 ng/mL and 193 ng·hr/mL,
respectively (Table 1) based on quantification via LC/MS/MS. Verinurad showed a moderate
clearance of 51.8 L/hr, CLr0-96hr of 11.5 mL/min and a high volume of distribution (Vss/F) of 504
L, suggesting extensive distribution of the drug to peripheral tissues.
In urine, 63.6% of the radioactive dose was recovered during the first 48 hr postdose
(Table 2) with 64.5% of the radioactive dose was recovered from 0-120 hr postdose, suggesting
at least 64.5% of the dose was absorbed in the circulation (Figure 2). The majority (>85%) of
radioactivity recovered in the urine occurred in the first 24 hr postdose with the fraction of
excretion at 24 hr postdose is 56% (Figure 2)). Only 1.3% of the dose was attributed to
unchanged verinurad excreted in the urine up to 96 hr postdose. The renal clearance of verinurad
was determined to be 11.5 mL/min based on urine excretion amount and plasma AUC.
In feces, unchanged verinurad was the predominant component (over 97% in sample
radioactivity analysis) accounting for 29.9% of the dose by 120 hr post-dose (Table 2, Figure 2),
representing either unabsorbed drug and/or excreted via biliary elimination.
This article has not been copyedited and formatted. The final version may differ from this version.DMD Fast Forward. Published on February 28, 2018 as DOI: 10.1124/dmd.117.078220
at ASPE
T Journals on February 2, 2020
dmd.aspetjournals.org
Dow
nloaded from
DMD Manuscript #78220
25
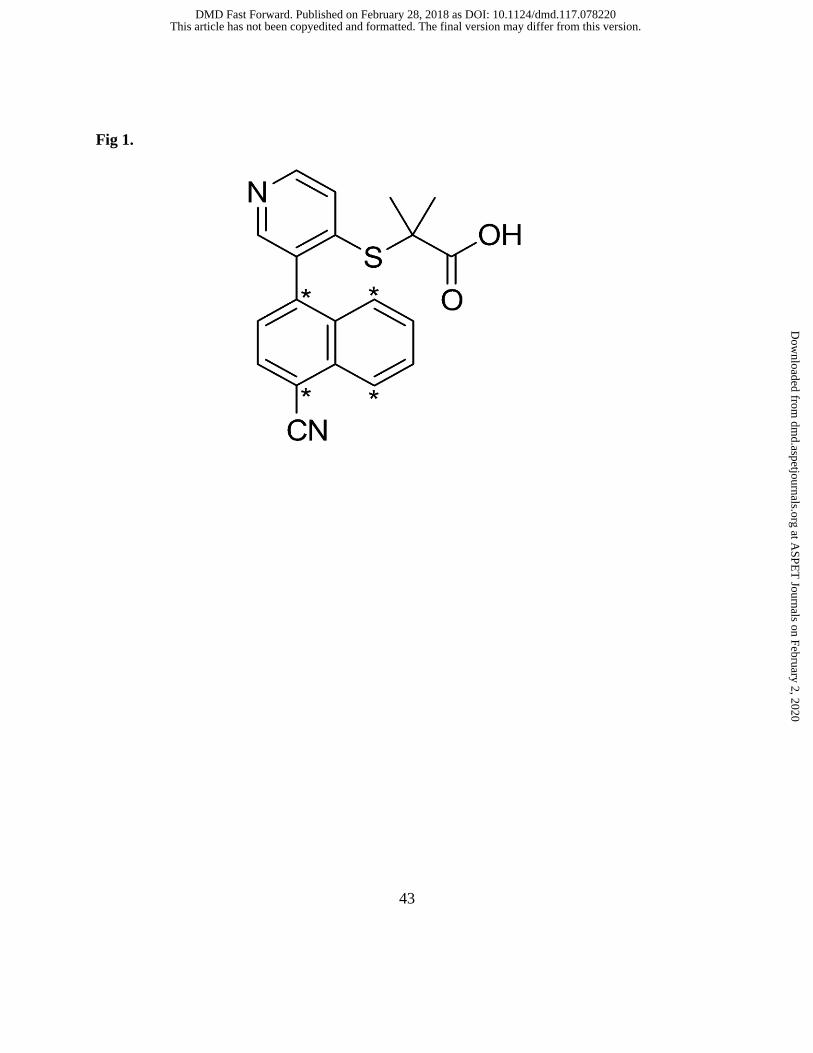
Metabolite Identification
Metabolite profiles of [14C]verinurad were determined in human plasma, urine, and feces
(Figure 4). Prior to the human [14C]-AME study reported herein, metabolite profile of [14C]-
verinurad was conducted in both the rat and dog. Six metabolites, oxidative and glucuronide
conjugates were identified in both species which set the metabolite naming convention (data not
shown). A total of 3 metabolites were identified in humans, including an acyl glucuronide (M1),
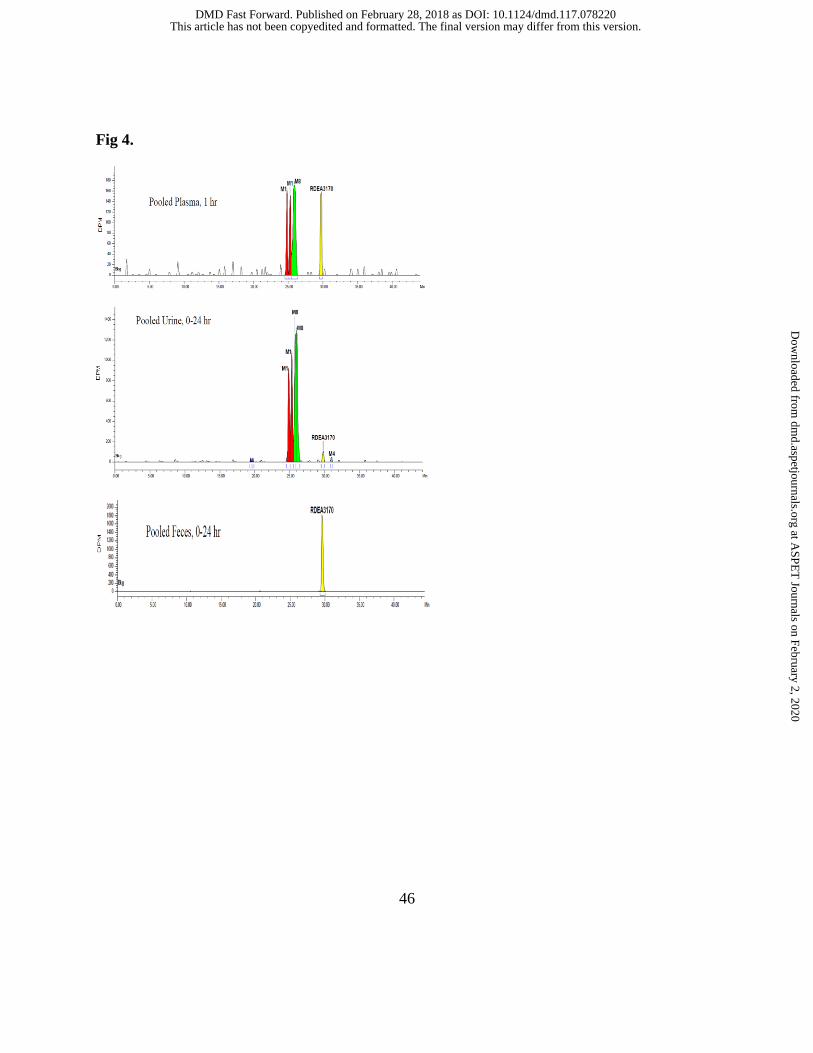
an N-oxide (M4), and an acyl glucuronide of M4 (M8). The proposed metabolic pathway of
verinurad in healthy adult male subjects is depicted in Figure 5 depicting metabolites M1, M4
and M8 (see Supplemental File Table 1 for chemical name).
Plasma. Radioactivity was measurable in only the 1, 3 and 6 hr postdose pooled samples as later
time samples were below detection limits. Major metabolites, M1 and M8, were observed and
accounted for most of the circulating radioactivity representing 22-31% and 35-51% of plasma
radioactivity, respectively, with no detection of M4 in the 8 subjects.
Metabolite Profiling in Urine and Feces. The total radioactivity at 48 hr postdose excreted in
urine and feces accounted for 63.6% and 30.6% of the dose, respectively (Table 2). M1 and M8
were exclusively eliminated in the urine, with recovered amounts of 29.2% and 32.5%,
respectively, of the radioactive dose and M4 was present at trace levels (Table 2). In feces,
unchanged verinurad was the predominant component. M1 and M8 were not found in the feces
but trace levels of unidentified metabolites were observed (1.0% of the dose).
This article has not been copyedited and formatted. The final version may differ from this version.DMD Fast Forward. Published on February 28, 2018 as DOI: 10.1124/dmd.117.078220
at ASPE
T Journals on February 2, 2020
dmd.aspetjournals.org
Dow
nloaded from

DMD Manuscript #78220
26
Pharmacokinetics of M1 and M8
Following verinurad administration, M1 and M8 were formed quickly with median Tmax
of 0.5 to 0.75 hr (Table 3). The majority (approximately 90%) of M1 and M8 exposure was
cleared within 24 hours postdose.
The geometric mean plasma M1-to-verinurad ratio for Cmax and AUC∞ were 0.786 and
0.997, respectively. The geometric mean plasma M8-to-verinurad ratios for Cmax and AUC∞
were 0.485 and 0.943, respectively (Table 3). The AUC molar ratios of M1 and M8 to verinurad
were both approximately 1:1. The plasma M1-to-total radioactivity ratios for Cmax and AUC∞
were 0.550 and 0.321, respectively. Similarly, plasma M8-to-total radioactivity ratios for Cmax
and AUC∞ were 0.350 and 0.313, respectively. The elimination of M1 and M8 were only
observed in the urine with high CLr0-96hr of 224 mL/min and 338 mL/min, respectively.
In Vitro Metabolism
Formation of M4 metabolite. Incubation studies with recombinant CYPs and FMO
demonstrated that oxidative metabolism of verinurad to M4 was primarily mediated by CYP3A4
with a minor contribution by CYP2C9 and CYP3A5 (Figure 6A). Studies conducted using HLM
and selective chemical inhibitors, ketoconazole and sulfaphenazole, confirmed that CYP3A4/5 is
the predominant oxidative enzyme with minor contribution by CYP2C9 (Figure 7).
Formation of M1 and M8 metabolites. Incubation studies with recombinant uridine 5'-
diphospho-glucuronyl transferase (UGT) demonstrated that the formation of M1 was mediated
This article has not been copyedited and formatted. The final version may differ from this version.DMD Fast Forward. Published on February 28, 2018 as DOI: 10.1124/dmd.117.078220
at ASPE
T Journals on February 2, 2020
dmd.aspetjournals.org
Dow
nloaded from
DMD Manuscript #78220
27
by several UGTs, namely UGT1A3, UGT2B4, UGT2B7 and UGT2B17 (Figure 8A). As shown
in Figure 5, the formation of M8 can occur via two pathways. The formation of M8 via
glucuronidation of M4 was mediated by several UGTs namely UGT1A1, UGT1A3, UGT2B7,
UGT1A8 and UGT2B17 (Figure 8B), although levels for UGT1A8 were low. Alternatively, the
formation M8 can also occur via CYP-mediated oxidation of M1. Recombinant CYP incubation
studies showed that CYP2C8 was the major isoform involved in the oxidation of M1 via N-
oxidation to form M8 (Figure 6B). Confirmation studies were performed with HLM and
quercetin, a selective CYP2C8 inhibitor (data not shown).
Buffer Stability of Acyl-glucuronides
To assess the chemical reactivity of M1 and M8, in vitro studies were performed in 100
mM potassium phosphate buffer (KPB) at 37°C up to and including 24 hours. The half-life of
M1 and M8 in KPB was determined to be 7.65 hours and 3.51 hours, respectively.
Assessment of in vitro URAT1 inhibition by M1 and M8
M1 inhibition of URAT1 was evaluated in vitro and the average IC50 was 2.9 µM ± 0.36
µM (mean ± SE, n=10). Minimal inhibition of 14C-uric acid uptake by URAT1 was observed
with M8, and did not allow for IC50 determination. Because both M1 and M8 were tested at
concentrations well above the human Cmax of 189 and 120 ng/mL (~350 and 220 nM,
respectively), they are not likely to contribute to efficacy.
This article has not been copyedited and formatted. The final version may differ from this version.DMD Fast Forward. Published on February 28, 2018 as DOI: 10.1124/dmd.117.078220
at ASPE
T Journals on February 2, 2020
dmd.aspetjournals.org
Dow
nloaded from

DMD Manuscript #78220
28
Discussion
The aim of this study was to investigate the disposition of verinurad in humans following
an oral dose of [14C]verinurad to 8 healthy male volunteers. Specifically, the study determined
the mass balance of verinurad and its metabolites in circulation and excreta, and identified that
verinurad was well tolerated in all subjects with no significant adverse events reported.
Verinurad was well absorbed with the extent of absorption estimated to be at least ~64% based
on urinary recovery of parent and metabolites.
The mean oral clearance (CL/F) was approximately 51.8 L/h indicating moderate
clearance. The radioactive dose was largely recovered in excreta (97.1% by 144 hours).
Unchanged verinurad accounted for 29.9% of the dose excreted in the feces, with 1.3% of dose
excreted unchanged in the urine, indicating that metabolism was the major route of elimination.
The higher radioactivity in plasma relative to whole blood indicated minimal distribution of
radioactivity to red blood cells. Furthermore, the large oral volume of distribution of 504 L
suggested that verinurad distributes extensively to peripheral tissues.
The verinurad-to-total radioactivity profiles indicated that metabolites were the
predominant component in circulation. Metabolism was the major route of elimination of
verinurad of which, M1 and M8, circulated approximately equal molar to parent drug. The
mechanism of metabolism was elucidated in which the formation of M1 occurred via direct
glucuronidation by several UGT (UGT1A3, 2B4, 2B7 and 2B17) isoforms while the formation
of M8 occurred via a two-step process likely involving two distinct pathways. From in vitro
studies, one pathway to M8 formation involved the oxidation of verinurad to M4 predominately
This article has not been copyedited and formatted. The final version may differ from this version.DMD Fast Forward. Published on February 28, 2018 as DOI: 10.1124/dmd.117.078220
at ASPE
T Journals on February 2, 2020
dmd.aspetjournals.org
Dow
nloaded from
DMD Manuscript #78220
29
by CYP3A4 and to a lesser extent by CYP2C9 and CYP3A5 followed by efficient
glucuronidation by several UGT isoforms (UGT1A1, 1A3, 2B7 and 2B17) as M4 was not
detected in circulation. The second pathway to M8 formation is the sequential oxidation of M1
by CYP2C8. Data generated herein, suggest both pathways are plausible to form M8.
Interestingly, the formation of M8 via oxidation of the verinurad acylglucuronide
metabolite, M1, by CYP2C8 is an example of glucuronide conjugate as a substrate for this
isoform. Several glucuronides substrates have been identified as CYP2C8 ligands in which the
parent drug is not a substrate as is the case for verinurad (Ma et al., 2017). Moreover, homology
modeling that examined substrate specificity of CYP2C family (namely 2C8, 2C9, 2C18 and
2C19) has identified the presences of several key amino acids in the CYP2C8 active site that
affords substrate selectivity namely Ser114, Phe205 and Ile476 that enabling binding of
hydrophilic substrates like glucuronides to the active site (Ridderstrom et al., 2001; Schoch et al.,
2004; Johnson and Stout, 2005). Several drugs, gemfibrozil and clopidogrel, form
acylglucuronides that are strong CYP2C8 time dependent inhibitors (Ma et al., 2017). The
CYP2C8 time dependent inhibition of M1 and M8 to have not been investigated but will be
evaluated in future studies.
Following oral administration of verinurad, the formation of acyl glucuronide metabolites
can occur via first pass metabolism in the gastrointestinal tract (GI) and liver due to the presence
of UGTs (Nakamura et al., 2008). Once verinurad is in the system circulation, formation of
acylglucuronide metabolites may also occur in the kidney in addition to the liver. Metabolite
formation is rapid as the Tmax (0.5 - 0.75 hr) is short which contributes to the plasma
This article has not been copyedited and formatted. The final version may differ from this version.DMD Fast Forward. Published on February 28, 2018 as DOI: 10.1124/dmd.117.078220
at ASPE
T Journals on February 2, 2020
dmd.aspetjournals.org
Dow
nloaded from

DMD Manuscript #78220
30
concentration decline of verinurad.
The disposition of verinurad involves drug transporters (unpublished data) namely active
uptake transporters in the liver (OATP1B3), kidney (OAT1/3) and the data was inconclusive for
OATP1A2 (GI tract). Verinurad is also highly permeable so its uptake across various organs is
likely a combination of both passive and active mechanism. The disposition of verinurad and its
acylglucuronide metabolites in the liver appears to be dependent on both transport and
metabolism involving enterohepatic recycling. This is evident by the lack of M1 and M8 in the
feces suggests indicating efficient hydrolysis by beta-glucuronidase in the intestine thereby
releasing the aglycone for reabsorption to systemic circulation. Enterohepatic recirculation is
also evident by the secondary verinurad peak at 6 hr post dose (Figure 3) which is also consistent
with the ex-vivo findings that verinurad exhibited colonic absorption (unpublished data).
Furthermore, studies conducted in bile duct cannulated (BDC) rats also indicated enterohepatic
recycling. Male BDC rats were dosed with [14C]verinurad (10 mg/kg, oral), ~79% of the
radiolabel material, predominately M1, was eliminated in the bile (within 24 hr) and ~4 to 11%
was recovered in urine and feces. The bile collected from these animals (consisting mainly M1)
was then dosed via intraduodenal infusion to a different group of rats; verinurad was the only
component in the feces indicating that M1 was converted efficiently to the aglycone in the GI
tract (unpublished data).
Another mechanism for the elimination of acylglucuronides formed in the liver is efflux
across the sinusoidal membrane followed by renal elimination as the acyl glucuronides were
detected in the urine but not the feces. In addition, the low excretion of verinurad in the kidney
This article has not been copyedited and formatted. The final version may differ from this version.DMD Fast Forward. Published on February 28, 2018 as DOI: 10.1124/dmd.117.078220
at ASPE
T Journals on February 2, 2020
dmd.aspetjournals.org
Dow
nloaded from

DMD Manuscript #78220
31
may be the result of kidney metabolism as UGTs and CYP3A5 are present and, possibly
CYP3A4 and CYP2C8 though their expression levels are less clear (Bieche et al., 2007). The
excretion of M1 and M8 in the urine may be attributed in part (minor) to kidney metabolism in
addition to hepatic metabolism (Nakamura et al., 2008; Knights et al., 2013). The renal
clearance (CLr0-96hr) of M1 and M8 of 224 mL/min and 338 mL/min, respectively, are both
greater than glomerulus filtration rate indicating active efflux. Both M1 and M8 are substrates
for MRP2 and MRP4 (data not shown) consistent with the active renal clearance.
While M1 and M8 circulate in plasma at approximately 1:1 with verinurad, they are not
pharmacologically active towards URAT1. Consequently, no further ADME characterization
was performed from a substrate perspective but additional CYP and transporter inhibition studies
will be conducted in the future. While rat and dog do not make appreciable levels of M8
(unpublished data), this metabolite is made in rabbits and monkeys which provided the
preclinical toxicology coverage.
Acylglucuronides have been implicated in idiosyncratic drug toxicity due to their
reactivity to towards macromolecules (Smith et al., 1990). The buffer stability studies conducted
with M1 and M8 indicated that they were stable with half-life values of 7.65 hours and
3.51 hours, respectively. As per Sawamura et al., acylglucuronides exhibiting or exceeding a
half-life of 3.6 hours in potassium phosphate buffer have a low risk of chemical instability
(Sawamura et al., 2010). The half-life of M1 was well above this safe drug criterion but the half-
life of M8 was similar to the criterion. The absence of an alpha hydrogen next to the carboxyl
group in M1 or M8 can further reduce the reactivity of M1 or M8, thereby reducing the risk for
This article has not been copyedited and formatted. The final version may differ from this version.DMD Fast Forward. Published on February 28, 2018 as DOI: 10.1124/dmd.117.078220
at ASPE
T Journals on February 2, 2020
dmd.aspetjournals.org
Dow
nloaded from
DMD Manuscript #78220
32
idiosyncratic toxicity (Wang et al., 2004). Thus, the chemical stability data and the lack of an
alpha hydrogen suggest a relatively low risk of M1 or M8 causing idiosyncratic drug toxicity.
This result is consistent with covalent binding studies performed in human hepatocytes and
found to be in the safe zone as clinical dose of verinurad is 10 mg (Nakayama et al., 2009) (data
not shown). To date, hepatotoxicity observations related to verinurad have not been detected in
clinical studies.
The potential for co-medications to significantly affect the pharmacokinetics of verinurad
is low due to the involvement of several enzymes, CYP3A and UGTs. From the in vitro and in
vivo investigations, glucuronidation appears to be the predominant pathway, however, a clinical
study is needed to confirm this hypothesis that would involve the inhibition of CYP3A to
understand the contribution of this pathway as glucuronides are the major circulating
metabolites. To date, a medication known to broadly inhibit several UGTs is not known so it is
unlikely that the UGT pathway would be completely inhibited. Furthermore, the UGTs are
known to be high capacity enzymes with high Km values (> 10 µM) (Kaivosaari et al., 2011).
Thus, it is unlikely that a co-medication can alter the metabolic disposition of verinurad and
therefore the drug interaction potential is low.
In conclusion, a single 10 mg dose of verinurad was safe and well tolerated in healthy
male subjects. The human disposition of verinurad is predominantly via metabolism although
transporters also contribute. The metabolism of verinurad is primarily via UGTs and CYP3A4.
Two acyl glucuronide metabolites (M1 and M8) circulate equimolar to verinurad but lack
efficacy towards URAT1. Furthermore, these acylglucuronides were characterized as being
This article has not been copyedited and formatted. The final version may differ from this version.DMD Fast Forward. Published on February 28, 2018 as DOI: 10.1124/dmd.117.078220
at ASPE
T Journals on February 2, 2020
dmd.aspetjournals.org
Dow
nloaded from
DMD Manuscript #78220
33
stable with low reactivity and low potential for idiosyncratic toxicity.
This article has not been copyedited and formatted. The final version may differ from this version.DMD Fast Forward. Published on February 28, 2018 as DOI: 10.1124/dmd.117.078220
at ASPE
T Journals on February 2, 2020
dmd.aspetjournals.org
Dow
nloaded from

DMD Manuscript #78220
34
Acknowledgements
This study was funded by Ardea Biosciences, Inc., a member of the AstraZeneca Group. The
authors thank Barbara Nelson of Ardea Biosciences for her contributions in editing the
manuscript.
This article has not been copyedited and formatted. The final version may differ from this version.DMD Fast Forward. Published on February 28, 2018 as DOI: 10.1124/dmd.117.078220
at ASPE
T Journals on February 2, 2020
dmd.aspetjournals.org
Dow
nloaded from

DMD Manuscript #78220
35
Authorship Contributions
Participated in research design: Yang, Shen, Hall, Gillen
Conducted experiments: Yang, Shah, Wilson, Ostertag
Contributed new reagents or analytic tools: Girardet
Performed data analysis: Lee, Yang, Shah, Shen, Wilson, Ostertag, Hall, Gillen
Wrote or contributed to the writing of the manuscript: Lee, Yang, Shen, Shah, Wilson, Ostertag,
Gillen, Girardet
This article has not been copyedited and formatted. The final version may differ from this version.DMD Fast Forward. Published on February 28, 2018 as DOI: 10.1124/dmd.117.078220
at ASPE
T Journals on February 2, 2020
dmd.aspetjournals.org
Dow
nloaded from

DMD Manuscript #78220
36
References
Bardin T, Keenan R, Khanna P, Kopicko J, Fung M, Bhakta N, Adler S, Storgard C,
Baumgartner S, and So A (2015) Lesinurad, A Selective Uric Acid Reabsorption
Inhibitor, in Combination With Allopurinol: Results from a Phase III Study in Gout
Patients Having an Inadequate Response to Standard of Care (CLEAR 2). EULAR:4.
Bardin T and Richette P (2014) Definition of hyperuricemia and gouty conditions. Curr Opin
Rheumatol 26:186-191.
Becker M, Fitz-Patrick D, Choi H, Dalbeth N, Storgard C, Cravets M, and Baumgartner S (2015)
An open-label, 6 month study of allopurinol safety in gout: The LASSO study. (Accepted
for Publication) Seminars in Arthritis and Rheumatism:33.
Becker MA, Schumacher HR, Jr., Wortmann RL, MacDonald PA, Eustace D, Palo WA, Streit J,
and Joseph-Ridge N (2005) Febuxostat compared with allopurinol in patients with
hyperuricemia and gout. N Engl J Med 353:2450-2461.
Bhole V, de Vera M, Rahman MM, Krishnan E, and Choi H (2010) Epidemiology of gout in
women: fifty-two-year followup of a prospective cohort. Arthritis Rheum 62:1069-1076.
Bieche I, Narjoz C, Asselah T, Vacher S, Marcellin P, Lidereau R, Beaune P, and de Waziers I
(2007) Reverse transcriptase-PCR quantification of mRNA levels from cytochrome
(CYP)1, CYP2 and CYP3 families in 22 different human tissues. Pharmacogenetics and
genomics 17:731-742.
Diaz-Torne C, Perez-Herrero N, and Perez-Ruiz F (2015) New medications in development for
the treatment of hyperuricemia of gout. Curr Opin Rheumatol 27:164-169.
Girardet JL and Miner J (2014) Urate Crystal Deposition Disease and Gout - New Therapies for
an Old Problem - Chapter 11. Annual Reports in Medicinal Chemistry 49:151 - 164.
Heap G and Sosa MP (2012) Gout. Decision Resources: Metabolic Disorders Study, A
Pharmacor Service:i-v,1-114.
Johnson EF and Stout CD (2005) Structural diversity of human xenobiotic-metabolizing
cytochrome P450 monooxygenases. Biochem Biophys Res Commun 338:331-336.
Kaivosaari S, Finel M, and Koskinen M (2011) N-glucuronidation of drugs and other xenobiotics
by human and animal UDP-glucuronosyltransferases. Xenobiotica 41:652-669.
Knights KM, Rowland A, and Miners JO (2013) Renal drug metabolism in humans: the potential
for drug-endobiotic interactions involving cytochrome P450 (CYP) and UDP-
glucuronosyltransferase (UGT). Br J Clin Pharmacol 76:587-602.
Ma Y, Fu Y, Khojasteh SC, Dalvie D, and Zhang D (2017) Glucuronides as Potential Anionic
Substrates of Human Cytochrome P450 2C8 (CYP2C8). J Med Chem.
Mikuls TR, Farrar JT, Bilker WB, Fernandes S, Schumacher HR, Jr., and Saag KG (2005) Gout
epidemiology: results from the UK General Practice Research Database, 1990-1999. Ann
Rheum Dis 64:267-272.
Nakamura A, Nakajima M, Yamanaka H, Fujiwara R, and Yokoi T (2008) Expression of
UGT1A and UGT2B mRNA in human normal tissues and various cell lines. Drug Metab
Dispos 36:1461-1464.
Nakayama S, Atsumi R, Takakusa H, Kobayashi Y, Kurihara A, Nagai Y, Nakai D, and Okazaki
O (2009) A zone classification system for risk assessment of idiosyncratic drug toxicity
This article has not been copyedited and formatted. The final version may differ from this version.DMD Fast Forward. Published on February 28, 2018 as DOI: 10.1124/dmd.117.078220
at ASPE
T Journals on February 2, 2020
dmd.aspetjournals.org
Dow
nloaded from

DMD Manuscript #78220
37
using daily dose and covalent binding. Drug Metab Dispos 37:1970-1977.
Ouk S, Gunic E, and Vernier J (24 September 2013) Thioacetate Compounds, Compositions and
Methods of Use, U.S. patent 8,541,589 B2.
Perez-Ruiz F, Sundy J, Krishnan E, Hingorani V, Welp J, Suster M, Manhard K, Shen Z, Yeh L-
T, Quart B, Hospital de Cruces, Baracaldo,, Vizcaya,, Spain,, Duke University Medical
Center, Stanford University School of Medicine, and Ardea Biosciences, Inc., (2011)
Efficacy and safety of lesinurad (RDEA594), a novel uricosuric agent, given in
combination with allopurinol in allopurinol-refractory gout patients: randomized, double-
blind, placebo-controlled, phase 2B study [EULAR abstract OP0111]. Ann Rheum Dis
70:104.
Perez-Ruiz F, Sundy JS, Miner JN, Cravets M, Storgard C, and Group RS (2016) Lesinurad in
combination with allopurinol: results of a phase 2, randomised, double-blind study in
patients with gout with an inadequate response to allopurinol. Ann Rheum Dis 75:1074-
1080.
Ridderstrom M, Zamora I, Fjellstrom O, and Andersson TB (2001) Analysis of selective regions
in the active sites of human cytochromes P450, 2C8, 2C9, 2C18, and 2C19 homology
models using GRID/CPCA. J Med Chem 44:4072-4081.
Saag K, Adler S, Bhakta N, Fung M, Kopicko J, Storgard C, and Bardin T (2014) Lesinurad, a
Novel Selective Uric Acid Reabsorption Inhibitor, in Two Phase III Clinical Trials:
Combination Study of Lesinurad in Allopurinol Standard of Care Inadequate Responders
(CLEAR 1 and 2). ACR 5.
Saag K, Fitz-Patrick D, Kopicko J, Fung M, Bhakta N, Adler S, Storgard C, Baumgartner S, and
Becker M (2015) Lesinurad, a Selective Uric Acid Reabsorption Inhibitor, in
Combination With Allopurinol: Results from a Phase III Study in Gout Patients Having
an Inadequate Response to Standard of Care (CLEAR 1). EULAR:4.
Schoch GA, Yano JK, Wester MR, Griffin KJ, Stout CD, and Johnson EF (2004) Structure of
human microsomal cytochrome P450 2C8. Evidence for a peripheral fatty acid binding
site. J Biol Chem 279:9497-9503.
Shen Z, Gillen M, Miner JN, Bucci G, Wilson DM, and Hall JW (2017) Pharmacokinetics,
pharmacodynamics, and tolerability of verinurad, a selective uric acid reabsorption
inhibitor, in healthy adult male subjects. Drug design, development and therapy 11:2077-
2086.
Shen Z, Yeh L, Kerr B, Hingorani V, Polvent E, Suster M, Sheedy B, Miner JN, Nguyen M,
Zhou D, Wilson D, Manhard K, Quart B, and Vince B (2011) RDEA594, a novel
uricosuric agent, shows significant additive activity in combination with allopurinol in
gout patients [ASCPT abstract]. Clin Pharmacol Ther 89(suppl 1):S93.
Singh JA, Akhras KS, and Shiozawa A (2015) Comparative effectiveness of urate lowering with
febuxostat versus allopurinol in gout: analyses from large U.S. managed care cohort.
Arthritis Res Ther 17:120.
Smith PC, Benet LZ, and McDonagh AF (1990) Covalent binding of zomepirac glucuronide to
proteins: evidence for a Schiff base mechanism. Drug Metab Dispos 18:639-644.
Tan PK, Hyndman D, Liu S, Quart BD, and Miner JN (2011) Lesinurad (RDEA594), a novel
investigational uricosuric agent for hyperuricemia and gout, blocks transport of uric acid
This article has not been copyedited and formatted. The final version may differ from this version.DMD Fast Forward. Published on February 28, 2018 as DOI: 10.1124/dmd.117.078220
at ASPE
T Journals on February 2, 2020
dmd.aspetjournals.org
Dow
nloaded from

DMD Manuscript #78220
38
induced by hydrochlorothiazide [EULAR abstract THU0025]. Ann Rheum Dis 70:187.
Tan PK, Liu S, Gunic E, and Miner JN (2017) Discovery and characterization of verinurad, a
potent and specific inhibitor of URAT1 for the treatment of hyperuricemia and gout.
Scientific reports 7:665.
Zhu Y, Pandya BJ, and Choi HK (2011) Prevalence of gout and hyperuricemia in the US general
population: the National Health and Nutrition Examination Survey 2007-2008, in:
Arthritis Rheum, pp 3136-3141.
This article has not been copyedited and formatted. The final version may differ from this version.DMD Fast Forward. Published on February 28, 2018 as DOI: 10.1124/dmd.117.078220
at ASPE
T Journals on February 2, 2020
dmd.aspetjournals.org
Dow
nloaded from
DMD Manuscript #78220
39
Figure legends
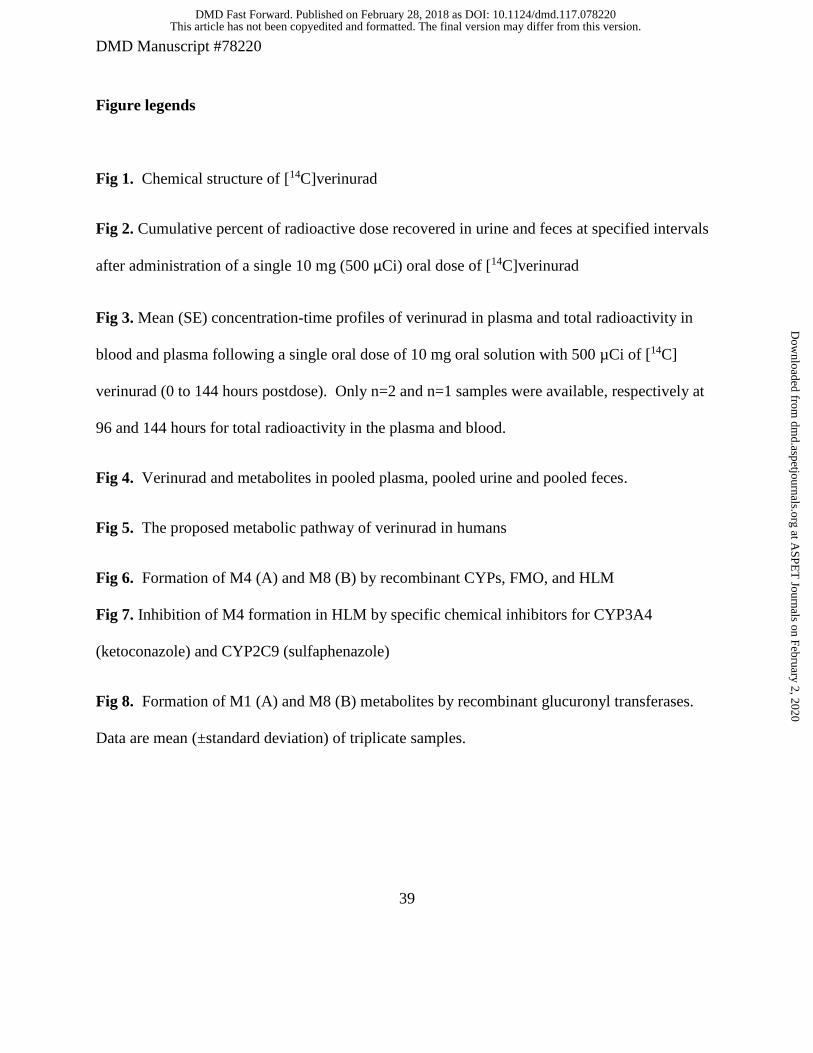
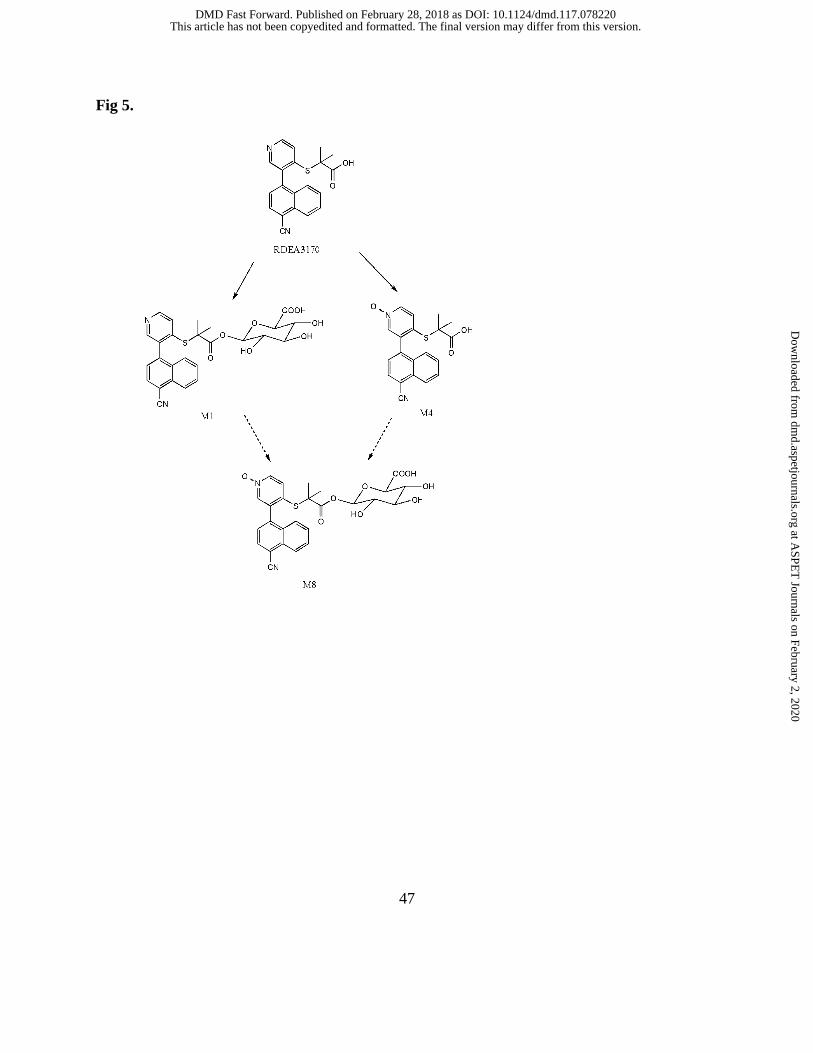
Fig 1. Chemical structure of [14C]verinurad
Fig 2. Cumulative percent of radioactive dose recovered in urine and feces at specified intervals
after administration of a single 10 mg (500 µCi) oral dose of [14C]verinurad
Fig 3. Mean (SE) concentration-time profiles of verinurad in plasma and total radioactivity in
blood and plasma following a single oral dose of 10 mg oral solution with 500 µCi of [14C]
verinurad (0 to 144 hours postdose). Only n=2 and n=1 samples were available, respectively at
96 and 144 hours for total radioactivity in the plasma and blood.
Fig 4. Verinurad and metabolites in pooled plasma, pooled urine and pooled feces.
Fig 5. The proposed metabolic pathway of verinurad in humans
Fig 6. Formation of M4 (A) and M8 (B) by recombinant CYPs, FMO, and HLM
Fig 7. Inhibition of M4 formation in HLM by specific chemical inhibitors for CYP3A4
(ketoconazole) and CYP2C9 (sulfaphenazole)
Fig 8. Formation of M1 (A) and M8 (B) metabolites by recombinant glucuronyl transferases.
Data are mean (±standard deviation) of triplicate samples.
This article has not been copyedited and formatted. The final version may differ from this version.DMD Fast Forward. Published on February 28, 2018 as DOI: 10.1124/dmd.117.078220
at ASPE
T Journals on February 2, 2020
dmd.aspetjournals.org
Dow
nloaded from

DMD Manuscript #78220
40
Table 1. Summary of Pharmacokinetic Parameters (geometric mean, CI95%) of Verinurad in Blood and Plasma Following a Single
Oral Dose of [14C]verinurad (10 mg, 500 µCi) Given to Healthy Male Subjects
Analyte Matrix Tmax
(hr)b
Cmax
(ng/mL)
AUC∞
(ng·hr/mL)
CL/F
(L/hr)
Vss/F
(L)
t1/2
(hr)
CLr0-96hr
(mL/min)
Verinurad
(N=8)
Plasma 0.50 160 193 51.8 504 14.8
- (0.50-0.75) (117-219) (152-246) (40.7-65.9) (368-690)
(11.9-
18.4)
Urine - - - - - -
11.5
(7.64-17.3)
Total
Radioactivitya
(N=8)
Plasma 0.50 344 906
- -
34.7
(0.50-0.75) (255-465) (742-1110) (26.9-
44.7)
-
Blood 0.50 190 556
- -
37.5
(0.25-0.75) (144-250) (428-723) (19.9-
70.6)
-
Blood-to-Plasma
Ratio -
0.551 0.614 - - - -
(0.527-0.576) (0.535-0.703)
Plasma Verinurad-
to-Total
Radioactivity
-
0.464 0.213
- - - - (0.433-0.496) (0.194-0.234)
aCmax and AUC values expressed as ng-equivalent/mL and ng-equivalent·hr/mL, respectively.
bTmax is expressed as median (range)
This article has not been copyedited and formatted. The final version may differ from this version.DMD Fast Forward. Published on February 28, 2018 as DOI: 10.1124/dmd.117.078220
at ASPE
T Journals on February 2, 2020
dmd.aspetjournals.org
Dow
nloaded from

DMD Manuscript #78220
41
Table 2. Recovery of verinurad and metabolites in excreta as a percentage of verinurad dose
Pathway Time Period
(hr)
% of Dose
M1 M4 M8 Othersa Verinurad Total
Urineb 0-48 29.2 0.33 32.5 0.36 1.17 63.6c
Fecesb 0-120 ND ND ND 0.67 29.9 30.6
Total Excretad 0-120 29.2 0.33 32.5 1.03 31.1 94.2
aOthers: including unidentified minor metabolites
bUrine collection up to 48 hr; and feces collection up to 120 hr
cUrine collection from 0-120 hours recovered 64.5% of dose.
dThe recovery of total radioactivity from 0-144 hr interval was 97.1%.
ND: Not detectable
This article has not been copyedited and formatted. The final version may differ from this version.DMD Fast Forward. Published on February 28, 2018 as DOI: 10.1124/dmd.117.078220
at ASPE
T Journals on February 2, 2020
dmd.aspetjournals.org
Dow
nloaded from

DMD Manuscript #78220
42
Table 3. Summary of pharmacokinetic parameters (Geometric Mean, CI95%) for M1 and M8
Analyte Tmax
a Cmax AUClast AUC∞ t1/2 CLr0-96hr
(hr) (ng/mL) (ng·hr/mL) (ng·hr/mL) (hr) (mL/min)
M1 0.5 189 287 290 12.9 224
(N=8) (0.50-0.75) (112-320) (182-452) (185-455) (10.2-16.4) (182-276)
M1-to-verinurad ratio - 0.786 1.01 0.997
- - (0.606-1.02) (0.769-1.34) (0.761-1.31)
M1-to-total radioactivity ratio -
0.550 0.340 0.321 - -
(0.428-0.705) (0.252-0.459) (0.238-0.432)
M8 0.75 120 273 283 18.1 338
(N=8) (0.50-0.75) (102-142) (227-329) (235-342) (12.4-26.5) (286-399)
M8-to-verinurad ratio - 0.485 0.936 0.943
- - (0.381-0.617) (0.769-1.14) (0.777-1.14)
M8-to-total radioactivity ratio -
0.350 0.324 0.313 - -
(0.282-0.433) (0.290-0.361) (0.279-0.351) aTmax is expressed as median (range)
This article has not been copyedited and formatted. The final version may differ from this version.DMD Fast Forward. Published on February 28, 2018 as DOI: 10.1124/dmd.117.078220
at ASPE
T Journals on February 2, 2020
dmd.aspetjournals.org
Dow
nloaded from
43
Fig 1.
This article has not been copyedited and formatted. The final version may differ from this version.DMD Fast Forward. Published on February 28, 2018 as DOI: 10.1124/dmd.117.078220
at ASPE
T Journals on February 2, 2020
dmd.aspetjournals.org
Dow
nloaded from

44
Fig 2.
0 24 48 72 96 120 144
0
20
40
60
80
100
T im e ( H o u r s P o s td o s e )
Pe
rc
en
t o
f R
ad
ioa
ctiv
e D
os
e R
ec
ov
ere
d U rin e
F e c e s
T o ta l (U r in e + F e c e s )
This article has not been copyedited and formatted. The final version may differ from this version.DMD Fast Forward. Published on February 28, 2018 as DOI: 10.1124/dmd.117.078220
at ASPE
T Journals on February 2, 2020
dmd.aspetjournals.org
Dow
nloaded from

45
Fig 3.
This article has not been copyedited and formatted. The final version may differ from this version.DMD Fast Forward. Published on February 28, 2018 as DOI: 10.1124/dmd.117.078220
at ASPE
T Journals on February 2, 2020
dmd.aspetjournals.org
Dow
nloaded from
46
Fig 4.
This article has not been copyedited and formatted. The final version may differ from this version.DMD Fast Forward. Published on February 28, 2018 as DOI: 10.1124/dmd.117.078220
at ASPE
T Journals on February 2, 2020
dmd.aspetjournals.org
Dow
nloaded from
47
Fig 5.
This article has not been copyedited and formatted. The final version may differ from this version.DMD Fast Forward. Published on February 28, 2018 as DOI: 10.1124/dmd.117.078220
at ASPE
T Journals on February 2, 2020
dmd.aspetjournals.org
Dow
nloaded from

48
Fig 6.
Insect
Cn
t l
CY
P1A
1
CY
P1A
2
CY
P1B
1
CY
P2A
6
CY
P2B
6
CY
P2C
8
CY
P2C
9
CY
P2C
18
CY
P2C
19
CY
P2D
6
CY
P2E
1
CY
P2J2
CY
P3A
4
CY
P3A
5
FM
O3
HL
M
0
1
2
3
Ve
rin
ur
ad
-M
4 P
ea
k A
re
a R
atio
to
IS
A
Inse
c t C
nt l
CY
P1A
1
CY
P1A
2
CY
P1B
1
CY
P2A
6
CY
P2B
6
CY
P2C
8
CY
P2C
9
CY
P2C
19
CY
P2D
6
CY
P2E
1
CY
P2J2
CY
P3A
4
CY
P3A
5
CY
P4A
11
FM
O1
FM
O3
FM
O5
HL
M
0 .0
0 .5
1 .0
1 .5
2 .0
Ve
rin
ur
ad
-M
8 P
ea
k A
re
a R
atio
to
IS
B
This article has not been copyedited and formatted. The final version may differ from this version.DMD Fast Forward. Published on February 28, 2018 as DOI: 10.1124/dmd.117.078220
at ASPE
T Journals on February 2, 2020
dmd.aspetjournals.org
Dow
nloaded from

49
Fig 7.
0 3 0 6 0 9 0
0 .0 0
0 .0 2
0 .0 4
0 .0 6
T i m e ( m in )
Pe
aK
Ar
ea
Ra
tio
of M
4 t
o I
S
H L M
H L M + 1 0 M S u lfa p h e n a z o le
H L M + 1 M K e to c o n a z o le
This article has not been copyedited and formatted. The final version may differ from this version.DMD Fast Forward. Published on February 28, 2018 as DOI: 10.1124/dmd.117.078220
at ASPE
T Journals on February 2, 2020
dmd.aspetjournals.org
Dow
nloaded from

50
Fig 8.
Inse
c t C
nt l
UG
T1A
1
UG
T1A
3
UG
T1A
4
UG
T1A
6
UG
T1A
7
UG
T1A
8
UG
T1A
9
UG
T1A
10
UG
T2B
4
UG
T2B
7
UG
T2B
10
UG
T2B
15
UG
T2B
17
HL
M
0
2
4
6
8
1 0
Pe
ak
Ar
ea
Ra
tio
of M
1 t
o I
S
A
Inse
c t C
nt l
UG
T1A
1
UG
T1A
3
UG
T1A
4
UG
T1A
6
UG
T1A
7
UG
T1A
8
UG
T1A
9
UG
T1A
10
UG
T2B
4
UG
T2B
7
UG
T2B
10
UG
T2B
15
UG
T2B
17
0 .0 0
0 .0 5
0 .1 0
0 .1 5
0 .2 0
0 .2 5
Pe
ak
Ar
ea
Ra
tio
of M
8 t
o I
S
B
This article has not been copyedited and formatted. The final version may differ from this version.DMD Fast Forward. Published on February 28, 2018 as DOI: 10.1124/dmd.117.078220
at ASPE
T Journals on February 2, 2020
dmd.aspetjournals.org
Dow
nloaded from