Embed Size (px)
Citation preview

Carol White Physical Carol White Physical Education GrantEducation Grant
First Year Evaluation & Report

Selected Descriptive StatisticsSelected Descriptive Statistics
For the most part data entry by teachers was “clean”. However, when data was “damaged” is was really “damaged”, e.g. the height of students in one class was reported as not having one child taller than 1.2 feet !!!!!
Other examples of not looking at their own data included giving the weight of a child well over 1000 pounds.
Caution your teachers to look at the data. Proof read it for errors.

Numbers of Students in the Numbers of Students in the First Year DatabaseFirst Year Database
0
200
400
600
800
1000
1200
1400
N
2nd Grade
4th Grade
6th Grade
8th Grade
9th Grade
Other Grades

Participation by GenderParticipation by Gender
0
10
20
30
40
50
60
70
80
90
100
Males
Females
Total

Student Height Ranges For Student Height Ranges For Females in InchesFemales in Inches
0
10
20
30
40
50
60
70
80
2ndGrade
4thGrade
6thGrade
8thGrade
9thGrade
Minimum
Maximum

Student Height Ranges For Student Height Ranges For Males in InchesMales in Inches
0
10
20
30
40
50
60
70
80
2ndGrade
4thGrade
6thGrade
8thGrade
9thGrade
Minimum
Maximum

Ranges of Height Ranges of Height Males & FemalesMales & Females
0
1020
3040
50
6070
80
2ndGradeBoys
4thGradeBoys
6thGradeBoys
8thGradeBoys
9thGradeBoys
Minimum
Maximum

Student Height Ranges For Student Height Ranges For Females in PoundsFemales in Pounds
0
50
100
150
200
250
300
2ndGrade
4thGrade
6thGrade
8thGrade
9thGrade
Minimum
Maximum

Student Height Ranges For Student Height Ranges For Males in InchesMales in Inches
0
50
100
150
200
250
300
350
2ndGrade
4thGrade
6thGrade
8thGrade
9thGrade
Minimum
Maximum

Ranges of WeightRanges of WeightMales & FemalesMales & Females
0
50
100
150
200
250
300
350
2ndGradeBoys
4thGradeBoys
6thGradeBoys
8thGradeBoys
9thGradeBoys
Minimum
Maximum

Body Mass Index Body Mass Index Percent Above Normal RangePercent Above Normal Range
05
101520253035404550
2ndGrad
4thGrade
6thGrade
8thGrade
9thGrade
Males
Females

Body Mass Index by Means for Body Mass Index by Means for
Males and Females by Grade Level.Males and Females by Grade Level.
0
5
10
15
20
25
Males Females
2nd Grade
4th Grade
6th Grade
8th Grade
9th Grade

Push-ups by Grade Level and Gender In Push-ups by Grade Level and Gender In Percent Below Normal Range Percent Below Normal Range
0
10
20
30
40
50
60
70
2ndGrade
4thGrade
6thGrade
8thGrade
9thGrade
Males
Females

Curl-ups by Grade Level and Gender In Curl-ups by Grade Level and Gender In Percent Below Normal RangePercent Below Normal Range
05
1015
202530
354045
2ndGrade
4thGrade
6thGrade
8thGrade
9thGrade
Males
Females

Back Saver Back Saver RightRight by Grade Level and by Grade Level and Gender In Percent Below Normal RangeGender In Percent Below Normal Range
0
5
10
15
20
25
30
35
2ndGrade
4thGrade
6thGrade
8thGrade
9thGrade
Males
Females

Back Saver Back Saver LeftLeft by Grade Level and by Grade Level and Gender In Percent Below Normal RangeGender In Percent Below Normal Range
0
5
10
15
20
25
30
35
2ndGrade
4thGrade
6thGrade
8thGrade
9thGrade
Males
Females

PACER by Grade Level and Gender In PACER by Grade Level and Gender In Percent Below Normal RangePercent Below Normal Range
05
101520253035404550
2ndGrade
4thGrade
6thGrade
8thGrade
9thGrade
Males
Females
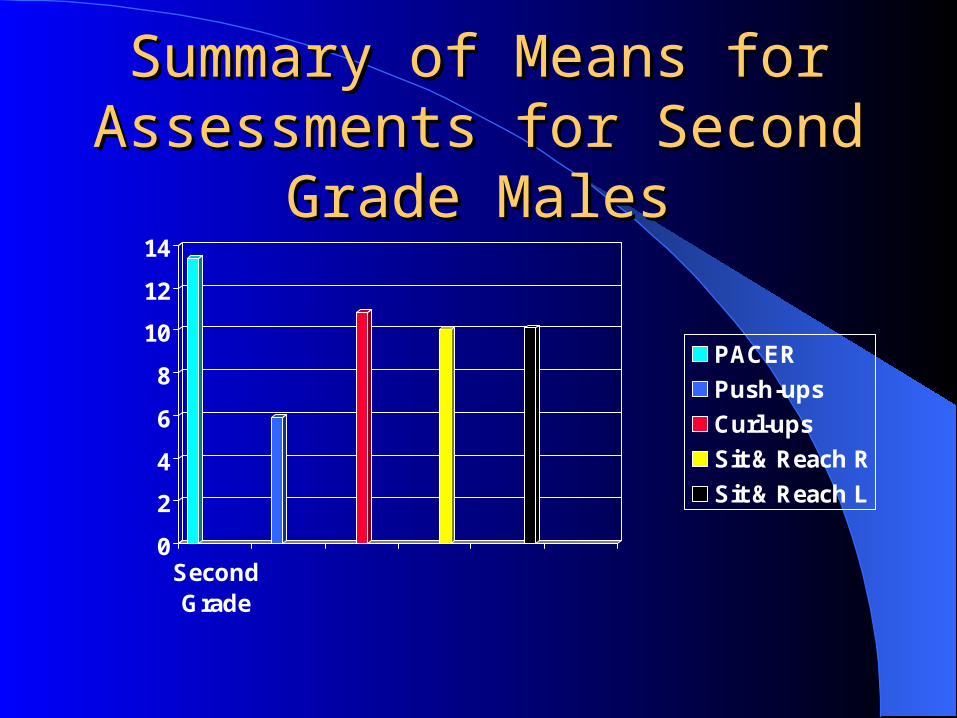
Summary of Means for Summary of Means for Assessments for Second Assessments for Second
Grade MalesGrade Males
0
2
4
6
8
10
12
14
SecondGrade
PACER
Push-ups
Curl-ups
Sit & Reach R
Sit & Reach L

Summary of Means for Summary of Means for Assessments for 4th Grade Assessments for 4th Grade
MalesMales
0
5
10
15
20
25
FourthGrade
PACER
Push-ups
Curl-ups
Sit & Reach R
Sit & Reach L

Summary of Means for Summary of Means for Assessments for Sixth Grade Assessments for Sixth Grade
Males.Males.
0
5
10
15
20
25
30
SixthGrade
PACER
Push-ups
Curl-ups
Sit & Reach R
Sit & Reach L

Summary of Means for Summary of Means for Assessments for Eight Grade Assessments for Eight Grade
Males. Males.
05
10
15202530
354045
EightGrade
PACER
Push-ups
Curl-ups
Sit & Reach R
Sit & Reach L

Summary of Means for Summary of Means for Assessments for Ninth Grade Assessments for Ninth Grade
MalesMales
05
101520253035404550
NinthGrade
PACER
Push-ups
Curl-ups
Sit & Reach R
Sit & Reach L