Embed Size (px)
Citation preview
Useful and useless statistics about viruses and anti-virus programs
Dipl.-Ing. Maik Morgenstern and Hendrik PilzAV-Test GmbH, Magdeburg, Germany
Presented at CARO 2010 Helsinki
http://www.av-test.org
Agenda
• Disclaimer• The Average Anti-Malware Product• The Average Malware• A Typical Day in Anti-Malware Industry• (Serious and not so Serious) Implications• Conclusions• Q&A
Disclaimer
• Not necessarily a scientific presentation• Bases on data from AV-Test only• May not be representative• We are just talking about numbers• We are not claiming anything and we could
be wrong with what we say• Still, some numbers may be interesting
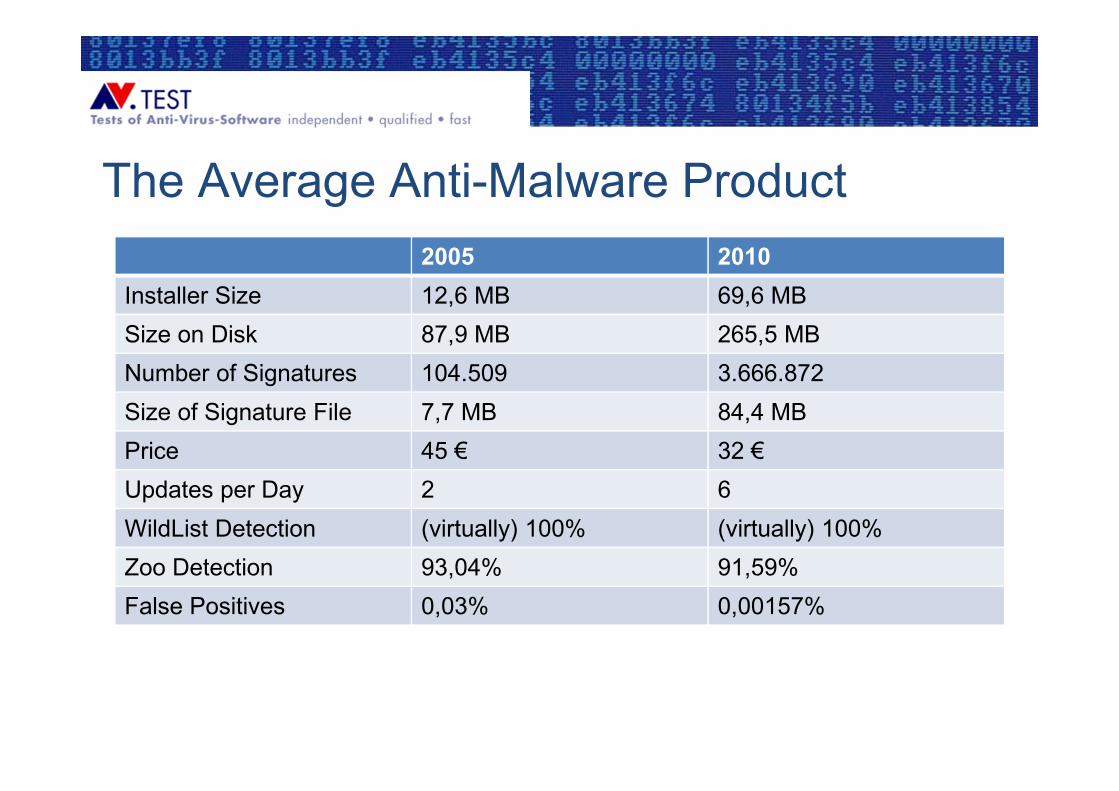
The Average Anti-Malware Product2005 2010
Installer Size 12,6 MB 69,6 MBSize on Disk 87,9 MB 265,5 MBNumber of Signatures 104.509 3.666.872Size of Signature File 7,7 MB 84,4 MBPrice 45 € 32 €Updates per Day 2 6WildList Detection (virtually) 100% (virtually) 100%Zoo Detection 93,04% 91,59%False Positives 0,03% 0,00157%
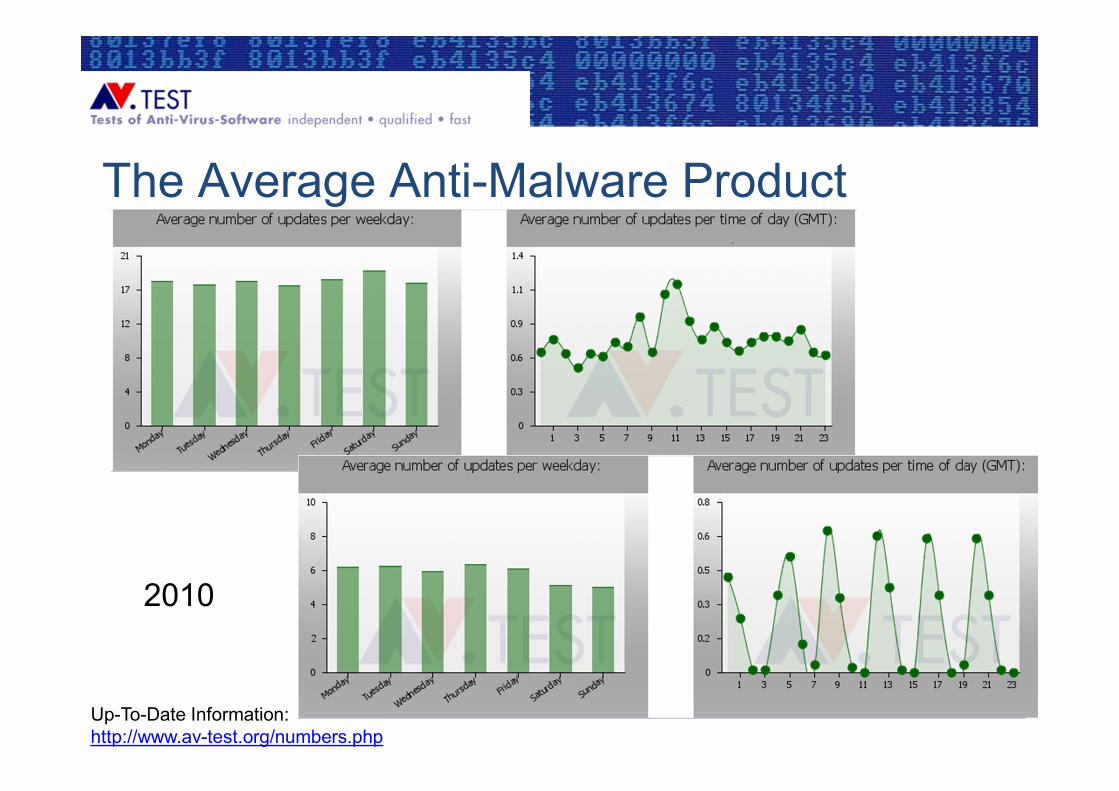
The Average Anti-Malware Product
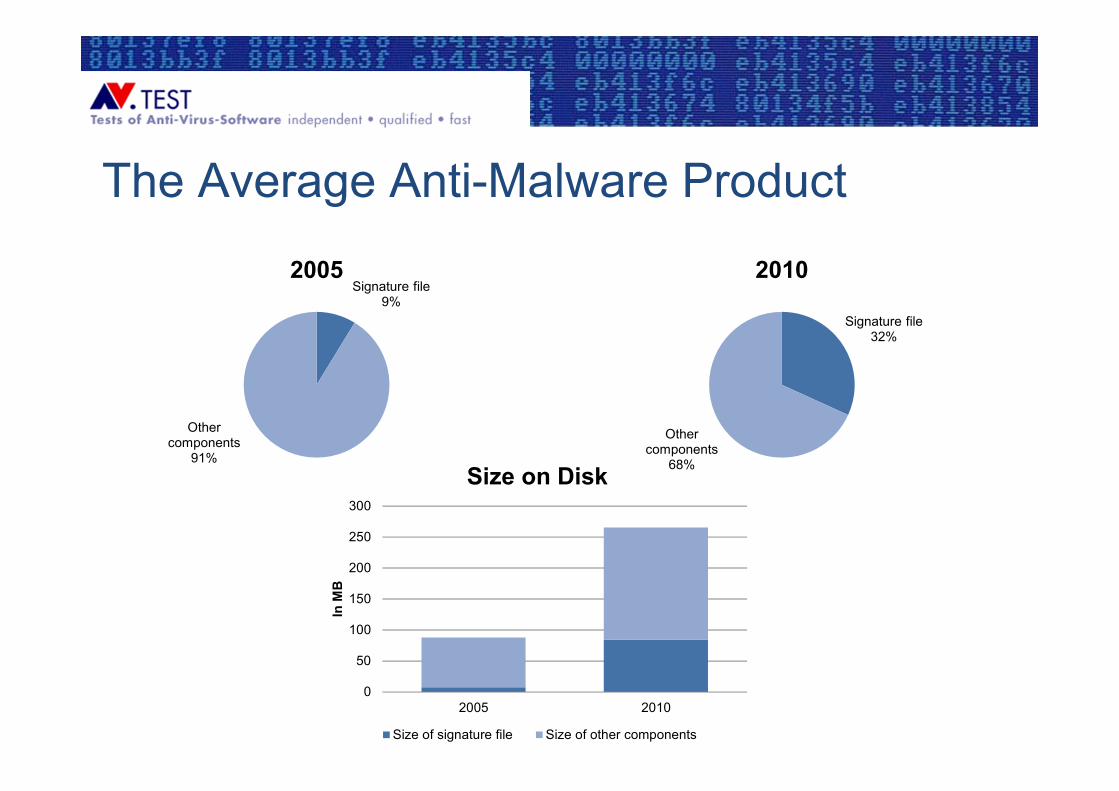
Signature file9%
Other components
91%
2005
Signature file32%
Other components
68%
2010
0
50
100
150
200
250
300
2005 2010
In M
B
Size on Disk
Size of signature file Size of other components
The Average Anti-Malware Product
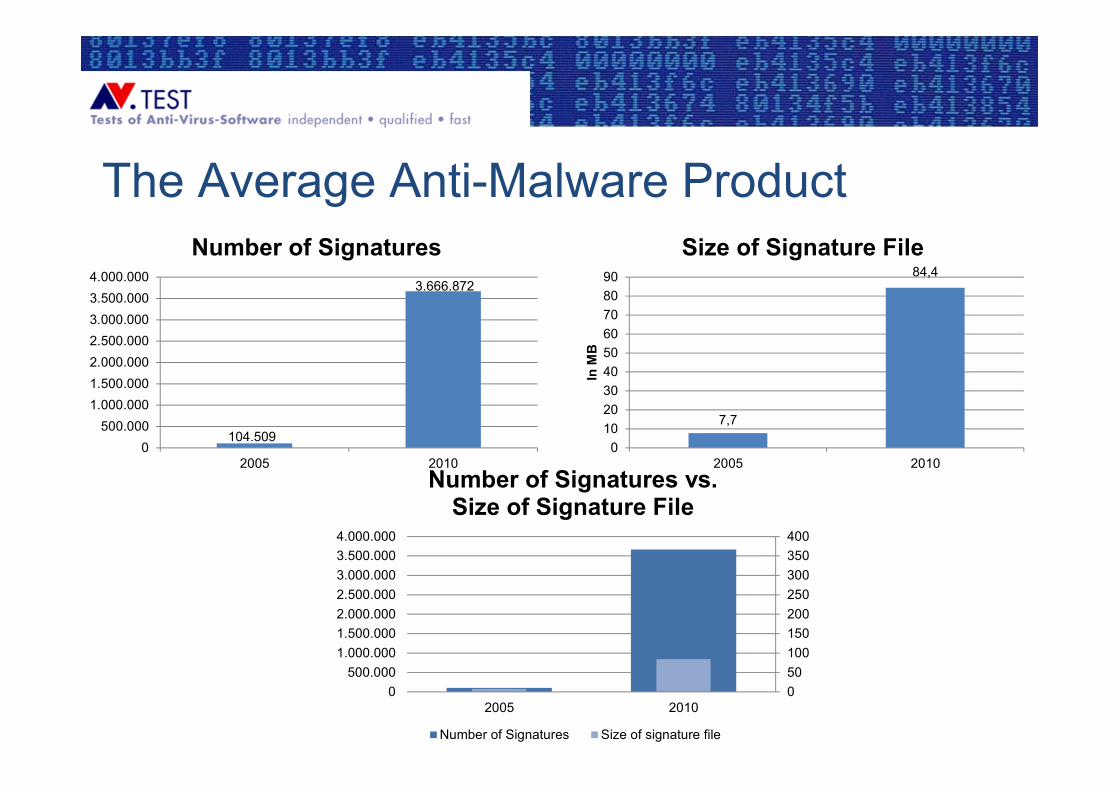
104.509
3.666.872
0500.000
1.000.0001.500.0002.000.0002.500.0003.000.0003.500.0004.000.000
2005 2010
Number of Signatures
7,7
84,4
0102030405060708090
2005 2010
In M
B
Size of Signature File
050100150200250300350400
0500.000
1.000.0001.500.0002.000.0002.500.0003.000.0003.500.0004.000.000
2005 2010
Number of Signatures vs. Size of Signature File
Number of Signatures Size of signature file
The Average Anti-Malware Product
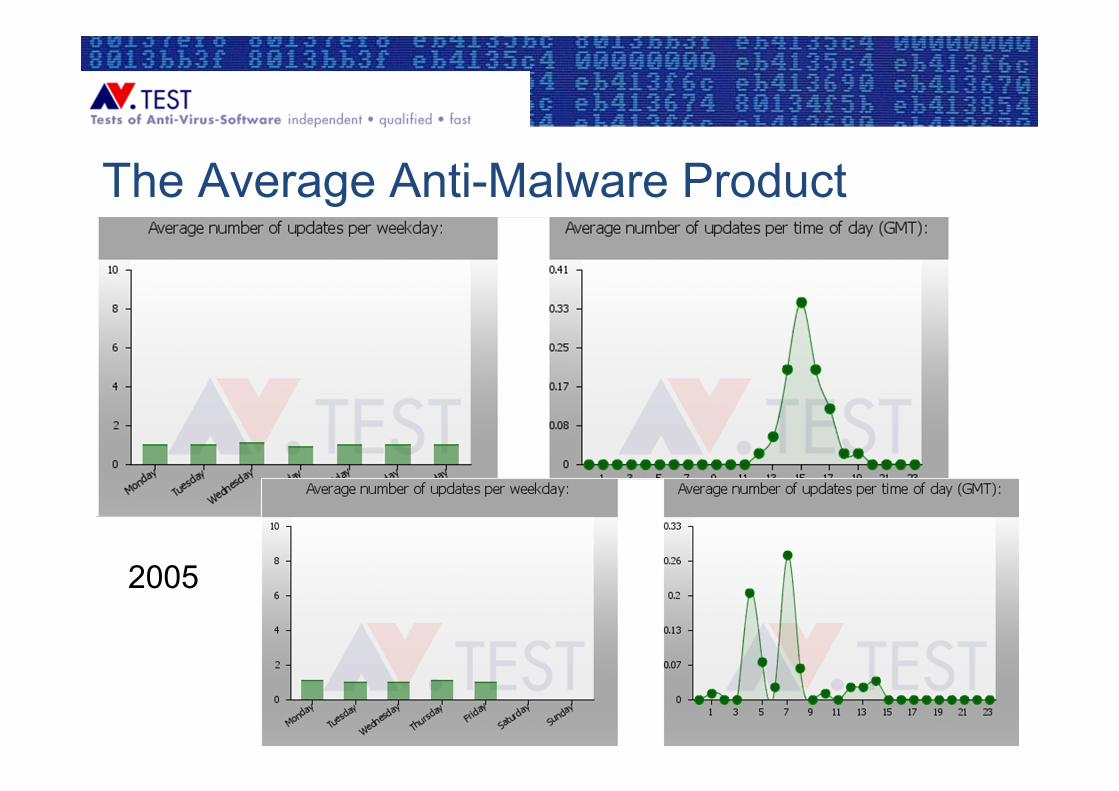
2005
The Average Anti-Malware Product
2010
Up-To-Date Information: http://www.av-test.org/numbers.php
The Average Anti-Malware Product
80,00%
82,00%
84,00%
86,00%
88,00%
90,00%
92,00%
94,00%
96,00%
98,00%
100,00%
06.0
6.20
0706
.07.
2007
06.0
8.20
0706
.09.
2007
06.1
0.20
0706
.11.
2007
06.1
2.20
0706
.01.
2008
06.0
2.20
0806
.03.
2008
06.0
4.20
0806
.05.
2008
06.0
6.20
0806
.07.
2008
06.0
8.20
0806
.09.
2008
06.1
0.20
0806
.11.
2008
06.1
2.20
0806
.01.
2009
06.0
2.20
0906
.03.
2009
06.0
4.20
0906
.05.
2009
06.0
6.20
0906
.07.
2009
06.0
8.20
0906
.09.
2009
06.1
0.20
0906
.11.
2009
06.1
2.20
0906
.01.
2010
06.0
2.20
1006
.03.
2010
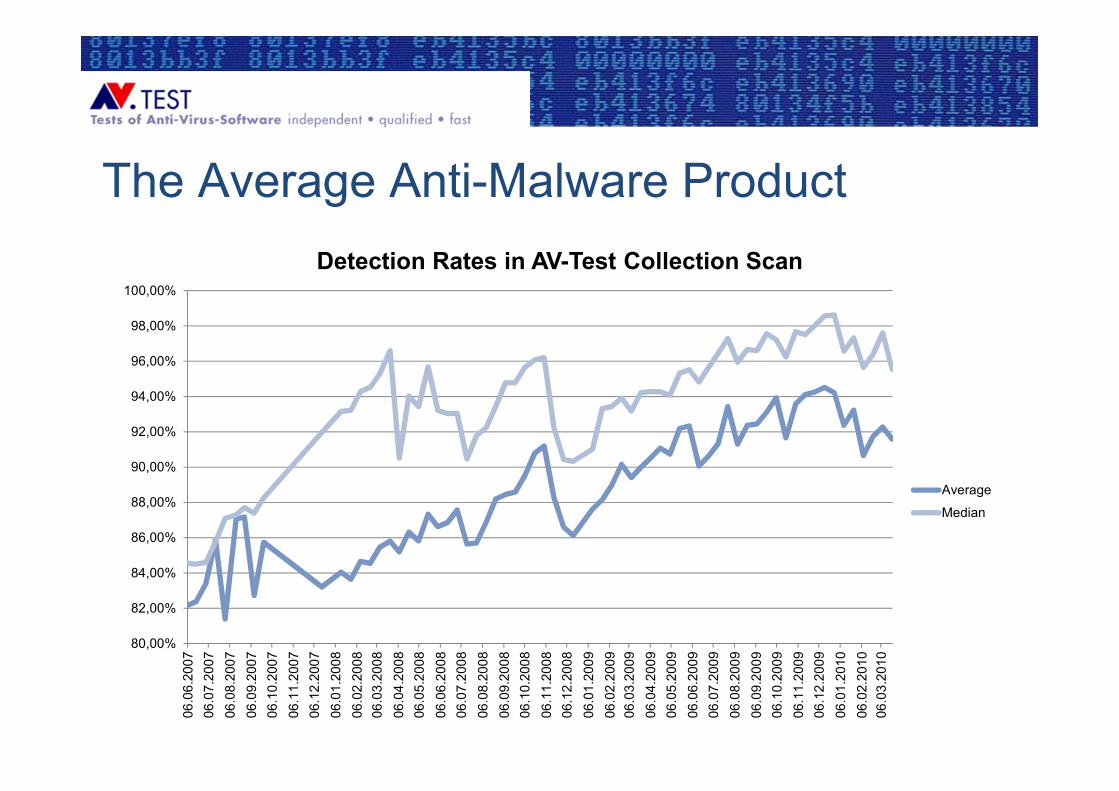
Detection Rates in AV-Test Collection Scan
Average
Median
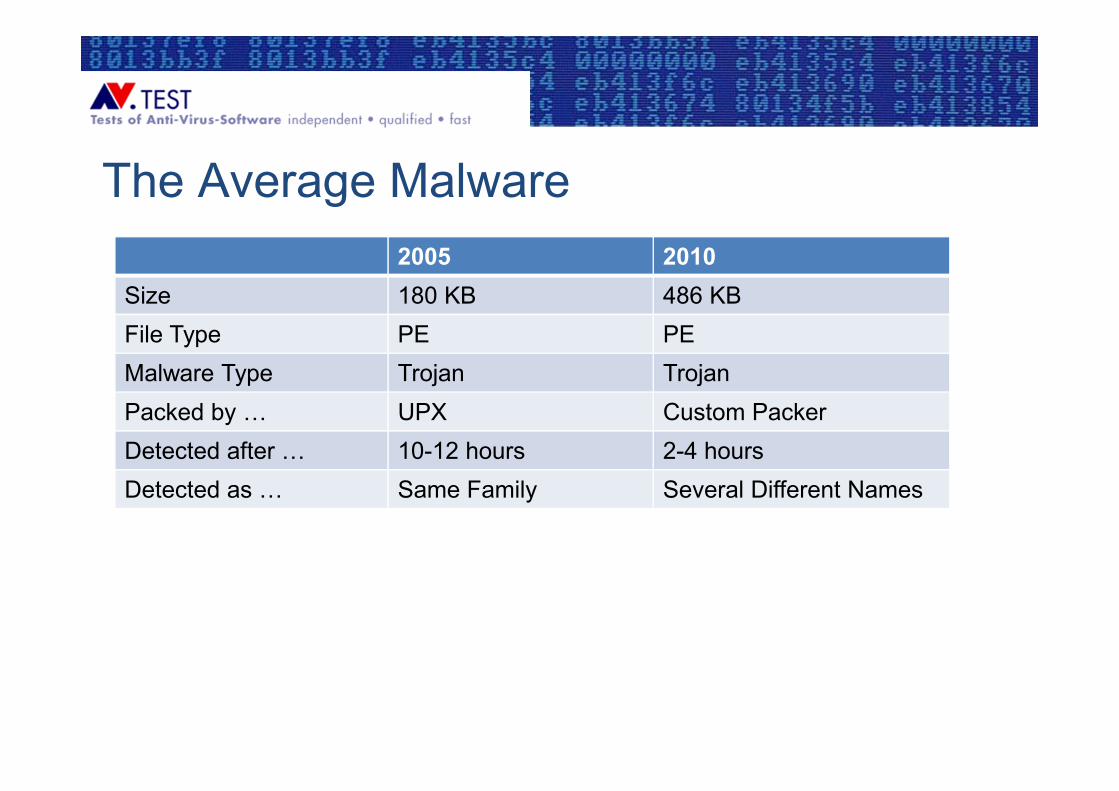
The Average Malware2005 2010
Size 180 KB 486 KBFile Type PE PEMalware Type Trojan TrojanPacked by … UPX Custom PackerDetected after … 10-12 hours 2-4 hoursDetected as … Same Family Several Different Names
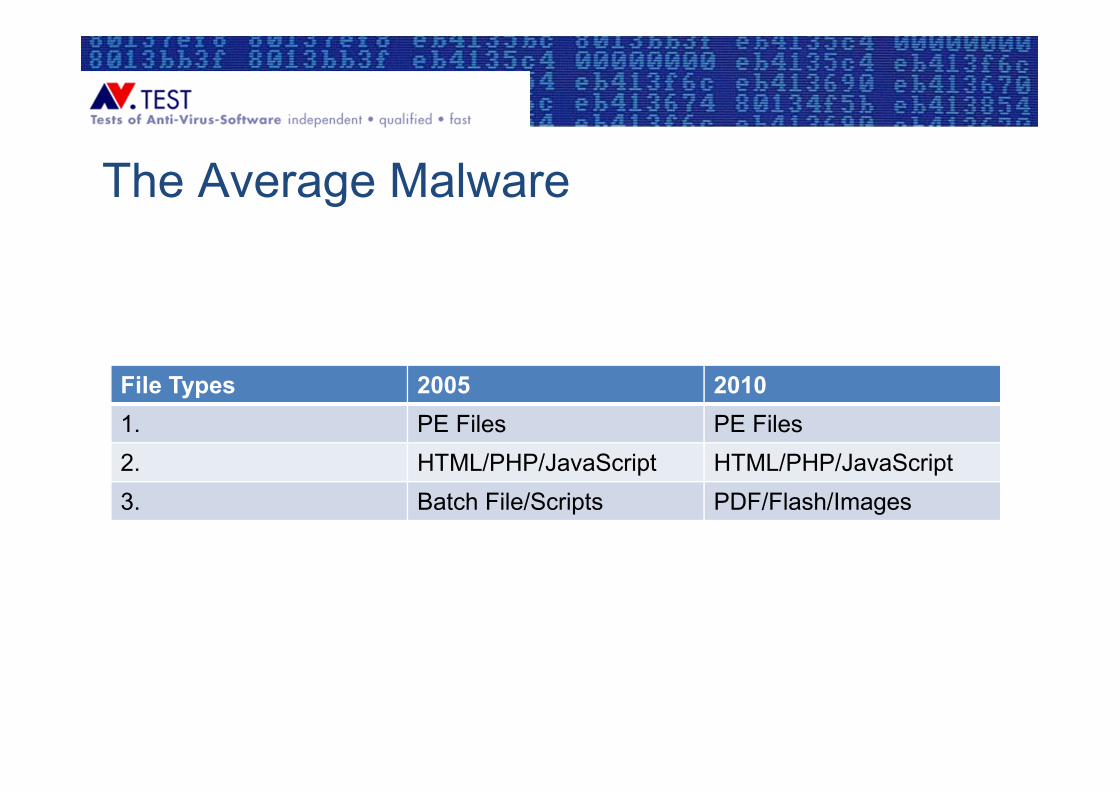
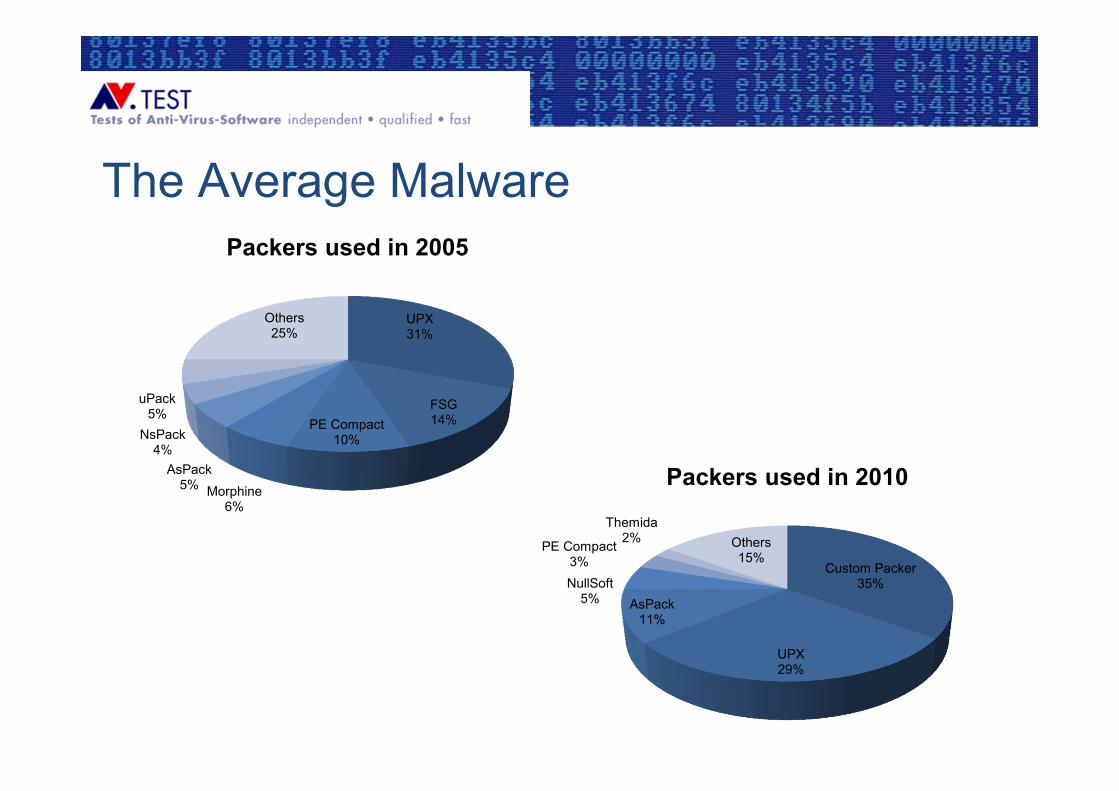
The Average Malware
File Types 2005 20101. PE Files PE Files2. HTML/PHP/JavaScript HTML/PHP/JavaScript3. Batch File/Scripts PDF/Flash/Images
The Average Malware
Custom Packer35%
UPX29%
AsPack11%
NullSoft5%
PE Compact3%
Themida2% Others
15%
Packers used in 2010
UPX31%
FSG14%PE Compact
10%
Morphine6%
AsPack5%
NsPack4%
uPack5%
Others25%
Packers used in 2005
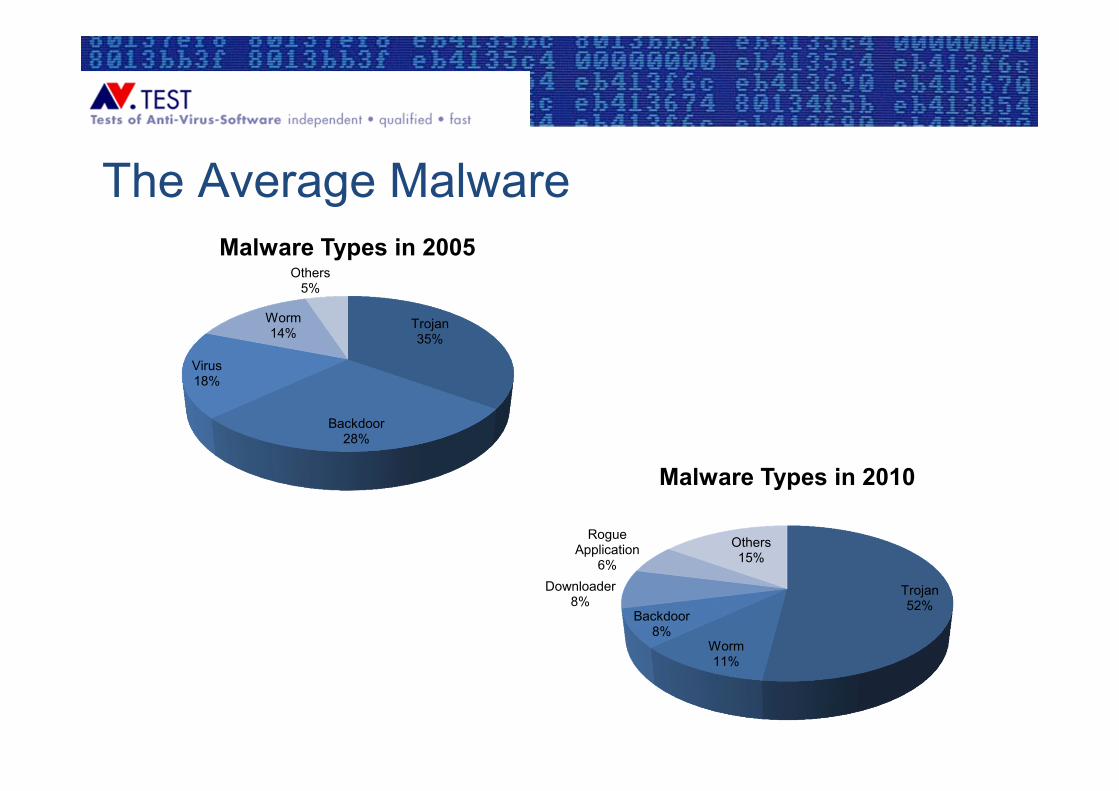
The Average Malware
Trojan35%
Backdoor28%
Virus18%
Worm14%
Others5%
Malware Types in 2005
Trojan52%
Worm11%
Backdoor8%
Downloader8%
Rogue Application
6%
Others15%
Malware Types in 2010
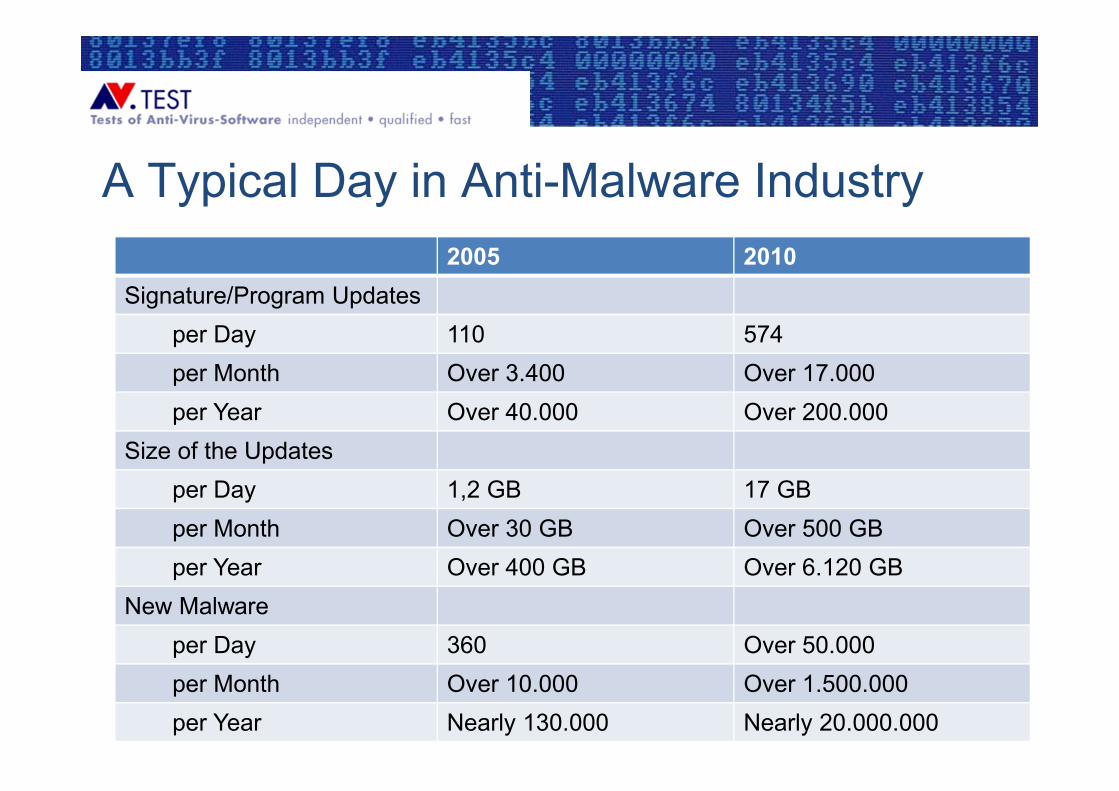
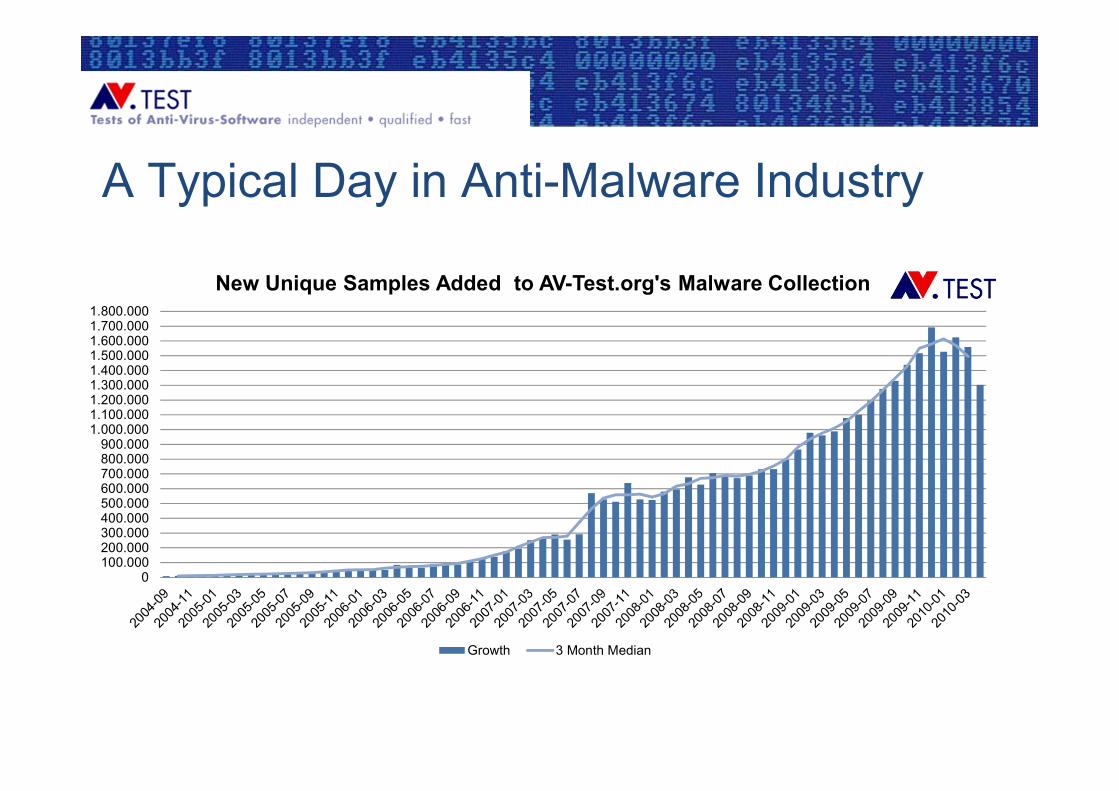
A Typical Day in Anti-Malware Industry2005 2010
Signature/Program Updatesper Day 110 574per Month Over 3.400 Over 17.000per Year Over 40.000 Over 200.000
Size of the Updatesper Day 1,2 GB 17 GBper Month Over 30 GB Over 500 GBper Year Over 400 GB Over 6.120 GB
New Malwareper Day 360 Over 50.000per Month Over 10.000 Over 1.500.000per Year Nearly 130.000 Nearly 20.000.000
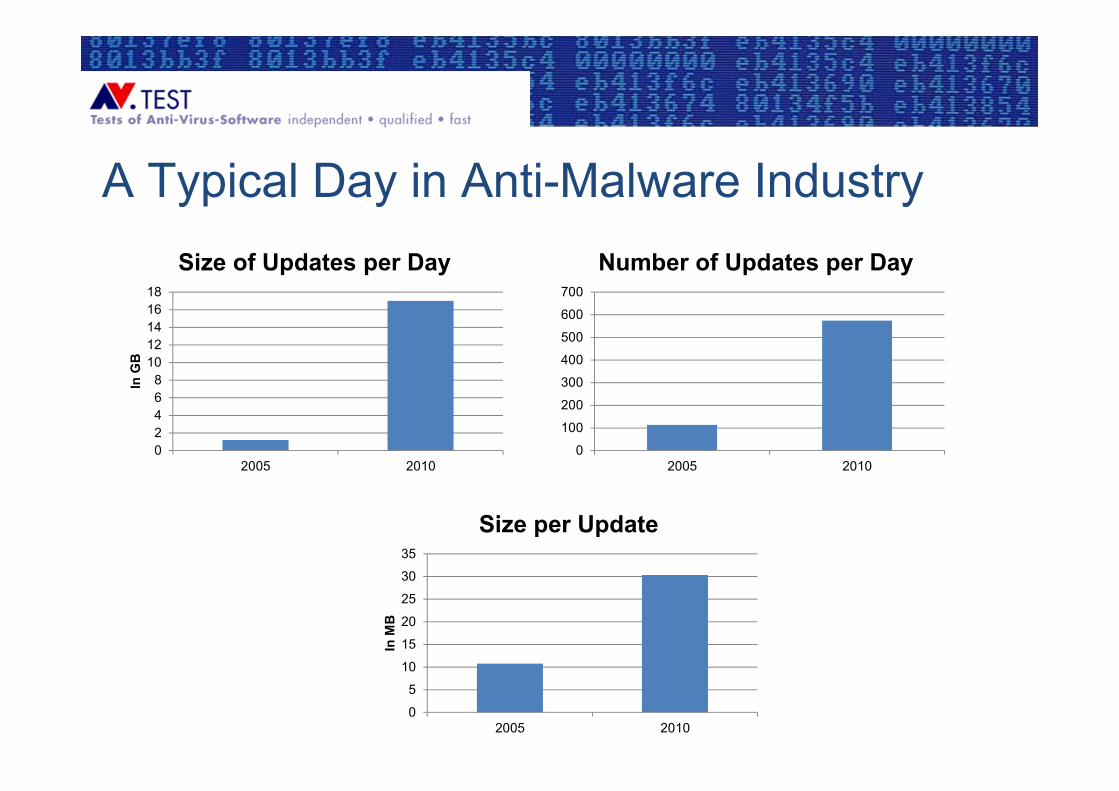
A Typical Day in Anti-Malware Industry
0
5
10
15
20
25
30
35
2005 2010
In M
B
Size per Update
02468
1012141618
2005 2010
In G
B
Size of Updates per Day
0
100
200
300
400
500
600
700
2005 2010
Number of Updates per Day
A Typical Day in Anti-Malware Industry
0100.000200.000300.000400.000500.000600.000700.000800.000900.000
1.000.0001.100.0001.200.0001.300.0001.400.0001.500.0001.600.0001.700.0001.800.000
New Unique Samples Added to AV-Test.org's Malware Collection
Growth 3 Month Median
A Typical Day in Anti-Malware Industry
0
5.000.000
10.000.000
15.000.000
20.000.000
25.000.000
30.000.000
35.000.000
40.000.000
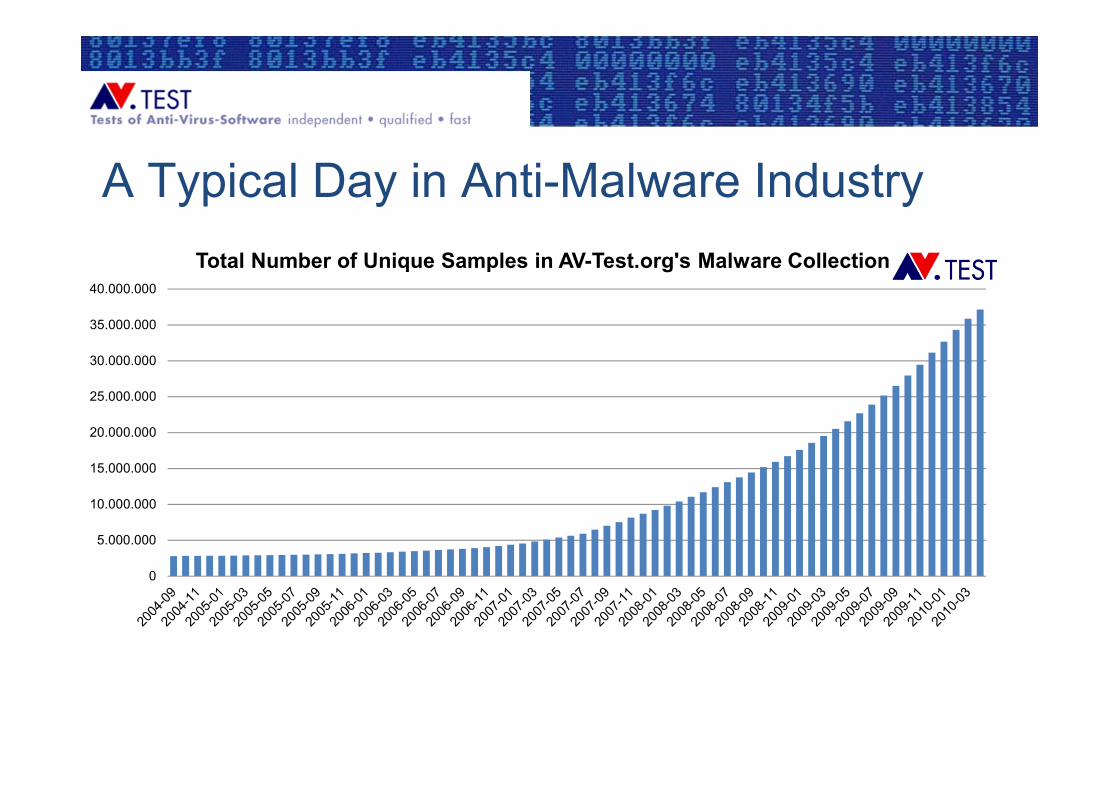
Total Number of Unique Samples in AV-Test.org's Malware Collection
Implications
• Summary of the above– More and more malware is released– More and more signatures are provided– More and more updates are released– … and the updates are getting bigger– Programs are getting bigger– (Relative) Detection rates remain the same
Implications
0
2.500.000
5.000.000
7.500.000
10.000.000
12.500.000
15.000.000
17.500.000
20.000.000
22.500.000
25.000.000
27.500.000
30.000.000
32.500.000
35.000.000
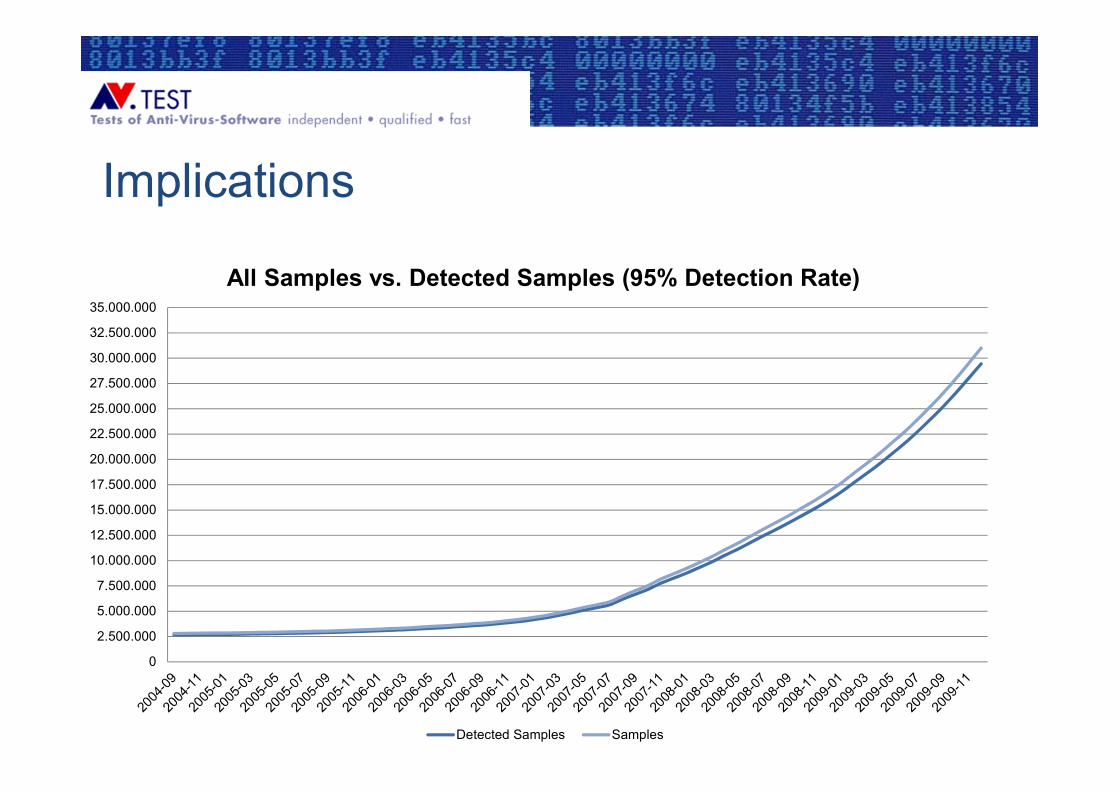
All Samples vs. Detected Samples (95% Detection Rate)
Detected Samples Samples
Implications
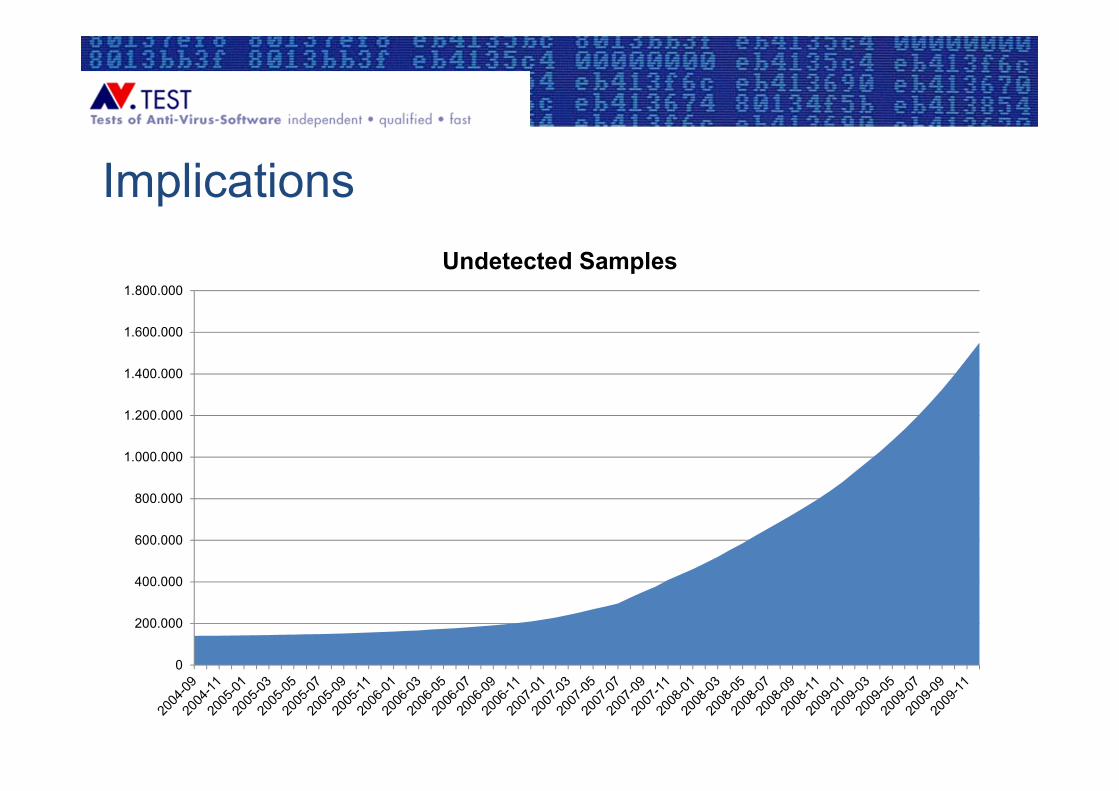
0
200.000
400.000
600.000
800.000
1.000.000
1.200.000
1.400.000
1.600.000
1.800.000
Undetected Samples
Implications
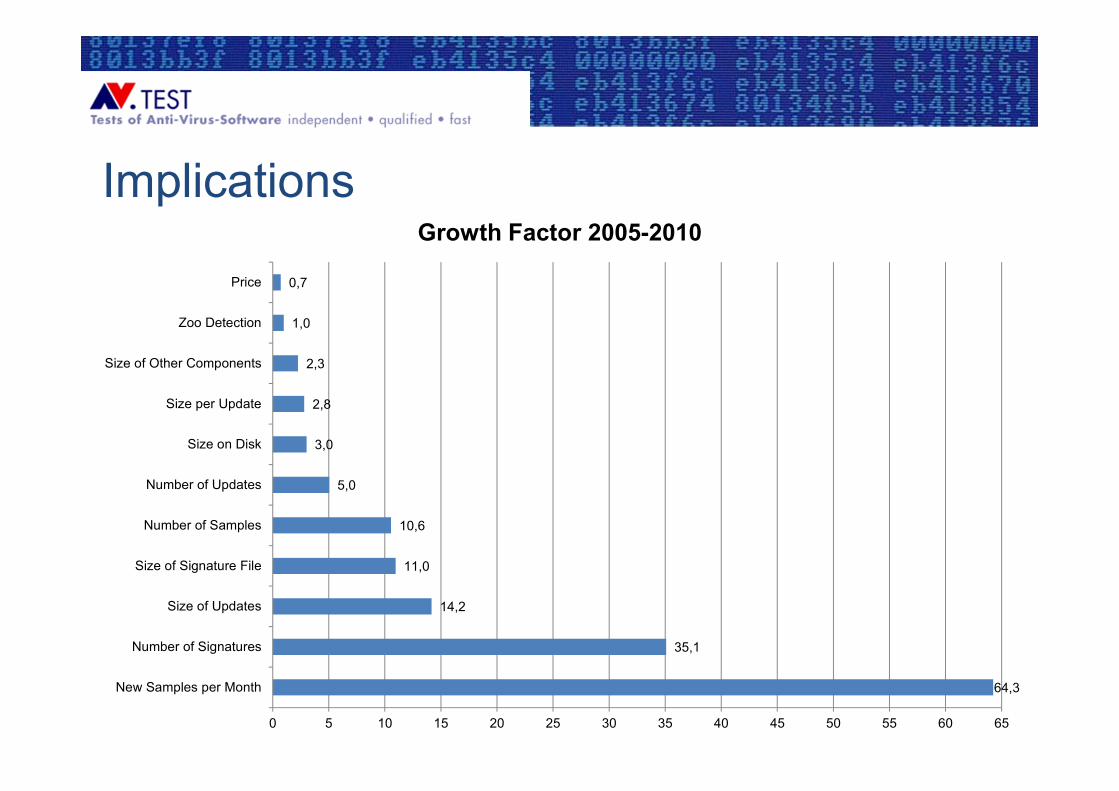
64,3
35,1
14,2
11,0
10,6
5,0
3,0
2,8
2,3
1,0
0,7
0 5 10 15 20 25 30 35 40 45 50 55 60 65
New Samples per Month
Number of Signatures
Size of Updates
Size of Signature File
Number of Samples
Number of Updates
Size on Disk
Size per Update
Size of Other Components
Zoo Detection
Price
Growth Factor 2005-2010
Implications
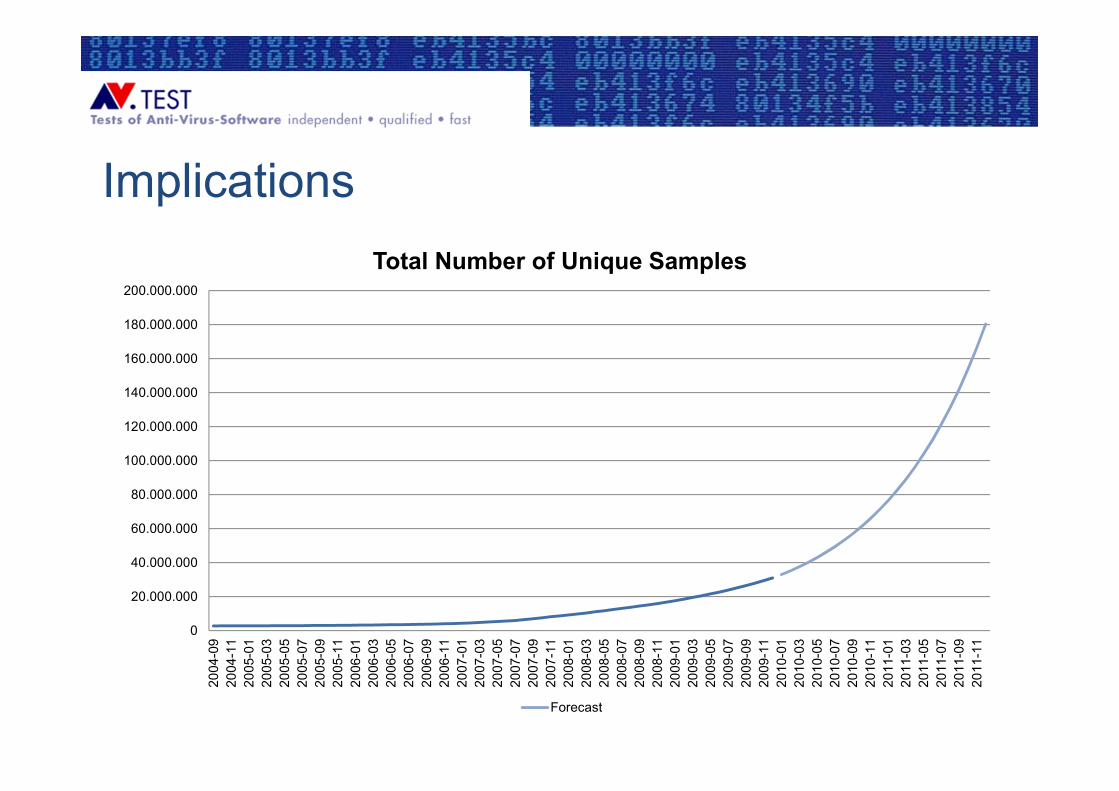
0
20.000.000
40.000.000
60.000.000
80.000.000
100.000.000
120.000.000
140.000.000
160.000.000
180.000.000
200.000.000
2004
-09
2004
-11
2005
-01
2005
-03
2005
-05
2005
-07
2005
-09
2005
-11
2006
-01
2006
-03
2006
-05
2006
-07
2006
-09
2006
-11
2007
-01
2007
-03
2007
-05
2007
-07
2007
-09
2007
-11
2008
-01
2008
-03
2008
-05
2008
-07
2008
-09
2008
-11
2009
-01
2009
-03
2009
-05
2009
-07
2009
-09
2009
-11
2010
-01
2010
-03
2010
-05
2010
-07
2010
-09
2010
-11
2011
-01
2011
-03
2011
-05
2011
-07
2011
-09
2011
-11
Total Number of Unique Samples
Forecast
Implications
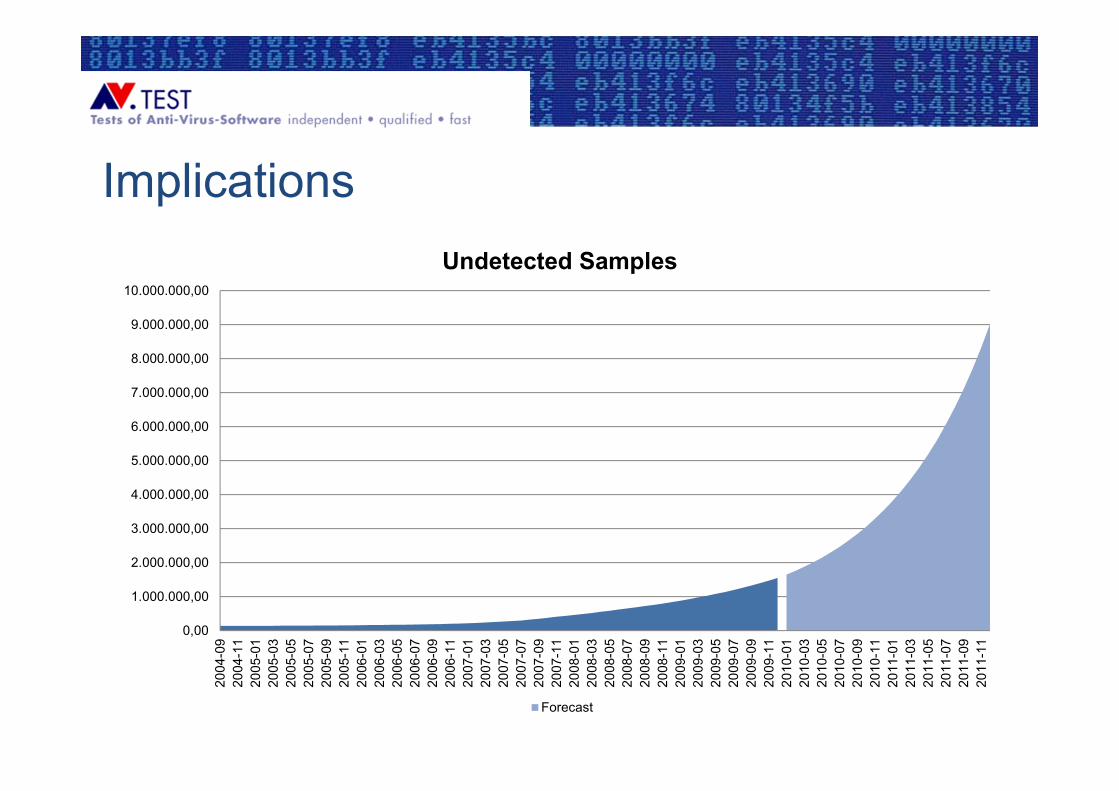
What if the problems are tackled as before?
Implications
0,00
1.000.000,00
2.000.000,00
3.000.000,00
4.000.000,00
5.000.000,00
6.000.000,00
7.000.000,00
8.000.000,00
9.000.000,00
10.000.000,00
2004
-09
2004
-11
2005
-01
2005
-03
2005
-05
2005
-07
2005
-09
2005
-11
2006
-01
2006
-03
2006
-05
2006
-07
2006
-09
2006
-11
2007
-01
2007
-03
2007
-05
2007
-07
2007
-09
2007
-11
2008
-01
2008
-03
2008
-05
2008
-07
2008
-09
2008
-11
2009
-01
2009
-03
2009
-05
2009
-07
2009
-09
2009
-11
2010
-01
2010
-03
2010
-05
2010
-07
2010
-09
2010
-11
2011
-01
2011
-03
2011
-05
2011
-07
2011
-09
2011
-11
Undetected Samples
Forecast
Implications
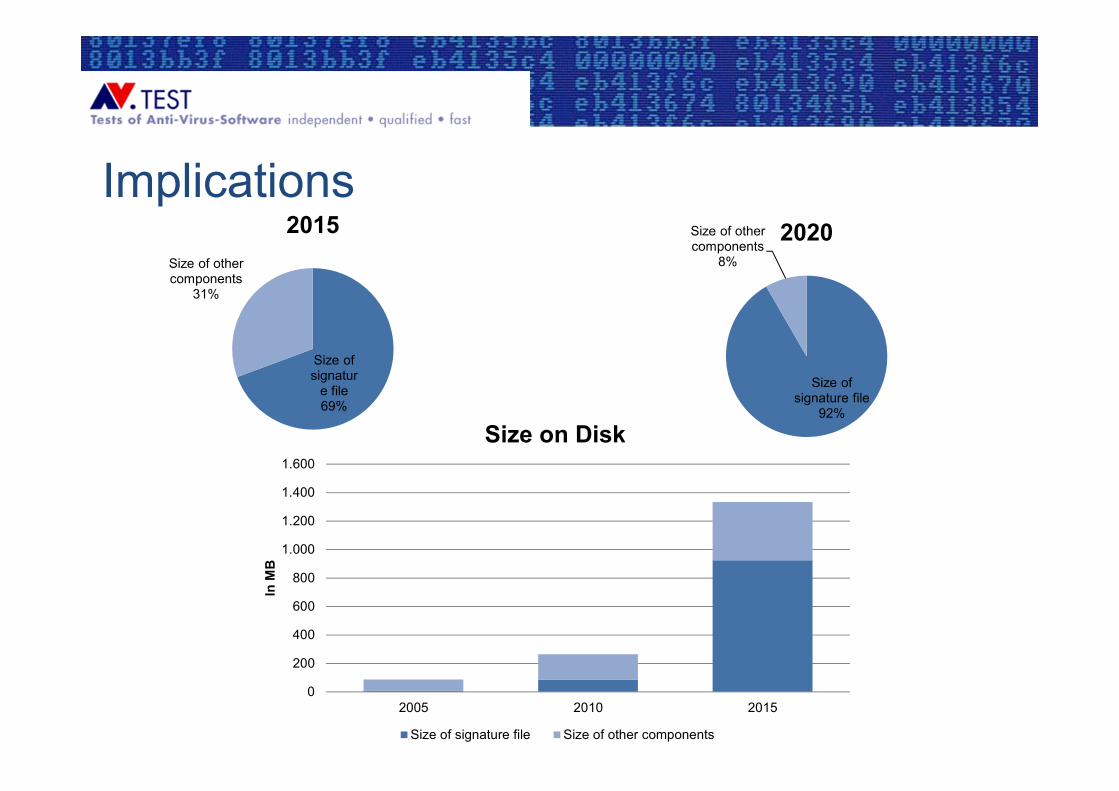
Size of signatur
e file69%
Size of other components
31%
2015
Size of signature file
92%
Size of other components
8%
2020
0
200
400
600
800
1.000
1.200
1.400
1.600
2005 2010 2015
In M
B
Size on Disk
Size of signature file Size of other components
Implications
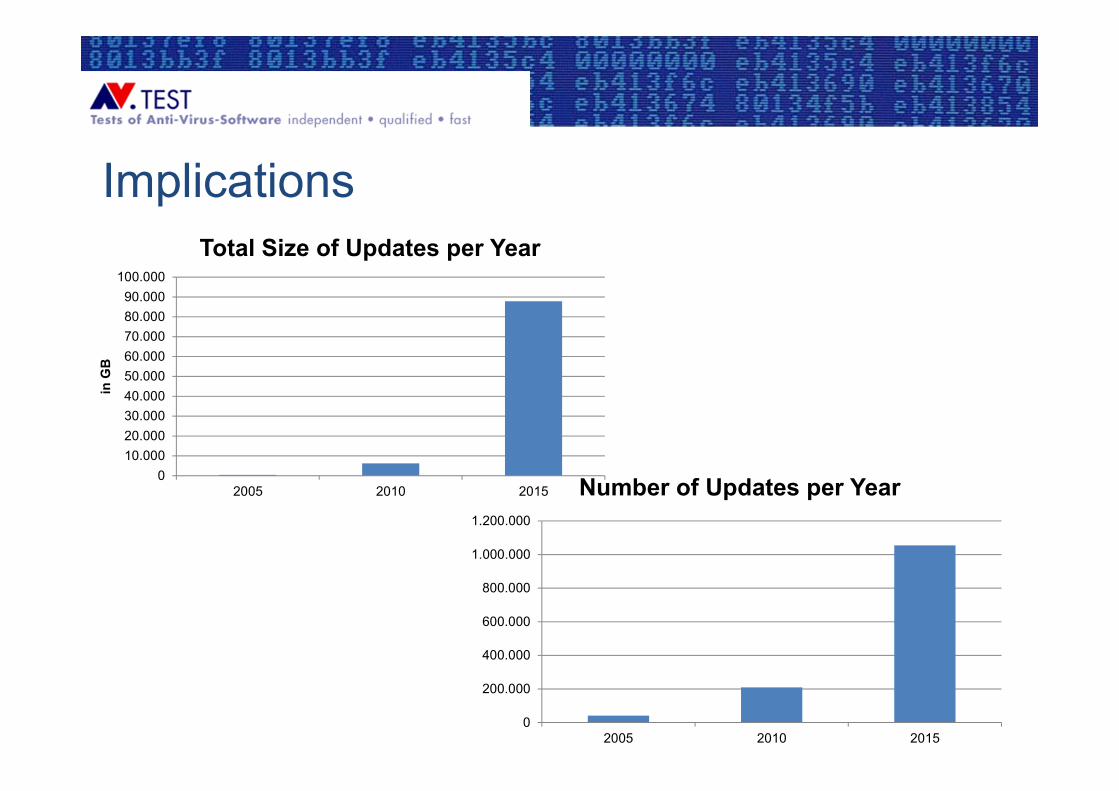
010.00020.00030.00040.00050.00060.00070.00080.00090.000
100.000
2005 2010 2015
in G
B
Total Size of Updates per Year
0
200.000
400.000
600.000
800.000
1.000.000
1.200.000
2005 2010 2015
Number of Updates per Year
Implications
• Fortunately the Anti-Malware Industry ismuch more innovative then just makingeverything bigger on the client …
• … instead they make everything bigger andmove it from the client to the cloud
• And from time to time they develop new approaches to detect malware
Implications
• What else can be concluded from thenumbers above?
• Your customers get a lot more value on 2010 than they did in 2005!
• How is that?
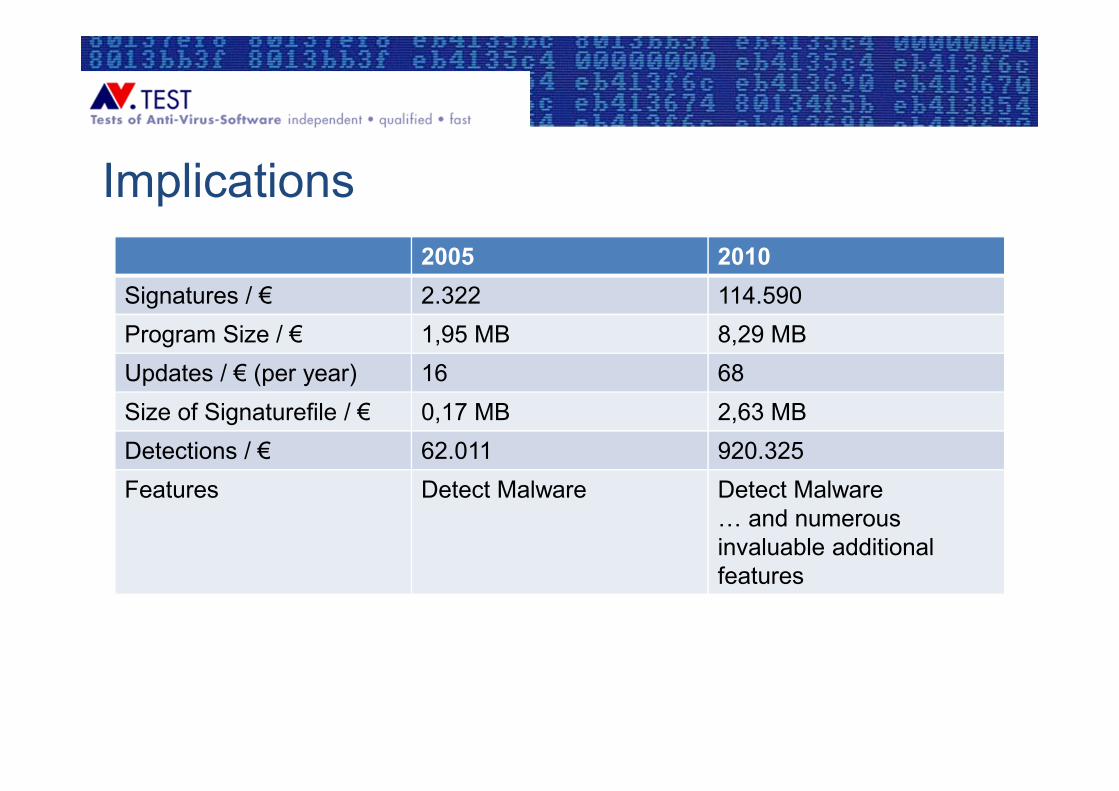
Implications2005 2010
Signatures / € 2.322 114.590Program Size / € 1,95 MB 8,29 MBUpdates / € (per year) 16 68Size of Signaturefile / € 0,17 MB 2,63 MBDetections / € 62.011 920.325Features Detect Malware Detect Malware
… and numerousinvaluable additional features
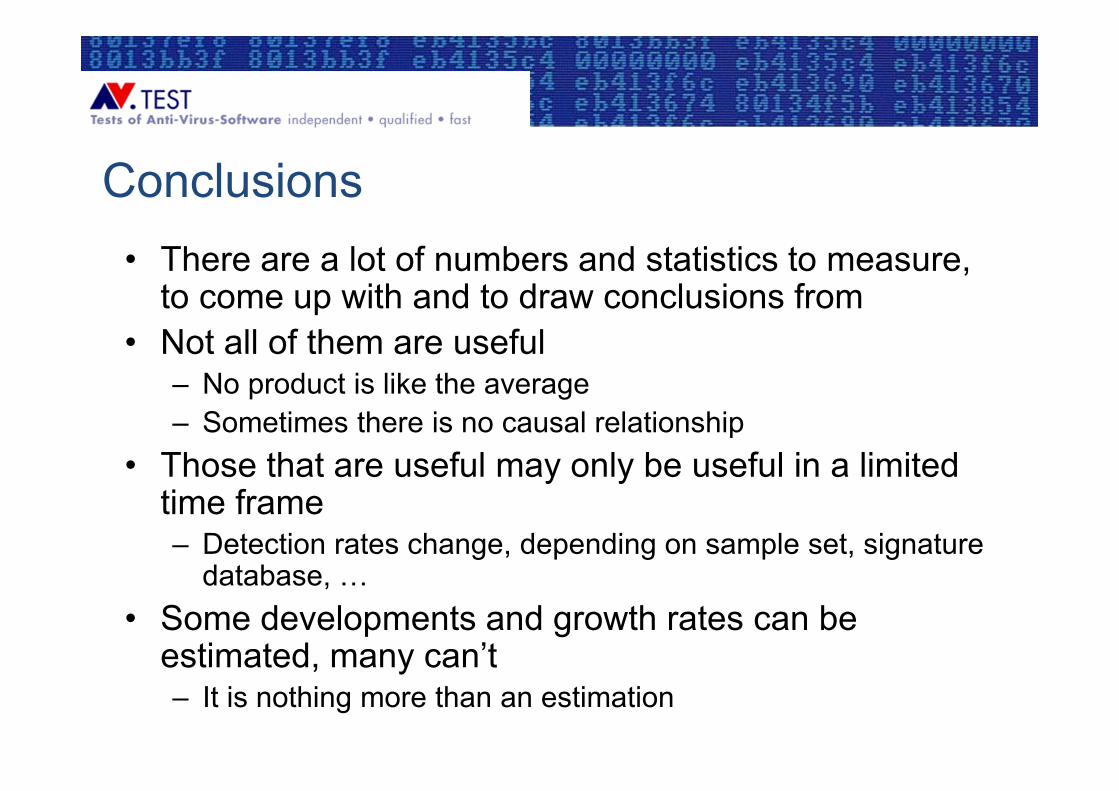
Conclusions• There are a lot of numbers and statistics to measure,
to come up with and to draw conclusions from• Not all of them are useful
– No product is like the average– Sometimes there is no causal relationship
• Those that are useful may only be useful in a limited time frame– Detection rates change, depending on sample set, signature
database, …• Some developments and growth rates can be
estimated, many can’t– It is nothing more than an estimation
Q&A
Thank you very much for your attention!
Questions?