Embed Size (px)
Citation preview
http://www.cmu.edu/planning/
Carnegie Mellon Factbook 2005
World Wide Web location:
Volume 19
University PlanningCarnegie Mellon University
February 2005

blah
ii.

Campus Community,
The Carnegie Mellon Factbook is a compilation of commonly requested data andstatistical information about Carnegie Mellon. It includes information about such things as students, alumni, faculty and staff. You can use The Factbook to find information on admissions enrollment, teaching, research, and University finances and facilities. The Factbook also provides some useful comparative data from other universities. The data presented in the tables and graphs are from internal sources except where noted.The terms used are defined in the Appendix.
The Carnegie Mellon Factbook is produced annually for use by members of the campus community and is intended primarily as an internal document. We encourage youto bookmark this document and use it as a reference. This publication is availableon the University Planning website at http://www.cmu.edu/planning.
We in University Planning want this book to be a reliable source of accurate anduseful information. Your suggestions and comments on the contents, format andusefulness of The Factbook will help with the continual improvement of this informationaltool. Please call University Planning at 412-268-2042 or send an e-mail to [email protected] if you have questions or suggestions for improving the report.
University Planning
iii.

blah
iv.

Acknowledgments
University Planning is grateful to individuals from the followingdepartments for providing information for the 2005 Factbook:
Computing ServicesDean's Office - Carnegie Institute of TechnologyDean's Office - College of Fine ArtsDean's Office - College of Humanities and Social ScienceDean's Office - Tepper School of BusinessDean's Office - H. John Heinz III School of Public Policy and ManagementDean's Office - Mellon College of ScienceDean's Office - School of Computer ScienceDirector's Office - Software Engineering InstituteEberly Center for Teaching ExcellenceEnrollment Services AdministrationFacilities Management ServicesFinancial Systems TeamOffice of the ProvostParking ServicesProperty AccountingReporting & TaxationResidential HousingTreasurer's OfficeUniversity LibrariesUniversity AdvancementVice Provost & CTO Office
v.

blah
vi.

TABLE OF CONTENTS
HISTORY, MISSION, ORGANIZATIONAbout Carnegie Mellon University 1.3The Colleges 1.4University Vision, Mission & Goals 1.5Degree Programs by College & Department, Fall Semester 2004 1.7Research Centers, Fall Semester 2004 1.10University Professors 1.12Endowed Professorships by College, as of Fall 2004 1.13Accreditations by College & Department, Fall Semester 2004 1.16
STUDENTSFreshman Applicant Activity, Fall Semesters 2000 to 2004 2.3Freshmen Average SAT Scores, Fall Semesters 2000 to 2004 2.4Top Fifteen Competing Schools, Entering Freshmen, Fall 2000 to 2004 2.5Enrolled First Time Freshmen by Region & State of Permanent Residence, Fall Semester 2004 2.6Undergraduate Headcount Enrollment by Region & State of Permanent Residence, Fall Semester 2004 2.7Headcount Enrollment by Continent & Country of Citizenship, Fall Semester 2004 2.8Headcount Enrollment by Primary Department, Level & Status, Fall Semester 2004 2.10Headcount Enrollment by Primary Department, Level & Gender, Fall Semester 2004 2.11Headcount Enrollment by Primary Department & Class, Fall Semester 2004 2.12FTE Enrollment by Primary Department & Class, Fall Semester 2004 2.13Headcount & FTE Enrollment by College, Level & Status, Fall Semesters 1999 to 2004 2.14Undergraduate Headcount Enrollment by Department, Race & Gender, Fall Semester 2004 2.16Masters Headcount Enrollment by Department, Race & Gender, Fall Semester 2004 2.18Doctoral Headcount Enrollment by Department, Race & Gender, Fall Semester 2004 2.20Headcount Enrollment by Department, Race & Gender, Fall Semester 2004 2.22Undergraduate Headcount Enrollment by Department, Race & Status, Fall Semester 2004 2.24Masters Headcount Enrollment by Department, Race & Status, Fall Semester 2004 2.26Doctoral Headcount Enrollment by Department, Race & Status, Fall Semester 2004 2.28Headcount Enrollment by Department, Race & Status, Fall Semester 2004 2.30Undergraduate Second Major Headcount Enrollment by Second Major Department, Race & Gender, 2.32 Fall Semester 2004Undergraduate Headcount Enrollment by Second Major Department, Fall Semesters 2000 to 2004 2.34Distribution of Students By Housing Type, Level & Gender, Fall Semester 2004 2.35Overall Attrition & Graduation Rates, Fall Semester 2004 2.36Total Degrees Granted by Department & Level, Academic Year 2003-2004 2.37Total Degrees Granted by College & Level, Academic Years 1999-2000 to 2003-2004 2.38Total Degrees Granted by Level, Race & Gender, Academic Year 2003-2004 2.39
TEACHING AND ACADEMIC SUPPORTUnits Completed by College & Level of Student, Academic Years 1999-2000 to 2003-2004 3.3Units Completed by Department & Level, Fall Semester 2003, Spring Semester 2004, Fall Semester 2004 3.4Computing Services Statistics, Fiscal Years 2000 to 2004 3.6Library Collections & Utilization, Fiscal Years 2000 to 2004 3.7Video Viewing Cluster, Fall 2000 to Fall 2004 3.9Instructional Technology Statistics, Fiscal Years 2000 to 2004 3.10Teaching & Academic Support, Additional Facts & Figures 3.11Eberly Center for Teaching Excellence 3.12
vii.

blah
viii.

TABLE OF CONTENTS (CONT.)
FACULTY AND STAFFIntroduction 4.3Full Time Employee Headcount Trends by Job Category, Fall Semesters 1998 to 2004 4.4Full Time Employee Headcount Trends by Home Division, Fall Semesters 1998 to 2004 4.4Part Time Employee Headcount Trends by Job Category, Fall Semesters 1998 to 2004 4.5Part Time Employee Headcount Trends by Home Division, Fall Semesters 1998 to 2004 4.5Employee Headcount Trends by Home Division & Job Category, Fall Semesters 1999 to 2004 4.6Full Time Employee Headcounts by Home Division & Job Category, Fall Semester 2004 4.8Part Time Employee Headcounts by Home Division & Job Category, Fall Semester 2004 4.9Full & Part Time Faculty FTEs by Hiring Department & Job Category, Fall Semester 2004 4.10Full & Part Time Faculty Headcounts by Home Department & Job Category, Fall Semester 2004 4.12Tenured & Tenure Eligible Faculty FTEs by Hiring Department & Rank, Fall Semester 2004 4.14Tenured & Tenure Eligible Faculty Headcounts by Home Department & Rank, Fall Semester 2004 4.16Tenured & Tenure Eligible Faculty FTEs by Hiring Department & Tenure Status, Fall Semester 2004 4.18Tenured & Tenure Eligible Faculty Headcounts by Home Department & Tenure Status, Fall 2004 4.19Tenured & Tenure Eligible Faculty FTEs by Hiring Department, Fall Semesters 1998 to 2004 4.20Tenured & Tenure Eligible Faculty Headcounts by Home Department, Fall Semesters 1998 to 2004 4.21Distribution of Tenured & Tenure Eligible Faculty by Gender, Race & Age, Fall Semesters 1998 to 2004 4.22
ALUMNIActive Alumni by Region & State, As of Fall 2004 5.3Active Alumni, As of Fall 2004 5.4
FINANCESTuition & Fees, Academic Years 2000-2001 to 2004-2005 6.3Operating Revenues & Expenditures, Fiscal Years 2001 to 2004 6.4Distribution of Operating Revenue & Expenses, Fiscal Year 2004 6.5Total Sponsored Research Costs by College & Research Center, Fiscal Years 2000 to 2004 6.6Sponsored Research Costs Real Versus Nominal Growth, Fiscal Years 2000 to 2004 6.7Total Sponsored Research Costs by Agency, Fiscal Years 2000 to 2004 6.7Total Giving by Source, Nominal Dollars, Fiscal Years 2000 to 2004 6.8Voluntary Support by Source & Purpose, Fiscal Years 2000 to 2004 6.8Undergraduate Scholarships by Source, Percent of Total, Fiscal Years 2000 to 2004 6.9Undergraduate Financial Aid Resources by Source, Fiscal Years 2000 to 2004 6.9Finances, Additional Facts & Figures, Undergraduate Comparison by Benchmark Competitors, 6.10 Academic year 2004 to 2005Endowment Statistics, Fiscal Years 2000 to 2004 6.10
SPACE AND FACILITIESTotal Space in Square Footage by Major Division, College/Division & Use Category, as of June 30, 2004 7.3Total Space in Square Footage by Major Division, College/Division & Building, as of June 30, 2004 7.4Net Assignable Space by Major Use & Division, as of June 30, 2004 7.8Parking Capacity, Fiscal Year 2005 7.9Housing Capacity by Beds Available & Beds Filled, Fall Semester 2004 7.9Current Campus Map 2005 7.11
APPENDIX 8.1
ix.

blah
x.

HISTORY, MISSION, ORGANIZATION

blah
1.2

ABOUT CARNEGIE MELLON UNIVERSITY Carnegie Mellon has rapidly evolved into an internationally recognized institution with a distinctive mix ofworld-class educational and research programs in computer science, robotics, engineering, the sciences, business, public policy, fine arts and the humanities. Nearly 10,000 undergraduate and graduate students at Carnegie Mellon receive an education characterized by its focus on creating and implementing solutions to solve real problems, interdisciplinary collaboration and innovation. A small student-to-faculty ratio provides an opportunity for close interaction between students and professors. President Jared L. Cohon, university president since 1997, is leading implementation of a comprehensive strategic plan that aims to leverage the university’s existing strengths to benefit society in the areas of biotechnology, information and security technology, environmental science and practices, the fine arts and humanities. The university also is committed to broadening and enhancing undergraduate education to allow students to explore various disciplines while maintaining a core focus in their primary area of study. Realizing that today’s graduates must understand international issues, Carnegie Mellon is committed to providing a global education for its students and is striving to expand its international offerings to increase its presence on a global scale. Increasing diversity in all aspects and fostering the economic development of southwestern Pennsylvania are also top priorities. Carnegie Mellon’s schools and specialty programs in computer science, engineering, business, public policy, science, the arts and the humanities are consistently ranked among the best in the country by national publications such as U.S. News & World Report Magazine, Business Week Magazine and The Wall Street Journal. Carnegie Mellon’s unique mix of strengths in technology, business, public policy and the arts is distinctive among national research universities. The university’s conservatory-like programs in the fine arts are highly regarded. Its Drama School has produced many well-known, award-winning stars of stage and screen since it granted the first degree in drama in 1917. The university consists of seven colleges and schools: The Carnegie Institute of Technology (engineering), the College of Fine Arts, the College of Humanities and Social Sciences, the Mellon College of Science, the Tepper School of Business, the School of Computer Science and the H. John Heinz III School of Public Policy and Management. In addition to the Pittsburgh campus, Carnegie Mellon also has campuses in California and the Persian Gulf nation of Qatar and is expanding its international presence in Europe and Asia with master’s programs and other educational partnerships. Carnegie Mellon is one of the most technologically sophisticated campuses in the world. When it introduced its “Andrew” computing network in the mid-1980s, it pioneered educational applications of technology. Today, the university employs a university-wide wireless computing network that allows faculty, staff and students to log on to the Internet and communicate via email from anywhere at any time. Carnegie Mellon was ranked as the nation’s “most wired” university by Yahoo! Internet Life Magazine. Industrialist and philanthropist Andrew Carnegie founded the Carnegie Technical Schools in 1900 for the sons and daughters of Pittsburgh blue-collar workers. The institution became the degree-granting Carnegie Institute of Technology in 1912 and in 1967, Carnegie Tech merged with Mellon Institute of Research to become Carnegie Mellon University. The core values that Carnegie instilled in the Carnegie Technical Schools more than 100 years ago -- problem solving, collaboration and innovation -- continue to drive the university today and will play a key role in setting its agenda for the next several decades. For more information, please visit www.cmu.edu
1.3

THE COLLEGES
The College of Engineering (CIT) is one of the foremost engineering schools in the United States. Because of its emphasis oninterdisciplinary research and partnerships with industry, the college produces graduates who are able to transfer their fundamental engineering knowledge into industrial practice. Faculty bring their knowledge of real-world industrial problems into the classrooms and laboratories. The college includes seven departments: Biomedical Engineering, Chemical Engineering, Civil and Environmental Engineering, Electrical and Computer Engineering, Engineering and Public Policy, Mechanical Engineering, and Materials Science and Engineering. URL: http://www.cit.cmu.edu/
The College of Fine Arts (CFA), founded in 1905, was the first comprehensive arts learning institution in the United States.Today, the college is a federation of schools with professional training programs in the visual and performing arts (Architecture, Art, Design, Drama and Music) in which the conservatory approach to education is enriched by the university setting. The collegeshares numerous research projects, interdisciplinary centers and educational programs with other units across the university.URL: http://www.cmu.edu/cfa/
The H. John Heinz III School of Public Policy and Management (Heinz) offers master's degrees in Public Policy and Management, Health Care Policy and Management, Public Management, Arts Management, Information Security Policy and Management, and Educational Technology Management. The school is a partner in the University-wide Master of Information Systems Management and Master of Science in Information Technology programs. It also offers a Ph.D. degree in Public Policy Analysis and a range of executive and mid-career short course and certification programs. Through its master's and doctoral programs, the Heinz School trains students to serve the public interest within the public, not-for-profit, interface and private sectors. URL: http://www.heinz.cmu.edu/
The College of Humanities and Social Sciences (H&SS) emphasizes in its research and teaching, the behaviors, institutions and beliefs that constitute the human experience. The college is committed to a balance among humanistic, scientific, and professional orientations in undergraduate education, along with an emphasis on basic modes of inquiry and on integrating research experience into the undergraduate training process. Its departments include Economics, English, History, Modern Languages, Philosophy, Psychology, Social and Decision Sciences and Statistics. The college also offers an undergraduate degree program in Information Systems. URL: http://www.hss.cmu.edu/
The Mellon College of Science (MCS) strives to achieve excellence within a set of carefully chosen areas of concentration, maximizing interdisciplinary contacts between and among the departments and centers within the college and in other colleges. MCS researchers are taking leadership roles in the university's biotechnology initiative in the areas of biosensors, proteomics, bioimaging, tissue engineering, and neurobiology. In addition there are strategic thrusts in green oxidation chemistry, bioinformatics, computational biology, nanotechnology, computational finance, and astrophysics. The college includes four departments: Biological Sciences, Chemistry, Mathematical Sciences and Physics. URL: http://www.cmu.edu/mcs/
The School of Computer Science (SCS) houses a curriculum that grounds learning in real world applications and issues. Faculty work actively with both undergraduate and graduate students, providing valuable hands-on teaching and research experience. Lecture series and conferences round out the students' educational experience, and provide a variety of forums to expose studentsto the widest spectrum of information. Carnegie Mellon University helped define, and continually redefines, the field of Computer Science. Through its diverse interdisciplinary research activities and breadth of educational programs, SCS leads the world in stretching the field by extending into areas beyond the traditional boundaries of computer science. SCS is recognized internationally for producing first-rate researchers, academic colleagues, and industry leaders in the computing profession. URL: http://www.cs.cmu.edu/
The Software Engineering Institute (SEI) is a federally funded research and development center that helps others improve their software engineering capabilities including network security. To help improve the state of the practice of software engineering, the SEI - works with the research community to help create and identify new and improved practices - works with leading-edge software developers and acquirers to apply and validate the new and improved practices - works through the global community of software engineers to amplify the impact of the new and improved practices by encouraging and supporting their widespread adoptionURL: http://www.sei.cmu.edu/
The Tepper School of Business (Tepper) offers undergraduate programs in Business Administration and Economics. The Tepper School offers Masters Degrees in Business Administration (MBA) and joint degrees in Computational Finance (MSCF) with the College of Humanities and Social Sciences, and the Mellon College of Science and School of Computer Science. In addition, joint degrees are offered with Civil and Environmental Engineering. The Tepper School offers doctoral degrees in several areas and presents a number of executive education programs. Until 2004, the Tepper School was named the Graduate School of Industrial Administration (GSIA). URL: http://www.gsia.cmu.edu/
1.4

CARNEGIE MELLON UNIVERSITY
VISION
Carnegie Mellon will be a leader among educational institutions by building on its distinctive core valuesof innovation and interdisciplinary collaboration to solve problems and make new discoveries to benefitsociety.
MISSION STATEMENT
To create and disseminate knowledge and art through research and artistic expression, teaching andlearning; and to transfer intellectual products to society.
To serve our students by teaching them problem-solving, leadership and teamwork skills, and the valueof a commitment to quality, ethical behavior, society and respect for one another.
To pursue the advantages provided by a diverse and relatively small university community, open to theexchange of ideas, where discovery, artistic creativity, and personal and professional development canflourish.
GOALS
EducationBuild upon, broaden and enhance our educational programs through international, multidisciplinary andcommunity-based initiatives to allow students to explore various fields while maintaining depth in theirprimary area of study. Our students will become broadly educated, humane leaders who will have animportant impact in their professions and communities.
Strategic Areas of LeadershipThe university has identified areas of focus in which its existing strengths and collaborative,problem-solving culture can positively impact the world. These areas of comparative advantage are: -biotechnology and the life sciences -environmental sciences and practices -information and security technology -the arts and humanities -business and public policy
International InitiativesSelectively and strategically expand our international impact by leveraging university strengths toestablish international partnerships to compete effectively on a global basis for research and educationalopportunities, academic talent and financial resources, and to provide a global education for students.
Community SuccessProvide a rewarding, welcoming and diverse environment that enables our students, faculty, staff andalumni to achieve professional success while helping to advance the university mission.
1.5

blah
1.6

DEGREE PROGRAMS BY COLLEGE & DEPARTMENTFALL SEMESTER 2004
CARNEGIE INSTITUTE OF TECHNOLOGY
Biomedical Engineering Engineering and Public PolicyBioengineering with CIT M.S., Ph.D. Engineering Major & EPP B.S., M.S.Bioengineering M.S., Ph.D. Engineering and Public Policy M.S., Ph.D.Engineering Major & B.S. Biomedical Engineering Electrical and Computer Engineering
Electrical and Computer Engineering B.S., M.S., Ph.D.Chemical Engineering Information Networking Institute
Chemical Engineering B.S., M.S., Ph.D. Information Networking M.S.Colloids, Polymers, & Surfaces M.S. (joint with Heinz, SCS & Tepper) (Interdisciplinary w/ MCS)
Mechanical EngineeringCivil and Environmental Engineering Mechanical Engineering B.S., M.E., M.S., Ph.D.
Civil and Environmental Engineering M.S., Ph.D.Civil Engineering B.S. Materials Science and Engineering
Material Science and Engineering B.S., M.E., M.S., Ph.D.
COLLEGE OF HUMANITIES AND SOCIAL SCIENCES
Economics PhilosophyEconomics B.A., B.S. Philosophy B.A., M.A.Managerial Economics B.S. Logic & Computation B.S., M.S.
Logic, Computation & Methodology Ph.D.English (joint with Math and CS)
English B.A., M.A.Creative Writing B.A. PsychologyProfessional Writing B.A., M.A. Psychology B.A., B.S.Technical Writing B.S. Cognitive Science B.S.Technical Writing & B.S. Psychology and Biological Sciences B.S. Communications (joint with MCS)Rhetoric M.A., Ph.D. Psychology Ph.D.Literary & Cultural Studies M.A., Ph.D. Psychology and Behavioral Decision Ph.D.Communication Information Design M.CID Research (joint with Social & (joint with Design) Decision Sciences)
History Social and Decision SciencesAnthropology and History B.A., B.S. Decision Science B.S.History and Policy B.A., B.S., M.S., Ph.D. Policy & Management B.S.Social and Cultural History B.A., B.S. Political Science B.S.History M.A., Ph.D. Political Economy Ph.D.
Behavioral Decision Research Ph.D.H&SS Program in Information Systems Organization Science Ph.D.
Information Systems B.S. Social & Decision Sciences Ph.D.Firm Strategy, Entrepreneurship, and Ph.D.
Modern Languages Technological ChoiceFrench B.A. Psychology and Behavioral Decision Ph.D.German B.A. Research (joint with Psychology)Japanese B.A.Spanish B.A. StatisticsModern Languages B.A. Statistics B.S., M.S., Ph.D. (w/ a concentration in English Statistics & Public Policy Ph.D. as a Second Language) (joint with Heinz)Computer-Assisted Language M.S. Learning (joint with LTI) Interdepartmental MajorsSecond Language Acquisition M.A., Ph.D. Environmental Policy B.S.
Ethics, History, and Public Policy B.A., B.S.European Studies B.A.International Relations B.A.Russian Studies B.A.
Student Defined B.A., B.S.
1.7

DEGREE PROGRAMS BY COLLEGE & DEPARTMENTFALL SEMESTER 2004(CONT.)
COLLEGE OF FINE ARTS
Architecture DramaArchitecture B.Arch., M.S., Ph.D. Drama B.F.A.Bldg. Performance and Diagnostics M.S. Costume Design M.F.A.Computational Design M.S. Scene Design M.F.A.Urban Design M.U.D. Lighting Design M.F.A.Sustainable Design M.S. Costume & Lighting Design M.F.A.Architecture-Engineering M.S. Costume & Scene Design M.F.A. Construction Management Scene & Lighting Design M.F.A.
Dramatic Writing M.F.A.Art Directing M.F.A.
Art B.F.A., M.F.A Production Technology & Mgmt. M.F.A.
Design MusicIndustrial Design B.F.A. Music (Composition) B.F.A., M.M.U.Communication Design B.F.A Music Performance B.F.A., M.M.U.Communication Planning & M.Des Music Conducting M.M.U. Information Design (w/ English) Music Education M.M.U.Interaction Design M.DesDesign Ph.D. Master of Arts Mgmt. M.A.M.
(joint with Heinz)
MELLON COLLEGE OF SCIENCE
Biological Sciences MathematicsBiological Sciences B.S., M.S., Ph.D. Mathematical Sciences M.S., D.A., Ph.D.Computational Biology B.S., M.S. Mathematics B.S.Biological Sciences & Humanities or B.A. Mathematical Sciences concentrations in: Social Science (double major) Discrete Mathematics & Logic B.S.Biological Sciences & Psychology B.S. Computational & Applied Math. B.S.Biological Sciences/Biochemistry Ph.D. Operations Research B.S. (w/ Chemistry & Physics) Statistics B.S.Biological Sciences/Biophysics Ph.D. Mathematical Finance Ph.D. (w/ Chemistry & Physics) Computational Finance B.S., M.S.Biological Sciences/Biochemistry & Ph.D. Algorithms, Combinatorics & Ph.D. Biophysics (w/ Chemistry & Physics) Optimization
Pure & Applied Logic Ph.D.
Chemistry PhysicsChemistry B.A., B.S., M.S., Ph.D. Physics B.A., B.S., M.S., Ph.D.Chemistry B.S. with B.S. tracks available in: (w/ concentration in Comp. Chem.) AstrophysicsPolymer Science M.S. Biological PhysicsColloids, Polymers, & Surfaces M.S. Chemical Physics (w/ Chemical Eng.) Computational PhysicsChemistry/Biochemistry Ph.D. Applied Physics (w/ Biology & Physics) Physics/Biochemistry Ph.D.Chemistry/Biophysics Ph.D. (w/ Biology & Chemistry) (w/ Biology & Physics) Physics/Biophysics Ph.D.Chemistry/Biochemistry & Ph.D. (w/ Biology & Chemistry) Biophysics (w/ Biology & Physics) Physics/Biochemistry & Biophysics Ph.D.
(w/ Biology & Chemistry)Applied Physics Ph.D.
1.8

DEGREE PROGRAMS BY COLLEGE AND DEPARTMENTFALL SEMESTER 2004(CONT.)
TEPPER SCHOOL OF BUSINESS
Business Administration B.S., M.B.A. Accounting Ph.D.Industrial Administration, minor in Public Ph.D. Algorithms, Combinatorics & Ph.D.Industrial Administration, minor in Public M.S. Optimization (joint with CS & Math) Policy & Management (w/ Heinz) Economics Ph.D.Civil Engineering & Management (w/ CIT) M.S. Finance Ph.D.Computational Finance M.S. Information Systems Ph.D. (joint with HSS, MCS and SCS) Management of Manufacturing & Ph.D.Environmental Engineering & Mgmt. M.S. Automation (w/ Robotics Institute) (joint with CIT) Production and Operations Management Ph.D.Software Engineering and Business M.S. Finance & Mathematics (joint with MCS) Ph.D. Mgmt. (joint with SCS) Marketing Ph.D.Strategy, Entrepreneurship and M.S., Ph.D. Operations Research Ph.D. Technological Change Organizational Behavior and Theory Ph.D. (joint w/ HSS, Heinz and EPP) Politics and Political Economy Ph.D.
H. JOHN HEINZ III SCHOOL OF PUBLIC POLICY AND MANAGEMENT
Public Policy & Management M.S.P.P.M. Master of Entertainment Industry Mgmt. M.E.I.M.Public Policy & Management, minor & dual M.S.P.P.M. (joint with CFA) in Business Admin. (joint with Tepper) Master of Arts Management M.A.M.Public Policy & Management M.S./J.D. (joint with CFA) (dual degree with Univ. of Pittsburgh Master of Public Management M.P.M. Law School) Master of Medical Management M.M.M.Health Care Policy and Management M.S.H.C.P.M. Educational Technology Management M.S.E.T.M.Health Care Policy and Management, M.S.H.C.P.M. Public Policy & Management Ph.D.dual Business Admin. (joint with Tepper) Statistics & Public Policy Ph.D.Information Security Policy and Mgmt. M.S.I.S.P.M.
SCHOOL OF COMPUTER SCIENCE
Computer Science B.S., Ph.D. Human-Computer Interaction M.H.C.I., Ph.D.Computational Finance M.S. Software Engineering M.S.E., Ph.D. (joint with HSS, MCS & Tepper) (joint with SEI & ISRI)Computer Aided Language Learning M.S. Computer Science/ Neural Basis of Ph.D. (joint with LTI & Modern Languages) Cognition (CNBC)Electronic Commerce (joint with Tepper) M.S. Computational and Statistical Learning Ph.D.Information Networking M.S. Computational and Statistical Learning/ Ph.D.Knowledge Discovery & Data Mining M.S. Neural Basis of Cognition (CNBC)Language Technologies M.S. Computation, Organizations and Society Ph.D.Robotics M.S., Ph.D. Language and Information Technologies Ph.D.Robotics (joint with Univ. of Pittsburgh) M.D./Ph.D. Robotics/Neural Basis of Cognition (CNBC) Ph.D.
CARNEGIE MELLON UNIVERSITY - INTERDISCIPLINARY DEGREES
Humanities & Arts (joint with CFA and H&SS) B.H.A.Science & Arts (joint with CFA and MCS) B.S.A.Entertainment Technology (joint with CFA and SCS) M.E.T.Information Systems Management M.I.S.M. (joint with Heinz, SCS and SEI)Information Technology M.S.I.T. (joint with Heinz, SCS and SEI)Information Security Technology and Management M.S.I.S.T.M (joint with CIT, SCS, Heinz, and Tepper)Integrated Product Development M.P.D. (joint with CFA, CIT and Tepper)
1.9

RESEARCH CENTERSFALL SEMESTER 2004CARNEGIE INSTITUTE OF TECHNOLOGY
Bone Tissue Engineering Center (BTEC)Brownfields Center (TBC)The Carnegie Mellon Electricity Industry CenterCenter for Advanced Process Decision-Making (CAPD)Center for Bioimage InformaticsCenter for Circuits & System Solutions (C2S2)Center for Complex Fluids Engineering (CCFE)Center for Integrated Study of the Human Dimensions of Global ChangeCenter for Iron and Steelmaking Research (CISR)Center for Silicon System Implementation (CSSI)Center for the Study and Improvement of Regulation (CSIR)Center for Wireless and Broadband Networking (CWBN)Climate Decision Making Center (CDMC)Data Storage Systems Center (DSSC)Green Design InitiativeGovernment/University/Industry (GUIde) Consortium on the Forced Response of Bladed DisksInformation Networking Institute (INI)Institute for Complex Engineered Systems (ICES)Materials Research Science and Engineering Center (MRSEC)Steinbrenner Institute for Environmental Education and Research
COLLEGE OF FINE ARTSAdvanced Building Systems Integration Consortium (ABSIC)Center for Building Performance and Diagnostics (CBPD)Center for the Arts in Society (CAS)STUDIO for Creative Inquiry (SfCI)
H. JOHN HEINZ III SCHOOL OF PUBLIC POLICY AND MANAGEMENTCenter for Arts Management and Technology (CAMT)Center for Economic Development (CED)Institute for the Management of Creative Enterprises (IMCE)Institute for the Study of Information Technology and Society (InSITeS)National Consortium on Violence Research (NCOVR)Pittsburgh Arts and Cultural Observatory (ACO)Software Industry Center (SWIC)Sustainable Computing Consortium (SCC)
HUMANITIES AND SOCIAL SCIENCESCenter for African American Urban Studies and the Economy (CAUSE)Center for Business, Technology and the EnvironmentCenter for Cognitive Brain ImagingCenter for History and PolicyCenter for Historical Information Systems and Analysis (CHISA)Center for the Advancement of Applied Ethics (CAAE)Center for the Neural Basis of Cognition (CNBC)Child Language Data Exchange System (CHILDES)Computational Systems Biology GroupLaboratory for the Study of Stress, Immunity and DiseaseLaboratory for Symbolic and Educational ComputingModern Language Resource Center (MLRC)Pittsburgh Center for Social HistoryThe Pittsburgh Mind-Body Center (PMBC)
MELLON COLLEGE OF SCIENCECenter for Macromolecular Engineering (CME)Center for Nonlinear Analysis (CNA)Pittsburgh NMR Center for Biomedical ResearchPittsburgh Supercomputing Center (PSC)Molecular Biosensor and Imaging Center (MBIC)Center for Computational FinanceInstitute for Green Oxidation ChemistryCenter for Molecular AnalysisCenter for the Neural Basis of Cognition
1.10

RESEARCH CENTERSFALL SEMESTER 2004 (Cont.)
OFFICE OF THE PROVOSTASTM Test Monitoring CenterCenter on the Materials of the Artist and ConservatorCylabEntertainment Technology Center (ETC)Hunt Institute for Botanical DocumentationLearning Systems Architecture Lab (LSAL)Steinbrenner Institute
SCHOOL OF COMPUTER SCIENCECenter for Integrated Manufacturing Decision Systems (CIMDS)Robotics Engineering ConsortiumSustainable Computing Consortium (SCC)Field Robotics Center (FRC)Vision and Autonomous System Center (VASC)National Robotics Engineering Consortium (NREC)Medical Robotics Technology Center (MRTC)Space Robotics Initiative (SRI)Aladdin Center for Algorithm Adaptation Dissemination and Integration (Aladdin)Specification and Verification CenterPittsburgh Advanced Cognitive Tutor (PACT) CenterIT Services Qualification CenterSloan Software Industry Center (SWIC)Center for the Neural Basis of Cognition (CNBC)CASOS Center for Computational Social and Organizational Science
SOFTWARE ENGINEERING INSTITUTE (SEI)Acquisition Support Program (ASP)Dynamic Systems (DS) Integration of Software Intensive Systems (ISIS) Performance Critical Systems (PCS)Networked Systems Security (NSS) CERT® Coordination Center (CERT/CC) Network Situational Awareness (NetSA) Survivable Systems Engineering (SSE) Practices, Development and Training (PD&T) Survivable Enterprise Management (SEM)Product Line Systems (PLS) Software Architecture Technology (SAT) Predictable Assembly from Certifiable Components (PACC) Product Line Practice (PLP)Software Engineering Process Management (SEPM) Capability Maturity Model Integration (CMMI) Software Engineering Measurement and Analysis (SEMA) Team Software Process (TSP)
TEPPER SCHOOL OF BUSINESSCarnegie Bosch Institute for Applied Studies in International ManagementCenter for Analytical Research in Technology (CART)Center for Business CommunicationCenter for e-Business Innovation (eBI)Center for Financial MarketsCenter for the Interdisciplinary Study of TeamsCenter for International Corporate ResponsibilityCenter for the Management of TechnologyCenter for Organizational Learning and InnovationDonald H. Jones Center for EntrepreneurshipElectricity Industry CenterGreen Design InitiativeThe Gailliot Center for Public PolicyInstitute for Electronic CommerceInstitute for Strategic DevelopmentTeaching Innovation Center
1.11
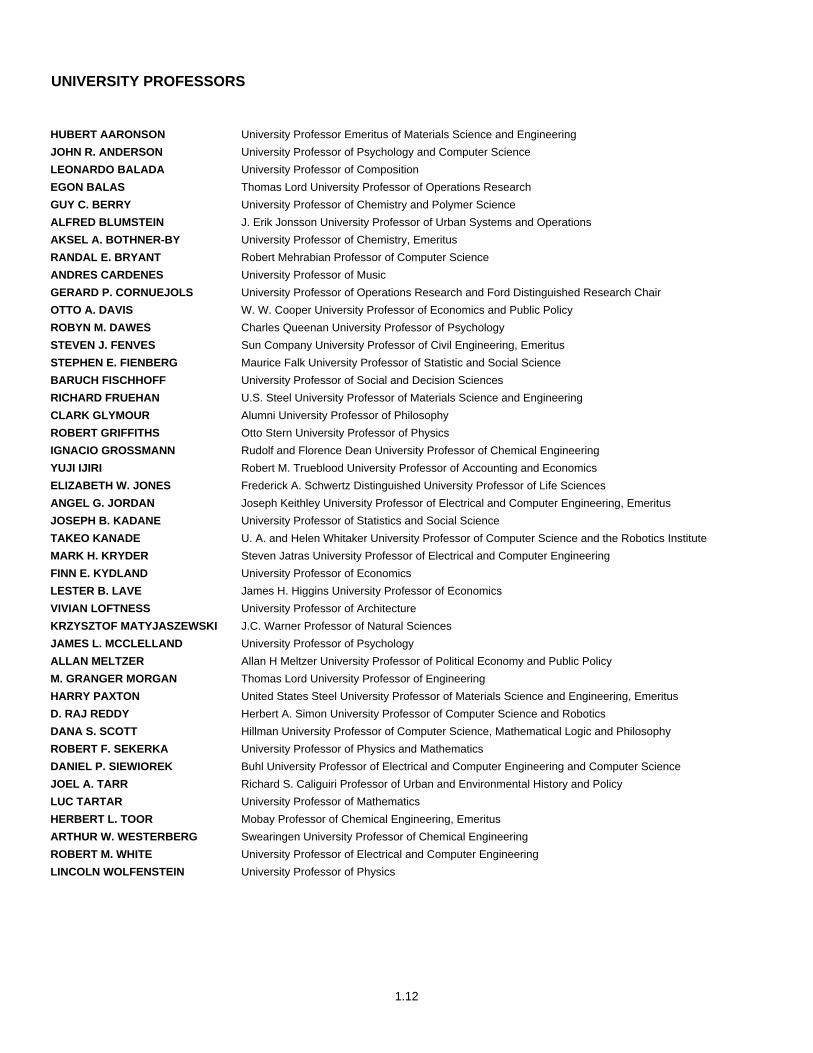
UNIVERSITY PROFESSORS
HUBERT AARONSON University Professor Emeritus of Materials Science and EngineeringJOHN R. ANDERSON University Professor of Psychology and Computer ScienceLEONARDO BALADA University Professor of CompositionEGON BALAS Thomas Lord University Professor of Operations ResearchGUY C. BERRY University Professor of Chemistry and Polymer ScienceALFRED BLUMSTEIN J. Erik Jonsson University Professor of Urban Systems and OperationsAKSEL A. BOTHNER-BY University Professor of Chemistry, EmeritusRANDAL E. BRYANT Robert Mehrabian Professor of Computer ScienceANDRES CARDENES University Professor of MusicGERARD P. CORNUEJOLS University Professor of Operations Research and Ford Distinguished Research ChairOTTO A. DAVIS W. W. Cooper University Professor of Economics and Public PolicyROBYN M. DAWES Charles Queenan University Professor of PsychologySTEVEN J. FENVES Sun Company University Professor of Civil Engineering, EmeritusSTEPHEN E. FIENBERG Maurice Falk University Professor of Statistic and Social ScienceBARUCH FISCHHOFF University Professor of Social and Decision SciencesRICHARD FRUEHAN U.S. Steel University Professor of Materials Science and EngineeringCLARK GLYMOUR Alumni University Professor of PhilosophyROBERT GRIFFITHS Otto Stern University Professor of PhysicsIGNACIO GROSSMANN Rudolf and Florence Dean University Professor of Chemical EngineeringYUJI IJIRI Robert M. Trueblood University Professor of Accounting and EconomicsELIZABETH W. JONES Frederick A. Schwertz Distinguished University Professor of Life SciencesANGEL G. JORDAN Joseph Keithley University Professor of Electrical and Computer Engineering, EmeritusJOSEPH B. KADANE University Professor of Statistics and Social ScienceTAKEO KANADE U. A. and Helen Whitaker University Professor of Computer Science and the Robotics InstituteMARK H. KRYDER Steven Jatras University Professor of Electrical and Computer EngineeringFINN E. KYDLAND University Professor of EconomicsLESTER B. LAVE James H. Higgins University Professor of EconomicsVIVIAN LOFTNESS University Professor of ArchitectureKRZYSZTOF MATYJASZEWSKI J.C. Warner Professor of Natural SciencesJAMES L. MCCLELLAND University Professor of PsychologyALLAN MELTZER Allan H Meltzer University Professor of Political Economy and Public PolicyM. GRANGER MORGAN Thomas Lord University Professor of EngineeringHARRY PAXTON United States Steel University Professor of Materials Science and Engineering, EmeritusD. RAJ REDDY Herbert A. Simon University Professor of Computer Science and RoboticsDANA S. SCOTT Hillman University Professor of Computer Science, Mathematical Logic and PhilosophyROBERT F. SEKERKA University Professor of Physics and MathematicsDANIEL P. SIEWIOREK Buhl University Professor of Electrical and Computer Engineering and Computer ScienceJOEL A. TARR Richard S. Caliguiri Professor of Urban and Environmental History and PolicyLUC TARTAR University Professor of MathematicsHERBERT L. TOOR Mobay Professor of Chemical Engineering, EmeritusARTHUR W. WESTERBERG Swearingen University Professor of Chemical EngineeringROBERT M. WHITE University Professor of Electrical and Computer EngineeringLINCOLN WOLFENSTEIN University Professor of Physics
1.12
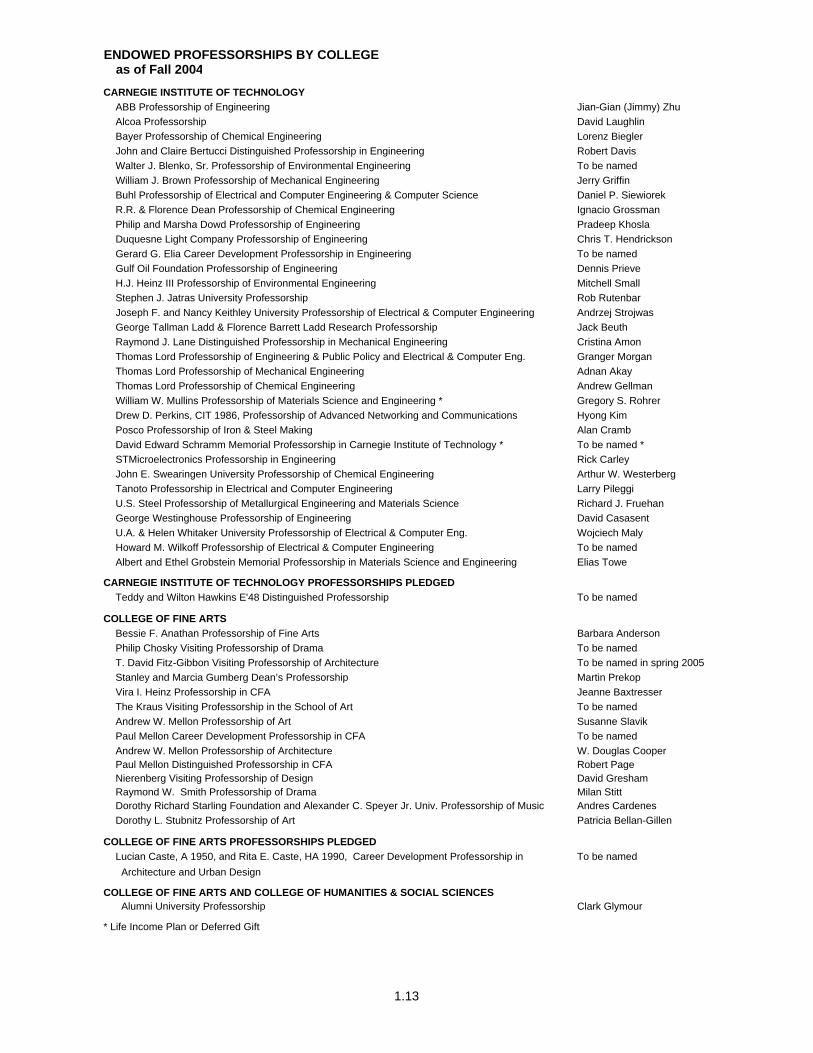
ENDOWED PROFESSORSHIPS BY COLLEGEas of Fall 2004
CARNEGIE INSTITUTE OF TECHNOLOGYABB Professorship of Engineering Jian-Gian (Jimmy) ZhuAlcoa Professorship David LaughlinBayer Professorship of Chemical Engineering Lorenz BieglerJohn and Claire Bertucci Distinguished Professorship in Engineering Robert DavisWalter J. Blenko, Sr. Professorship of Environmental Engineering To be namedWilliam J. Brown Professorship of Mechanical Engineering Jerry GriffinBuhl Professorship of Electrical and Computer Engineering & Computer Science Daniel P. SiewiorekR.R. & Florence Dean Professorship of Chemical Engineering Ignacio GrossmanPhilip and Marsha Dowd Professorship of Engineering Pradeep KhoslaDuquesne Light Company Professorship of Engineering Chris T. HendricksonGerard G. Elia Career Development Professorship in Engineering To be namedGulf Oil Foundation Professorship of Engineering Dennis PrieveH.J. Heinz III Professorship of Environmental Engineering Mitchell SmallStephen J. Jatras University Professorship Rob RutenbarJoseph F. and Nancy Keithley University Professorship of Electrical & Computer Engineering Andrzej StrojwasGeorge Tallman Ladd & Florence Barrett Ladd Research Professorship Jack BeuthRaymond J. Lane Distinguished Professorship in Mechanical Engineering Cristina AmonThomas Lord Professorship of Engineering & Public Policy and Electrical & Computer Eng. Granger MorganThomas Lord Professorship of Mechanical Engineering Adnan AkayThomas Lord Professorship of Chemical Engineering Andrew GellmanWilliam W. Mullins Professorship of Materials Science and Engineering * Gregory S. RohrerDrew D. Perkins, CIT 1986, Professorship of Advanced Networking and Communications Hyong KimPosco Professorship of Iron & Steel Making Alan CrambDavid Edward Schramm Memorial Professorship in Carnegie Institute of Technology * To be named *STMicroelectronics Professorship in Engineering Rick CarleyJohn E. Swearingen University Professorship of Chemical Engineering Arthur W. WesterbergTanoto Professorship in Electrical and Computer Engineering Larry PileggiU.S. Steel Professorship of Metallurgical Engineering and Materials Science Richard J. FruehanGeorge Westinghouse Professorship of Engineering David CasasentU.A. & Helen Whitaker University Professorship of Electrical & Computer Eng. Wojciech MalyHoward M. Wilkoff Professorship of Electrical & Computer Engineering To be namedAlbert and Ethel Grobstein Memorial Professorship in Materials Science and Engineering Elias Towe
CARNEGIE INSTITUTE OF TECHNOLOGY PROFESSORSHIPS PLEDGEDTeddy and Wilton Hawkins E'48 Distinguished Professorship To be named
COLLEGE OF FINE ARTSBessie F. Anathan Professorship of Fine Arts Barbara AndersonPhilip Chosky Visiting Professorship of Drama To be namedT. David Fitz-Gibbon Visiting Professorship of Architecture To be named in spring 2005Stanley and Marcia Gumberg Dean’s Professorship Martin PrekopVira I. Heinz Professorship in CFA Jeanne BaxtresserThe Kraus Visiting Professorship in the School of Art To be namedAndrew W. Mellon Professorship of Art Susanne SlavikPaul Mellon Career Development Professorship in CFA To be namedAndrew W. Mellon Professorship of Architecture W. Douglas CooperPaul Mellon Distinguished Professorship in CFA Robert PageNierenberg Visiting Professorship of Design David GreshamRaymond W. Smith Professorship of Drama Milan StittDorothy Richard Starling Foundation and Alexander C. Speyer Jr. Univ. Professorship of Music Andres CardenesDorothy L. Stubnitz Professorship of Art Patricia Bellan-Gillen
COLLEGE OF FINE ARTS PROFESSORSHIPS PLEDGEDLucian Caste, A 1950, and Rita E. Caste, HA 1990, Career Development Professorship in To be named Architecture and Urban Design
COLLEGE OF FINE ARTS AND COLLEGE OF HUMANITIES & SOCIAL SCIENCES Alumni University Professorship Clark Glymour
* Life Income Plan or Deferred Gift
1.13

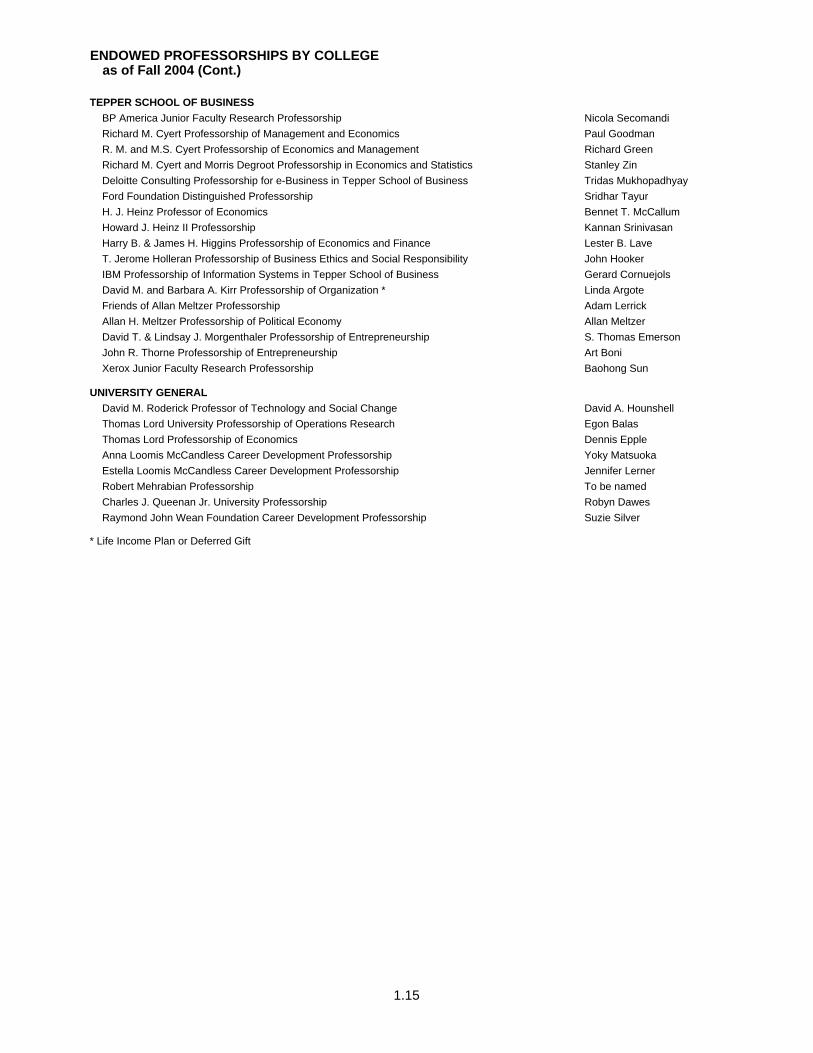
ENDOWED PROFESSORSHIPS BY COLLEGEas of Fall 2004 (Cont.)
H. JOHN HEINZ III SCHOOL OF PUBLIC POLICY AND MANAGEMENTEugene Barone Professorship of Health Systems Management Martin GaynorWilliam W. and Ruth F. Cooper Professorship Ramayya KrishnanH. J. Heinz II Professorship Denise RousseauTeresa and H. John Heinz III Professorship Daniel NaginH. J. Heinz III Professorship of Regional Economic Development To be namedH. J. Heinz III Heinz School Deanship To be namedJ. Erik Jonsson Professorship of Urban Systems & Operations Research Alfred BlumsteinJames M. Walton Professorship of Economics Linda Babcock
HUMANITIES AND SOCIAL SCIENCESThomas Stockham Baker Professorship of Literature and Rhetoric Jim DanielsWilliam W. Cooper University Professorship Otto A. DavisMaurice Falk Professorship of Statistics and Social Sciences Stephen E. FienbergHoward Heinz University Professorship of the Humanities & Social Sciences Baruch FischoffTeresa Heinz Professorship of Cognitive Psychology Robert SieglerThomas Lord Professorship of Statistics John LehoczkyPaul Mellon Career Development Professorship in H&SS To be namedR. K. Mellon University Professorship of Psychology and Computer Science John R. AndersonPaul Mellon Distinguished Professorship in Humanities and Social Sciences Paul HopperHerbert A. Simon Professorship of Philosophy Teddy SeidenfeldJohn C. Warner Distinguished Professorship in Psychology * To be named *
HUMANITIES AND SOCIAL SCIENCES PROFESSORSHIPS PLEDGEDGiant Eagle Professorship in Humanities and Social Sciences To be named
MELLON COLLEGE OF SCIENCEBuhl Professorship of Theoretical Physics Frederick J. GilmanMaxwell H. Connan Professorship * To be named *Eberly Family Career Development Professorship of Biological Science Gordon RuleJames Greenberg Professorship * To be named *Orion Hoch S’52 Professorship David HeathThomas Lord Professorship of Chemistry Terrence CollinsDr. Frederick A. Schwertz Distinguished Professorship of Life Sciences Elizabeth JonesOtto Stern Professorship of Physics Robert B. GriffithsJohn C. Warner Professorship of Chemistry Krzysztof Matyjaszewski
SCHOOL OF COMPUTER SCIENCECarnegie Group Professorship in Computer Science Mahadev SatyanarayananFinmeccanica Career Development Professorship of Computer Science Srinivisan SeshanFORE Systems Professorship Edmund Clarke, Jr.Fredkin Professorship of Artificial Intelligence Tom MitchellEdward Fredkin Research Professorship William L. WhittakerA. Nico Habermann Professorship of Computer Science James D. HerbslebHillman Professorship of Computer Science Sara KieslerHerbert A. Simon University Professorship of Computer Science & Robotics Raj ReddyAlumni Research Professorship of Computer Science Howard WactlarPresident's Professorship of Computer Science Jeannette M. WingHerbert A. Simon Professorship of Computer Science Robert E. KrautDr. Bruce J. Nelson Professorship in Computer Science Manuel BlumAllen Newell Professorship of Computer Science Jaime G. CarbonellAlan J. Perlis Professorship of Computer Science Mary ShawU.A. & Helen Whitaker University Professorship of Computer Science Takeo Kanade
* Life Income Plan or Deferred Gift
1.14
ENDOWED PROFESSORSHIPS BY COLLEGEas of Fall 2004 (Cont.)
TEPPER SCHOOL OF BUSINESSBP America Junior Faculty Research Professorship Nicola SecomandiRichard M. Cyert Professorship of Management and Economics Paul GoodmanR. M. and M.S. Cyert Professorship of Economics and Management Richard GreenRichard M. Cyert and Morris Degroot Professorship in Economics and Statistics Stanley ZinDeloitte Consulting Professorship for e-Business in Tepper School of Business Tridas MukhopadhyayFord Foundation Distinguished Professorship Sridhar TayurH. J. Heinz Professor of Economics Bennet T. McCallumHoward J. Heinz II Professorship Kannan SrinivasanHarry B. & James H. Higgins Professorship of Economics and Finance Lester B. LaveT. Jerome Holleran Professorship of Business Ethics and Social Responsibility John HookerIBM Professorship of Information Systems in Tepper School of Business Gerard CornuejolsDavid M. and Barbara A. Kirr Professorship of Organization * Linda ArgoteFriends of Allan Meltzer Professorship Adam LerrickAllan H. Meltzer Professorship of Political Economy Allan MeltzerDavid T. & Lindsay J. Morgenthaler Professorship of Entrepreneurship S. Thomas EmersonJohn R. Thorne Professorship of Entrepreneurship Art BoniXerox Junior Faculty Research Professorship Baohong Sun
UNIVERSITY GENERALDavid M. Roderick Professor of Technology and Social Change David A. HounshellThomas Lord University Professorship of Operations Research Egon BalasThomas Lord Professorship of Economics Dennis EppleAnna Loomis McCandless Career Development Professorship Yoky Matsuoka Estella Loomis McCandless Career Development Professorship Jennifer LernerRobert Mehrabian Professorship To be namedCharles J. Queenan Jr. University Professorship Robyn DawesRaymond John Wean Foundation Career Development Professorship Suzie Silver
* Life Income Plan or Deferred Gift
1.15

ACCREDITATIONS BY COLLEGE & DEPARTMENTFALL SEMESTER 2004
College/Department Accreditation Agency
CARNEGIE MELLON UNIVERSITY Middle States Association of Colleges and SchoolsMSA
CARNEGIE INSTITUTE Accreditation Board for Engineering Technology OF TECHNOLOGY ABET
Chemical EngineeringCivil EngineeringElectrical and Computer Engineering Engineering and Public PolicyMechanical Engineering Materials Science and Engineering
COLLEGE OF FINE ARTS
Architecture National Architectural Accrediting BoardNAAB
Art National Association of Schools of Art and DesignDesign NASAD
Music National Association of Schools of MusicNASM
H. JOHN HEINZ III SCHOOL OF National Association of Schools of Public Affairs and PUBLIC POLICY & MANAGEMENT Administration
NASPAA
TEPPER SCHOOL OF BUSINESS The Association to Advance Collegiate Schools of Business International AACSB
Middle Atlantic Association of College of Business AdministrationMAACBA
1.16

STUDENTS

blah
2.2
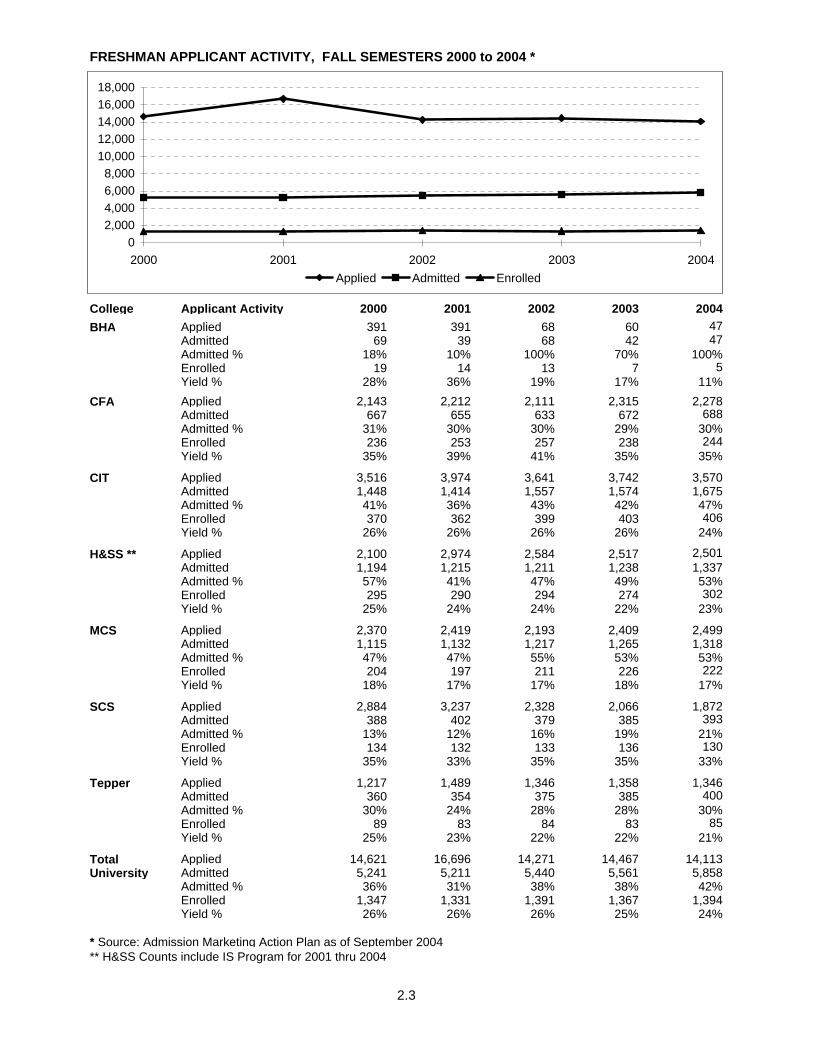
FRESHMAN APPLICANT ACTIVITY, FALL SEMESTERS 2000 to 2004 *
College Applicant Activity 2000 2001 2002 2003 2004BHA Applied 391 391 68 60 47
Admitted 69 39 68 42 47Admitted % 18% 10% 100% 70% 100%Enrolled 19 14 13 7 5Yield % 28% 36% 19% 17% 11%
CFA Applied 2,143 2,212 2,111 2,315 2,278Admitted 667 655 633 672 688Admitted % 31% 30% 30% 29% 30%Enrolled 236 253 257 238 244Yield % 35% 39% 41% 35% 35%
CIT Applied 3,516 3,974 3,641 3,742 3,570Admitted 1,448 1,414 1,557 1,574 1,675Admitted % 41% 36% 43% 42% 47%Enrolled 370 362 399 403 406Yield % 26% 26% 26% 26% 24%
H&SS ** Applied 2,100 2,974 2,584 2,517 2,501Admitted 1,194 1,215 1,211 1,238 1,337Admitted % 57% 41% 47% 49% 53%Enrolled 295 290 294 274 302Yield % 25% 24% 24% 22% 23%
MCS Applied 2,370 2,419 2,193 2,409 2,499Admitted 1,115 1,132 1,217 1,265 1,318Admitted % 47% 47% 55% 53% 53%Enrolled 204 197 211 226 222Yield % 18% 17% 17% 18% 17%
SCS Applied 2,884 3,237 2,328 2,066 1,872Admitted 388 402 379 385 393Admitted % 13% 12% 16% 19% 21%Enrolled 134 132 133 136 130Yield % 35% 33% 35% 35% 33%
Tepper Applied 1,217 1,489 1,346 1,358 1,346Admitted 360 354 375 385 400Admitted % 30% 24% 28% 28% 30%Enrolled 89 83 84 83 85Yield % 25% 23% 22% 22% 21%
Total Applied 14,621 16,696 14,271 14,467 14,113University Admitted 5,241 5,211 5,440 5,561 5,858
Admitted % 36% 31% 38% 38% 42%Enrolled 1,347 1,331 1,391 1,367 1,394Yield % 26% 26% 26% 25% 24%
* Source: Admission Marketing Action Plan as of September 2004** H&SS Counts include IS Program for 2001 thru 2004
02,0004,0006,0008,000
10,00012,00014,00016,00018,000
2000 2001 2002 2003 2004Applied Admitted Enrolled
2.3

FRESHMAN AVERAGE SAT SCORESFALL SEMESTERS 2000 to 2004
College 2000 2001 2002 2003 2004BHA/BSA Verbal 679 674 695 683 685
Math 664 687 668 721 722Total 1,343 1,361 1,363 1,404 1,407
CFA Verbal 630 642 630 643 636Math 700 694 692 694 692Total 1,330 1,336 1,322 1,337 1,328
CIT Verbal 645 647 638 648 654Math 733 734 732 728 733Total 1,378 1,381 1,370 1,376 1,387
H&SS Verbal 633 635 641 636 644Math 661 679 673 683 681Total 1,294 1,314 1,314 1,319 1,325
MCS Verbal 652 646 638 646 652Math 712 717 717 717 711Total 1,364 1,363 1,355 1,363 1,363
SCS Verbal 693 675 688 691 696Math 768 764 759 757 761Total 1,461 1,439 1,447 1,448 1,457
SHS Verbal 702 691 680 713 711Math 723 718 735 735 744Total 1,425 1,409 1,415 1,448 1,455
Tepper Verbal 628 618 626 627 644Math 723 721 719 718 720Total 1,351 1,339 1,345 1,345 1,364
Total Verbal 649 647 646 652 657University Math 713 718 716 718 718
Total 1,362 1,365 1,362 1,370 1,375
National** Verbal 505 506 504 507 508Math 514 514 516 519 518Total 1,019 1,020 1,020 1,026 1,026
*Note: CFA SAT scores contain only Architecture Students. Other CFA departments shift weight from SAT scores to qualitative measure such as portfolios and auditions for the purpose of evaluating applicants.**Source: www.collegeboard.com; Average scores for college-bound seniors.
Average SAT Scores*
600620640660680700720740
2000 2001 2002 2003 2004
CMU-Verbal CMU-Math
2.4

TOP FIFTEEN COMPETING SCHOOLS, ENTERING FRESHMEN FALL 2000 to 2004
TOP FIFTEEN RANKED BY CROSS APPLICANTS
School 2000 2001 2002 2003 2004Cornell 1 1 1 1 1MIT 2 2 2 2 2U. of Pennsylvania 3 3 3 3 3Harvard and Radcliffe Colleges 9 9 6 5 4Princeton 10 11 5 4 5Columbia 13 8 8 6 6Washington U. (St. Louis) 5 6 13 7 7Stanford 6 5 7 10 8New York University 7 10 18 9 9Penn State 14 10 11 15 10Johns Hopkins 8 4 9 11 11U. of Michigan - Ann Arbor 4 7 4 8 12Northwestern 11 14 20 12 13Yale 18 19 14 14 14Tufts 17 20 12 17 15
TOP FIFTEEN CROSS-APPLICANTS RANKED BY ADMITTANCE OVERLAP PERCENTAGE
School 2000 2001 2002 2003 2004Penn State 1 1 1 1 1U. Michigan - Ann Arbor 2 2 4 3 2Johns Hopkins 5 3 5 5 3Tufts -- -- 6 -- 4New York University 4 4 -- 4 5Cornell 7 7 7 7 6Northwestern 6 6 -- 6 7Washington U. (St. Louis) 3 5 3 8 8U. of Pennsylvania 10 10 10 9 9MIT 12 12 11 10 10Columbia 9 11 9 11 11Stanford 13 13 13 12 12Princeton 15 15 14 13 13Harvard and Radcliffe Colleges 14 14 15 15 14Yale -- -- 12 14 15
Note: Overlap refers to the number of applicants or admittees who applied or were admitted toCarnegie Mellon and one of the other schools listed.
Rank Each Year
Rank Each Year
2.5
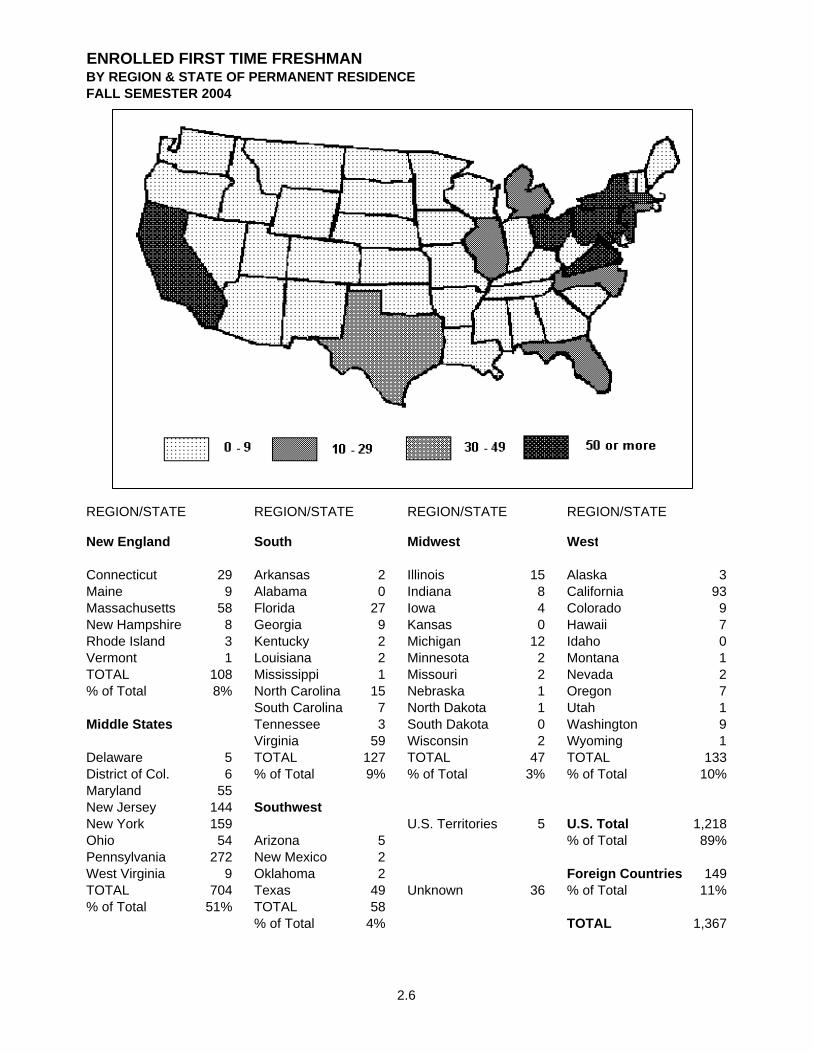
ENROLLED FIRST TIME FRESHMANBY REGION & STATE OF PERMANENT RESIDENCEFALL SEMESTER 2004
REGION/STATE REGION/STATE REGION/STATE REGION/STATE
New England South Midwest West
Connecticut 29 Arkansas 2 Illinois 15 Alaska 3Maine 9 Alabama 0 Indiana 8 California 93Massachusetts 58 Florida 27 Iowa 4 Colorado 9New Hampshire 8 Georgia 9 Kansas 0 Hawaii 7Rhode Island 3 Kentucky 2 Michigan 12 Idaho 0Vermont 1 Louisiana 2 Minnesota 2 Montana 1TOTAL 108 Mississippi 1 Missouri 2 Nevada 2% of Total 8% North Carolina 15 Nebraska 1 Oregon 7
South Carolina 7 North Dakota 1 Utah 1Middle States Tennessee 3 South Dakota 0 Washington 9
Virginia 59 Wisconsin 2 Wyoming 1Delaware 5 TOTAL 127 TOTAL 47 TOTAL 133District of Col. 6 % of Total 9% % of Total 3% % of Total 10%Maryland 55New Jersey 144 SouthwestNew York 159 U.S. Territories 5 U.S. Total 1,218Ohio 54 Arizona 5 % of Total 89%Pennsylvania 272 New Mexico 2West Virginia 9 Oklahoma 2 Foreign Countries 149TOTAL 704 Texas 49 Unknown 36 % of Total 11%% of Total 51% TOTAL 58
% of Total 4% TOTAL 1,367
2.6

UNDERGRADUATE HEADCOUNT ENROLLMENTBY REGION & STATE OF PERMANENT RESIDENCEFALL SEMESTER 2004
REGION/STATE REGION/STATE REGION/STATE REGION/STATE
New England South Midwest West
Connecticut 126 Arkansas 4 Illinois 71 Alaska 8Maine 23 Alabama 10 Indiana 20 California 294Massachusetts 208 Florida 115 Iowa 6 Colorado 30New Hampshire 26 Georgia 31 Kansas 10 Hawaii 39Rhode Island 13 Kentucky 16 Michigan 53 Idaho 5Vermont 14 Louisiana 10 Minnesota 23 Montana 3TOTAL 410 Mississippi 3 Missouri 20 Nevada 6% of Total 8% North Carolina 40 Nebraska 7 Oregon 35
South Carolina 22 North Dakota 2 Utah 4Middle States Tennessee 14 South Dakota 1 Washington 41
Virginia 175 Wisconsin 18 Wyoming 3Delaware 16 TOTAL 440 TOTAL 231 TOTAL 468District of Col. 22 % of Total 8% % of Total 4% % of Total 9%Maryland 229New Jersey 516 SouthwestNew York 698 U.S. Territories 17 U.S. Total 4,726Ohio 178 Arizona 17 % of Total 88%Pennsylvania 1,137 New Mexico 9West Virginia 23 Oklahoma 8 Foreign Countries 663TOTAL 2,819 Texas 142 Unknown 165 % of Total 12%% of Total 52% TOTAL 176
% of Total 3% TOTAL 5,389
2.7

HEADCOUNT ENROLLMENT BY CONTINENT & COUNTRY OF CITIZENSHIPFALL SEMESTER 2004
Continent Country Undergraduate Masters Doctoral Special TOTALAfrica Algeria 0 0 1 0 1
Cameroon 0 1 0 0 1Egypt 4 2 1 0 7Eritrea 0 0 0 1 1Ghana 0 1 6 0 7Kenya 0 1 2 0 3Madagascar 0 1 0 0 1Mauritius 2 0 0 0 2Nigeria 0 7 0 0 7South Africa 2 2 0 0 4Tanzania 0 0 1 0 1Zimbabwe 0 1 0 0 1TOTAL 8 16 11 1 36
Asia Armenia 0 0 2 0 2Bangladesh 0 3 4 0 7Bhutan 1 0 0 0 1China 13 82 218 2 315Cyprus 0 2 1 0 3Hong Kong 26 8 2 0 36India 105 256 155 1 517Indonesia 7 6 5 0 18Iran 1 4 4 0 9Israel 1 6 9 0 16Japan 9 39 10 0 58Jordan 2 0 0 0 2Kazakhstan 2 1 2 0 5Korea 139 109 50 1 299Kuwait 0 1 0 0 1Lebanon 2 7 3 0 12Malaysia 54 8 4 1 67Nepal 0 2 0 0 2Pakistan 5 7 2 1 15Philippines 1 4 1 0 6Qatar 24 0 0 0 24Russia 0 3 8 1 12Saudi Arabia 0 2 3 0 5Singapore 59 12 9 0 80Sri Lanka 0 1 1 0 2Syria 2 0 0 0 2Taiwan 21 63 23 0 107Thailand 35 21 18 0 74Turkey 14 23 37 0 74United Arab Emirates 3 0 0 0 3Vietnam 1 4 2 0 7TOTAL 527 674 573 7 1,781
Australia/Oceania Australia 4 2 3 0 9New Zealand 0 1 0 0 1TOTAL 4 3 3 0 10
Carribean, Central/ Argentina 0 10 9 0 19 South America Bahamas 1 1 0 1 3
Belize 1 0 0 0 1Bolivia 2 0 0 0 2Brazil 2 3 7 0 12Chile 1 1 3 0 5Colombia 1 5 6 0 12Ecuador 1 0 0 0 1
2.8
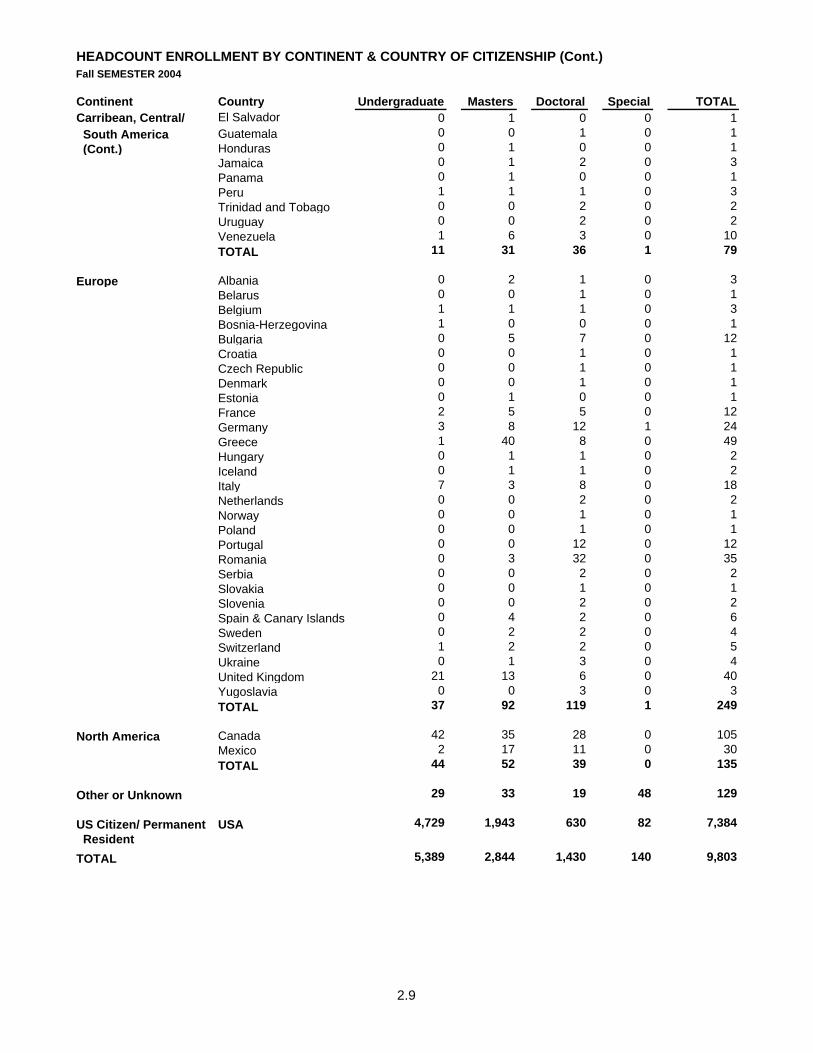
HEADCOUNT ENROLLMENT BY CONTINENT & COUNTRY OF CITIZENSHIP (Cont.)Fall SEMESTER 2004
Continent Country Undergraduate Masters Doctoral Special TOTALCarribean, Central/ El Salvador 0 1 0 0 1 South America Guatemala 0 0 1 0 1 (Cont.) Honduras 0 1 0 0 1
Jamaica 0 1 2 0 3Panama 0 1 0 0 1Peru 1 1 1 0 3Trinidad and Tobago 0 0 2 0 2Uruguay 0 0 2 0 2Venezuela 1 6 3 0 10TOTAL 11 31 36 1 79
Europe Albania 0 2 1 0 3Belarus 0 0 1 0 1Belgium 1 1 1 0 3Bosnia-Herzegovina 1 0 0 0 1Bulgaria 0 5 7 0 12Croatia 0 0 1 0 1Czech Republic 0 0 1 0 1Denmark 0 0 1 0 1Estonia 0 1 0 0 1France 2 5 5 0 12Germany 3 8 12 1 24Greece 1 40 8 0 49Hungary 0 1 1 0 2Iceland 0 1 1 0 2Italy 7 3 8 0 18Netherlands 0 0 2 0 2Norway 0 0 1 0 1Poland 0 0 1 0 1Portugal 0 0 12 0 12Romania 0 3 32 0 35Serbia 0 0 2 0 2Slovakia 0 0 1 0 1Slovenia 0 0 2 0 2Spain & Canary Islands 0 4 2 0 6Sweden 0 2 2 0 4Switzerland 1 2 2 0 5Ukraine 0 1 3 0 4United Kingdom 21 13 6 0 40Yugoslavia 0 0 3 0 3TOTAL 37 92 119 1 249
North America Canada 42 35 28 0 105Mexico 2 17 11 0 30TOTAL 44 52 39 0 135
Other or Unknown 29 33 19 48 129
US Citizen/ Permanent USA 4,729 1,943 630 82 7,384 ResidentTOTAL 5,389 2,844 1,430 140 9,803
2.9
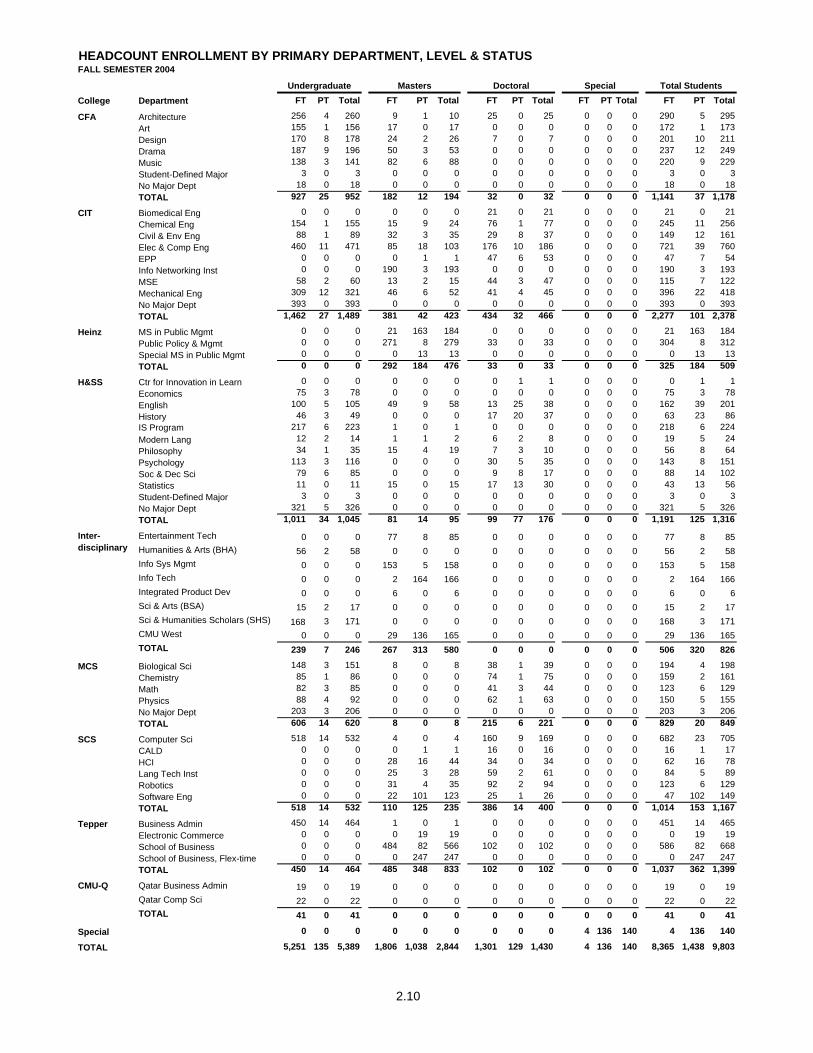
HEADCOUNT ENROLLMENT BY PRIMARY DEPARTMENT, LEVEL & STATUSFALL SEMESTER 2004
College Department FT PT Total FT PT Total FT PT Total FT PT Total FT PT Total
Architecture 256 4 260 9 1 10 25 0 25 0 0 0 290 5 295Art 155 1 156 17 0 17 0 0 0 0 0 0 172 1 173Design 170 8 178 24 2 26 7 0 7 0 0 0 201 10 211Drama 187 9 196 50 3 53 0 0 0 0 0 0 237 12 249Music 138 3 141 82 6 88 0 0 0 0 0 0 220 9 229Student-Defined Major 3 0 3 0 0 0 0 0 0 0 0 0 3 0 3No Major Dept 18 0 18 0 0 0 0 0 0 0 0 0 18 0 18TOTAL 927 25 952 182 12 194 32 0 32 0 0 0 1,141 37 1,178
Biomedical Eng 0 0 0 0 0 0 21 0 21 0 0 0 21 0 21Chemical Eng 154 1 155 15 9 24 76 1 77 0 0 0 245 11 256Civil & Env Eng 88 1 89 32 3 35 29 8 37 0 0 0 149 12 161Elec & Comp Eng 460 11 471 85 18 103 176 10 186 0 0 0 721 39 760EPP 0 0 0 0 1 1 47 6 53 0 0 0 47 7 54Info Networking Inst 0 0 0 190 3 193 0 0 0 0 0 0 190 3 193MSE 58 2 60 13 2 15 44 3 47 0 0 0 115 7 122Mechanical Eng 309 12 321 46 6 52 41 4 45 0 0 0 396 22 418No Major Dept 393 0 393 0 0 0 0 0 0 0 0 0 393 0 393TOTAL 1,462 27 1,489 381 42 423 434 32 466 0 0 0 2,277 101 2,378
MS in Public Mgmt 0 0 0 21 163 184 0 0 0 0 0 0 21 163 184Public Policy & Mgmt 0 0 0 271 8 279 33 0 33 0 0 0 304 8 312Special MS in Public Mgmt 0 0 0 0 13 13 0 0 0 0 0 0 0 13 13TOTAL 0 0 0 292 184 476 33 0 33 0 0 0 325 184 509
Ctr for Innovation in Learn 0 0 0 0 0 0 0 1 1 0 0 0 0 1 1Economics 75 3 78 0 0 0 0 0 0 0 0 0 75 3 78English 100 5 105 49 9 58 13 25 38 0 0 0 162 39 201History 46 3 49 0 0 0 17 20 37 0 0 0 63 23 86IS Program 217 6 223 1 0 1 0 0 0 0 0 0 218 6 224Modern Lang 12 2 14 1 1 2 6 2 8 0 0 0 19 5 24Philosophy 34 1 35 15 4 19 7 3 10 0 0 0 56 8 64Psychology 113 3 116 0 0 0 30 5 35 0 0 0 143 8 151Soc & Dec Sci 79 6 85 0 0 0 9 8 17 0 0 0 88 14 102Statistics 11 0 11 15 0 15 17 13 30 0 0 0 43 13 56Student-Defined Major 3 0 3 0 0 0 0 0 0 0 0 0 3 0 3No Major Dept 321 5 326 0 0 0 0 0 0 0 0 0 321 5 326TOTAL 1,011 34 1,045 81 14 95 99 77 176 0 0 0 1,191 125 1,316
Entertainment Tech 0 0 0 77 8 85 0 0 0 0 0 0 77 8 85Humanities & Arts (BHA) 56 2 58 0 0 0 0 0 0 0 0 0 56 2 58Info Sys Mgmt 0 0 0 153 5 158 0 0 0 0 0 0 153 5 158Info Tech 0 0 0 2 164 166 0 0 0 0 0 0 2 164 166Integrated Product Dev 0 0 0 6 0 6 0 0 0 0 0 0 6 0 6Sci & Arts (BSA) 15 2 17 0 0 0 0 0 0 0 0 0 15 2 17Sci & Humanities Scholars (SHS) 168 3 171 0 0 0 0 0 0 0 0 0 168 3 171CMU West 0 0 0 29 136 165 0 0 0 0 0 0 29 136 165TOTAL 239 7 246 267 313 580 0 0 0 0 0 0 506 320 826
Biological Sci 148 3 151 8 0 8 38 1 39 0 0 0 194 4 198Chemistry 85 1 86 0 0 0 74 1 75 0 0 0 159 2 161Math 82 3 85 0 0 0 41 3 44 0 0 0 123 6 129Physics 88 4 92 0 0 0 62 1 63 0 0 0 150 5 155No Major Dept 203 3 206 0 0 0 0 0 0 0 0 0 203 3 206TOTAL 606 14 620 8 0 8 215 6 221 0 0 0 829 20 849
Computer Sci 518 14 532 4 0 4 160 9 169 0 0 0 682 23 705CALD 0 0 0 0 1 1 16 0 16 0 0 0 16 1 17HCI 0 0 0 28 16 44 34 0 34 0 0 0 62 16 78Lang Tech Inst 0 0 0 25 3 28 59 2 61 0 0 0 84 5 89Robotics 0 0 0 31 4 35 92 2 94 0 0 0 123 6 129Software Eng 0 0 0 22 101 123 25 1 26 0 0 0 47 102 149TOTAL 518 14 532 110 125 235 386 14 400 0 0 0 1,014 153 1,167
Business Admin 450 14 464 1 0 1 0 0 0 0 0 0 451 14 465Electronic Commerce 0 0 0 0 19 19 0 0 0 0 0 0 0 19 19School of Business 0 0 0 484 82 566 102 0 102 0 0 0 586 82 668School of Business, Flex-time 0 0 0 0 247 247 0 0 0 0 0 0 0 247 247TOTAL 450 14 464 485 348 833 102 0 102 0 0 0 1,037 362 1,399
CMU-Q Qatar Business Admin 19 0 19 0 0 0 0 0 0 0 0 0 19 0 19Qatar Comp Sci 22 0 22 0 0 0 0 0 0 0 0 0 22 0 22TOTAL 41 0 41 0 0 0 0 0 0 0 0 0 41 0 41
Special 0 0 0 0 0 0 0 0 0 4 136 140 4 136 140
5,251 135 5,389 1,806 1,038 2,844 1,301 129 1,430 4 136 140 8,365 1,438 9,803
Tepper
TOTAL
Heinz
H&SS
MCS
SCS
Total Students
CFA
CIT
Inter-disciplinary
Undergraduate Masters Doctoral Special
2.10

HEADCOUNT ENROLLMENT BY PRIMARY DEPARTMENT, LEVEL & GENDERFALL SEMESTER 2004
College Department M F T M F T M F T M F T M F T
Architecture 135 125 260 1 9 10 12 13 25 0 0 0 148 147 295Art 60 96 156 11 6 17 0 0 0 0 0 0 71 102 173Design 63 115 178 8 18 26 4 3 7 0 0 0 75 136 211Drama 99 97 196 26 27 53 0 0 0 0 0 0 125 124 249Music 58 83 141 49 39 88 0 0 0 0 0 0 107 122 229Student-Defined Major 3 0 3 0 0 0 0 0 0 0 0 0 3 0 3No Major Dept 8 10 18 0 0 0 0 0 0 0 0 0 8 10 18TOTAL 426 526 952 95 99 194 16 16 32 0 0 0 537 641 1,178
Biomedical Eng 0 0 0 0 0 0 12 9 21 0 0 0 12 9 21Chemical Eng 95 60 155 17 7 24 58 19 77 0 0 0 170 86 256Civil & Env Eng 53 36 89 22 13 35 23 14 37 0 0 0 98 63 161Elec & Comp Eng 376 95 471 79 24 103 155 31 186 0 0 0 610 150 760EPP 0 0 0 1 0 1 34 19 53 0 0 0 35 19 54Info Networking Inst 0 0 0 166 27 193 0 0 0 0 0 0 166 27 193MSE 31 29 60 13 2 15 37 10 47 0 0 0 81 41 122Mechanical Eng 261 60 321 45 7 52 39 6 45 0 0 0 345 73 418No Major Dept 304 89 393 0 0 0 0 0 0 0 0 0 304 89 393TOTAL 1,120 369 1,489 343 80 423 358 108 466 0 0 0 1,821 557 2,378
MS in Public Mgmt 0 0 0 96 88 184 0 0 0 0 0 0 96 88 184Public Policy & Mgmt 0 0 0 135 144 279 22 11 33 0 0 0 157 155 312Special MS in Public Mgmt 0 0 0 4 9 13 0 0 0 0 0 0 4 9 13TOTAL 0 0 0 235 241 476 22 11 33 0 0 0 257 252 509
H&SS Ctr for Innovation in Learn 0 0 0 0 0 0 0 1 1 0 0 0 0 1 1Economics 56 22 78 0 0 0 0 0 0 0 0 0 56 22 78English 36 69 105 12 46 58 15 23 38 0 0 0 63 138 201History 15 34 49 0 0 0 17 20 37 0 0 0 32 54 86IS Program 167 56 223 1 0 1 0 0 0 0 0 0 168 56 224Modern Lang 6 8 14 1 1 2 0 8 8 0 0 0 7 17 24Philosophy 20 15 35 16 3 19 9 1 10 0 0 0 45 19 64Psychology 42 74 116 0 0 0 15 20 35 0 0 0 57 94 151Soc & Dec Sci 52 33 85 0 0 0 11 6 17 0 0 0 63 39 102Statistics 3 8 11 10 5 15 11 19 30 0 0 0 24 32 56Student-Defined Major 1 2 3 0 0 0 0 0 0 0 0 0 1 2 3No Major Dept 188 138 326 0 0 0 0 0 0 0 0 0 188 138 326TOTAL 586 459 1,045 40 55 95 78 98 176 0 0 0 704 612 1,316
Entertainment Tech 0 0 0 61 24 85 0 0 0 0 0 0 61 24 85Humanities & Arts (BHA) 16 42 58 0 0 0 0 0 0 0 0 0 16 42 58Info Sys Mgmt 0 0 0 109 49 158 0 0 0 0 0 0 109 49 158Info Tech 0 0 0 132 34 166 0 0 0 0 0 0 132 34 166Integrated Product Dev 0 0 0 5 1 6 0 0 0 0 0 0 5 1 6Sci & Arts (BSA) 4 13 17 0 0 0 0 0 0 0 0 0 4 13 17Sci & Humanities Scholars (SHS) 81 90 171 0 0 0 0 0 0 0 0 0 81 90 171CMU West 0 0 0 122 43 165 0 0 0 0 0 0 122 43 165TOTAL 101 145 246 429 151 580 0 0 0 0 0 0 530 296 826
Biological Sci 53 98 151 7 1 8 17 22 39 0 0 0 77 121 198Chemistry 40 46 86 0 0 0 42 33 75 0 0 0 82 79 161Math 67 18 85 0 0 0 37 7 44 0 0 0 104 25 129Physics 78 14 92 0 0 0 49 14 63 0 0 0 127 28 155No Major Dept 110 96 206 0 0 0 0 0 0 0 0 0 110 96 206TOTAL 348 272 620 7 1 8 145 76 221 0 0 0 500 349 849
Computer Sci 396 136 532 4 0 4 142 27 169 0 0 0 542 163 705CALD 0 0 0 1 0 1 13 3 16 0 0 0 14 3 17HCI 0 0 0 24 20 44 22 12 34 0 0 0 46 32 78Lang Tech Inst 0 0 0 23 5 28 40 21 61 0 0 0 63 26 89Robotics 0 0 0 31 4 35 76 18 94 0 0 0 107 22 129Software Eng 0 0 0 105 18 123 24 2 26 0 0 0 129 20 149TOTAL 396 136 532 188 47 235 317 83 400 0 0 0 901 266 1,167
Business Admin 281 183 464 0 1 1 0 0 0 0 0 0 281 184 465Electronic Commerce 0 0 0 16 3 19 0 0 0 0 0 0 16 3 19School of Business 0 0 0 451 115 566 65 37 102 0 0 0 516 152 668School of Business, Flex-time 0 0 0 206 41 247 0 0 0 0 0 0 206 41 247TOTAL 281 183 464 673 160 833 65 37 102 0 0 0 1,019 380 1,399
CMU-Q Qatar Business Admin 3 16 19 0 0 0 0 0 0 0 0 0 3 16 19Qatar Comp Sci 8 14 22 0 0 0 0 0 0 0 0 0 8 14 22TOTAL 11 30 41 0 0 0 0 0 0 0 0 0 11 30 41
Special 0 0 0 0 0 0 0 0 0 82 58 140 82 58 140
3,269 2,120 5,389 2,010 834 2,844 1,001 429 1,430 82 58 140 6,362 3,441 9,803
MCS
SCS
Tepper
TOTAL
Inter-Disciplinary
Special Total Students
CFA
CIT
Undergraduate Masters Doctoral
Heinz
2.11

HEADCOUNT ENROLLMENT BY PRIMARY DEPARTMENT & CLASSFALL SEMESTER 2004
Masters Doctoral Special HeadcountCollege Department Fresh. Soph. Jr. Sr. 5th Yr. Total Total Total Total Total
Architecture 69 58 49 39 45 260 10 25 0 295Art 43 33 38 38 4 156 17 0 0 173Design 47 37 44 46 4 178 26 7 0 211Drama 49 54 50 41 2 196 53 0 0 249Music 40 28 30 35 8 141 88 0 0 229Student-Defined Major 0 0 2 1 0 3 0 0 0 3No Major Dept 3 12 3 0 0 18 0 0 0 18Total 251 222 216 200 63 952 194 32 0 1,178
Biomedical Eng 0 0 0 0 0 0 0 21 0 21Chemical Eng 0 63 54 33 5 155 24 77 0 256Civil & Env Eng 0 28 30 27 4 89 35 37 0 161Elec & Comp Eng 0 159 134 144 34 471 103 186 0 760EPP 0 0 0 0 0 0 1 53 0 54Info Networking Inst 0 0 0 0 0 0 193 0 0 193MSE 0 20 21 15 4 60 15 47 0 122Mechanical Eng 0 109 111 87 14 321 52 45 0 418No Major Dept 390 3 0 0 0 393 0 0 0 393Total 390 382 350 306 61 1489 423 466 0 2,378
MS in Public Mgmt 0 0 0 0 0 0 184 0 0 184Public Policy & Mgmt 0 0 0 0 0 0 279 33 0 312Special MS in Public Mgmt 0 0 0 0 0 0 13 0 0 13Total 0 0 0 0 0 0 476 33 0 509
Ctr for Innovation in Learn 0 0 0 0 0 0 0 1 0 1Economics 0 15 29 30 4 78 0 0 0 78English 0 23 41 38 3 105 58 38 0 201History 0 5 17 23 4 49 0 37 0 86IS Program 49 37 62 67 8 223 1 0 0 224Modern Lang 0 2 6 3 3 14 2 8 0 24Philosophy 0 7 16 11 1 35 19 10 0 64Psychology 0 16 42 46 12 116 0 35 0 151Soc & Dec Sci 0 12 38 31 4 85 0 17 0 102Statistics 0 0 3 8 0 11 15 30 0 56Student-Defined Major 0 0 0 2 1 3 0 0 0 3No Major Dept 221 101 4 0 0 326 0 0 0 326Total 270 218 258 259 40 1045 95 176 0 1,316
Entertainment Tech 0 0 0 0 0 0 85 0 0 85Humanities & Arts (BHA) 3 11 24 18 2 58 0 0 0 58Info Sys Mgmt 0 0 0 0 0 0 158 0 0 158Info Tech 0 0 0 0 0 0 166 0 0 166Integrated Product Dev 0 0 0 0 0 0 6 0 0 6Sci & Arts (BSA) 3 3 6 2 3 17 0 0 0 17Sci & Humanities Scholars (SHS) 50 53 36 31 1 171 0 0 0 171CMU West 0 0 0 0 0 0 165 0 0 165Total 56 67 66 51 6 246 580 0 0 826
Biological Sci 1 58 47 42 3 151 8 39 0 198Chemistry 0 35 27 23 1 86 0 75 0 161Math 0 26 25 31 3 85 0 44 0 129Physics 0 36 25 26 5 92 0 63 0 155No Major Dept 191 8 4 3 0 206 0 0 0 206Total 192 163 128 125 12 620 8 221 0 849
Computer Sci 130 135 132 124 11 532 4 169 0 705CALD 0 0 0 0 0 0 1 16 0 17HCI 0 0 0 0 0 0 44 34 0 78Lang Tech Inst 0 0 0 0 0 0 28 61 0 89Robotics 0 0 0 0 0 0 35 94 0 129Software Eng 0 0 0 0 0 0 123 26 0 149Total 130 135 132 124 11 532 235 400 0 1,167
Business Admin 86 90 134 141 13 464 1 0 0 465Electronic Commerce 0 0 0 0 0 0 19 0 0 19School of Business 0 0 0 0 0 0 566 102 0 668School of Business, Flex-time 0 0 0 0 0 0 247 0 0 247Total 86 90 134 141 13 464 833 102 0 1,399
Qatar Business Admin 19 0 0 0 0 19 0 0 0 19Qatar Comp Sci 22 0 0 0 0 22 0 0 0 22Total 41 0 0 0 0 41 0 0 0 41
Special 0 0 0 0 0 0 0 0 140 1401,416 1,277 1,284 1,206 206 5,389 2,844 1,430 140 9,803Total
Heinz
MCS
SCS
H&SS
Inter-disciplinary
CMU-Q
Undergraduate
CFA
CIT
Tepper
2.12
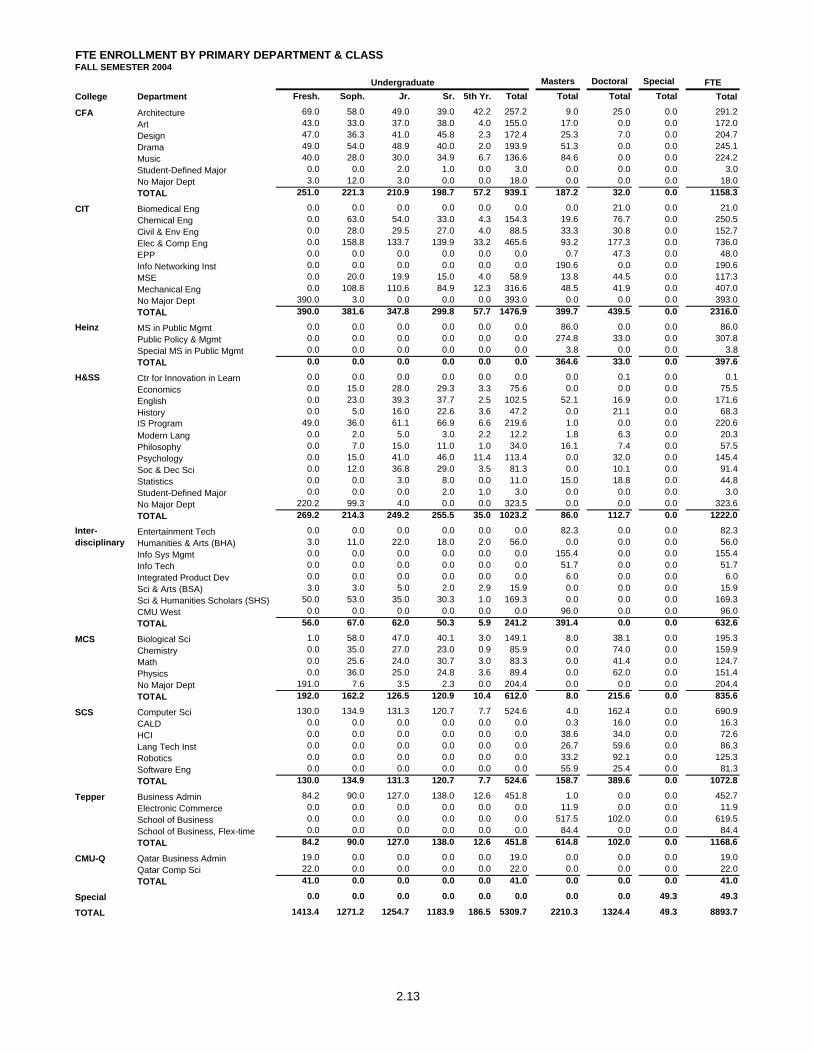
FTE ENROLLMENT BY PRIMARY DEPARTMENT & CLASSFALL SEMESTER 2004
Masters Doctoral Special FTECollege Department Fresh. Soph. Jr. Sr. 5th Yr. Total Total Total Total Total
Architecture 69.0 58.0 49.0 39.0 42.2 257.2 9.0 25.0 0.0 291.2Art 43.0 33.0 37.0 38.0 4.0 155.0 17.0 0.0 0.0 172.0Design 47.0 36.3 41.0 45.8 2.3 172.4 25.3 7.0 0.0 204.7Drama 49.0 54.0 48.9 40.0 2.0 193.9 51.3 0.0 0.0 245.1Music 40.0 28.0 30.0 34.9 6.7 136.6 84.6 0.0 0.0 224.2Student-Defined Major 0.0 0.0 2.0 1.0 0.0 3.0 0.0 0.0 0.0 3.0No Major Dept 3.0 12.0 3.0 0.0 0.0 18.0 0.0 0.0 0.0 18.0TOTAL 251.0 221.3 210.9 198.7 57.2 939.1 187.2 32.0 0.0 1158.3
Biomedical Eng 0.0 0.0 0.0 0.0 0.0 0.0 0.0 21.0 0.0 21.0Chemical Eng 0.0 63.0 54.0 33.0 4.3 154.3 19.6 76.7 0.0 250.5Civil & Env Eng 0.0 28.0 29.5 27.0 4.0 88.5 33.3 30.8 0.0 152.7Elec & Comp Eng 0.0 158.8 133.7 139.9 33.2 465.6 93.2 177.3 0.0 736.0EPP 0.0 0.0 0.0 0.0 0.0 0.0 0.7 47.3 0.0 48.0Info Networking Inst 0.0 0.0 0.0 0.0 0.0 0.0 190.6 0.0 0.0 190.6MSE 0.0 20.0 19.9 15.0 4.0 58.9 13.8 44.5 0.0 117.3Mechanical Eng 0.0 108.8 110.6 84.9 12.3 316.6 48.5 41.9 0.0 407.0No Major Dept 390.0 3.0 0.0 0.0 0.0 393.0 0.0 0.0 0.0 393.0TOTAL 390.0 381.6 347.8 299.8 57.7 1476.9 399.7 439.5 0.0 2316.0
Heinz MS in Public Mgmt 0.0 0.0 0.0 0.0 0.0 0.0 86.0 0.0 0.0 86.0Public Policy & Mgmt 0.0 0.0 0.0 0.0 0.0 0.0 274.8 33.0 0.0 307.8Special MS in Public Mgmt 0.0 0.0 0.0 0.0 0.0 0.0 3.8 0.0 0.0 3.8TOTAL 0.0 0.0 0.0 0.0 0.0 0.0 364.6 33.0 0.0 397.6
H&SS Ctr for Innovation in Learn 0.0 0.0 0.0 0.0 0.0 0.0 0.0 0.1 0.0 0.1Economics 0.0 15.0 28.0 29.3 3.3 75.6 0.0 0.0 0.0 75.5English 0.0 23.0 39.3 37.7 2.5 102.5 52.1 16.9 0.0 171.6History 0.0 5.0 16.0 22.6 3.6 47.2 0.0 21.1 0.0 68.3IS Program 49.0 36.0 61.1 66.9 6.6 219.6 1.0 0.0 0.0 220.6Modern Lang 0.0 2.0 5.0 3.0 2.2 12.2 1.8 6.3 0.0 20.3Philosophy 0.0 7.0 15.0 11.0 1.0 34.0 16.1 7.4 0.0 57.5Psychology 0.0 15.0 41.0 46.0 11.4 113.4 0.0 32.0 0.0 145.4Soc & Dec Sci 0.0 12.0 36.8 29.0 3.5 81.3 0.0 10.1 0.0 91.4Statistics 0.0 0.0 3.0 8.0 0.0 11.0 15.0 18.8 0.0 44.8Student-Defined Major 0.0 0.0 0.0 2.0 1.0 3.0 0.0 0.0 0.0 3.0No Major Dept 220.2 99.3 4.0 0.0 0.0 323.5 0.0 0.0 0.0 323.6TOTAL 269.2 214.3 249.2 255.5 35.0 1023.2 86.0 112.7 0.0 1222.0
Inter- Entertainment Tech 0.0 0.0 0.0 0.0 0.0 0.0 82.3 0.0 0.0 82.3disciplinary Humanities & Arts (BHA) 3.0 11.0 22.0 18.0 2.0 56.0 0.0 0.0 0.0 56.0
Info Sys Mgmt 0.0 0.0 0.0 0.0 0.0 0.0 155.4 0.0 0.0 155.4Info Tech 0.0 0.0 0.0 0.0 0.0 0.0 51.7 0.0 0.0 51.7Integrated Product Dev 0.0 0.0 0.0 0.0 0.0 0.0 6.0 0.0 0.0 6.0Sci & Arts (BSA) 3.0 3.0 5.0 2.0 2.9 15.9 0.0 0.0 0.0 15.9Sci & Humanities Scholars (SHS) 50.0 53.0 35.0 30.3 1.0 169.3 0.0 0.0 0.0 169.3CMU West 0.0 0.0 0.0 0.0 0.0 0.0 96.0 0.0 0.0 96.0TOTAL 56.0 67.0 62.0 50.3 5.9 241.2 391.4 0.0 0.0 632.6
Biological Sci 1.0 58.0 47.0 40.1 3.0 149.1 8.0 38.1 0.0 195.3Chemistry 0.0 35.0 27.0 23.0 0.9 85.9 0.0 74.0 0.0 159.9Math 0.0 25.6 24.0 30.7 3.0 83.3 0.0 41.4 0.0 124.7Physics 0.0 36.0 25.0 24.8 3.6 89.4 0.0 62.0 0.0 151.4No Major Dept 191.0 7.6 3.5 2.3 0.0 204.4 0.0 0.0 0.0 204.4TOTAL 192.0 162.2 126.5 120.9 10.4 612.0 8.0 215.6 0.0 835.6
Computer Sci 130.0 134.9 131.3 120.7 7.7 524.6 4.0 162.4 0.0 690.9CALD 0.0 0.0 0.0 0.0 0.0 0.0 0.3 16.0 0.0 16.3HCI 0.0 0.0 0.0 0.0 0.0 0.0 38.6 34.0 0.0 72.6Lang Tech Inst 0.0 0.0 0.0 0.0 0.0 0.0 26.7 59.6 0.0 86.3Robotics 0.0 0.0 0.0 0.0 0.0 0.0 33.2 92.1 0.0 125.3Software Eng 0.0 0.0 0.0 0.0 0.0 0.0 55.9 25.4 0.0 81.3TOTAL 130.0 134.9 131.3 120.7 7.7 524.6 158.7 389.6 0.0 1072.8
Business Admin 84.2 90.0 127.0 138.0 12.6 451.8 1.0 0.0 0.0 452.7Electronic Commerce 0.0 0.0 0.0 0.0 0.0 0.0 11.9 0.0 0.0 11.9School of Business 0.0 0.0 0.0 0.0 0.0 0.0 517.5 102.0 0.0 619.5School of Business, Flex-time 0.0 0.0 0.0 0.0 0.0 0.0 84.4 0.0 0.0 84.4TOTAL 84.2 90.0 127.0 138.0 12.6 451.8 614.8 102.0 0.0 1168.6
CMU-Q Qatar Business Admin 19.0 0.0 0.0 0.0 0.0 19.0 0.0 0.0 0.0 19.0Qatar Comp Sci 22.0 0.0 0.0 0.0 0.0 22.0 0.0 0.0 0.0 22.0TOTAL 41.0 0.0 0.0 0.0 0.0 41.0 0.0 0.0 0.0 41.0
Special 0.0 0.0 0.0 0.0 0.0 0.0 0.0 0.0 49.3 49.3
1413.4 1271.2 1254.7 1183.9 186.5 5309.7 2210.3 1324.4 49.3 8893.7
Undergraduate
CFA
CIT
Tepper
TOTAL
MCS
SCS
2.13

HEADCOUNT & FTE ENROLLMENT BY COLLEGE, LEVEL & STATUSFALL SEMESTERS 1999 to 2004
College Status Underg. Grad. Total Underg. Grad. Total Underg. Grad. Total
Headcount Full-time 932.0 181.0 1,113.0 951.0 181.0 1,132.0 966.0 184.0 1,150.0 Part-time 12.0 20.0 32.0 10.0 23.0 33.0 25.0 7.0 32.0 Total 944.0 201.0 1,145.0 961.0 204.0 1,165.0 991.0 191.0 1,182.0FTE 941.2 190.7 1,131.9 955.9 191.8 1,147.7 980.4 186.8 1,167.2
Headcount Full-time 1,331.0 548.0 1,879.0 951.0 181.0 1,132.0 1,363.0 585.0 1,948.0 Part-time 16.0 54.0 70.0 10.0 23.0 33.0 10.0 66.0 76.0 Total 1,347.0 602.0 1,949.0 961.0 204.0 1,165.0 1,373.0 651.0 2,024.0FTE 1,341.8 566.6 1,908.4 955.9 191.8 1,147.7 1,368.8 605.4 1,974.2
Headcount Full-time 0.0 351.0 351.0 0.0 237.0 237.0 0.0 237.0 237.0 Part-time 0.0 287.0 287.0 0.0 258.0 258.0 0.0 240.0 240.0 Total 0.0 638.0 638.0 0.0 495.0 495.0 0.0 477.0 477.0FTE 0.0 456.5 456.5 0.0 334.0 334.0 0.0 325.1 325.1
Headcount Full-time 1,081.0 147.0 1,228.0 1,066.0 142.0 1,208.0 1,055.0 172.0 1,227.0 Part-time 33.0 69.0 102.0 37.0 81.0 118.0 41.0 83.0 124.0 Total 1,114.0 216.0 1,330.0 1,103.0 223.0 1,326.0 1,096.0 255.0 1,351.0FTE 1,101.2 160.5 1,261.7 1,088.4 159.6 1,248.0 1,077.7 190.0 1,267.7
Headcount Full-time 106.0 47.0 153.0 156.0 122.0 278.0 185.0 189.0 374.0 Part-time 0.0 8.0 8.0 1.0 26.0 27.0 2.0 123.0 125.0 Total 106.0 55.0 161.0 157.0 148.0 305.0 187.0 312.0 499.0FTE 106.0 50.2 156.2 156.4 134.7 291.1 186.4 239.7 426.1
Headcount Full-time 560.0 165.0 725.0 538.0 192.0 730.0 548.0 200.0 748.0 Part-time 8.0 4.0 12.0 13.0 6.0 19.0 14.0 4.0 18.0 Total 568.0 169.0 737.0 551.0 198.0 749.0 562.0 204.0 766.0FTE 564.7 166.1 730.8 544.9 193.8 738.7 554.7 200.3 755.0
Headcount Full-time 538.0 336.0 874.0 541.0 400.0 941.0 520.0 367.0 887.0 Part-time 11.0 76.0 87.0 12.0 64.0 76.0 13.0 148.0 161.0 Total 549.0 412.0 961.0 553.0 464.0 1,017.0 533.0 515.0 1,048.0FTE 542.4 377.4 919.8 546.6 433.1 979.7 526.4 424.7 951.1
Headcount Full-time 499.0 617.0 1,116.0 431.0 692.0 1,123.0 447.0 671.0 1,118.0 Part-time 9.0 264.0 273.0 4.0 261.0 265.0 5.0 2.0 7.0 Total 508.0 881.0 1,389.0 435.0 953.0 1,388.0 452.0 673.0 1,125.0FTE 504.8 770.9 1,275.7 433.3 826.6 1,259.9 449.6 671.3 1,120.9
Headcount Full-time 5,047.0 2,392.0 7,443.0 5,010.0 2,507.0 7,522.0 5,084.0 2,605.0 7,690.0 Part-time 89.0 782.0 993.0 96.0 783.0 992.0 110.0 673.0 898.0 Total 5,136.0 3,174.0 8,436.0 5,106.0 3,290.0 8,514.0 5,194.0 3,278.0 8,588.0FTE 5,102.1 2,738.9 7,885.5 5,063.3 2,838.5 7,943.3 5,144.0 2,843.4 8,024.1
*Total Includes Non-Degree Headcount and FTE Enrollment.
Inter-disciplinary
MCS
TOTAL*
Tepper
SCS
Heinz
H&SS
2000 2001
CIT
CFA
1999
2.14

HEADCOUNT & FTE ENROLLMENT BY COLLEGE, LEVEL & STATUS (Cont.)FALL SEMESTERS 1999 to 2004
College Status Underg. Grad. Total Underg. Grad. Total Underg. Grad. Total
Headcount Full-time 990.0 192.0 1,182.0 951.0 223.0 1,174.0 927.0 214.0 1,141.0 Part-time 19.0 19.0 38.0 17.0 18.0 35.0 25.0 12.0 37.0 Total 1,009.0 211.0 1,220.0 968.0 241.0 1,209.0 952.0 226.0 1,178.0FTE 995.9 198.0 1,193.9 955.2 230.5 1,185.7 939.1 219.2 1,158.3
Headcount Full-time 1,410.0 740.0 2,150.0 1,427.0 773.0 2,200.0 1,462.0 815.0 2,277.0 Part-time 23.0 60.0 83.0 20.0 84.0 104.0 27.0 74.0 101.0 Total 1,433.0 800.0 2,233.0 1,447.0 857.0 2,304.0 1,489.0 889.0 2,378.0FTE 1,420.1 762.1 2,182.3 1,439.0 804.4 2,243.3 1,476.8 839.2 2,316.0
Headcount Full-time 0.0 237.0 237.0 0.0 267.0 267.0 0.0 325.0 325.0 Part-time 0.0 240.0 240.0 0.0 213.0 213.0 0.0 184.0 184.0 Total 0.0 477.0 477.0 0.0 480.0 480.0 0.0 509.0 509.0FTE 0.0 325.1 325.1 0.0 347.8 347.8 0.0 397.6 397.6
Headcount Full-time 1,055.0 172.0 1,227.0 1,005.0 162.0 1,167.0 1,011.0 180.0 1,191.0 Part-time 41.0 83.0 124.0 38.0 96.0 134.0 34.0 91.0 125.0 Total 1,096.0 255.0 1,351.0 1,043.0 258.0 1,301.0 1,045.0 271.0 1,316.0FTE 1,077.7 190.0 1,267.7 1,020.5 186.9 1,207.4 1,023.3 198.7 1,222.0
Headcount Full-time 185.0 189.0 374.0 246.0 232.0 478.0 280.0 267.0 547.0 Part-time 2.0 123.0 125.0 7.0 258.0 265.0 7.0 313.0 320.0 Total 187.0 312.0 499.0 253.0 490.0 743.0 287.0 580.0 867.0FTE 186.4 239.7 426.1 248.8 331.4 580.3 282.2 391.3 673.6
Headcount Full-time 548.0 200.0 748.0 580.0 227.0 807.0 606.0 223.0 829.0 Part-time 14.0 4.0 18.0 11.0 8.0 19.0 14.0 6.0 20.0 Total 562.0 204.0 766.0 591.0 235.0 826.0 620.0 229.0 849.0FTE 554.7 200.3 755.0 585.7 228.3 814.0 612.0 223.6 835.6
Headcount Full-time 520.0 367.0 887.0 533.0 469.0 1,002.0 518.0 496.0 1,014.0 Part-time 13.0 148.0 161.0 14.0 172.0 186.0 14.0 139.0 153.0 Total 533.0 515.0 1,048.0 547.0 641.0 1,188.0 532.0 635.0 1,167.0FTE 526.4 424.7 951.1 540.7 541.0 1,081.7 524.5 548.3 1,072.8
Headcount Full-time 463.0 675.0 1,138.0 479.0 692.0 1,171.0 450.0 587.0 1,037.0 Part-time 12.0 346.0 358.0 9.0 378.0 387.0 14.0 348.0 362.0 Total 475.0 1,021.0 1,496.0 488.0 1,070.0 1,558.0 464.0 935.0 1,399.0FTE 467.3 841.6 1,308.9 482.0 841.2 1,323.2 451.7 716.8 1,168.6
Headcount Full-time 5,234.0 2,941.0 8,180.0 5,221.0 3,045.0 8,271.0 5,254.0 3,107.0 8,361.0 Part-time 113.0 1,085.0 1,321.0 116.0 1,227.0 1,485.0 135.0 1,167.0 1,302.0 Total 5,347.0 4,026.0 9,501.0 5,337.0 4,272.0 9,756.0 5,389.0 4,274.0 9,803.0FTE 5,273.8 3,368.8 8,687.3 5,271.8 3,511.6 8,840.6 5,309.8 3,534.7 8,893.7
*Total Includes Non-Degree Headcount and FTE Enrollment.
2004
CFA
CIT
2002 2003
SCS
Tepper
TOTAL*
Heinz
H&SS
MCS
Inter-disciplinary
2.15

UNDERGRADUATE HEADCOUNT ENROLLMENT BY DEPARTMENT, RACE & GENDERFALL SEMESTER 2004
College Department M F T M F T M F T M F T
Architecture 13 18 31 9 5 14 22 25 47 0 1 1Art 0 8 8 1 5 6 12 16 28 0 1 1Design 5 17 22 3 0 3 9 34 43 0 2 2Drama 0 2 2 10 10 20 1 3 4 0 0 0Music 1 4 5 2 6 8 1 6 7 0 1 1Student-Defined Major 0 0 0 2 0 2 0 0 0 0 0 0No Major Dept 1 4 5 1 0 1 1 4 5 0 0 0TOTAL 20 53 73 28 26 54 46 88 134 0 5 5
Chemical Eng 12 4 16 4 10 14 23 13 36 0 0 0Civil & Env Eng 4 2 6 2 2 4 8 4 12 0 1 1Elec & Comp Eng 106 29 135 27 8 35 84 33 117 1 2 3MSE 3 1 4 0 4 4 5 4 9 0 0 0Mechanical Eng 28 5 33 9 7 16 44 12 56 1 0 1No Major Dept 50 10 60 12 3 15 74 16 90 3 0 3TOTAL 203 51 254 54 34 88 238 82 320 5 3 8
Economics 8 4 12 3 1 4 19 8 27 0 0 0English 0 0 0 1 7 8 3 15 18 0 0 0History 1 0 1 2 2 4 1 4 5 0 0 0IS Program 19 11 30 10 1 11 52 26 78 1 0 1Modern Lang 0 0 0 1 2 3 0 1 1 0 0 0Philosophy 0 0 0 2 2 4 4 0 4 0 0 0Psychology 1 3 4 5 4 9 7 23 30 0 0 0Social & Decision Sci 2 2 4 7 2 9 10 12 22 0 0 0Statistics 0 0 0 0 0 0 2 2 4 0 0 0Student-Defined Major 0 0 0 0 0 0 0 0 0 0 0 0No Major Dept 23 15 38 6 16 22 60 38 98 1 1 2TOTAL 54 35 89 37 37 74 158 129 287 2 1 3
Entertainment Tech 0 0 0 0 0 0 0 0 0 0 0 0Humanities & Arts (BHA) 0 0 0 1 2 3 0 5 5 0 0 0Sci & Arts (BSA) 0 0 0 0 1 1 1 0 1 0 0 0Sci & Humanities Scholars (SHS) 4 2 6 1 2 3 22 26 48 0 0 0TOTAL 4 2 6 2 5 7 23 31 54 0 0 0
Biological Sci 5 8 13 1 5 6 23 33 56 0 1 1Chemistry 1 1 2 1 4 5 14 11 25 1 0 1Math 4 1 5 2 0 2 18 5 23 1 0 1Physics 5 0 5 0 0 0 5 2 7 0 1 1No Major Dept 9 10 19 3 2 5 16 27 43 2 0 2TOTAL 24 20 44 7 11 18 76 78 154 4 2 6
SCS Computer Sci 65 19 84 15 6 21 78 56 134 1 1 2
Tepper Business Admin 45 27 72 15 9 24 79 97 176 3 0 3
CMU-Q Qatar Business Admin 2 15 17 0 0 0 0 0 0 0 0 0Qatar Comp Sci 7 14 21 0 0 0 0 0 0 0 0 0TOTAL 9 29 38 0 0 0 0 0 0 0 0 0
424 236 660 158 128 286 698 561 1,259 15 12 27
CFA
American IndianNRA-International Black Asian/Pacific Is.
TOTAL
MCS
CIT
H&SS
Inter-disciplinary
2.16

UNDERGRADUATE HEADCOUNT ENROLLMENT BY DEPARTMENT, RACE & GENDER (Cont.)FALL SEMESTER 2004
College Department M F T M F T M F T M F T
Architecture 8 10 18 68 52 120 15 14 29 135 125 260Art 5 4 9 29 47 76 13 15 28 60 96 156Design 4 7 11 38 45 83 4 10 14 63 115 178Drama 1 8 9 77 60 137 10 14 24 99 97 196Music 4 4 8 40 48 88 10 14 24 58 83 141Student-Defined Major 0 0 0 1 0 1 0 0 0 3 0 3No Major Dept 0 1 1 5 1 6 0 0 0 8 10 18TOTAL 22 34 56 258 253 511 52 67 119 426 526 952
Chemical Eng 3 3 6 45 29 74 8 1 9 95 60 155Civil & Env Eng 5 2 7 27 20 47 7 5 12 53 36 89Elec & Comp Eng 22 1 23 106 18 124 30 4 34 376 95 471MSE 1 1 2 19 13 32 3 6 9 31 29 60Mechanical Eng 16 2 18 136 28 164 27 6 33 261 60 321No Major Dept 17 7 24 118 37 155 30 16 46 304 89 393TOTAL 64 16 80 451 145 596 105 38 143 1,120 369 1,489
Economics 3 0 3 19 6 25 4 3 7 56 22 78English 2 4 6 26 31 57 4 12 16 36 69 105History 1 4 5 9 19 28 1 5 6 15 34 49IS Program 5 0 5 62 11 73 18 7 25 167 56 223Modern Lang 1 0 1 3 3 6 1 2 3 6 8 14Philosophy 0 1 1 10 10 20 4 2 6 20 15 35Psychology 7 7 14 20 31 51 2 6 8 42 74 116Soc & Dec Sci 2 2 4 24 9 33 7 6 13 52 33 85Statistics 0 1 1 1 3 4 0 2 2 3 8 11Student-Defined Major 0 0 0 1 2 3 0 0 0 1 2 3No Major Dept 8 5 13 73 49 122 17 14 31 188 138 326TOTAL 29 24 53 248 174 422 58 59 117 586 459 1,045
Inter- Entertainment Tech 0 0 0 0 0 0 0 0 0 0 0 0disciplinary Humanities & Arts (BHA) 1 2 3 11 25 36 3 8 11 16 42 58
Sci & Arts (BSA) 0 0 0 2 10 12 1 2 3 4 13 17Sci & Humanities Scholars (SHS) 4 5 9 40 42 82 10 13 23 81 90 171TOTAL 5 7 12 53 77 130 14 23 37 101 145 246
Biological Sci 1 3 4 17 35 52 6 13 19 53 98 151Chemistry 1 2 3 18 26 44 4 2 6 40 46 86Math 1 0 1 34 12 46 7 0 7 67 18 85Physics 2 1 3 49 4 53 17 6 23 78 14 92No Major Dept 6 4 10 54 38 92 20 15 35 110 96 206TOTAL 11 10 21 172 115 287 54 36 90 348 272 620
SCS Computer Sci 31 2 33 162 41 203 44 11 55 396 136 532
Tepper Business Admin 16 10 26 96 35 131 27 5 32 281 183 464
CMU-Q Qatar Business Admin 0 0 0 0 0 0 1 1 2 3 16 19Qatar Comp Sci 0 0 0 0 0 0 1 0 1 8 14 22TOTAL 0 0 0 0 0 0 2 1 3 11 30 41
178 103 281 1,440 840 2,280 356 240 596 3,269 2,120 5,389
Unknown/Other Total
MCS
TOTAL
Hispanic White
CFA
CIT
H&SS
2.17
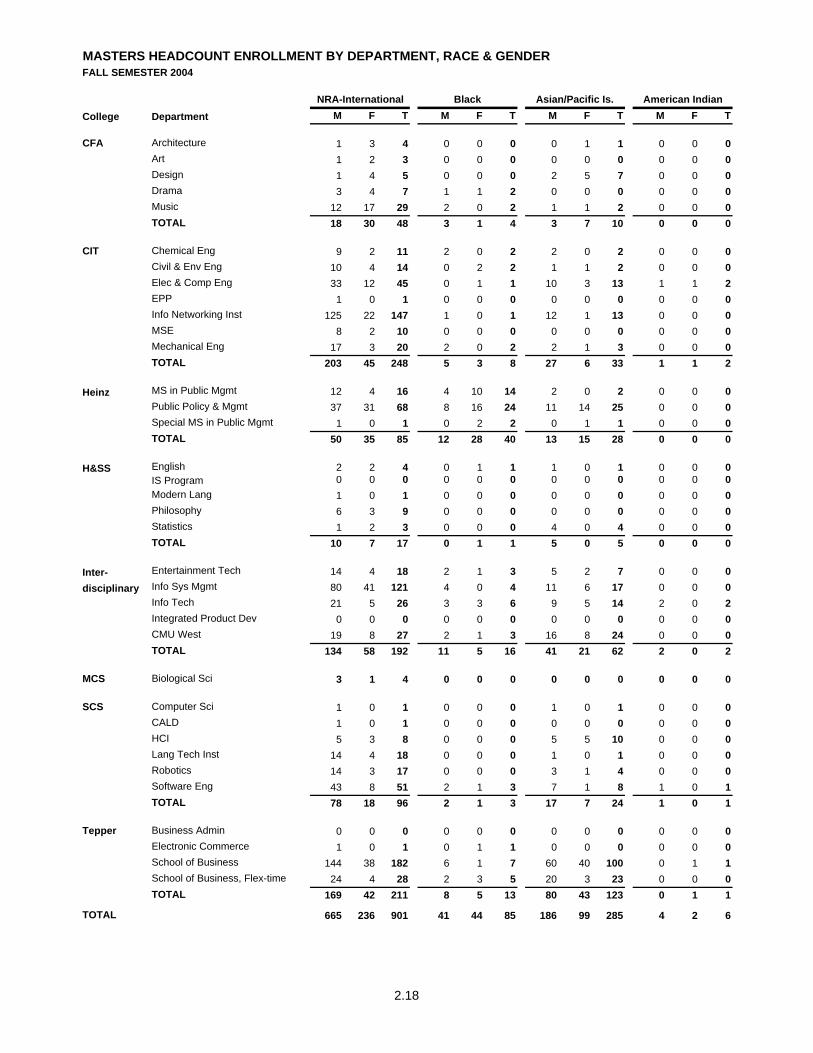
MASTERS HEADCOUNT ENROLLMENT BY DEPARTMENT, RACE & GENDERFALL SEMESTER 2004
College Department M F T M F T M F T M F T
Architecture 1 3 4 0 0 0 0 1 1 0 0 0Art 1 2 3 0 0 0 0 0 0 0 0 0Design 1 4 5 0 0 0 2 5 7 0 0 0Drama 3 4 7 1 1 2 0 0 0 0 0 0Music 12 17 29 2 0 2 1 1 2 0 0 0TOTAL 18 30 48 3 1 4 3 7 10 0 0 0
Chemical Eng 9 2 11 2 0 2 2 0 2 0 0 0Civil & Env Eng 10 4 14 0 2 2 1 1 2 0 0 0Elec & Comp Eng 33 12 45 0 1 1 10 3 13 1 1 2EPP 1 0 1 0 0 0 0 0 0 0 0 0Info Networking Inst 125 22 147 1 0 1 12 1 13 0 0 0MSE 8 2 10 0 0 0 0 0 0 0 0 0Mechanical Eng 17 3 20 2 0 2 2 1 3 0 0 0TOTAL 203 45 248 5 3 8 27 6 33 1 1 2
Heinz MS in Public Mgmt 12 4 16 4 10 14 2 0 2 0 0 0Public Policy & Mgmt 37 31 68 8 16 24 11 14 25 0 0 0Special MS in Public Mgmt 1 0 1 0 2 2 0 1 1 0 0 0TOTAL 50 35 85 12 28 40 13 15 28 0 0 0
H&SS English 2 2 4 0 1 1 1 0 1 0 0 0IS Program 0 0 0 0 0 0 0 0 0 0 0 0Modern Lang 1 0 1 0 0 0 0 0 0 0 0 0Philosophy 6 3 9 0 0 0 0 0 0 0 0 0Statistics 1 2 3 0 0 0 4 0 4 0 0 0TOTAL 10 7 17 0 1 1 5 0 5 0 0 0
Inter- Entertainment Tech 14 4 18 2 1 3 5 2 7 0 0 0disciplinary Info Sys Mgmt 80 41 121 4 0 4 11 6 17 0 0 0
Info Tech 21 5 26 3 3 6 9 5 14 2 0 2Integrated Product Dev 0 0 0 0 0 0 0 0 0 0 0 0CMU West 19 8 27 2 1 3 16 8 24 0 0 0TOTAL 134 58 192 11 5 16 41 21 62 2 0 2
MCS Biological Sci 3 1 4 0 0 0 0 0 0 0 0 0
Computer Sci 1 0 1 0 0 0 1 0 1 0 0 0CALD 1 0 1 0 0 0 0 0 0 0 0 0HCI 5 3 8 0 0 0 5 5 10 0 0 0Lang Tech Inst 14 4 18 0 0 0 1 0 1 0 0 0Robotics 14 3 17 0 0 0 3 1 4 0 0 0Software Eng 43 8 51 2 1 3 7 1 8 1 0 1TOTAL 78 18 96 2 1 3 17 7 24 1 0 1
Business Admin 0 0 0 0 0 0 0 0 0 0 0 0Electronic Commerce 1 0 1 0 1 1 0 0 0 0 0 0School of Business 144 38 182 6 1 7 60 40 100 0 1 1School of Business, Flex-time 24 4 28 2 3 5 20 3 23 0 0 0TOTAL 169 42 211 8 5 13 80 43 123 0 1 1
665 236 901 41 44 85 186 99 285 4 2 6
American IndianNRA-International Black Asian/Pacific Is.
Tepper
TOTAL
SCS
CFA
CIT
2.18

MASTERS HEADCOUNT ENROLLMENT BY DEPARTMENT, RACE & GENDER (Cont.)FALL SEMESTER 2004
College Department M F T M F T M F T M F T
Architecture 0 0 0 0 5 5 0 0 0 1 9 10Art 1 0 1 9 4 13 0 0 0 11 6 17Design 0 0 0 5 8 13 0 1 1 8 18 26Drama 1 1 2 16 16 32 5 5 10 26 27 53Music 1 0 1 7 5 12 26 16 42 49 39 88TOTAL 3 1 4 37 38 75 31 22 53 95 99 194
Chemical Eng 0 0 0 3 4 7 1 1 2 17 7 24Civil & Env Eng 0 0 0 10 6 16 1 0 1 22 13 35Elec & Comp Eng 2 1 3 25 5 30 8 1 9 79 24 103EPP 0 0 0 0 0 0 0 0 0 1 0 1Info Networking Inst 0 1 1 23 2 25 5 1 6 166 27 193MSE 0 0 0 4 0 4 1 0 1 13 2 15Mechanical Eng 1 0 1 19 3 22 4 0 4 45 7 52TOTAL 3 2 5 84 20 104 20 3 23 343 80 423
Heinz MS in Public Mgmt 1 1 2 58 58 116 19 15 34 96 88 184Public Policy & Mgmt 3 9 12 56 59 115 20 15 35 135 144 279Special MS in Public Mgmt 0 0 0 3 5 8 0 1 1 4 9 13TOTAL 4 10 14 117 122 239 39 31 70 235 241 476
H&SS English 0 3 3 7 24 31 2 16 18 12 46 58IS Program 0 0 0 1 0 1 0 0 0 1 0 1Modern Lang 0 0 0 0 1 1 0 0 0 1 1 2Philosophy 0 0 0 8 0 8 2 0 2 16 3 19Statistics 0 0 0 5 3 8 0 0 0 10 5 15TOTAL 0 3 3 21 28 49 4 16 20 40 55 95
Inter- Entertainment Tech 1 0 1 31 13 44 8 4 12 61 24 85disciplinary Info Sys Mgmt 0 0 0 9 0 9 5 2 7 109 49 158
Info Tech 0 1 1 73 16 89 24 4 28 132 34 166Integrated Product Dev 0 0 0 1 1 2 4 0 4 5 1 6CMU West 4 1 5 32 7 39 49 18 67 122 43 165TOTAL 5 2 7 146 37 183 90 28 118 429 151 580
MCS Biological Sci 1 0 1 1 0 1 2 0 2 7 1 8
Computer Sci 0 0 0 0 0 0 2 0 2 4 0 4CALD 0 0 0 0 0 0 0 0 0 1 0 1HCI 0 0 0 12 9 21 2 3 5 24 20 44Lang Tech Inst 0 0 0 0 0 0 8 1 9 23 5 28Robotics 1 0 1 10 0 10 3 0 3 31 4 35Software Eng 4 1 5 30 2 32 18 5 23 105 18 123TOTAL 5 1 6 52 11 63 33 9 42 188 47 235
Business Admin 0 0 0 0 0 0 0 1 1 0 1 1Electronic Commerce 1 2 3 13 0 13 1 0 1 16 3 19School of Business 10 2 12 151 24 175 80 9 89 451 115 566School of Business, Flex-time 5 1 6 128 27 155 27 3 30 206 41 247TOTAL 16 5 21 292 51 343 108 13 121 673 160 833
37 24 61 750 307 1,057 327 122 449 2,010 834 2,844
CFA
TotalWhite Unknown/Other Hispanic
CIT
TOTAL
SCS
Tepper
2.19
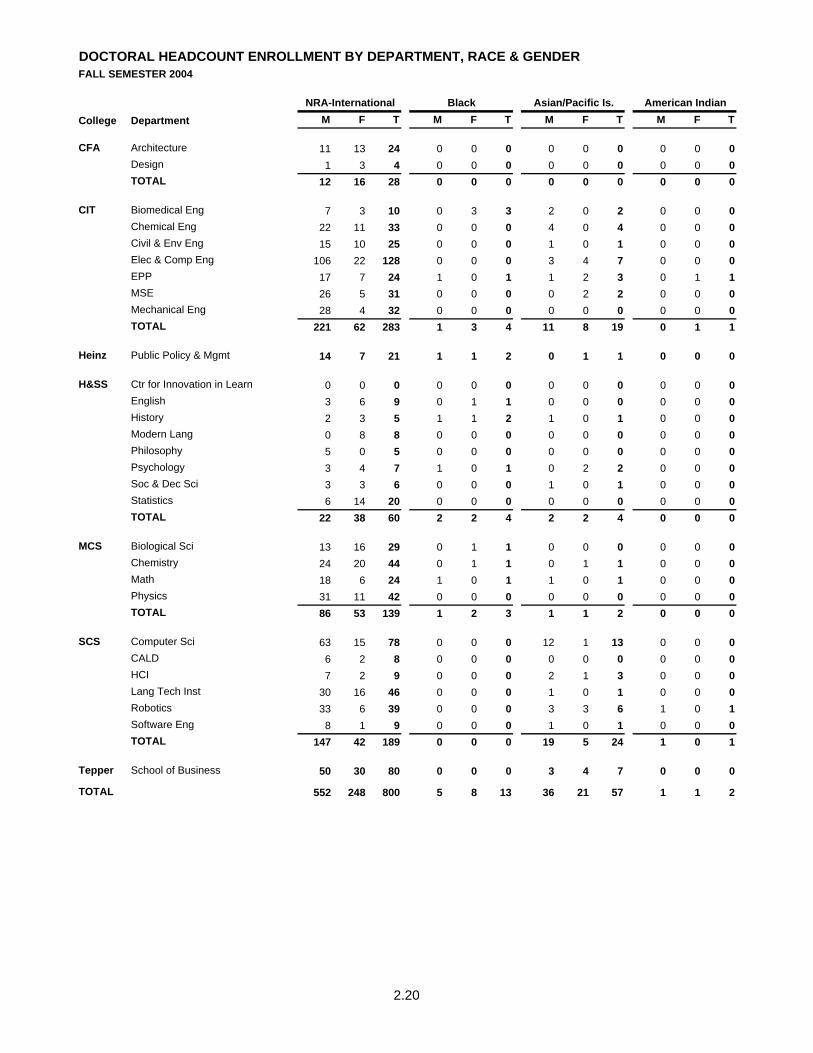
DOCTORAL HEADCOUNT ENROLLMENT BY DEPARTMENT, RACE & GENDERFALL SEMESTER 2004
College Department M F T M F T M F T M F T
Architecture 11 13 24 0 0 0 0 0 0 0 0 0Design 1 3 4 0 0 0 0 0 0 0 0 0TOTAL 12 16 28 0 0 0 0 0 0 0 0 0
Biomedical Eng 7 3 10 0 3 3 2 0 2 0 0 0Chemical Eng 22 11 33 0 0 0 4 0 4 0 0 0Civil & Env Eng 15 10 25 0 0 0 1 0 1 0 0 0Elec & Comp Eng 106 22 128 0 0 0 3 4 7 0 0 0EPP 17 7 24 1 0 1 1 2 3 0 1 1MSE 26 5 31 0 0 0 0 2 2 0 0 0Mechanical Eng 28 4 32 0 0 0 0 0 0 0 0 0TOTAL 221 62 283 1 3 4 11 8 19 0 1 1
Heinz Public Policy & Mgmt 14 7 21 1 1 2 0 1 1 0 0 0
Ctr for Innovation in Learn 0 0 0 0 0 0 0 0 0 0 0 0English 3 6 9 0 1 1 0 0 0 0 0 0History 2 3 5 1 1 2 1 0 1 0 0 0Modern Lang 0 8 8 0 0 0 0 0 0 0 0 0Philosophy 5 0 5 0 0 0 0 0 0 0 0 0Psychology 3 4 7 1 0 1 0 2 2 0 0 0Soc & Dec Sci 3 3 6 0 0 0 1 0 1 0 0 0Statistics 6 14 20 0 0 0 0 0 0 0 0 0TOTAL 22 38 60 2 2 4 2 2 4 0 0 0
Biological Sci 13 16 29 0 1 1 0 0 0 0 0 0Chemistry 24 20 44 0 1 1 0 1 1 0 0 0Math 18 6 24 1 0 1 1 0 1 0 0 0Physics 31 11 42 0 0 0 0 0 0 0 0 0TOTAL 86 53 139 1 2 3 1 1 2 0 0 0
Computer Sci 63 15 78 0 0 0 12 1 13 0 0 0CALD 6 2 8 0 0 0 0 0 0 0 0 0HCI 7 2 9 0 0 0 2 1 3 0 0 0Lang Tech Inst 30 16 46 0 0 0 1 0 1 0 0 0Robotics 33 6 39 0 0 0 3 3 6 1 0 1Software Eng 8 1 9 0 0 0 1 0 1 0 0 0TOTAL 147 42 189 0 0 0 19 5 24 1 0 1
Tepper School of Business 50 30 80 0 0 0 3 4 7 0 0 0
552 248 800 5 8 13 36 21 57 1 1 2
CFA
CIT
American IndianNRA-International Black Asian/Pacific Is.
TOTAL
H&SS
MCS
SCS
2.20

DOCTORAL HEADCOUNT ENROLLMENT BY DEPARTMENT, RACE & GENDER (Cont.)FALL SEMESTER 2004
College Department M F T M F T M F T M F T
Architecture 0 0 0 1 0 1 0 0 0 12 13 25Design 0 0 0 0 0 0 3 0 3 4 3 7TOTAL 0 0 0 1 0 1 3 0 3 16 16 32
Biomedical Eng 0 1 1 3 2 5 0 0 0 12 9 21Chemical Eng 2 2 4 30 6 36 0 0 0 58 19 77Civil & Env Eng 0 0 0 6 4 10 1 0 1 23 14 37Elec & Comp Eng 2 0 2 31 2 33 13 3 16 155 31 186EPP 2 0 2 12 9 21 1 0 1 34 19 53MSE 0 0 0 10 2 12 1 1 2 37 10 47Mechanical Eng 1 0 1 7 2 9 3 0 3 39 6 45TOTAL 7 3 10 99 27 126 19 4 23 358 108 466
Heinz Public Policy & Mgmt 0 0 0 5 1 6 2 1 3 22 11 33
Ctr for Innovation in Learn 0 0 0 0 1 1 0 0 0 0 1 1English 0 0 0 6 9 15 6 7 13 15 23 38History 0 0 0 5 7 12 8 9 17 17 20 37Modern Lang 0 0 0 0 0 0 0 0 0 0 8 8Philosophy 0 0 0 3 1 4 1 0 1 9 1 10Psychology 0 1 1 6 12 18 5 1 6 15 20 35Soc & Dec Sci 0 1 1 4 0 4 3 2 5 11 6 17Statistics 0 0 0 2 2 4 3 3 6 11 19 30TOTAL 0 2 2 26 32 58 26 22 48 78 98 176
Biological Sci 0 0 0 3 5 8 1 0 1 17 22 39Chemistry 1 0 1 14 8 22 3 3 6 42 33 75Math 0 0 0 17 1 18 0 0 0 37 7 44Physics 0 0 0 9 3 12 9 0 9 49 14 63TOTAL 1 0 1 43 17 60 13 3 16 145 76 221
Computer Sci 0 0 0 46 6 52 21 5 26 142 27 169CALD 0 0 0 6 1 7 1 0 1 13 3 16HCI 0 0 0 1 2 3 12 7 19 22 12 34Lang Tech Inst 0 0 0 2 1 3 7 4 11 40 21 61Robotics 1 0 1 32 7 39 6 2 8 76 18 94Software Eng 0 0 0 10 1 11 5 0 5 24 2 26TOTAL 1 0 1 97 18 115 52 18 70 317 83 400
Tepper School of Business 0 0 0 8 2 10 4 1 5 65 37 102
9 5 14 279 97 376 119 49 168 1,001 429 1,430
CIT
TOTAL
TotalWhite Unknown/OtherHispanic
H&SS
MCS
SCS
CFA
2.21

HEADCOUNT ENROLLMENT BY DEPARTMENT, RACE & GENDERFALL SEMESTER 2004
College Department M F T M F T M F T M F T
Architecture 25 34 59 9 5 14 22 26 48 0 1 1Art 1 10 11 1 5 6 12 16 28 0 1 1Design 7 24 31 3 0 3 11 39 50 0 2 2Drama 3 6 9 11 11 22 1 3 4 0 0 0Music 13 21 34 4 6 10 2 7 9 0 1 1Student-Defined Major 0 0 0 2 0 2 0 0 0 0 0 0No Major Dept 1 4 5 1 0 1 1 4 5 0 0 0TOTAL 50 99 149 31 27 58 49 95 144 0 5 5
Biomedical Eng 7 3 10 0 3 3 2 0 2 0 0 0Chemical Eng 43 17 60 6 10 16 29 13 42 0 0 0Civil & Env Eng 29 16 45 2 4 6 10 5 15 0 1 1Elec & Comp Eng 245 63 308 27 9 36 97 40 137 2 3 5EPP 18 7 25 1 0 1 1 2 3 0 1 1Info Networking Inst 125 22 147 1 0 1 12 1 13 0 0 0MSE 37 8 45 0 4 4 5 6 11 0 0 0Mechanical Eng 73 12 85 11 7 18 46 13 59 1 0 1No Major Dept 50 10 60 12 3 15 74 16 90 3 0 3TOTAL 627 158 785 60 40 100 276 96 372 6 5 11
Heinz MS in Public Mgmt 12 4 16 4 10 14 2 0 2 0 0 0Public Policy & Mgmt 51 38 89 9 17 26 11 15 26 0 0 0Special MS in Public Mgmt 1 0 1 0 2 2 0 1 1 0 0 0TOTAL 64 42 106 13 29 42 13 16 29 0 0 0
H&SS Ctr for Innovation in Learn 0 0 0 0 0 0 0 0 0 0 0 0Economics 8 4 12 3 1 4 19 8 27 0 0 0English 5 8 13 1 9 10 4 15 19 0 0 0History 3 3 6 3 3 6 2 4 6 0 0 0IS Program 19 11 30 10 1 11 52 26 78 1 0 1Modern Lang 1 8 9 1 2 3 0 1 1 0 0 0Philosophy 11 3 14 2 2 4 4 0 4 0 0 0Psychology 4 7 11 6 4 10 7 25 32 0 0 0Soc & Dec Sci 5 5 10 7 2 9 11 12 23 0 0 0Statistics 7 16 23 0 0 0 6 2 8 0 0 0Student-Defined Major 0 0 0 0 0 0 0 0 0 0 0 0No Major Dept 23 15 38 6 16 22 60 38 98 1 1 2TOTAL 86 80 166 39 40 79 165 131 296 2 1 3
Inter- Entertainment Tech 14 4 18 2 1 3 5 2 7 0 0 0disciplinary Humanities & Arts (BHA) 0 0 0 1 2 3 0 5 5 0 0 0
Info Sys Mgmt 80 41 121 4 0 4 11 6 17 0 0 0Info Tech 21 5 26 3 3 6 9 5 14 2 0 2Integrated Product Dev 0 0 0 0 0 0 0 0 0 0 0 0Sci & Arts (BSA) 0 0 0 0 1 1 1 0 1 0 0 0Sci & Humanities Scholars (SHS) 4 2 6 1 2 3 22 26 48 0 0 0CMU West 19 8 27 2 1 3 16 8 24 0 0 0TOTAL 138 60 198 13 10 23 64 52 116 2 0 2
Biological Sci 21 25 46 1 6 7 23 33 56 0 1 1Chemistry 25 21 46 1 5 6 14 12 26 1 0 1Math 22 7 29 3 0 3 19 5 24 1 0 1Physics 36 11 47 0 0 0 5 2 7 0 1 1No Major Dept 9 10 19 3 2 5 16 27 43 2 0 2TOTAL 113 74 187 8 13 21 77 79 156 4 2 6
Computer Sci 129 34 163 15 6 21 91 57 148 1 1 2CALD 7 2 9 0 0 0 0 0 0 0 0 0HCI 12 5 17 0 0 0 7 6 13 0 0 0Lang Tech Inst 44 20 64 0 0 0 2 0 2 0 0 0Robotics 47 9 56 0 0 0 6 4 10 1 0 1Software Eng 51 9 60 2 1 3 8 1 9 1 0 1TOTAL 290 79 369 17 7 24 114 68 182 3 1 4
Business Admin 45 27 72 15 9 24 79 97 176 3 0 3Electronic Commerce 1 0 1 0 1 1 0 0 0 0 0 0School of Business 194 68 262 6 1 7 63 44 107 0 1 1School of Business, Flex-time 24 4 28 2 3 5 20 3 23 0 0 0TOTAL 264 99 363 23 14 37 162 144 306 3 1 4
CMU-Q Qatar Business Admin 2 15 17 0 0 0 0 0 0 0 0 0Qatar Comp Sci 7 14 21 0 0 0 0 0 0 0 0 0TOTAL 9 29 38 0 0 0 0 0 0 0 0 0
Special Special 37 21 58 1 0 1 5 1 6 0 0 0
1,678 741 2,419 205 180 385 925 682 1,607 20 15 35
CFA
CIT
American IndianNRA-International Black Asian/Pacific Is.
Tepper
TOTAL
MCS
SCS
2.22

HEADCOUNT ENROLLMENT BY DEPARTMENT, RACE & GENDER (Cont.)FALL SEMESTER 2004
College Department M F T M F T M F T M F T
Architecture 8 10 18 69 57 126 15 14 29 148 147 295Art 6 4 10 38 51 89 13 15 28 71 102 173Design 4 7 11 43 53 96 7 11 18 75 136 211Drama 2 9 11 93 76 169 15 19 34 125 124 249Music 5 4 9 47 53 100 36 30 66 107 122 229Student-Defined Major 0 0 0 1 0 1 0 0 0 3 0 3No Major Dept 0 1 1 5 1 6 0 0 0 8 10 18TOTAL 25 35 60 296 291 587 86 89 175 537 641 1,178
Biomedical Eng 0 1 1 3 2 5 0 0 0 12 9 21Chemical Eng 5 5 10 78 39 117 9 2 11 170 86 256Civil & Env Eng 5 2 7 43 30 73 9 5 14 98 63 161Elec & Comp Eng 26 2 28 162 25 187 51 8 59 610 150 760EPP 2 0 2 12 9 21 1 0 1 35 19 54Info Networking Inst 0 1 1 23 2 25 5 1 6 166 27 193MSE 1 1 2 33 15 48 5 7 12 81 41 122Mechanical Eng 18 2 20 162 33 195 34 6 40 345 73 418No Major Dept 17 7 24 118 37 155 30 16 46 304 89 393TOTAL 74 21 95 634 192 826 144 45 189 1,821 557 2,378
Heinz MS in Public Mgmt 1 1 2 58 58 116 19 15 34 96 88 184Public Policy & Mgmt 3 9 12 61 60 121 22 16 38 157 155 312Special MS in Public Mgmt 0 0 0 3 5 8 0 1 1 4 9 13TOTAL 4 10 14 122 123 245 41 32 73 257 252 509
H&SS Ctr for Innovation in Learn 0 0 0 0 1 1 0 0 0 0 1 1Economics 3 0 3 19 6 25 4 3 7 56 22 78English 2 7 9 39 64 103 12 35 47 63 138 201History 1 4 5 14 26 40 9 14 23 32 54 86IS Program 5 0 5 63 11 74 18 7 25 168 56 224Modern Lang 1 0 1 3 4 7 1 2 3 7 17 24Philosophy 0 1 1 21 11 32 7 2 9 45 19 64Psychology 7 8 15 26 43 69 7 7 14 57 94 151Soc & Dec Sci 2 3 5 28 9 37 10 8 18 63 39 102Statistics 0 1 1 8 8 16 3 5 8 24 32 56Student-Defined Major 0 0 0 1 2 3 0 0 0 1 2 3No Major Dept 8 5 13 73 49 122 17 14 31 188 138 326TOTAL 29 29 58 295 234 529 88 97 185 704 612 1,316
Inter- Entertainment Tech 1 0 1 31 13 44 8 4 12 61 24 85disciplinary Humanities & Arts (BHA) 1 2 3 11 25 36 3 8 11 16 42 58
Info Sys Mgmt 0 0 0 9 0 9 5 2 7 109 49 158Info Tech 0 1 1 73 16 89 24 4 28 132 34 166Integrated Product Dev 0 0 0 1 1 2 4 0 4 5 1 6Sci & Arts (BSA) 0 0 0 2 10 12 1 2 3 4 13 17Sci & Humanities Scholars (SHS) 4 5 9 40 42 82 10 13 23 81 90 171CMU West 4 1 5 32 7 39 49 18 67 122 43 165TOTAL 10 9 19 199 114 313 104 51 155 530 296 826
Biological Sci 2 3 5 21 40 61 9 13 22 77 121 198Chemistry 2 2 4 32 34 66 7 5 12 82 79 161Math 1 0 1 51 13 64 7 0 7 104 25 129Physics 2 1 3 58 7 65 26 6 32 127 28 155No Major Dept 6 4 10 54 38 92 20 15 35 110 96 206TOTAL 13 10 23 216 132 348 69 39 108 500 349 849
Computer Sci 31 2 33 208 47 255 67 16 83 542 163 705CALD 0 0 0 6 1 7 1 0 1 14 3 17HCI 0 0 0 13 11 24 14 10 24 46 32 78Lang Tech Inst 0 0 0 2 1 3 15 5 20 63 26 89Robotics 2 0 2 42 7 49 9 2 11 107 22 129Software Eng 4 1 5 40 3 43 23 5 28 129 20 149TOTAL 37 3 40 311 70 381 129 38 167 901 266 1,167
Business Admin 16 10 26 96 35 131 27 6 33 281 184 465Electronic Commerce 1 2 3 13 0 13 1 0 1 16 3 19School of Business 10 2 12 159 26 185 84 10 94 516 152 668School of Business, Flex-time 5 1 6 128 27 155 27 3 30 206 41 247TOTAL 32 15 47 396 88 484 139 19 158 1,019 380 1,399
CMU-Q Qatar Business Admin 0 0 0 0 0 0 1 1 2 3 16 19Qatar Comp Sci 0 0 0 0 0 0 1 0 1 8 14 22TOTAL 0 0 0 0 0 0 2 1 3 11 30 41
Special Special 3 0 3 23 25 48 13 11 24 82 58 140
227 132 359 2,492 1,269 2,761 815 422 1,237 6,362 3,441 9,803
CFA
TotalWhite Unknown/OtherHispanic
CIT
TOTAL
MCS
SCS
Tepper
2.23

UNDERGRADUATE HEADCOUNT ENROLLMENT BY DEPARTMENT, RACE & STATUSFALL SEMESTER 2004
College Department FT PT Total FT PT Total FT PT Total FT PT Total
Architecture 30 1 31 14 0 14 47 0 47 1 0 1Art 8 0 8 6 0 6 28 0 28 1 0 1Design 22 0 22 3 0 3 41 2 43 2 0 2Drama 2 0 2 20 0 20 4 0 4 0 0 0Music 5 0 5 8 0 8 7 0 7 1 0 1Student-Defined Major 0 0 0 2 0 2 0 0 0 0 0 0No Major Dept 5 0 5 1 0 1 5 0 5 0 0 0TOTAL 72 1 73 54 0 54 132 2 134 5 0 5
Chemical Eng 16 0 16 14 0 14 35 1 36 0 0 0Civil & Env Eng 6 0 6 4 0 4 12 0 12 1 0 1Elec & Comp Eng 133 2 135 34 1 35 113 4 117 3 0 3MSE 4 0 4 4 0 4 9 0 9 0 0 0Mechanical Eng 32 1 33 14 2 16 54 2 56 1 0 1No Major Dept 60 0 60 15 0 15 90 0 90 3 0 3TOTAL 251 3 254 85 3 88 313 7 320 8 0 8
H&SS Economics 12 0 12 4 0 4 27 0 27 0 0 0English 0 0 0 7 1 8 18 0 18 0 0 0History 1 0 1 4 0 4 4 1 5 0 0 0IS Program 30 0 30 11 0 11 77 1 78 1 0 1Modern Lang 0 0 0 3 0 3 1 0 1 0 0 0Philosophy 0 0 0 4 0 4 4 0 4 0 0 0Psychology 4 0 4 9 0 9 28 2 30 0 0 0Soc & Dec Sci 4 0 4 9 0 9 20 2 22 0 0 0Statistics 0 0 0 0 0 0 4 0 4 0 0 0Student-Defined Major 0 0 0 0 0 0 0 0 0 0 0 0No Major Dept 38 0 38 22 0 22 97 1 98 2 0 2TOTAL 89 0 89 73 1 74 280 7 287 3 0 3
Inter- Entertainment Tech 0 0 0 0 0 0 0 0 0 0 0 0disciplinary Humanities & Arts (BHA) 0 0 0 3 0 3 5 0 5 0 0 0
Sci & Arts (BSA) 0 0 0 1 0 1 1 0 1 0 0 0Sci & Humanities Scholars (SHS) 6 0 6 3 0 3 48 0 48 0 0 0TOTAL 6 0 6 7 0 7 54 0 54 0 0 0
Biological Sci 13 0 13 5 1 6 56 0 56 1 0 1Chemistry 2 0 2 5 0 5 25 0 25 1 0 1Math 5 0 5 2 0 2 21 2 23 1 0 1Physics 5 0 5 0 0 0 7 0 7 0 1 1No Major Dept 19 0 19 5 0 5 43 0 43 2 0 2TOTAL 44 0 44 17 1 18 152 2 154 5 1 6
SCS Computer Sci 83 1 84 20 1 21 133 1 134 2 0 2
Tepper Business Admin 69 3 72 23 1 24 173 3 176 3 0 3
CMU-Q Qatar Business Admin 17 0 17 0 0 0 0 0 0 0 0 0Qatar Comp Sci 21 0 21 0 0 0 0 0 0 0 0 0TOTAL 38 0 38 0 0 0 0 0 0 0 0 0
652 8 660 279 7 286 1,237 22 1,259 26 1 27
American IndianNRA-International Black Asian/Pacific Is.
TOTAL
MCS
CIT
CFA
2.24

UNDERGRADUATE HEADCOUNT ENROLLMENT BY DEPARTMENT, RACE & STATUS (Cont.)FALL SEMESTER 2004
College Department FT PT Total FT PT Total FT PT Total FT PT Total
Architecture 18 0 18 117 3 120 29 0 29 256 4 260Art 9 0 9 75 1 76 28 0 28 155 1 156Design 11 0 11 78 5 83 13 1 14 170 8 178Drama 9 0 9 129 8 137 23 1 24 187 9 196Music 8 0 8 86 2 88 23 1 24 138 3 141Student-Defined Major 0 0 0 1 0 1 0 0 0 3 0 3No Major Dept 1 0 1 6 0 6 0 0 0 18 0 18TOTAL 56 0 56 492 19 511 116 3 119 927 25 952
Chemical Eng 6 0 6 74 0 74 9 0 9 154 1 155Civil & Env Eng 7 0 7 47 0 47 11 1 12 88 1 89Elec & Comp Eng 23 0 23 122 2 124 32 2 34 460 11 471MSE 2 0 2 31 1 32 8 1 9 58 2 60Mechanical Eng 18 0 18 159 5 164 31 2 33 309 12 321No Major Dept 24 0 24 155 0 155 46 0 46 393 0 393TOTAL 80 0 80 588 8 596 137 6 143 1,462 27 1,489
H&SS Economics 3 0 3 22 3 25 7 0 7 75 3 78English 6 0 6 54 3 57 15 1 16 100 5 105History 5 0 5 26 2 28 6 0 6 46 3 49IS Program 5 0 5 70 3 73 23 2 25 217 6 223Modern Lang 1 0 1 4 2 6 3 0 3 12 2 14Philosophy 1 0 1 19 1 20 6 0 6 34 1 35Psychology 13 1 14 51 0 51 8 0 8 113 3 116Soc & Dec Sci 4 0 4 29 4 33 13 0 13 79 6 85Statistics 1 0 1 4 0 4 2 0 2 11 0 11Student-Defined Major 0 0 0 3 0 3 0 0 0 3 0 3No Major Dept 11 2 13 120 2 122 31 0 31 321 5 326TOTAL 50 3 53 402 20 422 114 3 117 1,011 34 1,045
Inter- Entertainment Tech 0 0 0 0 0 0 0 0 0 0 0 0disciplinary Humanities & Arts (BHA) 2 1 3 35 1 36 11 0 11 56 2 58
Sci & Arts (BSA) 0 0 0 10 2 12 3 0 3 15 2 17Sci & Humanities Scholars (SHS) 7 2 9 81 1 82 23 0 23 168 3 171TOTAL 9 3 12 126 4 130 37 0 37 239 7 246
Biological Sci 4 0 4 51 1 52 18 1 19 148 3 151Chemistry 3 0 3 43 1 44 6 0 6 85 1 86Math 1 0 1 45 1 46 7 0 7 82 3 85Physics 3 0 3 50 3 53 23 0 23 88 4 92No Major Dept 10 0 10 90 2 92 34 1 35 203 3 206TOTAL 21 0 21 279 8 287 88 2 90 606 14 620
SCS Computer Sci 33 0 33 196 7 203 51 4 55 518 14 532
Tepper Business Admin 26 0 26 128 3 131 28 4 32 450 14 464
CMU-Q Qatar Business Admin 0 0 0 0 0 0 2 0 2 19 0 19Qatar Comp Sci 0 0 0 0 0 0 1 0 1 22 0 22TOTAL 0 0 0 0 0 0 3 0 3 41 0 41
275 6 281 2,211 69 2,280 574 22 596 5,254 135 5,389
Hispanic White Unknown/Other Total
MCS
TOTAL
CFA
CIT
2.25
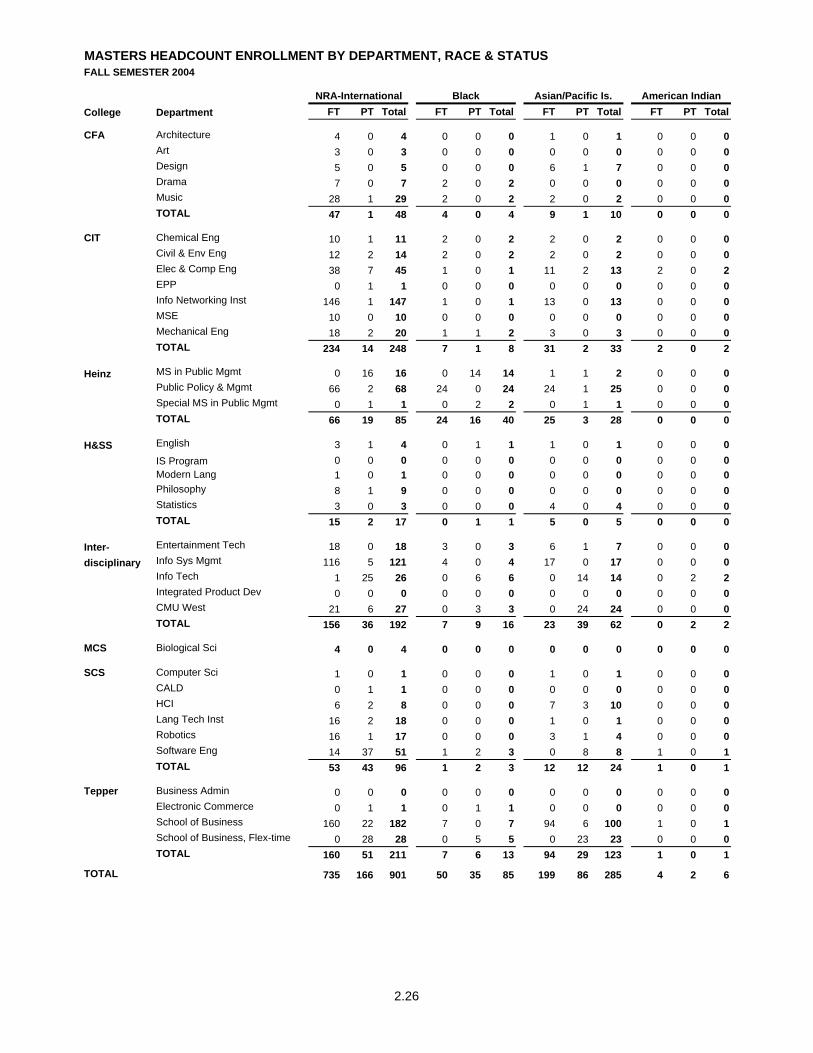
MASTERS HEADCOUNT ENROLLMENT BY DEPARTMENT, RACE & STATUSFALL SEMESTER 2004
College Department FT PT Total FT PT Total FT PT Total FT PT Total
Architecture 4 0 4 0 0 0 1 0 1 0 0 0Art 3 0 3 0 0 0 0 0 0 0 0 0Design 5 0 5 0 0 0 6 1 7 0 0 0Drama 7 0 7 2 0 2 0 0 0 0 0 0Music 28 1 29 2 0 2 2 0 2 0 0 0TOTAL 47 1 48 4 0 4 9 1 10 0 0 0
Chemical Eng 10 1 11 2 0 2 2 0 2 0 0 0Civil & Env Eng 12 2 14 2 0 2 2 0 2 0 0 0Elec & Comp Eng 38 7 45 1 0 1 11 2 13 2 0 2EPP 0 1 1 0 0 0 0 0 0 0 0 0Info Networking Inst 146 1 147 1 0 1 13 0 13 0 0 0MSE 10 0 10 0 0 0 0 0 0 0 0 0Mechanical Eng 18 2 20 1 1 2 3 0 3 0 0 0TOTAL 234 14 248 7 1 8 31 2 33 2 0 2
Heinz MS in Public Mgmt 0 16 16 0 14 14 1 1 2 0 0 0Public Policy & Mgmt 66 2 68 24 0 24 24 1 25 0 0 0Special MS in Public Mgmt 0 1 1 0 2 2 0 1 1 0 0 0TOTAL 66 19 85 24 16 40 25 3 28 0 0 0
H&SS English 3 1 4 0 1 1 1 0 1 0 0 0IS Program 0 0 0 0 0 0 0 0 0 0 0 0Modern Lang 1 0 1 0 0 0 0 0 0 0 0 0Philosophy 8 1 9 0 0 0 0 0 0 0 0 0Statistics 3 0 3 0 0 0 4 0 4 0 0 0TOTAL 15 2 17 0 1 1 5 0 5 0 0 0
Inter- Entertainment Tech 18 0 18 3 0 3 6 1 7 0 0 0disciplinary Info Sys Mgmt 116 5 121 4 0 4 17 0 17 0 0 0
Info Tech 1 25 26 0 6 6 0 14 14 0 2 2Integrated Product Dev 0 0 0 0 0 0 0 0 0 0 0 0CMU West 21 6 27 0 3 3 0 24 24 0 0 0TOTAL 156 36 192 7 9 16 23 39 62 0 2 2
MCS Biological Sci 4 0 4 0 0 0 0 0 0 0 0 0
Computer Sci 1 0 1 0 0 0 1 0 1 0 0 0CALD 0 1 1 0 0 0 0 0 0 0 0 0HCI 6 2 8 0 0 0 7 3 10 0 0 0Lang Tech Inst 16 2 18 0 0 0 1 0 1 0 0 0Robotics 16 1 17 0 0 0 3 1 4 0 0 0Software Eng 14 37 51 1 2 3 0 8 8 1 0 1TOTAL 53 43 96 1 2 3 12 12 24 1 0 1
Business Admin 0 0 0 0 0 0 0 0 0 0 0 0Electronic Commerce 0 1 1 0 1 1 0 0 0 0 0 0School of Business 160 22 182 7 0 7 94 6 100 1 0 1School of Business, Flex-time 0 28 28 0 5 5 0 23 23 0 0 0TOTAL 160 51 211 7 6 13 94 29 123 1 0 1
735 166 901 50 35 85 199 86 285 4 2 6
CFA
American IndianNRA-International Black Asian/Pacific Is.
Tepper
TOTAL
SCS
CIT
2.26

MASTERS HEADCOUNT ENROLLMENT BY DEPARTMENT, RACE & STATUS (Cont.)FALL SEMESTER 2004
College Department FT PT Total FT PT Total FT PT Total FT PT Total
Architecture 0 0 0 4 1 5 0 0 0 9 1 10Art 1 0 1 13 0 13 0 0 0 17 0 17Design 0 0 0 12 1 13 1 0 1 24 2 26Drama 1 1 2 31 1 32 9 1 10 50 3 53Music 1 0 1 11 1 12 38 4 42 82 6 88TOTAL 3 1 4 71 4 75 48 5 53 182 12 194
Chemical Eng 0 0 0 1 6 7 0 2 2 15 9 24Civil & Env Eng 0 0 0 15 1 16 1 0 1 32 3 35Elec & Comp Eng 2 1 3 24 6 30 7 2 9 85 18 103EPP 0 0 0 0 0 0 0 0 0 0 1 1Info Networking Inst 1 0 1 23 2 25 6 0 6 190 3 193MSE 0 0 0 3 1 4 0 1 1 13 2 15Mechanical Eng 1 0 1 19 3 22 4 0 4 46 6 52TOTAL 4 1 5 85 19 104 18 5 23 381 42 423
Heinz MS in Public Mgmt 0 2 2 17 99 116 3 31 34 21 163 184Public Policy & Mgmt 12 0 12 112 3 115 33 2 35 271 8 279Special MS in Public Mgmt 0 0 0 0 8 8 0 1 1 0 13 13TOTAL 12 2 14 129 110 239 36 34 70 292 184 476
H&SS English 3 0 3 26 5 31 16 2 18 49 9 58IS Program 0 0 0 1 0 1 0 0 0 1 0 1Modern Lang 0 0 0 0 1 1 0 0 0 1 1 2Philosophy 0 0 0 7 1 8 0 2 2 15 4 19Statistics 0 0 0 8 0 8 0 0 0 15 0 15TOTAL 3 0 3 42 7 49 16 4 20 81 14 95
Inter- Entertainment Tech 1 0 1 39 5 44 10 2 12 77 8 85disciplinary Info Sys Mgmt 0 0 0 9 0 9 7 0 7 153 5 158
Info Tech 0 1 1 1 88 89 0 28 28 2 164 166Integrated Product Dev 0 0 0 2 0 2 4 0 4 6 0 6CMU West 1 4 5 4 35 39 3 64 67 29 136 165TOTAL 2 5 7 55 128 183 24 94 118 267 313 580
MCS Biological Sci 1 0 1 1 0 1 2 0 2 8 0 8
Computer Sci 0 0 0 0 0 0 2 0 2 4 0 4CALD 0 0 0 0 0 0 0 0 0 0 1 1HCI 0 0 0 13 8 21 2 3 5 28 16 44Lang Tech Inst 0 0 0 0 0 0 8 1 9 25 3 28Robotics 1 0 1 8 2 10 3 0 3 31 4 35Software Eng 0 5 5 3 29 32 3 20 23 22 101 123TOTAL 1 5 6 24 39 63 18 24 42 110 125 235
Business Admin 0 0 0 0 0 0 1 0 1 1 0 1Electronic Commerce 0 3 3 0 13 13 0 1 1 0 19 19School of Business 12 0 12 164 11 175 46 43 89 484 82 566School of Business, Flex-time 0 6 6 0 155 155 0 30 30 0 247 247TOTAL 12 9 21 164 179 343 47 74 121 485 348 833
38 23 61 571 486 1,057 209 240 449 1,806 1,038 2,844
Hispanic TotalWhite Unknown/Other
TOTAL
SCS
Tepper
CFA
CIT
2.27
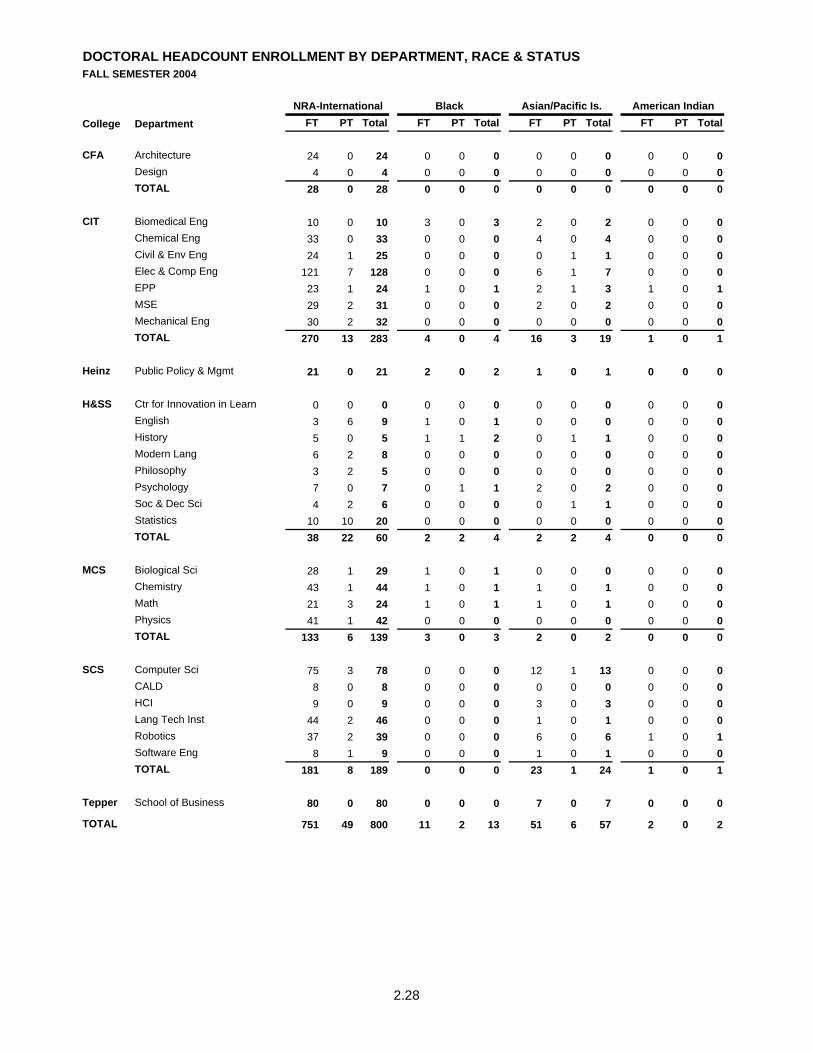
DOCTORAL HEADCOUNT ENROLLMENT BY DEPARTMENT, RACE & STATUSFALL SEMESTER 2004
College Department FT PT Total FT PT Total FT PT Total FT PT Total
Architecture 24 0 24 0 0 0 0 0 0 0 0 0Design 4 0 4 0 0 0 0 0 0 0 0 0TOTAL 28 0 28 0 0 0 0 0 0 0 0 0
Biomedical Eng 10 0 10 3 0 3 2 0 2 0 0 0Chemical Eng 33 0 33 0 0 0 4 0 4 0 0 0Civil & Env Eng 24 1 25 0 0 0 0 1 1 0 0 0Elec & Comp Eng 121 7 128 0 0 0 6 1 7 0 0 0EPP 23 1 24 1 0 1 2 1 3 1 0 1MSE 29 2 31 0 0 0 2 0 2 0 0 0Mechanical Eng 30 2 32 0 0 0 0 0 0 0 0 0TOTAL 270 13 283 4 0 4 16 3 19 1 0 1
Public Policy & Mgmt 21 0 21 2 0 2 1 0 1 0 0 0
Ctr for Innovation in Learn 0 0 0 0 0 0 0 0 0 0 0 0English 3 6 9 1 0 1 0 0 0 0 0 0History 5 0 5 1 1 2 0 1 1 0 0 0Modern Lang 6 2 8 0 0 0 0 0 0 0 0 0Philosophy 3 2 5 0 0 0 0 0 0 0 0 0Psychology 7 0 7 0 1 1 2 0 2 0 0 0Soc & Dec Sci 4 2 6 0 0 0 0 1 1 0 0 0Statistics 10 10 20 0 0 0 0 0 0 0 0 0TOTAL 38 22 60 2 2 4 2 2 4 0 0 0
Biological Sci 28 1 29 1 0 1 0 0 0 0 0 0Chemistry 43 1 44 1 0 1 1 0 1 0 0 0Math 21 3 24 1 0 1 1 0 1 0 0 0Physics 41 1 42 0 0 0 0 0 0 0 0 0TOTAL 133 6 139 3 0 3 2 0 2 0 0 0
Computer Sci 75 3 78 0 0 0 12 1 13 0 0 0CALD 8 0 8 0 0 0 0 0 0 0 0 0HCI 9 0 9 0 0 0 3 0 3 0 0 0Lang Tech Inst 44 2 46 0 0 0 1 0 1 0 0 0Robotics 37 2 39 0 0 0 6 0 6 1 0 1Software Eng 8 1 9 0 0 0 1 0 1 0 0 0TOTAL 181 8 189 0 0 0 23 1 24 1 0 1
School of Business 80 0 80 0 0 0 7 0 7 0 0 0
751 49 800 11 2 13 51 6 57 2 0 2
Asian/Pacific Is.
CFA
American Indian
CIT
Heinz
NRA-International Black
TOTAL
H&SS
MCS
SCS
Tepper
2.28

DOCTORAL HEADCOUNT ENROLLMENT BY DEPARTMENT, RACE & STATUS (Cont.)FALL SEMESTER 2004
College Department FT PT Total FT PT Total FT PT Total FT PT Total
Architecture 0 0 0 1 0 1 0 0 0 25 0 25Design 0 0 0 0 0 0 3 0 3 7 0 7TOTAL 0 0 0 1 0 1 3 0 3 32 0 32
Biomedical Eng 1 0 1 5 0 5 0 0 0 21 0 21Chemical Eng 4 0 4 35 1 36 0 0 0 76 1 77Civil & Env Eng 0 0 0 5 5 10 0 1 1 29 8 37Elec & Comp Eng 2 0 2 32 1 33 15 1 16 176 10 186EPP 1 1 2 18 3 21 1 0 1 47 6 53MSE 0 0 0 11 1 12 2 0 2 44 3 47Mechanical Eng 1 0 1 8 1 9 2 1 3 41 4 45TOTAL 9 1 10 114 12 126 20 3 23 434 32 466
Public Policy & Mgmt 0 0 0 6 0 6 3 0 3 33 0 33
Ctr for Innovation in Learn 0 0 0 0 1 1 0 0 0 0 1 1English 0 0 0 5 10 15 4 9 13 13 25 38History 0 0 0 6 6 12 5 12 17 17 20 37Modern Lang 0 0 0 0 0 0 0 0 0 6 2 8Philosophy 0 0 0 4 0 4 0 1 1 7 3 10Psychology 1 0 1 15 3 18 5 1 6 30 5 35Soc & Dec Sci 0 1 1 1 3 4 4 1 5 9 8 17Statistics 0 0 0 4 0 4 3 3 6 17 13 30TOTAL 1 1 2 35 23 58 21 27 48 99 77 176
Biological Sci 0 0 0 8 0 8 1 0 1 38 1 39Chemistry 1 0 1 22 0 22 6 0 6 74 1 75Math 0 0 0 18 0 18 0 0 0 41 3 44Physics 0 0 0 12 0 12 9 0 9 62 1 63TOTAL 1 0 1 60 0 60 16 0 16 215 6 221
Computer Sci 0 0 0 49 3 52 24 2 26 160 9 169CALD 0 0 0 7 0 7 1 0 1 16 0 16HCI 0 0 0 3 0 3 19 0 19 34 0 34Lang Tech Inst 0 0 0 3 0 3 11 0 11 59 2 61Robotics 1 0 1 39 0 39 8 0 8 92 2 94Software Eng 0 0 0 11 0 11 5 0 5 25 1 26TOTAL 1 0 1 112 3 115 68 2 70 386 14 400
School of Business 0 0 0 10 0 10 5 0 5 102 0 102
12 2 14 338 38 376 136 32 168 1,301 129 1,430
Hispanic White Unknown/Other Total
CFA
CIT
Heinz
H&SS
MCS
SCS
Tepper
TOTAL
2.29

HEADCOUNT ENROLLMENT BY DEPARTMENT, RACE & STATUSFALL SEMESTER 2004
College Department FT PT Total FT PT Total FT PT Total FT PT TotalArchitecture 58 1 59 14 0 14 48 0 48 1 0 1Art 11 0 11 6 0 6 28 0 28 1 0 1Design 31 0 31 3 0 3 47 3 50 2 0 2Drama 9 0 9 22 0 22 4 0 4 0 0 0Music 33 1 34 10 0 10 9 0 9 1 0 1Student-Defined Major 0 0 0 2 0 2 0 0 0 0 0 0No Major Dept 5 0 5 1 0 1 5 0 5 0 0 0TOTAL 147 2 149 58 0 58 141 3 144 5 0 5Biomedical Eng 10 0 10 3 0 3 2 0 2 0 0 0Chemical Eng 59 1 60 16 0 16 41 1 42 0 0 0Civil & Env Eng 42 3 45 6 0 6 14 1 15 1 0 1Elec & Comp Eng 292 16 308 35 1 36 130 7 137 5 0 5EPP 23 2 25 1 0 1 2 1 3 1 0 1Info Networking Inst 146 1 147 1 0 1 13 0 13 0 0 0MSE 43 2 45 4 0 4 11 0 11 0 0 0Mechanical Eng 80 5 85 15 3 18 57 2 59 1 0 1No Major Dept 60 0 60 15 0 15 90 0 90 3 0 3TOTAL 755 30 785 96 4 100 360 12 372 11 0 11
Heinz MS in Public Mgmt 0 16 16 0 14 14 1 1 2 0 0 0Public Policy & Mgmt 87 2 89 26 0 26 25 1 26 0 0 0Special MS in Public Mgmt 0 1 1 0 2 2 0 1 1 0 0 0TOTAL 87 19 106 26 16 42 26 3 29 0 0 0
H&SS Ctr for Innovation in Learn 0 0 0 0 0 0 0 0 0 0 0 0Economics 12 0 12 4 0 4 27 0 27 0 0 0English 6 7 13 8 2 10 19 0 19 0 0 0History 6 0 6 5 1 6 4 2 6 0 0 0IS Program 30 0 30 11 0 11 77 1 78 1 0 1Modern Lang 7 2 9 3 0 3 1 0 1 0 0 0Philosophy 11 3 14 4 0 4 4 0 4 0 0 0Psychology 11 0 11 9 1 10 30 2 32 0 0 0Soc & Dec Sci 8 2 10 9 0 9 20 3 23 0 0 0Statistics 13 10 23 0 0 0 8 0 8 0 0 0Student-Defined Major 0 0 0 0 0 0 0 0 0 0 0 0No Major Dept 38 0 38 22 0 22 97 1 98 2 0 2TOTAL 142 24 166 75 4 79 287 9 296 3 0 3
Inter- Entertainment Tech 18 0 18 3 0 3 6 1 7 0 0 0disciplinary Humanities & Arts (BHA) 0 0 0 3 0 3 5 0 5 0 0 0
Info Sys Mgmt 116 5 121 4 0 4 17 0 17 0 0 0Info Tech 1 25 26 0 6 6 0 14 14 0 2 2Integrated Product Dev 0 0 0 0 0 0 0 0 0 0 0 0Sci & Arts (BSA) 0 0 0 1 0 1 1 0 1 0 0 0Sci & Humanities Scholars (SHS) 6 0 6 3 0 3 48 0 48 0 0 0CMU West 21 6 27 0 3 3 0 24 24 0 0 0TOTAL 162 36 198 14 9 23 77 39 116 0 2 2Biological Sci 45 1 46 6 1 7 56 0 56 1 0 1Chemistry 45 1 46 6 0 6 26 0 26 1 0 1Math 26 3 29 3 0 3 22 2 24 1 0 1Physics 46 1 47 0 0 0 7 0 7 0 1 1No Major Dept 19 0 19 5 0 5 43 0 43 2 0 2TOTAL 181 6 187 20 1 21 154 2 156 5 1 6Computer Sci 159 4 163 20 1 21 146 2 148 2 0 2CALD 8 1 9 0 0 0 0 0 0 0 0 0HCI 15 2 17 0 0 0 10 3 13 0 0 0Lang Tech Inst 60 4 64 0 0 0 2 0 2 0 0 0Robotics 53 3 56 0 0 0 9 1 10 1 0 1Software Eng 22 38 60 1 2 3 1 8 9 1 0 1TOTAL 317 52 369 21 3 24 168 14 182 4 0 4Business Admin 69 3 72 23 1 24 173 3 176 3 0 3Electronic Commerce 0 1 1 0 1 1 0 0 0 0 0 0School of Business 240 22 262 7 0 7 101 6 107 1 0 1School of Business, Flex-time 0 28 28 0 5 5 0 23 23 0 0 0TOTAL 309 54 363 30 7 37 274 32 306 4 0 4
CMU-Q Qatar Business Admin 17 0 17 0 0 0 0 0 0 0 0 0Qatar Comp Sci 21 0 21 0 0 0 0 0 0 0 0 0TOTAL 38 0 38 0 0 0 0 0 0 0 0 0
Special 2 56 58 0 1 1 0 6 6 0 0 02,140 279 2,419 340 45 385 1,487 120 1,607 32 3 35
CIT
American IndianNRA-International Black Asian/Pacific Is.
CFA
Tepper
TOTAL
MCS
SCS
2.30

HEADCOUNT ENROLLMENT BY DEPARTMENT, RACE & STATUS (Cont.)FALL SEMESTER 2004
College Department FT PT Total FT PT Total FT PT Total FT PT TotalArchitecture 18 0 18 122 4 126 29 0 29 290 5 295Art 10 0 10 88 1 89 28 0 28 172 1 173Design 11 0 11 90 6 96 17 1 18 201 10 211Drama 10 1 11 160 9 169 32 2 34 237 12 249Music 9 0 9 97 3 100 61 5 66 220 9 229Student-Defined Major 0 0 0 1 0 1 0 0 0 3 0 3No Major Dept 1 0 1 6 0 6 0 0 0 18 0 18TOTAL 59 1 60 564 23 587 167 8 175 1,141 37 1,178Biomedical Eng 1 0 1 5 0 5 0 0 0 21 0 21Chemical Eng 10 0 10 110 7 117 9 2 11 245 11 256Civil & Env Eng 7 0 7 67 6 73 12 2 14 149 12 161Elec & Comp Eng 27 1 28 178 9 187 54 5 59 721 39 760EPP 1 1 2 18 3 21 1 0 1 47 7 54Info Networking Inst 1 0 1 23 2 25 6 0 6 190 3 193MSE 2 0 2 45 3 48 10 2 12 115 7 122Mechanical Eng 20 0 20 186 9 195 37 3 40 396 22 418No Major Dept 24 0 24 155 0 155 46 0 46 393 0 393TOTAL 93 2 95 787 39 826 175 14 189 2,277 101 2,378
Heinz MS in Public Mgmt 0 2 2 17 99 116 3 31 34 21 163 184Public Policy & Mgmt 12 0 12 118 3 121 36 2 38 304 8 312Special MS in Public Mgmt 0 0 0 0 8 8 0 1 1 0 13 13TOTAL 12 2 14 135 110 245 39 34 73 325 184 509
H&SS Ctr for Innovation in Learn 0 0 0 0 1 1 0 0 0 0 1 1Economics 3 0 3 22 3 25 7 0 7 75 3 78English 9 0 9 85 18 103 35 12 47 162 39 201History 5 0 5 32 8 40 11 12 23 63 23 86IS Program 5 0 5 71 3 74 23 2 25 218 6 224Modern Lang 1 0 1 4 3 7 3 0 3 19 5 24Philosophy 1 0 1 30 2 32 6 3 9 56 8 64Psychology 14 1 15 66 3 69 13 1 14 143 8 151Soc & Dec Sci 4 1 5 30 7 37 17 1 18 88 14 102Statistics 1 0 1 16 0 16 5 3 8 43 13 56Student-Defined Major 0 0 0 3 0 3 0 0 0 3 0 3No Major Dept 11 2 13 120 2 122 31 0 31 321 5 326TOTAL 54 4 58 479 50 529 151 34 185 1,191 125 1,316
Inter- Entertainment Tech 1 0 1 39 5 44 10 2 12 77 8 85disciplinary Humanities & Arts (BHA) 2 1 3 35 1 36 11 0 11 56 2 58
Info Sys Mgmt 0 0 0 9 0 9 7 0 7 153 5 158Info Tech 0 1 1 1 88 89 0 28 28 2 164 166Integrated Product Dev 0 0 0 2 0 2 4 0 4 6 0 6Sci & Arts (BSA) 0 0 0 10 2 12 3 0 3 15 2 17Sci & Humanities Scholars (SHS) 7 2 9 81 1 82 23 0 23 168 3 171CMU West 1 4 5 4 35 39 3 64 67 29 136 165TOTAL 11 8 19 181 132 313 61 94 155 506 320 826Biological Sci 5 0 5 60 1 61 21 1 22 194 4 198Chemistry 4 0 4 65 1 66 12 0 12 159 2 161Math 1 0 1 63 1 64 7 0 7 123 6 129Physics 3 0 3 62 3 65 32 0 32 150 5 155No Major Dept 10 0 10 90 2 92 34 1 35 203 3 206TOTAL 23 0 23 340 8 348 106 2 108 829 20 849Computer Sci 33 0 33 245 10 255 77 6 83 682 23 705CALD 0 0 0 7 0 7 1 0 1 16 1 17HCI 0 0 0 16 8 24 21 3 24 62 16 78Lang Tech Inst 0 0 0 3 0 3 19 1 20 84 5 89Robotics 2 0 2 47 2 49 11 0 11 123 6 129Software Eng 0 5 5 14 29 43 8 20 28 47 102 149TOTAL 35 5 40 332 49 381 137 30 167 1,014 153 1,167Business Admin 26 0 26 128 3 131 29 4 33 451 14 465Electronic Commerce 0 3 3 0 13 13 0 1 1 0 19 19School of Business 12 0 12 174 11 185 51 43 94 586 82 668School of Business, Flex-time 0 6 6 0 155 155 0 30 30 0 247 247TOTAL 38 9 47 302 182 484 80 78 158 1,037 362 1,399
CMU-Q Qatar Business Admin 0 0 0 0 0 0 2 0 2 19 0 19Qatar Comp Sci 0 0 0 0 0 0 1 0 1 22 0 22TOTAL 0 0 0 0 0 0 3 0 3 41 0 41
Special 0 3 3 1 47 48 1 23 24 4 136 140325 34 359 3,121 640 3,761 920 317 1,237 8,365 1,438 9,803
Unknown/Other Total
CFA
CIT
Hispanic White
TOTAL
MCS
SCS
Tepper
2.31

UNDERGRADUATE SECOND MAJOR HEADCOUNT ENROLLMENTBY SECOND MAJOR DEPARTMENT, RACE & GENDERFALL SEMESTER 2004
College Department M F T M F T M F T M F T
Biomedical Eng 15 4 19 6 10 16 31 17 48 1 0 1EPP 4 1 5 2 1 3 1 1 2 0 0 0TOTAL 19 5 24 8 11 19 32 18 50 1 0 1
Economics 14 4 18 1 0 1 12 5 17 0 0 0English 2 0 2 1 1 2 3 4 7 0 0 0History 0 0 0 0 4 4 4 12 16 0 1 1IS Program 0 0 0 0 0 0 0 0 0 0 0 0Modern Lang 1 0 1 1 1 2 4 2 6 0 0 0Philosophy 1 0 1 0 1 1 1 1 2 0 0 0Psychology 2 3 5 0 0 0 4 7 11 0 0 0Soc & Dec Sci 0 0 0 1 0 1 2 3 5 1 0 1Statistics 1 1 2 0 0 0 0 4 4 0 0 0Student-Defined Major 0 0 0 1 0 1 0 0 0 0 0 0TOTAL 21 8 29 5 7 12 30 38 68 1 1 2
Biological Sci 0 0 0 0 1 1 0 0 0 0 0 0Chemistry 1 0 1 0 0 0 0 1 1 0 0 0Math 3 3 6 0 1 1 8 2 10 0 0 0Physics 1 0 1 0 0 0 0 0 0 0 0 0TOTAL 5 3 8 0 2 2 8 3 11 0 0 0
Computer Sci 1 0 1 0 0 0 6 1 7 0 0 0HCI 5 4 9 0 0 0 13 3 16 0 0 0TOTAL 6 4 10 0 0 0 19 4 23 0 0 0
Tepper Business Admin 6 3 9 0 0 0 3 8 11 0 0 0
57 23 80 13 20 33 92 71 163 2 1 3
CIT
Black Asian/Pacific Is. American IndianNRA-International
H&SS
MCS
SCS
TOTAL
2.32

UNDERGRADUATE SECOND MAJOR HEADCOUNT ENROLLMENTBY SECOND MAJOR DEPARTMENT, RACE & GENDER (Cont.)FALL SEMESTER 2004
College Department M F T M F T M F T M F T
Biomedical Eng 3 2 5 49 33 82 8 4 12 113 70 183EPP 3 0 3 19 16 35 1 3 4 30 22 52TOTAL 6 2 8 68 49 117 9 7 16 143 92 235
Economics 3 0 3 14 1 15 2 0 2 46 10 56English 2 2 4 13 22 35 2 5 7 23 34 57History 2 3 5 17 25 42 3 8 11 26 53 79IS Program 0 0 0 0 1 1 0 1 1 0 2 2Modern Lang 0 4 4 5 10 15 2 6 8 13 23 36Philosophy 0 0 0 3 2 5 1 0 1 6 4 10Psychology 1 1 2 10 6 16 1 1 2 18 18 36Soc & Dec Sci 0 0 0 7 0 7 2 1 3 13 4 17Statistics 0 1 1 2 1 3 0 0 0 3 7 10Student-Defined Major 0 0 0 1 1 2 0 0 0 2 1 3TOTAL 8 11 19 72 69 141 13 22 35 150 156 306
Biological Sci 0 0 0 2 2 4 2 1 3 4 4 8Chemistry 0 0 0 0 1 1 0 0 0 1 2 3Math 2 0 2 13 1 14 3 1 4 29 8 37Physics 0 0 0 6 0 6 1 0 1 8 0 8TOTAL 2 0 2 21 4 25 6 2 8 42 14 56
Computer Sci 1 0 1 10 0 10 3 0 3 21 1 22HCI 2 0 2 14 6 20 3 3 6 37 16 53TOTAL 3 0 3 24 6 30 6 3 9 58 17 75
Tepper Business Admin 0 1 1 2 0 2 1 0 1 12 12 24
19 14 33 187 128 315 35 34 69 405 291 696
SCS
TOTAL
Total
CIT
H&SS
MCS
Hispanic White Unknown
2.33
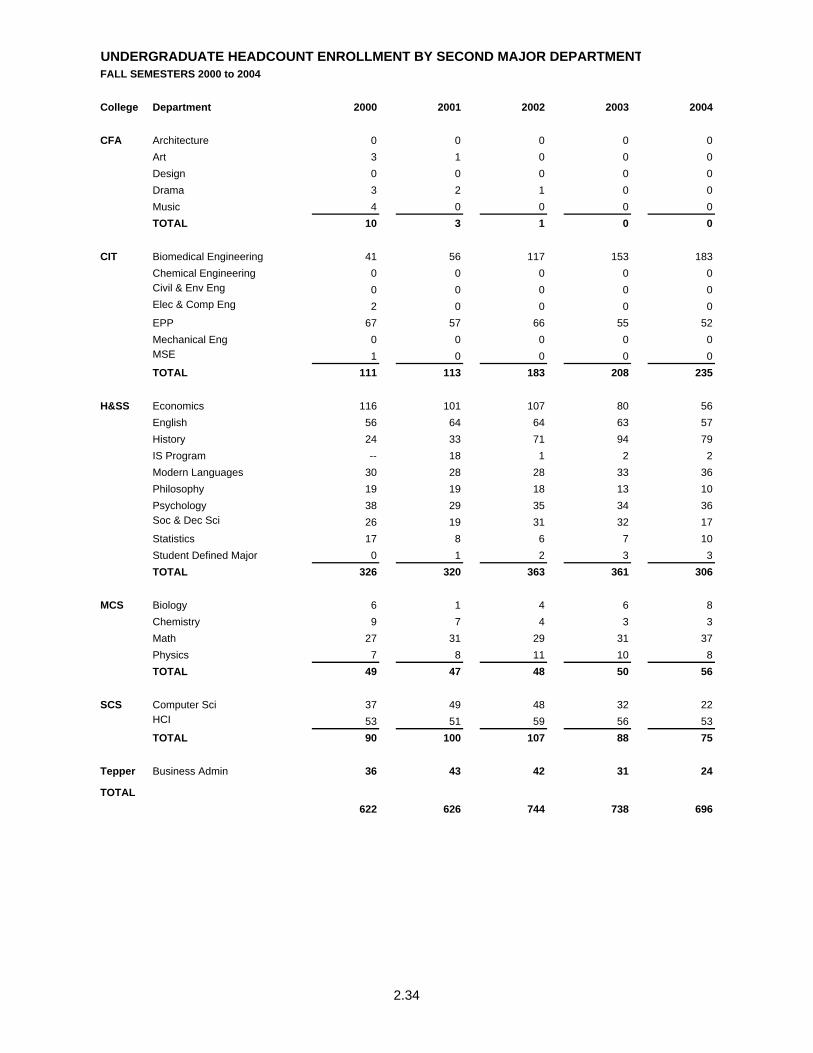
UNDERGRADUATE HEADCOUNT ENROLLMENT BY SECOND MAJOR DEPARTMENTFALL SEMESTERS 2000 to 2004
College Department 2000 2001 2002 2003 2004
CFA Architecture 0 0 0 0 0Art 3 1 0 0 0Design 0 0 0 0 0Drama 3 2 1 0 0Music 4 0 0 0 0TOTAL 10 3 1 0 0
CIT Biomedical Engineering 41 56 117 153 183Chemical Engineering 0 0 0 0 0Civil & Env Eng 0 0 0 0 0Elec & Comp Eng 2 0 0 0 0EPP 67 57 66 55 52Mechanical Eng 0 0 0 0 0MSE 1 0 0 0 0TOTAL 111 113 183 208 235
H&SS Economics 116 101 107 80 56English 56 64 64 63 57History 24 33 71 94 79IS Program -- 18 1 2 2Modern Languages 30 28 28 33 36Philosophy 19 19 18 13 10Psychology 38 29 35 34 36Soc & Dec Sci 26 19 31 32 17Statistics 17 8 6 7 10Student Defined Major 0 1 2 3 3TOTAL 326 320 363 361 306
MCS Biology 6 1 4 6 8Chemistry 9 7 4 3 3Math 27 31 29 31 37Physics 7 8 11 10 8TOTAL 49 47 48 50 56
SCS Computer Sci 37 49 48 32 22HCI 53 51 59 56 53TOTAL 90 100 107 88 75
Tepper Business Admin 36 43 42 31 24
TOTAL622 626 744 738 696
2.34
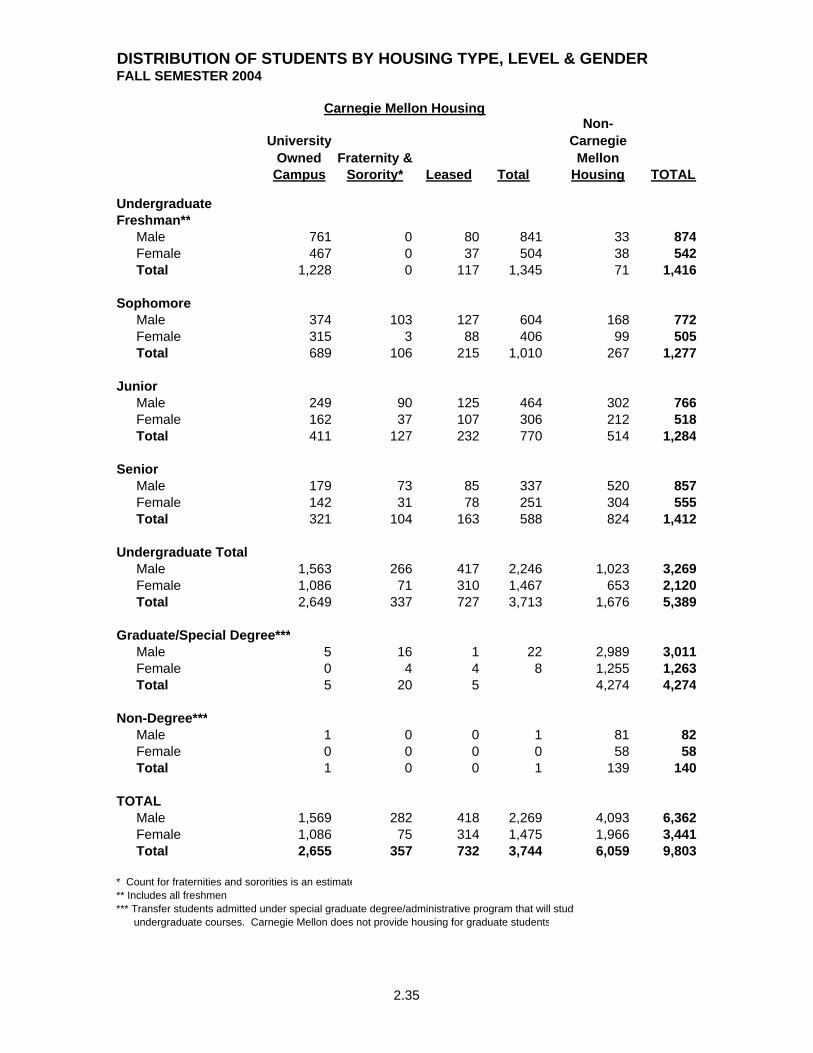
DISTRIBUTION OF STUDENTS BY HOUSING TYPE, LEVEL & GENDERFALL SEMESTER 2004
University Owned Fraternity &
Non-Carnegie Mellon
Campus Sorority* Leased Total Housing TOTAL
UndergraduateFreshman**
Male 761 0 80 841 33 874Female 467 0 37 504 38 542Total 1,228 0 117 1,345 71 1,416
SophomoreMale 374 103 127 604 168 772Female 315 3 88 406 99 505Total 689 106 215 1,010 267 1,277
JuniorMale 249 90 125 464 302 766Female 162 37 107 306 212 518Total 411 127 232 770 514 1,284
SeniorMale 179 73 85 337 520 857Female 142 31 78 251 304 555Total 321 104 163 588 824 1,412
Undergraduate TotalMale 1,563 266 417 2,246 1,023 3,269Female 1,086 71 310 1,467 653 2,120Total 2,649 337 727 3,713 1,676 5,389
Graduate/Special Degree***Male 5 16 1 22 2,989 3,011Female 0 4 4 8 1,255 1,263Total 5 20 5 4,274 4,274
Non-Degree***Male 1 0 0 1 81 82Female 0 0 0 0 58 58Total 1 0 0 1 139 140
TOTALMale 1,569 282 418 2,269 4,093 6,362Female 1,086 75 314 1,475 1,966 3,441Total 2,655 357 732 3,744 6,059 9,803
* Count for fraternities and sororities is an estimate** Includes all freshmen*** Transfer students admitted under special graduate degree/administrative program that will study undergraduate courses. Carnegie Mellon does not provide housing for graduate students
Carnegie Mellon Housing
2.35

OVERALL ATTRITION & GRADUATION RATESFALL SEMESTER 2004
ATTRITION RATES1994 1995 1996 1997 1998 1999 2000 2001 2002 2003
Freshman to Sophomore 10.6% 10.9% 8.4% 10.3% 8.2% 7.6% 6.9% 4.4% 5.6% 7.8%Freshman to Junior 16.9% 18.2% 14.9% 15.9% 13.7% 11.8% 10.8% 9.4% 9.6%Freshman to Senior 21.8% 21.3% 15.2% 17.0% 13.7% 12.0% 12.3% 11.5%Freshman to 6-Year 23.9% 21.8% 18.0% 18.3% 15.3%
GRADUATION RATES1994 1995 1996 1997 1998 1999 2000
Graduated in 4 Years or Less 58.0% 60.2% 61.8% 62.9% 65.0% 66.4% 69.1%Graduated in 5 Years 14.8% 14.4% 17.0% 14.9% 17.5% 16.2%Graduated in 6 Years 3.2% 3.6% 3.1% 3.9% 2.2%Graduated in 7 Years or More 2.6% 2.3% 2.0% 1.1%Cumulative Graduation Rate 78.7% 80.5% 84.0% 82.8% 84.7% 82.6% 69.1%
Carnegie Mellon University Attrition Rates, 1994 to 2003 Cohorts
0%
5%
10%
15%
20%
25%
30%
1994 1995 1996 1997 1998 1999 2000 2001 2002 2003Cohort
Perc
ent A
ttriti
on
Freshman to Sophomore Freshman to Junior CumulativeFreshman to Senior Cumulative Freshman to 6-Year Graduation
Carnegie Mellon University Overall Graduation Rates, 1994 to 2000 Cohorts
69.1%
82.6%84.7%82.8%84.0%80.5%78.7%
0%10%20%30%40%50%60%70%80%90%
100%
1994 1995 1996 1997 1998 1999 2000Cohort
Gra
duat
ion
Rat
e
Graduated in 4 Years or Less Graduated in 5 Years Graduated in 6 YearsGraduated in 7 Years or More Cumulative Graduation Rate
2.36

TOTAL DEGREES GRANTED BY DEPARTMENT & LEVELACADEMIC YEAR 2003-2004
College Department Bachelors Masters Doctorate Total
Architecture 49 8 3 60Art 36 1 0 37Design 39 18 0 57Drama 58 19 0 77Music 28 31 0 59Total 210 77 3 290
Biomedical Eng 0 3 0 3Chemical Eng 64 16 11 91Civil & Env Eng 22 25 6 53Elec & Comp Eng 128 126 32 286EPP 0 5 3 8Info Networking Inst 0 69 0 69MSE 12 16 10 38Mechanical Eng 84 30 6 120Total 310 290 68 668
Heinz MS in Public Mgmt 0 95 0 95Public Policy & Mgmt 0 100 3 103Total 0 195 3 198
H&SS Economics 27 0 0 27English 46 44 4 94History 20 5 6 31IS Program 69 0 0 69Modern Lang 8 2 5 15Philosophy 22 8 2 32Psychology 36 8 6 50Soc & Dec Sci 25 5 1 31Statistics 5 7 7 19Student-Defined Major 2 0 0 2Total 260 79 31 370
Inter- Entertainment Tech 0 25 0 25disciplinary Humanities & Arts (BHA) 26 0 0 26
Info Sys Mgmt 0 117 0 117Info Tech 0 76 0 76Integrated Product Dev 0 4 0 4Sci & Arts (BSA) 6 0 0 6Sci & Humanities Scholars (SHS) 26 0 0 26CMU West 0 39 0 39Total 58 261 0 319
Biological Sci 54 3 7 64Chemistry 13 5 8 26Math 39 4 8 51Physics 21 7 12 40Total 127 19 35 181
Computer Sci 155 15 20 190CALD 0 6 0 6HCI 0 30 1 31Lang Tech Inst 0 13 2 15Robotics 0 23 13 36Software Eng 0 28 1 29Total 155 115 37 307
Business Admin 141 0 0 141Electronic Commerce 0 11 0 11School of Business 0 280 18 298School of Business, Flex-time 0 90 0 90Total 141 381 18 540
1,261 1,417 195 2,873Total
MCS
SCS
CFA
CIT
Tepper
2.37

TOTAL DEGREES GRANTED BY COLLEGE & LEVELACADEMIC YEARS 1999-2000 TO 2003-2004
1999-2000 2000-2001 2001-2002 2002-2003 2003-2004College Degrees
CFA Bachelors 178 180 213 218 210
Masters 71 74 71 62 77
Doctorates 4 3 2 4 3
Total 253 257 286 284 290
CIT Bachelors 318 301 291 320 310
Masters 218 194 157 231 290
Doctorates 67 72 75 81 68
Total 603 567 523 632 668
Heinz Masters 281 239 191 225 195
Doctorates 2 7 1 4 3
Total 283 246 192 229 198
H&SS Bachelors 262 280 278 265 260
Masters 47 36 59 57 79
Doctorates 18 24 19 18 31
Total 327 340 356 340 370
Inter- Bachelors 26 29 42 58
disciplinary Masters 95 144 148 243 261
Doctorates 0 0 0 0 0
Total 95 170 177 285 319
MCS Bachelors 115 122 95 119 127
Masters 19 28 33 26 19
Doctorates 29 25 27 26 35
Total 163 175 155 171 181
SCS Bachelors 151 162 153 153 155
Masters 93 88 78 89 115
Doctorates 24 23 34 21 37
Total 268 273 265 263 307
Tepper Bachelors 172 141 119 128 141
Masters 373 418 404 405 381
Doctorates 8 15 18 10 18
Total 553 574 541 543 540
Total Bachelors 1,196 1,212 1,178 1,245 1,261
Masters 1,197 1,221 1,141 1,338 1,417
Doctorates 152 169 176 164 195
Total 2,545 2,602 2,495 2,747 2,873
2.38
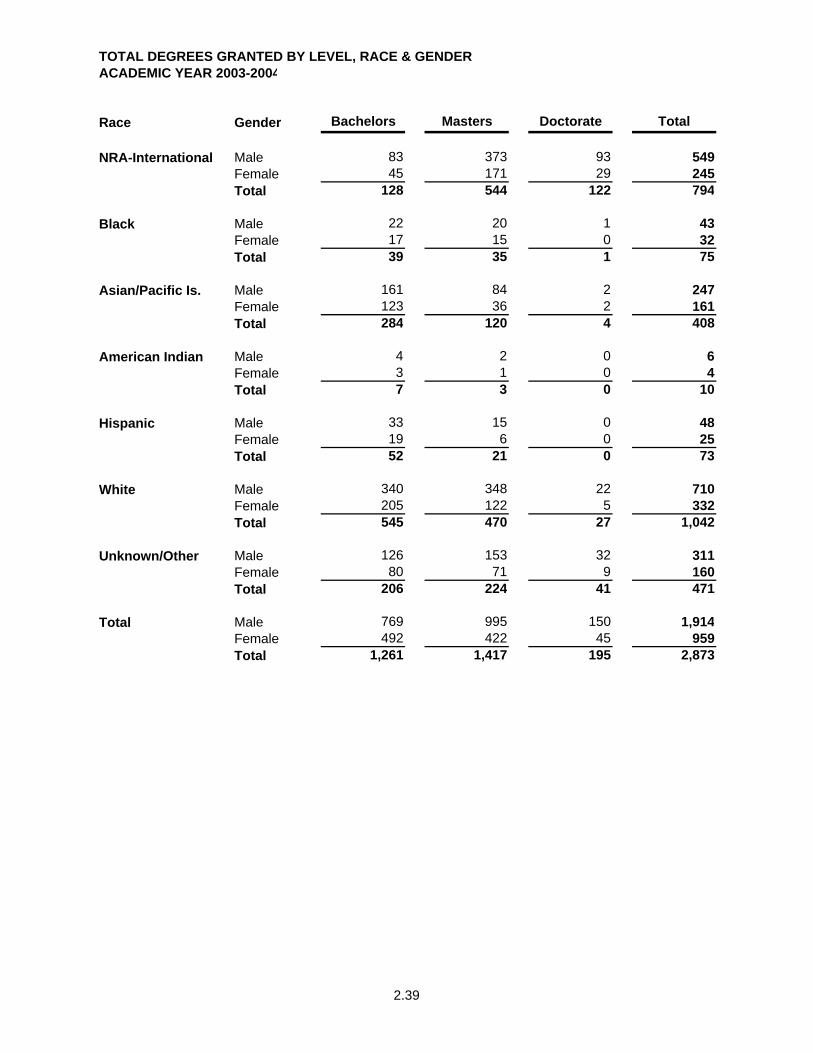
TOTAL DEGREES GRANTED BY LEVEL, RACE & GENDERACADEMIC YEAR 2003-2004
Race Gender Bachelors Masters Doctorate Total
Male 83 373 93 549Female 45 171 29 245Total 128 544 122 794
Male 22 20 1 43Female 17 15 0 32Total 39 35 1 75
Male 161 84 2 247Female 123 36 2 161Total 284 120 4 408
Male 4 2 0 6Female 3 1 0 4Total 7 3 0 10
Male 33 15 0 48Female 19 6 0 25Total 52 21 0 73
Male 340 348 22 710Female 205 122 5 332Total 545 470 27 1,042
Male 126 153 32 311Female 80 71 9 160Total 206 224 41 471
Male 769 995 150 1,914Female 492 422 45 959Total 1,261 1,417 195 2,873
NRA-International
Black
Asian/Pacific Is.
Total
American Indian
Hispanic
White
Unknown/Other
2.39

blah
2.40

TEACHING AND ACADEMIC SUPPORT

blah
3.2
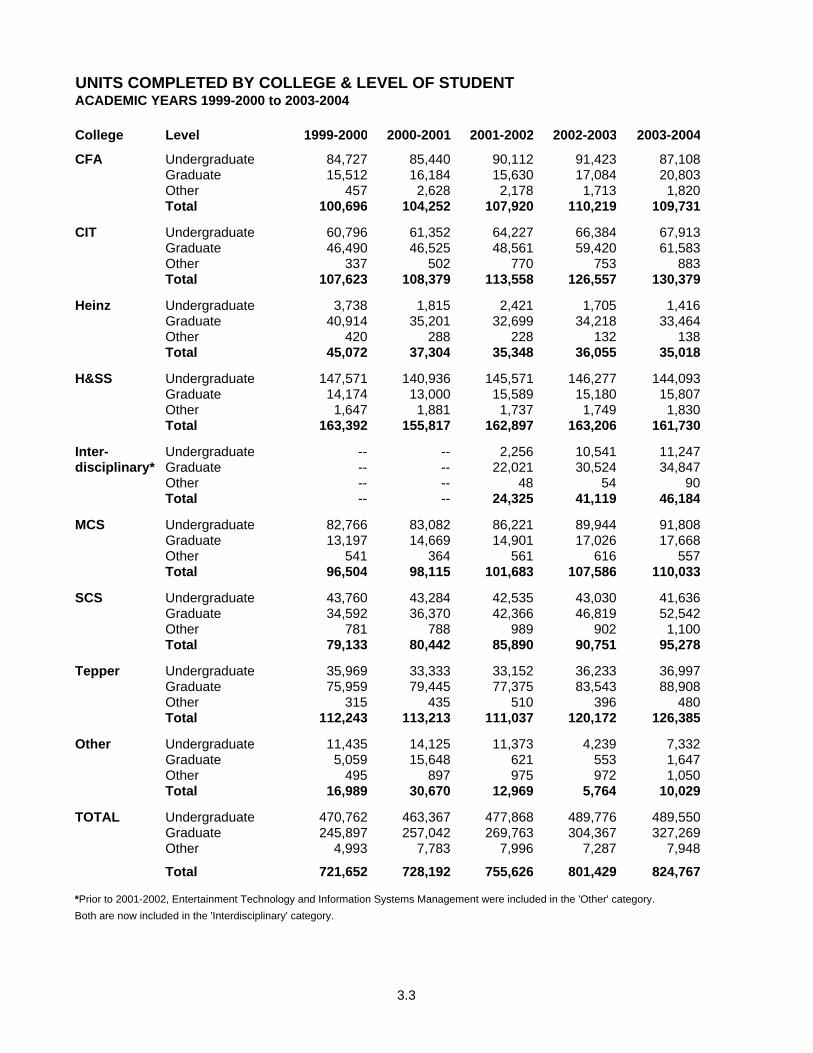
UNITS COMPLETED BY COLLEGE & LEVEL OF STUDENT
College Level 1999-2000 2000-2001 2001-2002 2002-2003 2003-2004
CFA Undergraduate 84,727 85,440 90,112 91,423 87,108Graduate 15,512 16,184 15,630 17,084 20,803Other 457 2,628 2,178 1,713 1,820Total 100,696 104,252 107,920 110,219 109,731
CIT Undergraduate 60,796 61,352 64,227 66,384 67,913Graduate 46,490 46,525 48,561 59,420 61,583Other 337 502 770 753 883Total 107,623 108,379 113,558 126,557 130,379
Heinz Undergraduate 3,738 1,815 2,421 1,705 1,416Graduate 40,914 35,201 32,699 34,218 33,464Other 420 288 228 132 138Total 45,072 37,304 35,348 36,055 35,018
H&SS Undergraduate 147,571 140,936 145,571 146,277 144,093Graduate 14,174 13,000 15,589 15,180 15,807Other 1,647 1,881 1,737 1,749 1,830Total 163,392 155,817 162,897 163,206 161,730
Inter- Undergraduate -- -- 2,256 10,541 11,247disciplinary* Graduate -- -- 22,021 30,524 34,847
Other -- -- 48 54 90Total -- -- 24,325 41,119 46,184
MCS Undergraduate 82,766 83,082 86,221 89,944 91,808Graduate 13,197 14,669 14,901 17,026 17,668Other 541 364 561 616 557Total 96,504 98,115 101,683 107,586 110,033
SCS Undergraduate 43,760 43,284 42,535 43,030 41,636Graduate 34,592 36,370 42,366 46,819 52,542Other 781 788 989 902 1,100Total 79,133 80,442 85,890 90,751 95,278
Tepper Undergraduate 35,969 33,333 33,152 36,233 36,997Graduate 75,959 79,445 77,375 83,543 88,908Other 315 435 510 396 480Total 112,243 113,213 111,037 120,172 126,385
Other Undergraduate 11,435 14,125 11,373 4,239 7,332Graduate 5,059 15,648 621 553 1,647Other 495 897 975 972 1,050Total 16,989 30,670 12,969 5,764 10,029
TOTAL Undergraduate 470,762 463,367 477,868 489,776 489,550Graduate 245,897 257,042 269,763 304,367 327,269Other 4,993 7,783 7,996 7,287 7,948
Total 721,652 728,192 755,626 801,429 824,767
*Prior to 2001-2002, Entertainment Technology and Information Systems Management were included in the 'Other' category. Both are now included in the 'Interdisciplinary' category.
ACADEMIC YEARS 1999-2000 to 2003-2004
3.3

UNITS COMPLETED BY DEPARTMENT & LEVELFALL SEMESTER 2003, SPRING SEMESTER 2004, FALL SEMESTER 2004
College Department UG Grad Other Total UG Grad Other Total UG Grad Other Total
Architecture 10,179 1,131 63 11,373 8,862 1,050 9 9,921 10,674 1,044 27 11,745Art 6,703 851 19 7,572 6,750 929 0 7,678 6,833 776 10 7,619Design 6,335 2,519 33 8,886 6,255 2,199 85 8,539 6,500 2,325 9 8,834Drama 11,098 2,847 39 13,984 10,248 2,758 31 13,037 9,694 2,876 22 12,592Interdisciplinary 1,111 53 13 1,177 1,783 51 10 1,844 956 12 9 977Music 9,100 3,024 708 12,832 8,685 3,393 810 12,888 8,643 3,222 549 12,414TOTAL 44,525 10,424 875 55,824 42,583 10,379 945 53,907 43,300 10,255 626 54,180
Biomedical Eng 1,500 494 27 2,021 2,821 537 12 3,370 2,106 909 9 3,024Chemical Eng 4,346 4,433 12 8,791 3,417 4,339 21 7,777 3,762 4,034 60 7,856Civil & Env Eng 2,877 2,539 81 5,497 2,868 2,089 96 5,053 3,102 2,304 63 5,469Elec & Comp Eng 12,083 14,450 246 26,779 9,612 12,694 228 22,534 12,655 13,917 318 26,890EPP 669 1,417 24 2,110 1,590 1,493 12 3,095 864 1,835 12 2,711Info Networking Inst 0 1,373 0 1,373 0 1,535 12 1,547 0 1,325 0 1,325Interdisciplinary 1,410 177 27 1,614 1,144 285 0 1,429 1,206 189 36 1,431MSE 2,567 2,883 18 5,468 1,692 3,003 0 4,695 2,536 2,782 18 5,336Mechanical Eng 9,639 3,937 21 13,597 9,678 3,905 46 13,629 10,180 4,292 21 14,493TOTAL 35,091 31,703 456 67,250 32,822 29,880 427 63,129 36,411 31,587 537 68,535
MS in Public Mgmt 96 4,404 12 4,512 114 4,086 12 4,212 84 3,864 0 3,948Public Policy & Mgmt 819 12,472 54 13,345 387 12,502 60 12,949 918 14,335 162 15,415TOTAL 915 16,876 66 17,857 501 16,588 72 17,161 1,002 18,199 162 19,363
H&SS Ctr for Innovation in Learn 0 5 0 5 0 5 0 5 0 5 0 5Economics 8,190 9 27 8,226 9,527 27 36 9,590 8,826 36 27 8,889English 12,906 2,472 153 15,531 11,898 2,232 108 14,238 13,047 2,448 99 15,594History 12,567 697 42 13,306 12,402 610 63 13,075 12,948 903 105 13,956IS Program 3,036 0 0 3,036 3,009 0 0 3,009 3,449 24 18 3,491Modern Lang 9,890 742 348 10,980 8,165 571 246 8,982 10,116 775 177 11,068Philosophy 6,260 616 54 6,930 5,367 619 57 6,043 7,384 796 36 8,216Psychology 9,325 1,361 153 10,839 9,063 1,379 198 10,640 9,680 1,502 36 11,218Soc & Dec Sci 5,866 369 36 6,271 4,872 479 45 5,396 5,049 306 39 5,394Statistics 6,093 1,993 57 8,143 5,657 1,621 207 7,485 6,411 2,360 51 8,822TOTAL 74,133 8,264 870 83,267 69,960 7,543 960 78,463 76,910 9,155 588 86,653
CIT
Heinz
Fall 2004Fall 2003 Spring 2004
CFA
3.4

UNITS COMPLETED BY DEPARTMENT & LEVEL (Cont.)FALL SEMESTER 2003, SPRING SEMESTER 2004, FALL SEMESTER 2004
College Department UG Grad Other Total UG Grad Other Total UG Grad Other Total
Inter- CM University-Wide Studies 4,179 39 3 4,221 774 36 3 813 4,206 216 12 4,434disciplinary Entertainment Tech 324 2,706 0 3,030 234 2,559 12 2,805 264 3,582 0 3,846
Info Networking Inst 0 648 0 648 0 588 0 588 0 564 0 564Info Sys Mgmt 1,011 11,490 36 12,537 930 9,803 24 10,757 1,608 12,744 48 14,400International Ed 900 0 0 900 1,044 0 0 1,044 1,260 0 0 1,260StuCo (Student Led Courses) 606 63 3 672 1,245 93 9 1,347 729 33 6 768CMU West 0 3,680 0 3,680 0 3,142 0 3,142 28 5,012 0 5,040TOTAL 7,020 18,626 42 25,688 4,227 16,221 48 20,496 8,095 22,151 66 30,312
Biological Sci 6,114 1,773 9 7,896 6,217 1,678 54 7,949 6,536 1,667 36 8,239Chemistry 8,845 2,768 9 11,622 8,057 2,880 84 11,021 10,645 3,235 30 13,910Interdisciplinary 114 0 0 114 0 0 0 0 0 84 0 84Math 22,101 1,910 175 24,186 16,467 2,211 95 18,773 23,507 2,139 141 25,787Physics 12,230 2,318 47 14,595 11,663 2,130 84 13,877 13,169 2,377 53 15,599TOTAL 49,404 8,769 240 58,413 42,404 8,899 317 51,620 53,857 9,502 260 63,619
Computer Sci 18,437 10,801 275 29,513 20,234 9,638 249 30,121 19,209 11,207 224 30,640CALD 12 738 24 774 24 642 12 678 0 1,188 0 1,188HCI 483 2,385 87 2,955 720 2,145 18 2,883 570 2,877 33 3,480Lang Tech Inst 90 3,710 72 3,872 72 3,734 108 3,914 12 4,251 108 4,371Robotics 619 5,063 90 5,772 687 4,928 60 5,675 375 5,846 174 6,395Software Eng 36 4,545 57 4,638 222 4,213 48 4,483 171 4,239 81 4,491TOTAL 19,677 27,242 605 47,524 21,959 25,300 495 47,754 20,337 29,608 620 50,565
Business Admin 18,066 162 27 18,255 18,391 144 33 18,568 18,976 306 18 19,300Electronic Commerce 30 1,236 6 1,272 54 882 0 936 0 66 0 66School of Business 180 45,462 216 45,858 276 41,022 198 41,496 168 40,710 102 40,980TOTAL 18,276 46,860 249 65,385 18,721 42,048 231 61,000 19,144 41,082 120 60,346
Other 3,431 829 495 4,755 3,901 818 555 5,274 2,973 770 618 4,361TOTAL 3,431 829 495 4,755 3,901 818 555 5,274 2,973 770 618 4,361
252,472 169,593 3,898 425,963 237,078 157,676 4,050 398,804 262,029 172,309 3,597 437,934
Fall 2003 Spring 2004 Fall 2004
MCS
SCS
Tepper
Other
TOTAL
3.5

COMPUTING SERVICES STATISTICSFiscal Years 2000 TO 2004
-Computing Services provides the majority of computing and network infrastructure on campus. -We build and maintain basic communications infrastructure, from phone lines to wireless access points. -We run the central computing clusters and the computer store. -We deploy and maintain shared email and web services (Cyrus, Mulberry, MyAndrew, the Portal). -We work with faculty to design and teach the Computing Skills Workshop, and to provide essential and innovative instructional technologies within the classroom. -We monitor the security and fair use of our network, and protect it against abuse and attack. -We support all of these activities with documentation, education, outreach and a fully-staffed help center.
Computing Services Website: https://www.cmu.edu/computing/
Network Connections 2000 2001 2002 2003 2004Ethernet 1,469 5,875 6,962 11,904 17,192Wireless 11,813 9,686 9,948 11,198 11,701Total Network Connections 13,282 15,561 16,910 23,102 28,893
Computer Store Purchases (CPUs) 2000 2001 2002 2003 2004Non Departmental 672 728 882 1,139 1,226Departments 953 1,027 1,008 1,202 1,290TOTAL 1,625 1,755 1,890 2,341 2,516
Computers in Public Clusters 2000 2001 2002 2003 2004WorkstationsTotal Workstations 73 93 71 107 103
MacintoshTotal Macintosh 143 141 136 123 123
WindowsTotal Windows 234 232 237 165 176
TOTAL 450 466 444 395 402
3.6

LIBRARY COLLECTIONS & UTILIZATIONFISCAL YEARS 2000 TO 2004
Library Collections 2000 2001 2002 2003 2004Total Print Volumes (Books, Bound Journals, etc.) 961,507 981,479 999,798 1,021,423 1,042,080Current Subscriptions: 3,184 3,254 3,143 2,945 2,628
Periodicals, Newspapers, Government DocumentsElectronic Subscriptions 2,530 3,221 3,754 13,957 16,456 Microforms: 905,420 929,783 938,851 945,715 958,462
Books, Serial Titles, Government DocumentsGraphic Materials: 187,604 187,964 188,922 190,332 191,169
Pictures (Unmounted), SlidesAudio Materials: 24,717 25,153 25,578 26,031 26,408
Cassettes, Phonograph Records, CDs, TapesVideo Materials 6,458 6,965 7,243 7,684 8,569 Music Scores 20,176 20,175 20,174 20,174 20,173Maps 157 157 158 160 160
Library Material DuplicationPhotocopies Made in Libraries 1,298,756 1,095,569 948,816 970,100 868,760 Microform Copies Made in Libraries 19,758 17,251 17,126 16,598 11,753 Printing: Pages Printed from Public Laser Printers 700,243 703,153 701,368 1,297,116 2,162,989
Number of Visits to the LibrariesEngineering and Science Library 168,567 161,844 157,513 151,205 159,056 Hunt Library * 470,402 546,871 441,409 365,449 437,612 Mellon Institute Library N/A N/A N/A N/A N/AVirtual Visits 553,231 596,894 768,220 816,490 1,020,468
1,192,200 1,305,609 1,367,142 1,333,144 1,617,136
SeatingEngineering and Science Library 161 163 159 158 158Hunt Library 619 632 631 656 672Mellon Institute Library 95 117 117 119 122
875 912 907 933 952
Circulation of Library Materials 142,690 158,898 158,258 138,549 164,620
Books Used in Libraries 118,355 90,642 107,293 87,469 87,795
Library InstructionNumber of classes 188 183 161 148 171Number of participants 3,565 3,337 3,238 2,815 3,582
Reference Questions Answered 13,996 14,539 13,993 12,471 15,725Directional Help Given 13,240 15,670 16,416 14,322 15,047
*No data for Hunt Library for part of April and all of May 2003.
3.7

LIBRARY COLLECTIONS & UTILIZATIONFISCAL YEARS 2000 TO 2004
Electronic Information Resources and Access
The University Libraries provide access to a variety of digital information, including the library catalog andother local databases, and a growing number of commercial databases that are licensed for use by theuniversity community. Access methods continue to change as the delivery of electronic information evolves.Currently, Internet (web) access predominates.
The web-based library catalog (Cameo) contains records of items owned by the libraries, as well as items onorder or being cataloged for library collections. Cameo is part of a system that integrates acquisitions and cataloging functions with circulation, reserve, and user service functions. Users can see if items are availableor checked out when they use the library catalog; they can also request services (like Renew Item orRequest Check-out Item).
Users may access Cameo from any computer with Internet capability at: http://www.library.cmu.edu
As the digital library environment matures, more full-text documents and images are becoming available. Some vendors who are providing full-text documents are no longer reporting numbers of searches.
Searches: 2000 2001 2002 2003 2004Performed using Cameo (Library Catalog) 596,013 552,479 617,425 534,985 665,462Performed to Licensed and Local Web Resources* 416,468 396,973 549,710 533,061 606,058Total Database Searches 1,012,481 949,452 1,167,135 1,068,046 1,271,520
Total Full-text Documents Retrieved* 207,284 317,714 378,360 458,000 614,647
Electronic Reserve Usage (Items Viewed) -- 66,770 136,467 151,508 114,198
Images Scanned for the Digital Library 131,470 210,556 221,754 185,412 220,446
Reference Questions Answered 2000 2001 2002 2003 2004Digital -- 2,354 2,186 1,712 2,551Traditional -- 14,539 11,807 10,759 13,174
Reserve Items Used 2000 2001 2002 2003 2004Digital -- 66,770 136,467 151,508 114,198Traditional -- 22,090 11,491 7,587 6,445
*Actual counts may be higher. One vendor does not report data.
3.8

LIBRARY COLLECTIONS & UTILIZATIONFISCAL YEARS 2000 TO 2004
Resource Sharing and Document Delivery 2000 2001 2002 2003 2004Interlibrary LoanItems Borrowed 9,082 9,826 9,498 12,263 16,180Items Loaned 5,454 5,107 4,013 5,142 5,664
Oakland Library ConsortiumItems Borrowed 2,255 1,182 737 490 306Items Loaned 299 88 69 56 228
PALCI (Pennsylvania Academic Library Consortium, Inc.Items Borrowed 231 619 821 1,653 1,846 Items Loaned 259 1,007 1,414 1,626 2,757
Electronic Current Awareness ServiceIndividuals using site license subscription 87 82 79 65 67
VIDEO VIEWING CLUSTERFALL 2000 to FALL 2004
2000 2001 2002 2003 2004VCR carrels 14 15 15 14 14Laserdisc carrels 13 13 13 7 7DVD carrels 8 14 14 14 15
3.9

INSTRUCTIONAL TECHNOLOGY STATISTICSFISCAL YEARS 2000 TO 2004
Equipment for Delivery
2000 2001 2002 2003 2004Video/Data Projectors 6 6 6 6 4VCRs 4 4 4 4 2Video/Data Monitors 1 1 1 1 1Slide Projectors 10 10 4 4 4Tape Players 10 10 3 3 0Sound Systems 9 9 9 9 4Overhead Projectors 2 2 2 2 2Videodisc Players 4 4 4 0 0Personal Computers 16 16 10 10 6TOTAL 62 62 43 39 23
Classrooms (level of installed equipment)
2000 2001 2002 2003 2004Overhead Projector 79 83 63 63 59Video Viewing 79 83 63 63 63Data Viewing 79 83 63 63 63
3.10

TEACHING & ACADEMIC SUPPORT, ADDITIONAL FACTS & FIGURES
Pittsburgh Council of Higher Education (PCHE) Units Taken by Carnegie Mellon Students, by Student Level & College Units Taught by Carnegie Mellon, by CollegeAcademic Year 2003-2004
Units Taught to PCHE Students by
Carnegie Mellon CollegeMajor/College Undergraduate Graduate Total Total
CFA 597 57 654 73CIT 159 78 237 270Heinz 0 156 156 84H&SS 468 213 681 777Interdisciplinary 270 0 270 12MCS 207 129 336 198SCS 123 162 285 177Tepper 216 39 255 267Other 0 0 0 945
TOTAL 2,040 834 2,874 2,803
PCHE College Undergraduate Graduate Total
Carlow University 30 0 30Chatham College 267 6 273CCAC 30 12 42Duquesne University 12 9 21University of Pittsburgh 1,701 807 2,508
TOTAL 2,040 834 2,874
Pittsburgh Council of Higher Education (PCHE) Colleges:
Carlow University Pittsburgh Theological SeminaryChatham College Point Park UniversityCommunity College of Allegheny County (CCAC) Robert Morris UniversityDuquesne University University of PittsburghLa Roche College
Units Taken by Carnegie Mellon Students at Pittsburgh Filmmakers:
Undergraduate 1,017Graduate 144Non-degree 27
TOTAL 1,188
at PCHE SchoolsUnits Taken by Carnegie Mellon Students
Units Taken by Carnegie Mellon Studentsat PCHE Schools
3.11
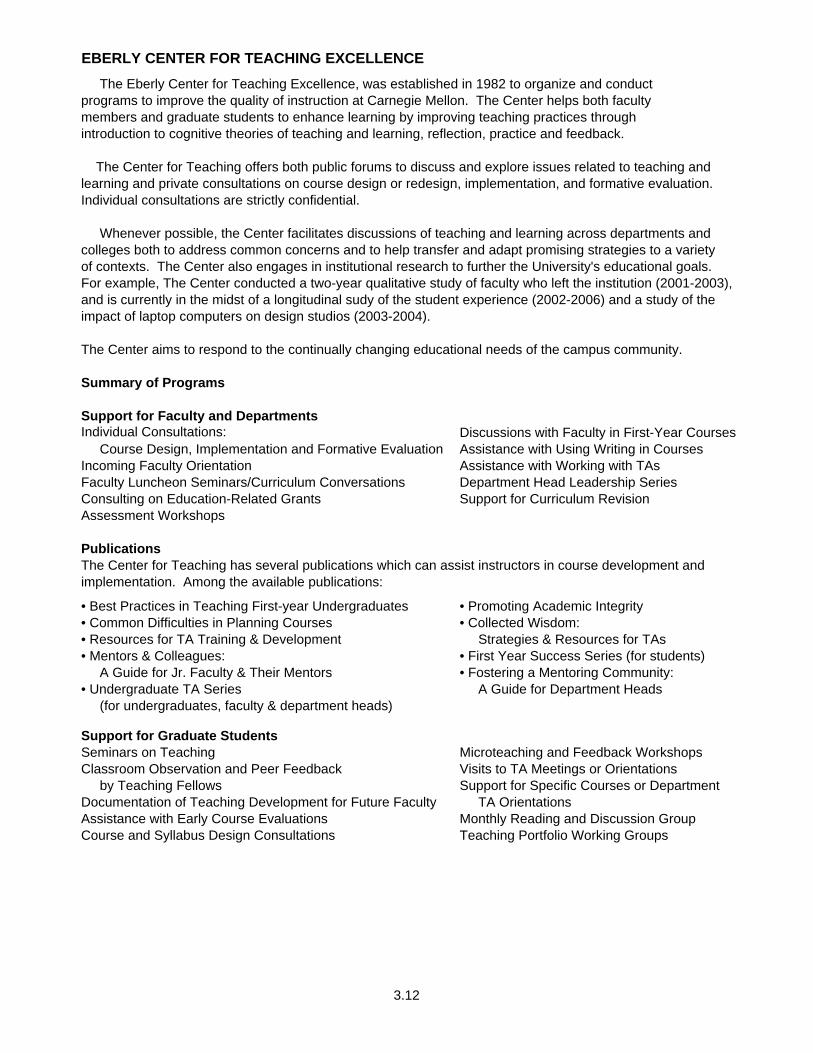
EBERLY CENTER FOR TEACHING EXCELLENCE The Eberly Center for Teaching Excellence, was established in 1982 to organize and conductprograms to improve the quality of instruction at Carnegie Mellon. The Center helps both facultymembers and graduate students to enhance learning by improving teaching practices throughintroduction to cognitive theories of teaching and learning, reflection, practice and feedback.
The Center for Teaching offers both public forums to discuss and explore issues related to teaching and learning and private consultations on course design or redesign, implementation, and formative evaluation. Individual consultations are strictly confidential.
Whenever possible, the Center facilitates discussions of teaching and learning across departments and colleges both to address common concerns and to help transfer and adapt promising strategies to a variety of contexts. The Center also engages in institutional research to further the University's educational goals. For example, The Center conducted a two-year qualitative study of faculty who left the institution (2001-2003), and is currently in the midst of a longitudinal sudy of the student experience (2002-2006) and a study of the impact of laptop computers on design studios (2003-2004).
The Center aims to respond to the continually changing educational needs of the campus community.
Summary of Programs
Support for Faculty and DepartmentsDiscussions with Faculty in First-Year Courses
Course Design, Implementation and Formative Evaluation Assistance with Using Writing in CoursesIncoming Faculty Orientation Assistance with Working with TAsFaculty Luncheon Seminars/Curriculum Conversations Department Head Leadership SeriesConsulting on Education-Related Grants Support for Curriculum RevisionAssessment Workshops
PublicationsThe Center for Teaching has several publications which can assist instructors in course development and implementation. Among the available publications:
• Best Practices in Teaching First-year Undergraduates • Promoting Academic Integrity• Common Difficulties in Planning Courses • Collected Wisdom: • Resources for TA Training & Development Strategies & Resources for TAs• Mentors & Colleagues: • First Year Success Series (for students) A Guide for Jr. Faculty & Their Mentors • Fostering a Mentoring Community:• Undergraduate TA Series A Guide for Department Heads (for undergraduates, faculty & department heads)
Support for Graduate StudentsSeminars on Teaching Microteaching and Feedback WorkshopsClassroom Observation and Peer Feedback Visits to TA Meetings or Orientations by Teaching Fellows Support for Specific Courses or DepartmentDocumentation of Teaching Development for Future Faculty TA OrientationsAssistance with Early Course Evaluations Monthly Reading and Discussion GroupCourse and Syllabus Design Consultations Teaching Portfolio Working Groups
Individual Consultations:
3.12

FACULTY AND STAFF

blah
4.2
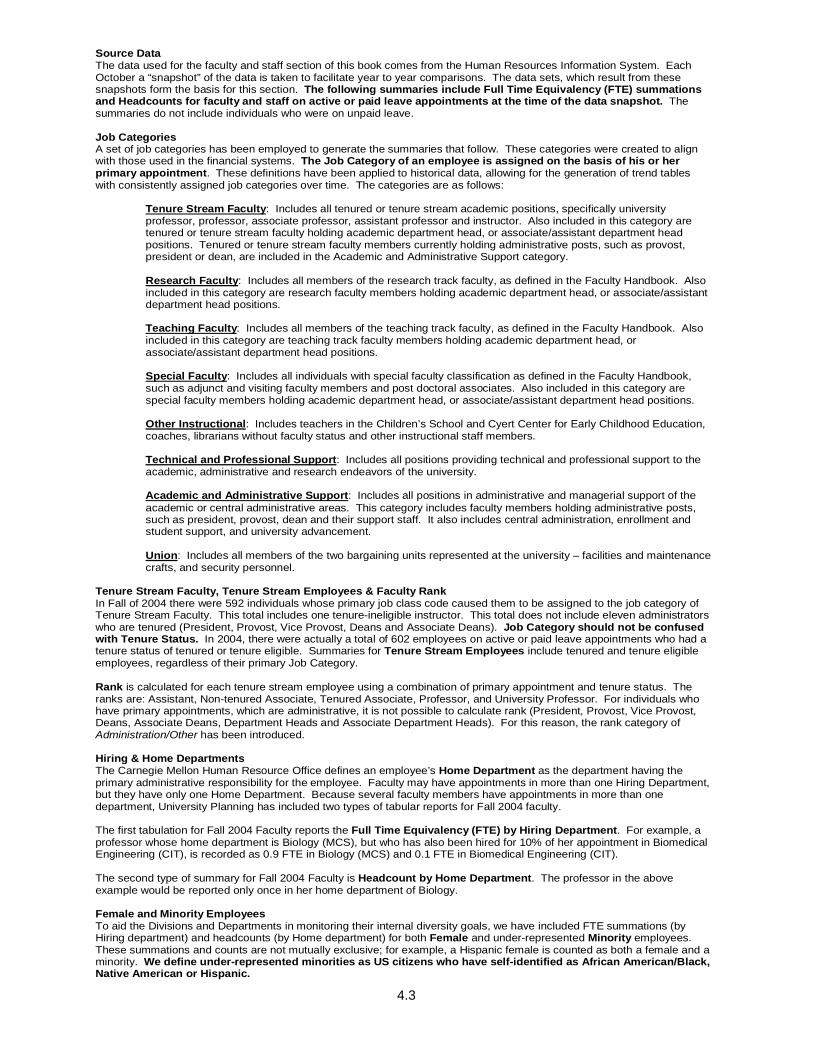
Source Data The data used for the faculty and staff section of this book comes from the Human Resources Information System. Each October a “snapshot” of the data is taken to facilitate year to year comparisons. The data sets, which result from these snapshots form the basis for this section. The following summaries include Full Time Equivalency (FTE) summations and Headcounts for faculty and staff on active or paid leave appointments at the time of the data snapshot. The summaries do not include individuals who were on unpaid leave. Job Categories A set of job categories has been employed to generate the summaries that follow. These categories were created to align with those used in the financial systems. The Job Category of an employee is assigned on the basis of his or her primary appointment. These definitions have been applied to historical data, allowing for the generation of trend tables with consistently assigned job categories over time. The categories are as follows:
Tenure Stream Faculty: Includes all tenured or tenure stream academic positions, specifically university professor, professor, associate professor, assistant professor and instructor. Also included in this category are tenured or tenure stream faculty holding academic department head, or associate/assistant department head positions. Tenured or tenure stream faculty members currently holding administrative posts, such as provost, president or dean, are included in the Academic and Administrative Support category. Research Faculty: Includes all members of the research track faculty, as defined in the Faculty Handbook. Also included in this category are research faculty members holding academic department head, or associate/assistant department head positions. Teaching Faculty: Includes all members of the teaching track faculty, as defined in the Faculty Handbook. Also included in this category are teaching track faculty members holding academic department head, or associate/assistant department head positions. Special Faculty: Includes all individuals with special faculty classification as defined in the Faculty Handbook, such as adjunct and visiting faculty members and post doctoral associates. Also included in this category are special faculty members holding academic department head, or associate/assistant department head positions. Other Instructional: Includes teachers in the Children’s School and Cyert Center for Early Childhood Education, coaches, librarians without faculty status and other instructional staff members. Technical and Professional Support: Includes all positions providing technical and professional support to the academic, administrative and research endeavors of the university. Academic and Administrative Support: Includes all positions in administrative and managerial support of the academic or central administrative areas. This category includes faculty members holding administrative posts, such as president, provost, dean and their support staff. It also includes central administration, enrollment and student support, and university advancement. Union: Includes all members of the two bargaining units represented at the university – facilities and maintenance crafts, and security personnel.
Tenure Stream Faculty, Tenure Stream Employees & Faculty Rank In Fall of 2004 there were 592 individuals whose primary job class code caused them to be assigned to the job category of Tenure Stream Faculty. This total includes one tenure-ineligible instructor. This total does not include eleven administrators who are tenured (President, Provost, Vice Provost, Deans and Associate Deans). Job Category should not be confused with Tenure Status. In 2004, there were actually a total of 602 employees on active or paid leave appointments who had a tenure status of tenured or tenure eligible. Summaries for Tenure Stream Employees include tenured and tenure eligible employees, regardless of their primary Job Category. Rank is calculated for each tenure stream employee using a combination of primary appointment and tenure status. The ranks are: Assistant, Non-tenured Associate, Tenured Associate, Professor, and University Professor. For individuals who have primary appointments, which are administrative, it is not possible to calculate rank (President, Provost, Vice Provost, Deans, Associate Deans, Department Heads and Associate Department Heads). For this reason, the rank category of Administration/Other has been introduced. Hiring & Home Departments The Carnegie Mellon Human Resource Office defines an employee’s Home Department as the department having the primary administrative responsibility for the employee. Faculty may have appointments in more than one Hiring Department, but they have only one Home Department. Because several faculty members have appointments in more than one department, University Planning has included two types of tabular reports for Fall 2004 faculty. The first tabulation for Fall 2004 Faculty reports the Full Time Equivalency (FTE) by Hiring Department. For example, a professor whose home department is Biology (MCS), but who has also been hired for 10% of her appointment in Biomedical Engineering (CIT), is recorded as 0.9 FTE in Biology (MCS) and 0.1 FTE in Biomedical Engineering (CIT). The second type of summary for Fall 2004 Faculty is Headcount by Home Department. The professor in the above example would be reported only once in her home department of Biology. Female and Minority Employees To aid the Divisions and Departments in monitoring their internal diversity goals, we have included FTE summations (by Hiring department) and headcounts (by Home department) for both Female and under-represented Minority employees. These summations and counts are not mutually exclusive; for example, a Hispanic female is counted as both a female and a minority. We define under-represented minorities as US citizens who have self-identified as African American/Black, Native American or Hispanic.
4.3
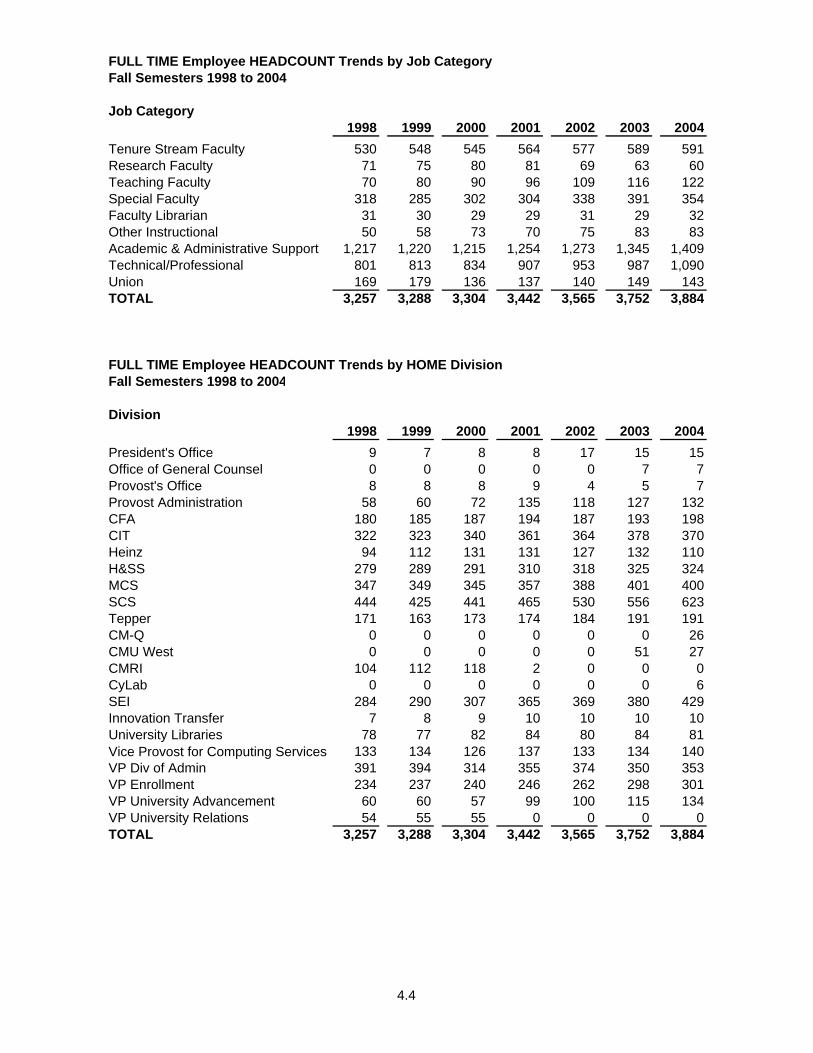
FULL TIME Employee HEADCOUNT Trends by Job Category
Job Category1998 1999 2000 2001 2002 2003 2004
Tenure Stream Faculty 530 548 545 564 577 589 591Research Faculty 71 75 80 81 69 63 60Teaching Faculty 70 80 90 96 109 116 122Special Faculty 318 285 302 304 338 391 354Faculty Librarian 31 30 29 29 31 29 32Other Instructional 50 58 73 70 75 83 83Academic & Administrative Support 1,217 1,220 1,215 1,254 1,273 1,345 1,409Technical/Professional 801 813 834 907 953 987 1,090Union 169 179 136 137 140 149 143TOTAL 3,257 3,288 3,304 3,442 3,565 3,752 3,884
FULL TIME Employee HEADCOUNT Trends by HOME DivisionFall Semesters 1998 to 2004
Division1998 1999 2000 2001 2002 2003 2004
President's Office 9 7 8 8 17 15 15Office of General Counsel 0 0 0 0 0 7 7Provost's Office 8 8 8 9 4 5 7Provost Administration 58 60 72 135 118 127 132CFA 180 185 187 194 187 193 198CIT 322 323 340 361 364 378 370Heinz 94 112 131 131 127 132 110H&SS 279 289 291 310 318 325 324MCS 347 349 345 357 388 401 400SCS 444 425 441 465 530 556 623Tepper 171 163 173 174 184 191 191CM-Q 0 0 0 0 0 0 26CMU West 0 0 0 0 0 51 27CMRI 104 112 118 2 0 0 0CyLab 0 0 0 0 0 0 6SEI 284 290 307 365 369 380 429Innovation Transfer 7 8 9 10 10 10 10University Libraries 78 77 82 84 80 84 81Vice Provost for Computing Services 133 134 126 137 133 134 140VP Div of Admin 391 394 314 355 374 350 353VP Enrollment 234 237 240 246 262 298 301VP University Advancement 60 60 57 99 100 115 134VP University Relations 54 55 55 0 0 0 0TOTAL 3,257 3,288 3,304 3,442 3,565 3,752 3,884
Fall Semesters 1998 to 2004
4.4
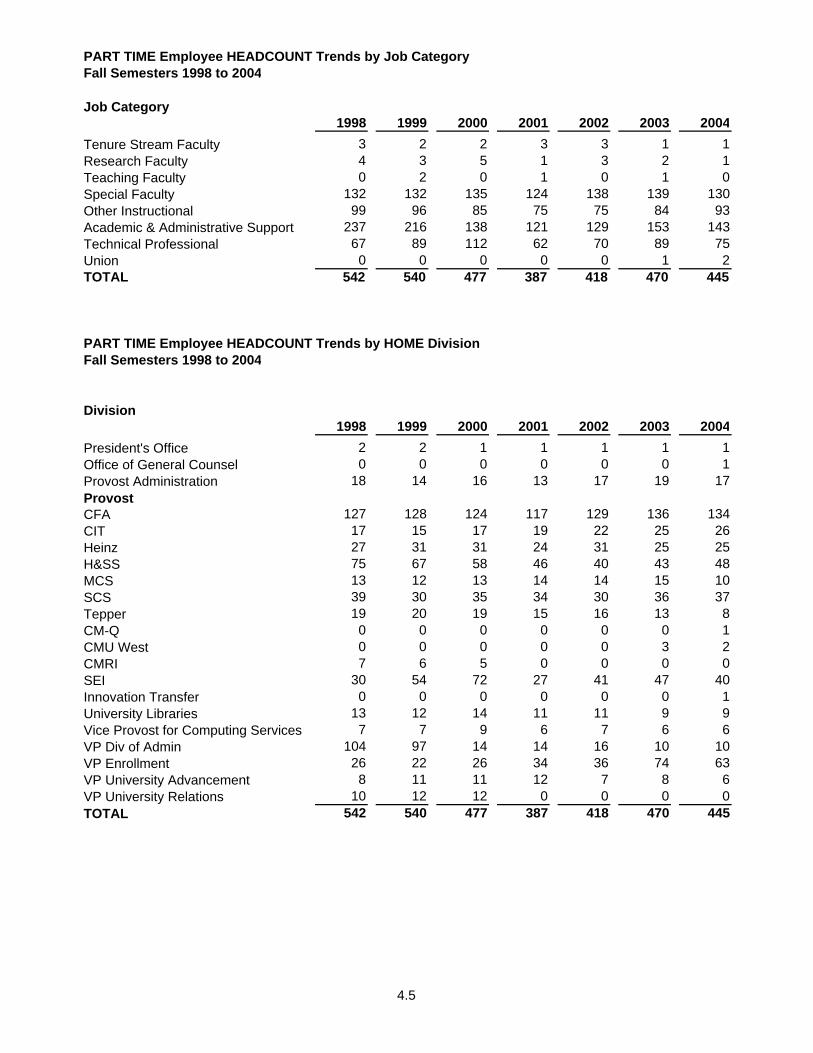
PART TIME Employee HEADCOUNT Trends by Job CategoryFall Semesters 1998 to 2004
1998 1999 2000 2001 2002 2003 2004Tenure Stream Faculty 3 2 2 3 3 1 1Research Faculty 4 3 5 1 3 2 1Teaching Faculty 0 2 0 1 0 1 0Special Faculty 132 132 135 124 138 139 130Other Instructional 99 96 85 75 75 84 93Academic & Administrative Support 237 216 138 121 129 153 143Technical Professional 67 89 112 62 70 89 75Union 0 0 0 0 0 1 2TOTAL 542 540 477 387 418 470 445
PART TIME Employee HEADCOUNT Trends by HOME DivisionFall Semesters 1998 to 2004
1998 1999 2000 2001 2002 2003 2004President's Office 2 2 1 1 1 1 1Office of General Counsel 0 0 0 0 0 0 1Provost Administration 18 14 16 13 17 19 17Provost CFA 127 128 124 117 129 136 134CIT 17 15 17 19 22 25 26Heinz 27 31 31 24 31 25 25H&SS 75 67 58 46 40 43 48MCS 13 12 13 14 14 15 10SCS 39 30 35 34 30 36 37Tepper 19 20 19 15 16 13 8CM-Q 0 0 0 0 0 0 1CMU West 0 0 0 0 0 3 2CMRI 7 6 5 0 0 0 0SEI 30 54 72 27 41 47 40Innovation Transfer 0 0 0 0 0 0 1University Libraries 13 12 14 11 11 9 9Vice Provost for Computing Services 7 7 9 6 7 6 6VP Div of Admin 104 97 14 14 16 10 10VP Enrollment 26 22 26 34 36 74 63VP University Advancement 8 11 11 12 7 8 6VP University Relations 10 12 12 0 0 0 0TOTAL 542 540 477 387 418 470 445
Job Category
Division
4.5

EMPLOYEE HEADCOUNT Trends by HOME Division & Job CategoryFall Semesters 1999 to 2004
Job Category
Total Female Minority Total Female Minority Total Female Minority Total Female Minority Total Female Minority Total Female MinorityTenure Stream Faculty 85 30 7 83 31 6 84 32 9 77 31 9 79 33 9 82 34 9Research Faculty 1 0 0 2 0 0 0 0 0 0 0 0 0 0 0 0 0 0Teaching Faculty 21 7 3 22 7 2 23 8 4 23 9 4 25 9 4 25 10 4Special Faculty 86 35 4 82 31 6 81 28 4 92 34 4 97 36 3 92 31 5Other Instructional 55 22 5 47 20 5 46 20 4 48 22 4 50 24 3 53 24 4Academic & Administrative Support 39 29 2 42 31 4 43 31 4 43 29 4 42 31 3 47 34 3Technical Professional 26 7 2 33 11 1 34 11 0 33 9 0 36 10 1 33 9 0CFA Total 313 130 23 311 131 24 311 130 25 316 134 25 329 143 23 332 142 25
Tenure Stream Faculty 105 10 3 108 9 4 111 8 5 118 11 5 115 13 6 119 13 7Research Faculty 19 3 0 21 4 0 23 5 0 16 5 1 13 4 1 13 4 1Teaching Faculty 4 1 0 4 1 0 5 1 0 5 1 0 5 1 0 6 1 0Special Faculty 63 11 3 67 10 2 67 16 3 68 14 4 79 12 6 70 12 5Other Instructional 2 1 0 2 1 0 2 1 0 2 1 0 3 2 0 3 2 0Academic & Administrative Support 99 82 8 100 83 9 105 87 10 104 85 11 111 88 11 108 90 9Technical Professional 46 6 1 55 9 2 67 17 0 73 18 1 77 19 3 77 11 2CIT Total 338 114 15 357 117 17 380 135 18 386 135 22 403 139 27 396 133 24
Tenure Stream Faculty 26 5 3 27 5 4 31 7 4 29 5 2 30 6 2 29 6 2Research Faculty 3 1 0 4 1 0 5 2 0 3 2 0 1 1 0 1 1 0Teaching Faculty 7 2 0 5 2 0 8 3 0 9 3 0 9 3 0 9 4 0Special Faculty 34 16 2 41 17 2 28 10 1 31 9 0 34 14 0 30 8 0Other Instructional 0 0 0 5 2 0 2 2 0 2 0 0 4 2 1 0 0 0Academic & Administrative Support 57 46 7 66 55 8 63 55 10 68 60 9 61 52 9 51 39 4Technical Professional 16 5 1 14 6 1 18 6 1 16 5 2 18 4 2 15 4 2Heinz Total 143 75 13 162 88 15 155 85 16 158 84 13 157 82 14 135 62 8
Tenure Stream Faculty 115 41 6 115 41 5 118 43 9 116 44 9 118 47 10 115 41 9Research Faculty 4 2 0 3 1 0 2 1 0 4 2 0 5 2 0 6 3 0Teaching Faculty 17 10 2 18 10 2 19 12 0 22 13 1 21 13 1 21 13 1Special Faculty 56 23 1 62 29 1 61 25 5 58 28 6 63 26 4 63 29 5Faculty Librarians 0 0 0 1 1 0 0 0 0 0 0 0 0 0 0 0 0 0Other Instructional 41 32 2 35 30 2 31 26 3 29 23 3 34 28 3 39 29 4Academic & Administrative Support 74 67 10 63 58 9 64 53 11 65 55 9 64 57 9 67 58 8Technical Professional 49 29 3 52 27 3 61 32 5 64 37 2 63 36 2 61 37 0H&SS Total 356 204 24 349 197 22 356 192 33 358 202 30 368 209 29 372 210 27
Tenure Stream Faculty 99 6 2 95 7 2 97 8 2 102 9 2 109 13 2 106 12 2Research Faculty 7 1 0 8 2 0 7 1 0 7 1 0 6 0 0 4 0 0Teaching Faculty 10 5 0 11 6 0 12 6 0 14 6 0 15 7 0 16 8 0Special Faculty 74 25 3 82 27 2 88 30 4 101 33 5 95 33 4 88 23 5Other Instructional 2 0 0 2 0 0 1 0 0 2 0 0 2 0 0 1 0 0Academic & Administrative Support 73 56 8 70 52 8 71 50 7 70 51 8 77 55 8 76 53 9Technical Professional 96 28 0 90 29 0 95 32 2 106 33 1 112 37 1 119 40 1MCS Total 361 121 13 358 123 12 371 127 15 402 133 16 416 145 15 410 136 17
Tenure Stream Faculty 50 7 0 53 8 0 60 11 0 65 12 1 70 14 1 75 15 1Research Faculty 40 5 1 45 4 1 42 5 1 41 5 0 38 7 0 36 8 0Teaching Faculty 13 3 1 16 2 2 14 0 2 18 0 2 20 1 2 21 1 1Special Faculty 78 16 3 81 18 3 86 20 1 106 17 1 106 14 1 104 11 1Other Instructional 2 2 1 1 1 1 1 0 0 0 0 0 0 0 0 2 1 0Academic & Administrative Support 103 69 10 118 82 10 125 81 11 135 87 12 145 92 16 157 99 12Technical Professional 169 34 2 162 31 2 171 36 2 195 42 2 213 45 2 265 51 3SCS Total 455 136 18 476 146 19 499 153 17 560 163 18 592 173 22 660 186 18
2000 2001 2004
MCS
SCS
2002 2003
CFA
CIT
Heinz
H&SS
Division1999
4.6

EMPLOYEE HEADCOUNT Trends by HOME Division & Job Category (Cont.)Fall Semesters 1999 to 2004
Division Job Category
Total Female Minority Total Female Minority Total Female Minority Total Female Minority Total Female Minority Total Female MinorityTepper Tenure Stream Faculty 69 9 1 66 6 1 66 8 0 72 11 0 68 11 0 65 11 0
Research Faculty 0 0 0 0 0 0 1 0 1 1 0 1 2 0 1 1 0 0Teaching Faculty 9 2 1 13 2 1 15 2 1 15 3 1 17 3 1 16 2 1Special Faculty 19 4 0 17 4 0 12 4 0 14 5 2 10 4 0 12 5 0Other Instructional 0 0 0 1 1 0 0 0 0 1 0 0 0 0 0 1 0 0Academic & Administrative Support 82 67 8 89 74 11 86 69 8 87 67 5 95 71 7 92 70 8Technical Professional 4 0 0 6 0 0 9 2 0 10 2 1 12 4 0 12 5 1Tepper Subtotal 183 82 10 192 87 13 189 85 10 200 88 10 204 93 9 199 93 10
CMU-Q Teaching Faculty 0 0 0 0 0 0 0 0 0 0 0 0 0 0 0 4 1 1Faculty Librarians 0 0 0 0 0 0 0 0 0 0 0 0 0 0 0 1 1 0Academic & Administrative Support 0 0 0 0 0 0 0 0 0 0 0 0 0 0 0 18 10 0Technical Professional 0 0 0 0 0 0 0 0 0 0 0 0 0 0 0 4 0 0CM-Q Subtotal 0 0 0 0 0 0 0 0 0 0 0 0 0 0 0 27 12 1
CMU West Teaching Faculty 0 0 0 0 0 0 0 0 0 0 0 0 1 0 0 0 0 0Special Faculty 0 0 0 0 0 0 0 0 0 0 0 0 41 11 0 16 3 0
Academic & Administrative Support 0 0 0 0 0 0 0 0 0 0 0 0 8 6 0 8 7 0Technical Professional 0 0 0 0 0 0 0 0 0 0 0 0 4 0 0 5 0 0CMU West Subtotal 0 0 0 0 0 0 0 0 0 0 0 0 54 17 0 29 10 0
SEI Research Faculty 1 0 0 0 0 0 0 0 0 0 0 0 0 0 0 0 0 0Special Faculty 1 1 0 0 0 0 0 0 0 0 0 0 0 0 0 0 0 0Faculty Librarians 0 0 0 0 0 0 0 0 0 2 2 0 2 2 0 2 2 0Academic & Administrative Support 103 79 7 110 82 6 120 94 8 120 92 11 119 96 8 131 108 10Technical Professional 239 63 3 269 73 7 272 77 5 288 84 4 306 99 8 336 105 8SEI Subtotal 344 143 10 379 155 13 392 171 13 410 178 15 427 197 16 469 215 18
Administrative Tenure Stream Faculty 1 0 0 0 0 0 0 0 0 1 0 0 1 0 0 1 0 0Research Faculty 3 1 0 2 1 0 2 1 0 0 0 0 0 0 0 0 0 0Teaching Faculty 1 1 0 1 1 0 1 1 0 3 2 0 4 3 0 4 3 0Special Faculty 6 3 1 5 2 1 5 2 1 6 3 1 5 2 1 9 2 1Faculty Librarians 30 23 1 28 23 1 29 24 2 29 23 2 27 21 2 29 23 2Other Instructional 52 31 1 65 41 2 62 37 0 66 39 2 74 44 3 77 46 6Academic & Administrative Support 806 529 114 695 458 76 698 468 77 710 467 78 776 503 92 797 524 95Technical Professional 257 90 18 265 98 19 242 97 22 238 101 20 235 104 18 238 101 18Union 179 40 60 136 12 37 137 13 41 140 12 36 150 12 36 145 17 36Adm Subtotal 1335 718 195 1197 636 136 1176 643 143 1193 647 139 1272 689 152 1300 716 158
Total Tenure Stream Faculty 550 108 22 547 107 22 567 117 29 580 123 28 590 137 30 592 132 30Research Faculty 78 13 1 85 13 1 82 15 2 72 15 2 65 14 2 61 16 1Teaching Faculty 82 31 7 90 31 7 97 33 7 109 37 8 117 40 8 122 43 8Special Faculty 417 134 17 437 138 17 428 135 19 476 143 23 530 152 19 484 124 22Faculty Librarians 30 23 1 29 24 1 29 24 2 31 25 2 29 23 2 32 26 2Other Instructional 154 88 9 158 96 10 145 86 7 150 85 9 167 100 10 176 102 14Academic & Administrative Support 1436 1024 174 1353 975 141 1375 988 146 1402 993 147 1498 1051 163 1552 1092 158Technical Professional 902 262 30 946 284 35 969 310 37 1023 331 33 1076 358 37 1165 363 35Union 179 40 60 136 12 37 137 13 41 140 12 36 150 12 36 145 17 36TOTAL 3828 1723 321 3781 1680 271 3829 1721 290 3983 1764 288 4222 1887 307 4329 1915 306
2003 20041999 2000 2001 2002
4.7
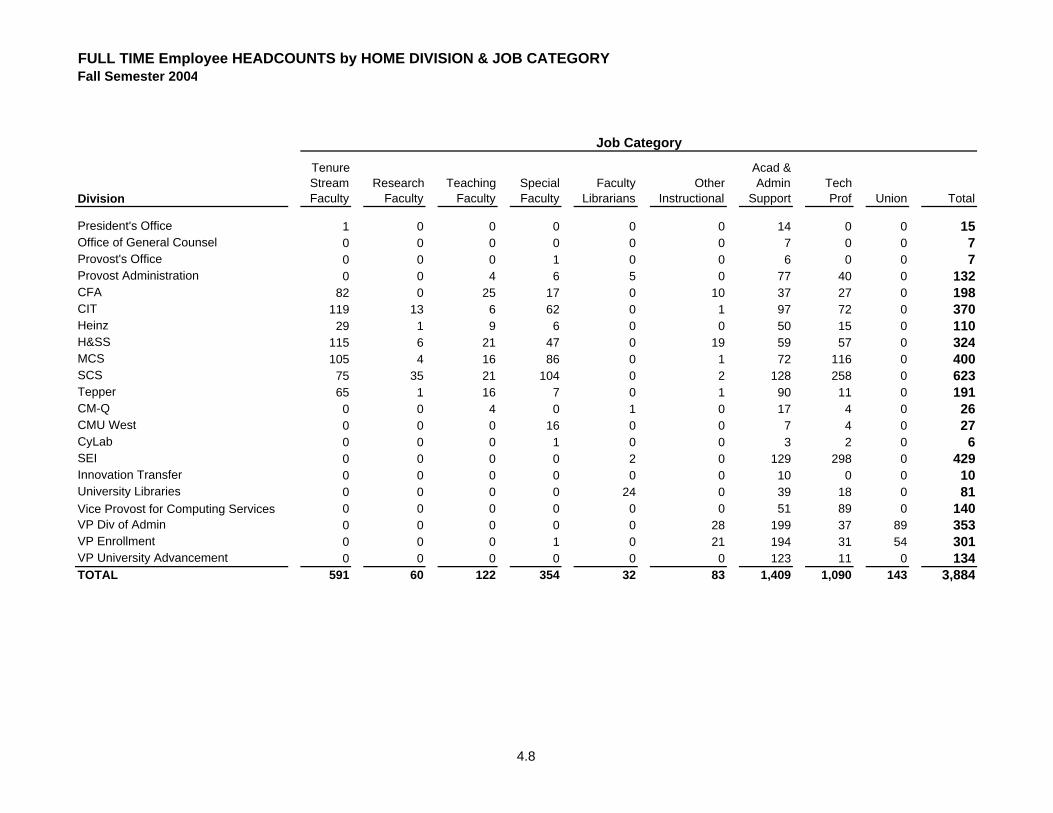
FULL TIME Employee HEADCOUNTS by HOME DIVISION & JOB CATEGORYFall Semester 2004
Division
Tenure Stream Faculty
Research Faculty
Teaching Faculty
Special Faculty
Faculty Librarians
Other Instructional
Acad & Admin
SupportTech Prof Union Total
President's Office 1 0 0 0 0 0 14 0 0 15Office of General Counsel 0 0 0 0 0 0 7 0 0 7Provost's Office 0 0 0 1 0 0 6 0 0 7Provost Administration 0 0 4 6 5 0 77 40 0 132CFA 82 0 25 17 0 10 37 27 0 198CIT 119 13 6 62 0 1 97 72 0 370Heinz 29 1 9 6 0 0 50 15 0 110H&SS 115 6 21 47 0 19 59 57 0 324MCS 105 4 16 86 0 1 72 116 0 400SCS 75 35 21 104 0 2 128 258 0 623Tepper 65 1 16 7 0 1 90 11 0 191CM-Q 0 0 4 0 1 0 17 4 0 26CMU West 0 0 0 16 0 0 7 4 0 27CyLab 0 0 0 1 0 0 3 2 0 6SEI 0 0 0 0 2 0 129 298 0 429Innovation Transfer 0 0 0 0 0 0 10 0 0 10University Libraries 0 0 0 0 24 0 39 18 0 81Vice Provost for Computing Services 0 0 0 0 0 0 51 89 0 140VP Div of Admin 0 0 0 0 0 28 199 37 89 353VP Enrollment 0 0 0 1 0 21 194 31 54 301VP University Advancement 0 0 0 0 0 0 123 11 0 134TOTAL 591 60 122 354 32 83 1,409 1,090 143 3,884
Job Category
4.8
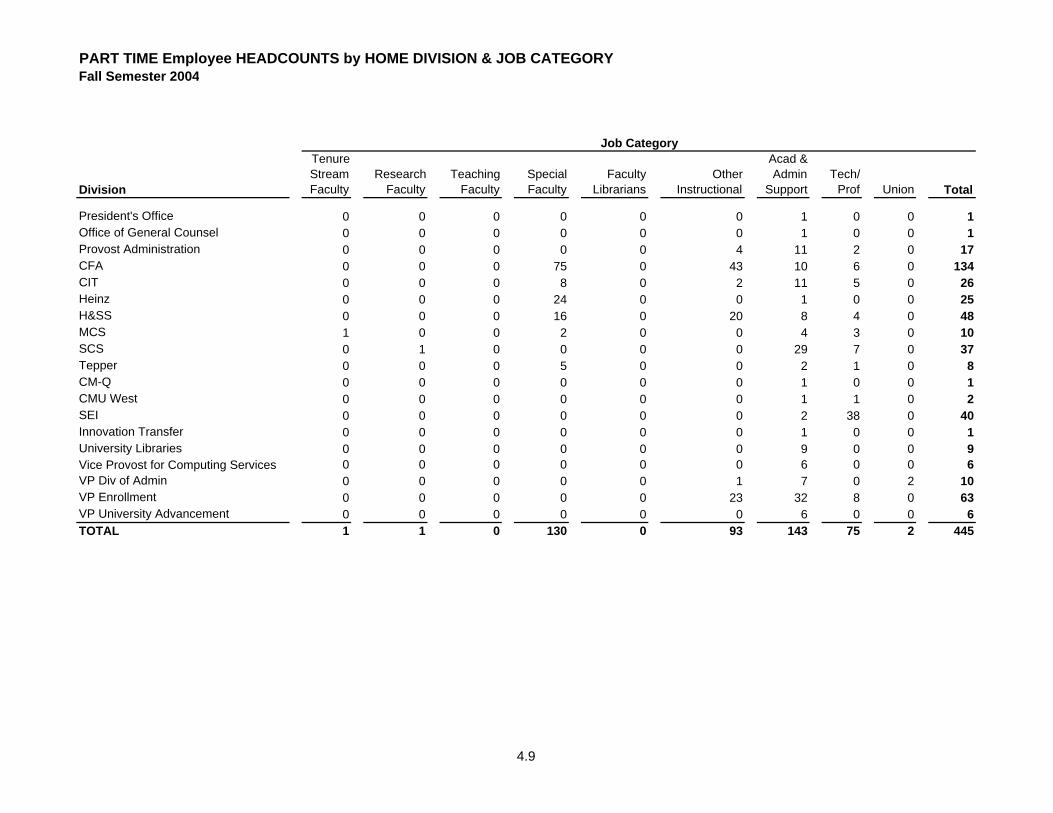
PART TIME Employee HEADCOUNTS by HOME DIVISION & JOB CATEGORYFall Semester 2004
Division
Tenure Stream Faculty
Research Faculty
Teaching Faculty
Special Faculty
Faculty Librarians
Other Instructional
Acad & Admin
SupportTech/
Prof Union Total
President's Office 0 0 0 0 0 0 1 0 0 1Office of General Counsel 0 0 0 0 0 0 1 0 0 1Provost Administration 0 0 0 0 0 4 11 2 0 17CFA 0 0 0 75 0 43 10 6 0 134CIT 0 0 0 8 0 2 11 5 0 26Heinz 0 0 0 24 0 0 1 0 0 25H&SS 0 0 0 16 0 20 8 4 0 48MCS 1 0 0 2 0 0 4 3 0 10SCS 0 1 0 0 0 0 29 7 0 37Tepper 0 0 0 5 0 0 2 1 0 8CM-Q 0 0 0 0 0 0 1 0 0 1CMU West 0 0 0 0 0 0 1 1 0 2SEI 0 0 0 0 0 0 2 38 0 40Innovation Transfer 0 0 0 0 0 0 1 0 0 1University Libraries 0 0 0 0 0 0 9 0 0 9Vice Provost for Computing Services 0 0 0 0 0 0 6 0 0 6VP Div of Admin 0 0 0 0 0 1 7 0 2 10VP Enrollment 0 0 0 0 0 23 32 8 0 63VP University Advancement 0 0 0 0 0 0 6 0 0 6TOTAL 1 1 0 130 0 93 143 75 2 445
Job Category
4.9

Full & Part Time FACULTY FTEs by HIRING Department and Job CategoryFall Semester 2004
Division Department
Tota
l
Fem
ale
Min
ority
Tota
l
Fem
ale
Min
ority
Tota
l
Fem
ale
Min
ority
Tota
l
Fem
ale
Min
ority
Tota
l
Fem
ale
Min
ority
Tota
l
Fem
ale
Min
ority
Tota
l
Fem
ale
Min
ority
Tota
l
Fem
ale
Min
ority
Tota
l
Fem
ale
Min
ority
CFA ARCHITECTURE 12.5 4 0 0 0 0 2 1 0 1.1 0.1 0 6.5 1.7 0.2 0 0 0 5.9 3 0.8 0 0 0 28 9.8 1ART 17.7 8.7 1.7 0 0 0 0 0 0 4.2 2 0 1.2 0.2 0 0 0 0 0 0 0 0 0 0 23.1 10.9 1.7CBPD 0 0 0 0 0 0 0 0 0 1 1 0 1 0 0 0 0 0 0 0 0 0 0 0 2 1 0DESIGN 12.7 4.3 1 0 0 0 3 2 0 4 1 0 1.7 1 0 0 0 0 0 0 0 0 0 0 21.4 8.3 1DRAMA 19.4 8.6 1 0 0 0 11.5 4 2 1 1 0 0.9 0.2 0 0 0 0 1.5 1.4 0.1 0.1 0 0 34.4 15.2 3.1MUSIC 18.9 7.9 5 0 0 0 8.8 2.8 1.9 2 0 0 4.1 1.9 0.6 0 0 0 7.4 1.5 1.7 0 0 0 41.2 14 9.1MUSIC-EXT DIV 0 0 0 0 0 0 0 0 0 0 0 0 0.3 0.2 0 0 0 0 1 0.4 0 0 0 0 1.3 0.6 0MUSIC-PREP SCH 0.2 0.2 0 0 0 0 0.2 0.2 0.2 0 0 0 0.9 0.7 0 0 0 0 1.1 0.9 0.1 0 0 0 2.3 1.9 0.2SAT PRE ART 0 0 0 0 0 0 0 0 0 0 0 0 1 0.5 0 0 0 0 0 0 0 0 0 0 1 0.5 0SFCI 0 0 0 0 0 0 0 0 0 3.8 2 1 1.2 0.2 0 0 0 0 0 0 0 0 0 0 5 2.2 1DEAN'S OFC 1.2 0 0 0 0 0 0 0 0 0 0 0 0.7 0.2 0 0 0 0 1 0 0 1.2 0.2 0.2 4.1 0.4 0.2CFA Total 82.4 33.6 8.7 0 0 0 25.5 10 4 17.1 7.1 1 19.5 6.7 0.8 0 0 0 17.8 7.1 2.7 1.3 0.2 0.2 163.6 64.7 17.3
CIT BIOMEDICAL ENG 3.5 1 0 0 0 0 0 0 0 1 0 0 0.5 0 0 0 0 0 0 0 0 0 0 0 5 1 0CHEMICAL ENG 16 1 1 0 0 0 1 1 0 12 3 3 0 0 0 0 0 0 0.5 0.5 0 0 0 0 29.5 5.5 4CIVIL & ENV ENG 14.5 3 2 1 0 0 1.3 0.3 0 3 1 0 0.7 0.7 0 0 0 0 0 0 0 0 0 0 20.5 5 2CTR BONE TISSUE 0 0 0 0 0 0 0 0 0 1 0 0 0 0 0 0 0 0 0 0 0 0 0 0 1 0 0ELEC & COMP ENG 39.5 3.5 1.5 4 2 0 1 0 0 14 1 0 1.4 0 0 0 0 0 0 0 0 0 0 0 59.9 6.5 1.5EPP 9.3 0.5 0 1 1 0 1 0 0 6 0 0 1.5 0.5 0 0 0 0 0 0 0 0 0 0 18.8 2 0ICES 0 0 0 7 1 1 0 0 0 5 0 0 0 0 0 0 0 0 0 0 0 0 0 0 12 1 1INFO NETWORKING INST 0 0 0 0 0 0 0 0 0 0 0 0 0 0 0 0 0 0 0 0 0 1 1 0 1 1 0MECHANICAL ENG 20.9 2.4 1.9 0 0 0 0 0 0 8.8 1 1 0 0 0 0 0 0 0.3 0 0 0 0 0 29.9 3.4 2.9MSE 15.5 2 0.5 0 0 0 1 0 0 9 3 1 0 0 0 0 0 0 0 0 0 0 0 0 25.5 5 1.5DEAN'S OFC 0.1 0.1 0.1 0 0 0 1 0 0 0 0 0 0 0 0 0 0 0 0 0 0 1 0 0 2.1 0.1 0.1CIT Total 119 13.5 7 13 4 1 6.3 1.3 0 59.8 9 5 4.1 1.2 0 0 0 0 0.8 0.5 0 2 1 0 205.2 30.5 13
Heinz 29 6 2 1 1 0 8.8 3.7 0 6 1 0 3.4 0.9 0 0 0 0 0 0 0 1 0 0 49.2 12.6 2
H&SS CNBC 2 0 0 0 0 0 0 0 0 5 1 0 0 0 0 0 0 0 0 0 0 0 0 0 7 1 0CTR-ARTS IN SOC 0.2 0.2 0 0 0 0 0 0 0 0.7 0.7 0 0 0 0 0 0 0 0 0 0 0 0 0 0.9 0.9 0ENGLISH 25 12 3 0 0 0 1 1 0 3 2 0 0.6 0.4 0.2 0 0 0 0 0 0 0 0 0 29.6 15.4 3.2H&SS MULTIMEDIA 0 0 0 0 0 0 0 0 0 0 0 0 0.3 0 0 0 0 0 0 0 0 0 0 0 0.3 0 0HISTORY 18.4 7.9 3 0 0 0 0 0 0 2.5 1 1 1.8 1.7 0 0 0 0 1.2 0.2 0 0 0 0 23.8 10.7 4IS Program 0 0 0 0 0 0 3 0 0 0 0 0 0 0 0 0 0 0 0 0 0 0 0 0 3 0 0MODERN LANG 7 5 2 0 0 0 12 9 1 1 1 0 0 0 0 0 0 0 7.1 6.1 0.9 1 1 0 28.1 22.1 3.9PHILOSOPHY 14 1 1 1 1 0 3 1 0 0 0 0 1.2 0 0 0 0 0 0 0 0 0 0 0 19.2 3 1PSYCHOLOGY 22 8 0 1 0 0 1 1 0 22.9 9.9 0 0.3 0.3 0 0 0 0 2.1 1.7 1 0 0 0 49.3 20.9 1SOC & DEC SCI 13 4 0 1 1 0 1 1 0 6 3 1 0.4 0.1 0 0 0 0 0 0 0 0 0 0 21.4 9.1 1STATISTICS 12.1 2.1 0 3 1 0 1 0 0 7 2 2 0 0 0 0 0 0 0.5 0 0 0.1 0 0 23.7 5.1 2DEAN'S OFC 1 1 0 0 0 0 0 0 0 0 0 0 0 0 0 0 0 0 0 0 0 1 0 0 2 1 0H&SS Total 115 41.1 9 6 3 0 21.9 13 1 48.1 20.6 4 4.5 2.4 0.2 0 0 0 10.9 8 1.9 2.1 1 0 208 89.1 16.1
Acad & Adm Support Total FacultyLibrarian
Other Instructional
Full Time Special
Part Time Special Tenure Stream Research Teaching
4.10
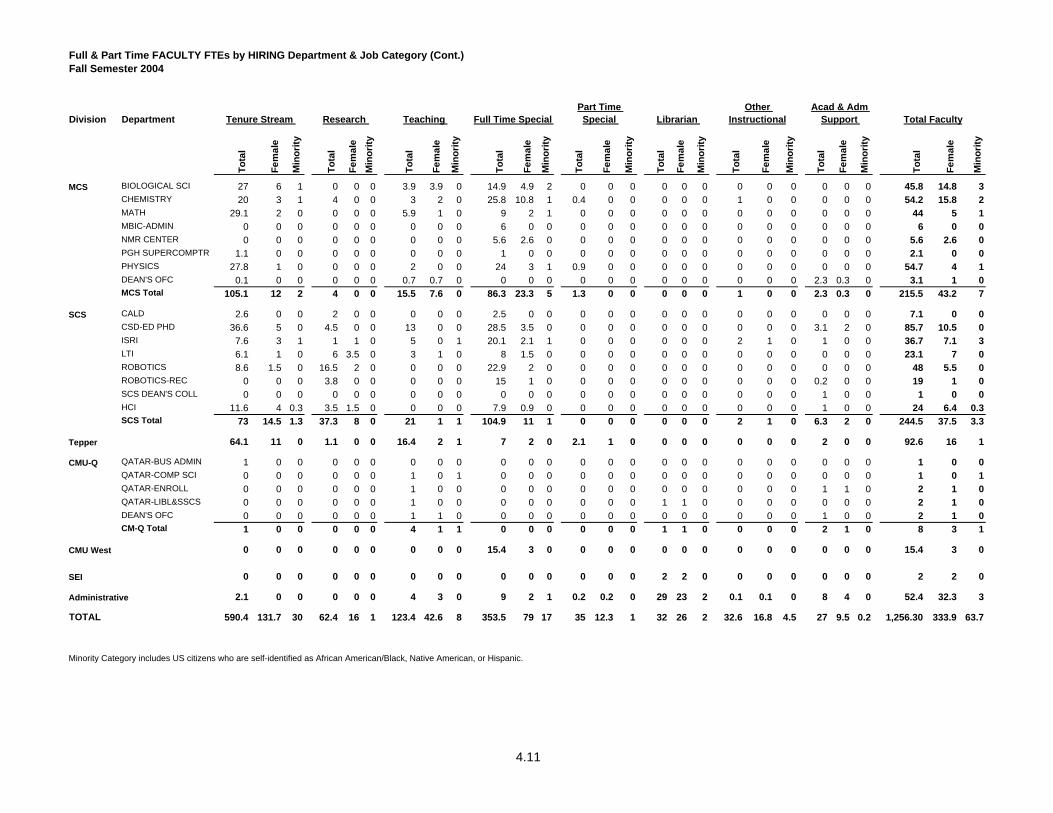
Full & Part Time FACULTY FTEs by HIRING Department & Job Category (Cont.)Fall Semester 2004
Division Department
Tota
l
Fem
ale
Min
ority
Tota
l
Fem
ale
Min
ority
Tota
l
Fem
ale
Min
ority
Tota
l
Fem
ale
Min
ority
Tota
l
Fem
ale
Min
ority
Tota
l
Fem
ale
Min
ority
Tota
l
Fem
ale
Min
ority
Tota
l
Fem
ale
Min
ority
Tota
l
Fem
ale
Min
ority
MCS BIOLOGICAL SCI 27 6 1 0 0 0 3.9 3.9 0 14.9 4.9 2 0 0 0 0 0 0 0 0 0 0 0 0 45.8 14.8 3CHEMISTRY 20 3 1 4 0 0 3 2 0 25.8 10.8 1 0.4 0 0 0 0 0 1 0 0 0 0 0 54.2 15.8 2MATH 29.1 2 0 0 0 0 5.9 1 0 9 2 1 0 0 0 0 0 0 0 0 0 0 0 0 44 5 1MBIC-ADMIN 0 0 0 0 0 0 0 0 0 6 0 0 0 0 0 0 0 0 0 0 0 0 0 0 6 0 0NMR CENTER 0 0 0 0 0 0 0 0 0 5.6 2.6 0 0 0 0 0 0 0 0 0 0 0 0 0 5.6 2.6 0PGH SUPERCOMPTR 1.1 0 0 0 0 0 0 0 0 1 0 0 0 0 0 0 0 0 0 0 0 0 0 0 2.1 0 0PHYSICS 27.8 1 0 0 0 0 2 0 0 24 3 1 0.9 0 0 0 0 0 0 0 0 0 0 0 54.7 4 1DEAN'S OFC 0.1 0 0 0 0 0 0.7 0.7 0 0 0 0 0 0 0 0 0 0 0 0 0 2.3 0.3 0 3.1 1 0MCS Total 105.1 12 2 4 0 0 15.5 7.6 0 86.3 23.3 5 1.3 0 0 0 0 0 1 0 0 2.3 0.3 0 215.5 43.2 7
SCS CALD 2.6 0 0 2 0 0 0 0 0 2.5 0 0 0 0 0 0 0 0 0 0 0 0 0 0 7.1 0 0CSD-ED PHD 36.6 5 0 4.5 0 0 13 0 0 28.5 3.5 0 0 0 0 0 0 0 0 0 0 3.1 2 0 85.7 10.5 0ISRI 7.6 3 1 1 1 0 5 0 1 20.1 2.1 1 0 0 0 0 0 0 2 1 0 1 0 0 36.7 7.1 3LTI 6.1 1 0 6 3.5 0 3 1 0 8 1.5 0 0 0 0 0 0 0 0 0 0 0 0 0 23.1 7 0ROBOTICS 8.6 1.5 0 16.5 2 0 0 0 0 22.9 2 0 0 0 0 0 0 0 0 0 0 0 0 0 48 5.5 0ROBOTICS-REC 0 0 0 3.8 0 0 0 0 0 15 1 0 0 0 0 0 0 0 0 0 0 0.2 0 0 19 1 0SCS DEAN'S COLL 0 0 0 0 0 0 0 0 0 0 0 0 0 0 0 0 0 0 0 0 0 1 0 0 1 0 0HCI 11.6 4 0.3 3.5 1.5 0 0 0 0 7.9 0.9 0 0 0 0 0 0 0 0 0 0 1 0 0 24 6.4 0.3SCS Total 73 14.5 1.3 37.3 8 0 21 1 1 104.9 11 1 0 0 0 0 0 0 2 1 0 6.3 2 0 244.5 37.5 3.3
Tepper 64.1 11 0 1.1 0 0 16.4 2 1 7 2 0 2.1 1 0 0 0 0 0 0 0 2 0 0 92.6 16 1
CMU-Q QATAR-BUS ADMIN 1 0 0 0 0 0 0 0 0 0 0 0 0 0 0 0 0 0 0 0 0 0 0 0 1 0 0QATAR-COMP SCI 0 0 0 0 0 0 1 0 1 0 0 0 0 0 0 0 0 0 0 0 0 0 0 0 1 0 1QATAR-ENROLL 0 0 0 0 0 0 1 0 0 0 0 0 0 0 0 0 0 0 0 0 0 1 1 0 2 1 0QATAR-LIBL&SSCS 0 0 0 0 0 0 1 0 0 0 0 0 0 0 0 1 1 0 0 0 0 0 0 0 2 1 0DEAN'S OFC 0 0 0 0 0 0 1 1 0 0 0 0 0 0 0 0 0 0 0 0 0 1 0 0 2 1 0CM-Q Total 1 0 0 0 0 0 4 1 1 0 0 0 0 0 0 1 1 0 0 0 0 2 1 0 8 3 1
CMU West 0 0 0 0 0 0 0 0 0 15.4 3 0 0 0 0 0 0 0 0 0 0 0 0 0 15.4 3 0
SEI 0 0 0 0 0 0 0 0 0 0 0 0 0 0 0 2 2 0 0 0 0 0 0 0 2 2 0
Administrative 2.1 0 0 0 0 0 4 3 0 9 2 1 0.2 0.2 0 29 23 2 0.1 0.1 0 8 4 0 52.4 32.3 3
590.4 131.7 30 62.4 16 1 123.4 42.6 8 353.5 79 17 35 12.3 1 32 26 2 32.6 16.8 4.5 27 9.5 0.2 1,256.30 333.9 63.7
Minority Category includes US citizens who are self-identified as African American/Black, Native American, or Hispanic.
TOTAL
Full Time Special Part Time Special Tenure Stream Research Teaching
Acad & Adm Support Total FacultyLibrarian
Other Instructional
4.11

Full & Part Time FACULTY HEADCOUNTS by HOME Department & Job CategoryFall Semester 2004
Division Department
Tota
l
Fem
ale
Min
ority
Tota
l
Fem
ale
Min
ority
Tota
l
Fem
ale
Min
ority
Tota
l
Fem
ale
Min
ority
Tota
l
Fem
ale
Min
ority
Tota
l
Fem
ale
Min
ority
Tota
l
Fem
ale
Min
ority
Tota
l
Fem
ale
Min
ority
Tota
l
Fem
ale
Min
ority
CFA ARCHITECTURE 12 4 0 0 0 0 2 1 0 1 0 0 20 4 1 0 0 0 6 3 1 0 0 0 41 12 2ART 18 9 2 0 0 0 0 0 0 4 2 0 4 0 0 0 0 0 0 0 0 0 0 0 26 11 2CBPD 0 0 0 0 0 0 0 0 0 1 1 0 0 0 0 0 0 0 0 0 0 0 0 0 1 1 0DESIGN 12 4 1 0 0 0 3 2 0 4 1 0 5 4 0 0 0 0 0 0 0 0 0 0 24 11 1DRAMA 20 9 1 0 0 0 11 4 2 1 1 0 1 0 0 0 0 0 2 2 0 1 0 0 36 16 3MUSIC 19 8 5 0 0 0 9 3 2 2 0 0 26 8 2 0 0 0 23 6 2 0 0 0 79 25 11MUSIC-EXT DIV 0 0 0 0 0 0 0 0 0 0 0 0 5 3 1 0 0 0 10 6 0 0 0 0 15 9 1MUSIC-PREP SCH 0 0 0 0 0 0 0 0 0 0 0 0 4 1 0 0 0 0 10 6 1 0 0 0 14 7 1SAT PRE ART 0 0 0 0 0 0 0 0 0 0 0 0 4 2 0 0 0 0 0 0 0 0 0 0 4 2 0SFCI 0 0 0 0 0 0 0 0 0 4 2 1 3 1 0 0 0 0 0 0 0 0 0 0 7 3 1DEAN'S OFC 1 0 0 0 0 0 0 0 0 0 0 0 3 1 0 0 0 0 1 0 0 1 0 0 6 1 0CFA Total 82 34 9 0 0 0 25 10 4 17 7 1 75 24 4 0 0 0 52 23 4 2 0 0 253 98 22
CIT BIOMEDICAL ENG 3 1 0 0 0 0 0 0 0 1 0 0 1 0 0 0 0 0 0 0 0 0 0 0 5 1 0CHEMICAL ENG 16 1 1 0 0 0 1 1 0 12 3 3 0 0 0 0 0 0 1 1 0 0 0 0 30 6 4CIVIL & ENV ENG 18 3 2 1 0 0 1 0 0 3 1 0 2 2 0 0 0 0 0 0 0 0 0 0 25 6 2CTR BONE TISSUE 0 0 0 0 0 0 0 0 0 1 0 0 0 0 0 0 0 0 0 0 0 0 0 0 1 0 0ELEC & COMP ENG 41 4 2 4 2 0 1 0 0 15 1 0 2 0 0 0 0 0 0 0 0 0 0 0 63 7 2EPP 5 0 0 1 1 0 1 0 0 6 0 0 2 1 0 0 0 0 0 0 0 0 0 0 15 2 0ICES 0 0 0 7 1 1 0 0 0 5 0 0 0 0 0 0 0 0 0 0 0 0 0 0 12 1 1INFO NETWORKING INST 0 0 0 0 0 0 0 0 0 0 0 0 0 0 0 0 0 0 0 0 0 1 1 0 1 1 0MECHANICAL ENG 21 2 2 0 0 0 0 0 0 10 1 1 1 0 0 0 0 0 1 0 0 0 0 0 33 3 3MSE 15 2 0 0 0 0 1 0 0 9 3 1 0 0 0 0 0 0 0 0 0 0 0 0 25 5 1DEAN'S OFC 0 0 0 0 0 0 1 0 0 0 0 0 0 0 0 0 0 0 0 0 0 1 0 0 2 0 0CIT Total 119 13 7 13 4 1 6 1 0 62 9 5 8 3 0 0 0 0 2 1 0 2 1 0 212 32 13
Heinz 29 6 2 1 1 0 9 4 0 6 1 0 24 7 0 0 0 0 0 0 0 1 0 0 70 19 2
H&SS CNBC 1 0 0 0 0 0 0 0 0 4 1 0 0 0 0 0 0 0 1 0 0 0 0 0 6 1 0CTR-ARTS IN SOC 0 0 0 0 0 0 0 0 0 1 1 0 0 0 0 0 0 0 0 0 0 0 0 0 1 1 0ENGLISH 25 12 3 0 0 0 1 1 0 3 2 0 4 3 1 0 0 0 0 0 0 0 0 0 33 18 4H&SS ACAD ADV C 0 0 0 0 0 0 0 0 0 0 0 0 1 1 0 0 0 0 0 0 0 0 0 0 1 1 0H&SS MULTIMEDIA 0 0 0 0 0 0 0 0 0 0 0 0 2 0 0 0 0 0 0 0 0 0 0 0 2 0 0HISTORY 19 8 3 0 0 0 0 0 0 3 1 1 5 4 0 0 0 0 3 2 0 0 0 0 30 15 4IS PGM-H&SS 0 0 0 0 0 0 3 0 0 0 0 0 0 0 0 0 0 0 0 0 0 0 0 0 3 0 0MODERN LANG 7 5 2 0 0 0 12 9 1 1 1 0 0 0 0 0 0 0 14 12 2 1 1 0 35 28 5PHILOSOPHY 14 1 1 1 1 0 3 1 0 0 0 0 2 0 0 0 0 0 0 0 0 0 0 0 20 3 1PSYCHOLOGY 22 8 0 1 0 0 1 1 0 22 9 0 0 0 0 0 0 0 6 5 1 0 0 0 52 23 1SOC & DEC SCI 14 4 0 1 1 0 1 1 0 6 3 1 2 1 0 0 0 0 0 0 0 0 0 0 24 10 1STATISTICS 12 2 0 3 1 0 0 0 0 7 2 2 0 0 0 0 0 0 1 0 0 1 0 0 24 5 2DEAN'S OFC 1 1 0 0 0 0 0 0 0 0 0 0 0 0 0 0 0 0 0 0 0 1 0 0 2 1 0H&SS Total 115 41 9 6 3 0 21 13 1 47 20 4 16 9 1 0 0 0 25 19 3 3 1 0 233 106 18
Acad & Adm Support Total FacultyLibrarian
Other Instructional
Full Time Special
Part Time Special Tenure Stream Research Teaching
4.12

Full & Part Time FACULTY HEADCOUNTS by HOME Department & Job Category (Cont.)Fall Semester 2004
Division Department
Tota
l
Fem
ale
Min
ority
Tota
l
Fem
ale
Min
ority
Tota
l
Fem
ale
Min
ority
Tota
l
Fem
ale
Min
ority
Tota
l
Fem
ale
Min
ority
Tota
l
Fem
ale
Min
ority
Tota
l
Fem
ale
Min
ority
Tota
l
Fem
ale
Min
ority
Tota
l
Fem
ale
Min
ority
MCS BIOLOGICAL SCI 27 6 1 0 0 0 5 5 0 15 5 2 0 0 0 0 0 0 0 0 0 0 0 0 47 16 3CHEMISTRY 20 3 1 4 0 0 3 2 0 25 10 1 1 0 0 0 0 0 1 0 0 1 1 0 55 16 2MATH 30 2 0 0 0 0 6 1 0 9 2 1 0 0 0 0 0 0 0 0 0 0 0 0 45 5 1MBIC-ADMIN 0 0 0 0 0 0 0 0 0 6 0 0 0 0 0 0 0 0 0 0 0 0 0 0 6 0 0NMR CENTER 0 0 0 0 0 0 0 0 0 6 3 0 0 0 0 0 0 0 0 0 0 0 0 0 6 3 0PGH SUPERCOMPTR 1 0 0 0 0 0 0 0 0 1 0 0 0 0 0 0 0 0 0 0 0 0 0 0 2 0 0PHYSICS 28 1 0 0 0 0 2 0 0 24 3 1 1 0 0 0 0 0 0 0 0 0 0 0 55 4 1DEAN'S OFC 0 0 0 0 0 0 0 0 0 0 0 0 0 0 0 0 0 0 0 0 0 2 0 0 2 0 0MCS Total 106 12 2 4 0 0 16 8 0 86 23 5 2 0 0 0 0 0 1 0 0 3 1 0 218 44 7
SCS CALD 4 0 0 2 0 0 0 0 0 2 0 0 0 0 0 0 0 0 0 0 0 0 0 0 8 0 0CSD-ED PHD 31 4 0 4 0 0 13 0 0 28 3 0 0 0 0 0 0 0 0 0 0 3 2 0 79 9 0ISRI 9 3 1 1 1 0 5 0 1 20 2 1 0 0 0 0 0 0 2 1 0 1 0 0 38 7 3LTI 6 1 0 7 4 0 3 1 0 8 2 0 0 0 0 0 0 0 0 0 0 0 0 0 24 8 0ROBOTICS 13 3 0 17 2 0 0 0 0 23 2 0 0 0 0 0 0 0 0 0 0 1 0 0 54 7 0ROBOTICS-REC 0 0 0 2 0 0 0 0 0 15 1 0 0 0 0 0 0 0 0 0 0 2 0 0 19 1 0DEAN'S OFC 0 0 0 0 0 0 0 0 0 0 0 0 0 0 0 0 0 0 0 0 0 1 0 0 1 0 0HCI 12 4 0 3 1 0 0 0 0 8 1 0 0 0 0 0 0 0 0 0 0 1 0 0 24 6 0SCS Total 75 15 1 36 8 0 21 1 1 104 11 1 0 0 0 0 0 0 2 1 0 9 2 0 247 38 3
Tepper 65 11 0 1 0 0 16 2 1 7 2 0 5 3 0 0 0 0 0 0 0 2 0 0 96 18 1
CMU-Q QATAR-COMP SCI 0 0 0 0 0 0 1 0 1 0 0 0 0 0 0 0 0 0 0 0 0 0 0 0 1 0 1QATAR-ENROLL 0 0 0 0 0 0 0 0 0 0 0 0 0 0 0 0 0 0 0 0 0 1 1 0 1 1 0QATAR-LIBL&SSCS 0 0 0 0 0 0 2 0 0 0 0 0 0 0 0 0 0 0 0 0 0 0 0 0 2 0 0QATAR-LIBRARY 0 0 0 0 0 0 0 0 0 0 0 0 0 0 0 1 1 0 0 0 0 0 0 0 1 1 0DEAN'S OFC 0 0 0 0 0 0 1 1 0 0 0 0 0 0 0 0 0 0 0 0 0 0 0 0 1 1 0CMU-Q Total 0 0 0 0 0 0 4 1 1 0 0 0 0 0 0 1 1 0 0 0 0 1 1 0 6 3 1
CMU West 0 0 0 0 0 0 0 0 0 16 3 0 0 0 0 0 0 0 0 0 0 0 0 0 16 3 0
SEI 0 0 0 0 0 0 0 0 0 0 0 0 0 0 0 2 2 0 0 0 0 0 0 0 2 2 0
Administrative 1 0 0 0 0 0 4 3 0 9 2 1 0 0 0 29 23 2 0 0 0 8 4 0 51 32 3
592 132 30 61 16 1 122 43 8 354 78 17 130 46 5 32 26 2 82 44 7 31 10 0 1,404 395 70TOTAL
Full Time Special
Part Time Special Tenure Stream Research Teaching
Acad & Adm Support Total FacultyLibrarian
Other Instructional
4.13

Tenured & Tenure Eligible Faculty FTEs by HIRING Department & RankFall Semester 2004
Division DepartmentTotal Female Minority Total Female Minority Total Female Minority
ARCHITECTURE 1 0 0 2 2 0 0 0 0ART 3.7 2.7 1.7 3 1 0 2 0 0DESIGN 3.7 2.3 0 3 1 1 1 0 0DRAMA 3 1 0 1 0 1 5.9 4 0MUSIC 1 1 0 0 0 0 6.9 2.9 1MUSIC-PREP SCH 0 0 0 0 0 0 0.2 0.2 0DEAN'S OFC 0 0 0 0 0 0 1 0 0CFA Total 12.3 7 1.7 9 4 2 16.9 7 1
CIT BIOMEDICAL ENG 0 0 0 0 0 0 1 0 0CHEMICAL ENG 1 0 0 4 1 0 0 0 0CIVIL & ENV ENG 5 2 0 2 0 1 1 1 0ELEC & COMP ENG 6.5 3 0 4.5 0 0 1 0 0EPP 3.5 0 0 0 0 0 0 0 0MECHANICAL ENG 7.5 1.5 1 2.5 0 0 0 0 0MSE 0 0 0 3 1 0 0 0 0DEAN'S OFC 0 0 0 0 0 0 0 0 0CIT Total 23.5 6.5 1 16 2 1 3 1 0
Heinz 10 3 2 0.5 0 0 1 0 0
CNBC 0.5 0 0 0.5 0 0 0 0 0CTR-ARTS IN SOC 0 0 0 0 0 0 0 0 0ENGLISH 4 3 2 3 1 1 4 3 0HISTORY 4 2 1 2 0 0 3 3 1MODERN LANG 1 1 1 0 0 0 3 2 1PHILOSOPHY 2 0 0 4 1 1 2 0 0PSYCHOLOGY 4 1 0 1 1 0 0 0 0SOC & DEC SCI 4 3 0 2 1 0 0 0 0STATISTICS 2 1 0 0 0 0 1 0 0DEAN'S OFC 0 0 0 0 0 0 0 0 0H&SS Total 21.5 11 4 12.5 4 2 13 8 2
BIOLOGICAL SCI 8 4 0 1 1 0 6 0 1CHEMISTRY 5 2 0 0 0 0 5 1 0MATH 1 0 0 3 1 0 6 0 0PGH SUPERCOMPTR 0 0 0 1 0 0 0 0 0PHYSICS 1 0 0 3 0 0 0 0 0DEAN'S OFC 0 0 0 0 0 0 0 0 0MCS Total 15 6 0 8 2 0 17 1 1
CALD 2 0 0 0 0 0 0 0 0CSD-ED PHD 8.5 2.5 0 2.5 0 0 5 0 0ISRI 2 1 1 2 0 0 0.1 0 0LTI 0.5 0 0 0 0 0 3 0 0ROBOTICS 3 1 0 0.5 0 0 0 0 0HCI 3.7 2 0.3 0 0 0 3 1 0SCS Total 19.7 6.5 1.3 5 0 0 11.1 1 0
Tepper 21 6 0 9 2 0 7 1 0
CMU-Q 0 0 0 0 0 0 0 0 0
Administrative 0 0 0 0 0 0 0 0 0
123 46 10 60 14 5 69 19 4
Assistant Non Tenured Associate Tenured Associate
TOTAL
MCS
SCS
CFA
H&SS
4.14

Tenured & Tenure Eligible Faculty FTEs by HIRING Department & Rank (Cont.)Fall Semester 2004
Total Female Minority Total Female Minority Total Female Minority Total Female Minority
7.5 0 0 1 1 0 1 1 0 12.5 4 08 4 0 0 0 0 1 1 0 17.7 8.7 1.7
3.9 1 0 0 0 0 1.1 0 0 12.7 4.3 18.5 2.6 0 0 0 0 1 1 0 19.4 8.6 1
8 4 2 2 0 2 1 0 0 18.9 7.9 50 0 0 0 0 0 0 0 0 0.2 0.2 0
0.2 0 0 0 0 0 1 0.2 0 2.2 0.2 036.1 11.6 2 3 1 2 6.1 3.2 0 83.4 33.8 8.7
1.5 1 0 0 0 0 1 0 0 3.5 1 09 0 0 1 0 1 1 0 0 16 1 1
5.5 0 1 0 0 0 1 0 0 14.5 3 227.5 0.5 1.5 0 0 0 0 0 0 39.5 3.5 1.53.8 0.5 0 0.5 0 0 1.5 0 0 9.3 0.5 09.9 0.9 0.9 0 0 0 1 0 0 20.9 2.4 1.9
11.5 1 0.5 0 0 0 1 0 0 15.5 2 0.50.1 0.1 0.1 0 0 0 1 0 0 1.1 0.1 0.1
68.8 4 4 1.5 0 1 7.5 0 0 120.3 13.5 7
16 3 0 1.5 0 0 0 0 0 29 6 2
1 0 0 0 0 0 0 0 0 2 0 00.2 0.2 0 0 0 0 0 0 0 0.2 0.2 013 5 0 0 0 0 1 0 0 25 12 37.9 2.9 0 0.5 0 0 1 0 1 18.4 7.9 3
2 2 0 0 0 0 1 0 0 7 5 24 0 0 1 0 0 1 0 0 14 1 1
14 6 0 2 0 0 1 0 0 22 8 03.5 0 0 2.5 0 0 1 0 0 13 4 0
6 1 0 2 0 0 1.1 0.1 0 12.1 2.1 01 1 0 0 0 0 1 0 0 2 1 0
52.5 18 0 8 0 0 8.1 0.1 1 115.6 41.1 9
12 1 0 0 0 0 0 0 0 27 6 18 0 1 1 0 0 1 0 0 20 3 1
18.1 1 0 1 0 0 0 0 0 29.1 2 00.1 0 0 0 0 0 0 0 0 1.1 0 0
20.8 1 0 2 0 0 1 0 0 27.8 1 00 0 0 0 0 0 1.1 0 0 1.1 0 0
59 3 1 4 0 0 3.1 0 0 106.1 12 2
0.5 0 0 0 0 0 0.1 0 0 2.6 0 019.6 2.4 0 1 0 0 1.2 0.1 0 37.7 5 03.5 2 0 0 0 0 0 0 0 7.6 3 12.6 1 0 0 0 0 0 0 0 6.1 1 04.1 0.5 0 1 0 0 0 0 0 8.6 1.5 0
4 1 0 0.9 0 0 1.1 0 0 12.6 4 0.334 6.9 0 2.9 0 0 2.4 0.1 0 75.1 14.5 1.3
21.1 2 0 5 0 0 2 0 0 65.1 11 0
1 0 0 0 0 0 0 0 0 1 0 0
1 0 0 0 0 0 4.1 1 0 5.1 1 0
289.4 48.5 7 25.9 1 3 33.2 4.4 1 600.5 132.9 30
Total Tenure StreamProfessor University Professor Administration/Other
4.15

Tenured & Tenure Eligible Faculty HEADCOUNTS by HOME Department & RankFall Semester 2004
Division DepartmentTotal Female Minority Total Female Minority Total Female Minority
CFA ARCHITECTURE 1 0 0 2 2 0 0 0 0ART 4 3 2 3 1 0 2 0 0DESIGN 3 2 0 3 1 1 1 0 0DRAMA 3 1 0 1 0 1 6 4 0MUSIC 1 1 0 0 0 0 7 3 1DEAN'S OFC 0 0 0 0 0 0 1 0 0CFA Total 12 7 2 9 4 2 17 7 1
CIT BIOMEDICAL ENG 0 0 0 0 0 0 1 0 0CHEMICAL ENG 1 0 0 4 1 0 0 0 0CIVIL & ENV ENG 6 2 0 2 0 1 1 1 0ELEC & COMP ENG 7 3 0 4 0 0 1 0 0EPP 1 0 0 0 0 0 0 0 0MECHANICAL ENG 7 1 1 3 0 0 0 0 0MSE 0 0 0 3 1 0 0 0 0DEAN'S OFC 0 0 0 0 0 0 0 0 0CIT Total 22 6 1 16 2 1 3 1 0
Heinz 10 3 2 1 0 0 1 0 0
H&SS CNBC 0 0 0 0 0 0 0 0 0ENGLISH 4 3 2 3 1 1 4 3 0HISTORY 4 2 1 2 0 0 3 3 1MODERN LANG 1 1 1 0 0 0 3 2 1PHILOSOPHY 2 0 0 4 1 1 2 0 0PSYCHOLOGY 4 1 0 1 1 0 0 0 0SOC & DEC SCI 4 3 0 2 1 0 0 0 0STATISTICS 2 1 0 0 0 0 1 0 0DEAN'S OFC 0 0 0 0 0 0 0 0 0H&SS Total 21 11 4 12 4 2 13 8 2
MCS BIOLOGICAL SCI 8 4 0 1 1 0 6 0 1CHEMISTRY 5 2 0 0 0 0 5 1 0MATH 1 0 0 3 1 0 6 0 0PGH SUPERCOMPTR 0 0 0 1 0 0 0 0 0PHYSICS 1 0 0 3 0 0 0 0 0DEAN'S OFC 0 0 0 0 0 0 0 0 0MCS Total 15 6 0 8 2 0 17 1 1
SCS CALD 3 0 0 0 0 0 0 0 0CSD-ED PHD 7 2 0 3 0 0 5 0 0ISRI 2 1 1 2 0 0 0 0 0LTI 0 0 0 0 0 0 3 0 0ROBOTICS 5 2 0 1 0 0 0 0 0HCI 4 2 0 0 0 0 3 1 0SCS Total 21 7 1 6 0 0 11 1 0
Tepper 21 6 0 9 2 0 7 1 0
Administrative 0 0 0 0 0 0 0 0 0
122 46 10 61 14 5 69 19 4TOTAL
Assistant Non Tenured Associate Tenured Associate
4.16

Tenured & Tenure Eligible Faculty HEADCOUNTS by HOME Department & Rank (Cont.)Fall Semester 2004
Total Female Minority Total Female Minority Total Female Minority Total Female Minority
7 0 0 1 1 0 1 1 0 12 4 08 4 0 0 0 0 1 1 0 18 9 24 1 0 0 0 0 1 0 0 12 4 19 3 0 0 0 0 1 1 0 20 9 18 4 2 2 0 2 1 0 0 19 8 50 0 0 0 0 0 1 0 0 2 0 0
36 12 2 3 1 2 6 3 0 83 34 9
1 1 0 0 0 0 1 0 0 3 1 09 0 0 1 0 1 1 0 0 16 1 18 0 1 0 0 0 1 0 0 18 3 2
29 1 2 0 0 0 0 0 0 41 4 23 0 0 0 0 0 1 0 0 5 0 0
10 1 1 0 0 0 1 0 0 21 2 211 1 0 0 0 0 1 0 0 15 2 00 0 0 0 0 0 1 0 0 1 0 0
71 4 4 1 0 1 7 0 0 120 13 7
16 3 0 1 0 0 0 0 0 29 6 2
1 0 0 0 0 0 0 0 0 1 0 013 5 0 0 0 0 1 0 0 25 12 38 3 0 1 0 0 1 0 1 19 8 32 2 0 0 0 0 1 0 0 7 5 24 0 0 1 0 0 1 0 0 14 1 1
14 6 0 2 0 0 1 0 0 22 8 04 0 0 3 0 0 1 0 0 14 4 06 1 0 2 0 0 1 0 0 12 2 01 1 0 0 0 0 1 0 0 2 1 0
53 18 0 9 0 0 8 0 1 116 41 9
12 1 0 0 0 0 0 0 0 27 6 18 0 1 1 0 0 1 0 0 20 3 1
19 1 0 1 0 0 0 0 0 30 2 00 0 0 0 0 0 0 0 0 1 0 0
21 1 0 2 0 0 1 0 0 28 1 00 0 0 0 0 0 1 0 0 1 0 0
60 3 1 4 0 0 3 0 0 107 12 2
1 0 0 0 0 0 0 0 0 4 0 016 2 0 0 0 0 1 0 0 32 4 04 2 0 1 0 0 0 0 0 9 3 13 1 0 0 0 0 0 0 0 6 1 06 1 0 1 0 0 0 0 0 13 3 04 1 0 1 0 0 1 0 0 13 4 0
34 7 0 3 0 0 2 0 0 77 15 1
22 2 0 5 0 0 2 0 0 66 11 0
0 0 0 0 0 0 4 1 0 4 1 0
292 49 7 26 1 3 32 4 1 602 133 30
Total Tenure StreamProfessor University Professor Administration/Other
4.17

Tenured & Tenure Eligible Faculty FTEs by HIRING Department & Tenure StatusFall Semester 2004
Division Department
Total Female Minority Total Female Minority Total Female Minority
CFA ARCHITECTURE 9.5 2 0 3 2 0 12.5 4 0ART 11 5 0 6.7 3.7 1.7 17.7 8.7 1.7DESIGN 6 1 0 6.7 3.3 1 12.7 4.3 1DRAMA 15.4 7.6 0 4 1 1 19.4 8.6 1MUSIC 17.9 6.9 5 1 1 0 18.9 7.9 5MUSIC-PREP SCH 0.2 0.2 0 0 0 0 0.2 0.2 0DEAN'S OFC 2.2 0.2 0 0 0 0 2.2 0.2 0CFA Total 62.1 22.8 5 21.3 11 3.7 83.4 33.8 8.7
CIT BIOMEDICAL ENG 3.5 1 0 0 0 0 3.5 1 0CHEMICAL ENG 11 0 1 5 1 0 16 1 1CIVIL & ENV ENG 7.5 1 1 7 2 1 14.5 3 2ELEC & COMP ENG 28.5 0.5 1.5 11 3 0 39.5 3.5 1.5EPP 5.8 0.5 0 3.5 0 0 9.3 0.5 0MECHANICAL ENG 10.9 0.9 0.9 10 1.5 1 20.9 2.4 1.9MSE 12.5 1 0.5 3 1 0 15.5 2 0.5DEAN'S OFC 1.1 0.1 0.1 0 0 0 1.1 0.1 0.1CIT Total 80.8 5 5 39.5 8.5 2 120.3 13.5 7
Heinz 18.5 3 0 10.5 3 2 29 6 2
H&SS CNBC 1 0 0 1 0 0 2 0 0CTR-ARTS IN SOC 0.2 0.2 0 0 0 0 0.2 0.2 0ENGLISH 18 8 0 7 4 3 25 12 3HISTORY 12.4 5.9 2 6 2 1 18.4 7.9 3MODERN LANG 6 4 1 1 1 1 7 5 2PHILOSOPHY 8 0 0 6 1 1 14 1 1PSYCHOLOGY 17 6 0 5 2 0 22 8 0SOC & DEC SCI 7 0 0 6 4 0 13 4 0STATISTICS 10.1 1.1 0 2 1 0 12.1 2.1 0DEAN'S OFC 2 1 0 0 0 0 2 1 0H&SS Total 81.6 26.1 3 34 15 6 115.6 41.1 9
MCS BIOLOGICAL SCI 18 1 1 9 5 0 27 6 1CHEMISTRY 15 1 1 5 2 0 20 3 1MATH 25.1 1 0 4 1 0 29.1 2 0PGH SUPERCOMPTR 0.1 0 0 1 0 0 1.1 0 0PHYSICS 23.8 1 0 4 0 0 27.8 1 0DEAN'S OFC 1.1 0 0 0 0 0 1.1 0 0MCS Total 83.1 4 2 23 8 0 106.1 12 2
SCS CALD 0.6 0 0 2 0 0 2.6 0 0CSD-ED PHD 26.7 2.5 0 11 2.5 0 37.7 5 0ISRI 3.6 2 0 4 1 1 7.6 3 1LTI 5.6 1 0 0.5 0 0 6.1 1 0ROBOTICS 5.1 0.5 0 3.5 1 0 8.6 1.5 0HCI 9 2 0 3.7 2 0.3 12.6 4 0.3SCS Total 50.4 8 0 24.7 6.5 1.3 75.1 14.5 1.3
Tepper 35.1 3 0 30 8 0 65.1 11 0
CMU-Q 1 0 0 0 0 0 1 0 0
Administrative 5.1 1 0 0 0 0 5.1 1 0
417.5 72.9 15 183 60 15 600.5 132.9 30TOTAL
Tenured Tenure Eligible Total Tenure Stream
4.18

Tenured & Tenure Eligible Faculty HEADCOUNTS by HOME Department & Tenure StatusFall Semester 2004
Division DepartmentTotal Female Minority Total Female Minority Total Female Minority
CFA ARCHITECTURE 9 2 0 3 2 0 12 4 0ART 11 5 0 7 4 2 18 9 2DESIGN 6 1 0 6 3 1 12 4 1DRAMA 16 8 0 4 1 1 20 9 1MUSIC 18 7 5 1 1 0 19 8 5DEAN'S OFC 2 0 0 0 0 0 2 0 0CFA Total 62 23 5 21 11 4 83 34 9
CIT BIOMEDICAL ENG 3 1 0 0 0 0 3 1 0CHEMICAL ENG 11 0 1 5 1 0 16 1 1CIVIL & ENV ENG 10 1 1 8 2 1 18 3 2ELEC & COMP ENG 30 1 2 11 3 0 41 4 2EPP 4 0 0 1 0 0 5 0 0MECHANICAL ENG 11 1 1 10 1 1 21 2 2MSE 12 1 0 3 1 0 15 2 0DEAN'S OFC 1 0 0 0 0 0 1 0 0CIT Total 82 5 5 38 8 2 120 13 7
Heinz 18 3 0 11 3 2 29 6 2
H&SS CNBC 1 0 0 0 0 0 1 0 0ENGLISH 18 8 0 7 4 3 25 12 3HISTORY 13 6 2 6 2 1 19 8 3MODERN LANG 6 4 1 1 1 1 7 5 2PHILOSOPHY 8 0 0 6 1 1 14 1 1PSYCHOLOGY 17 6 0 5 2 0 22 8 0SOC & DEC SCI 8 0 0 6 4 0 14 4 0STATISTICS 10 1 0 2 1 0 12 2 0DEAN'S OFC 2 1 0 0 0 0 2 1 0H&SS Total 83 26 3 33 15 6 116 41 9
MCS BIOLOGICAL SCI 18 1 1 9 5 0 27 6 1CHEMISTRY 15 1 1 5 2 0 20 3 1MATH 26 1 0 4 1 0 30 2 0PGH SUPERCOMPTR 0 0 0 1 0 0 1 0 0PHYSICS 24 1 0 4 0 0 28 1 0DEAN'S OFC 1 0 0 0 0 0 1 0 0MCS Total 84 4 2 23 8 0 107 12 2
SCS CALD 1 0 0 3 0 0 4 0 0CSD-ED PHD 22 2 0 10 2 0 32 4 0ISRI 5 2 0 4 1 1 9 3 1LTI 6 1 0 0 0 0 6 1 0ROBOTICS 7 1 0 6 2 0 13 3 0HCI 9 2 0 4 2 0 13 4 0SCS Total 50 8 0 27 7 1 77 15 1
Tepper 36 3 0 30 8 0 66 11 0
Administrative 4 1 0 0 0 0 4 1 0
419 73 15 183 60 15 602 133 30TOTAL
Tenured Tenure Eligible Total Tenure Stream
4.19
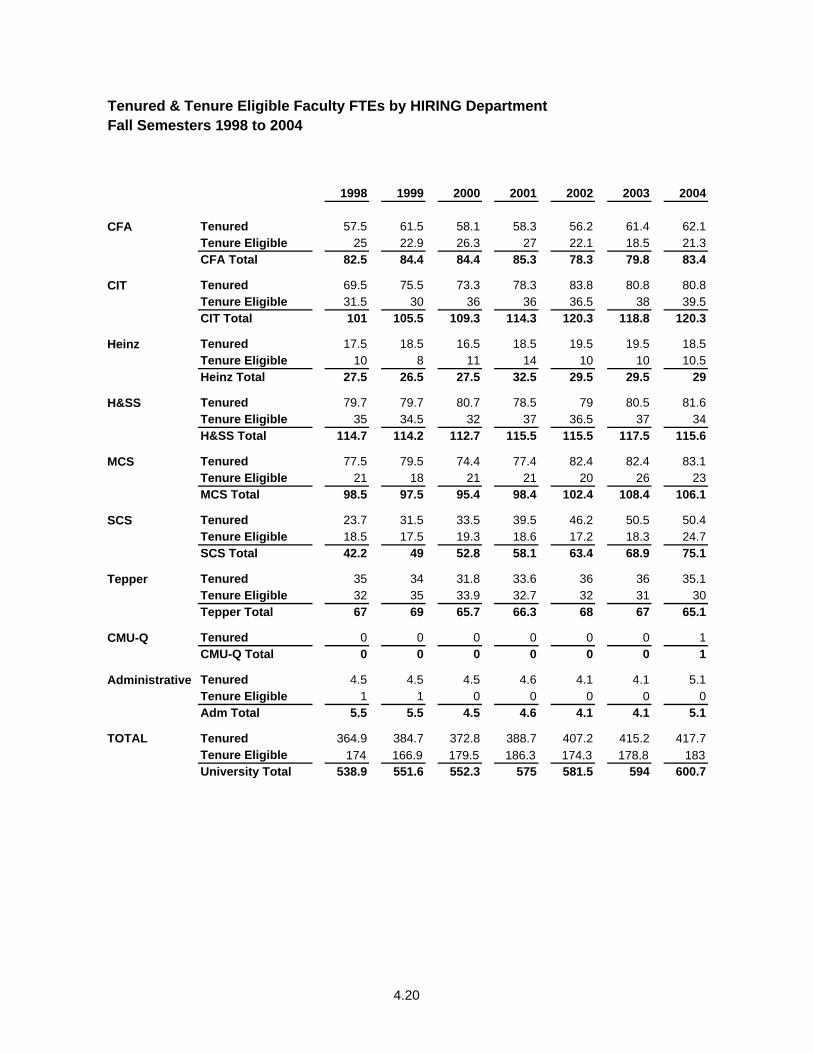
Tenured & Tenure Eligible Faculty FTEs by HIRING DepartmentFall Semesters 1998 to 2004
1998 1999 2000 2001 2002 2003 2004
CFA Tenured 57.5 61.5 58.1 58.3 56.2 61.4 62.1Tenure Eligible 25 22.9 26.3 27 22.1 18.5 21.3CFA Total 82.5 84.4 84.4 85.3 78.3 79.8 83.4
CIT Tenured 69.5 75.5 73.3 78.3 83.8 80.8 80.8Tenure Eligible 31.5 30 36 36 36.5 38 39.5CIT Total 101 105.5 109.3 114.3 120.3 118.8 120.3
Heinz Tenured 17.5 18.5 16.5 18.5 19.5 19.5 18.5Tenure Eligible 10 8 11 14 10 10 10.5Heinz Total 27.5 26.5 27.5 32.5 29.5 29.5 29
H&SS Tenured 79.7 79.7 80.7 78.5 79 80.5 81.6Tenure Eligible 35 34.5 32 37 36.5 37 34H&SS Total 114.7 114.2 112.7 115.5 115.5 117.5 115.6
MCS Tenured 77.5 79.5 74.4 77.4 82.4 82.4 83.1Tenure Eligible 21 18 21 21 20 26 23MCS Total 98.5 97.5 95.4 98.4 102.4 108.4 106.1
SCS Tenured 23.7 31.5 33.5 39.5 46.2 50.5 50.4Tenure Eligible 18.5 17.5 19.3 18.6 17.2 18.3 24.7SCS Total 42.2 49 52.8 58.1 63.4 68.9 75.1
Tepper Tenured 35 34 31.8 33.6 36 36 35.1Tenure Eligible 32 35 33.9 32.7 32 31 30Tepper Total 67 69 65.7 66.3 68 67 65.1
CMU-Q Tenured 0 0 0 0 0 0 1CMU-Q Total 0 0 0 0 0 0 1
Administrative Tenured 4.5 4.5 4.5 4.6 4.1 4.1 5.1Tenure Eligible 1 1 0 0 0 0 0Adm Total 5.5 5.5 4.5 4.6 4.1 4.1 5.1
TOTAL Tenured 364.9 384.7 372.8 388.7 407.2 415.2 417.7Tenure Eligible 174 166.9 179.5 186.3 174.3 178.8 183University Total 538.9 551.6 552.3 575 581.5 594 600.7
4.20

Fall Semesters 1998 to 2004
1998 1999 2000 2001 2002 2003 2004
CFA Tenured 57 61 58 58 56 61 62Tenure Eligible 25 23 26 27 22 19 21CFA Total 82 84 84 85 78 80 83
CIT Tenured 69 76 74 80 84 81 82Tenure Eligible 31 29 35 34 35 36 38CIT Total 100 105 109 114 119 117 120
Heinz Tenured 17 18 16 18 19 19 18Tenure Eligible 11 9 12 15 11 11 11Heinz Total 28 27 28 33 30 30 29
H&SS Tenured 82 82 83 82 80 82 83Tenure Eligible 35 34 32 37 36 37 33H&SS Total 117 116 115 119 116 119 116
MCS Tenured 78 80 75 78 83 83 84Tenure Eligible 21 18 21 21 20 27 23MCS Total 99 98 96 99 103 110 107
SCS Tenured 25 31 33 40 48 51 50Tenure Eligible 18 18 21 21 19 20 27SCS Total 43 49 54 61 67 71 77
Tepper Tenured 35 34 32 34 36 36 36Tenure Eligible 32 35 34 33 32 32 30Tepper Total 67 69 66 67 68 68 66
Administrative Tenured 4 4 4 4 4 4 4Tenure Eligible 1 1 0 0 0 0 0Adm Total 5 5 4 4 4 4 4
TOTAL Tenured 367 386 375 394 410 417 419Tenure Eligible 174 167 181 188 175 182 183University Total 541 553 556 582 585 599 602
Tenured & Tenure Eligible Faculty HEADCOUNTS by HOME Department
4.21

Distribution of Tenured & Tenure Eligible Faculty by Gender, Race & AgeFall Semesters 1998 to 2004
Percent of Tenure Stream Faculty by Gender 1998 1999 2000 2001 2002 2003 2004Female 19.2% 19.7% 19.4% 20.4% 21.2% 23.0% 22.1%Male 80.8% 80.3% 80.6% 79.6% 78.8% 77.0% 77.9%
Percent of Tenured & Tenure Eligible Faculty by Race 1998 1999 2000 2001 2002 2003 2004African American/Black 2.0% 2.2% 2.2% 2.9% 2.9% 3.2% 3.0%Asian/Pacific Islander 8.9% 8.3% 7.9% 7.9% 8.2% 8.2% 7.8%Hispanic 1.8% 1.8% 1.8% 1.7% 1.7% 1.8% 1.8%White 84.1% 84.5% 83.5% 82.3% 81.7% 80.8% 79.2%Non US Citizen 3.1% 3.2% 4.7% 5.2% 5.5% 6.0% 8.1%
Percent of Tenured & Tenure Eligible Faculty by Age 1998 1999 2000 2001 2002 2003 2004Under 30 2.8% 2.9% 2.7% 2.1% 1.7% 1.8% 1.8%30 to 39 24.6% 23.1% 24.1% 25.8% 24.2% 25.0% 24.3%40 to 49 32.2% 33.2% 31.5% 31.3% 30.7% 29.7% 29.6%50 to 59 25.3% 25.3% 26.6% 25.4% 26.8% 26.4% 26.6%60 and Over 15.2% 15.5% 15.1% 15.5% 16.6% 17.0% 17.8%
4.22

ALUMNI

blah
5.2

ACTIVE ALUMNI *BY REGION & STATEAS OF FALL 2004
Region / State Region / State Region / State Region / State
New England South Midwest WestConnecticut 1,216 Alabama 172 Illinois 1,519 Alaska 27Maine 177 Arkansas 51 Indiana 419 California 6,931Massachusetts 2,563 Florida 2,336 Iowa 94 Colorado 782New Hampshire 329 Georgia 802 Kansas 142 Hawaii 116Rhode Island 172 Kentucky 205 Michigan 1,182 Idaho 71Vermont 161 Louisiana 163 Minnesota 431 Montana 31TOTAL 4,618 Mississippi 40 Missouri 325 Nevada 145% of Total 7% North Carolina 1,213 Nebraska 61 Oregon 526
South Carolina 478 North Dakota 14 Utah 110Middle States Tennessee 377 South Dakota 24 Washington 1,066Delaware 284 Virginia 2,561 Wisconsin 329 Wyoming 35District of Col. 483 TOTAL 8,398 TOTAL 4,540 TOTAL 9,840Maryland 2,373 % of Total 13% % of Total 7% % of Total 15%New Jersey 3,098New York 5,360 Southwest OtherOhio 2,488 Arizona 615 U.S. Territories 61 U.S. TOTAL 62,132Pennsylvania 16,713 New Mexico 265 Email only ** 694 % of Total 93%West Virginia 305 Oklahoma 95TOTAL 31,104 Texas 1,902 Foreign Countries 4,737% of Total 47% TOTAL 2,877 % of Total 7%
% of Total 4%66,869
*Defined as all alumni who maintain a current postal or email address**Only information available is e-mail address
TOTAL ACTIVE ALUMNI
5.3

ACTIVE ALUMNI*AS OF FALL 2004
Active Alumni by Geographic Areas
PA - Pittsburgh 13,057 CA - San Diego 509NY - New York City 6,106 TX - Austin 453DC - Washington, DC 3,502 AZ - Phoenix 423CA - San Francisco 3,418 OH - Cincinnati-Dayton 404MA - Boston 2,524 MN - Minneapolis-St Paul 379PA - Philadelphia 2,480 OH - Columbus 378CA - Los Angeles 2,337 OH - Youngstown 342NJ - Princeton 1,416 FL - St. Petersburg 340IL - Chicago 1,271 NY - Rochester 331OH - Cleveland 1,056 FL - West Palm Beach 289MD - Baltimore 951 NY - Buffalo 264WA - Seattle 866 FL - Miami 238MI - Detroit 859 MO - St. Louis 235CT - Hartford 786 CA - Sacramento 226TX - Houston 636 FL - Fort Lauderdale 205GA - Atlanta 634 MO - Kansas City 138NC - Raleigh 584 TN - Nashville 122PA - Harrisburg 550 HI - Hawaii 116TX - Dallas 541 NV - Las Vegas 91CO - Denver 515 LA - New Orleans 89
Active Alumni by College
Carnegie Institute of Technology 19,746 Industries 46Tepper School of Business 11,289 Intercollege and Joint DegreeCollege of Fine Arts 10,385 Entertainment Technology 42Humanities and Social Science 7,326 Humanities and Arts 145Mellon College of Science 6,950 Information Systems Management 406Heinz School 3,825 Information Technology 233Margaret Morrison 3,138 Integrated Product Development 2Computer Science 2,276 Mathematical Sciences 1Printing Management 674 Sciences and Arts 11Library 318 Sciences and Humanities Scholars 56
Total 66,869
Active Alumni by Class Year in Decades
1908 - 1917 6 1960 - 1969 7,131 1920 - 1929 101 1970 - 1979 8,923 1930 - 1939 896 1980 - 1989 12,911 1940 - 1949 3,015 1990 - 1999 17,186 1950 - 1959 5,466 2000 - 2004 11,234
Total 66,869
*Defined as all alumni who maintain a current postal or email address
5.4

FINANCES

blah
6.2

TUITION & FEES
2000-01 2001-02 2002-03 2003-04 2004-05Undergraduate Tuition: Entry after Fall 2003 --- --- --- $29,190 $30,650 Entry after Fall 2000 and prior to Fall 2003 $24,600 $25,670 $26,910 $28,766 $30,200
Graduate Tuition: *
College of Fine Arts $23,300 $24,760 $26,380 $28,200 $28,200Carnegie Institute of Technology $23,300 $24,760 $26,380 $28,200 $28,200H. John Heinz III School of Public Policy & Management $23,300 $24,760 $26,380 $28,200 $29,900College of Humanities & Social Sciences $23,300 $24,760 $26,380 $28,200 $28,200Information Networking Institute** $41,000 $43,600 $53,000 $56,000 $59,000Mellon College of Science $23,300 $24,760 $26,380 $28,200 $28,200School of Computer Science $23,300 $24,760 $26,380 $28,200 $28,200Tepper School of Business $26,750 $28,250 $29,750 $35,000 $37,000Carnegie Mellon West --- --- $28,334 $29,184 $29,184
Mandatory Fees: $192 $202 $206 $220 $386
*Graduate tuition displayed is for most programs in each college. Tuition may vary by program.**Tuition is for a 16 month program.
ROOM AND BOARDACADEMIC YEARS 2000-2001 to 2004-2005
2000-01 2001-02 2002-03 2003-04 2004-05
Average Room* $4,228 $4,354 $4,524 $4,705 $4,964Average Board** $2,800 $3,220 $3,320 $3,450 $3,590
*Average Room is based on the cost of a standard double room.**Average Board is based on the cost of a full dining service program.
TOTAL ESTIMATED COST* OF ATTENDING CARNEGIE MELLONACADEMIC YEARS 2000-2001 TO 2004-2005
2000-01 2001-02 2002-03 2003-04 2004-05
Resident: Entry after Fall 2003 --- --- --- 39,725$ $41,780 Entry after Fall 2000 & prior to Fall 2003 33,870$ 35,546$ 37,090$ 39,301$ $41,330
Commuter: Entry after Fall 2003 --- --- --- 33,240$ $34,986 Entry after Fall 2000 & prior to Fall 2003 28,262$ 29,530$ 30,856$ 32,816$ $34,536
*Cost includes: tuition and fees, books and supplies, incidentals, room and board (for on-campus residents) and lunchesand transportation (for commuters).
ACADEMIC YEARS 2000-2001 to 2004-2005
6.3

OPERATING REVENUES & EXPENDITURESFISCAL YEARS 2001 to 2004(Dollars in Thousands)
2001 2002 2003 2004Operating Revenue and Support (Unrestricted):
Tuition and Other Educational Fees, Net of Financial Aid $165,694 $177,299 $196,153 $217,214
Sponsored Projects 188,086 246,107 243,871 $278,900
Investment Income 34,947 32,890 31,306 $25,057
Contributions 11,009 10,520 9,149 $10,782
Auxiliary Services 29,031 31,423 32,950 $35,280
Other Sources 26,083 24,470 25,689 $34,294
Net Assets Released from Restrictions 29,653 30,723 37,875 $30,183
TOTAL OPERATING REVENUES AND SUPPORT $484,503 $553,432 $576,993 $631,710
2001 2002 2003 2004Operating Expenses:
Salaries $254,499 $273,808 $296,635 $325,578
Benefits 47,975 51,525 55,233 $66,643
Supplies and Services 82,102 120,461 99,010 $116,167
Occupancy and Related Expenses 35,188 34,957 35,994 $36,812
Other Operating Expenses 11,222 23,309 28,247 $29,500
Depreciation and Amortization 41,820 41,539 38,819 $40,200
Interest Expense 10,175 5,407 5,817 $5,176TOTAL OPERATING EXPENSES $482,981 $551,006 $559,755 $620,076
6.4

DISTRIBUTION OF OPERATING REVENUEFISCAL YEAR 2004Total=$631,710
DISTRIBUTION OF OPERATING EXPENSESFISCAL YEAR 2004Total=$620,076
Sponsored Projects44%
Other Sources5%
Contributions2%
InvestmentIncome
4%
Tuition and Other Educational Fees, Net of
Financial Aid34%
Net Assets Releasedfrom Restrictions
5%Auxiliary Services
6%
Salaries52%
Benefits11%
Supplies and Services
19%
Occupancy and
Related Expenses6%
Other Operating Expenses
5%
Depreciation and
Amortization6%
Interest Expense
1%
6.5

TOTAL SPONSORED RESEARCH COSTSBY COLLEGE & RESEARCH CENTERFISCAL YEARS 2000 to 2004(Dollars in Thousands)
Direct Costs 2000 2001 2002 2003 2004CIT $28,241 $29,290 $36,391 $39,534 $41,567CFA 1,011 1,079 1,877 1,791 1,518Heinz 3,120 2,984 4,463 4,489 5,797H&SS 8,939 8,669 10,388 14,028 13,096MCS 17,904 25,118 56,358 30,093 38,928SCS 35,032 36,778 47,839 56,665 65,746Tepper 1,353 1,367 1,680 2,233 2,814CMRI 10,349 6,634 -955 73 -10SEI 35,591 38,863 44,014 41,942 54,734CMU West -- -- -- 3,694 4,803CyLab -- -- -- -- 720Other 1,648 1,387 4,010 2,216 6,753TOTAL $143,188 $152,169 $206,065 $196,758 $236,466
Indirect CostsCIT $7,694 $8,168 $9,524 $9,896 $10,993CFA 274 183 293 374 294Heinz 1,007 1,130 877 590 762H&SS 2,547 2,431 3,194 3,586 3,704MCS 5,206 5,751 6,544 6,567 7,437SCS 11,995 11,394 14,052 15,312 17,268Tepper 476 542 533 495 797CMRI 4,118 3,208 207 32 -6SEI 2,335 1,153 1,510 2,909 2,315CMU West -- -- -- 693 1,272CyLab -- -- -- -- 57Other 156 187 996 508 789TOTAL $35,808 $34,147 $37,730 $40,962 $45,682
Total Sponsored Research CostsCIT $35,935 $37,458 $45,915 $49,430 $52,560CFA 1,285 1,262 2,170 2,165 1,812Heinz 4,127 4,114 5,340 5,079 6,559H&SS 11,486 11,100 13,582 17,614 16,800MCS 23,110 30,869 62,902 36,660 46,365SCS 47,027 48,172 61,891 71,977 83,014Tepper 1,829 1,909 2,213 2,728 3,611CMRI 14,467 9,842 -748 * 105 -16SEI 37,926 40,016 45,524 44,851 57,049CMU West -- -- -- 4,387 6,075CyLab -- -- -- -- 777Other 1,805 1,574 5,006 2,724 7,542TOTAL $178,997 $186,316 $243,795 $237,720 $282,148
*A portion of the increase in research volume in 'Other' is due to CMRI reorganization.
6.6

SPONSORED RESEARCH COSTSREAL VERSUS NOMINAL GROWTHFISCAL YEARS 2000 to 2004
Real dollars calculated using the 2nd quarter implicit price deflator with 2000 as the base year.
TOTAL SPONSORED RESEARCH COSTS BY AGENCYFISCAL YEARS 2000 to 2004(Dollars in Thousands)
2000 2001 2002 2003 2004Federal
Defense $67,752 $65,087 $71,649 $61,411 $59,397National Science Foundation 31,312 38,299 73,838 53,045 68,060Health & Human Services 8,381 10,645 13,673 20,839 22,763Energy 3,564 3,924 5,648 8,634 7,981Other Federal 13,565 12,728 15,013 17,877 26,629TOTAL $124,574 $130,683 $179,821 $161,806 $184,830
Non-FederalIndustrial $22,433 $23,569 $28,889 $14,246 $19,400Other Non-Federal 31,990 32,064 35,085 16,817 20,869 TOTAL $54,423 $55,633 $63,974 $31,063 $40,269
Software Engineering Institute* -- -- -- $44,851 $57,049
TOTAL $178,997 $186,316 $243,795 $237,720 $282,148
* Beginning in FY03, Software Engineering Institute costs are no longer broken down by agency.
$178,997
$181,755
$234,239 $224,908
$260,358
$140,000
$160,000
$180,000
$200,000
$220,000
$240,000
$260,000
$280,000
$300,000
2000 2001 2002 2003 2004
FISCAL YEAR
Real Dollars Nominal Dollars
$186,316
$243,795$237,720
$282,148
6.7
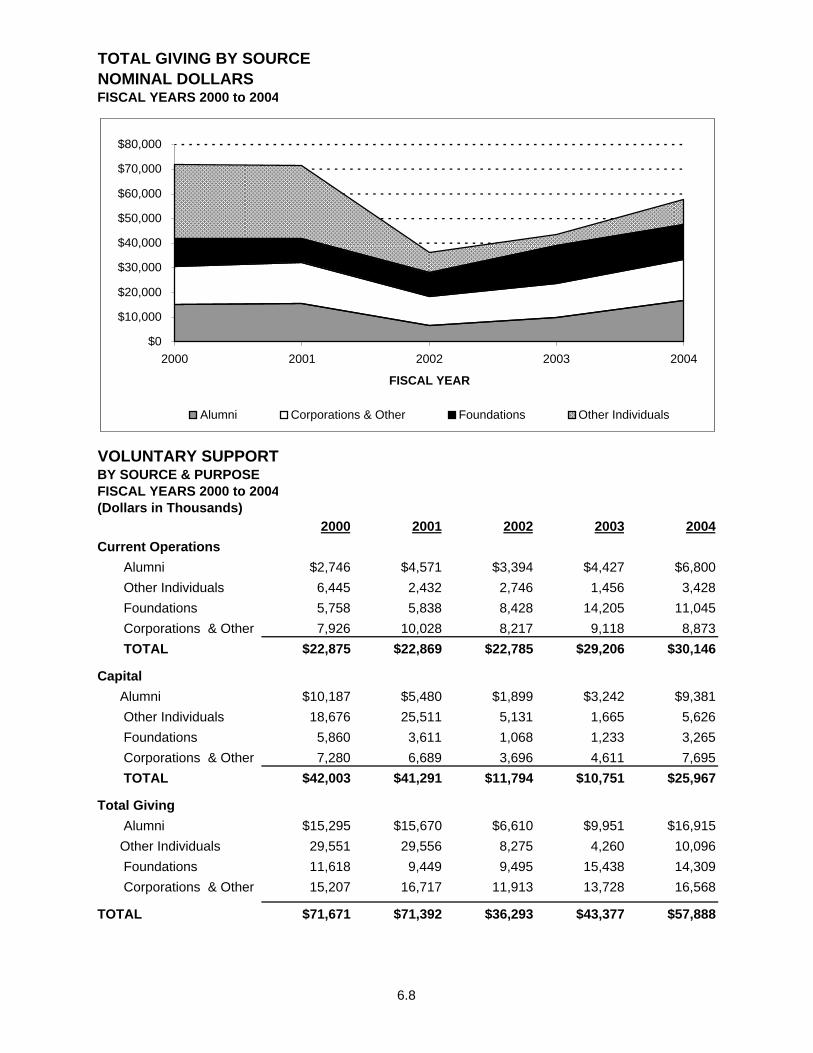
TOTAL GIVING BY SOURCENOMINAL DOLLARSFISCAL YEARS 2000 to 2004
VOLUNTARY SUPPORTBY SOURCE & PURPOSEFISCAL YEARS 2000 to 2004(Dollars in Thousands)
2000 2001 2002 2003 2004Current Operations
Alumni $2,746 $4,571 $3,394 $4,427 $6,800 Other Individuals 6,445 2,432 2,746 1,456 3,428 Foundations 5,758 5,838 8,428 14,205 11,045 Corporations & Other 7,926 10,028 8,217 9,118 8,873 TOTAL $22,875 $22,869 $22,785 $29,206 $30,146
Capital Alumni $10,187 $5,480 $1,899 $3,242 $9,381 Other Individuals 18,676 25,511 5,131 1,665 5,626 Foundations 5,860 3,611 1,068 1,233 3,265 Corporations & Other 7,280 6,689 3,696 4,611 7,695 TOTAL $42,003 $41,291 $11,794 $10,751 $25,967
Total Giving Alumni $15,295 $15,670 $6,610 $9,951 $16,915 Other Individuals 29,551 29,556 8,275 4,260 10,096 Foundations 11,618 9,449 9,495 15,438 14,309 Corporations & Other 15,207 16,717 11,913 13,728 16,568
TOTAL $71,671 $71,392 $36,293 $43,377 $57,888
$0
$10,000
$20,000
$30,000
$40,000
$50,000
$60,000
$70,000
$80,000
2000 2001 2002 2003 2004
FISCAL YEAR
Alumni Corporations & Other Foundations Other Individuals
6.8

UNDERGRADUATE SCHOLARSHIPSBY SOURCE, PERCENT OF TOTALFISCAL YEARS 2000 to 2004
*All other includes Federal, State and Other Grant Resources
UNDERGRADUATE FINANCIAL AID RESOURCESBY SOURCE FISCAL YEARS 2000 to 2004(Dollars in Thousands)
2000 2001 2002 2003 2004Scholarships & Grants
Federal - PELL $1,193 $1,231 $1,501 $1,794 $1,844Federal - SEOG 1,894 1,966 1,980 1,984 1,963State - PHEAA 897 1,038 1,003 1,009 1,015Other State Grants 97 118 84 69 43Carnegie Mellon General Unrestricted 27,029 26,245 27,412 30,837 36,323Carnegie Mellon Endowed 5,132 5,474 5,808 5,929 5,142Carnegie Mellon Gifts & Grants 197 288 301 245 300ROTC 1,062 849 923 1,254 1,576Other Grant Resources 2,167 2,326 2,450 2,305 2,129TOTAL $39,668 $39,535 $41,462 $45,426 $50,335
Self-HelpWorkstudy $1,981 $1,893 $2,184 $2,284 $2,022Loans 13,149 11,351 14,922 17,809 19,720TOTAL $15,130 $13,244 $17,106 $20,093 $21,742
TOTAL $54,798 $52,779 $58,568 $65,519 $72,077
% of Undergraduates with Need 54% 51% 49% 50% 51%
0%
10%
20%
30%
40%
50%
60%
70%
80%
2000 2001 2002 2003 2004
PER
CEN
T O
F TO
TAL
Carnegie Mellon General Unrestricted Carnegie Mellon Endowed All Other
6.9

FINANCESADDITIONAL FACTS & FIGURESUNDERGRADUATE COMPARISON BY BENCHMARK COMPETITORSACADEMIC YEAR 2004-2005
School Tuition & Fees Room & Board*Carnegie Mellon
Entry after Fall 2003 $31,036 $8,554Entry after Fall 2000 prior to Fall 2003 $30,586 $8,554
CompetitorsMIT $30,800 $9,100Princeton University 30,495 8,387Cornell University 30,167 9,932University of Pennsylvania 30,716 8,918Stanford University 29,847 9,503Washington University (St. Louis) 30,546 9,640Duke 30,720 8,520Emory 29,332 9,650Rice 21,206 8,380Cal Tech 25,561 9,939Georgia Tech 17,558 6,150RPI 28,950 9,083Northwestern 29,940 9,393Average Competitor $28,141 $8,969
*Carnegie Mellon costs are based upon the cost of a standard double room and a full dining service program.
Competitor Source: US News & World Report's America's Best Colleges, 2005 Edition.
ENDOWMENT STATISTICSFISCAL YEARS 2000 to 2004
2000 2001 2002 2003 2004
Market Value $829,121,000 $756,930,000 $667,807,000 $654,678,000 $768,990,000Rank* 62 63 65 67 ***
Endowment/FTE Student $105,138 $95,295 $84,075 $75,363 $86,984Rank** 109 116 114 133 ***
Life Income Funds $29,136,000 $29,437,000 $27,043,000 $26,694,000 $27,793,000
*Public and Private Institutions rank.**Private Institutions rank.***Ranks not available until publication of FY2004 NACUBO Endowment Reports in spring 2005.
Source: NACUBO Endowment Reports and Carnegie Mellon Annual Reports
6.10

SPACE AND FACILITIES

blah
7.2

TOTAL SPACE IN SQUARE FOOTAGEBY MAJOR DIVISION, COLLEGE/DIVISION & USE CATEGORYAS OF JUNE 30, 2004
Classroom Facilities
Laboratory Facilities
Office Facilities
Study Facilities
Special Use Facilities
General Use
FacilitiesSupport Facilities
Residential Facilities Other Leased TOTAL
President 0 0 4,770 0 0 11,400 290 0 0 0 16,460
ProvostCIT 3,408 142,735 126,407 4,000 0 6,713 12,051 0 694 16,140 312,147CFA 42,489 104,157 43,733 804 349 40,022 17,944 0 0 26,601 276,100Heinz 670 656 36,459 3,615 56 3,444 898 0 0 1,650 47,450H&SS 2,362 23,432 88,088 1,599 237 2,761 966 0 97 1,667 121,209MCS 8,716 164,184 87,490 3,549 1,691 9,725 13,640 0 2,822 12,000 303,817SCS 7,434 117,826 123,785 326 135 8,716 13,988 0 2,400 0 274,610Tepper 14,282 3,656 47,177 1,668 0 8,109 4,193 0 0 7,770 86,855SEI 0 0 72,632 2,034 3,037 6,177 10,654 0 0 29,477 124,010Other 8,571 20,564 60,238 102,279 340 10,759 38,139 0 1,782 22,937 265,610Total 87,933 577,210 686,010 119,874 5,845 96,425 112,474 0 7,795 118,242 1,811,807
VP Administration 0 0 42,555 4,208 0 27,730 82,468 0 172 6,374 163,508
VP EnrollmentRegistrar Classrooms 62,615 42 7,859 0 0 1,470 268 0 0 0 72,255Housing 0 0 3,531 1,573 0 14,269 18,872 608,474 2,094 213,560 862,373Athletics 0 0 4,690 0 108,936 953 2,931 0 0 1,875 119,386Other 0 0 29,000 1,500 4,001 72,811 8,228 0 8,473 9,560 133,574Total 62,615 42 45,081 3,073 112,938 89,503 30,299 608,474 10,567 224,995 1,187,588
VP Univ. Advancement 507 0 18,587 0 1,489 182 8,437 0 0 33,785 62,987
Total University 151,055 577,252 797,003 127,155 120,272 225,240 233,968 608,474 18,534 383,396 3,242,349
University Controlled 0 0 15,730 0 13,437 358 4,295 0 24,437 0 58,257
Total Net Assignable Space 151,055 577,252 812,733 127,155 133,709 225,599 238,263 608,474 42,970 383,396 3,300,605
Building Support 0 0 0 0 0 0 0 0 1,201,101 8,564 1,209,665
TOTAL 151,055 577,252 812,733 127,155 133,709 225,599 238,263 608,474 1,244,071 391,960 4,510,270
*The National Robotics Engineering Consortium (NREC) and the Software Engineering Institute (SEI) Building are not included in the leased use category.These buildings are counted with Carnegie Mellon buildings within the use catergory, within this table.
Use Category
7.3

TOTAL SPACE IN SQUARE FOOTAGEBY MAJOR DIVISION, COLLEGE/DIVISION & BUILDINGAS OF JUNE 30, 2004
407-409S. Craig
4902 Forbes
Ave.Alumni House
Baker/Porter Bramer
College of Fine Arts Cyert Doherty
FMS Bldg.
President 0 0 0 109 0 0 290 0 0
ProvostCIT 0 0 0 42,614 0 0 1,456 52,114 0CFA 0 5,853 0 5,233 0 82,553 0 27,891 0Heinz 0 0 0 0 0 0 0 0 0H&SS 0 4,702 0 93,982 0 0 0 0 0MCS 0 0 0 0 0 0 0 72,037 1,323SCS 0 0 0 0 0 0 96 3,018 0Tepper 0 0 0 0 0 0 0 0 0SEI 0 0 0 0 0 0 0 0 0Other 0 5,026 492 4,964 0 2,207 36,324 360 1,396Total 0 15,581 492 146,793 0 84,759 37,876 155,420 2,719
VP Administration 4,054 177 0 107 0 30 4,207 0 27,912
VP EnrollmentRegistrar Classrooms 0 2,349 0 24,606 0 3,474 92 11,688 0Housing 0 0 0 0 0 0 0 0 0Athletics 0 0 0 0 0 0 0 0 0Other 0 5,980 0 0 0 0 508 0 0Total 0 8,329 0 24,606 0 3,474 600 11,688 0
VP Univ. Advancement 0 1,118 6,008 0 3,485 0 0 0 0
Total University 4,054 25,205 6,500 171,615 3,485 88,264 42,973 167,108 30,630
University Controlled 2,881 3,708 0 0 0 0 0 266 0
Total Net Assignable Space 6,935 28,913 6,500 171,615 3,485 88,264 42,973 167,374 30,630
Building Support 3,498 7,675 1,714 79,105 1,013 39,271 21,500 81,510 13,081
TOTAL 10,433 36,588 8,214 250,720 4,498 127,534 64,473 248,884 43,712
Building
7.4

TOTAL SPACE IN SQUARE FOOTAGE (Cont.)BY MAJOR DIVISION, COLLEGE/DIVISION, & BUILDINGAS OF JUNE 30, 2004
GSIA GymHam-burg
Hamer-schlag
Hunt Library
M. Mor-rison
Mellon Institute
Newell-Simon
Pgh. Tech. Center
President 0 0 0 0 0 0 0 0 0
ProvostCIT 0 0 20,174 73,079 0 0 47 0 17,985CFA 0 0 0 0 0 67,056 0 0 0Heinz 0 0 44,045 0 0 0 0 0 0H&SS 0 0 0 0 0 8,353 12,505 0 0MCS 0 0 0 0 0 0 169,252 0 36SCS 0 0 0 2,274 0 0 0 94,586 0Tepper 79,085 0 0 0 0 0 0 0 0SEI 0 0 0 0 0 0 0 0Other 138 0 234 158 82,771 0 16,915 0 31,594Total 79,223 0 64,452 75,510 82,771 75,409 198,719 94,586 49,614
VP Administration 50 20 30 20 0 79 3,917 129 122
VP EnrollmentRegistrar Classrooms 0 0 5,788 1,783 0 2,927 1,575 0 0Housing 0 0 0 0 0 0 0 0 0Athletics 0 55,488 0 0 0 0 0 0 0Other 0 0 0 583 0 1,195 465 1,171 88Total 0 55,488 5,788 2,366 0 4,122 2,041 1,171 88
VP Univ. Advancement 0 0 0 0 903 0 2,389 0 0
Total University 79,273 55,508 70,270 77,896 83,674 79,609 207,066 95,887 49,824
University Controlled 0 0 0 235 0 193 1,978 0 0
Total Net Assignable Space 79,273 55,508 70,270 78,131 83,674 79,802 209,045 95,887 49,824
Building Support 52,950 8,053 35,239 49,689 15,336 36,823 143,821 58,094 31,671
TOTAL 132,223 63,561 105,509 127,820 99,010 116,625 352,866 153,981 81,495
Building
7.5
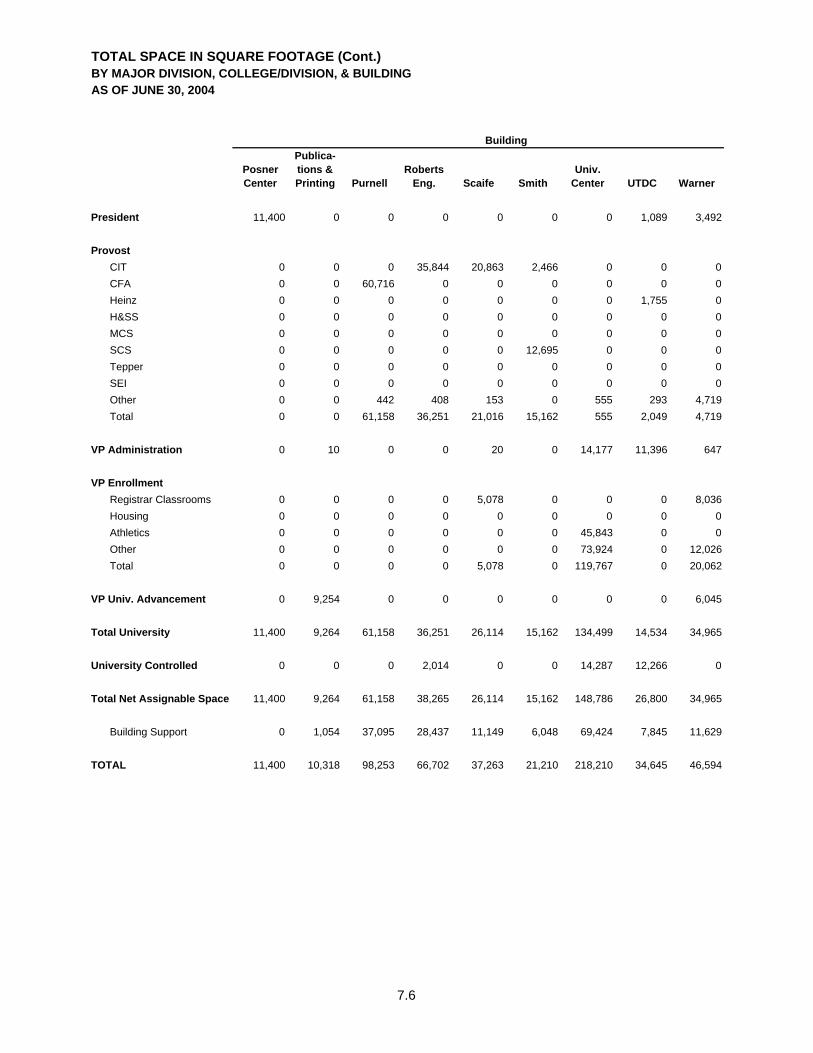
TOTAL SPACE IN SQUARE FOOTAGE (Cont.)BY MAJOR DIVISION, COLLEGE/DIVISION, & BUILDINGAS OF JUNE 30, 2004
Posner Center
Publica-tions & Printing Purnell
Roberts Eng. Scaife Smith
Univ. Center UTDC Warner
President 11,400 0 0 0 0 0 0 1,089 3,492
ProvostCIT 0 0 0 35,844 20,863 2,466 0 0 0CFA 0 0 60,716 0 0 0 0 0 0Heinz 0 0 0 0 0 0 0 1,755 0H&SS 0 0 0 0 0 0 0 0 0MCS 0 0 0 0 0 0 0 0 0SCS 0 0 0 0 0 12,695 0 0 0Tepper 0 0 0 0 0 0 0 0 0SEI 0 0 0 0 0 0 0 0 0Other 0 0 442 408 153 0 555 293 4,719Total 0 0 61,158 36,251 21,016 15,162 555 2,049 4,719
VP Administration 0 10 0 0 20 0 14,177 11,396 647
VP EnrollmentRegistrar Classrooms 0 0 0 0 5,078 0 0 0 8,036Housing 0 0 0 0 0 0 0 0 0Athletics 0 0 0 0 0 0 45,843 0 0Other 0 0 0 0 0 0 73,924 0 12,026Total 0 0 0 0 5,078 0 119,767 0 20,062
VP Univ. Advancement 0 9,254 0 0 0 0 0 0 6,045
Total University 11,400 9,264 61,158 36,251 26,114 15,162 134,499 14,534 34,965
University Controlled 0 0 0 2,014 0 0 14,287 12,266 0
Total Net Assignable Space 11,400 9,264 61,158 38,265 26,114 15,162 148,786 26,800 34,965
Building Support 0 1,054 37,095 28,437 11,149 6,048 69,424 7,845 11,629
TOTAL 11,400 10,318 98,253 66,702 37,263 21,210 218,210 34,645 46,594
Building
7.6

TOTAL SPACE IN SQUARE FOOTAGE (Cont.)BY MAJOR DIVISION, COLLEGE/DIVISION, & BUILDINGAS OF JUNE 30, 2004
WeanWhit-field
Housing Bldgs. Other NREC SEI
Other Leased
UNIVERSITY TOTAL
President 0 0 0 80 0 0 0 16,460
ProvostCIT 28,461 0 0 904 0 0 16,140 312,147CFA 197 0 0 0 0 0 26,601 276,100Heinz 0 0 0 0 0 0 1,650 47,450H&SS 0 0 0 0 0 0 1,667 121,209MCS 48,970 0 0 0 200 0 12,000 303,817SCS 80,279 0 0 0 81,662 0 0 274,610Tepper 0 0 0 0 0 0 7,770 86,855SEI 0 0 0 0 0 94,533 29,477 124,010Other 20,343 68 1,172 31,383 0 557 22,937 265,610Total 178,250 68 1,172 32,287 81,862 95,090 118,242 1,811,807
VP Administration 1,838 8,242 19,020 60,929 0 0 6,374 163,508
VP EnrollmentRegistrar Classrooms 4,859 0 0 0 0 0 0 72,255Housing 0 0 614,673 34,140 0 0 213,560 862,373Athletics 0 0 14,196 1,984 0 0 1,875 119,386Other 0 0 22,912 5,162 0 0 9,560 133,574Total 4,859 0 651,781 41,286 0 0 224,995 1,187,588
VP Univ. Advancement 0 0 0 0 0 0 33,785 62,987
Total University 184,947 8,310 671,973 134,582 81,862 95,090 383,396 3,242,349
University Controlled 0 0 0 20,227 0 202 0 58,257
Total Net Assignable Space 184,947 8,310 671,973 154,809 81,862 95,292 383,396 3,300,605
Building Support 112,372 3,722 173,054 7,804 13,478 37,949 8,564 1,209,665
TOTAL 297,319 12,032 845,027 162,613 95,340 133,241 391,960 4,510,270
Leased SpaceBuilding
7.7

NET ASSIGNABLE SPACE BY MAJOR USE & DIVISIONAS OF JUNE 30, 2004
Net Assignable Space by Major Division
Net Assignable Space by Major Use
Academic47%
Provost Admin.8%
VP Enrollment
36%
Univ. Controlled
2%
VP Univ.Advancement
2%
VP Administration5%
Classroom5%
Laboratory17%
Office25%
Study4%
Special Use4%
General Use7%
Support7%
Other1%
Leased12%
Residential18%
7.8

PARKING CAPACITYFISCAL YEAR 2005
SpacesPermit Parking 2,418Visitor Parking 242Meter Parking 46Utility Parking 28Campus Street 301Carnegie Mellon Area Total 3,035Total Permits Issued 2,610
HOUSING CAPACITYBY BEDS AVAILABLE & BEDS FILLEDFALL SEMESTER 2004
Beds Available
BedsFilled
Boss House 72 72Cathedral Mansions 170 168Doherty Apartments 152 151Donner House 252 249Fairfax Apartments 153 150Fraternities 440 282Forbes House 33 32Hammerschlag House 166 164Henderson House 60 60London Terrace Apartments 59 58Margaret Morrison Apartments 71 71Margaret Morrison Sorority Houses 24 24McGill House 71 70Morewood Gardens 664 659Mudge House 308 305Neville Apartments 22 22New House 256 255Resnik House 150 149Roselawn Houses 60 59Scobell House 86 86Shady Oak Apartments 68 66Shirley Apartments 41 40Sororities 80 75Spirit House 7 5Tech House 6 5Veronica Apartments 35 33Webster Hall 199 198Welch House 56 56West Wing 146 144Woodlawn Apartments 36 36Total 3,943 3,744
7.9

1
blah
7.10

7.11

7.12

7.13

1
blah
7.14

APPENDIX

blah
8.2

I. COLLEGE AND DEPARTMENT LISTING
College Abbreviation Notes
CARNEGIE INSTITUTE OF TECHNOLOGY CIT Undergraduate and Graduate College
PROGRAMS:Biomedical Engineering Biomedical EngChemical Engineering Chemical EngCivil and Environmental Engineering Civil & Env EngElectrical and Computer Engineering Elec & Comp EngEngineering and Public Policy EPPInformation Networking Institute Info Networking InstMaterials Science and Engineering MSEMechanical Engineering Mechanical Eng
ADDITIONAL UNITS:Center for Bone Tissue Ctr Bone Tissue Research center that houses faculty in CIT.Dean's Office Dean's Ofc Some faculty with administrative responsibility are
located in the Dean's office.Institute for Complex Engineered Systems ICES Research center that houses faculty in CIT.No Major Department No Major Dept Students have not yet declared their major.
COLLEGE OF FINE ARTS CFA Undergraduate and Graduate College
PROGRAMS:ArchitectureArtDesignDramaMusic
ADDITIONAL UNITS:Ctr. for Building Performance & Diagnostics CBPD Research center that houses faculty in CFA.Dean's Office Dean's Ofc Some faculty with administrative responsibility are
located in the Dean's office.Music Extension Division Music-Ext Div Program of study within CFA.Music Preparatory School Music-Prep Sch Program of study within CFA.Saturday Pre-College Art Program Sat Pre Art Program within CFA for high school students.Studio for Creative Inquiry SFCI Research center that houses faculty in CFA.No Major Department No Major Dept Students have not yet declared their major.Student Defined Major Individualized interdisciplinary majors.
COLLEGE OF HUMANITIES H&SS Undergraduate and Graduate CollegeAND SOCIAL SCIENCES
PROGRAMS:Center for Innovation in Learning Ctr for Innovation in LearnEconomics (Undergraduate)EnglishHistoryInformation Systems Program IS ProgramModern Languages Modern LangPhilosophyPsychologySocial and Decision Sciences Soc & Dec SciStatistics
ADDITIONAL UNITS:Center for the Neural Basis of Cognition CNBC Research center that houses faculty in H&SS.Center for the Arts in Society CTR-ARTS IN SOC Research center that houses faculty in H&SS.Dean's Office Dean's Ofc. Some faculty with administrative responsibility are
located in the Dean's office.
8.3

College Abbreviation Notes
H&SS ADDITIONAL UNITS CONTINUEDH&SS Academic Advisory Center H&SS ACAD ADV C Faculty advisors housed within H&SS.H&SS Multimedia Faculty department within H&SS.No Major Department No Major Dept Students have not yet declared their major.Student Defined Major Individualized interdisciplinary majors.
MELLON COLLEGE OF SCIENCE MCS Undergraduate and Graduate College
PROGRAMS:Biological Sciences Biological SciChemistryMathematical Sciences MathPhysics
ADDITIONAL UNITS:Dean's Office Dean's Ofc. Some faculty with administrative responsibility are
located in the Dean's office.Molecular Biosensor & Imaging Ctr. Admin. MBIC-ADMIN Research center that houses faculty in MCS.No Major Department No Major Dept. Students have not yet declared their major.NMR Center Research center that houses faculty in MCS.Pittsburgh Supercomputing Center PGH Supercomptr Research center that houses faculty in MCS.
SCS Undergraduate and Graduate College
PROGRAMS:Center for Automated Learning & Discovery CALD Research CenterComputer Science Computer SciHuman-Computer Interaction HCILanguage Technologies Institute LTI or Lang Tech InstRoboticsSoftware Engineering Software Eng
ADDITIONAL UNITS:CSD Education - PhD CSD-ED PHD Computer Science Department faculty and staff.Dean's Office Dean's Ofc. Some faculty with administrative responsibility are
located in the Dean's office.Institute for Software Research, Intl. ISRI Research center that houses faculty in SCS.
Tepper Undergraduate and Graduate College
PROGRAMS:Business Administration Business AdminElectronic CommerceSchool of BusinessSchool of Business, Flex-time
Heinz Graduate College POLICY AND MANAGEMENT
INTERDISCIPLINARY Undergraduate and Graduate ProgramsPROGRAMS:
Entertainment Technology Entertainment Tech Joint Graduate program between CFA and SCS.Humanities & Arts (BHA) BHA Joint Undergrad program between CFA and H&SS.Information Security Technology and Management Joint Graduate program with CIT, SCS, Heinz, and TepperInformation Systems Management Info Sys Mgmt Joint Graduate program with Heinz, SCS, and SEI.Information Technology Info Tech Joint Graduate program with Heinz, SCS, and SEI.Integrated Product Development Integrated Product Dev Joint Graduate Program with CIT, CFA, and TepperScience & Arts (BSA) Sci & Arts (BSA) Joint Undergrad program between CFA and MCS.
SOFTWARE ENGINEERING INSTITUTE SEI Research Center
CARNEGIE MELLON QATAR CMU-Q Undergraduate PROGRAMS:
Business Administration Qatar Business AdminComputer Science Qatar Comp Sci
CARNEGIE MELLON WEST CMU West Graduate
NON-DEGREE Non-degree seeking students
H. JOHN HEINZ III SCHOOL OF PUBLIC
TEPPER SCHOOL OF BUSINESS
SCHOOL OF COMPUTER SCIENCE
8.4
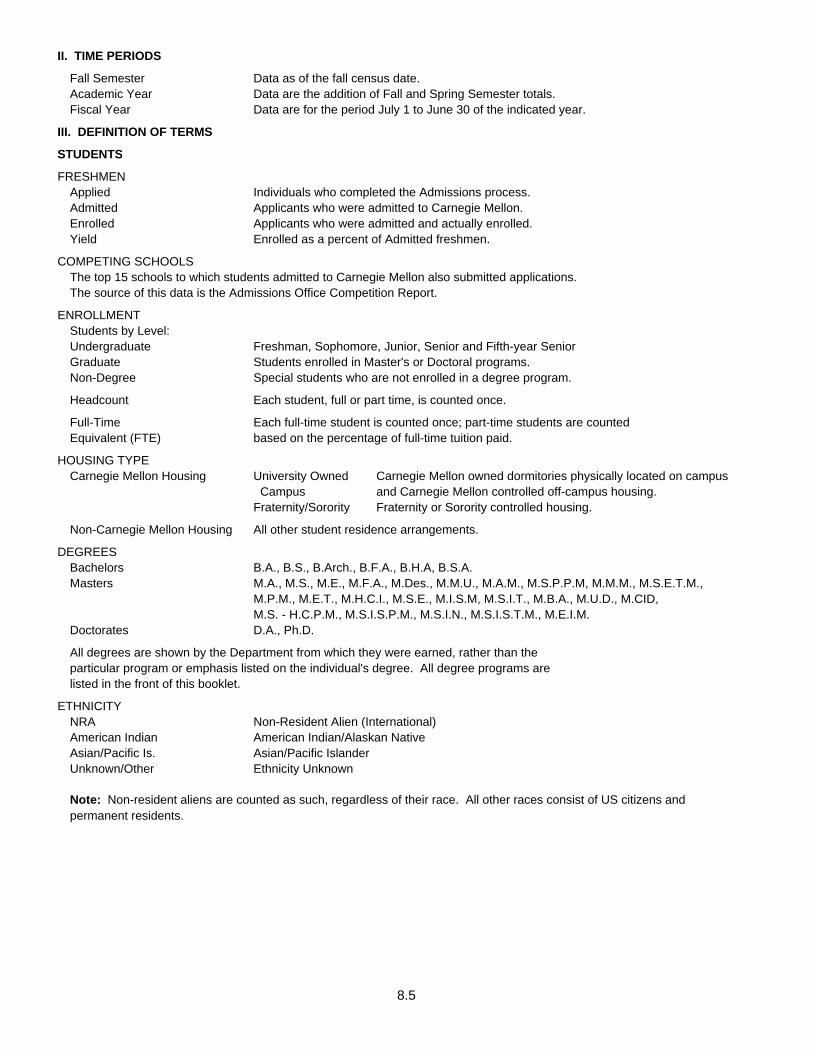
II. TIME PERIODS
Fall Semester Data as of the fall census date.Academic Year Data are the addition of Fall and Spring Semester totals.Fiscal Year Data are for the period July 1 to June 30 of the indicated year.
III. DEFINITION OF TERMS
STUDENTS
FRESHMENApplied Individuals who completed the Admissions process.Admitted Applicants who were admitted to Carnegie Mellon.Enrolled Applicants who were admitted and actually enrolled.Yield Enrolled as a percent of Admitted freshmen.
COMPETING SCHOOLSThe top 15 schools to which students admitted to Carnegie Mellon also submitted applications.The source of this data is the Admissions Office Competition Report.
ENROLLMENTStudents by Level:Undergraduate Freshman, Sophomore, Junior, Senior and Fifth-year SeniorGraduate Students enrolled in Master's or Doctoral programs.Non-Degree Special students who are not enrolled in a degree program.
Headcount Each student, full or part time, is counted once.
Full-Time Each full-time student is counted once; part-time students are countedEquivalent (FTE) based on the percentage of full-time tuition paid.
HOUSING TYPECarnegie Mellon Housing University Owned Carnegie Mellon owned dormitories physically located on campus
Campus and Carnegie Mellon controlled off-campus housing.Fraternity/Sorority Fraternity or Sorority controlled housing.
Non-Carnegie Mellon Housing All other student residence arrangements.
DEGREESBachelors B.A., B.S., B.Arch., B.F.A., B.H.A, B.S.A.Masters M.A., M.S., M.E., M.F.A., M.Des., M.M.U., M.A.M., M.S.P.P.M, M.M.M., M.S.E.T.M.,
M.P.M., M.E.T., M.H.C.I., M.S.E., M.I.S.M, M.S.I.T., M.B.A., M.U.D., M.CID,M.S. - H.C.P.M., M.S.I.S.P.M., M.S.I.N., M.S.I.S.T.M., M.E.I.M.
Doctorates D.A., Ph.D.
All degrees are shown by the Department from which they were earned, rather than the particular program or emphasis listed on the individual's degree. All degree programs are listed in the front of this booklet.
ETHNICITYNRA Non-Resident Alien (International)American Indian American Indian/Alaskan NativeAsian/Pacific Is. Asian/Pacific IslanderUnknown/Other Ethnicity Unknown
Note: Non-resident aliens are counted as such, regardless of their race. All other races consist of US citizens and permanent residents.
8.5

TEACHING
UNITSA student earns a specified number of units for each course taken at the University. Three (3) units are the equivalent of one (1) credit hour. The total units taught by a department is calculated bysumming the units taken by each student for each course taught by the department.
Other Includes units taught to Non-Degree students and students from other colleges attending Carnegie Mellon through the Pennsylvania Council of Higher Education(PCHE) agreement.
FACULTY AND STAFF
See definitions on page 4.3
ALUMNI
Includes all living persons who attended the university as degree candidates.
FINANCES
TUITION AND FEESUndergraduate Tuition Tuition charged to full-time undergraduate students. This is established at the
university level. Tuition levels vary by student's year of entry.Graduate Tuition Tuition charged to full-time graduate students. This is established by each college.Average Room The annual charge for a standard double room. Average Board The average board plan includes the student's choice of meal plan options.Total Estimated Cost This includes tuition and activities fee, books and supplies, of Attending incidentals, room and board and lunches and transportation for Carnegie Mellon Commuters. This is computed each year by the Financial Aid Office.
UNDERGRADUATE FINANCIAL AID RESOURCES
Federal Aid PELL Federal entitlement grant programSEOG Supplemental Education Opportunity Grant
State Aid PHEAA Pennsylvania Higher Education Assistance AgencyOther State Aid Aid from states other than PennsylvaniaCarnegie Mellon Aid provided from Carnegie Mellon General Unrestricted Operating Funds General Unrestricted (i.e. scholarship and grant aid from undergraduate tuition revenue)Carnegie Mellon Endowed Aid provided from income from the Carnegie Mellon University Endowment FundCarnegie Mellon Aid provided through gifts and grants to the University (other than endowed funding) Gifts & Grants for this purposeROTC Scholarship funding from the Air Force, Army and Navy ROTC programsOther Grant Resources External aid from all other sources, other than those listed above
RESEARCH COSTS
In the listing by College and Research Center, the category "Other" includes:Academic Computing, Computing Systems, Hunt Institute for Botanical Documentation, Center for the Design of Educational Computing, Office of the Provost, Office of the Vice President for Enrollment and General Institutional.
Nominal dollars Not adjusted for inflation.Real dollars Adjusted for inflation.
VOLUNTARY SUPPORT
Voluntary Support Contributions supporting the University, excluding: income from endowment and otherinvested funds, and support from federal, state and local governments and their agencies.
8.6

OPERATING REVENUE AND OPERATING EXPENSES
OPERATING REVENUE
Tuition & Fees, Tuition and other educational fees are reported net of student financial aid. net of financial aid
Sponsored Projects Includes research and other programs sponsored by government and private sources. Direct sponsored project revenues represent reimbursement of costs incurred in direct support ofsponsored projects. Such revenue is recognized when the direct costs are incurred. In addition, sponsored projects normally provide for the recovery of indirect costs supporting the project. Indirect sponsored project revenues are recorded at rates established in advance byCarnegie Mellon through negotiations with the United States Government and other sponsors.Amounts received from sponsors under agreements that require the exchange of assets, rightsor other privileges between Carnegie Mellon and the sponsor are recorded as deferred revenueuntil the contract terms are fulfilled.
Investment Income Includes dividends, interest, rents, royalties, and equity or total net income of subsidiaries thatare significantly or wholly-owned.
Contributions Includes gifts, unconditional pledges to give and grants.Auxiliary Services Includes revenues from an entity that exists predominately to furnish goods or services to
students, faculty, or staff, and that charges a fee directly related to, although not necessarilyequal to, the cost of goods or services.
Other Sources Includes all other revenue sources not captured in the defined categories.Net Assets Released Represents the reclassification of net assets for operations received with donor-imposed from Restrictions temporary time or purpose restrictions to unrestricted net assets as such time and purpose
restrictions are met.
OPERATING EXPENSES
Salaries Includes all forms of monetary compensation to employees, including students employed oncampus.
Benefits University sponsored benefits offered to full time and permanent part time employees. Offerings change from year to year in keeping with market trends and cost considerations.
Supplies and Services Includes supplies, shipping, subcontracts, professional fees, travel and other personnel costs.Occupancy and Costs associated with owning, renting and operating university space. Related ExpensesOther Expenses Includes all other operating expenses not captured in the defined categories.Depreciation and Annual cost of capital assets allocated over estimated useful lives. AmortizationInterest Expense Cost of interest on external borrowing.
8.7

SPACE AND FACILITIES
USE CATEGORIESClassroom Facilities General purpose classrooms, lecture halls, recitation rooms, seminar rooms and other rooms
used primarily for scheduled non-laboratory instruction.Laboratory Facilities Rooms characterized by special purpose equipment or a specific configuration that ties
instructional or research activities to a particular discipline or a closely related group ofdisciplines.
Office Facilities Offices and conference rooms specifically assigned to each of the various academic,administrative and service functions.
Study Facilities Study rooms, open stack reading rooms, and library processing rooms.Special Use Facilities Rooms that are so sufficiently specialized in their primary activity or function to merit a unique
room code. Areas and rooms for military training, athletic activity, media production, clinicalactivities (outside of separately organized health care facilities), demonstration, agriculturalfield activities, and animal and plant shelters are included here.
General Use Facilities General use facilities comprise a campus general service or functional support system(assembly, exhibition, dining, relaxation, merchandising, recreation, general meetings, andday care).
Support Facilities These rooms provide centralized space for auxiliary support systems, which help keep allinstitutional programs and activities operational. Included in these areas are computer-basedprocessing and telecommunications, shop services, general storage and supply, vehiclestorage, central services (e.g., printing and duplicating, mail, shipping and receiving,environmental testing or monitoring, laundry, or food stores), and hazardous materials areas.
Residential Facilities Housing facilities for students, faculty, staff, and outside visitors to campus.Other Include health care facilities (rooms used to provide patient care that is located in separately
organized health care facilities), unclassified areas (assignable areas that are inactive orunassigned; in the process of being altered, renovated, or converted), and nonassignableareas (areas of a building that are used to support the overall activities in that building -e.g., elevators, stairs, custodial closets, circulation and mechanical areas).
8.8