Embed Size (px)
Citation preview
Aequorea Victoria, Green Fluorescent Protein:The protein that started it allThe protein that started it all

Fluorescent Protein Timeline
Roger Tsien
Osamu Shimomura
Day and DavidsonDay and DavidsonChem. Soc. Rev.38: 2887 (2009)
Martin Chalfie
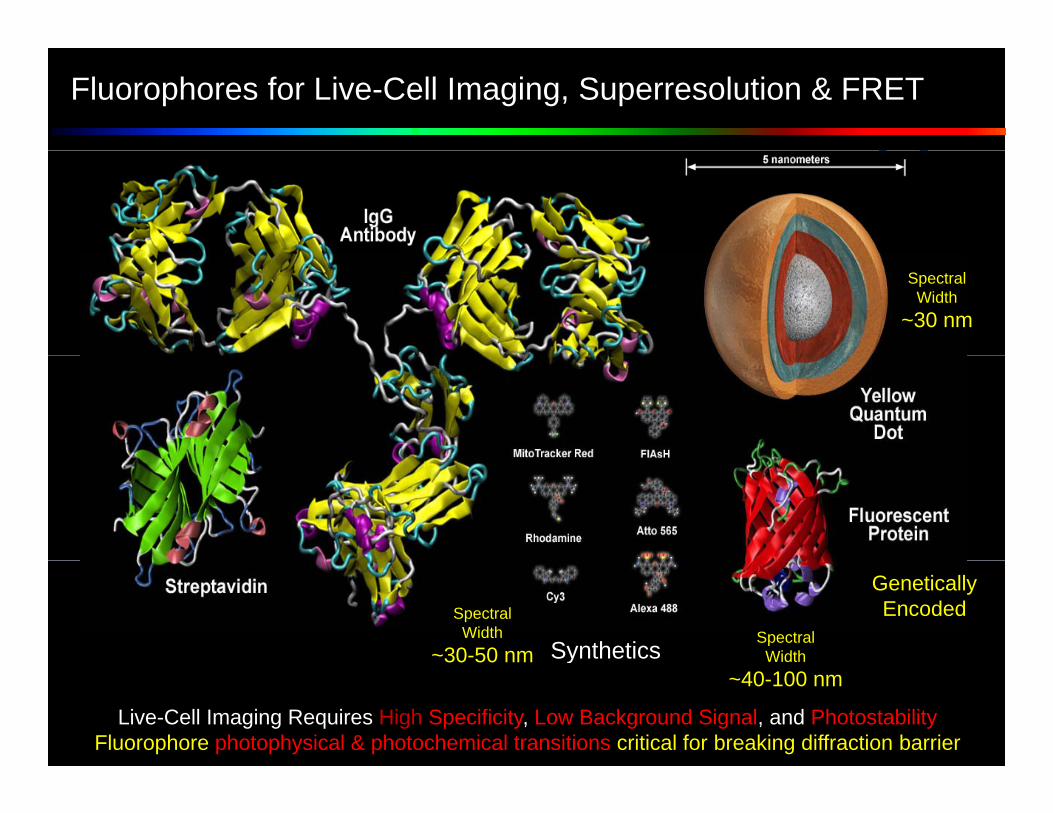
Fluorophores for Live-Cell Imaging, Superresolution & FRET
SpectralWidth
~30 nm
GeneticallyEncoded
Synthetics SpectralWidth
SpectralWidth
~30-50 nm y~40-100 nm
Live-Cell Imaging Requires High Specificity, Low Background Signal, and PhotostabilityFluorophore photophysical & photochemical transitions critical for breaking diffraction barrier
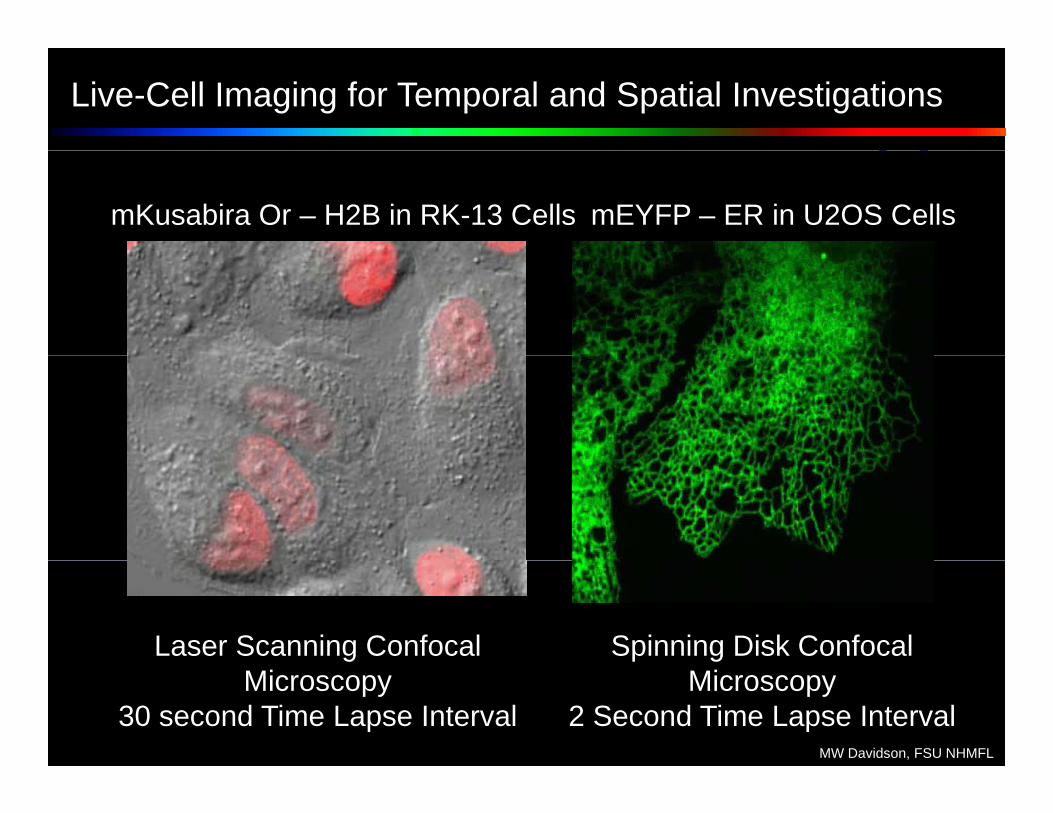
Live-Cell Imaging for Temporal and Spatial Investigations
mKusabira Or – H2B in RK-13 Cells mEYFP – ER in U2OS Cells
Laser Scanning Confocal Spinning Disk ConfocalMicroscopy
30 second Time Lapse IntervalMicroscopy
2 Second Time Lapse IntervalMW Davidson, FSU NHMFL
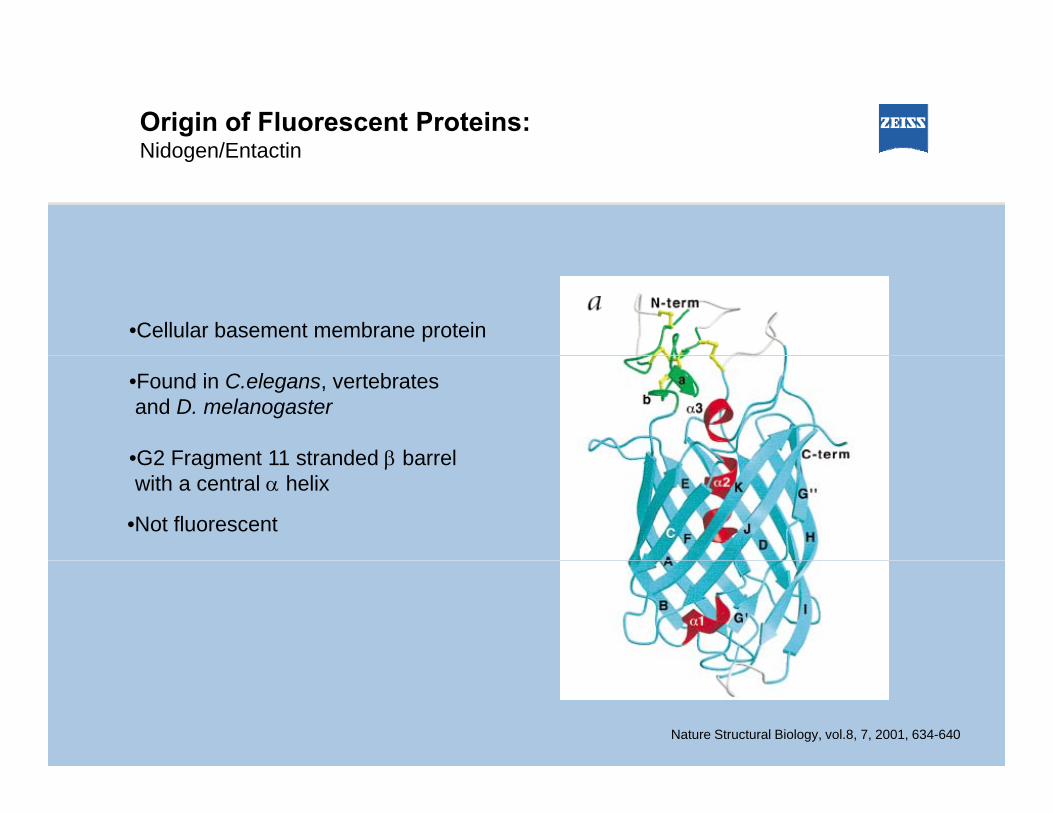
Origin of Fluorescent Proteins:Nidogen/EntactinNidogen/Entactin
•Cellular basement membrane protein
•Found in C.elegans, vertebrates and D. melanogaster
•G2 Fragment 11 stranded β barrel•G2 Fragment 11 stranded β barrelwith a central α helix
•Not fluorescent
Nature Structural Biology, vol.8, 7, 2001, 634-640

Origin of Fluorescent Proteins:The family treeThe family tree
Biol. Bull.,213:95-100, 2007
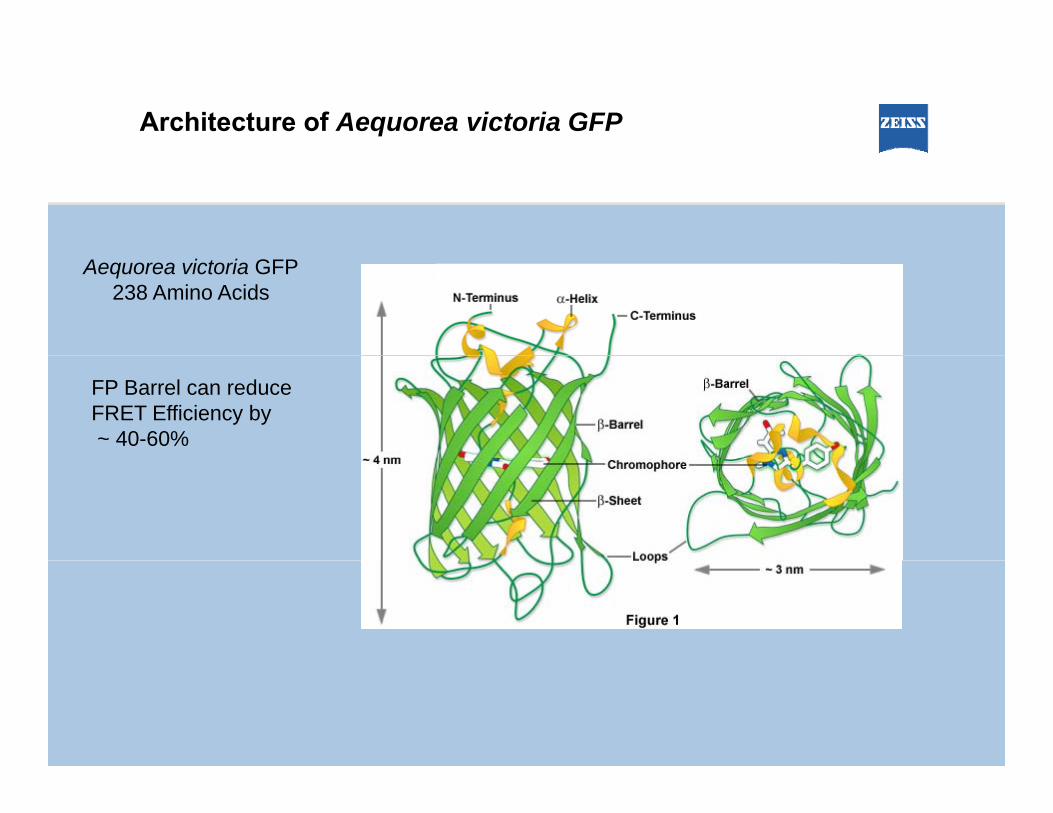
Architecture of Aequorea victoria GFP
Aequorea victoria GFP238 Amino Acids
FP Barrel can reduce FRET Efficiency by ~ 40-60%

GFP Spectral Properties:wtGFP and EGFP (S65T) and variantswtGFP and EGFP (S65T) and variants
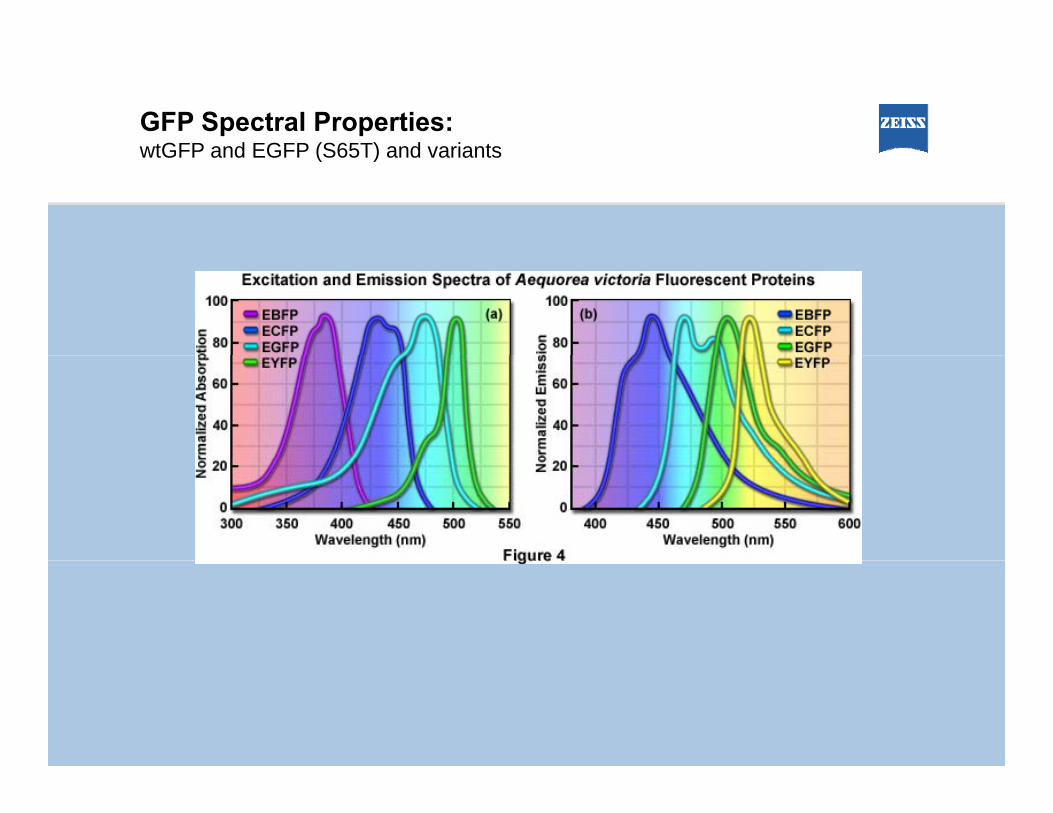
GFP Spectral Properties:wtGFP and EGFP (S65T) and variantswtGFP and EGFP (S65T) and variants

Improved GFPs Through Mutagenesis
~75% mutationsoccur in strands
λ mutationsoccur near
central α-helix
7, 8, & 10
Cyan andYellow mutations
A206KavGFP
at terminifrom
CyPet & YPet
a Gcommon
“monomerizing”mutation
Folding mutations occur throughout the sequence
Formation of the EGFP Chromophore
www.Zeiss.com/campus
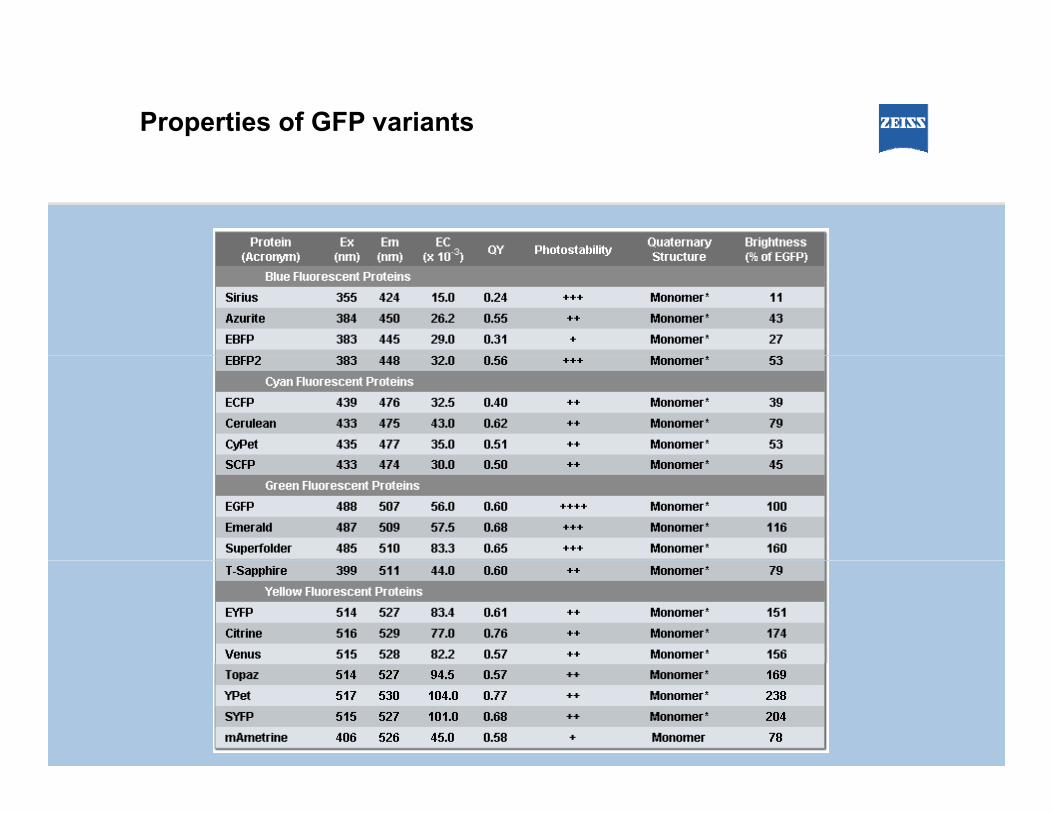
Properties of GFP variants
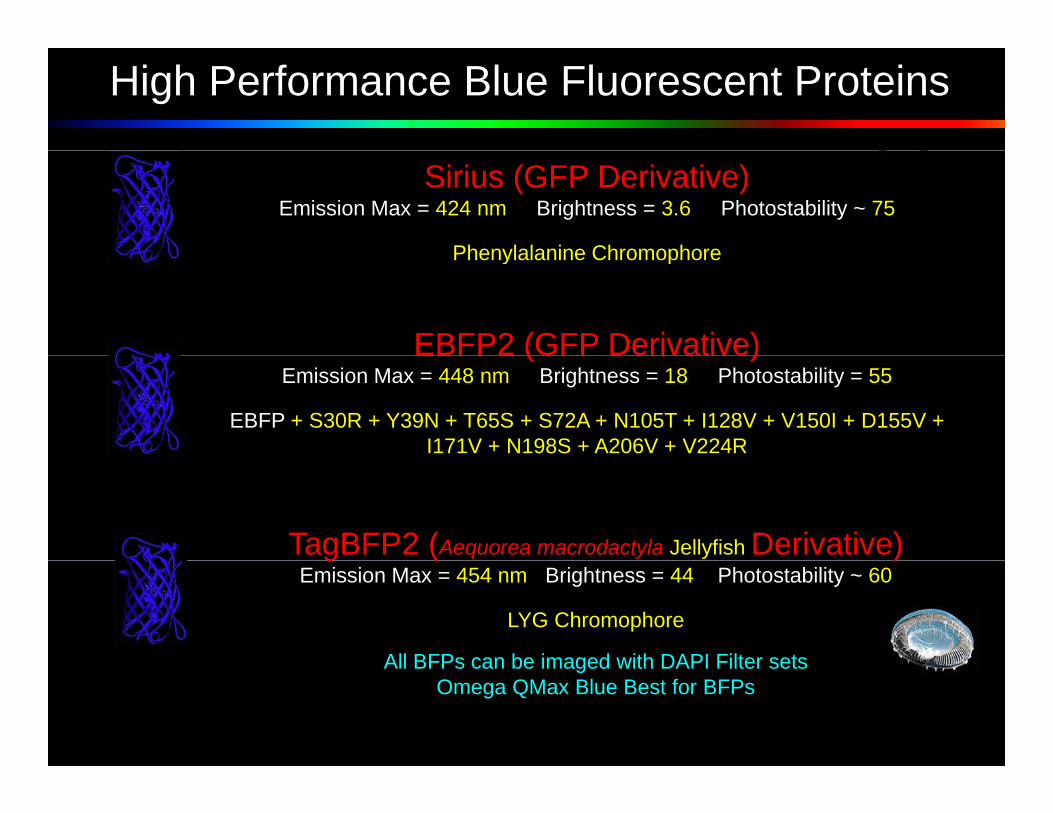
High Performance Blue Fluorescent Proteins
Sirius (GFP Derivative)Emission Max = 424 nm Brightness = 3.6 Photostability ~ 75
Phenylalanine ChromophorePhenylalanine Chromophore
EBFP2 (GFP Derivative)( )Emission Max = 448 nm Brightness = 18 Photostability = 55
EBFP + S30R + Y39N + T65S + S72A + N105T + I128V + V150I + D155V + I171V + N198S + A206V + V224R
TagBFP2 (Aequorea macrodactyla Jellyfish Derivative)g ( )Emission Max = 454 nm Brightness = 44 Photostability ~ 60
LYG Chromophore
All BFPs can be imaged with DAPI Filter setsAll BFPs can be imaged with DAPI Filter setsOmega QMax Blue Best for BFPs
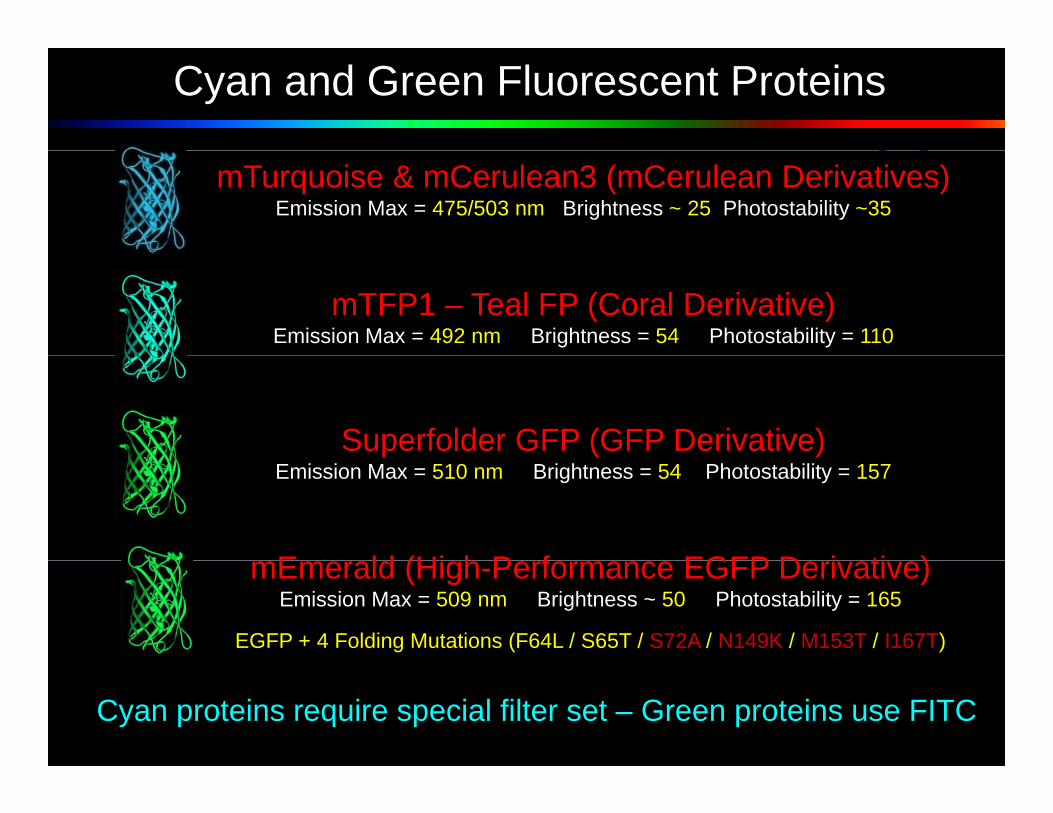
Cyan and Green Fluorescent Proteins
mTurquoise & mCerulean3 (mCerulean Derivatives)Emission Max = 475/503 nm Brightness ~ 25 Photostability ~35
mTFP1 – Teal FP (Coral Derivative)Emission Max = 492 nm Brightness = 54 Photostability = 110
Superfolder GFP (GFP Derivative)Emission Max = 510 nm Brightness = 54 Photostability = 157
E ld (Hi h P f EGFP D i ti )mEmerald (High-Performance EGFP Derivative)Emission Max = 509 nm Brightness ~ 50 Photostability = 165
EGFP + 4 Folding Mutations (F64L / S65T / S72A / N149K / M153T / I167T)
Cyan proteins require special filter set – Green proteins use FITC
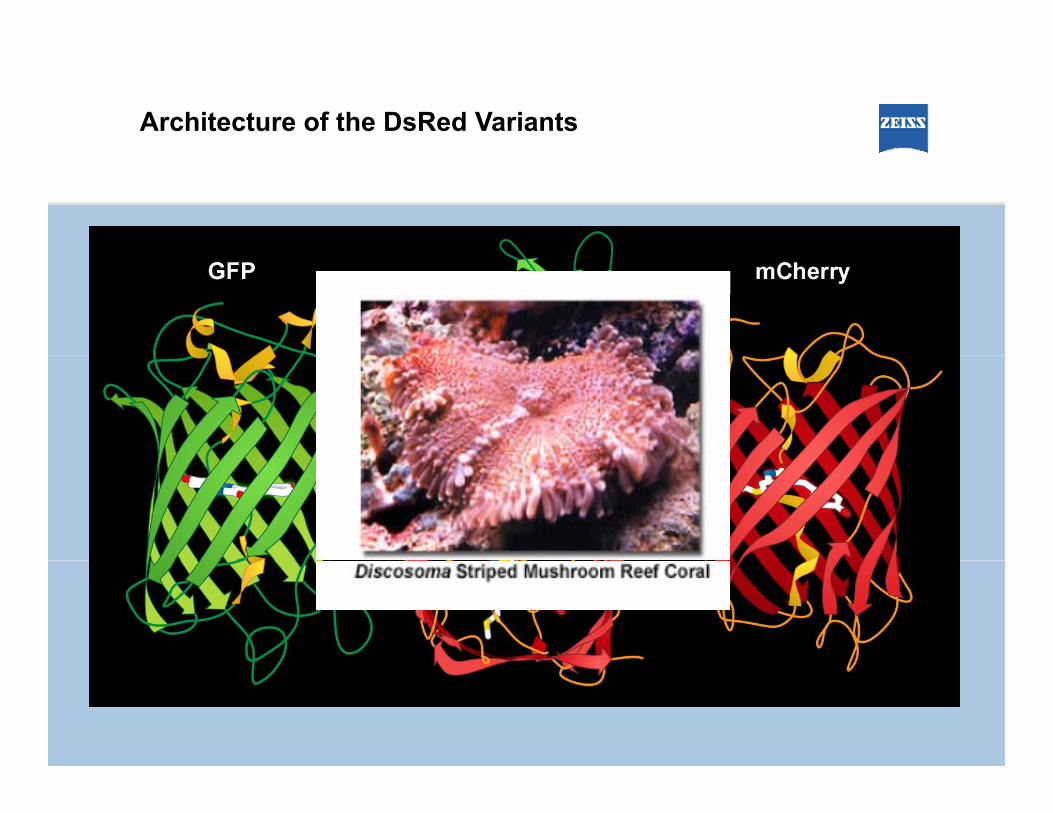
Architecture of the DsRed Variants
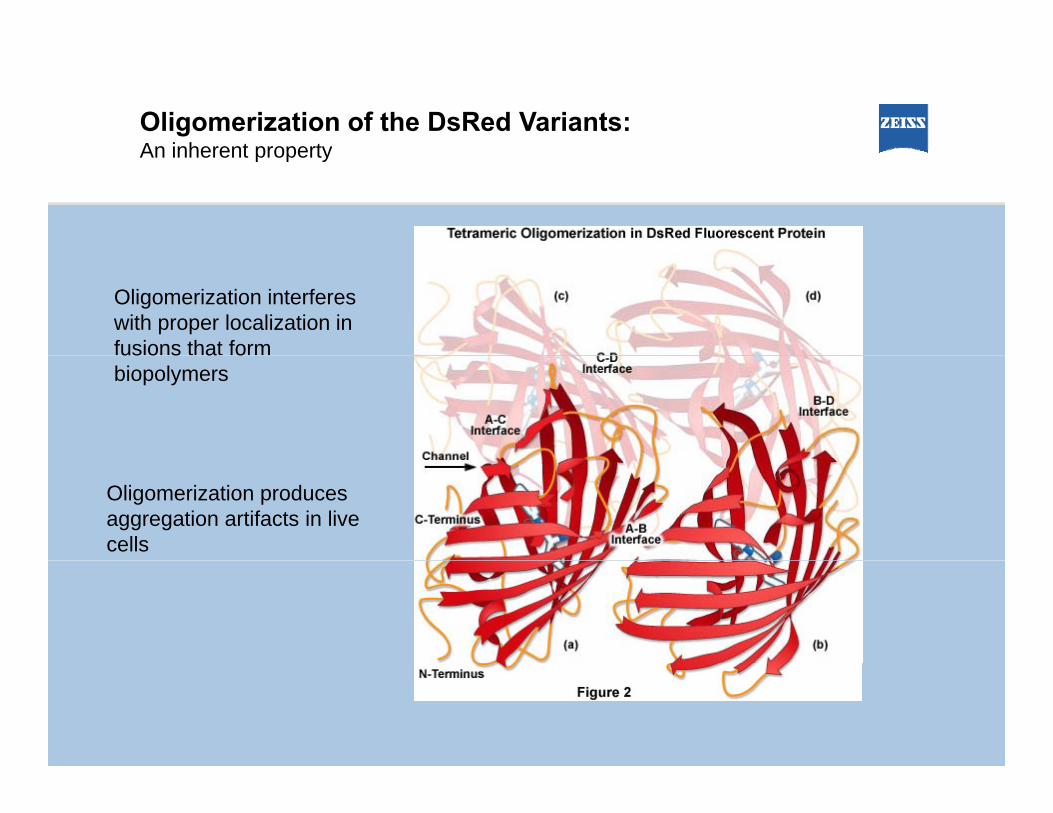
Oligomerization of the DsRed Variants:An inherent propertyAn inherent property
Oligomerization interfereswith proper localization in fusions that form us o s a obiopolymers
Oligomerization produces aggregation artifacts in live cells

Overcoming Oligomerization of the DsRed Variants
In some cases, tetramers and dimers don’t affect localizationlocalization
Tandem Dimer may work similar to a monomerbut at twice the sizebut at twice the size
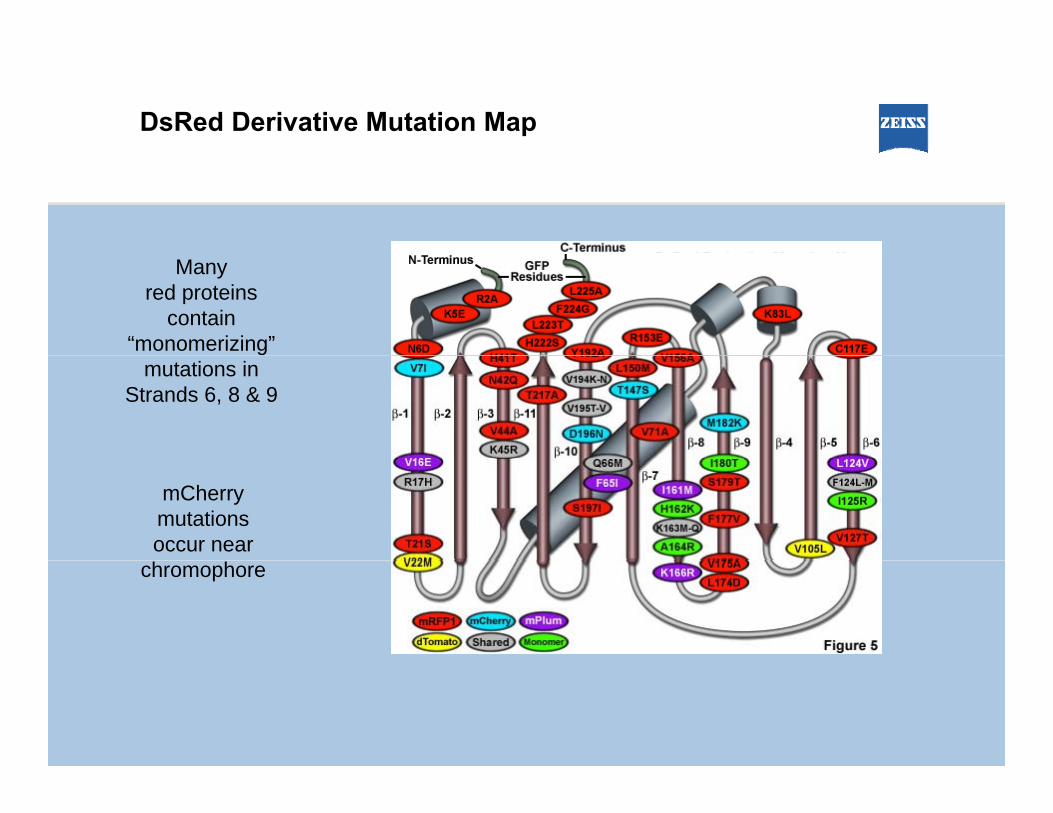
DsRed Derivative Mutation Map
Manyred proteins
contain“monomerizing”
mutations inStrands 6, 8 & 9
mCherrymutationsoccur near
chromophore
Anthozoa Fluorescent Protein Variants:DsRed Chromophore FormationDsRed Chromophore Formation
www.Zeiss.com/campus

Orange and Red Fluorescent Proteins
mKO2 (Kusabira Orange; Coral Derivative)Emission Max = 565 nm Brightness = 40 Photostability = 100
tdTomato (dsRed Derivative)Emission Max = 581 nm Brightness = 95 Photostability = 75
mApple (mOrange Derivative; 18 Mutations)Emission Max = 592 nm Brightness = 37 Photostability ~ 100Emission Max = 592 nm Brightness = 37 Photostability 100
mCherry (mRFP1 Derivative)mCherry (mRFP1 Derivative)Emission Max = 610 nm Brightness = 16 Photostability ~ 100
Orange FPs can be imaged with a TRITC or Cy3 filter setRed FPs require Texas Red or Longpass filter set
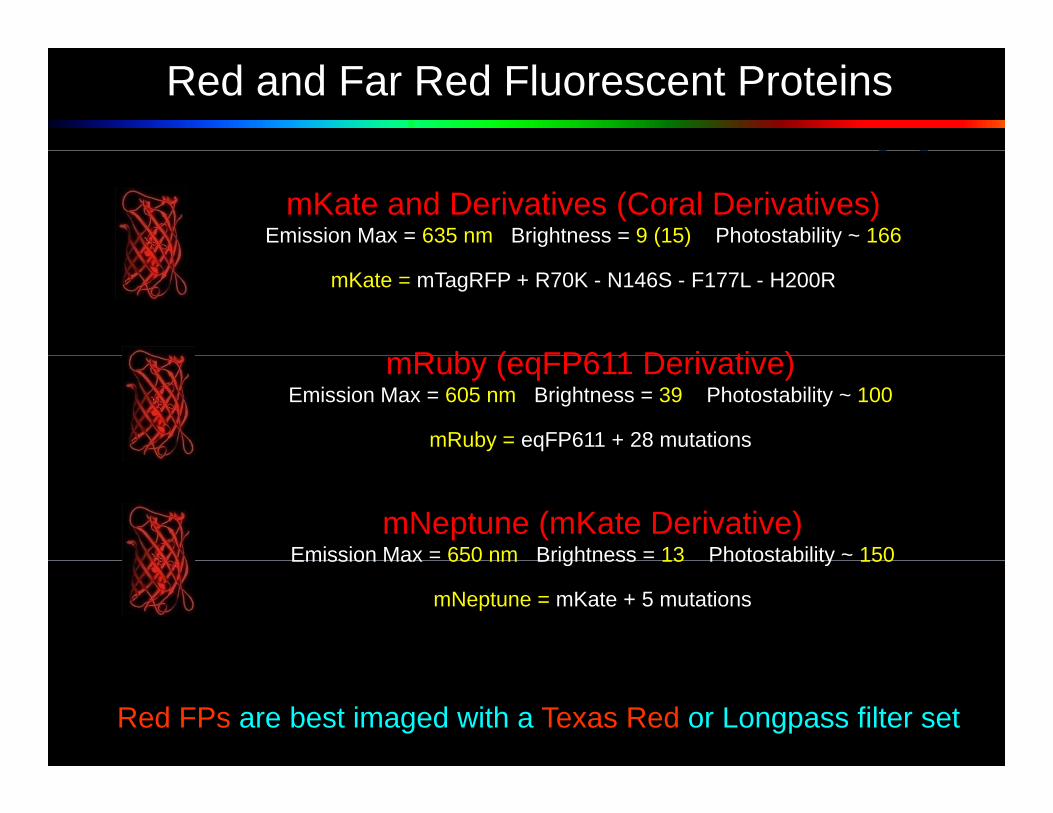
Red and Far Red Fluorescent Proteins
mKate and Derivatives (Coral Derivatives)Emission Max = 635 nm Brightness = 9 (15) Photostability ~ 166
mKate = mTagRFP + R70K - N146S - F177L - H200R
R b ( FP611 D i ti )mRuby (eqFP611 Derivative)Emission Max = 605 nm Brightness = 39 Photostability ~ 100
mRuby = eqFP611 + 28 mutations
mNeptune (mKate Derivative)Emission Max = 650 nm Brightness = 13 Photostability ~ 150Emission Max 650 nm Brightness 13 Photostability 150
mNeptune = mKate + 5 mutations
Red FPs are best imaged with a Texas Red or Longpass filter set
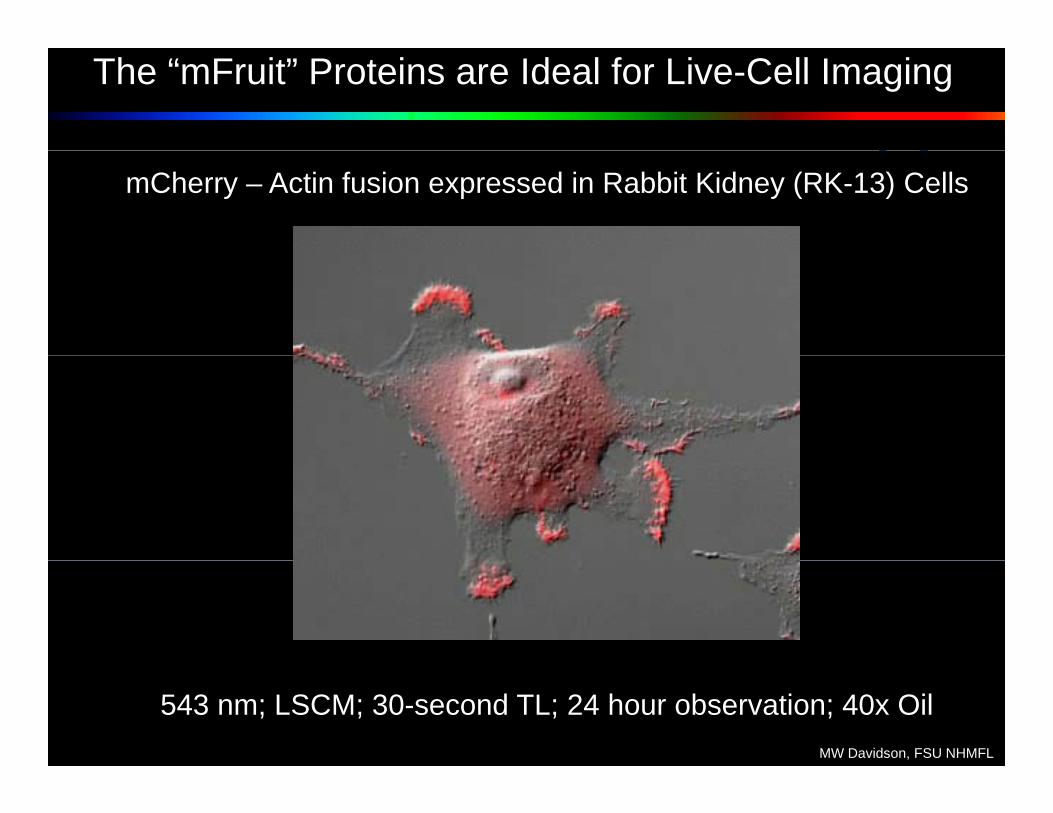
The “mFruit” Proteins are Ideal for Live-Cell Imaging
mCherry – Actin fusion expressed in Rabbit Kidney (RK-13) Cells
543 nm; LSCM; 30-second TL; 24 hour observation; 40x OilMW Davidson, FSU NHMFL
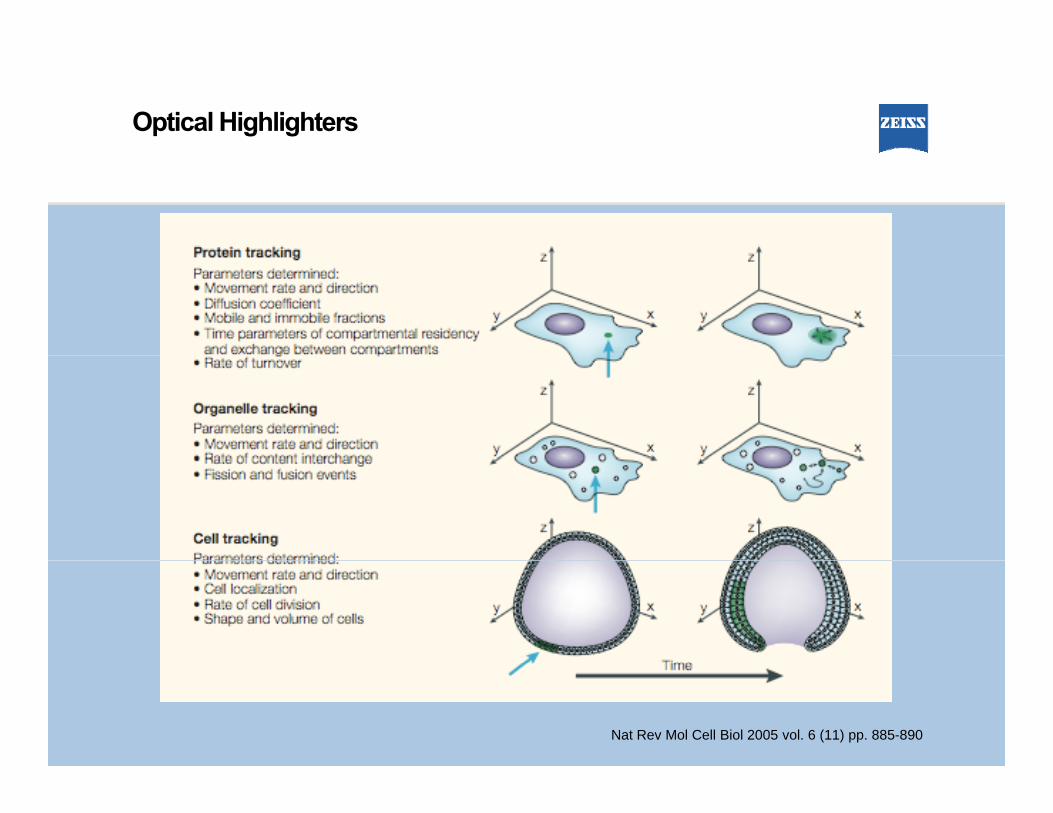
Optical Highlighters
Nat Rev Mol Cell Biol 2005 vol. 6 (11) pp. 885-890
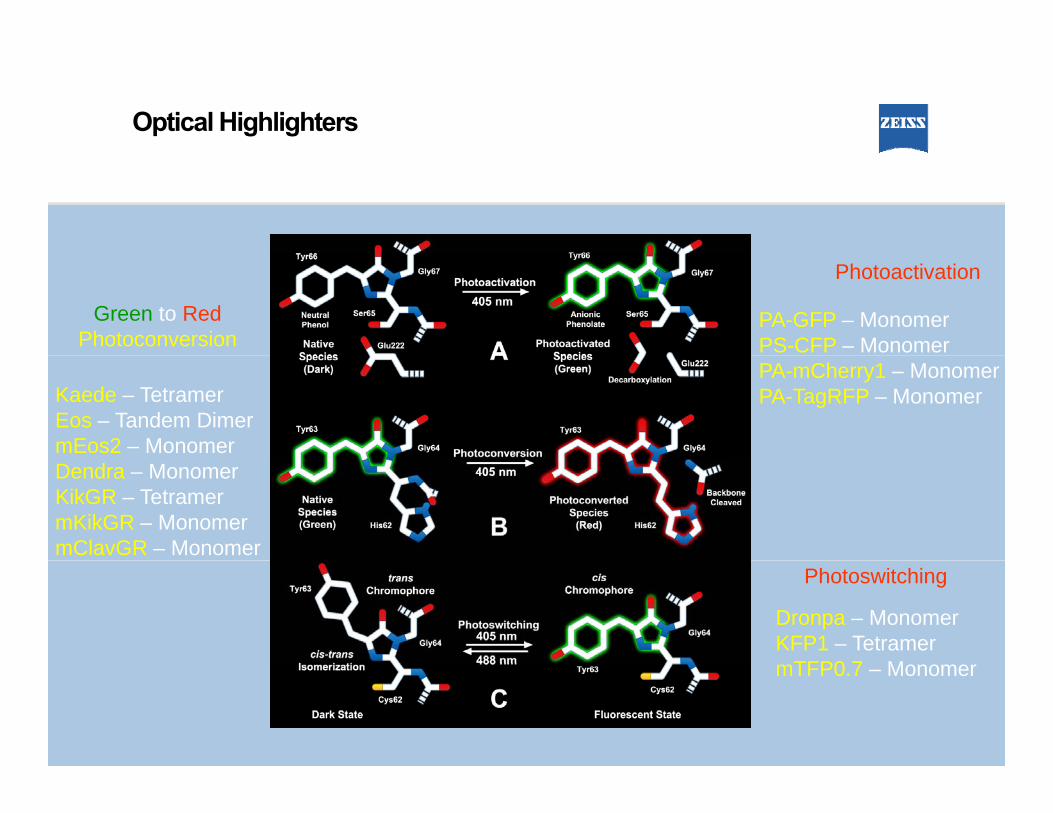
Optical Highlighters
Green to RedPhotoconversion
Photoactivation
PA-GFP – MonomerPS-CFP – MonomerPA-mCherry1 – MonomerPA-TagRFP – MonomerKaede – Tetramer
Eos – Tandem DimermEos2 – MonomerDendra – MonomerKikGR – TetramermKikGR – MonomermClavGR – Monomer
Dronpa – MonomerKFP1 – Tetramer
TFP0 7 M
Photoswitching
mTFP0.7 – Monomer

Photoactivatible Fluorescent Proteins:PA GFPPA-GFP
PA-GFP is activated with 405 nm light
Prior to activation, will fluoresce at 8% brightness of EGFP (effectively “off”)(effectively “off”)
Will fluoresce at 40% brightness after gactivation
405nm405nm
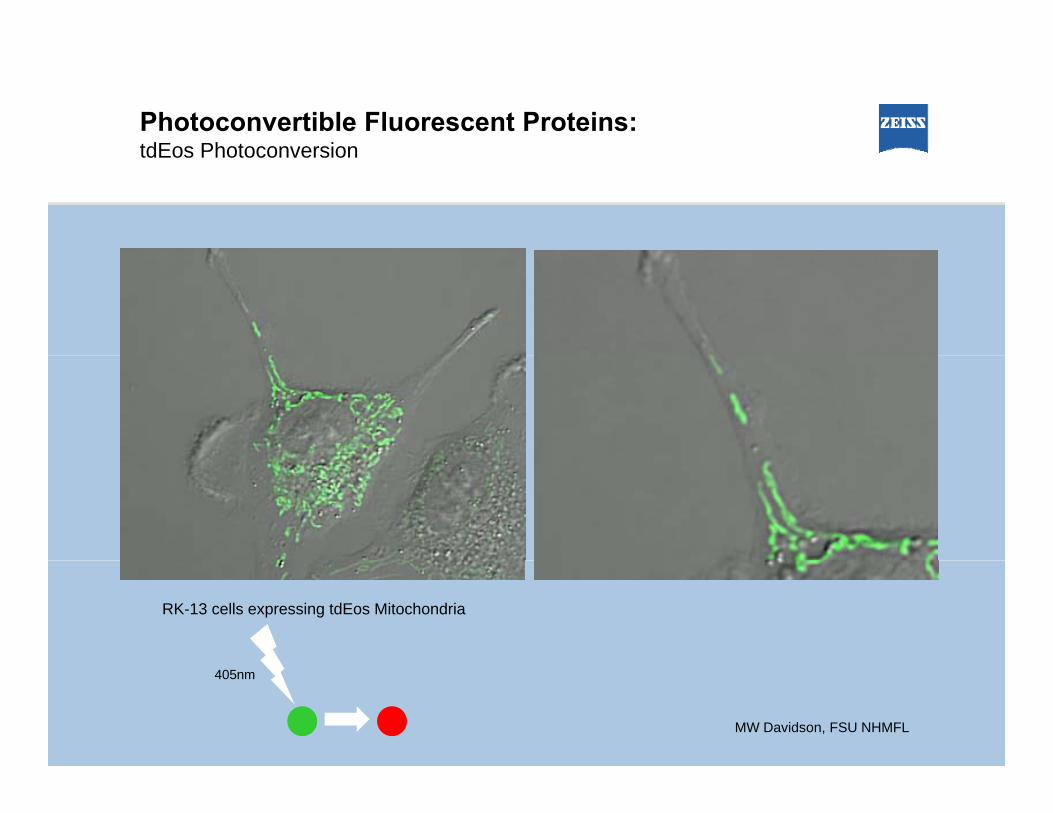
Photoconvertible Fluorescent Proteins:tdEos PhotoconversiontdEos Photoconversion
RK-13 cells expressing tdEos Mitochondria
MW Davidson, FSU NHMFL
405nm
Photoconvertible Fluorescent Proteins
www.Zeiss.com/campus
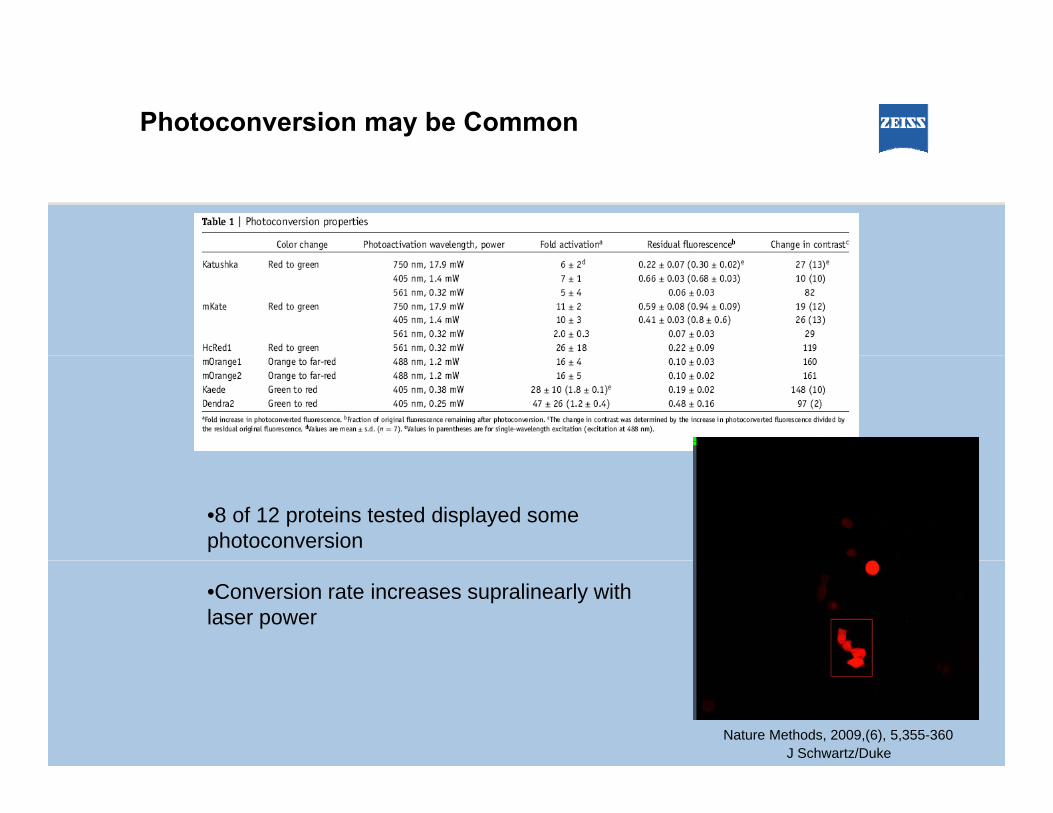
Photoconversion may be Common
•8 of 12 proteins tested displayed some photoconversion
•Conversion rate increases supralinearly with laser power
Nature Methods, 2009,(6), 5,355-360J Schwartz/Duke
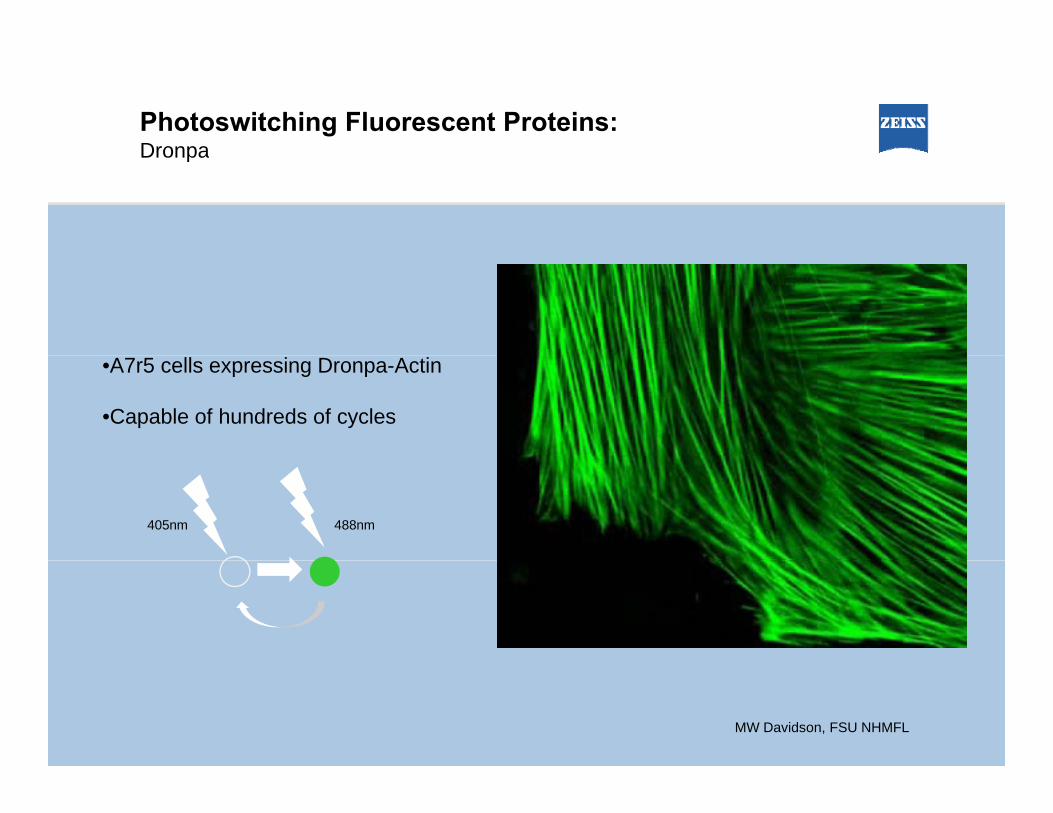
Photoswitching Fluorescent Proteins:DronpaDronpa
•A7r5 cells expressing Dronpa-Actin
•Capable of hundreds of cycles
405nm 488nm
MW Davidson, FSU NHMFL

Photoswitching Fluorescent Proteins

Photoswitching Fluorescent Proteins:rsEGFPrsEGFP
405nm 491nm
ε (M-1cm-1)47,000 QY0.36~50% GFP
Grotjohann,T et al, Nature, 2011
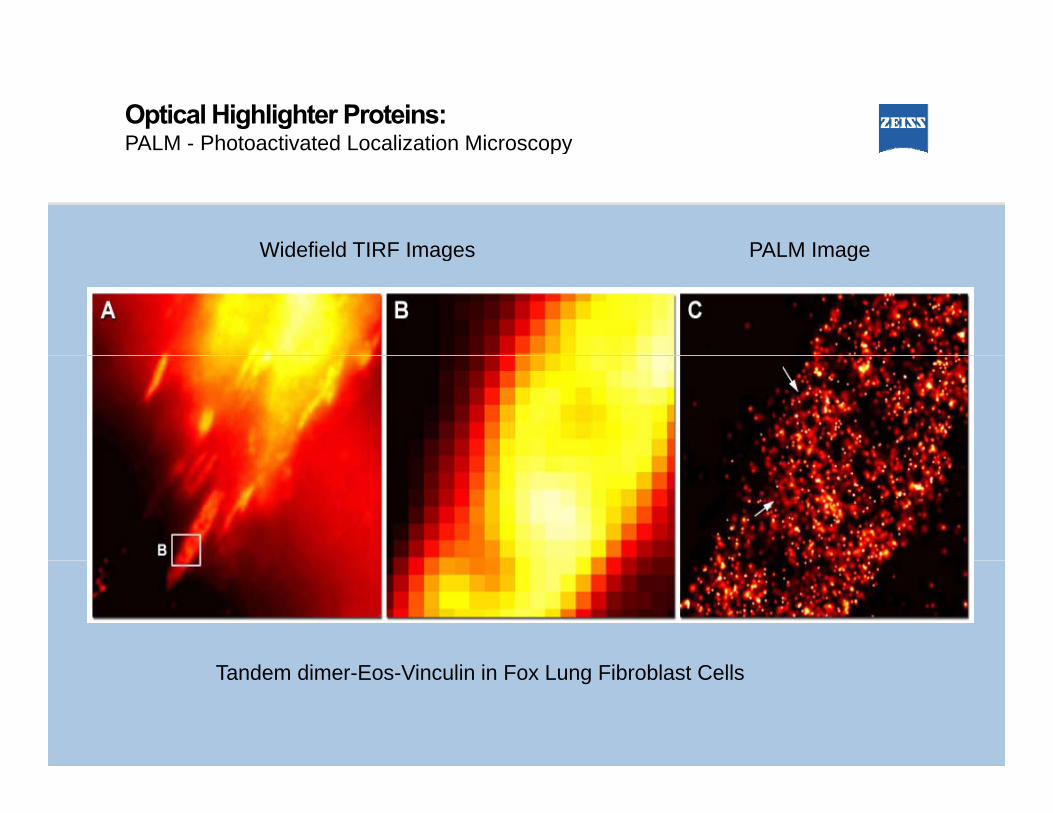
Optical Highlighters in PALMOptical Highlighter Proteins:PALM - Photoactivated Localization Microscopy
Photoactivated Localization Microscopy
Widefield TIRF Images PALM Image
o oac a ed oca a o c oscopy
Widefield TIRF Images PALM Image
Tandem dimer-Eos-Vinculin in Fox Lung Fibroblast Cells

Optical Highlighters in PALM
Ph t ti t d L li ti MiOptical Highlighter Proteins:PALM - Photoactivated Localization MicroscopyPhotoactivated Localization Microscopyo oac a ed oca a o c oscopy
1. Photoactivate and image PA species single molecules with a high degreeof precision
2. Photobleach and repeat step 1 until all molecules are expended
3. Localize single molecule centers and construct super-resolution image

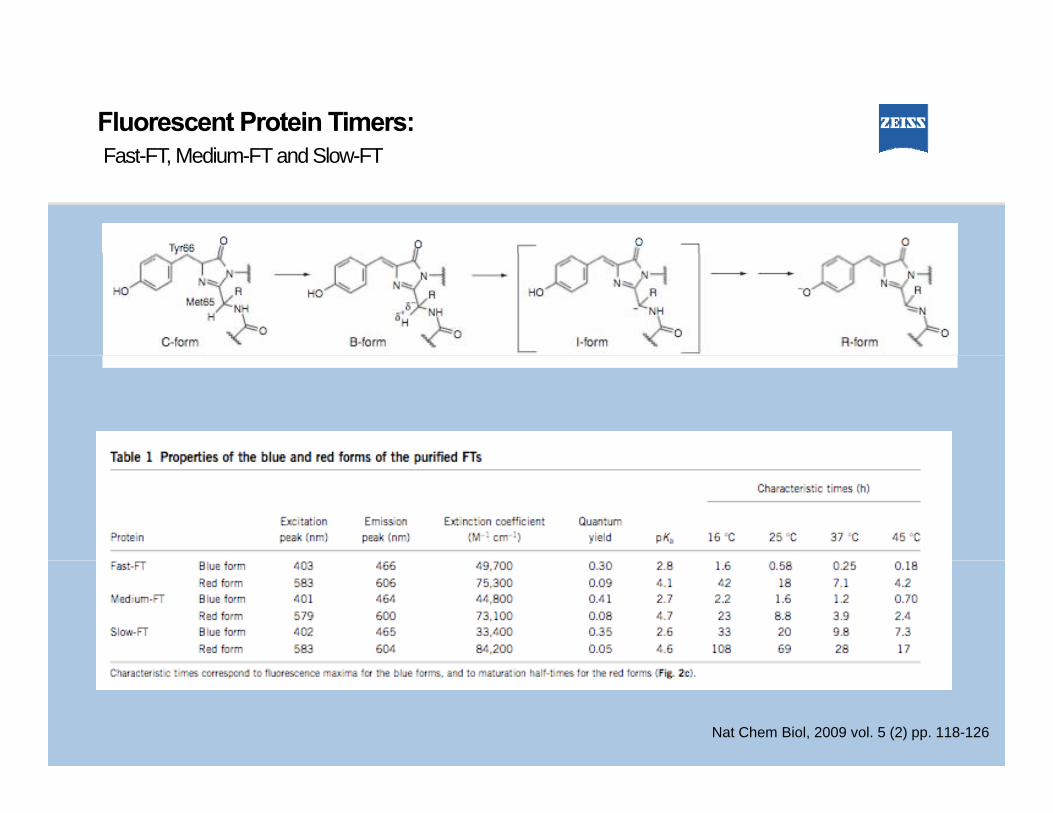
Fluorescent Protein Timers:F t FT M di FT d Sl FTFast-FT, Medium-FT and Slow-FT
Nat Chem Biol, 2009 vol. 5 (2) pp. 118-126
Fluorescent Protein Timers:F t FT M di FT d Sl FTFast-FT, Medium-FT and Slow-FT
Nat Chem Biol, 2009 vol. 5 (2) pp. 118-126
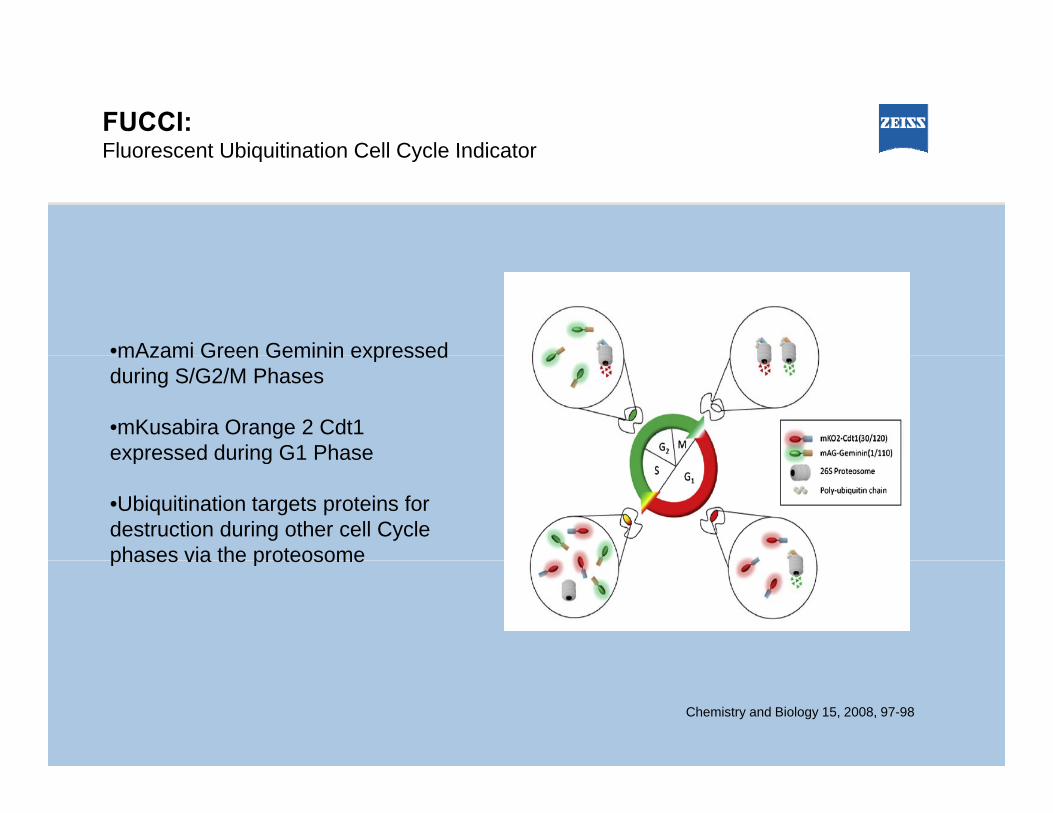
FUCCI:Fluorescent Ubiquitination Cell Cycle IndicatorFluorescent Ubiquitination Cell Cycle Indicator
•mAzami Green Geminin expressedmAzami Green Geminin expressed during S/G2/M Phases
•mKusabira Orange 2 Cdt1 expressed during G1 Phaseexpressed during G1 Phase
•Ubiquitination targets proteins for destruction during other cell Cycle phases via the proteosomephases via the proteosome
Chemistry and Biology 15, 2008, 97-98

FUCCI:Fluorescent Ubiquitination Cell Cycle IndicatorFluorescent Ubiquitination Cell Cycle Indicator
•HeLa cells expressing the mAG-HeLa cells expressing the mAGGemininand mKO2 Cdf1 plasmids
•All phases of cell cycle are visibleAll phases of cell cycle are visible
Cell, 132, 3, 2008,487-498
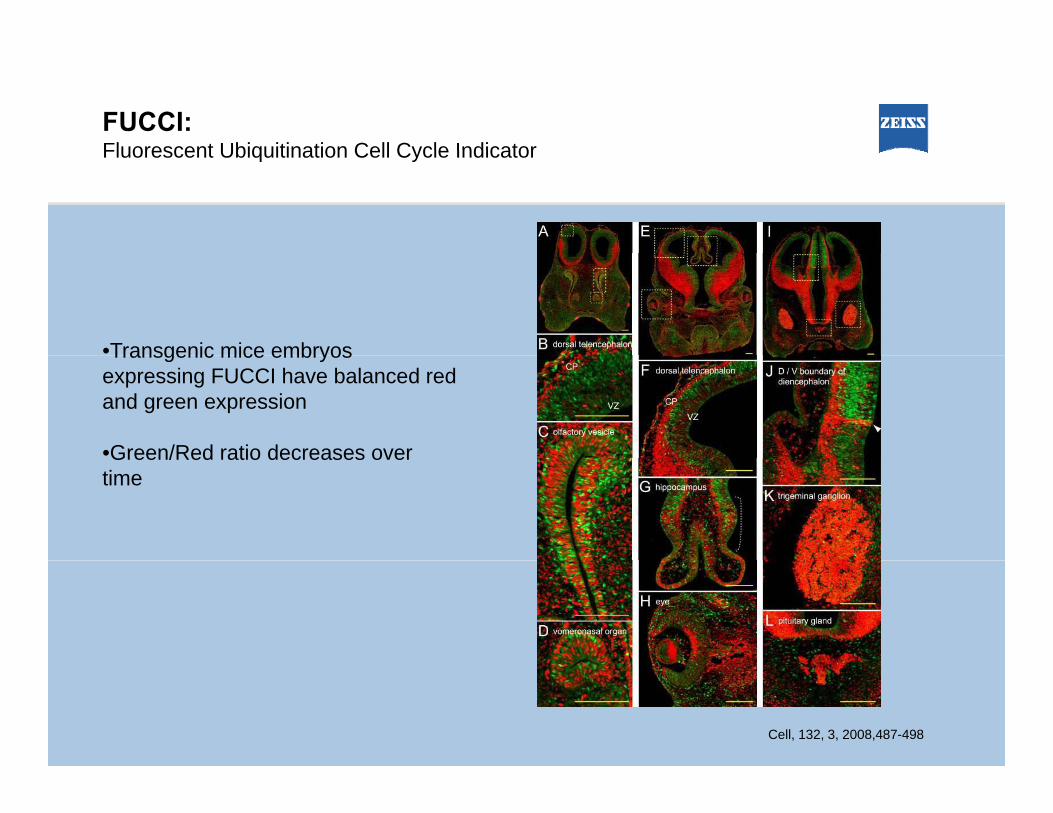
FUCCI:Fluorescent Ubiquitination Cell Cycle IndicatorFluorescent Ubiquitination Cell Cycle Indicator
•Transgenic mice embryosTransgenic mice embryos expressing FUCCI have balanced red and green expression
•Green/Red ratio decreases overGreen/Red ratio decreases over time
Cell, 132, 3, 2008,487-498
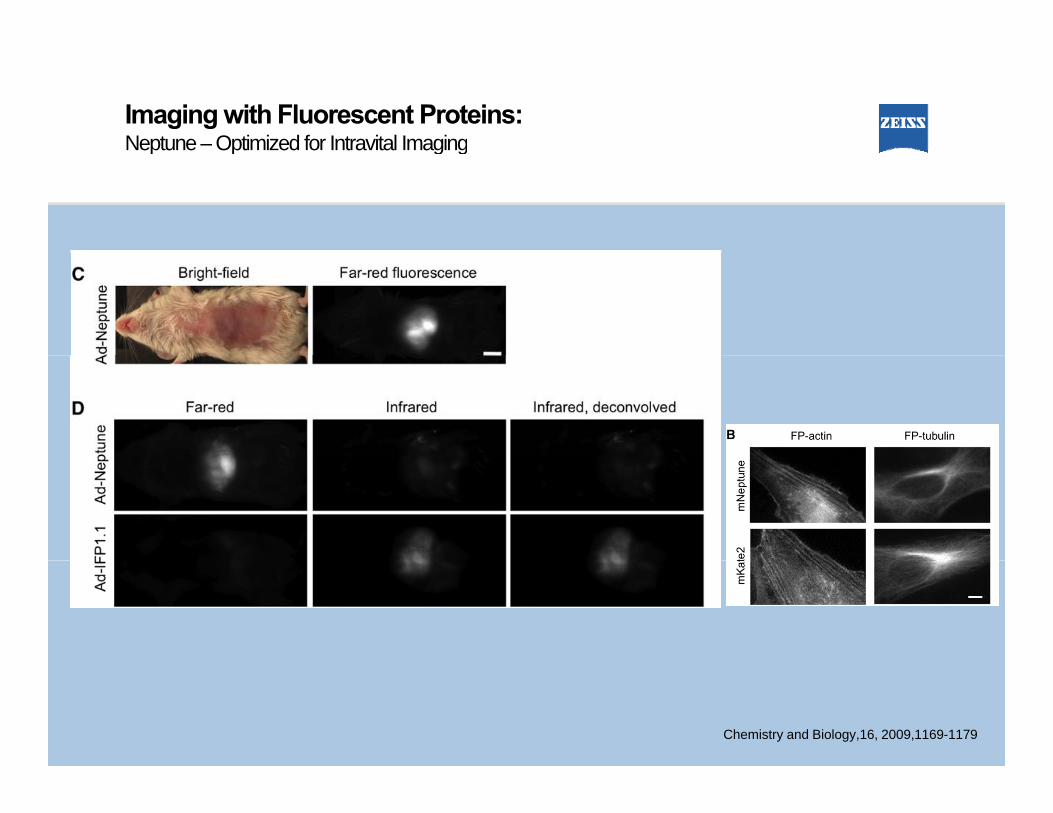
Imaging with Fluorescent Proteins:Neptune – Optimized for Intravital Imagingep u e Op ed o a a ag g
Chemistry and Biology,16, 2009,1169-1179
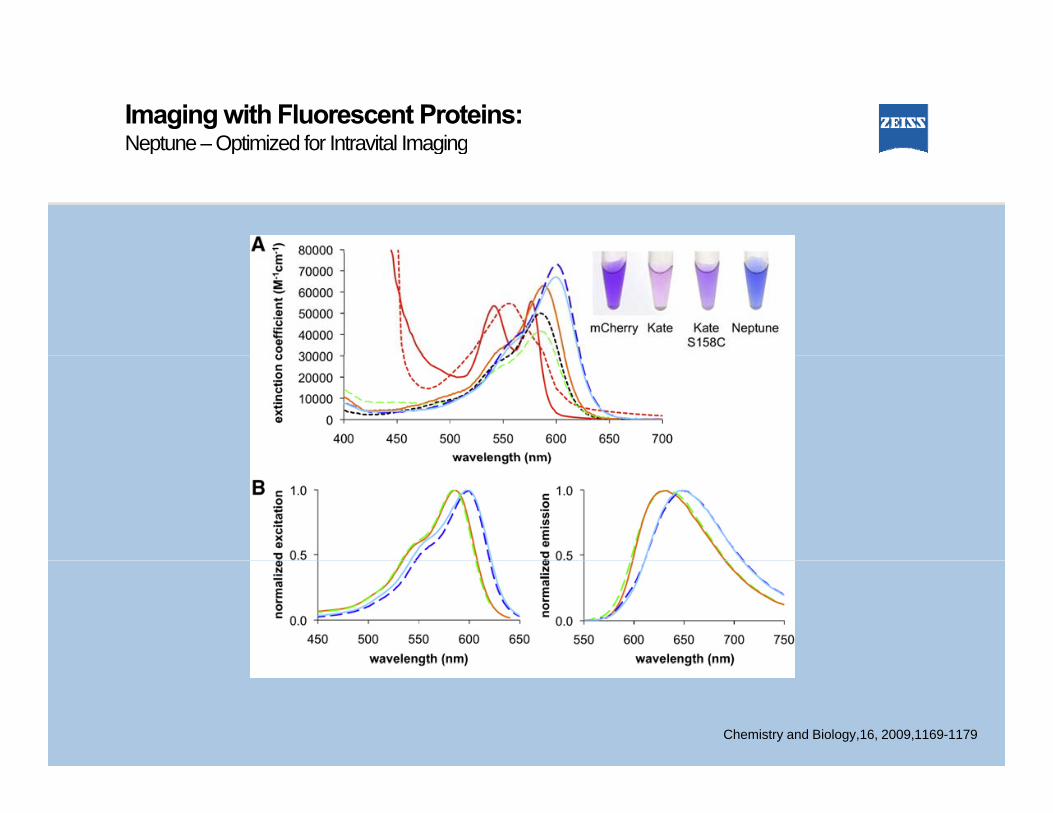
Imaging with Fluorescent Proteins:Neptune – Optimized for Intravital Imagingep u e Op ed o a a ag g
Chemistry and Biology,16, 2009,1169-1179
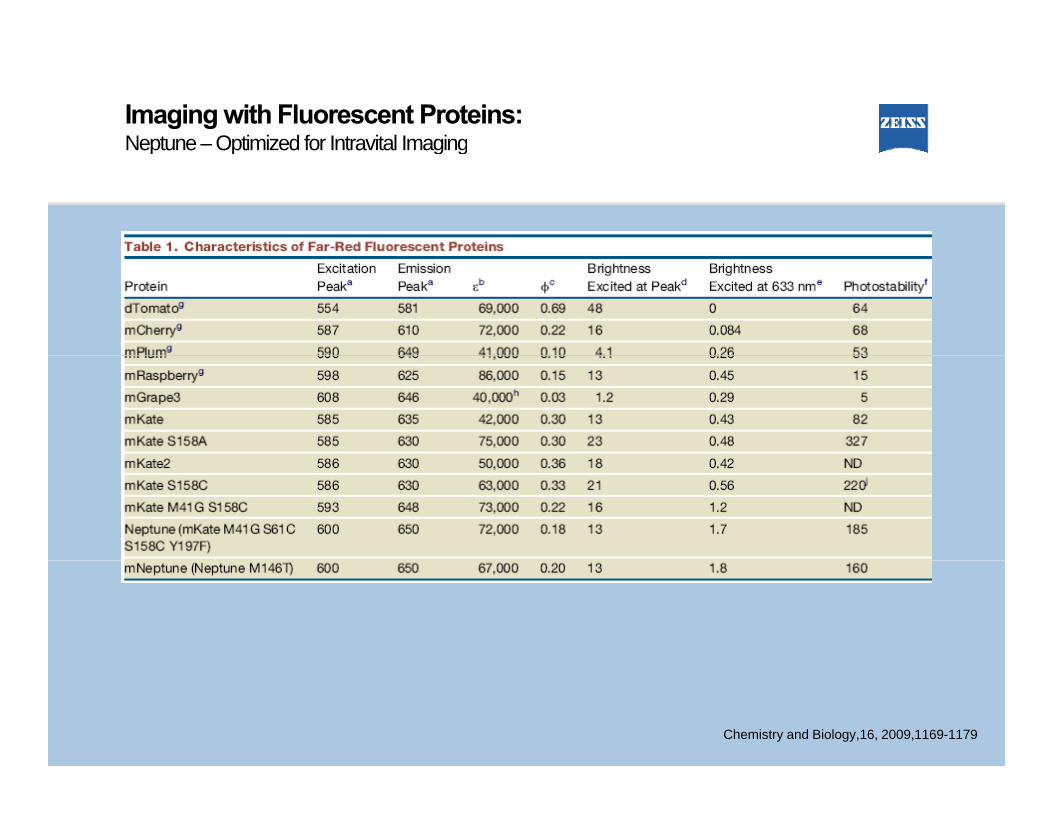
Imaging with Fluorescent Proteins:Neptune – Optimized for Intravital Imagingep u e Op ed o a a ag g
Chemistry and Biology,16, 2009,1169-1179
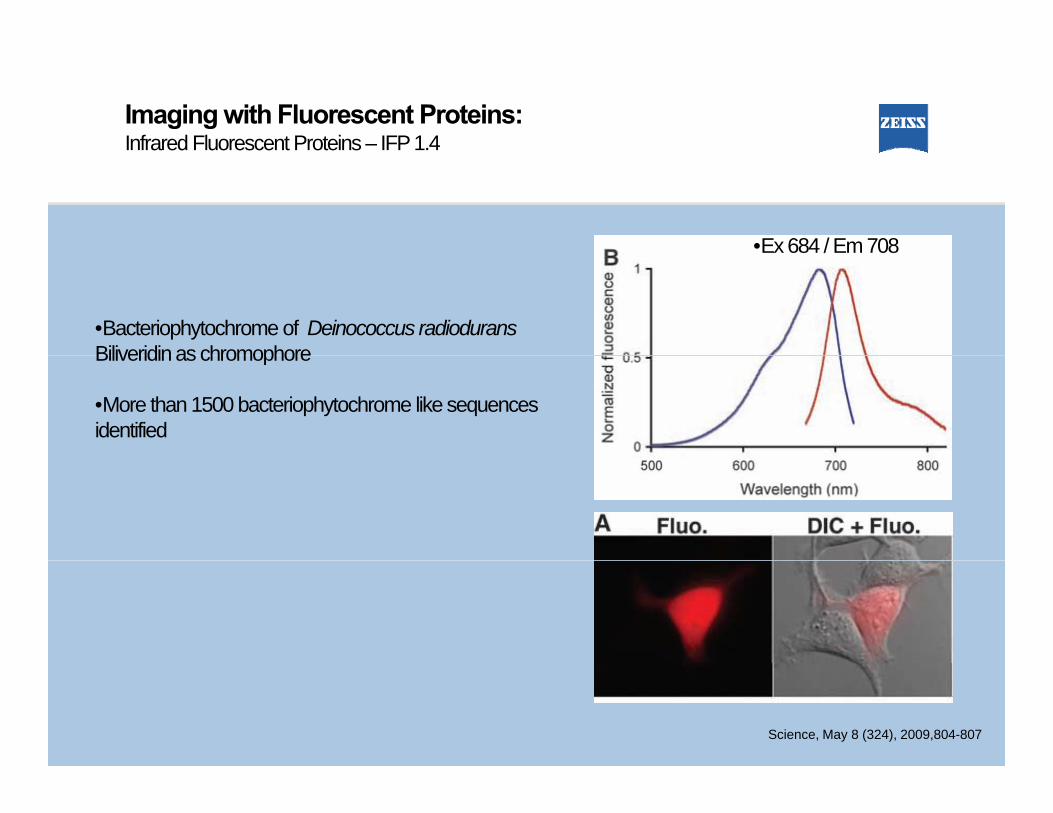
Imaging with Fluorescent Proteins:Infrared Fluorescent Proteins – IFP 1.4a ed uo esce o e s
•Ex 684 / Em 708
•Bacteriophytochrome of Deinococcus radioduransBiliveridin as chromophore
68 / 08
Biliveridin as chromophore
•More than 1500 bacteriophytochrome like sequences identified
Science, May 8 (324), 2009,804-807
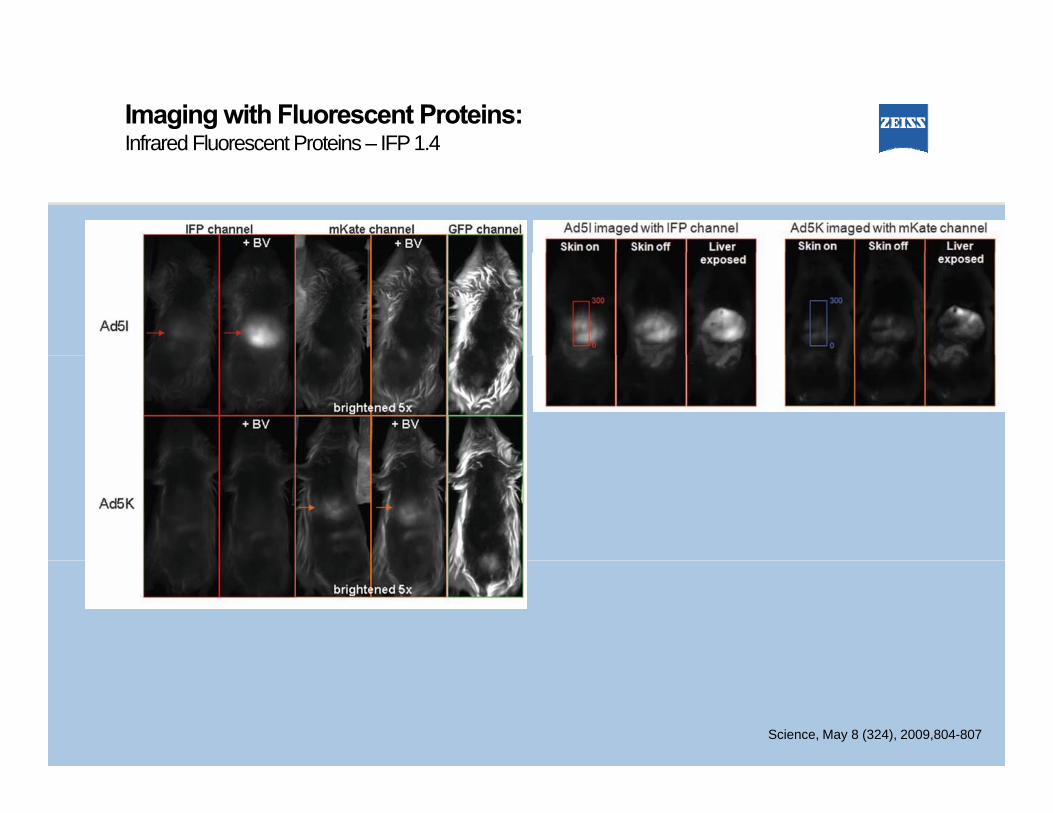
Imaging with Fluorescent Proteins:Infrared Fluorescent Proteins – IFP 1.4a ed uo esce o e s
Science, May 8 (324), 2009,804-807
Imaging with Fluorescent Proteins:mCerulean3 Ce uea 3
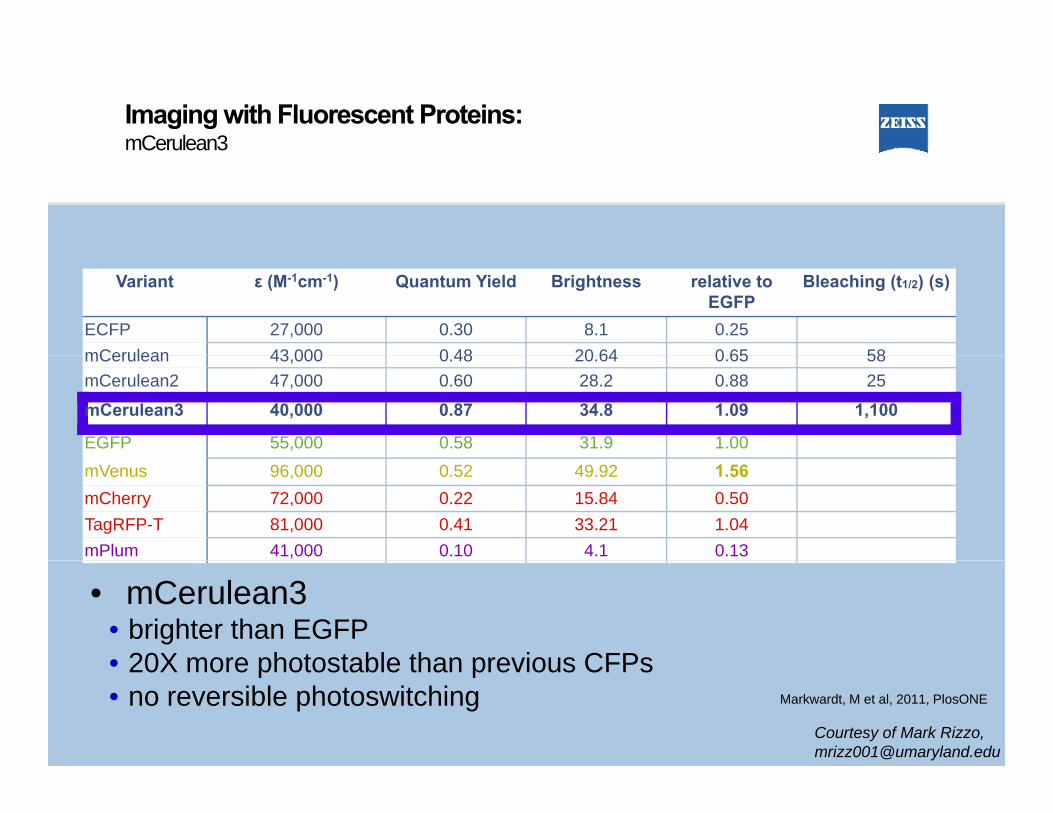
Variant ε (M-1cm-1) Quantum Yield Brightness relative to EGFP
Bleaching (t1/2) (s)
ECFP 27,000 0.30 8.1 0.25mCerulean 43 000 0 48 20 64 0 65 58mCerulean 43,000 0.48 20.64 0.65 58mCerulean2 47,000 0.60 28.2 0.88 25
mCerulean3 40,000 0.87 34.8 1.09 1,100
EGFP 55,000 0.58 31.9 1.00mVenus 96,000 0.52 49.92 1.56mCherry 72,000 0.22 15.84 0.50TagRFP-T 81,000 0.41 33.21 1.04mPlum 41,000 0.10 4.1 0.13
• mCerulean3 • brighter than EGFP• 20X more photostable than previous CFPs• 20X more photostable than previous CFPs • no reversible photoswitching
Courtesy of Mark Rizzo,[email protected]
Markwardt, M et al, 2011, PlosONE
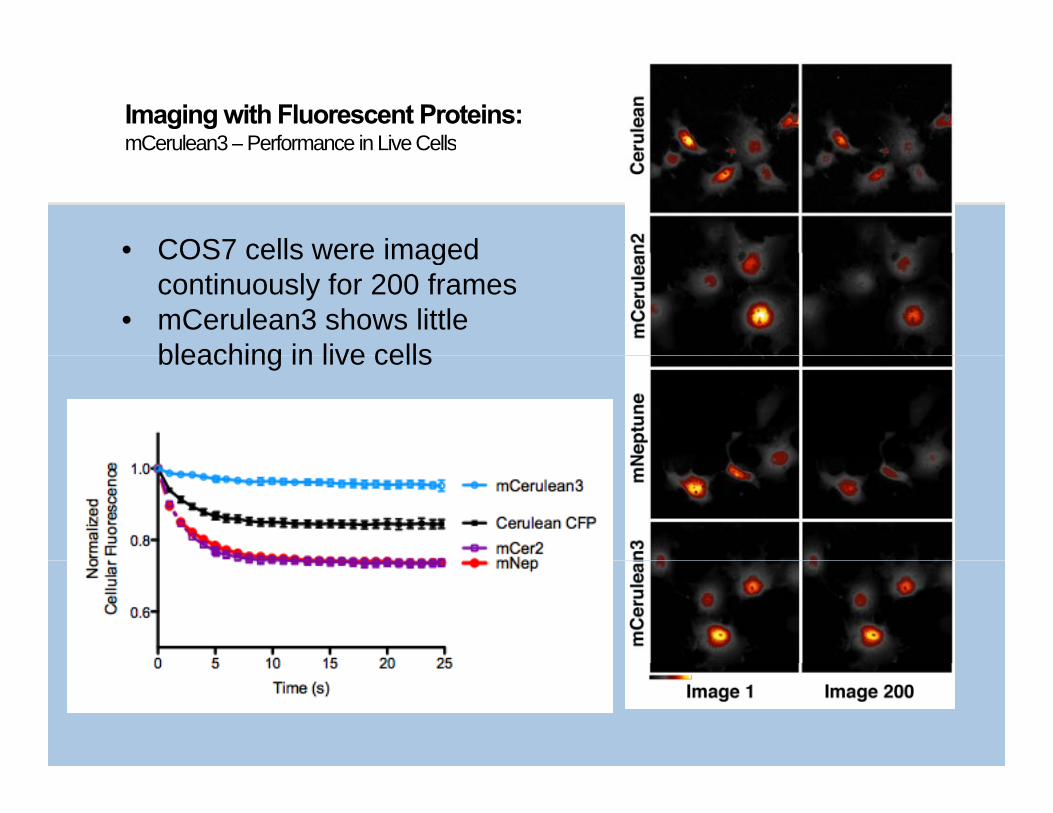
Imaging with Fluorescent Proteins:mCerulean3 – Performance in Live CellsCe uea 3 e o a ce e Ce s
• COS7 cells were imaged• COS7 cells were imaged continuously for 200 frames
• mCerulean3 shows little bleaching in live cellsbleaching in live cells

Imaging with Fluorescent Proteins:MiniSOG for Correlative MicroscopySOG o Co ea e c oscopy
Shu, X et al, Plos Biology, 2011~16% brightness of GFP
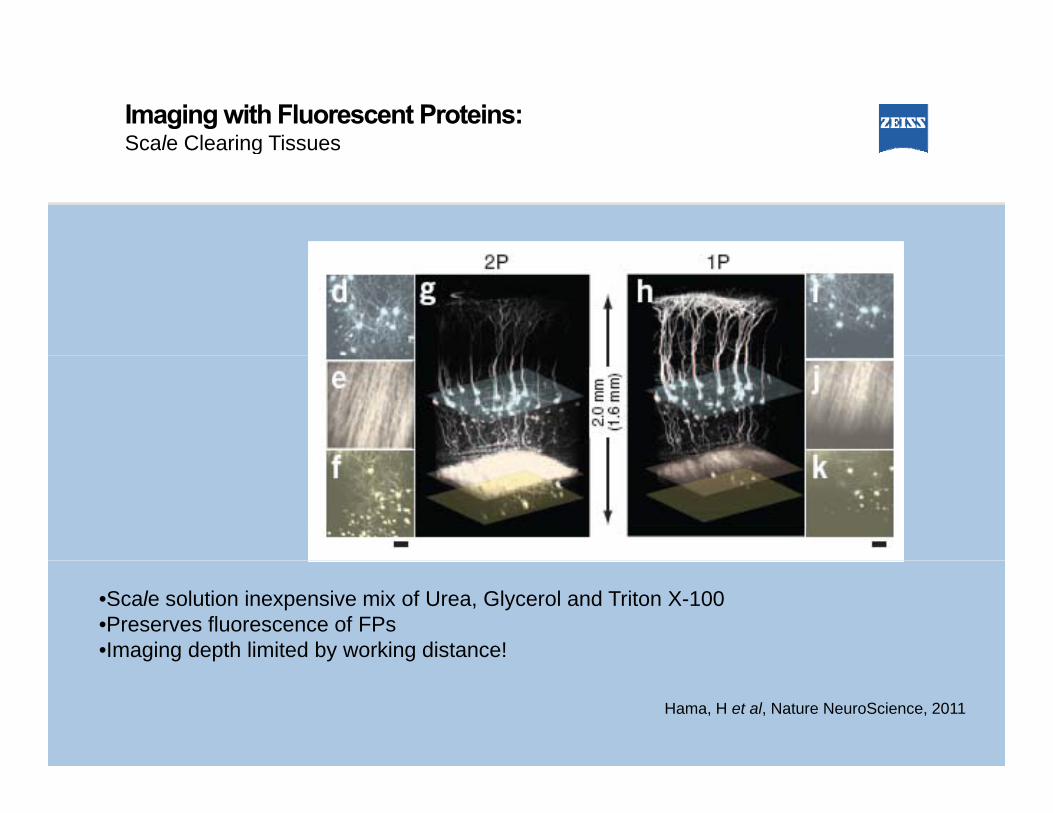
Imaging with Fluorescent Proteins:Scale Clearing TissuesSca e C ea g ssues
•Scale solution inexpensive mix of Urea, Glycerol and Triton X-100•Preserves fluorescence of FPs•Imaging depth limited by working distance!
Hama, H et al, Nature NeuroScience, 2011
Protein Reference Excitation, Emission, Brightness, % f G Protein Reference Excitation, Emission, Brightness,
% f EGFP
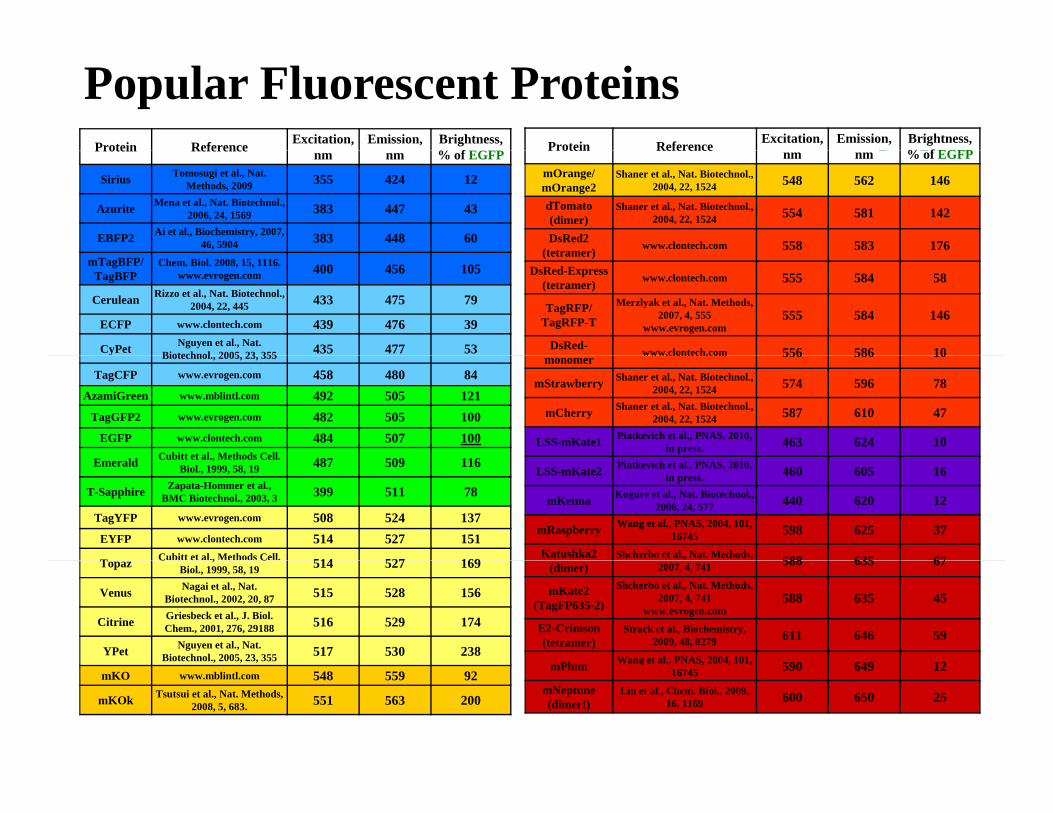
Popular Fluorescent Proteins Protein Reference nm nm % of EGFP
Sirius Tomosugi et al., Nat. Methods, 2009 355 424 12
Azurite Mena et al., Nat. Biotechnol., 2006, 24, 1569 383 447 43
EBFP2 Ai et al., Biochemistry, 2007, 46, 5904 383 448 60
Protein Reference nm nm % of EGFPmOrange/mOrange2
Shaner et al., Nat. Biotechnol., 2004, 22, 1524 548 562 146
dTomato (dimer)
Shaner et al., Nat. Biotechnol., 2004, 22, 1524 554 581 142
DsRed2 (tetramer) www.clontech.com 558 583 176
mTagBFP/TagBFP
Chem. Biol. 2008, 15, 1116.www.evrogen.com 400 456 105
Cerulean Rizzo et al., Nat. Biotechnol., 2004, 22, 445 433 475 79
ECFP www.clontech.com 439 476 39
CyPet Nguyen et al., Nat. Biotechnol 2005 23 355 435 477 53
(tetramer)DsRed-Express
(tetramer) www.clontech.com 555 584 58
TagRFP/TagRFP-T
Merzlyak et al., Nat. Methods, 2007, 4, 555
www.evrogen.com555 584 146
DsRed- www.clontech.com 556 586 10Biotechnol., 2005, 23, 355
TagCFP www.evrogen.com 458 480 84AzamiGreen www.mblintl.com 492 505 121
TagGFP2 www.evrogen.com 482 505 100EGFP www.clontech.com 484 507 100
Cubitt et al. Methods Cell. 48 09 116
monomer www.clontech.com 556 586 10
mStrawberry Shaner et al., Nat. Biotechnol., 2004, 22, 1524 574 596 78
mCherry Shaner et al., Nat. Biotechnol., 2004, 22, 1524 587 610 47
LSS-mKate1 Piatkevich et al., PNAS, 2010, in press. 463 624 10
Emerald Cubitt et al., Methods Cell. Biol., 1999, 58, 19 487 509 116
T-Sapphire Zapata-Hommer et al.,BMC Biotechnol., 2003, 3 399 511 78
TagYFP www.evrogen.com 508 524 137EYFP www.clontech.com 514 527 151
T Cubitt et al., Methods Cell. 514 527 169
LSS-mKate2 Piatkevich et al., PNAS, 2010, in press. 460 605 16
mKeima Kogure et al., Nat. Biotechnol., 2006, 24, 577 440 620 12
mRaspberry Wang et al., PNAS, 2004, 101, 16745 598 625 37
Katushka2 Shcherbo et al., Nat. Methods, 588 635 67Topaz C , CBiol., 1999, 58, 19 514 527 169
Venus Nagai et al., Nat. Biotechnol., 2002, 20, 87 515 528 156
Citrine Griesbeck et al., J. Biol. Chem., 2001, 276, 29188 516 529 174
YPet Nguyen et al., Nat. Biotechnol., 2005, 23, 355 517 530 238
(dimer) 2007, 4, 741 588 635 67
mKate2 (TagFP635-2)
Shcherbo et al., Nat. Methods, 2007, 4, 741
www.evrogen.com588 635 45
E2-Crimson(tetramer)
Strack et al., Biochemistry, 2009, 48, 8279 611 646 59
Pl Wang et al., PNAS, 2004, 101, 590 649 12mKO www.mblintl.com 548 559 92
mKOk Tsutsui et al., Nat. Methods, 2008, 5, 683. 551 563 200
mPlum Wang et al., PNAS, 2004, 101, 16745 590 649 12
mNeptune(dimer!)
Lin et al., Chem. Biol., 2009, 16, 1169 600 650 25
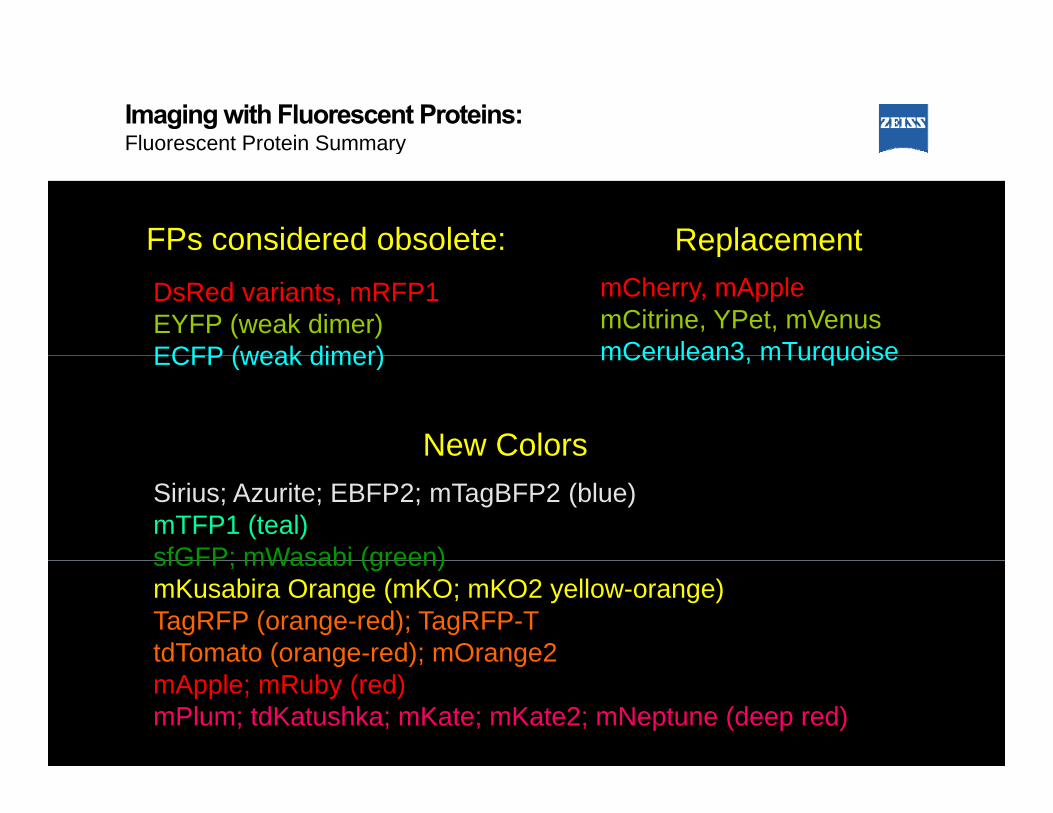
Fluorescent Protein SummaryImaging with Fluorescent Proteins:Fluorescent Protein Summary
ReplacementFPs considered obsolete:
uo esce o e Su a y
DsRed variants, mRFP1EYFP (weak dimer)ECFP (weak dimer)
mCherry, mApplemCitrine, YPet, mVenusmCerulean3 mTurquoise
p
ECFP (weak dimer) mCerulean3, mTurquoise
New ColorsSirius; Azurite; EBFP2; mTagBFP2 (blue)mTFP1 (teal)sfGFP; mWasabi (green)sfGFP; mWasabi (green)mKusabira Orange (mKO; mKO2 yellow-orange)TagRFP (orange-red); TagRFP-TtdTomato (orange-red); mOrange2( g ); gmApple; mRuby (red)mPlum; tdKatushka; mKate; mKate2; mNeptune (deep red)
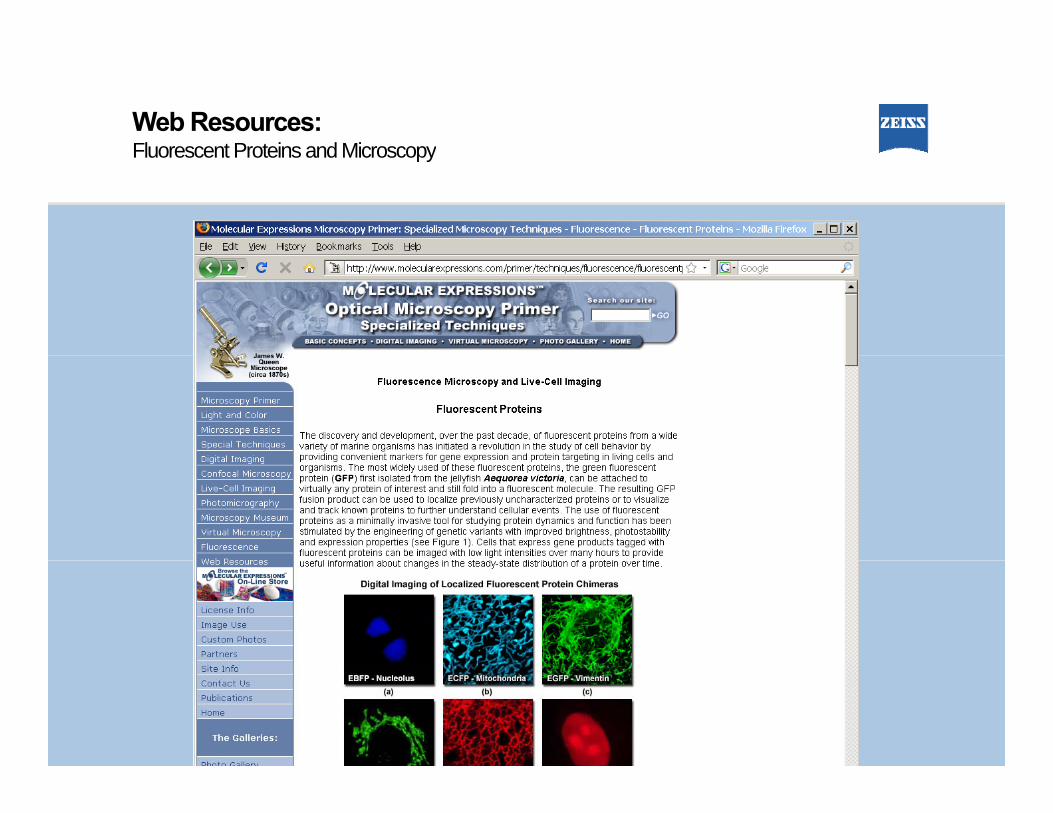
Web Resources:Fluorescent Proteins and MicroscopyFluorescent Proteins and Microscopy

Web Resources:Fluorescent Proteins and MicroscopyFluorescent Proteins and Microscopy