Embed Size (px)
Citation preview

CARL HANSER VERLAG
David Grewell, Avraham Benatar, Joon B. Park
Plastics and Composites Welding Handbook
3-446-19534-3
www.hanser.de

1.4 Goals of the Handbook 7
External heating methods rely on convection and/or conduction to heat the weld surface.
These processes include: hot tool, hot gas, extrusion, implant induction, and implant resist-
ance welding.
Figure 1.6 Classification of plastic and composites welding processes
Internal mechanical heating methods rely on the conversion of mechanical energy into heat
through surface friction and intermolecular friction. These processes include: ultrasonic,
vibration, and spin welding.
Internal electromagnetic heating methods rely on the absorption and conversion of electro-
magnetic radiation into heat. These processes include: infrared, laser, radio frequency, and
microwave welding.
1.4 Goals of the Handbook
This handbook was developed to provide the user with a resource for information about all
welding methods. Each chapter was developed by experts in the field with a wide breadth
of information dealing with all the welding aspects including materials, process phenome-
nology, equipment, and joint design. The authors also included many application examples
Plastic and
Composite Welding
Processes
External
Heating
Internal
Heating
Mechanical ElectromagneticHeated Tool
Chapter 3
Hot Gas
Chapter 4
Extrusion
Chapter 5
Implant Induction
Chapter 6
Implant
Resistance
Chapter 7
Ultrasonic
Chapter 8
Vibration
Chapter 9
Spin
Chapter 10
Radio Frequency
Chapter 11
Infrared and Laser
Chapter 12
Microwave
Chapter 13
2.4 Pressing 19
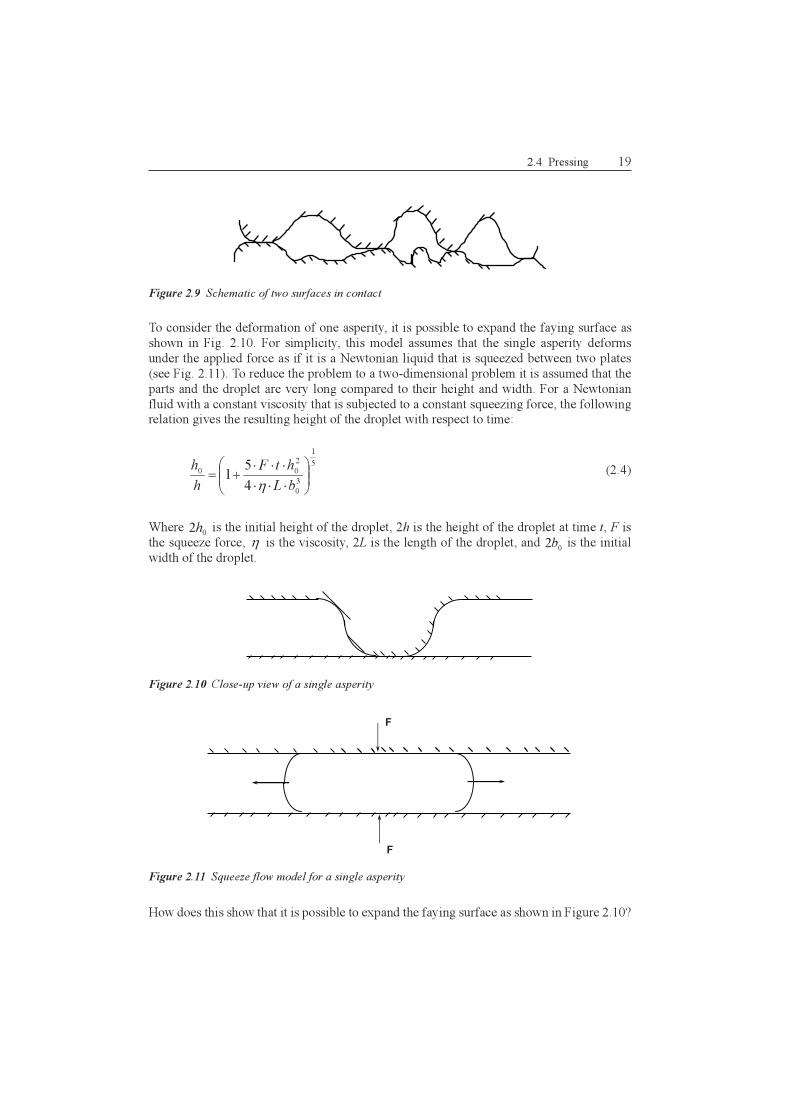
Figure 2.9 Schematic of two surfaces in contact
To consider the deformation of one asperity, it is possible to expand the faying surface as
shown in Fig. 2.10. For simplicity, this model assumes that the single asperity deforms
under the applied force as if it is a Newtonian liquid that is squeezed between two plates
(see Fig. 2.11). To reduce the problem to a two-dimensional problem it is assumed that the
parts and the droplet are very long compared to their height and width. For a Newtonian
fluid with a constant viscosity that is subjected to a constant squeezing force, the followingrelation gives the resulting height of the droplet with respect to time:
(2.4)
Where is the initial height of the droplet, 2h is the height of the droplet at time t, F is
the squeeze force, is the viscosity, 2L is the length of the droplet, and is the initial
width of the droplet.
Figure 2.10 Close-up view of a single asperity
Figure 2.11 Squeeze flow model for a single asperity
How does this show that it is possible to expand the faying surface as shown in Figure 2.10?
5
1
3
0
2
00
4
51
⋅⋅⋅
⋅⋅⋅+=
bL
htF
h
h
η
02h
η0
2b
F
F
26 2 Fundamental Steps in Plastics and Composites Welding
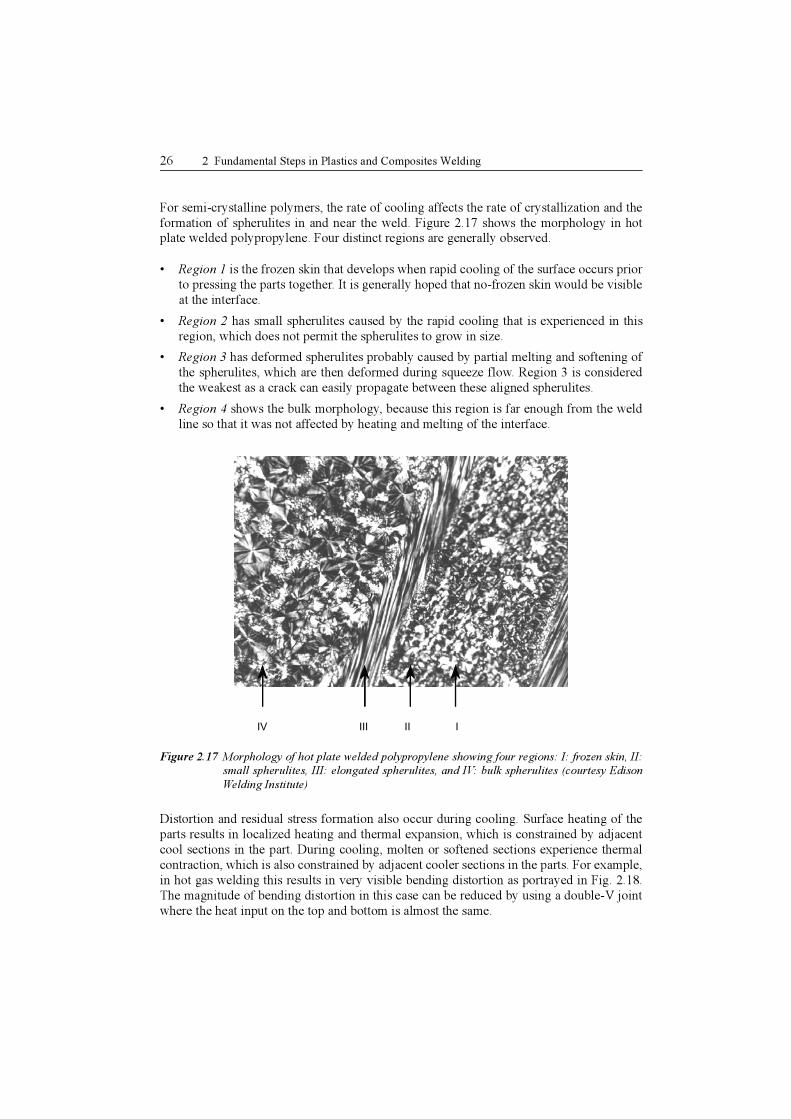
For semi-crystalline polymers, the rate of cooling affects the rate of crystallization and the
formation of spherulites in and near the weld. Figure 2.17 shows the morphology in hotplate welded polypropylene. Four distinct regions are generally observed.
• Region 1 is the frozen skin that develops when rapid cooling of the surface occurs prior
to pressing the parts together. It is generally hoped that no-frozen skin would be visible
at the interface.
• Region 2 has small spherulites caused by the rapid cooling that is experienced in this
region, which does not permit the spherulites to grow in size.
• Region 3 has deformed spherulites probably caused by partial melting and softening of
the spherulites, which are then deformed during squeeze flow. Region 3 is considered
the weakest as a crack can easily propagate between these aligned spherulites.
• Region 4 shows the bulk morphology, because this region is far enough from the weld
line so that it was not affected by heating and melting of the interface.
Figure 2.17 Morphology of hot plate welded polypropylene showing four regions: I: frozen skin, II:
small spherulites, III: elongated spherulites, and IV: bulk spherulites (courtesy Edison
Welding Institute)
Distortion and residual stress formation also occur during cooling. Surface heating of the
parts results in localized heating and thermal expansion, which is constrained by adjacent
cool sections in the part. During cooling, molten or softened sections experience thermal
contraction, which is also constrained by adjacent cooler sections in the parts. For example,
in hot gas welding this results in very visible bending distortion as portrayed in Fig. 2.18.
The magnitude of bending distortion in this case can be reduced by using a double-V joint
where the heat input on the top and bottom is almost the same.
IIIIIIIV

42 3 Heated Tool (Hot Plate) Welding
process for welding automotive fuel tanks and components because of safety require-
ments. The components to be welded to the tank are automatically fed in from maga-zines or vibrator pots. They are seized by the welding stations and joined. Each
component is joined in a separate and individually operating welding station. The con-
trol system for each welding station must be designed to allow for different matching
times, to correct for part warpage, or uneven weld surfaces.
• Welding of additional components to the fuel tank system could also be done using
other processes such as spin or ultrasonic welding.
• At the end of the production line, the pallets holding the tank are lowered below the
main machining and welding area and they are transported to the initial position, where
they rise to the top level again to enable release of the completed fuel tank and loading
of another pre-assembled fuel tank on the pallet.
Figure 3.6 Fully automated machine for production of automotive fuel tanks
The following key components can be found in each hot plate welding machine:
Hot Plates
Hot plates are the heart of the welding unit. Correct dimensioning and heat capacity as well
as uniform temperature distribution on their surface are of vital importance for the quality
of the weld. Hot plates are made from different materials – depending on the weldingvariant used – see below for detailed information. Hot plates are heated exclusively by
electric heating elements, which must be placed appropriately to ensure uniform tempera-
ture distribution. As the hot plate size increases, so will the non-uniformities in tempera-
ture. Below are general guidelines showing acceptable temperature variation in hot plates
of different sizes:
• Diagonal dimension up to 350 mm: 10 °C
• Diagonal dimension up to 700 mm: 14 °C
• Greater than 700 mm: 18 °C

118 6 Implant Induction (Electromagnetic) Welding
Table 6.1 Material Compatibility for Implant Induction Welding (Courtesy Ashland Specialty
Chemical Company Emabond Systems)
6.7 Applications
Implant induction welding is used in a wide range of applications including automotive,
medical, food packaging, composite welding, and much more. It can be used on small and
large parts and on a variety of materials.
Sealing of aseptic drink boxes is perhaps the largest volume application for implantinduction welding (see Fig. 6.10). These boxes are made from complex multi-layered
materials. One of the layers is aluminum foil that is used as an oxygen barrier to avoid
discoloration and flavor change. The aluminum layer is inductively heated to melt the low
AB
S
Ace
tals
Acr
ylic
s
Cel
lulo
sics
Iono
mer
(S
urly
n)
Nyl
on 6
.6,1
1,12
Pol
ybut
ylen
e
Pol
ycar
bona
te
Pol
yeth
ylen
e
Pol
yphe
nyle
neox
ide
(Nor
yl)
Pol
ypro
pyle
ne
Pol
ysty
rene
Pol
ysul
fone
Pol
yvin
yle
chlo
ride
Pol
yure
than
e
SA
N
The
rmop
last
icpo
lyes
ter
TP
E-c
opol
yest
er
TP
E-s
tyre
nebl
.cop
olym
er
TP
E-o
lefin
e ty
pe
ABS � � � �
Acetals �
Acrylics � � � � �
Cellulosics �
Ionomer (Surlyn) �
Nylon 6.6, 11, 12 �
Polybutylene � �
Polycarbonate � � � � � �
Polyethylene � � �
Polyphenylene oxide (Noryl) � �
Polypropylene � � � �
Polystyrene � � � � �
Polysulfone � �
Polyvinyl chloride �
Polyurethane �
SAN � � � � �
Thermoplastic polyester �
TPE-copolyester � �
TPE-styrene bl. copolymer � �
TPE-olefin type � � �

8.3 Physics of Process 149
Figure 8.7 Cyclical loading of a typical viscoelastic material
For most metals, the loss tangent is around 0.001 or less while for polymers it is in the range
of 0.001–0.5. Therefore, polymers can dissipate a significant amounts of energy duringultrasonic vibration. The average internal heat generation ( , energy dissipated per unit
time and per unit volume) is
(8.2)
Where ω is the operating frequency (rad/s) and ε0 is the strain amplitude, which in most
cases is directly proportional to the vibration amplitude. Unfortunately, the dynamic loss
modulus of the polymer is both frequency and temperature dependent and it is very
difficult to measure at the excitation frequency for ultrasonic assembly. A variety of tech-
niques may be used for the measurement of the dynamic properties of polymers [4, 5].
Low frequency measurement is usually favored because of commercially available equip-
ment, and because inertial effects are negligible. In addition, the commercial equipment
incorporates environmentally controlled chambers and computer interfacing, which allowfor time-temperature superposition to estimate the dynamic properties at higher frequen-
cies.
As the energy directors get hotter from the dissipation of vibrational energy, heat is
conducted from the energy directors into the (relatively) cooler parts. Heat conduction is
much greater than the convective heat loss to the air [3]. Once the temperature in any
portion of an energy director exceeds the melting temperature, the energy director will start
Stress
Strain
Strain Rate
Power
- -
++
t
t
t
t
Area under the curve is energy
&Qavg
2
2
0εωE
Qavg
′′=&

8.4 Equipment Description 155
stiffness of the booster can have significant influence on weld quality and weld data
reported by the controller. In standard units, the booster clamping ring is at the nodal pointand in order to minimize transmission of vibrations to the clamping structure, it includes
rubber O-rings. Using O-rings with a square cross-section can increase the stiffness of the
clamping ring. Further increase in stiffness of the clamping ring is possible by using direct
metal-to-metal contact or one-piece solid boosters that include the clamping ring. These
designs tend to be more costly and can introduce problems with long bar horns.
Figure 8.11 Boosters of various gains (Courtesy Branson Ultrasonics Corp.)
Horn
The horn has two main functions: (1) to further increase the amplitude of vibration (similar
to the booster) and (2) to apply the ultrasonic energy to the work piece. It is usually ½
wavelength long and is usually machined from aluminum or titanium. Figure 8.12 shows
the geometry, stress distribution, and amplitude distribution in a few standard horn designs:
step, exponential, and catenoidal. It is seen that by changing the shape of the horn, it is
possible to change the stress distribution within the horn as well as its gain. In the example
in Fig. 8.12, the step horn is easier to manufacture but it has a relatively low gain and it has
high internal stresses. On the other hand, the exponential horn has a high gain and rela-
tively low internal stresses, a more desirable combination.
Figure 8.12 Geometry, amplitude distribution, and stress distribution in a step, exponential and
catenoidal horns
StressStress Stress
Amplitude Amplitude Amplitude
Step Horn ExponentialHorn
CatinodialHorn
8.5 Joint and Part Design 161
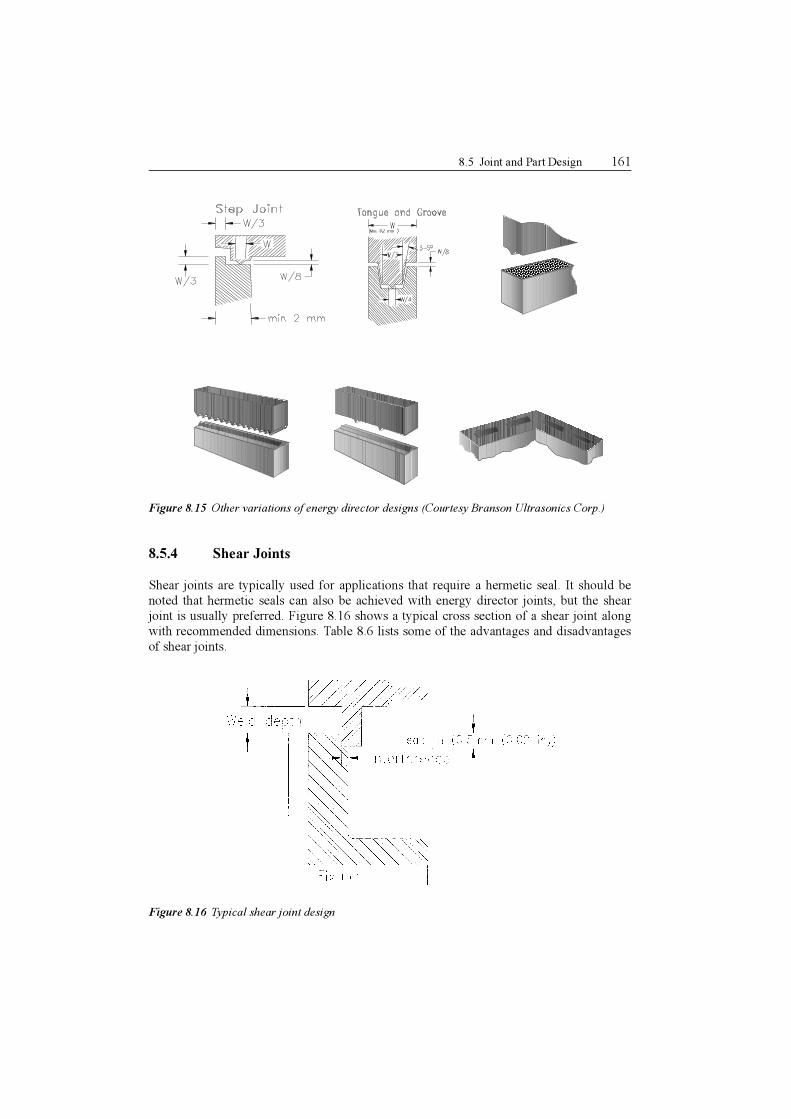
Figure 8.15 Other variations of energy director designs (Courtesy Branson Ultrasonics Corp.)
8.5.4 Shear Joints
Shear joints are typically used for applications that require a hermetic seal. It should be
noted that hermetic seals can also be achieved with energy director joints, but the shear
joint is usually preferred. Figure 8.16 shows a typical cross section of a shear joint along
with recommended dimensions. Table 8.6 lists some of the advantages and disadvantages
of shear joints.
Figure 8.16 Typical shear joint design

9.2 Process Description 191
Figure 9.1 Motion produced by linear friction welding
Table 9.1 provides an overview over the linear vibration welding cycle along with typical
times for each step in the cycle.
Table 9.1 Typical Linear Vibration Welding Cycle
The vibration welding machine cycle commences when the parts are placed into the
tooling. The parts can be either pre-assembled and placed into the lower tooling platen or
one component-half placed in the lower tooling platen and the other component-half
placed in the upper. Components placed in the upper tooling can be held in place using a
vacuum system or another mechanical clamping design. Pressing two palm buttons
activates the manual weld cycle. Two buttons are employed to ensure that the operator’s
Step Typical time
Load components
Activate cycle (palm buttons or automated)
Door closes
Lower tooling platen raises
Vibration weld cycle
Hold cycle
Lower tooling platen lowers
Door opens
Remove parts
Manually (3 to 5 s)/automated (1 to 3 s)
Manually (1 to 2 s)/automated (0 to 0.5 s)
0.5 to 2 s
1 to 4 s
8 to 15 s
5 to 15 s
1 to 4 s
0.5 to 2 s
Manually (3 to 5 s)/automated (1 to 3 s)
Pressure
Components
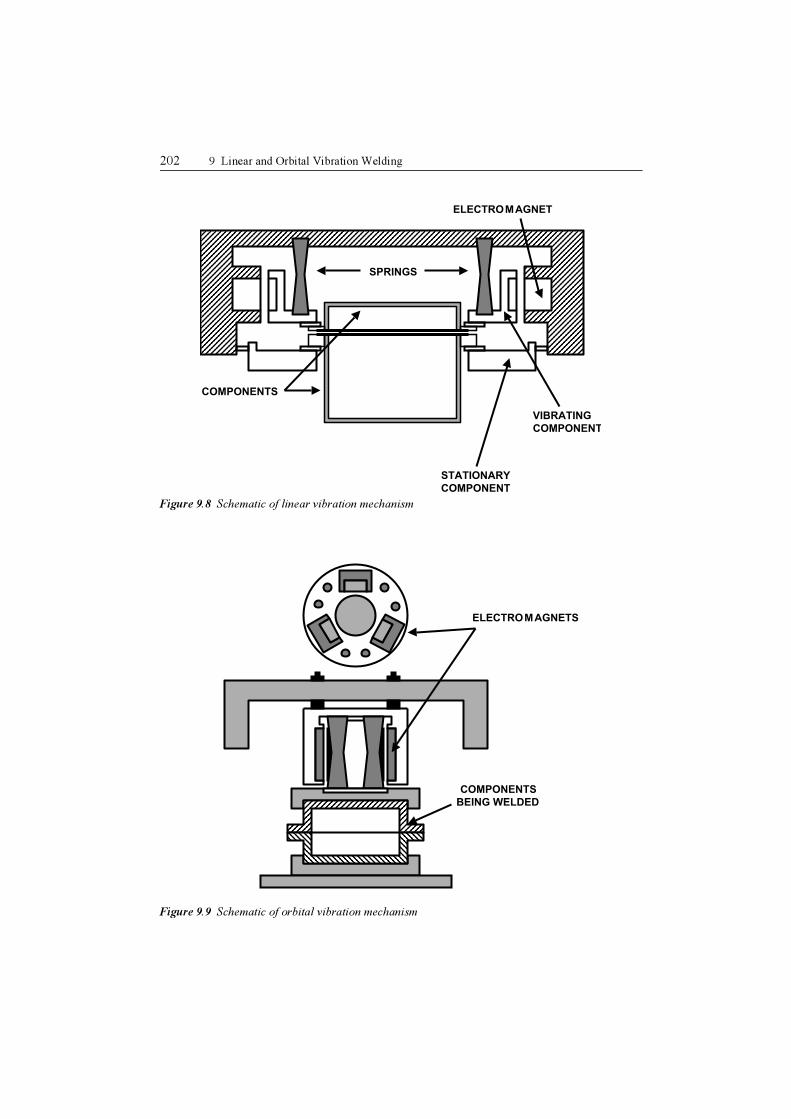
202 9 Linear and Orbital Vibration Welding
Figure 9.8 Schematic of linear vibration mechanism
Figure 9.9 Schematic of orbital vibration mechanism
SPRINGS
COMPONENTS
STATIONARY
COMPONENT
VIBRATING
COMPONENT
ELECTROMAGNET
COMPONENTS
BEING WELDED
ELECTROMAGNETS
9.8 Equipment Setup 223
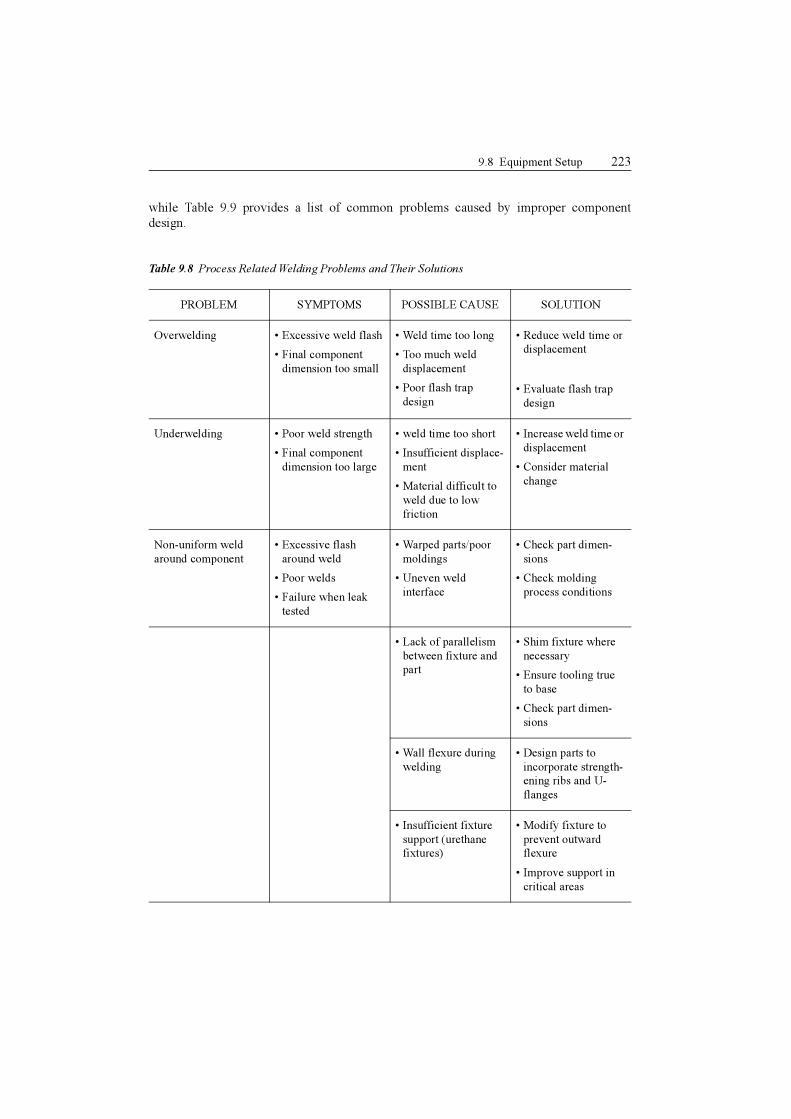
while Table 9.9 provides a list of common problems caused by improper component
design.
Table 9.8 Process Related Welding Problems and Their Solutions
PROBLEM SYMPTOMS POSSIBLE CAUSE SOLUTION
Overwelding • Excessive weld flash
• Final component
dimension too small
• Weld time too long
• Too much weld
displacement
• Poor flash trap
design
• Reduce weld time or
displacement
• Evaluate flash trap
design
Underwelding • Poor weld strength
• Final component
dimension too large
• weld time too short
• Insufficient displace-
ment
• Material difficult to
weld due to low
friction
• Increase weld time or
displacement
• Consider material
change
Non-uniform weld
around component
• Excessive flash
around weld
• Poor welds
• Failure when leak
tested
• Warped parts/poor
moldings
• Uneven weld
interface
• Check part dimen-
sions
• Check molding
process conditions
• Lack of parallelism
between fixture and
part
• Shim fixture where
necessary
• Ensure tooling true
to base
• Check part dimen-
sions
• Wall flexure during
welding
• Design parts to
incorporate strength-
ening ribs and U-
flanges
• Insufficient fixture
support (urethane
fixtures)
• Modify fixture to
prevent outward
flexure
• Improve support in
critical areas

11.3 Physics of the Process 253
tions, such as some book covers, require this configuration in order to accommodate the
part geometry.
Figure 11.3 Typical electrode configuration, flat plate opposing sheet metal on edge
Figure 11.4 Typical electrode configuration, two opposing sheet metal electrode
While the electrode configurations produce different electric field contours (Fig. 11.3 and
Fig. 11.4), the model, a capacitor, as seen in Fig. 11.2 can be used to estimate heat genera-
tion [1]. The capacitance (Co) of the model is:
(11.1)
where εo
is the permittivity of a vacuum, εr is the permittivity of the material (plastic), and
A is the cross sectional area of the weld.
It is important to note that compared to typical capacitor models, the model seen in the
figure includes a lossy component (resistor). To model the dielectric welding process,
where the losses are substantial, the resistor must incorporated into the model. That is to
say, the loss (resistor component- ) and storage (capacitance component- ) components
of the dielectric constant must be incorporator. The complex loss modulus is the vector
sum of the two components and is defined as:
(11.2)
Upper electrode
Material to be sealed
Lower electrode
Lower electrode
Upper electrode
Materials to be sealed
g
ro
d
Aεε
=o
C
'ε "ε
"' εεε i−=*r
268 11 Radio Frequency Welding
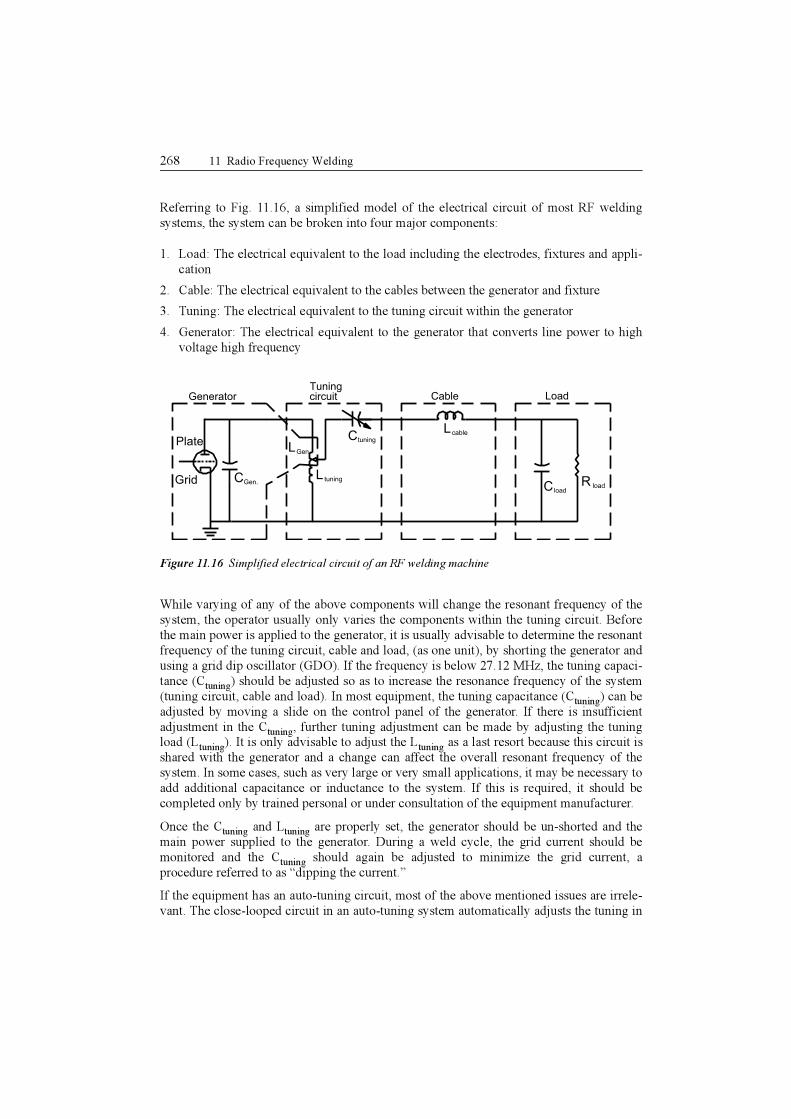
Referring to Fig. 11.16, a simplified model of the electrical circuit of most RF welding
systems, the system can be broken into four major components:
1. Load: The electrical equivalent to the load including the electrodes, fixtures and appli-
cation
2. Cable: The electrical equivalent to the cables between the generator and fixture
3. Tuning: The electrical equivalent to the tuning circuit within the generator
4. Generator: The electrical equivalent to the generator that converts line power to high
voltage high frequency
Figure 11.16 Simplified electrical circuit of an RF welding machine
While varying of any of the above components will change the resonant frequency of the
system, the operator usually only varies the components within the tuning circuit. Before
the main power is applied to the generator, it is usually advisable to determine the resonant
frequency of the tuning circuit, cable and load, (as one unit), by shorting the generator and
using a grid dip oscillator (GDO). If the frequency is below 27.12 MHz, the tuning capaci-
tance (Ctuning) should be adjusted so as to increase the resonance frequency of the system
(tuning circuit, cable and load). In most equipment, the tuning capacitance (Ctuning) can be
adjusted by moving a slide on the control panel of the generator. If there is insufficient
adjustment in the Ctuning, further tuning adjustment can be made by adjusting the tuningload (L tuning). It is only advisable to adjust the L tuning as a last resort because this circuit is
shared with the generator and a change can affect the overall resonant frequency of the
system. In some cases, such as very large or very small applications, it may be necessary to
add additional capacitance or inductance to the system. If this is required, it should be
completed only by trained personal or under consultation of the equipment manufacturer.
Once the Ctuning and Ltuning are properly set, the generator should be un-shorted and the
main power supplied to the generator. During a weld cycle, the grid current should be
monitored and the Ctuning should again be adjusted to minimize the grid current, a
procedure referred to as “dipping the current.”
If the equipment has an auto-tuning circuit, most of the above mentioned issues are irrele-
vant. The close-looped circuit in an auto-tuning system automatically adjusts the tuning in
LoadCableTuningcircuitGenerator
R loadCload
LcableCtuning
tuningL
LGen.
CGen.Grid
Plate

286 12 Infrared and Laser Welding
12.3 Physics of the Process
12.3.1 The Electromagnetic Spectrum
While the human eye is only sensitive to wavelengths between 400 nm (violet) and 780 nm
(red), the electromagnetic spectrum is much broader, see Figure 12.16.
Figure 12.16 Electromagnetic spectrum
In order to understand IR and laser welding of plastics it is important to understand the
importance of the electromagnetic spectrum, in particular of those wavelengths (λ)
between 800 and 11,000 nm. Wavelengths between 800 and 11,000 nm are the mostcommon for laser/IR plastic welding and processing. As will be detailed in the following
sections, there are several material characteristics, which make these wavelengths more
amendable for processing. In addition, these wavelengths are also easily produced at rela-
tively high power levels, >10W. For example, one of the most common lasers used in
industry, a CO2 laser, produces radiation at a wavelength of 10,600 nm. Another common
high power laser, YAG (yttrium-aluminum garnet) laser, produces a wavelength of 1,064
nm [4]. In the late 1990s, high power laser diodes became common. Laser diodes typically
produce wavelengths between 800 and 950 nm. In addition, non-laser sources such as
ceramic heaters and quartz lamps are able to produce similar wavelengths, 5,000 to 10,000
nm and 1,000 to 5,000 nm respectively.
Shorter wavelengths can be produced, but only at relatively lower power levels. For
example, a typical excimer laser can produce wavelengths as short as 200 nm, however, the
power levels are usually less than 10 W for a single laser. Because of the relatively low
power capacities, these wavelengths are usually limited to very small components or
surface modifications in terms of plastic processing.
One of the reasons why it is more difficult to produce the shorter wavelengths is that the
amount of energy in the electromagnetic spectrum is inversely proportional to the wave-
length, see Eq. (12.1). Here, h is Planck’s Constant (6.626x10⁻²⁷ erg s) and c is the speed of
light (3.0x1010 cm/s) [5].
290 12 Infrared and Laser Welding
Historically, the relationship between absorption and chemical structure has been used for
material identification. By exposing a sample to a wide bandwidth IR radiation (typically awavelength between 3,000 to 15,000 nm) and observing the absorption, it is possible to
determine which chemical bonds are present [9], see Table 12.4, and to interpret a mate-
rial’s chemical structure.
Table 12.4 Selected Modes of Vibration for Some Chemical Bonds and IR Absorption [5]
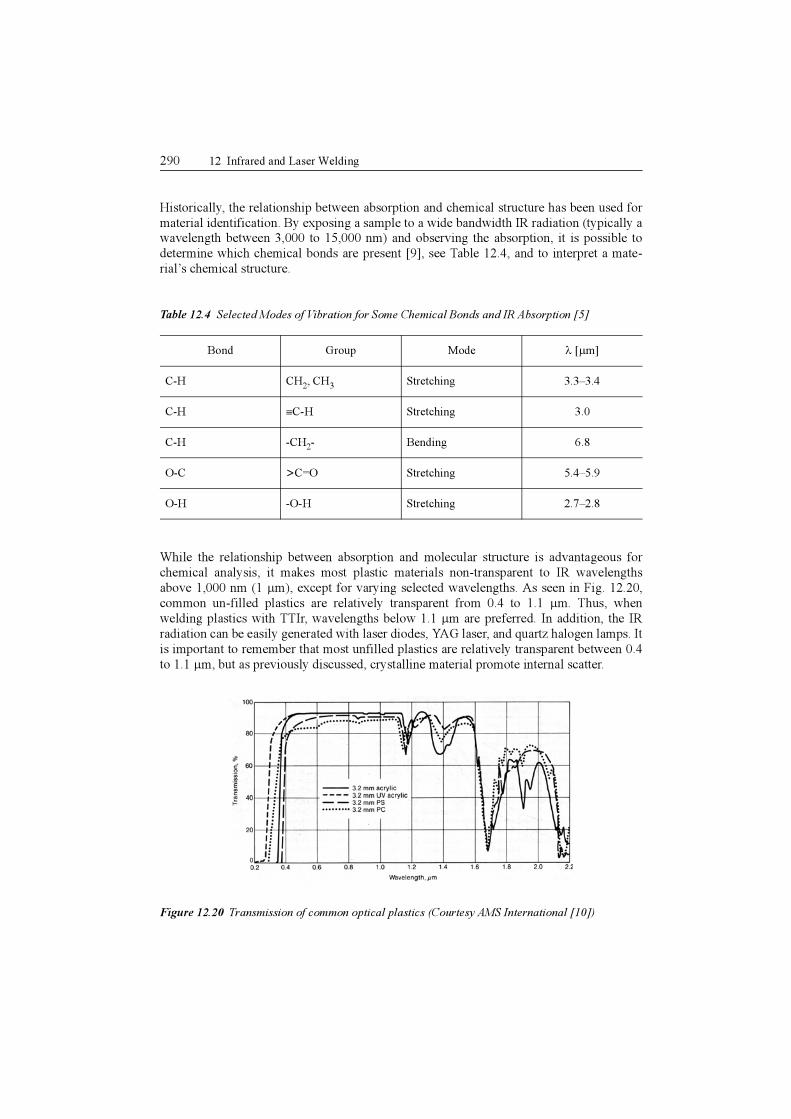
While the relationship between absorption and molecular structure is advantageous for
chemical analysis, it makes most plastic materials non-transparent to IR wavelengths
above 1,000 nm (1 µm), except for varying selected wavelengths. As seen in Fig. 12.20,
common un-filled plastics are relatively transparent from 0.4 to 1.1 µm. Thus, when
welding plastics with TTIr, wavelengths below 1.1 µm are preferred. In addition, the IR
radiation can be easily generated with laser diodes, YAG laser, and quartz halogen lamps. It
is important to remember that most unfilled plastics are relatively transparent between 0.4
to 1.1 µm, but as previously discussed, crystalline material promote internal scatter.
Figure 12.20 Transmission of common optical plastics (Courtesy AMS International [10])
Bond Group Mode λ [µm]
C-H CH2, CH
3Stretching 3.3–3.4
C-H ≡C-H Stretching 3.0
C-H -CH2- Bending 6.8
O-C >C=O Stretching 5.4–5.9
O-H -O-H Stretching 2.7–2.8
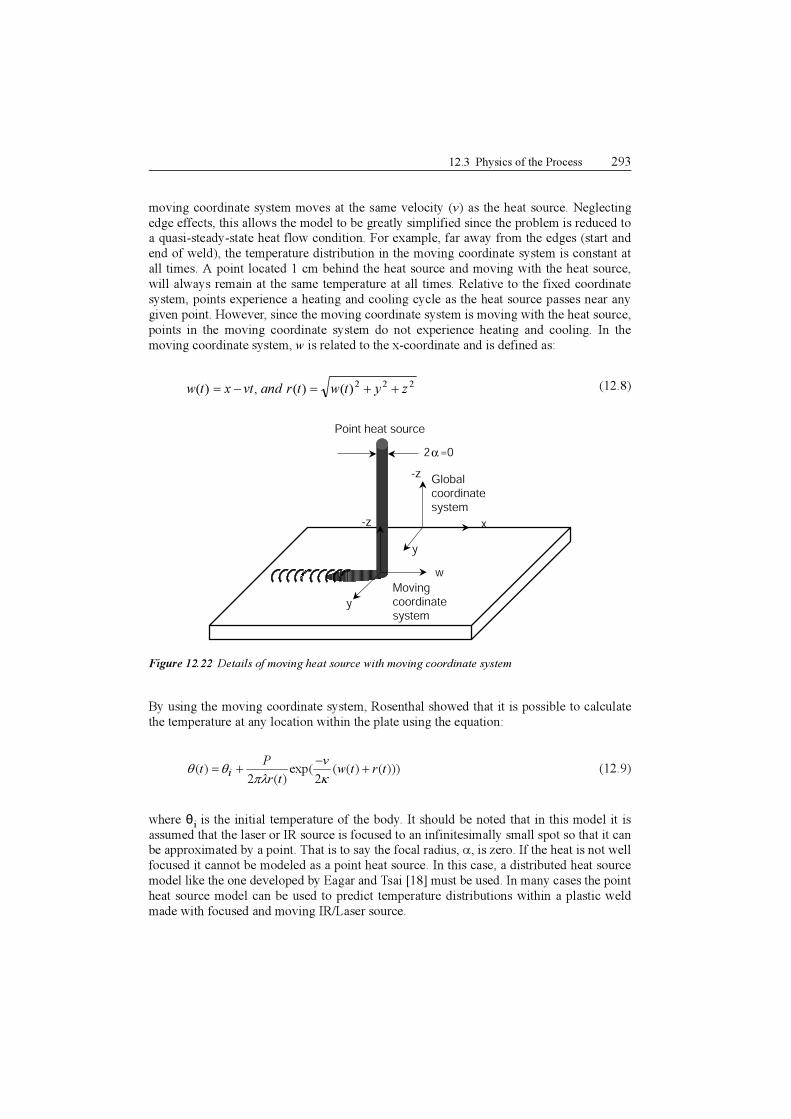
12.3 Physics of the Process 293
moving coordinate system moves at the same velocity (v) as the heat source. Neglecting
edge effects, this allows the model to be greatly simplified since the problem is reduced toa quasi-steady-state heat flow condition. For example, far away from the edges (start and
end of weld), the temperature distribution in the moving coordinate system is constant at
all times. A point located 1 cm behind the heat source and moving with the heat source,
will always remain at the same temperature at all times. Relative to the fixed coordinate
system, points experience a heating and cooling cycle as the heat source passes near any
given point. However, since the moving coordinate system is moving with the heat source,
points in the moving coordinate system do not experience heating and cooling. In the
moving coordinate system, w is related to the x-coordinate and is defined as:
(12.8)
Figure 12.22 Details of moving heat source with moving coordinate system
By using the moving coordinate system, Rosenthal showed that it is possible to calculate
the temperature at any location within the plate using the equation:
(12.9)
where θi is the initial temperature of the body. It should be noted that in this model it is
assumed that the laser or IR source is focused to an infinitesimally small spot so that it canbe approximated by a point. That is to say the focal radius, α, is zero. If the heat is not well
focused it cannot be modeled as a point heat source. In this case, a distributed heat source
model like the one developed by Eagar and Tsai [18] must be used. In many cases the point
heat source model can be used to predict temperature distributions within a plastic weld
made with focused and moving IR/Laser source.
222)()(,)( zytwtrandvtxtw ++=−=
-z
x
y
-z
y
w
Point heat source
Global coordinate system
Movingcoordinate system
2 =0α
)))()((2(exp
)(2)( trtw
v
tr
Pt i +
−+=
κπλθθ

302 12 Infrared and Laser Welding
Case Study 1: CO Detector Filter
This application had a thin filter medium attached to the housing and when alternative
techniques were used, such as ultrasonic welding, this filter medium was often destroyed.
However, with IR welding the application was welded without any damage to the filter and
generation of particulate, see Fig. 12.30.
Figure 12.30 CO filter tester welded with IR/laser to prevent part damage, (a) un-welded, and
(b) welded (Courtesy Quantum Group Inc.)
Case Study 2: Film and Fabric Applications
The photograph in Fig. 12.31 shows a medical application. In this IV-bag, blood is exposed
to the weld, which makes it critical for patient safety to avoid particulate generation. Laser
welding allows such complex geometries to be welded without any particulate generation.
In addition, with proper equipment setup, it is also possible to weld applications of this
type without flash generation. In medical applications with blood contact, flash generation
can cause turbulent flow of the blood and result in damage to the blood platelets.
Figure 12.31 Film application with IR/laser welding (Courtesy TWI)
(a) (b)
344 14 Guidelines for Process Selection
Additives such as fillers, pigments, flame retardants, mold release agents, etc. can greatly
affect the weld strength. Small amount of fillers (less than 10%) can increase a material’sstiffness and enhance its weldability for ultrasonic and vibration welding. However, higher
levels of a filler material can increase melt viscosity that can interfere with the material
flow and mix. When a radiant heating process is used, carbon black content can greatly
affect the welding quality.
It is also common for fillers to collect or migrate to the bondline, which can compound
their effects on a material’s weldability. It is usually possible to detect such issues by eval-
uating a micro-cross section of the weld. In addition, when welding polymer blends
(alloys), such PC/ABS, it is common that one of the materials, usually the continuous
phase, will migrate to the bondline. This usually promotes the weld performance to moreclosely match one of the alloy components and not the bulk material. Again, a microstruc-
ture analysis of the bondline can often reveal such issues.
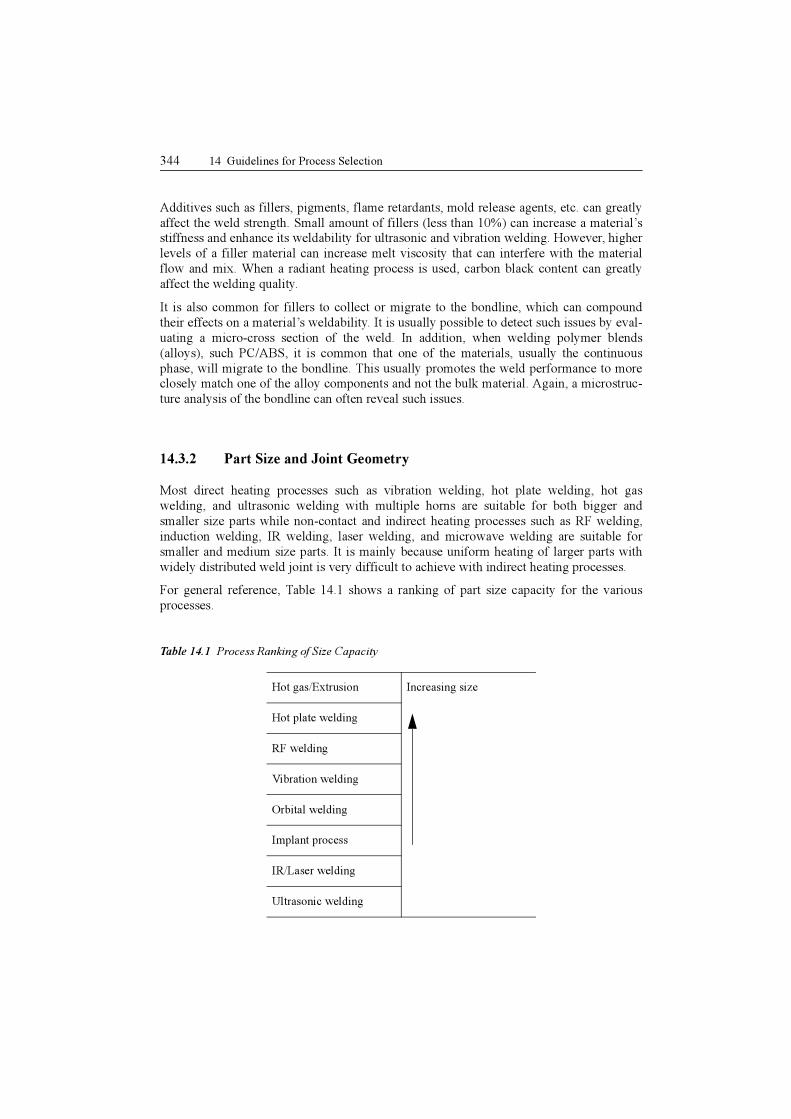
14.3.2 Part Size and Joint Geometry
Most direct heating processes such as vibration welding, hot plate welding, hot gas
welding, and ultrasonic welding with multiple horns are suitable for both bigger and
smaller size parts while non-contact and indirect heating processes such as RF welding,
induction welding, IR welding, laser welding, and microwave welding are suitable for
smaller and medium size parts. It is mainly because uniform heating of larger parts with
widely distributed weld joint is very difficult to achieve with indirect heating processes.
For general reference, Table 14.1 shows a ranking of part size capacity for the various
processes.
Table 14.1 Process Ranking of Size Capacity
Hot gas/Extrusion Increasing size
Hot plate welding
RF welding
Vibration welding
Orbital welding
Implant process
IR/Laser welding
Ultrasonic welding
360 14 Guidelines for Process Selection
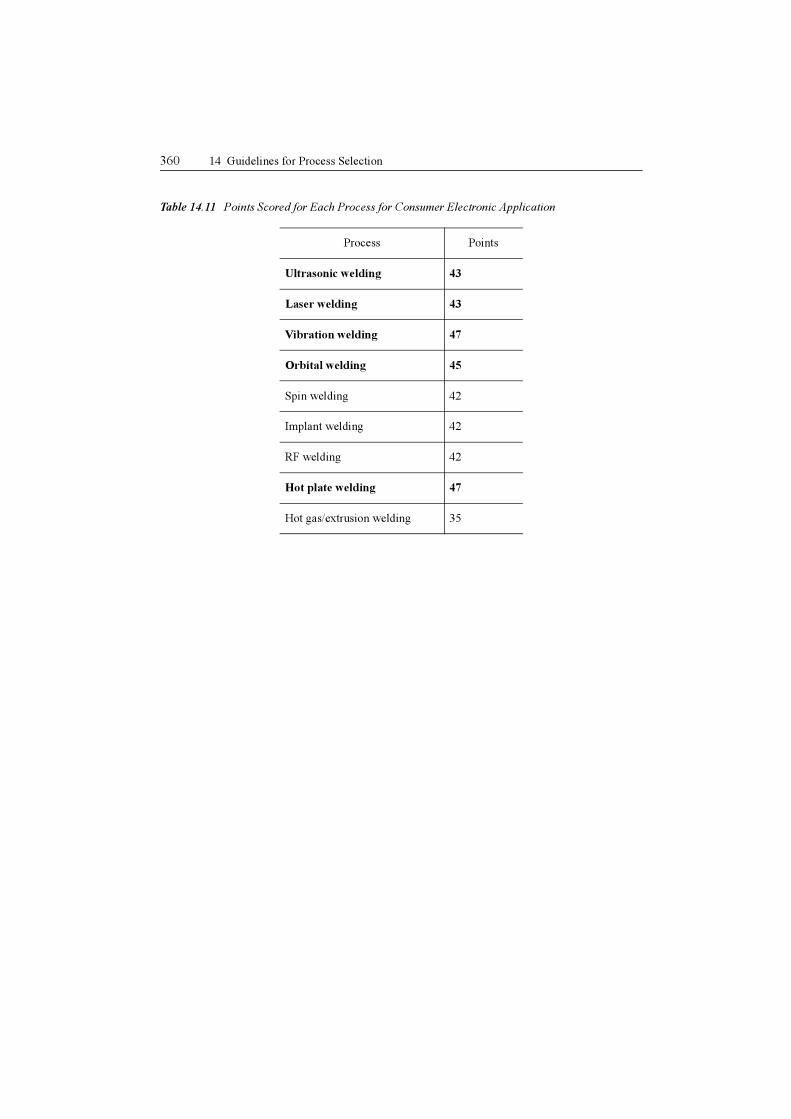
Table 14.11 Points Scored for Each Process for Consumer Electronic Application
Process Points
Ultrasonic welding 43
Laser welding 43
Vibration welding 47
Orbital welding 45
Spin welding 42
Implant welding 42
RF welding 42
Hot plate welding 47
Hot gas/extrusion welding 35
376 15 Testing of Weld Joints
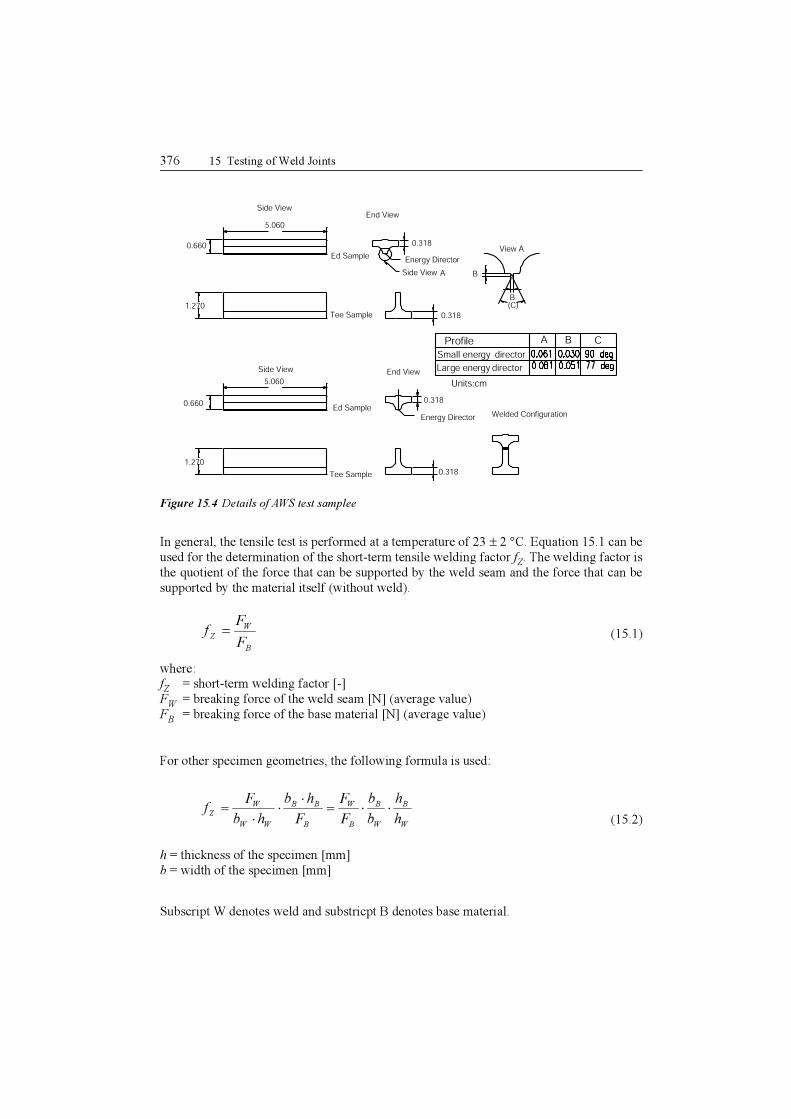
Figure 15.4 Details of AWS test samplee
In general, the tensile test is performed at a temperature of 23 ± 2 °C. Equation 15.1 can be
used for the determination of the short-term tensile welding factor fZ. The welding factor is
the quotient of the force that can be supported by the weld seam and the force that can be
supported by the material itself (without weld).
(15.1)
where:fZ
= short-term welding factor [-]
FW
= breaking force of the weld seam [N] (average value)
FB
= breaking force of the base material [N] (average value)
For other specimen geometries, the following formula is used:
(15.2)
h = thickness of the specimen [mm]
b = width of the specimen [mm]
Subscript W denotes weld and substricpt B denotes base material.
Small energy director
Profile A B C
Large energy director
Units:cm
0.660
1.270
0.660
1.270
5.060
5.060
Side View
Side View
Side View
End View
End View
Ed Sample
Ed Sample
Tee Sample
Tee Sample
0.318
0.318
0.318
0.318
A
Energy Director
Energy Director
Welded Configuration
View A
B
B(C)
B
W
Z
F
Ff =
W
B
W
B
B
W
B
BB
WW
W
Z
h
h
b
b
F
F
F
hb
hb
Ff ⋅⋅=
⋅
⋅
⋅
=