Embed Size (px)
Citation preview
193
Caring for collections in tropicalenvironments: collecting and communicatingdata at Museu Paulista/USP, Brasil(1997-2000)1
Teresa Cristina Toledo de Paula
Museu Paulista da USP
Anais do Museu Paulista. São Paulo. N. Sér. v. 8/9. p. 193-278 (2000-2001). Editado em 2003.
Introduction
The environmental data recorded since 1997 at Museu Paulista,Universidade de São Paulo, Brazil, is part of the “Museum Environmental Plan”, aresearch project begun in 1996 and still in progress. The plan has as main objectives:- to improve understanding the museum environmental conditions;- to research, learn and compare the environmental conditions inside and outside
the building;- to develope a simple way of presenting this data so it could be used by all
museum staff, researchers in general, graduate students and museums insideor outside Brazil;
- to help the museum staff plan their activities;- to manage the collections preservation by studying each area individually,
proposing changes when necessary;- to contribute with other institutions by divulging our experience, problems and
solutions;- to contribute with the study of collections management in tropical countries2.
The museum and the city of São Paulo
Museu Paulista da Universidade de São Paulo is known all over Brazilas the “Independence Museum”. It is one of the most visited sites in the country andone of São Paulo’s largest museums. The Museu Paulista, which is one of the four
1. This project would notexist without the hardwork of Christine MayKauffmann Fidalgo(graphic designer, MuseuPaulista); AlexandreHenrique da Silva (gra-dua-tion student scholar2001-2003, author of Car-tas Climáticas); LincolnSeiji Tejima (graduationstudent scholar 2000-2001 author of Plantastemáticas) ; Dinah Eastop(The Textile ConservationCentre, University ofSouthampton, UK) andProf. Dr. Tarik Rezende deAzevedo from the Labo-ratório de Climatologiae Biogeografia do Depar-tamento de Geografia daFFLCH/USP – who joinedthe project in 2002.
2. All the equipmentdescribed was sponsoredby FAPESP, Fundação deAmparo à Pesquisa doEstado de São Paulo.
194
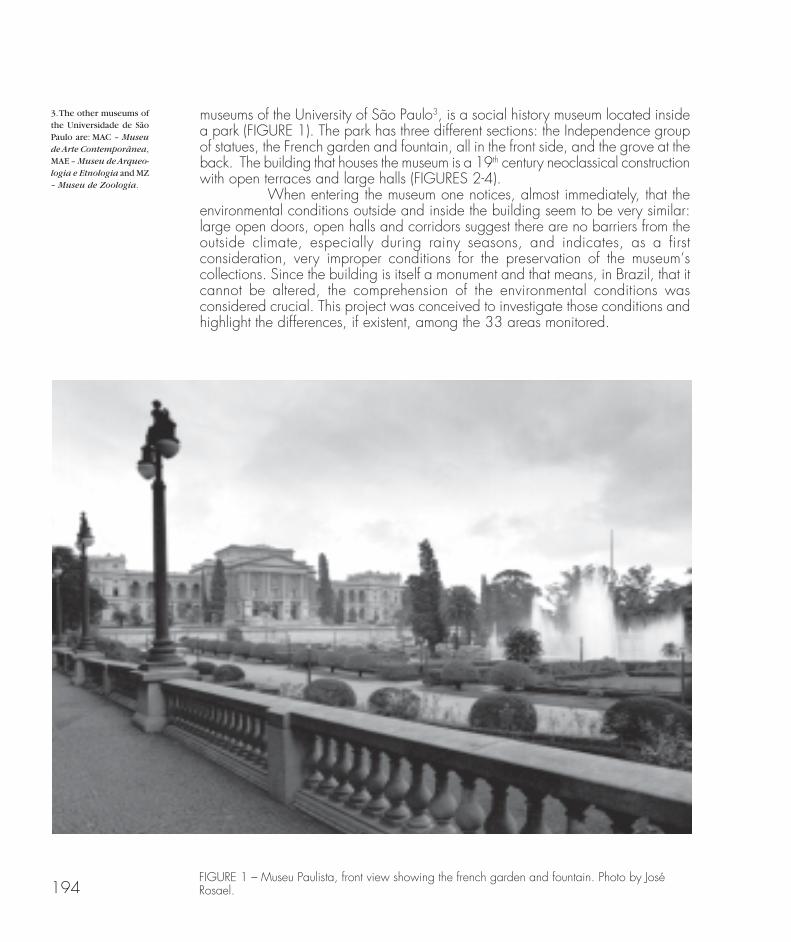
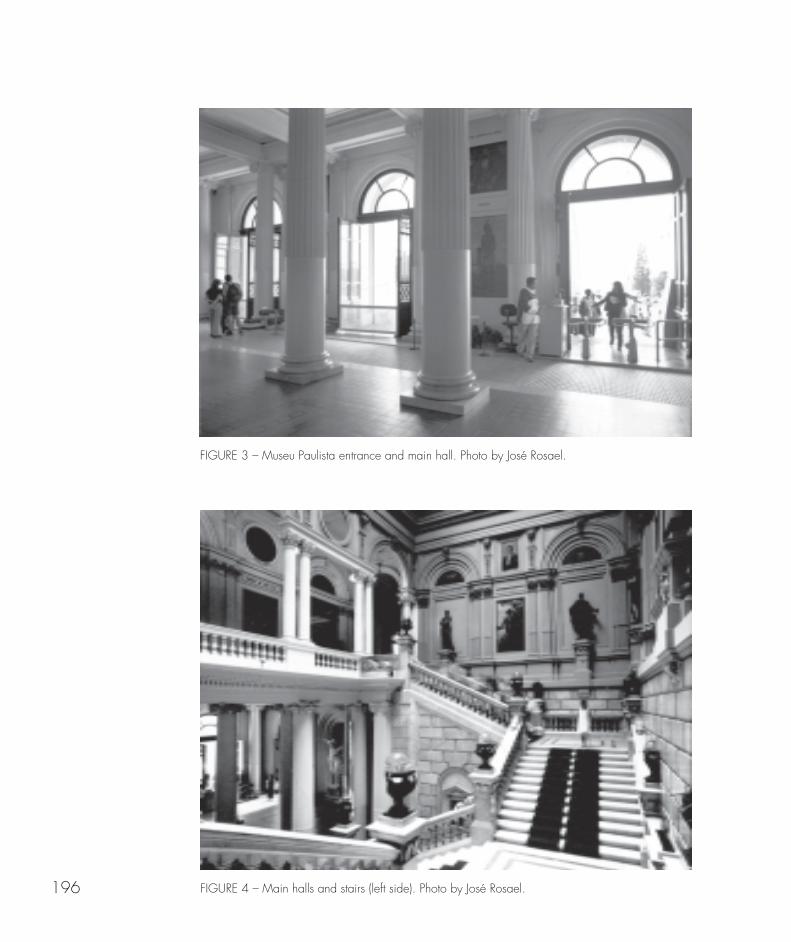
museums of the University of São Paulo3, is a social history museum located insidea park (FIGURE 1). The park has three different sections: the Independence groupof statues, the French garden and fountain, all in the front side, and the grove at theback. The building that houses the museum is a 19th century neoclassical constructionwith open terraces and large halls (FIGURES 2-4).
When entering the museum one notices, almost immediately, that theenvironmental conditions outside and inside the building seem to be very similar:large open doors, open halls and corridors suggest there are no barriers from theoutside climate, especially during rainy seasons, and indicates, as a firstconsideration, very improper conditions for the preservation of the museum‘scollections. Since the building is itself a monument and that means, in Brazil, that itcannot be altered, the comprehension of the environmental conditions wasconsidered crucial. This project was conceived to investigate those conditions andhighlight the differences, if existent, among the 33 areas monitored.
3. The other museums ofthe Universidade de SãoPaulo are: MAC – Museude Arte Contemporânea,MAE – Museu de Arqueo-logia e Etnologia and MZ– Museu de Zoologia.
FIGURE 1 – Museu Paulista, front view showing the french garden and fountain. Photo by JoséRosael.
195
4. The essay wasproduced by LincolnSeiji.Teshima “O meio fí-sico da cidade de SãoPaulo”, 2001 ;unpublished.
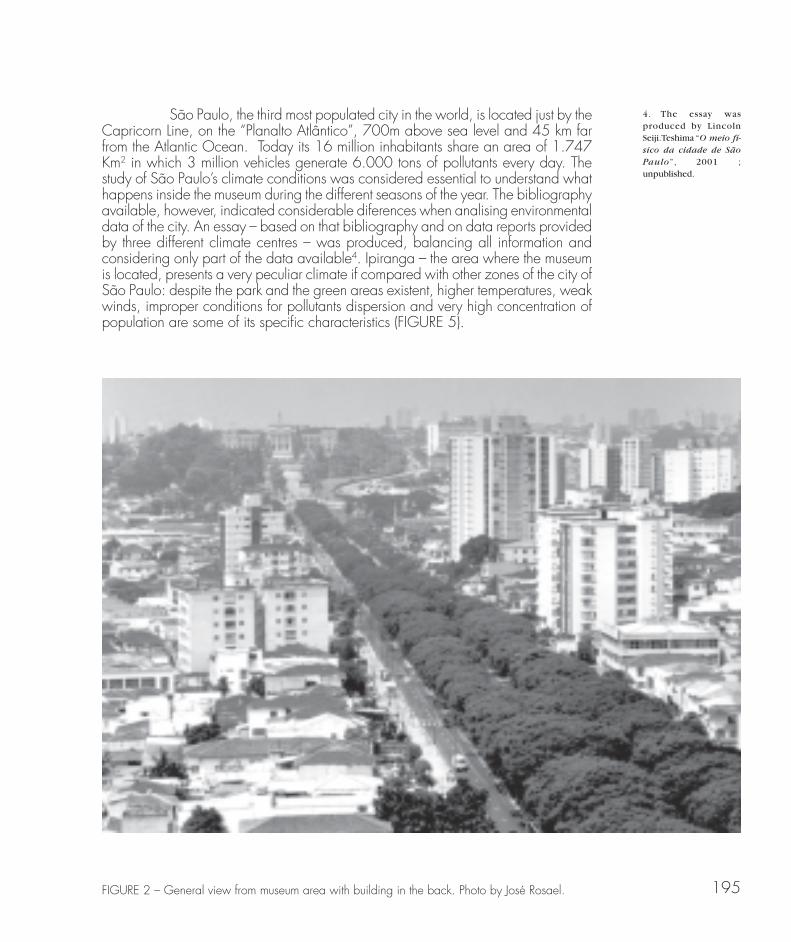
São Paulo, the third most populated city in the world, is located just by theCapricorn Line, on the “Planalto Atlântico”, 700m above sea level and 45 km farfrom the Atlantic Ocean. Today its 16 million inhabitants share an area of 1.747Km2 in which 3 million vehicles generate 6.000 tons of pollutants every day. Thestudy of São Paulo’s climate conditions was considered essential to understand whathappens inside the museum during the different seasons of the year. The bibliographyavailable, however, indicated considerable diferences when analising environmentaldata of the city. An essay – based on that bibliography and on data reports providedby three different climate centres – was produced, balancing all information andconsidering only part of the data available4. Ipiranga – the area where the museumis located, presents a very peculiar climate if compared with other zones of the city ofSão Paulo: despite the park and the green areas existent, higher temperatures, weakwinds, improper conditions for pollutants dispersion and very high concentration ofpopulation are some of its specific characteristics (FIGURE 5).
FIGURE 2 – General view from museum area with building in the back. Photo by José Rosael.
196
FIGURE 3 – Museu Paulista entrance and main hall. Photo by José Rosael.
FIGURE 4 – Main halls and stairs (left side). Photo by José Rosael.
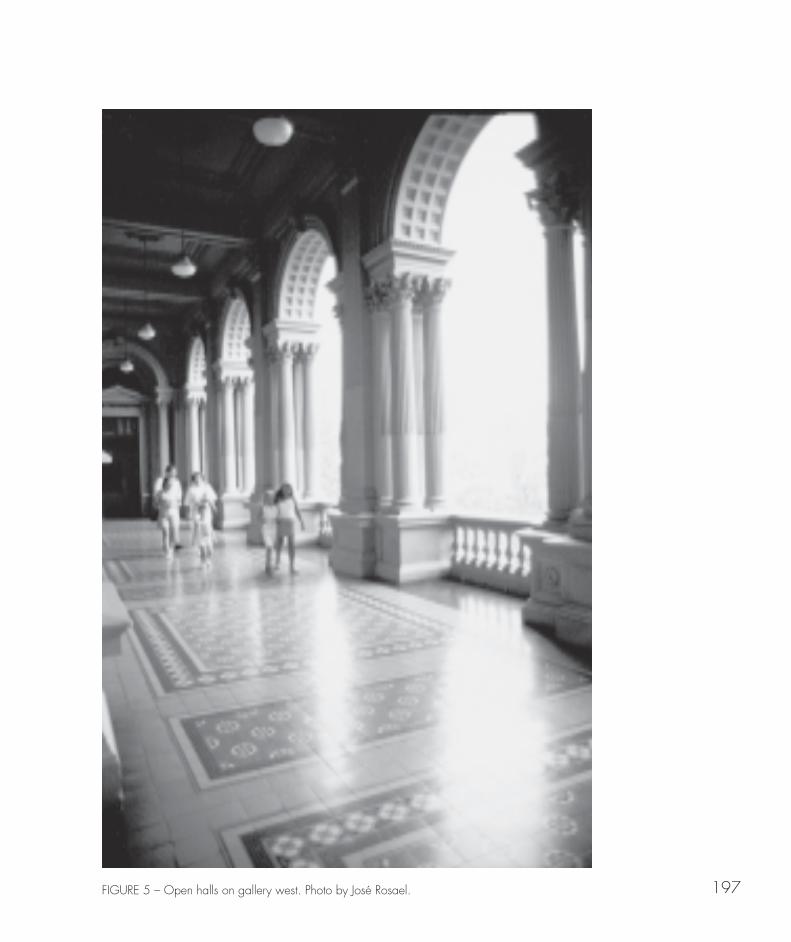
197FIGURE 5 – Open halls on gallery west. Photo by José Rosael.
198
Recording relative humidity and temperature data
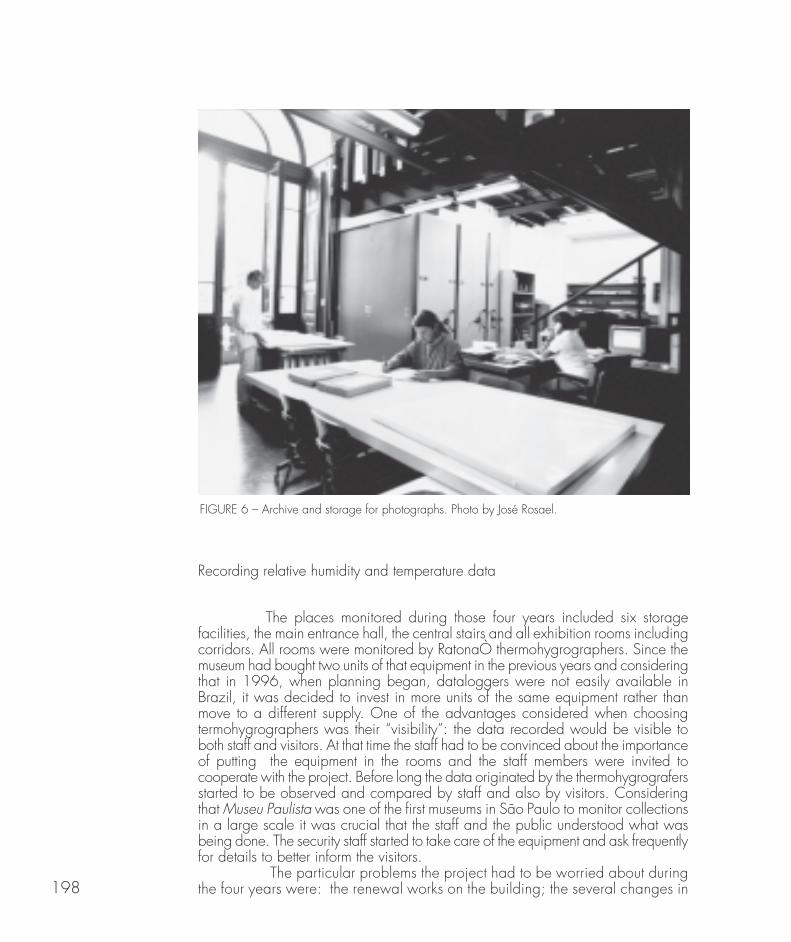
The places monitored during those four years included six storagefacilities, the main entrance hall, the central stairs and all exhibition rooms includingcorridors. All rooms were monitored by RatonaÒ thermohygrographers. Since themuseum had bought two units of that equipment in the previous years and consideringthat in 1996, when planning began, dataloggers were not easily available inBrazil, it was decided to invest in more units of the same equipment rather thanmove to a different supply. One of the advantages considered when choosingtermohygrographers was their “visibility”: the data recorded would be visible toboth staff and visitors. At that time the staff had to be convinced about the importanceof putting the equipment in the rooms and the staff members were invited tocooperate with the project. Before long the data originated by the thermohygrografersstarted to be observed and compared by staff and also by visitors. Consideringthat Museu Paulista was one of the first museums in São Paulo to monitor collectionsin a large scale it was crucial that the staff and the public understood what wasbeing done. The security staff started to take care of the equipment and ask frequentlyfor details to better inform the visitors.
The particular problems the project had to be worried about duringthe four years were: the renewal works on the building; the several changes in
FIGURE 6 – Archive and storage for photographs. Photo by José Rosael.
199
the exhibition rooms and the security of the equipment itself. From 1995 to2000 the building was completely restored without the need of closing themuseum to visitors. To make this possible exhibitions had to be held in turns,some rooms had to be closed while others were under work. It should bementioned that firstly, restoration plans did not include the exhibition areas, sothe risk of equipment and information accuracy were not considered whenelaborating the environmental project. The termohygrographers always stayedin place, protected, except for one that invariably followed the coins and medalscollections. The changes in the rooms were all recorded and will be consideredin all future investigations.
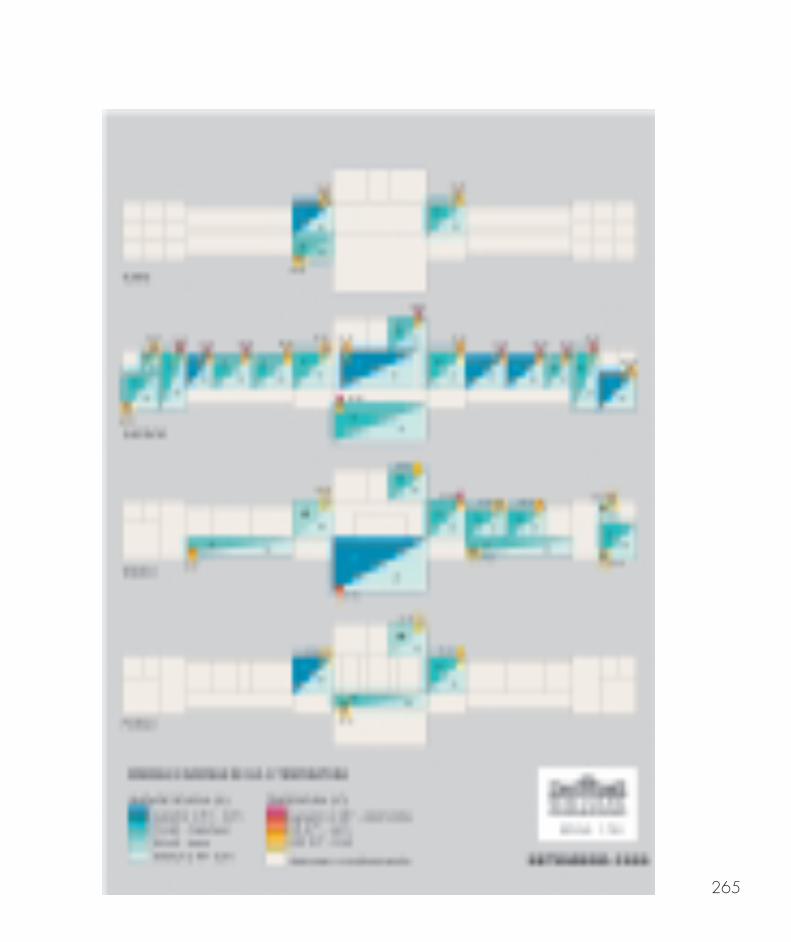
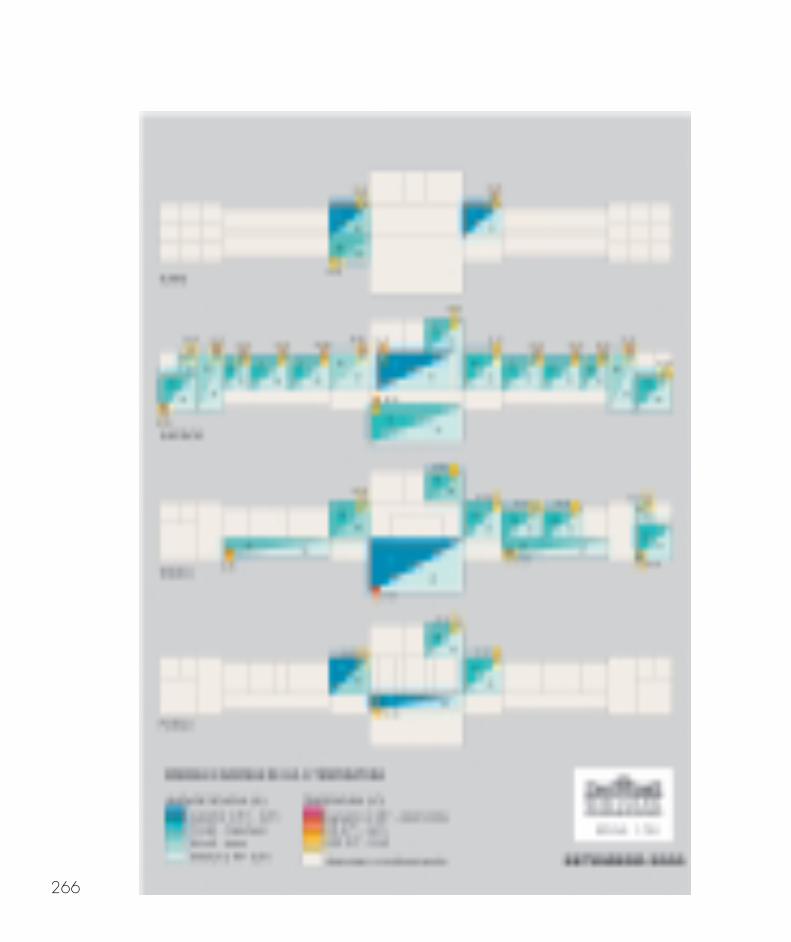
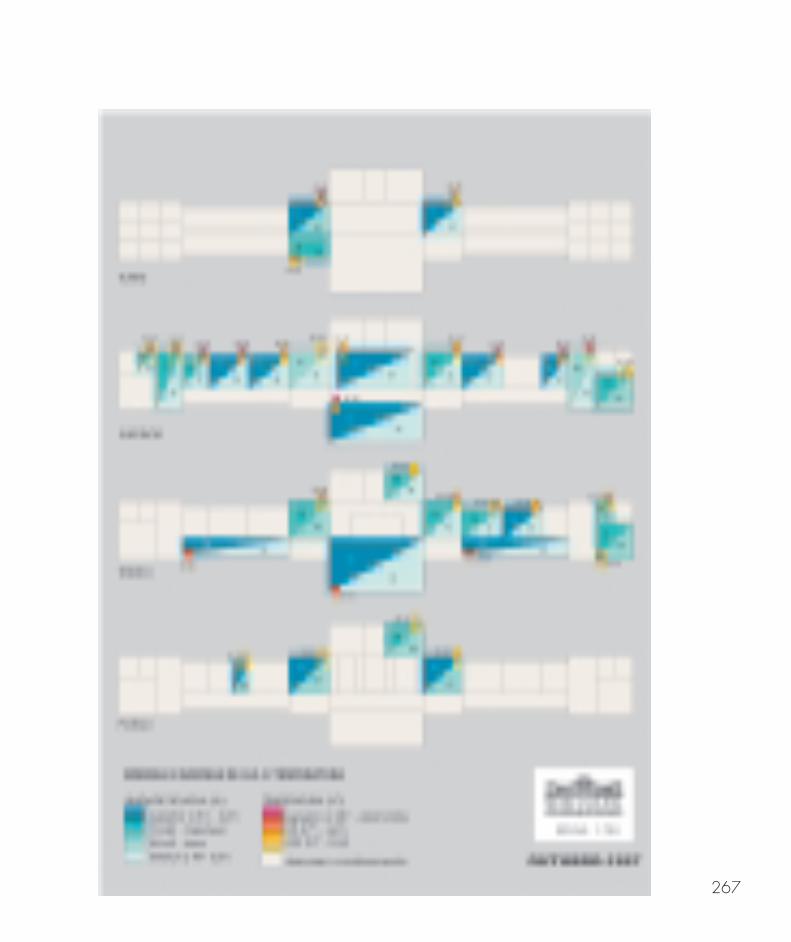
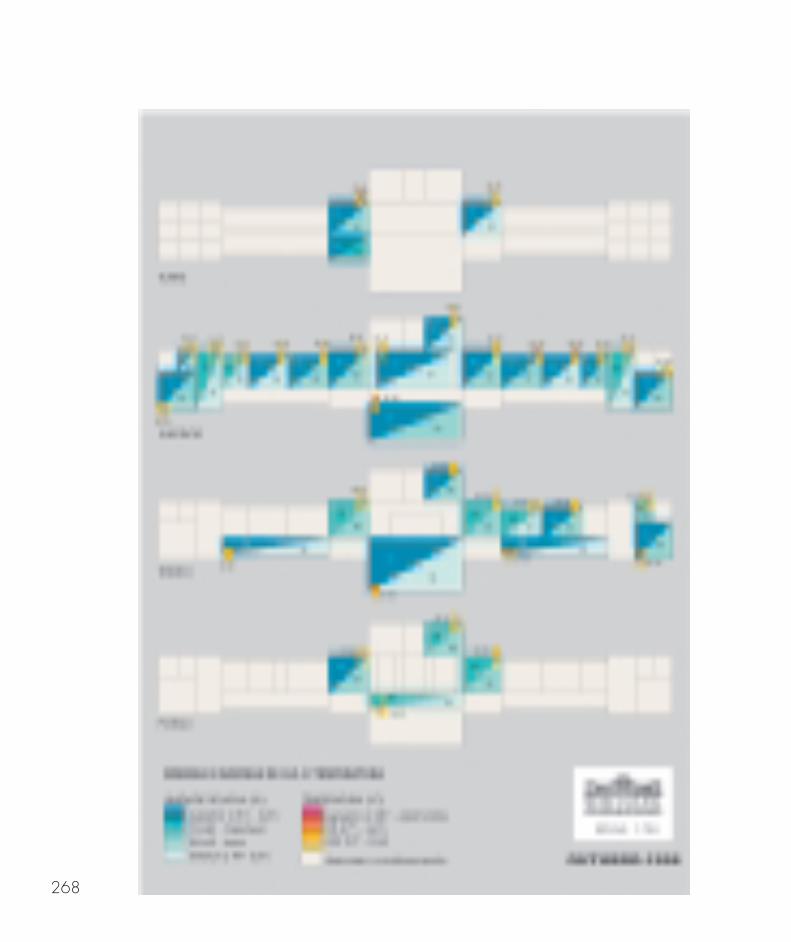
The environmental plans (plantas temáticas)
The relative humidity and temperature data recorded during these fouryears offers us an important opportunity to analise and understand the impact ofthose factors in museum collections, and may suggest, also, that museums situatedin tropical environments should consider other values when discussing and evaluatingtheir environmental conditions. However, all the information obtained would beuseless if museum staff, researchers in general, graduate students and even thegeneral public could not make use of it. Communication was always consideredcrucial; one of the main issues of the project was to provide information to help themuseum staff plan their activities. During the first two years all data was transferedto an Excel® program that produced graphs for each one of the rooms. Theunderstanding of the data and the graphs, however, was considered inadequateand confusing by the staff. Links between the graphs and people’s workingexperiences had to be made clear.
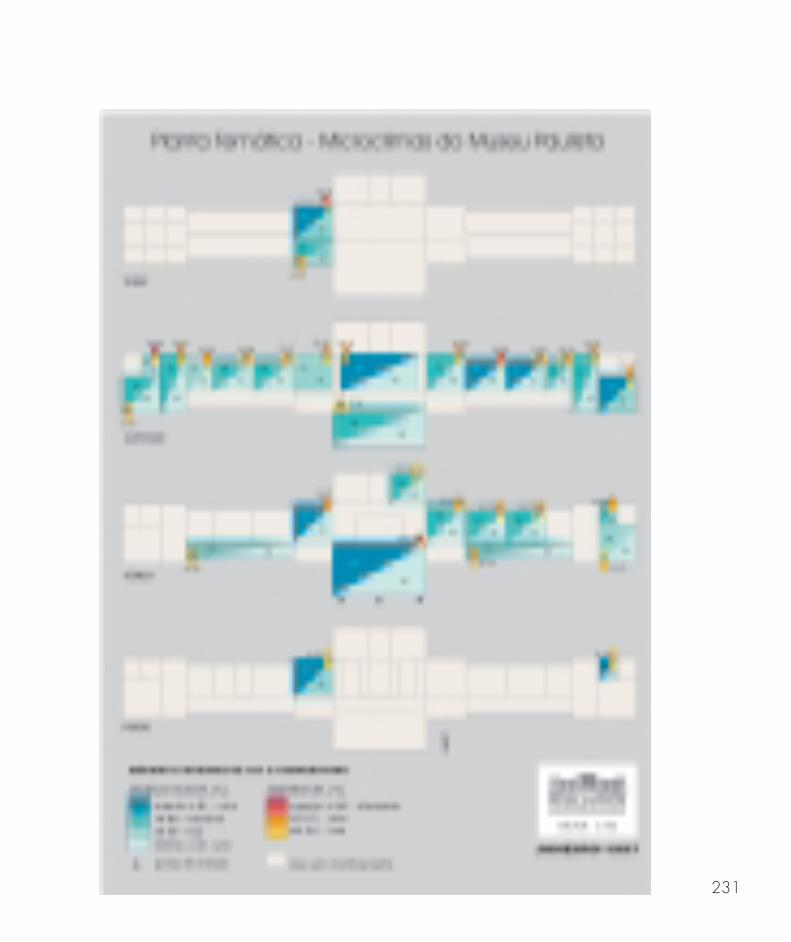
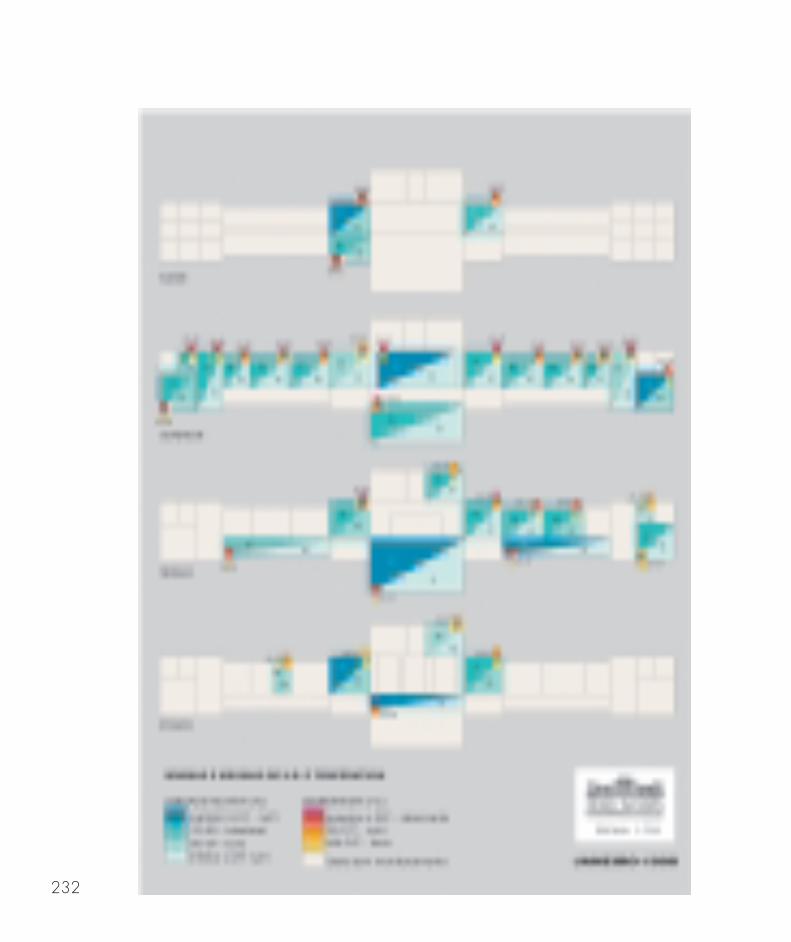
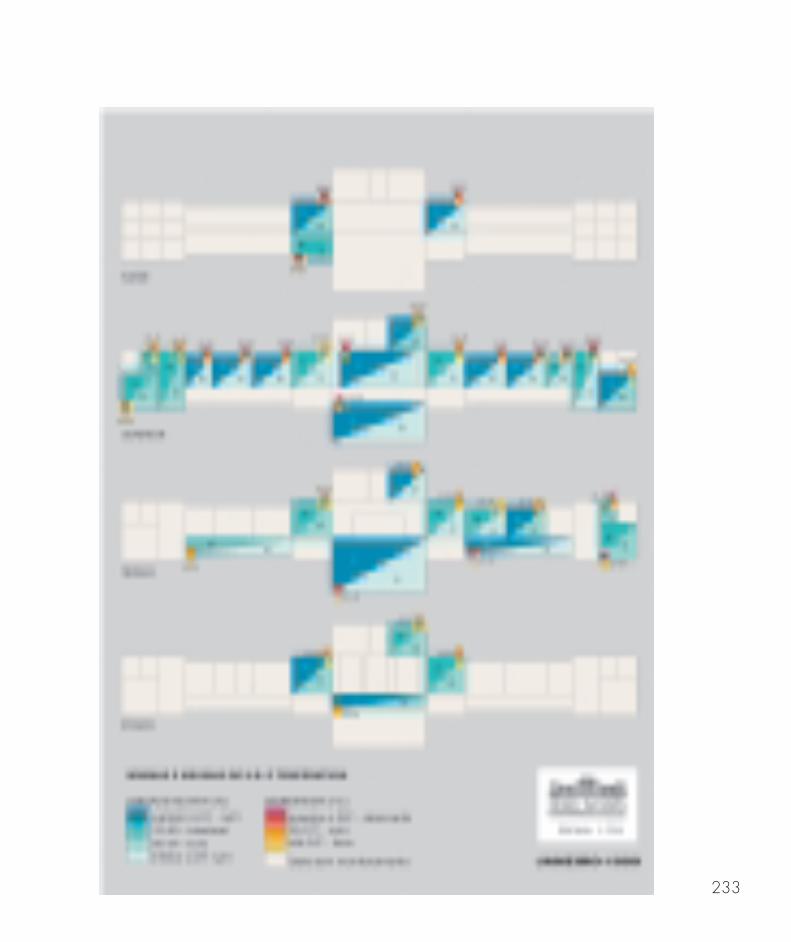
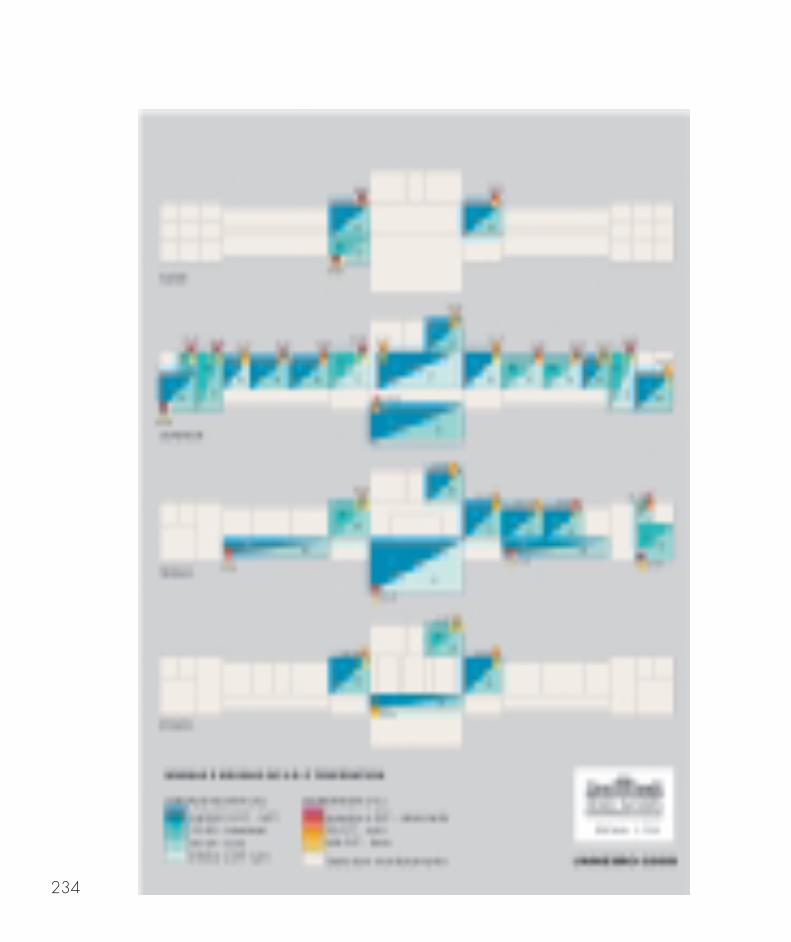
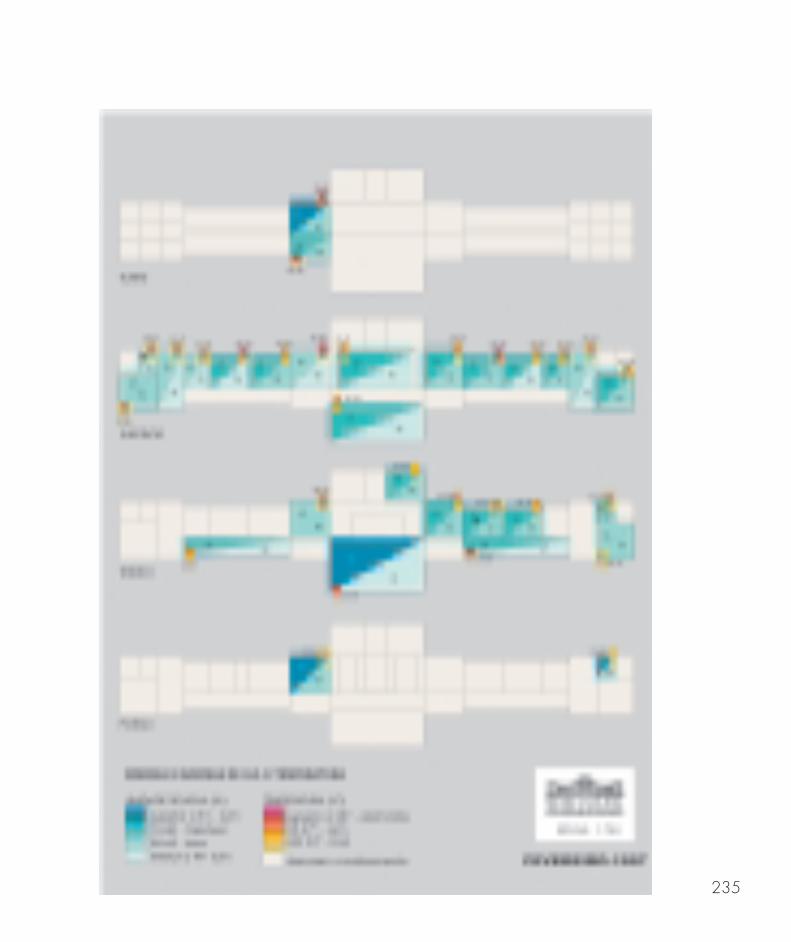
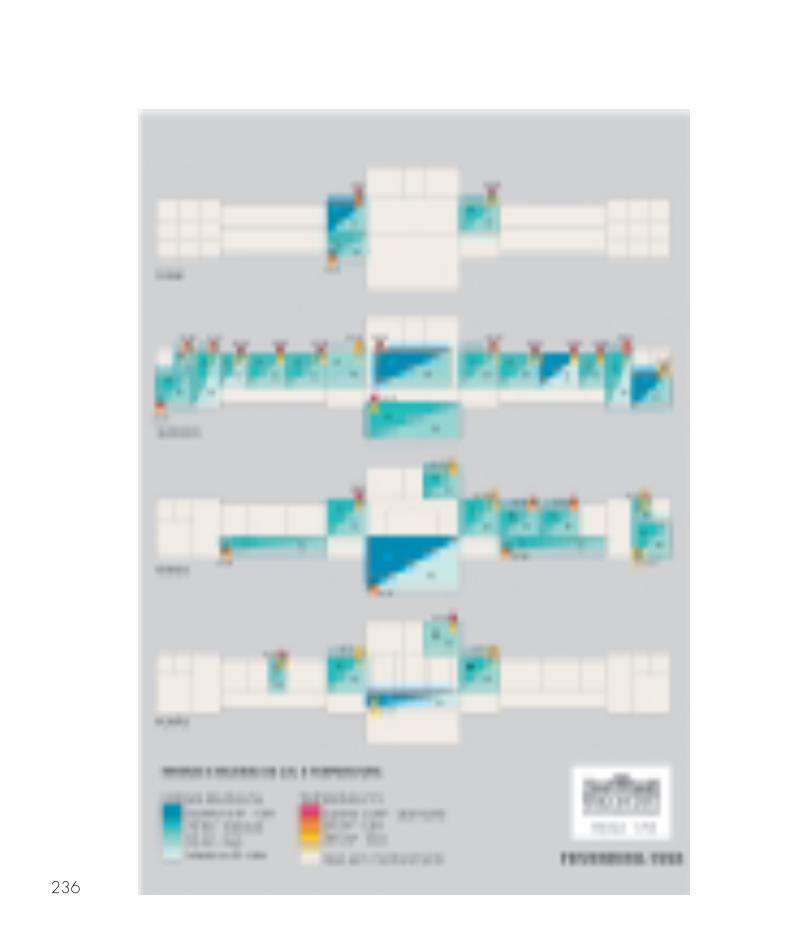
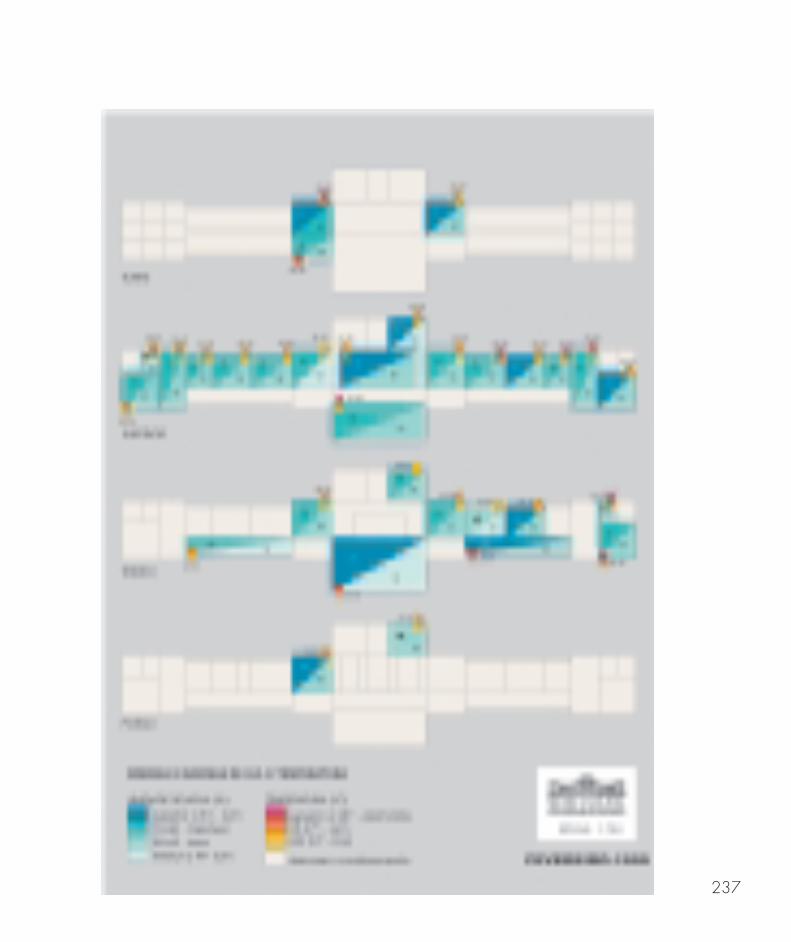
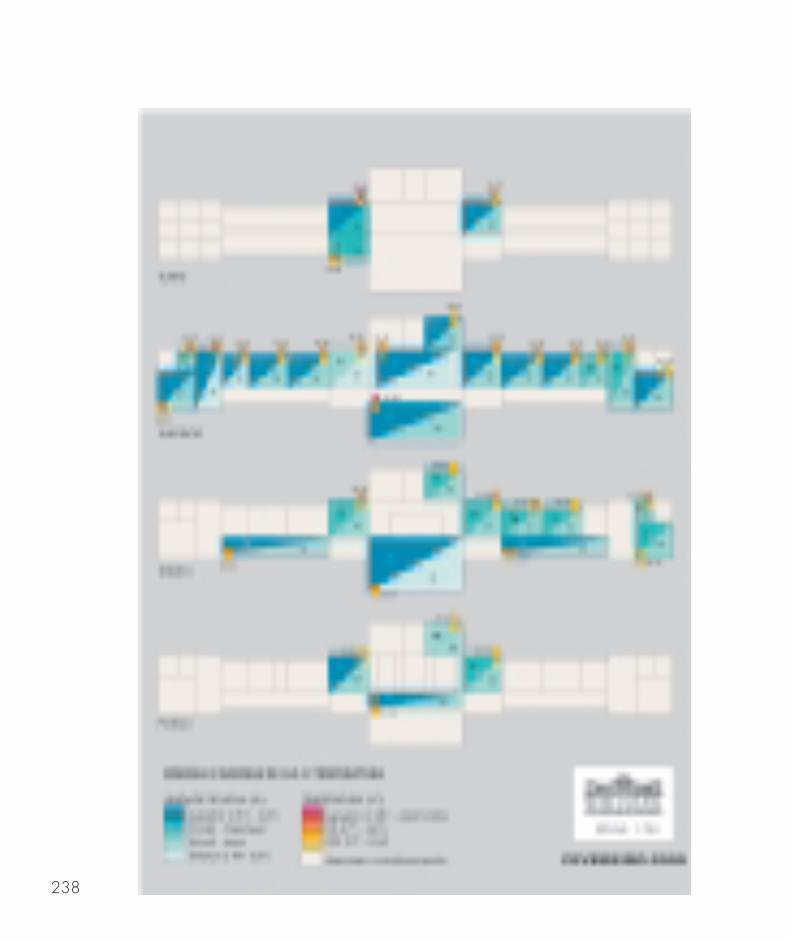
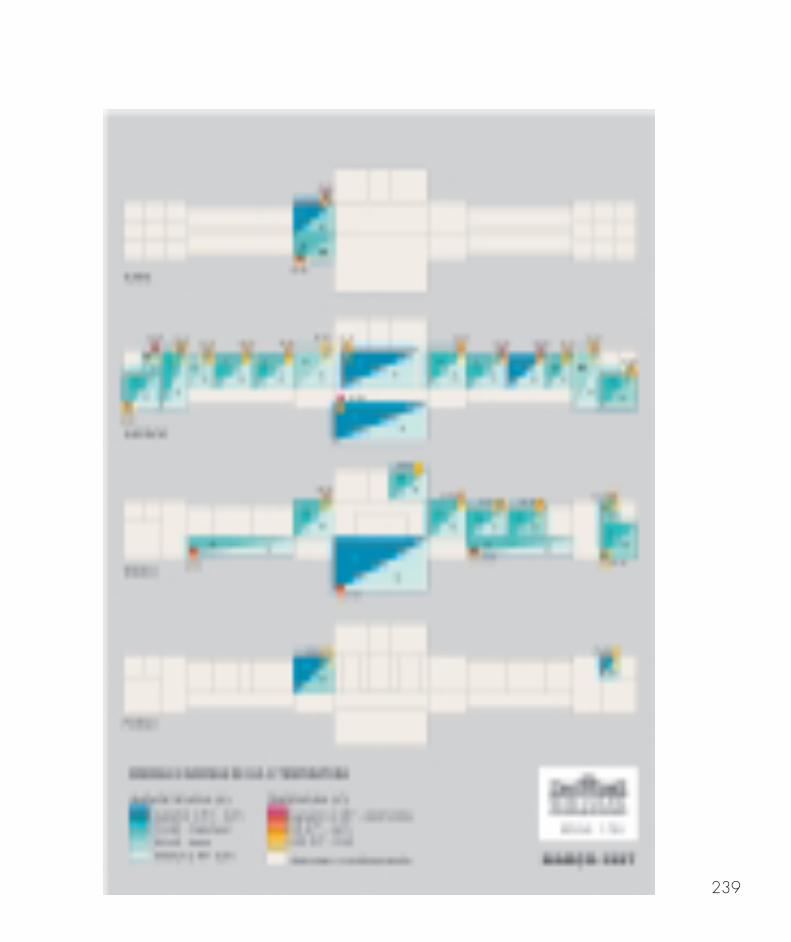
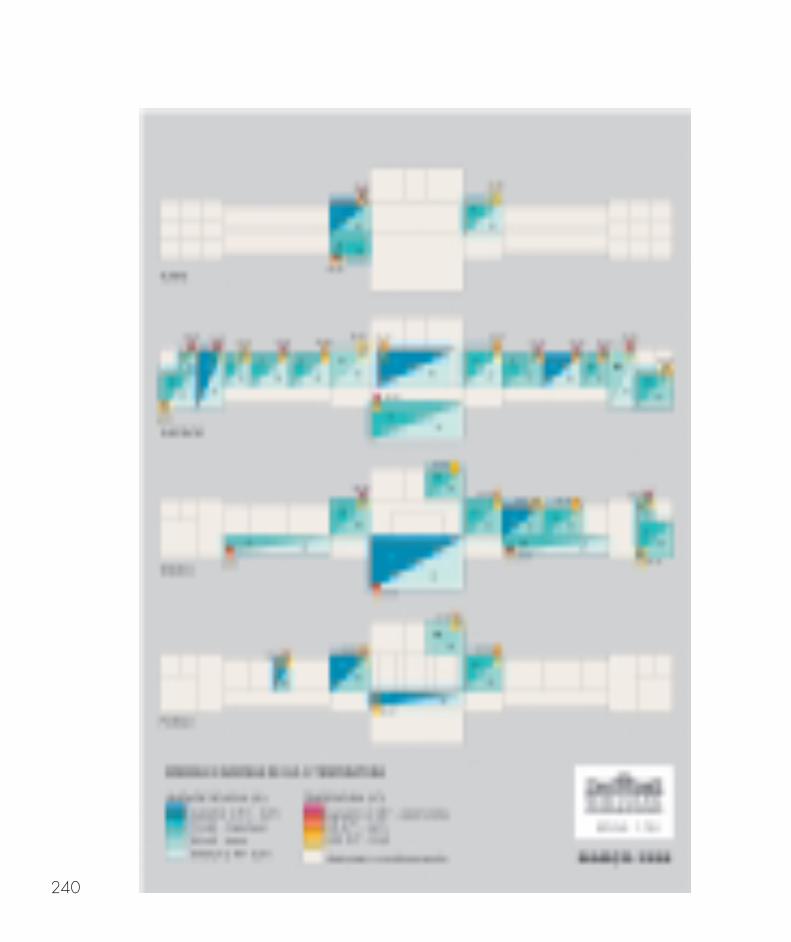
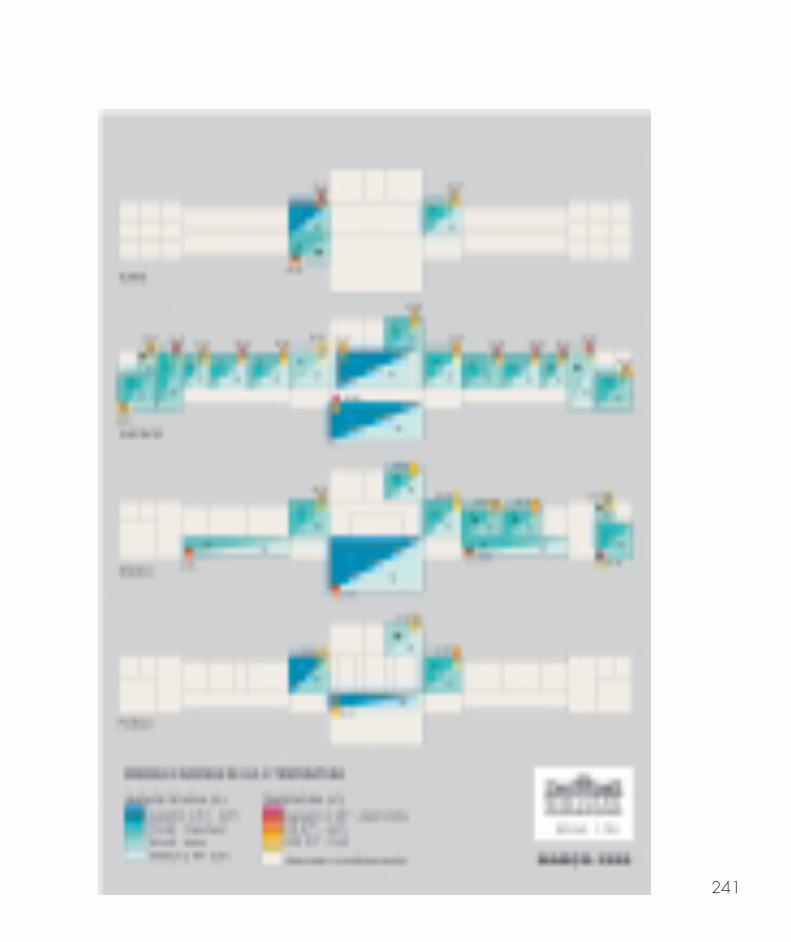
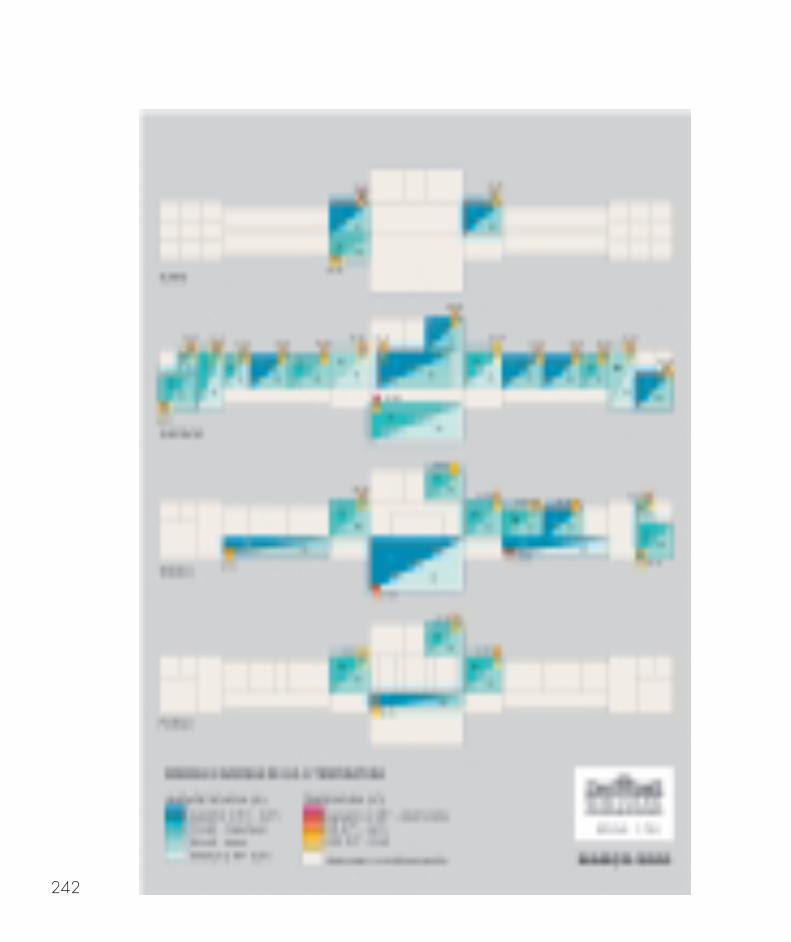
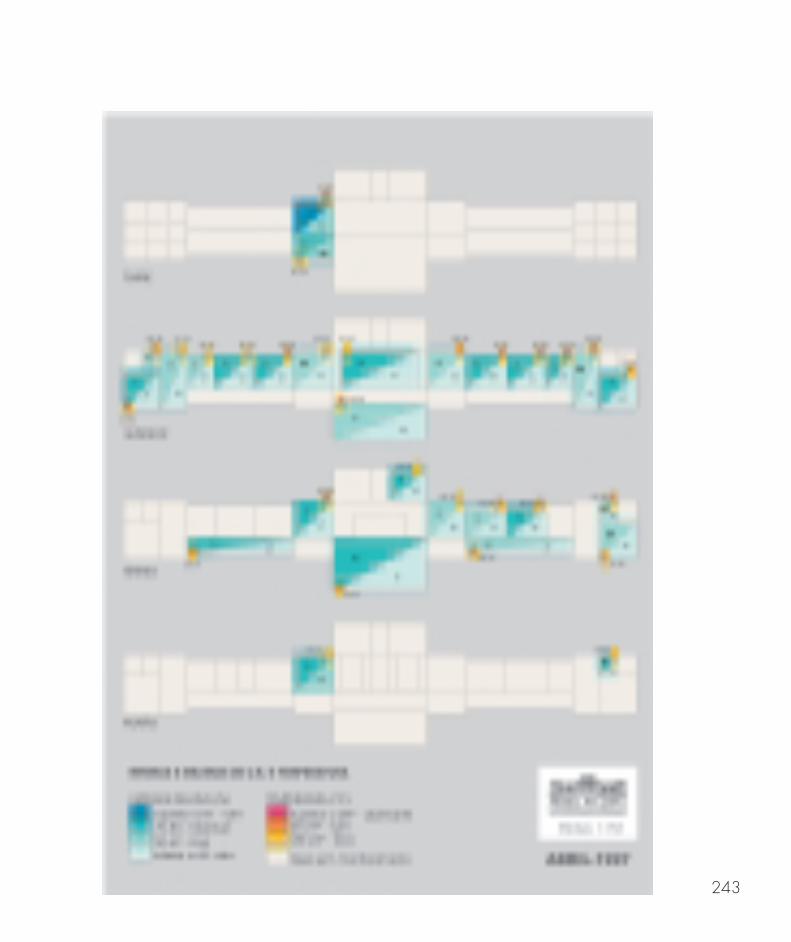
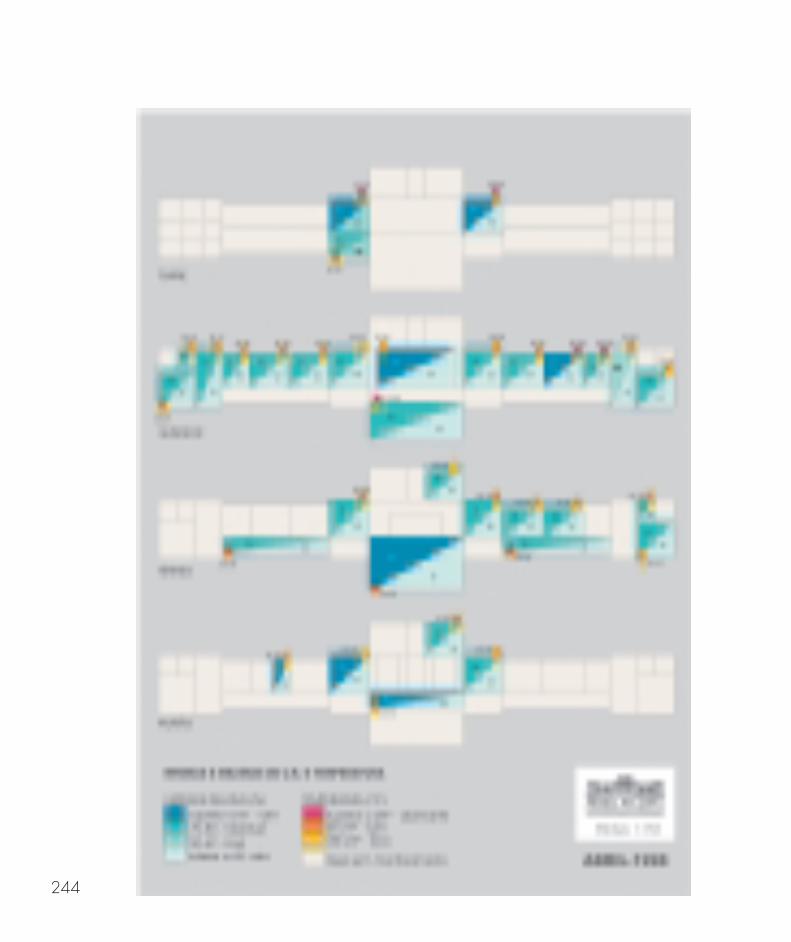
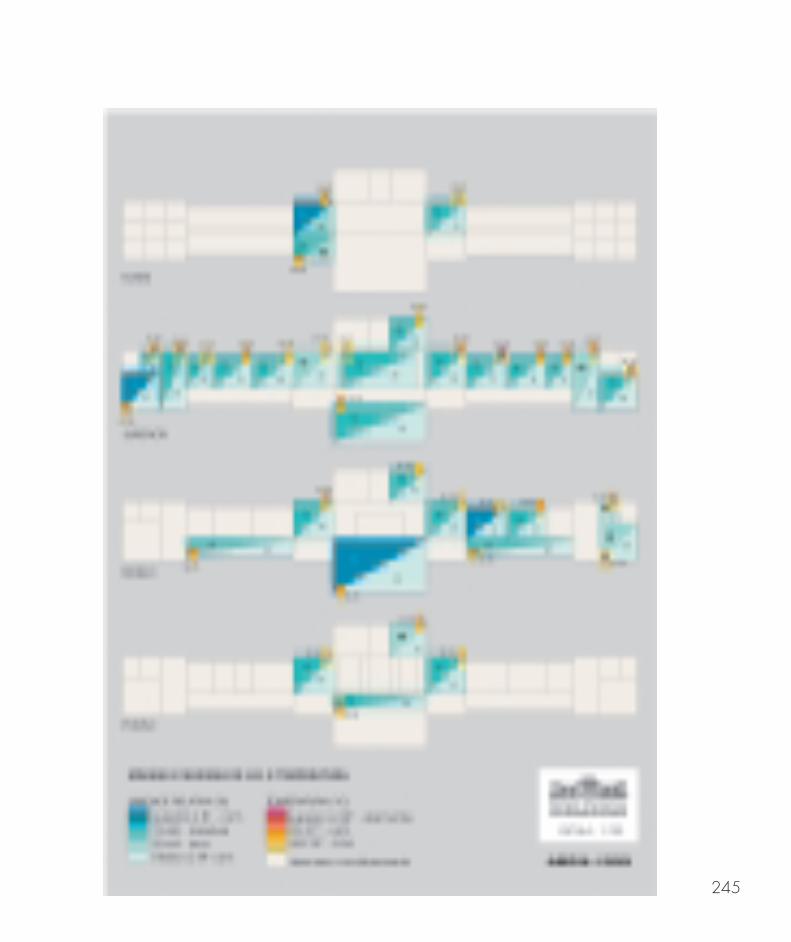
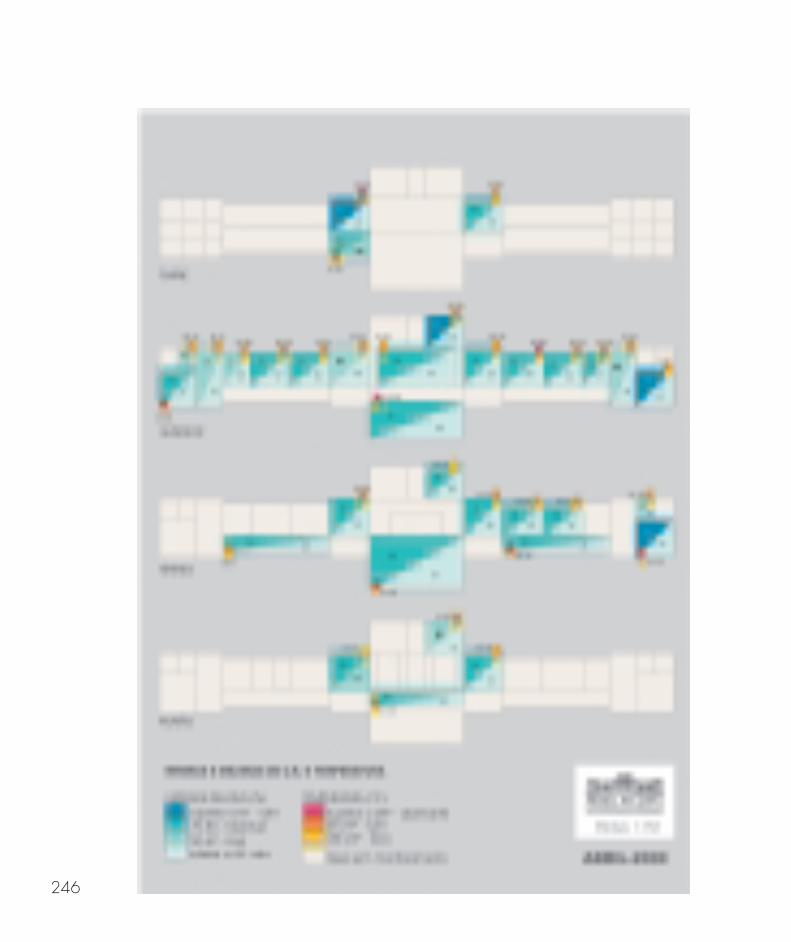
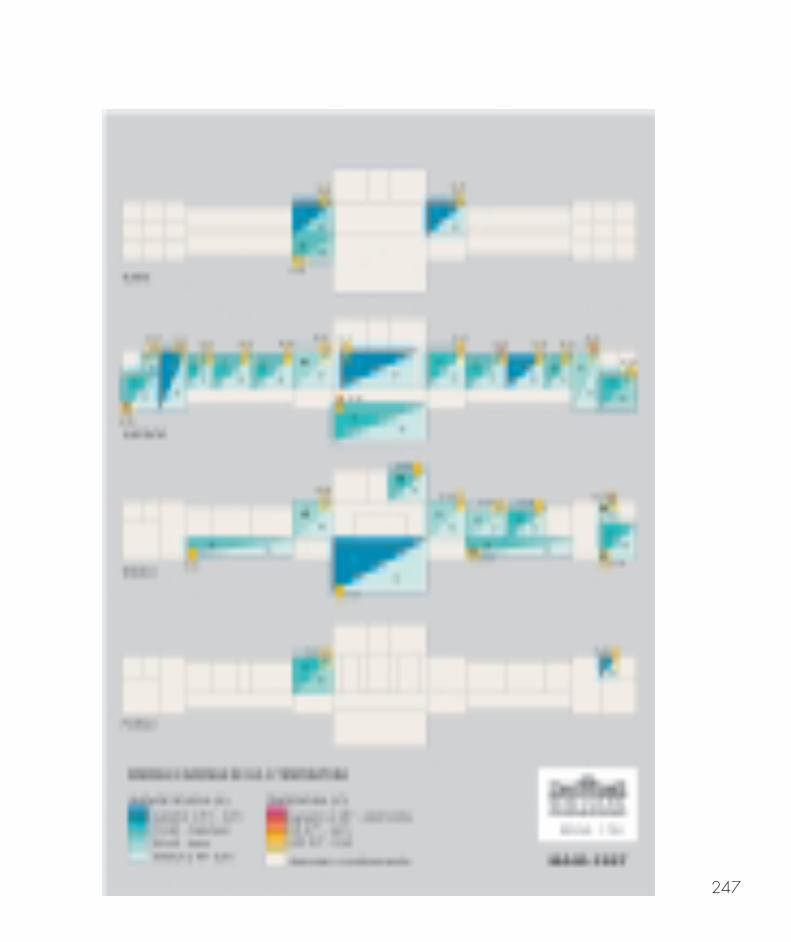
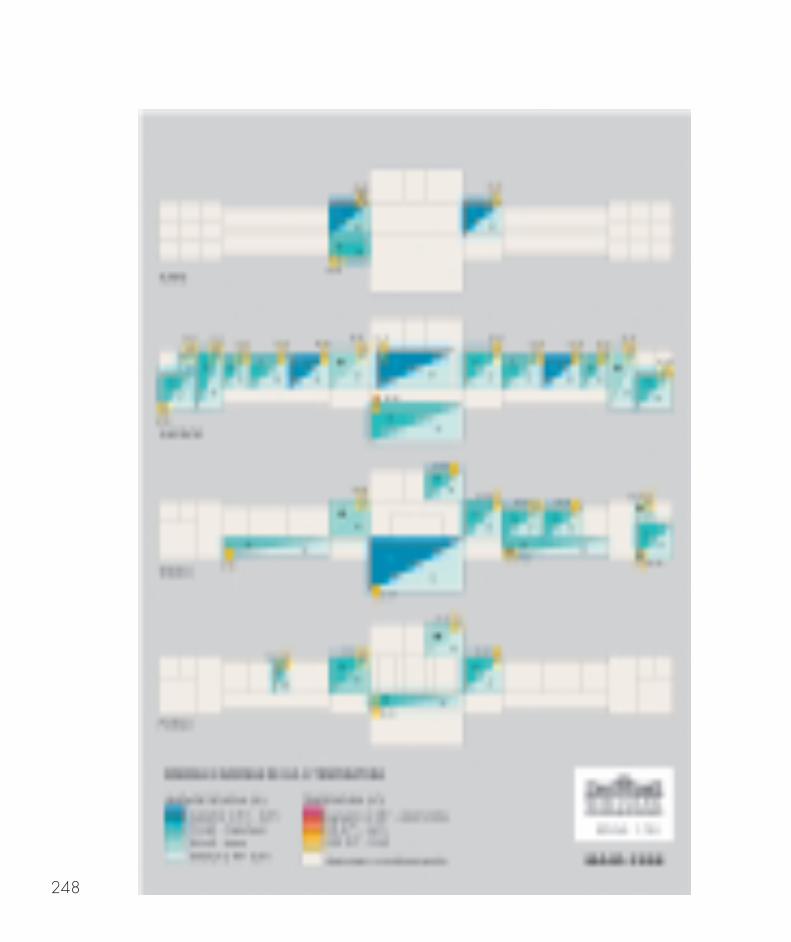
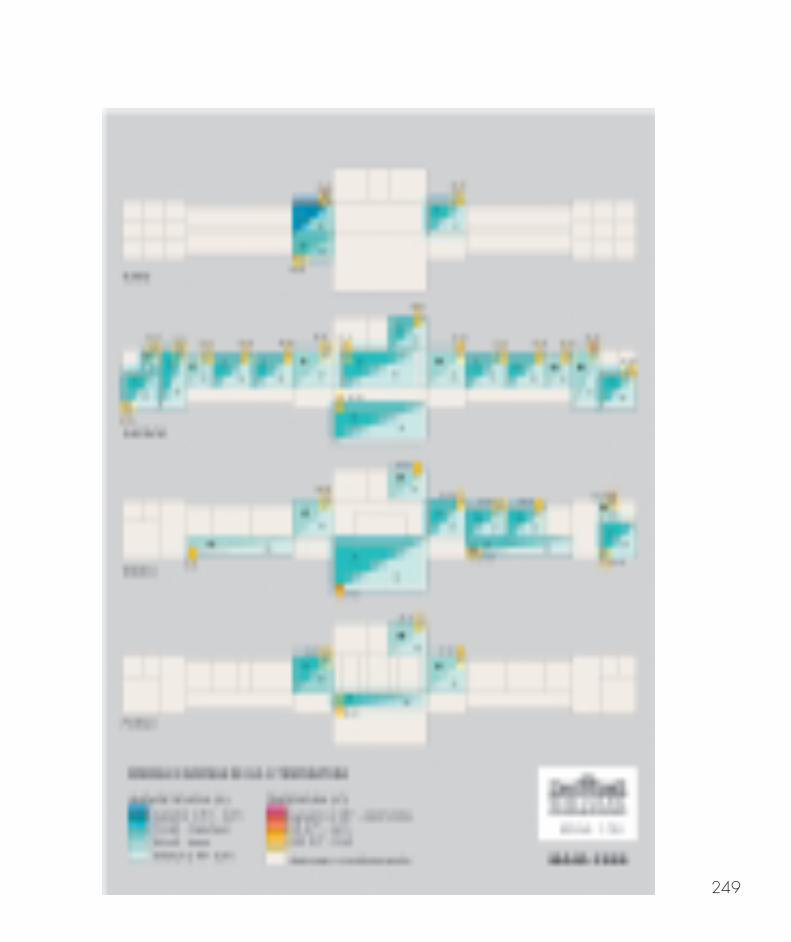
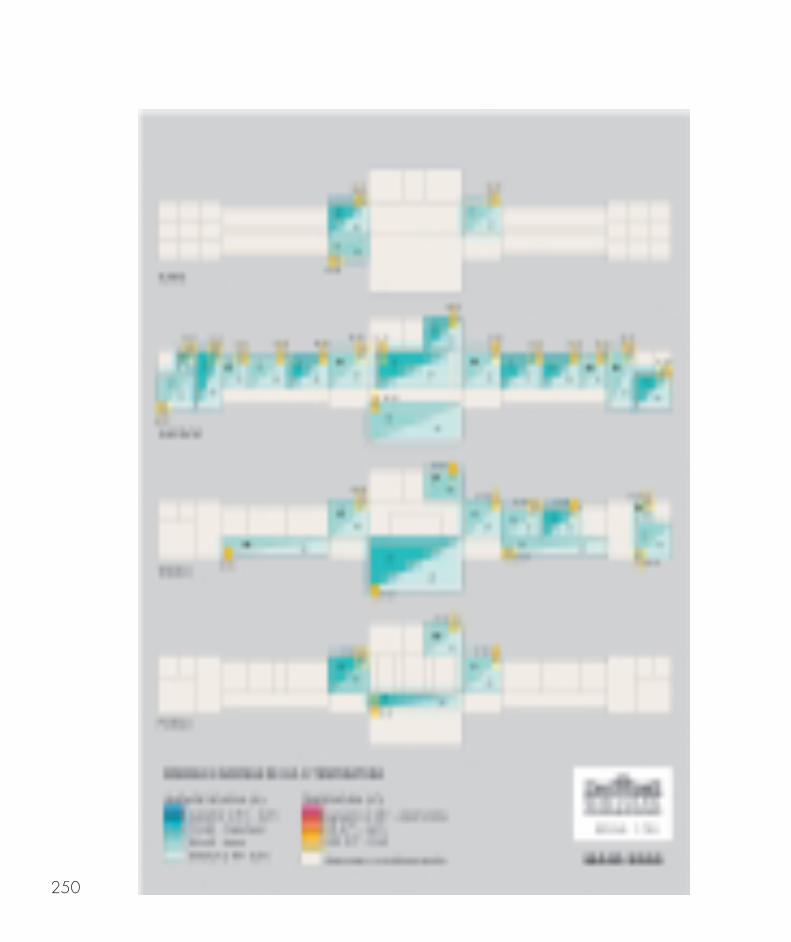
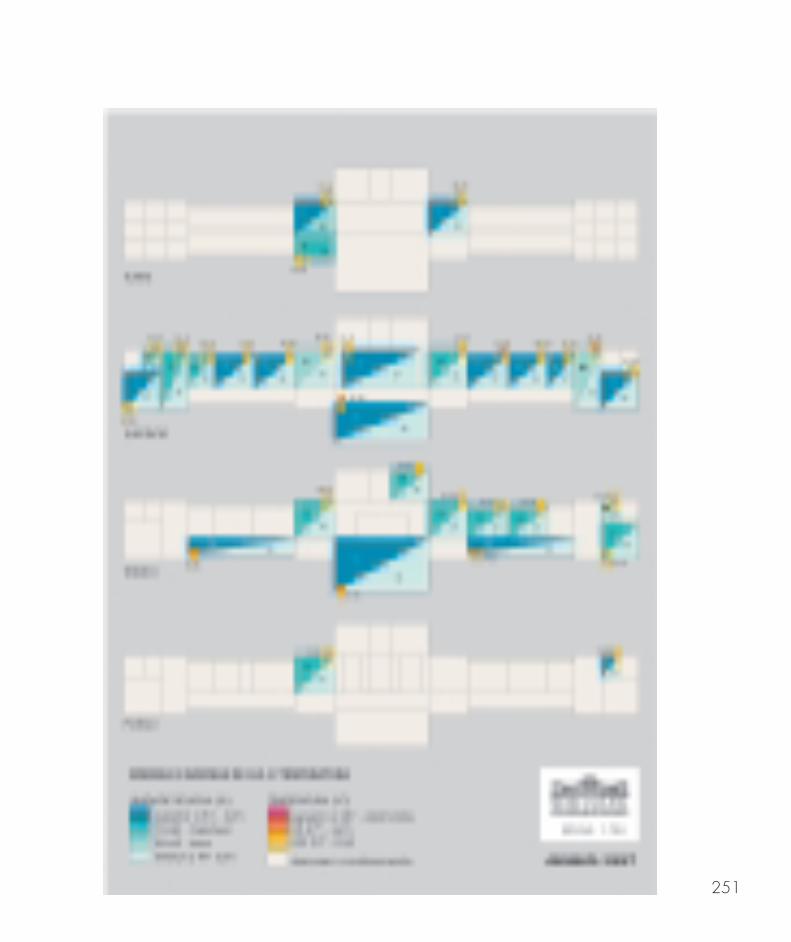
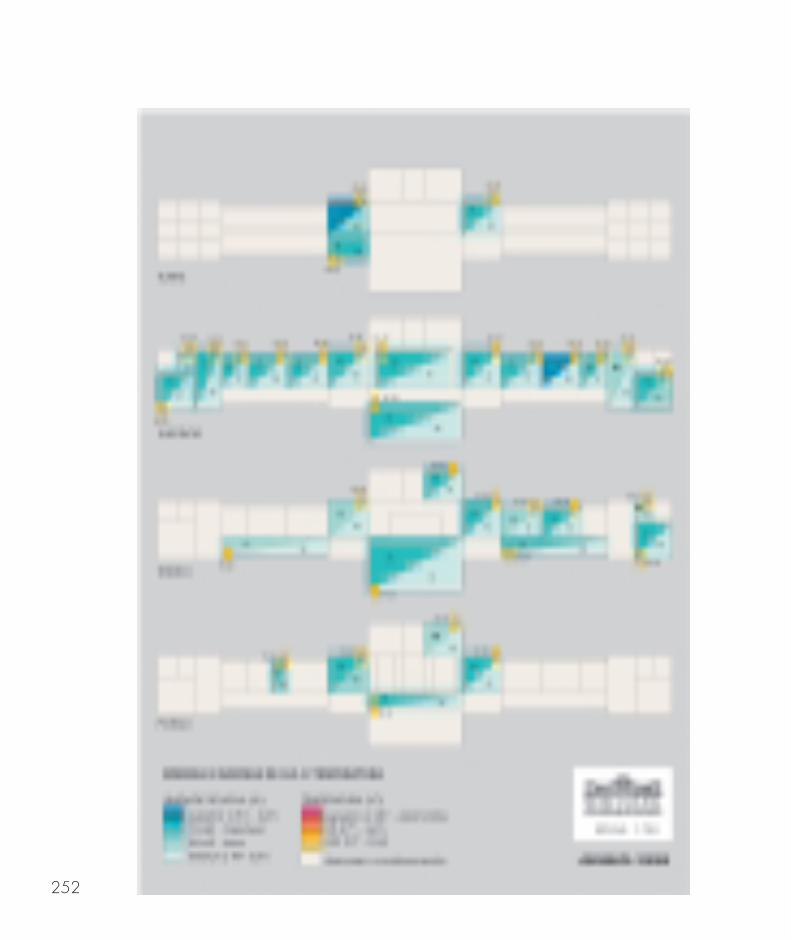
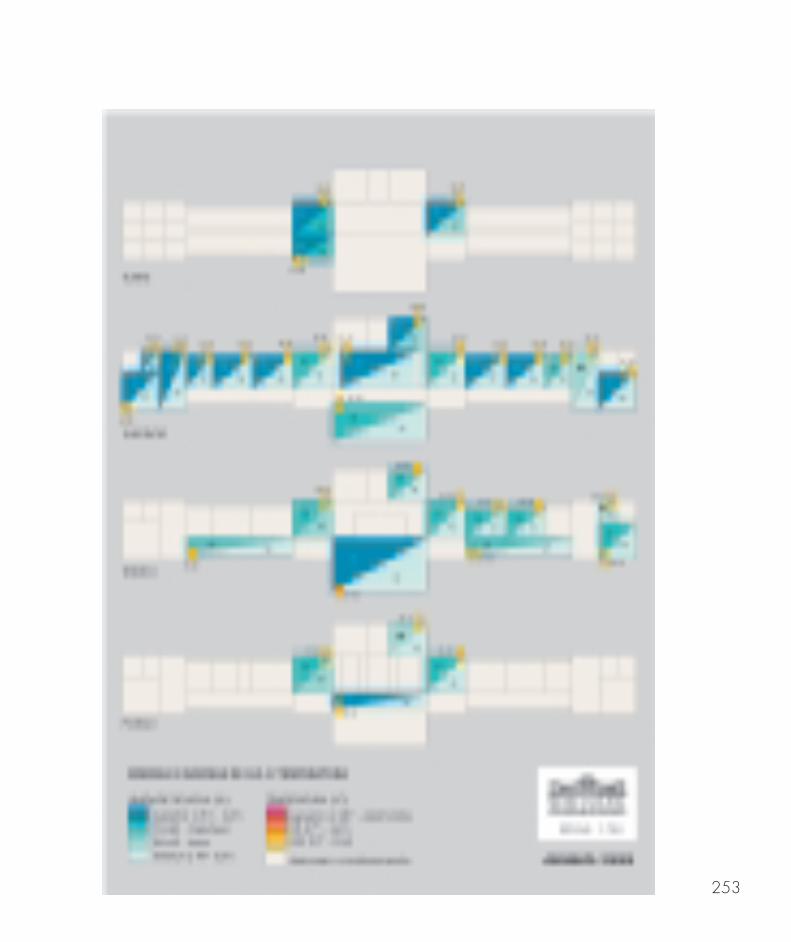
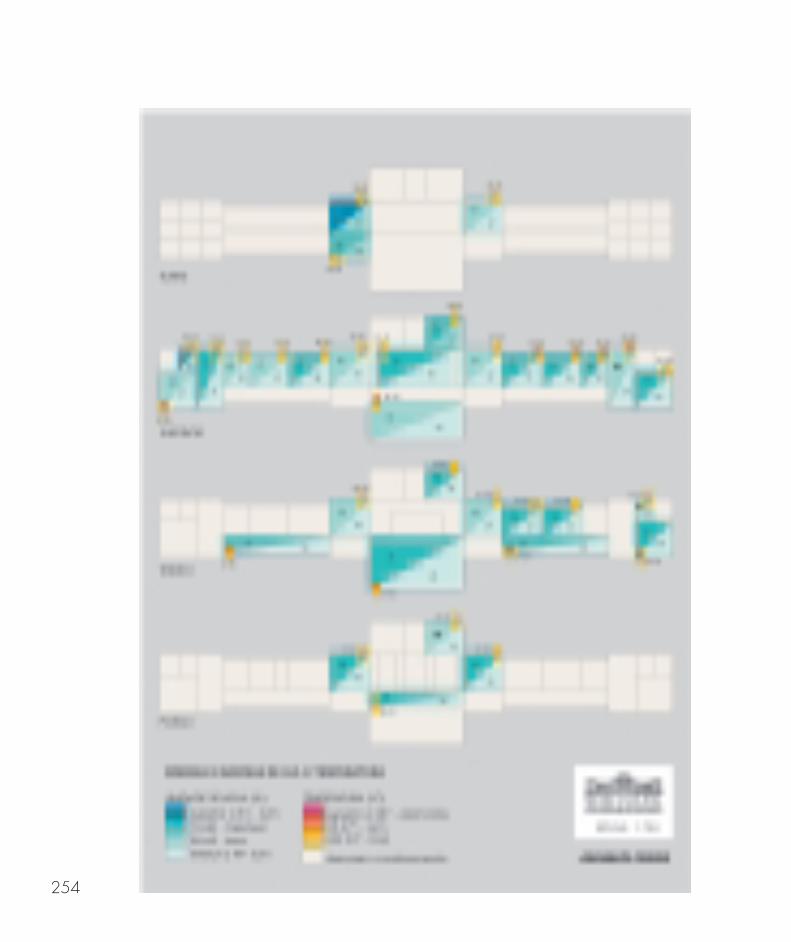
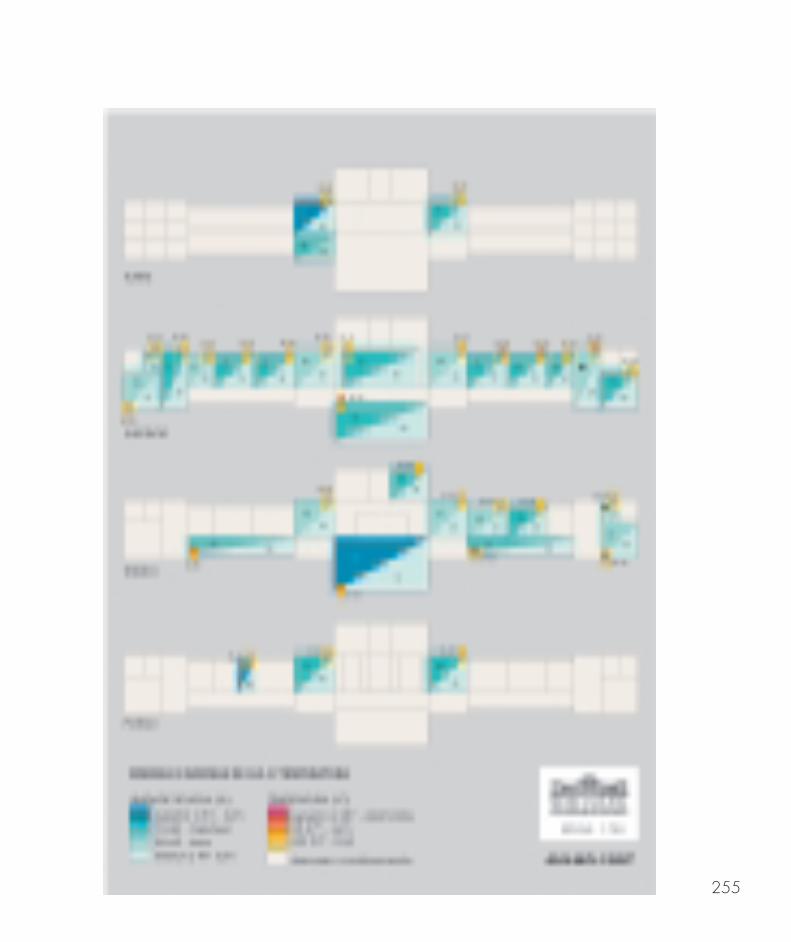
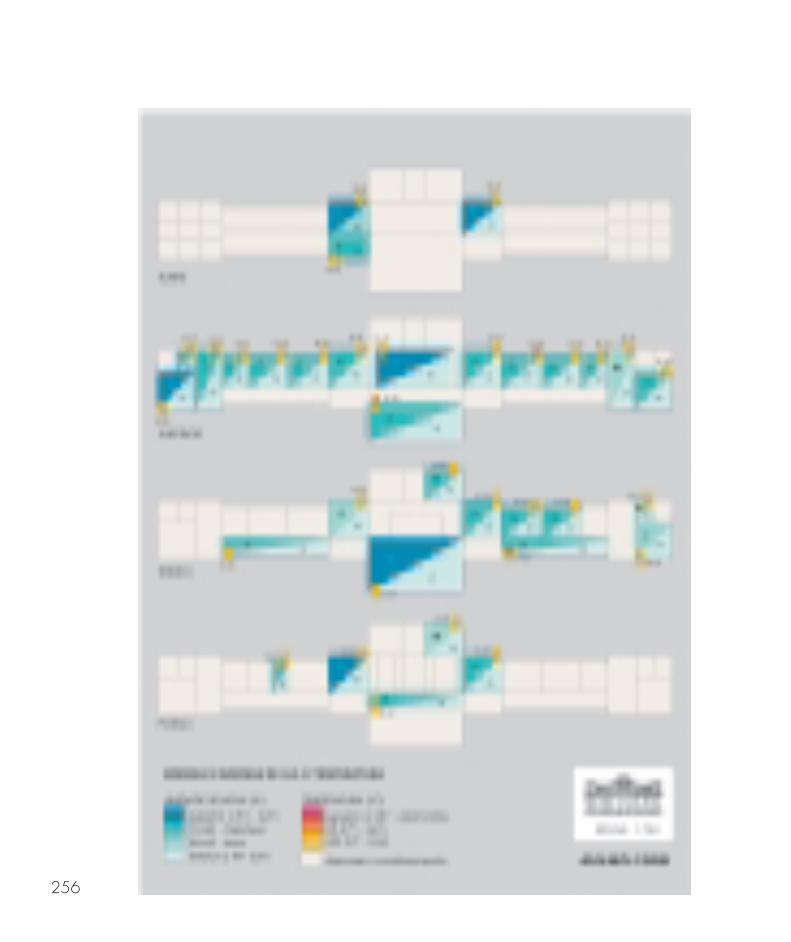
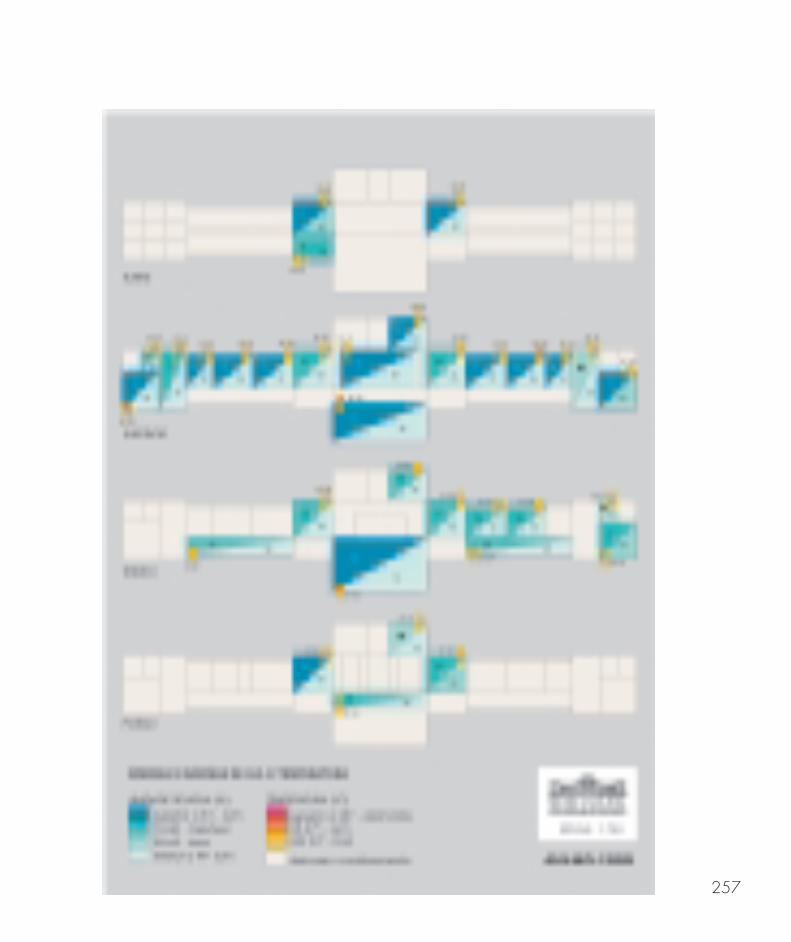
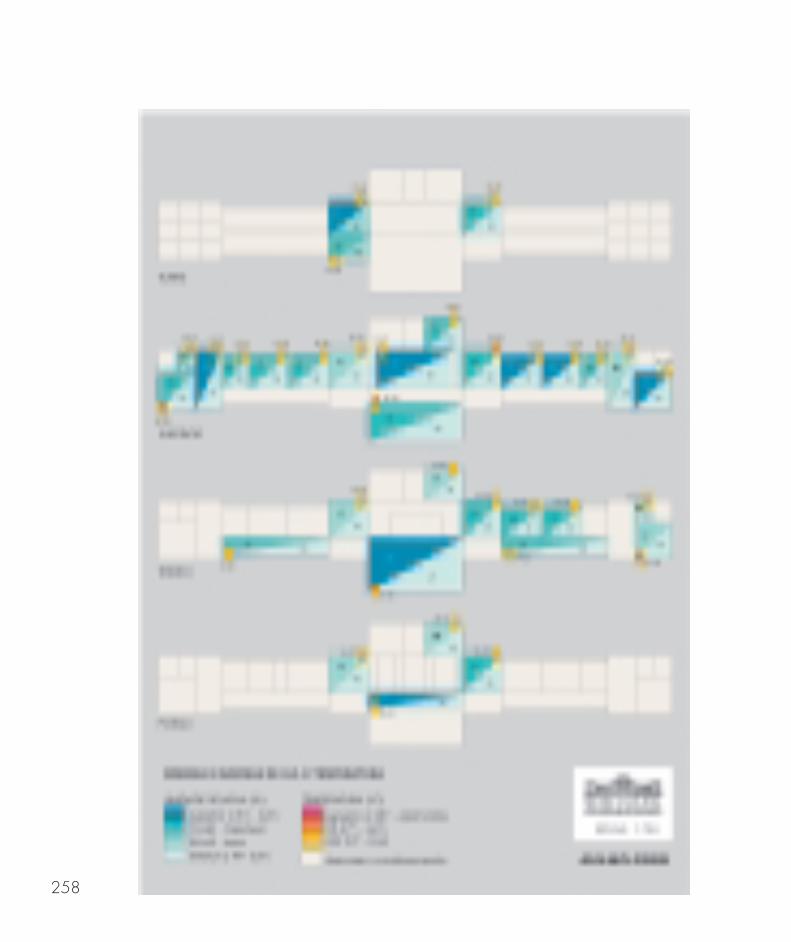
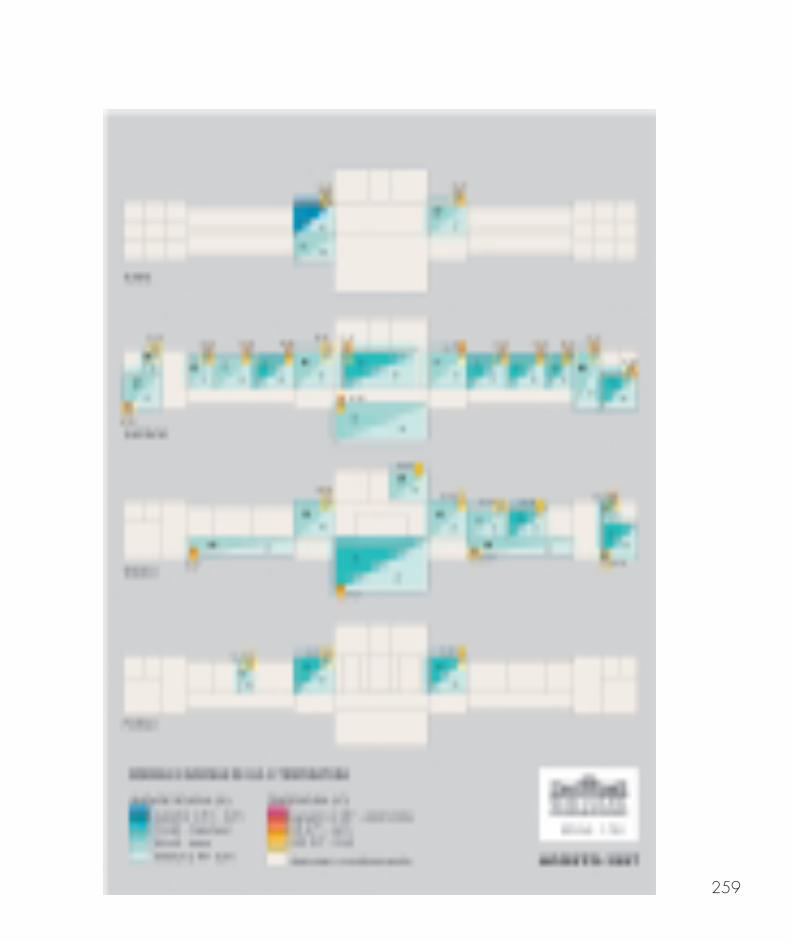
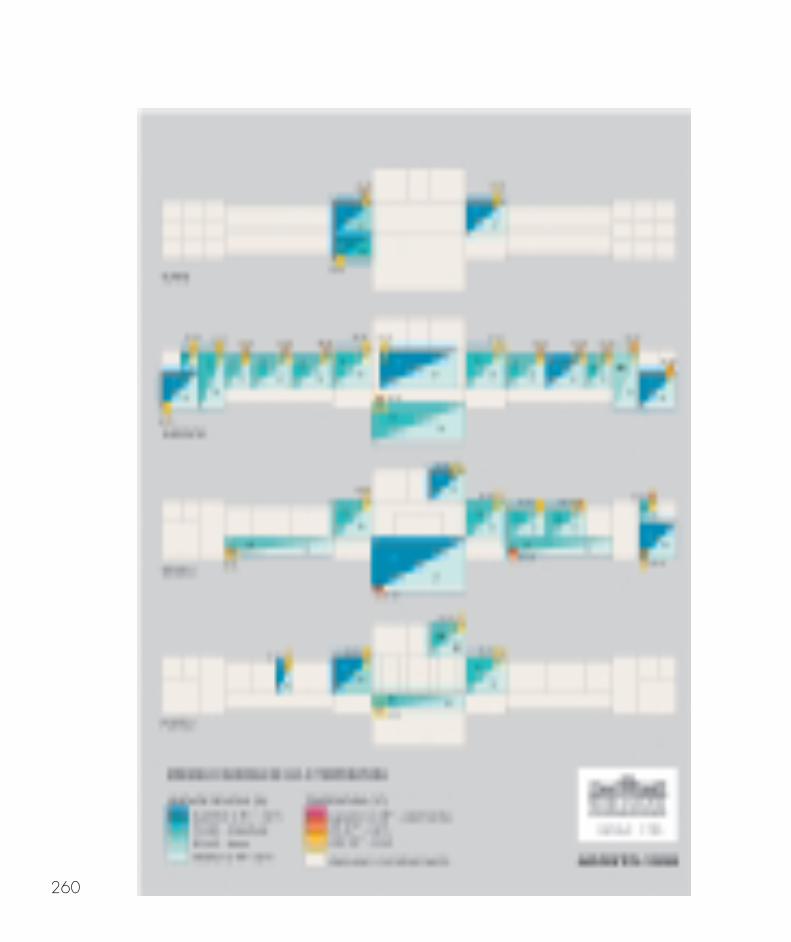
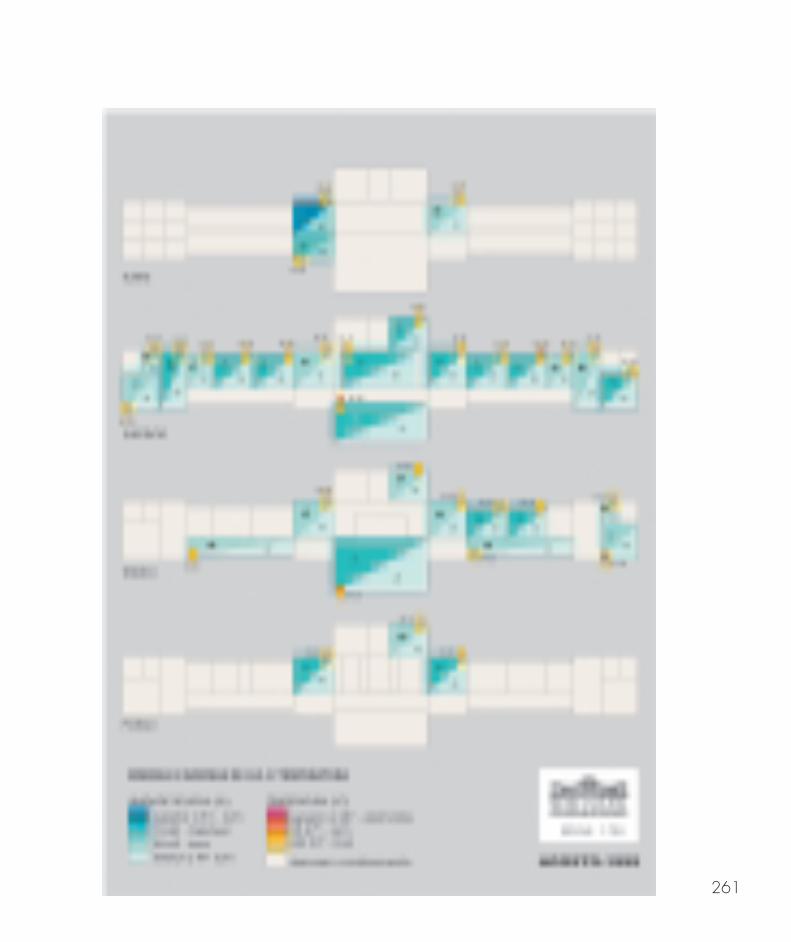
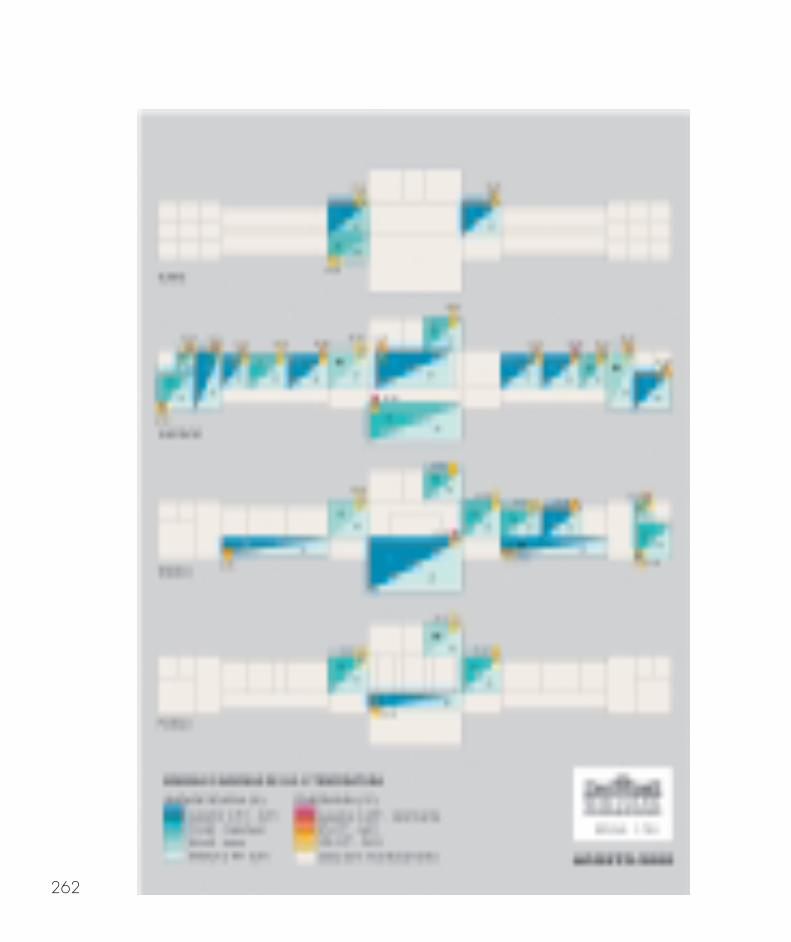
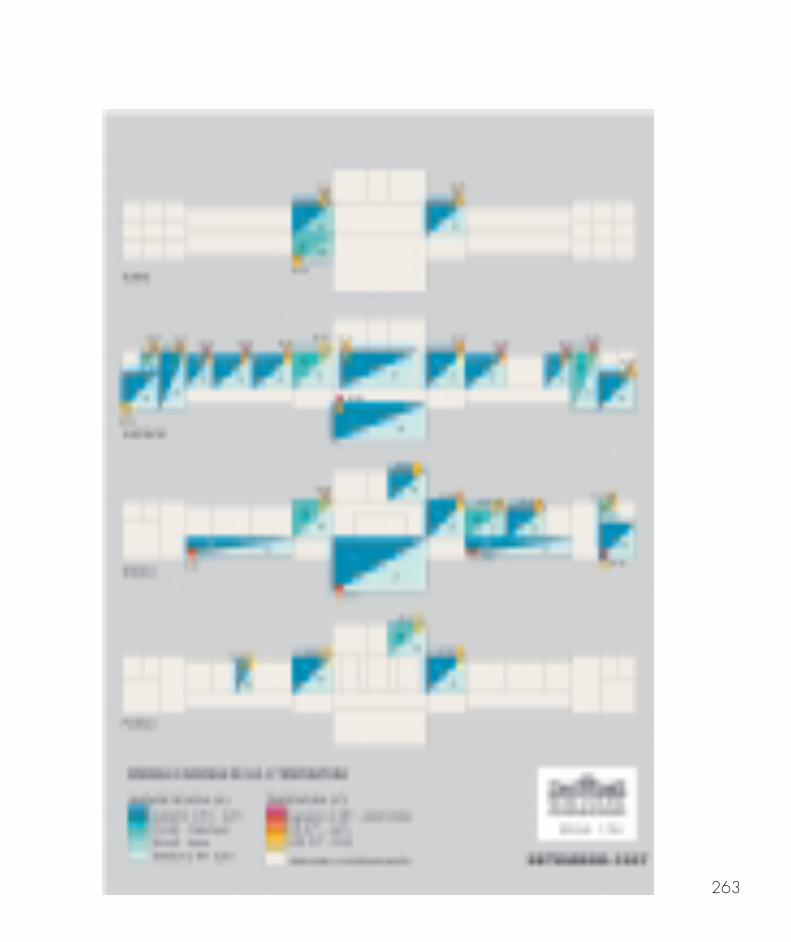
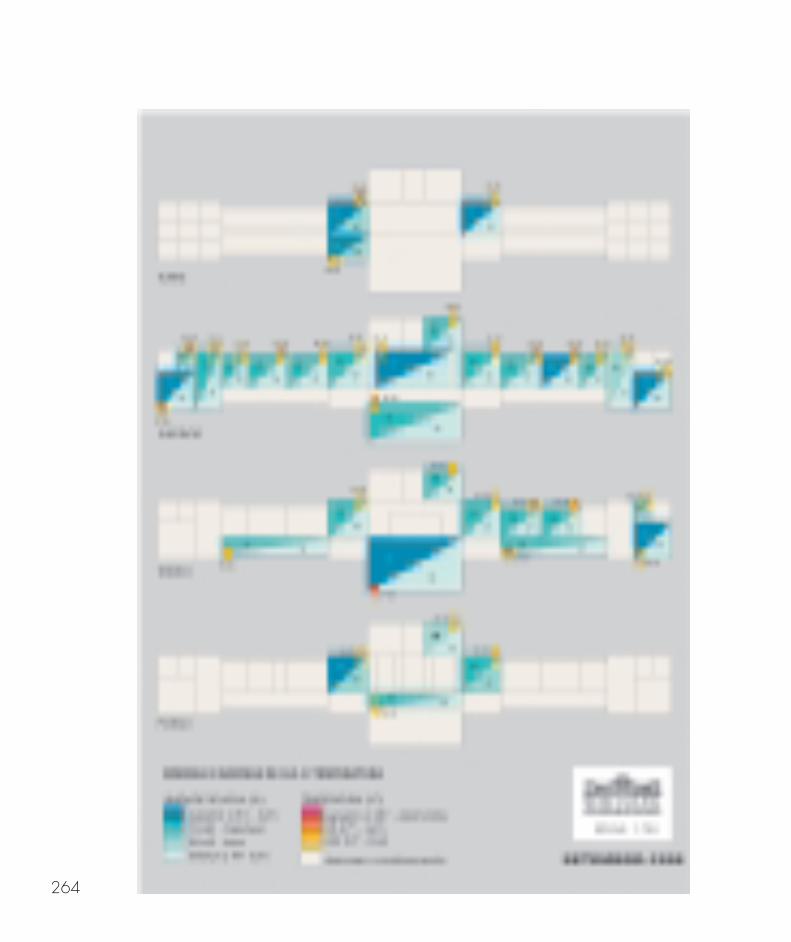
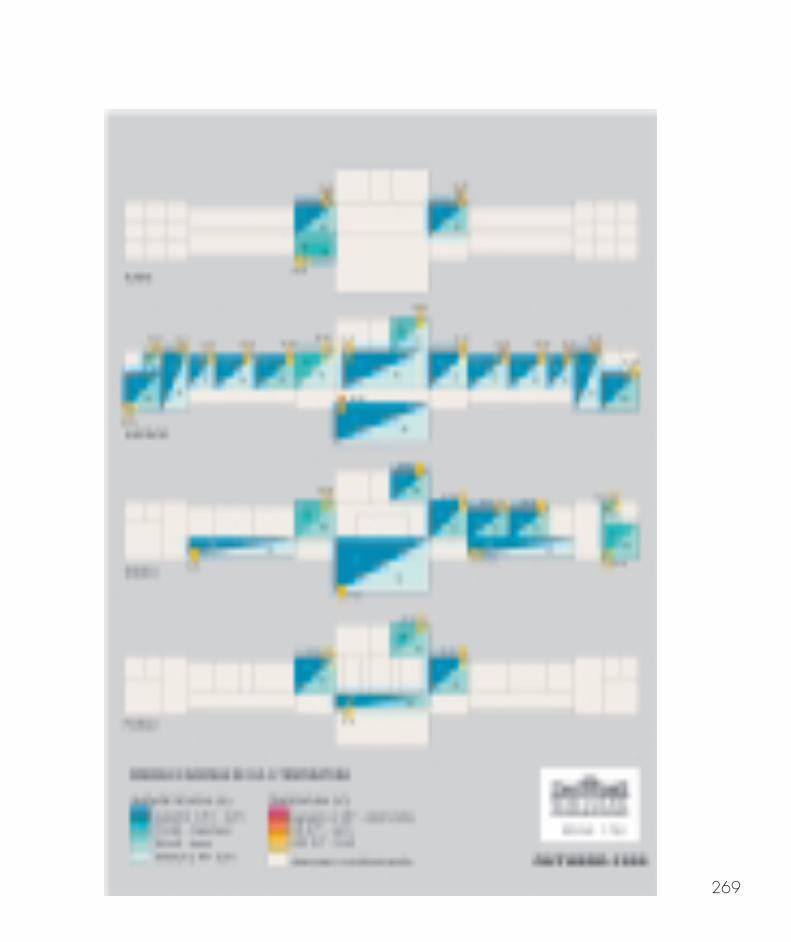
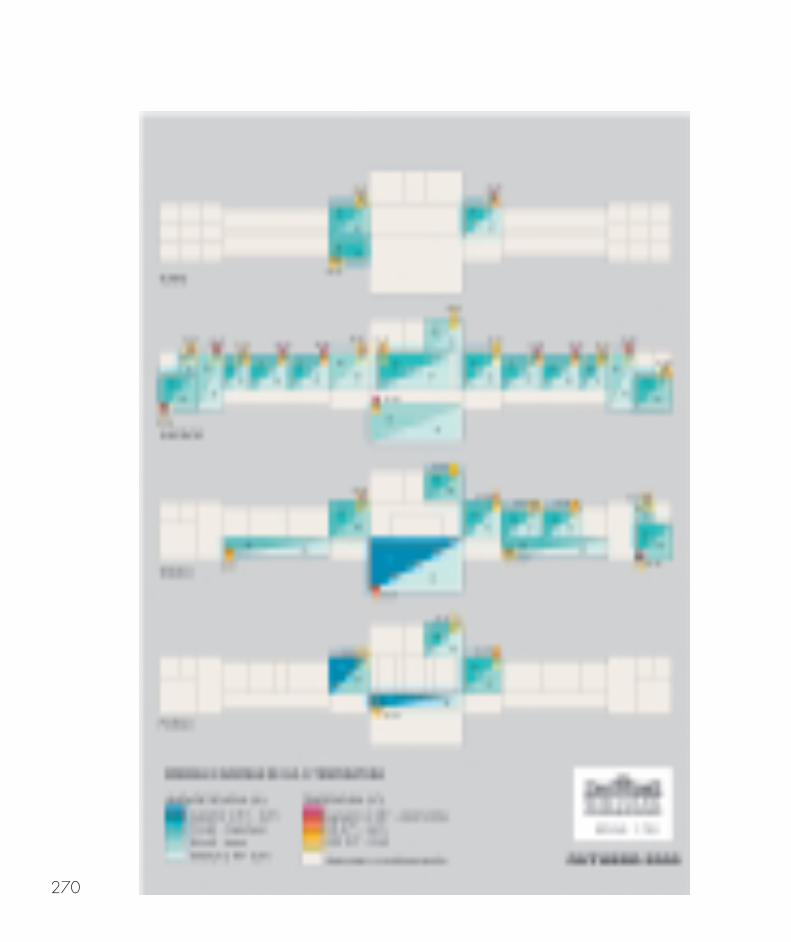
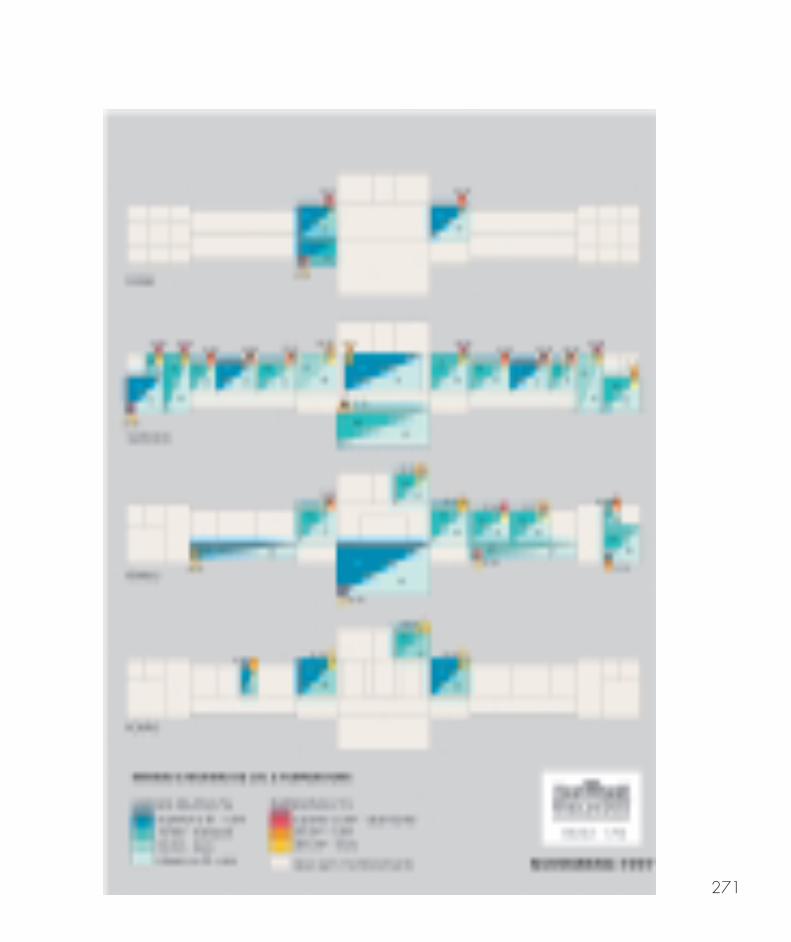
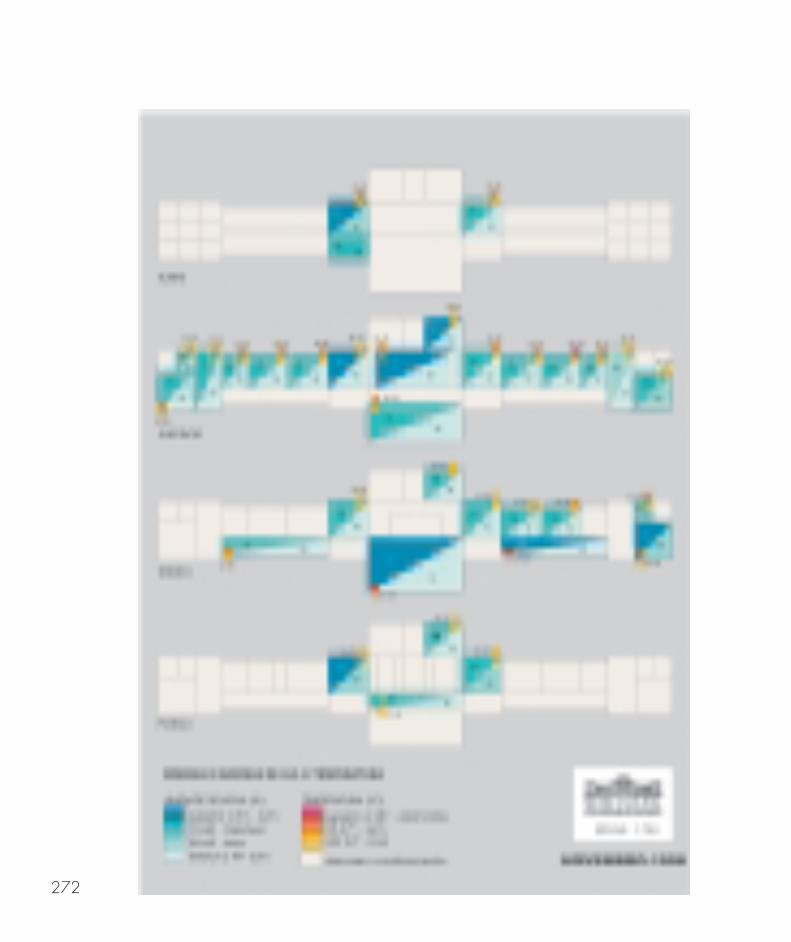
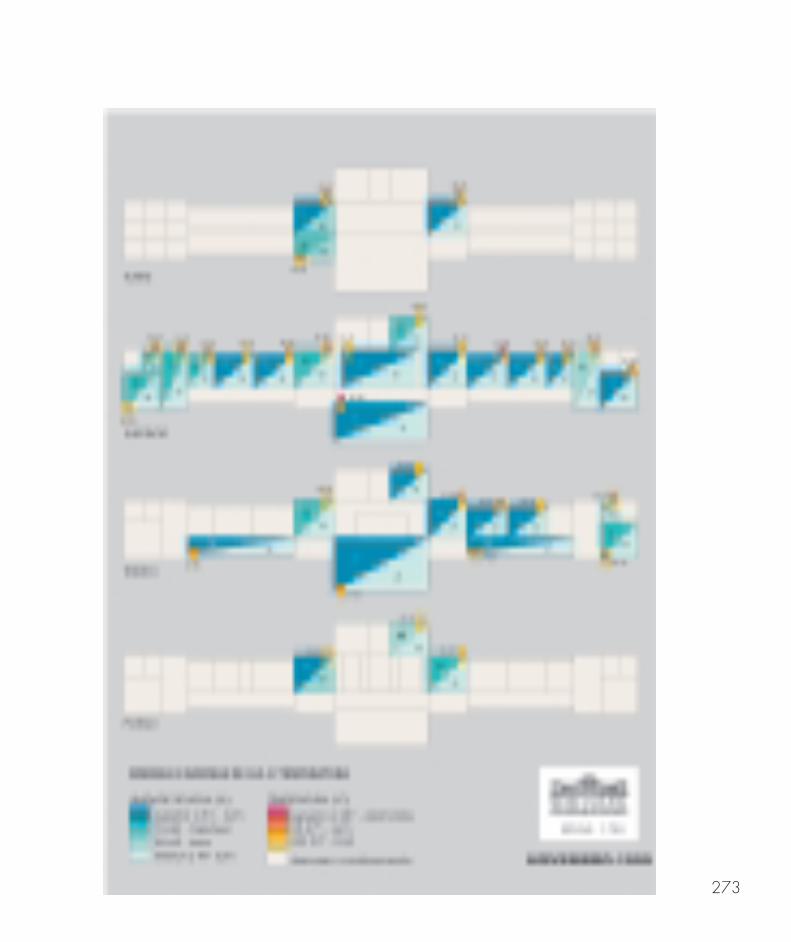
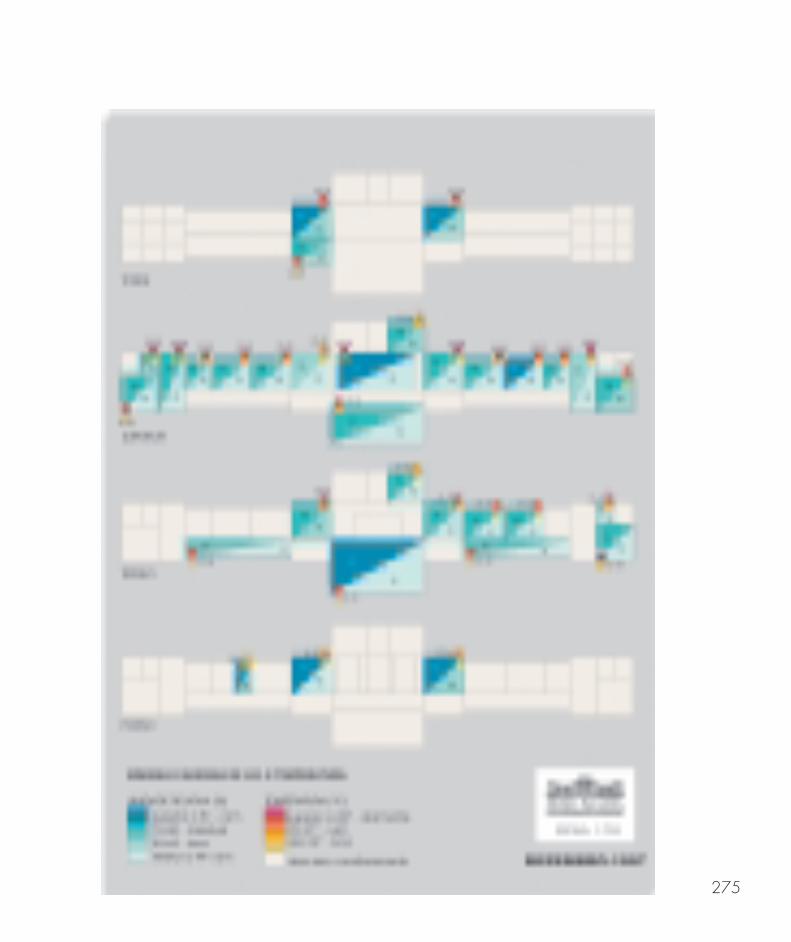
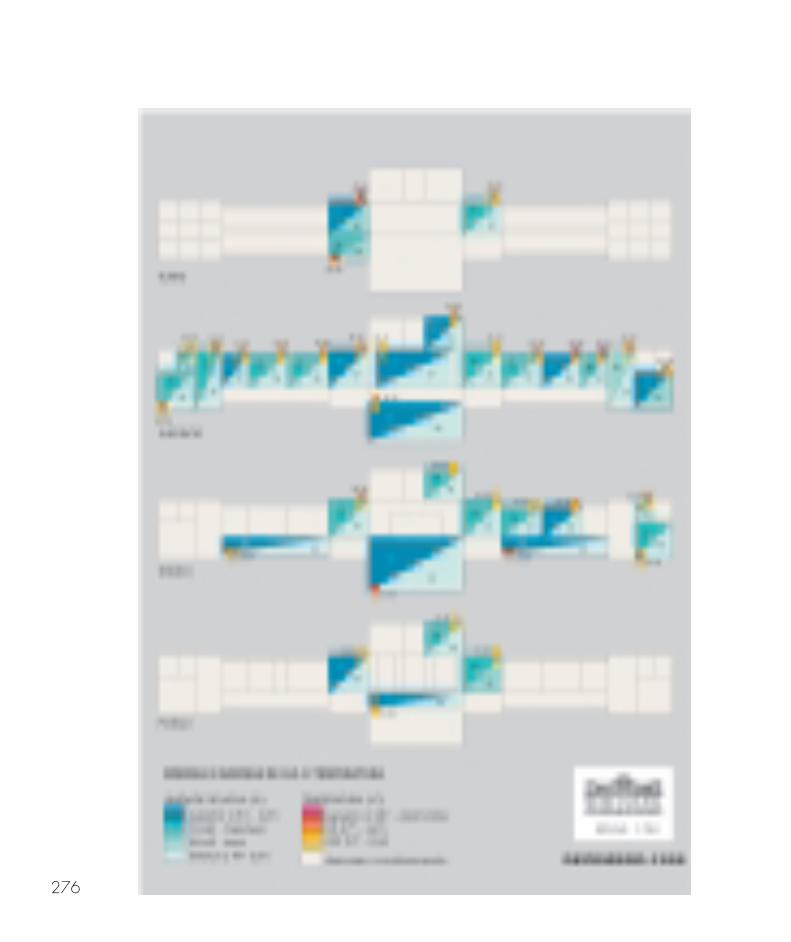
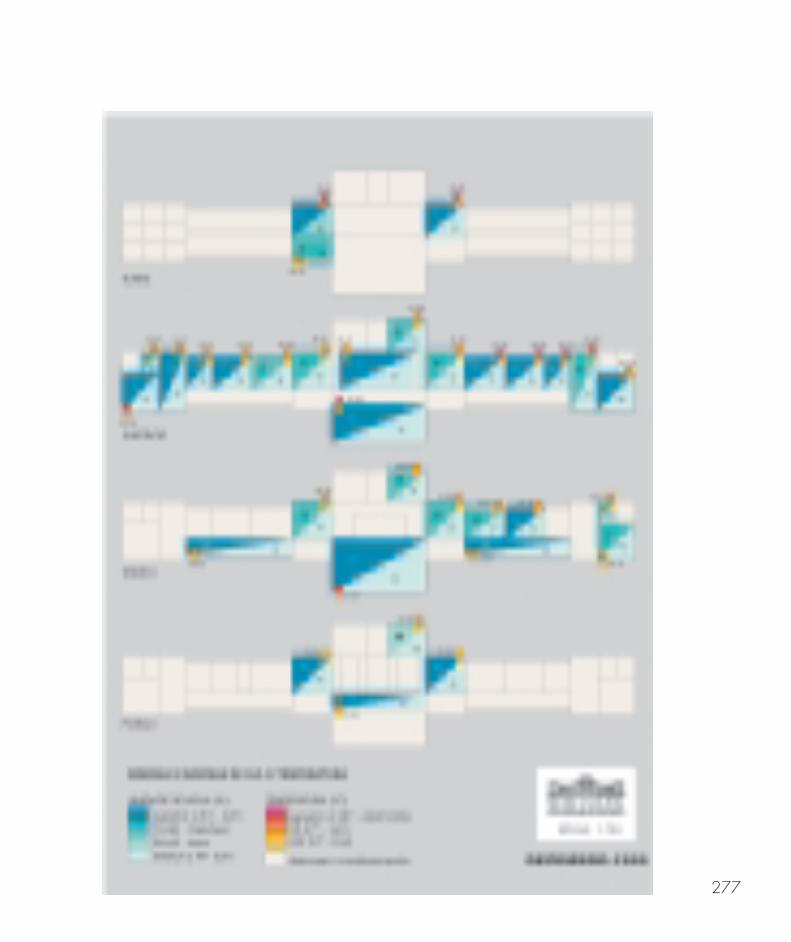
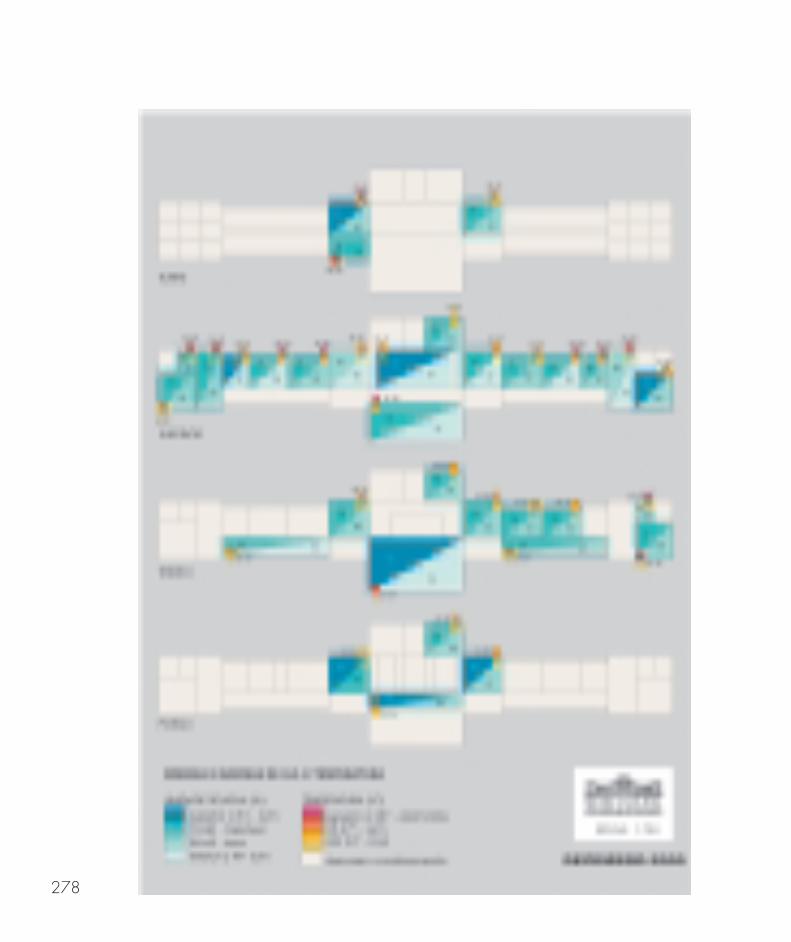
To make all the records easily comprehensible to the museum staff,environmental plans were created. Adapting the museum plans and basing thework on geography, physics and architectural patterns, the environmental plans(plantas temáticas) were developed with the use of a CorelDRAW 9® program.The main criterion used to design the plans was the staff’s comprehension. It wascrucial that the plans could be easily assimilated and used without the assistancefrom a conservator.
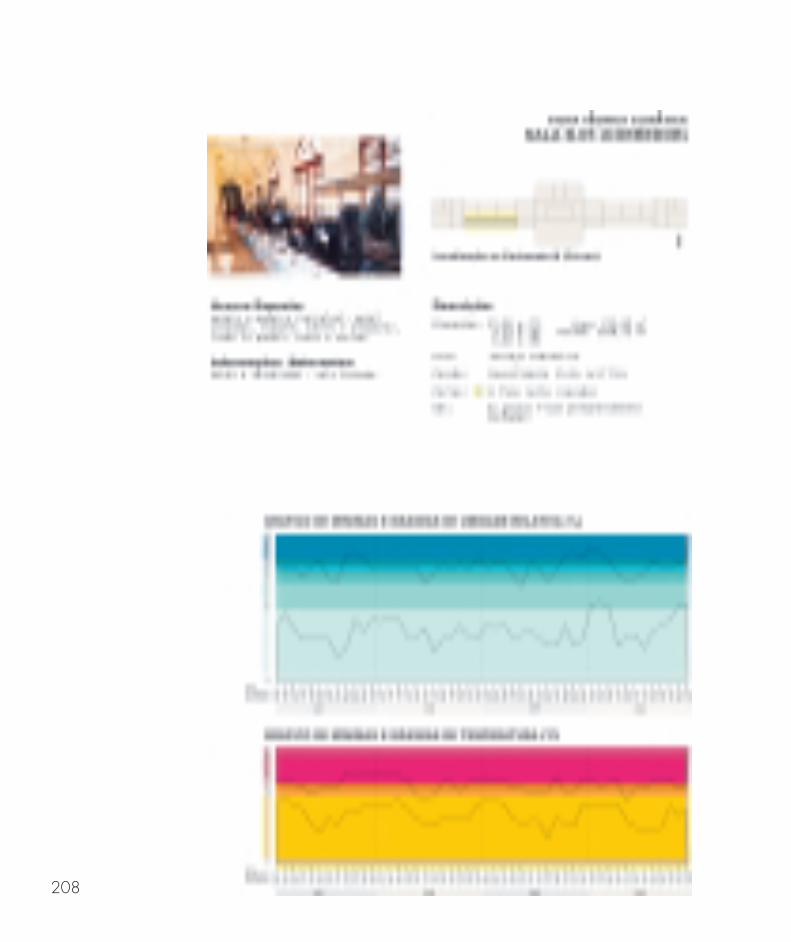
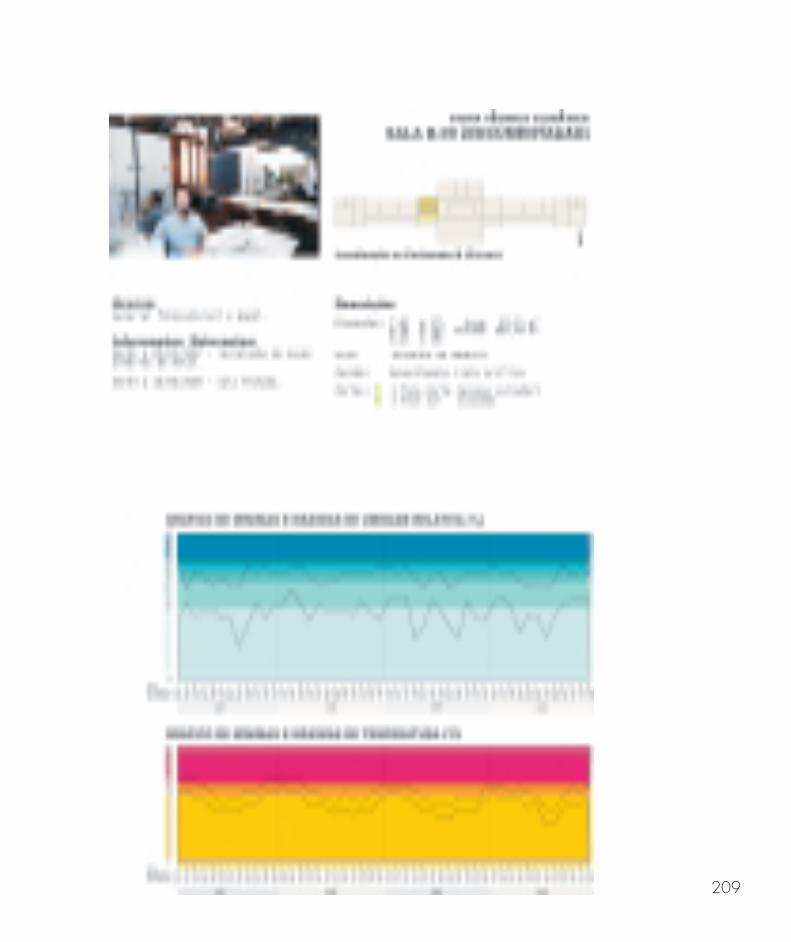
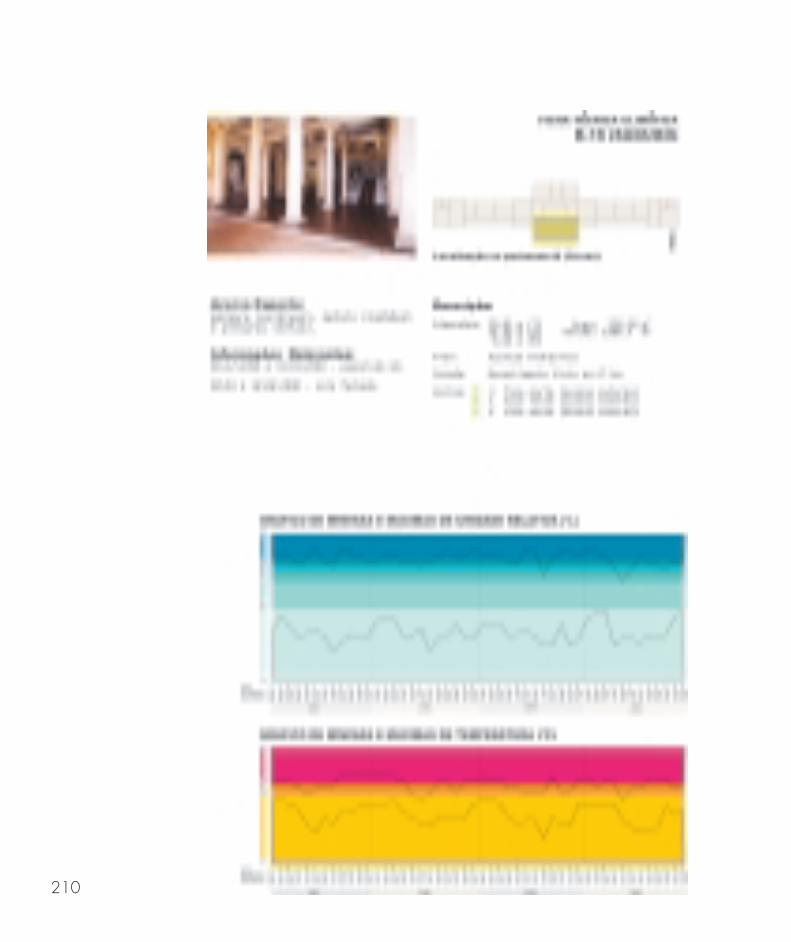
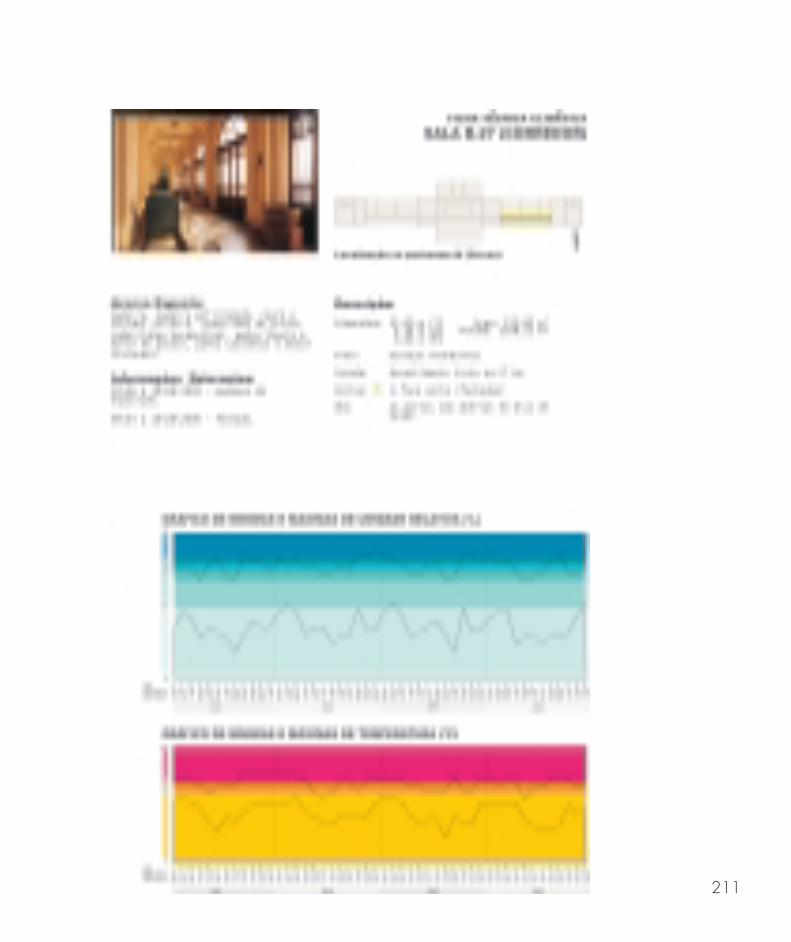
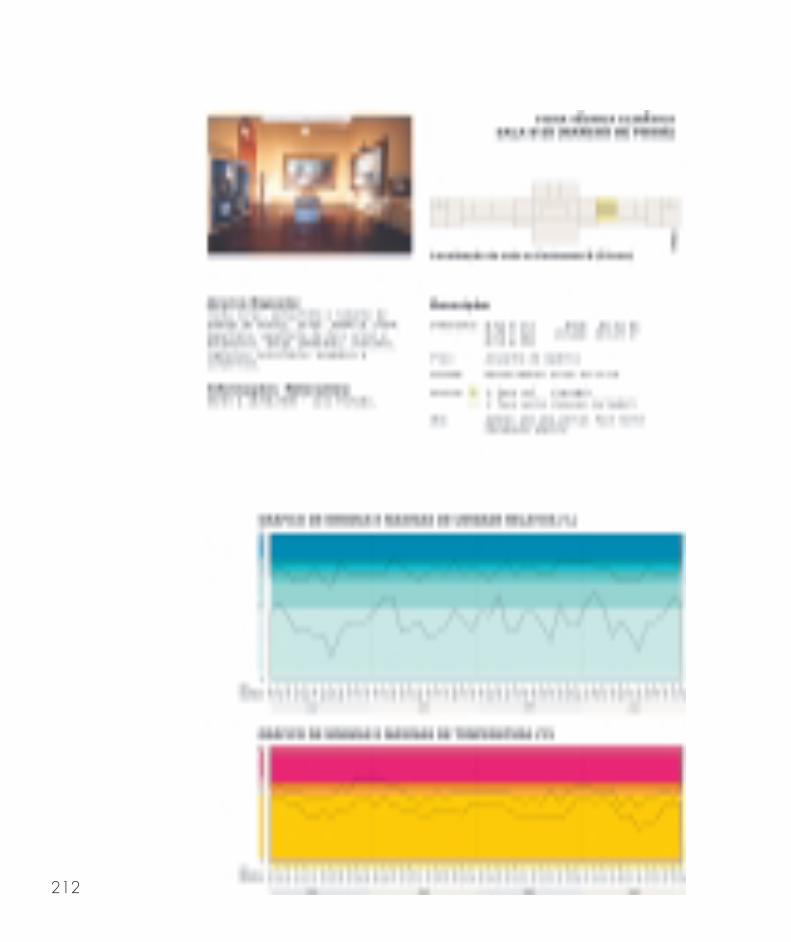
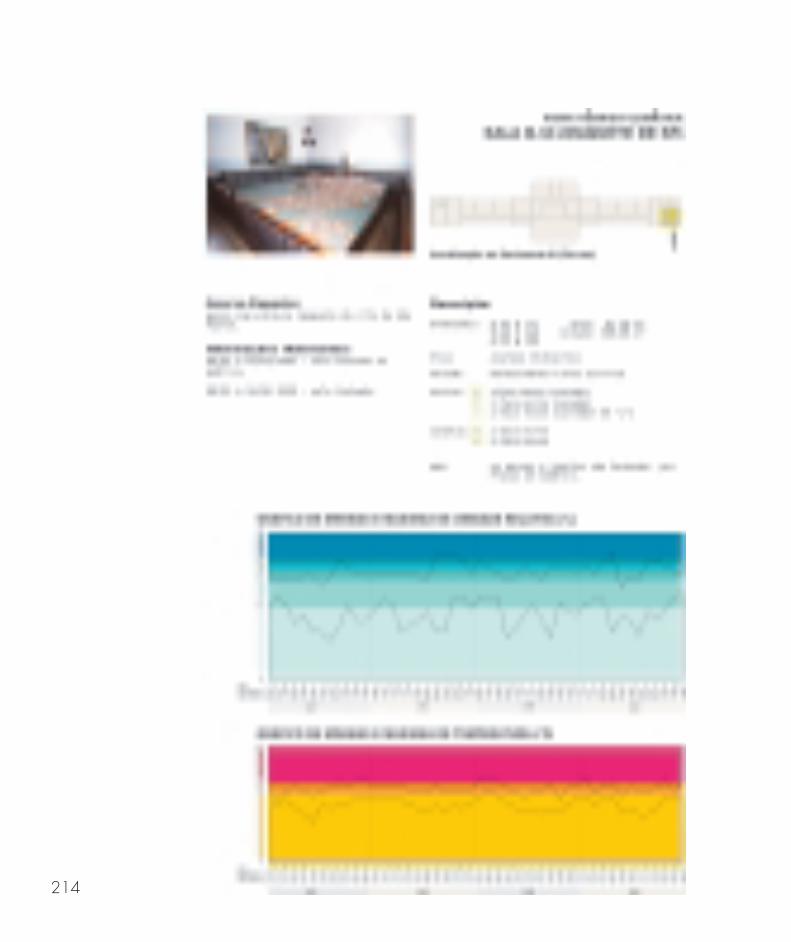
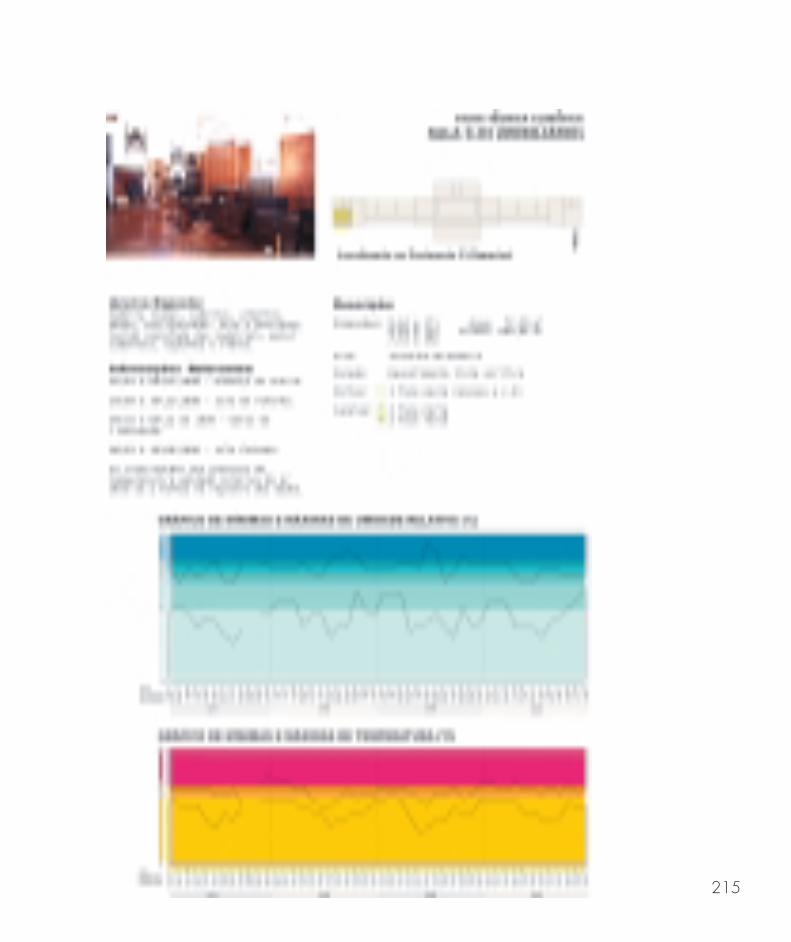
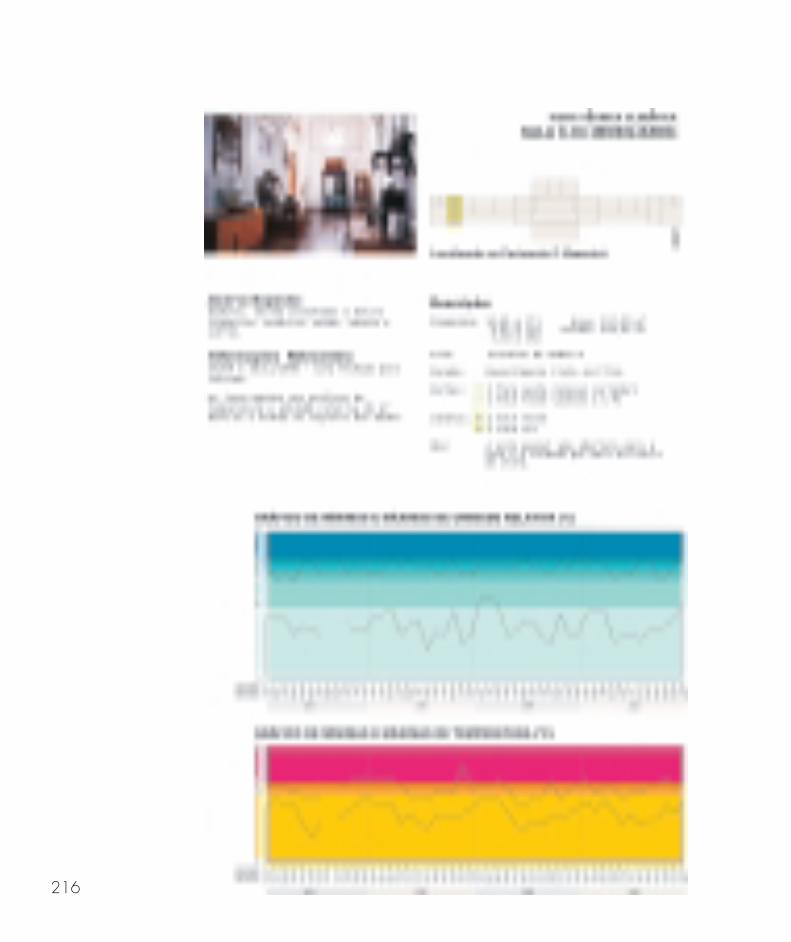
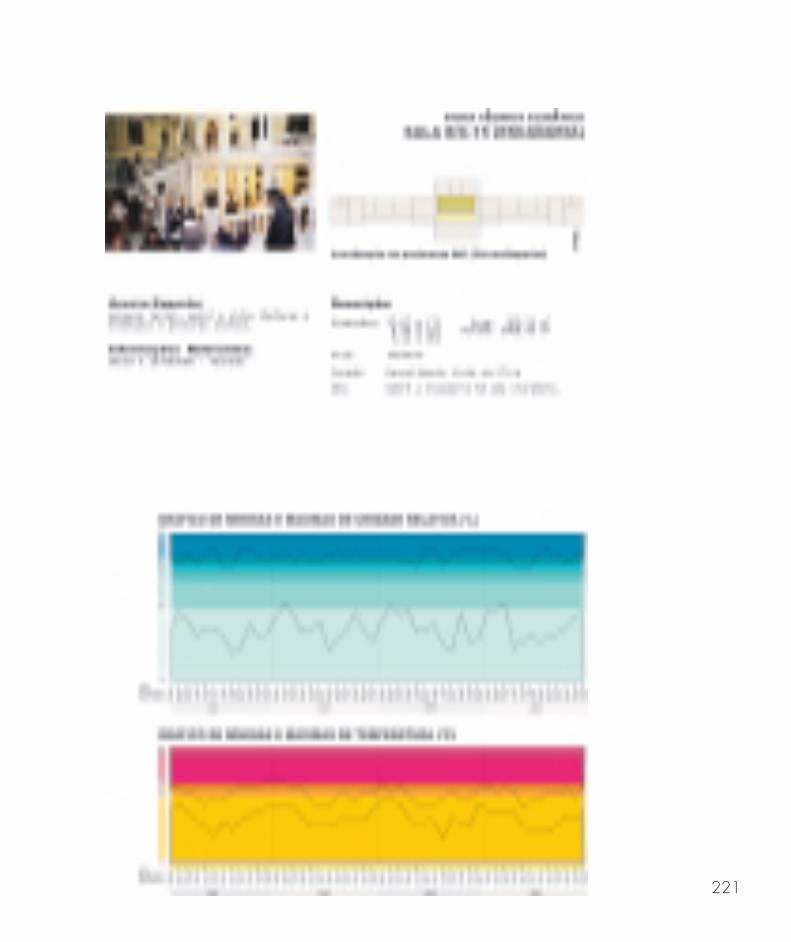
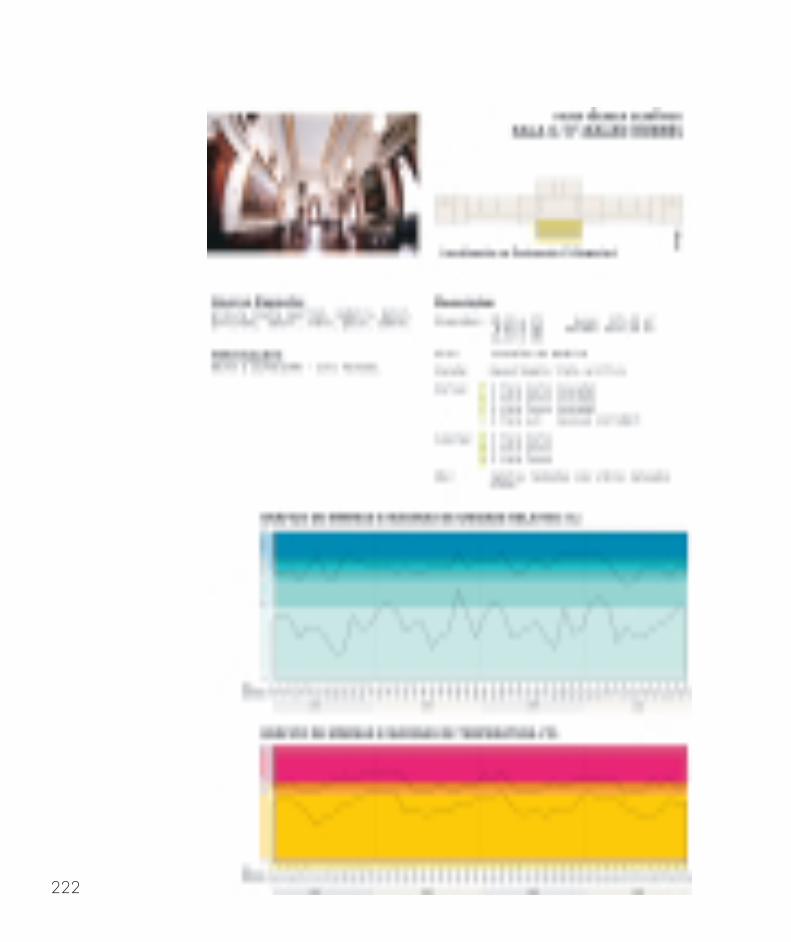
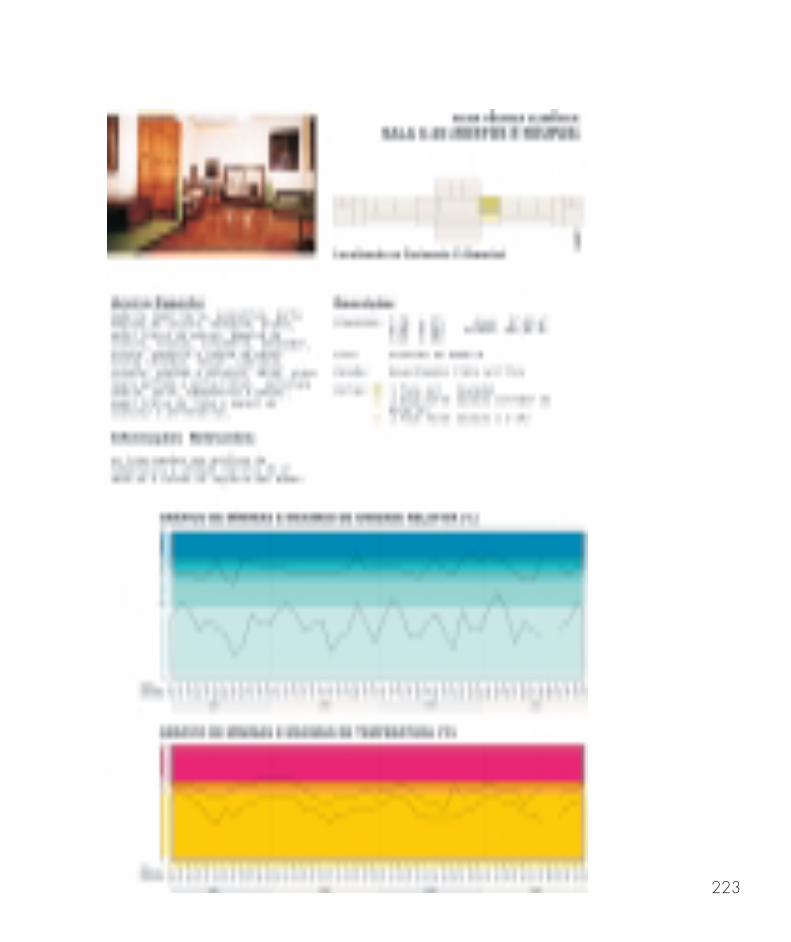
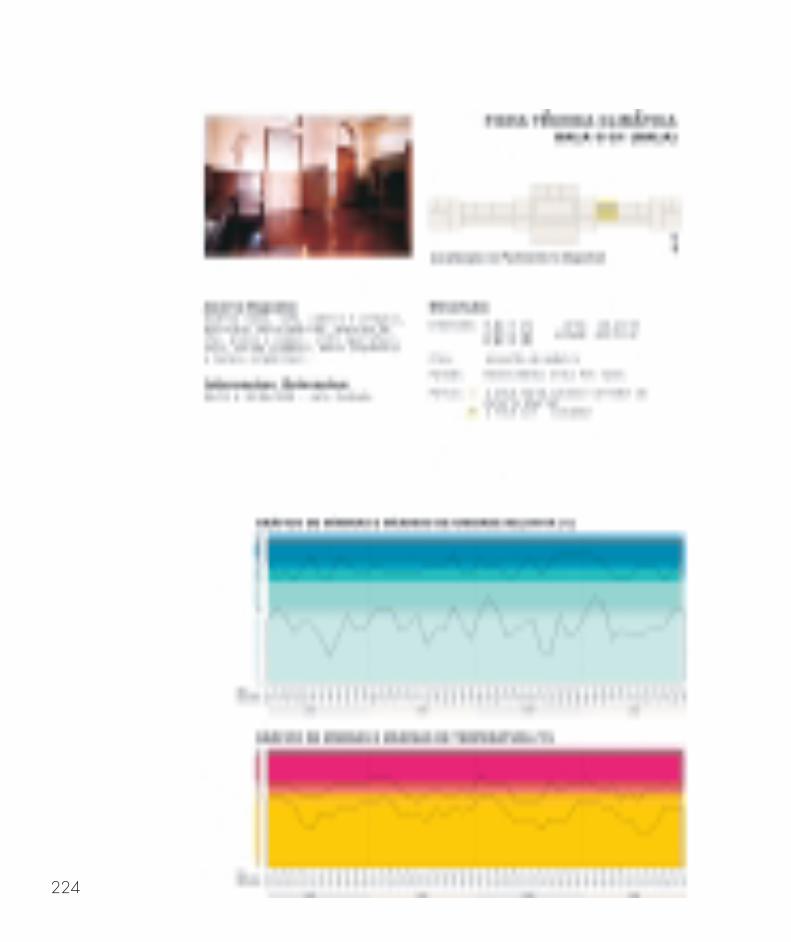
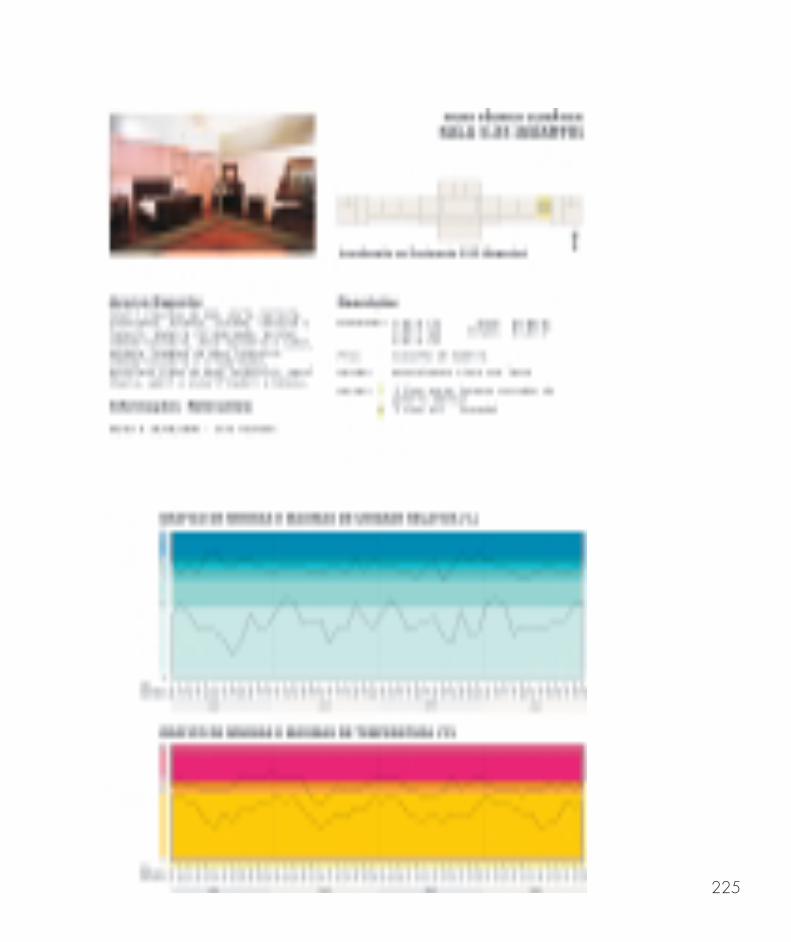
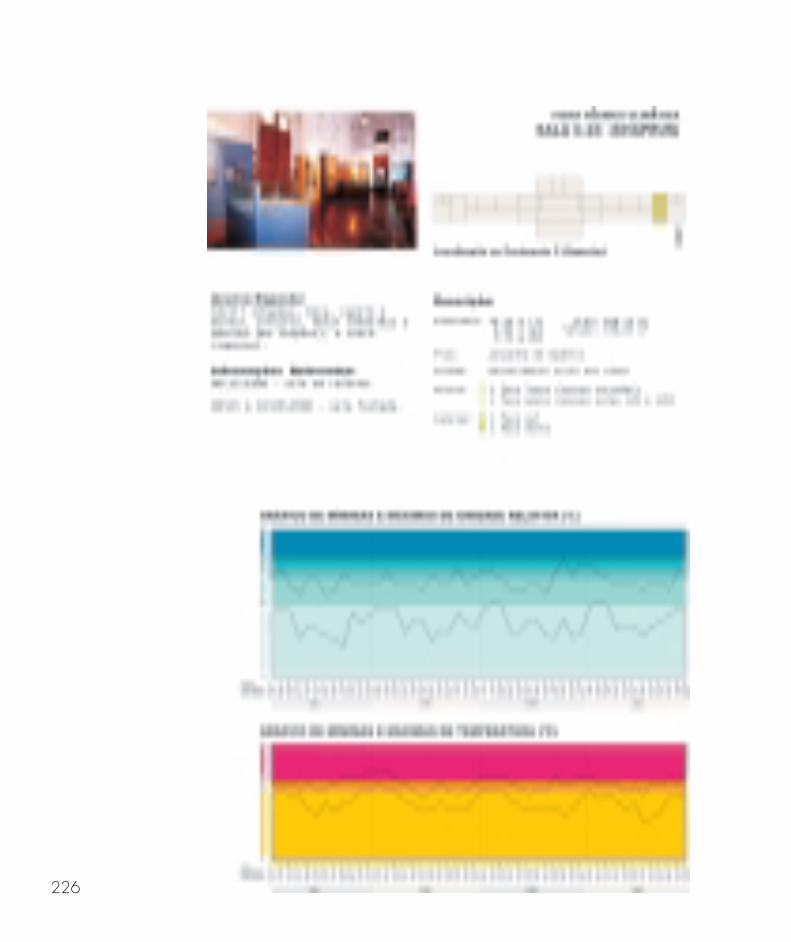
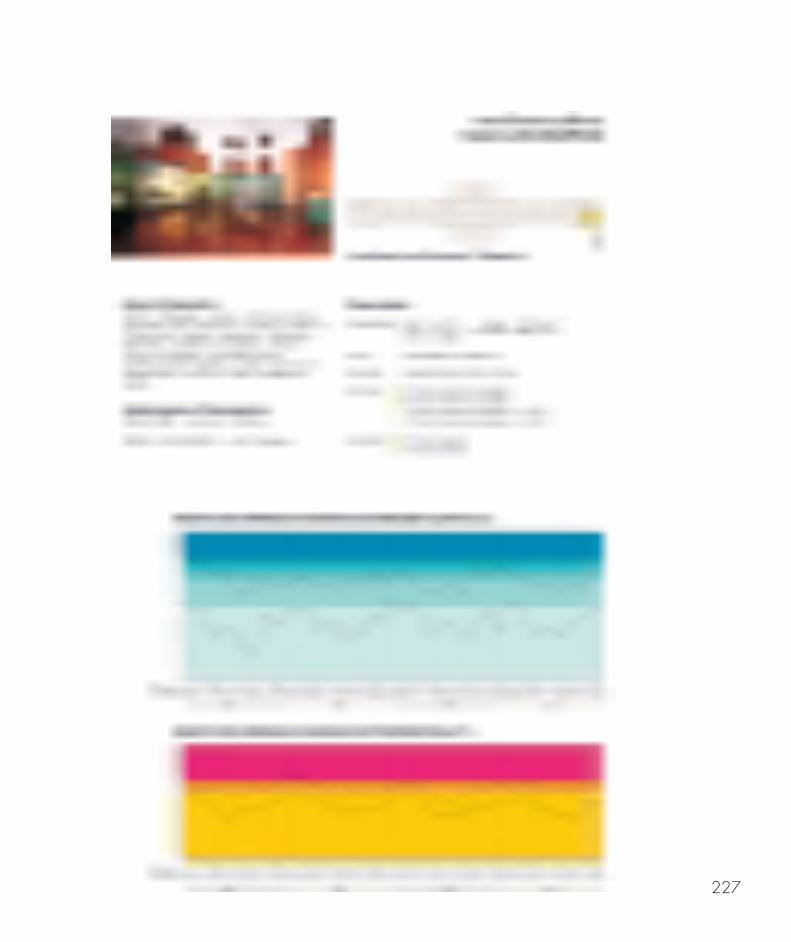
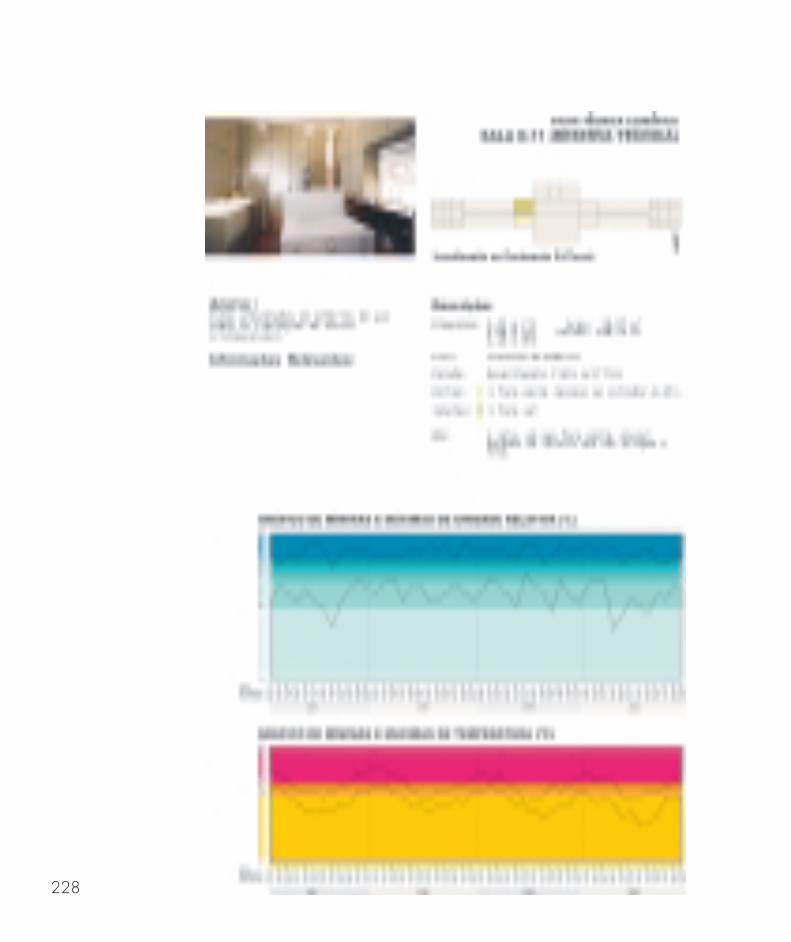
The most difficult part when elaborating the plans was establishingdiverse levels for relative humidity and temperature data. At the Museu Paulistarelative humidity levels recorded varied from under 30% up to 98 % , andtemperatures from 12°C to 35°C approximately. What ranges should be classifiedas improper ones? What range would be considered “proper”? No referencesabout similar classifications were found in the bibliography5. Decisions had to bemade and it was decided that levels of relative humidity lower than 50% andhigher than 80% would be considered improper; in between, two other levelswere created. The 50-69% level was considered “proper” or the “good level”and the 70-80% level was considered acceptable. Four different shades of bluewere used to indicate the four different levels in the plans. Since relative humiditydata should be accentuated more than temperature information, RH numberswere located inside the plan while temperature numbers were positioned insidesmall bars.
5. The author means thatexamples of similarclassifications in othermuseums with tropicalenvironments were notfound. Stefan Michalski’sarticle “A discussion ofcorrect/incorrect values.”published in ICOM-CC10th Triennial MeetingPreprints was crucial forestablishing those levels.
200
Concerning the temperature, three levels were named: “the proper orthe good temperature level” until 24°C; the “bad level” comprising level databetween 25°C and 28°C and a “very bad level” including temperatures higherthan 28°C. Three different colours were used to indicate the levels: yellow,orange and red. The author never felt comfortable about those classifications butit was assumed that distinctions should be made to the users of the environmentalplans. Above all, the plans should point out to the staff which museum areaswere better from the conservation point of view, and which ones needed moreattention.
After some changes the plans were finally submited for te museum staff’sevaluation and, since results were considered very successful, a total of 48 plans– one for each month of 1997, 1998, 1999 and 2000 - were produced. Recently,two museum activities envolving collections have already planned their actionsbased on the environmental plans.
The author, besides having all the plans published here, intends tomake them available on the web. Many small museums of Brazil have alreadyinquired Museu Paulista about those environmental plans; the possibility ofdeveloping simple and low cost environmental studies is always mentioned asthe main interest. Seminars about environmental studies in tropical climates tomuseum staff and the general public demonstrate a growing interest in the subject,probably due to the lack of information available in Portuguese and in outsideconservation literature.
Understanding the records
Instability in relative humidity and temperature is expected in tropicalclimates. In the case of São Paulo’s climate, instability might mean, for example,changes in RH from 50% to 80% in few hours. What effects this instability has inthe inside areas of the museum is what we want to determine from now on. Theimpact of these changes on museum objects, however, will not be discussed in thenear future. Since the year 2000, the project was elected by the university trainingprogram to receive a two-year scholarship. That brought graduate students fromthe Geography course to work in the museum environmental project, substantiallyincreasing the exchange of information.
The second part of the project – which commenced in 2002 – aims toevaluate the information recorded. Factors such as seasons of the year, climatephenomena like “El Niño” and “La Niña”, ventilation on the different floors, directcontact with external areas, levels of insulation, distances from the park’s vegetationand the park’s fountain, direction of the winds, exposure to external pollution,amount of visitors and duration of their stay in the rooms, and the amount ofhygroscopic materials in the rooms monitored, should be carefully considered.
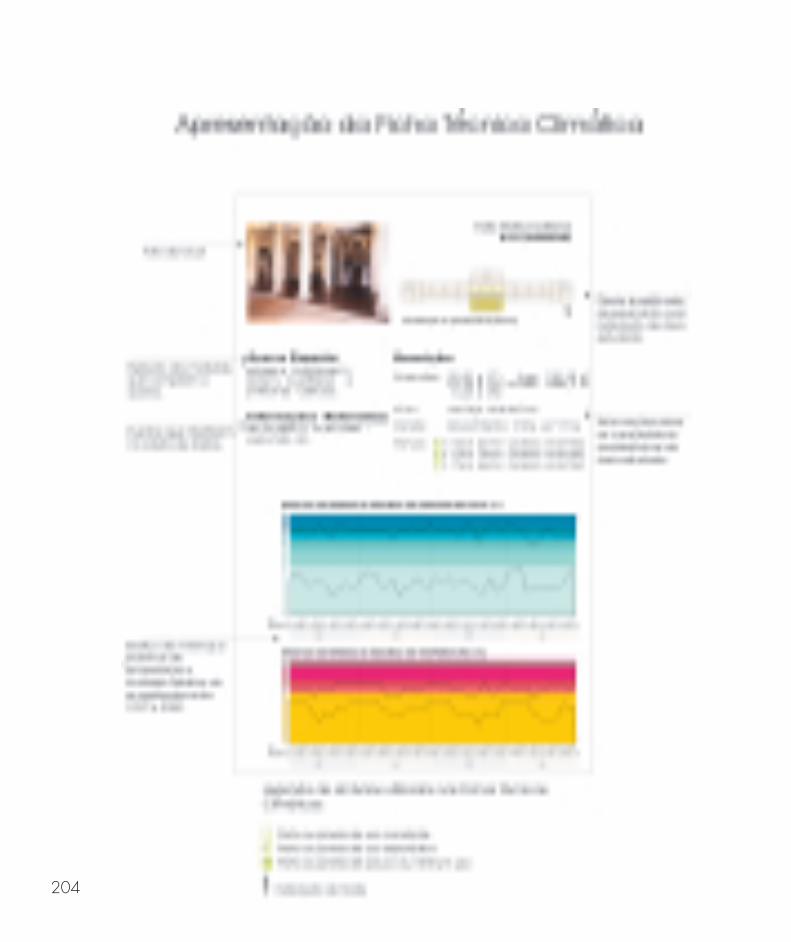
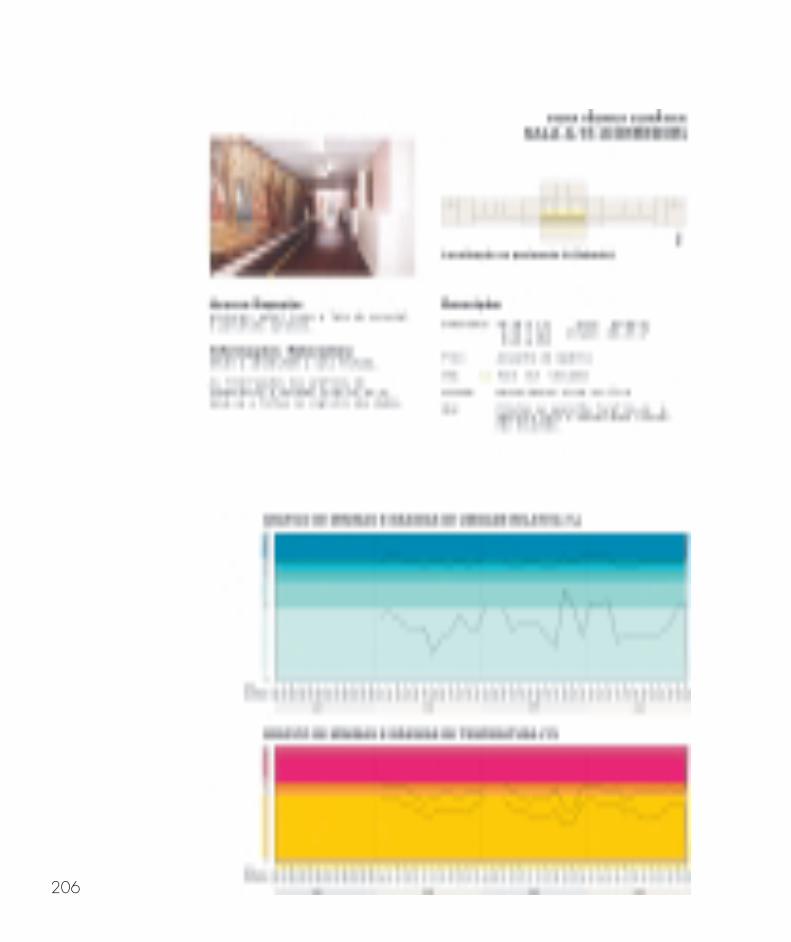
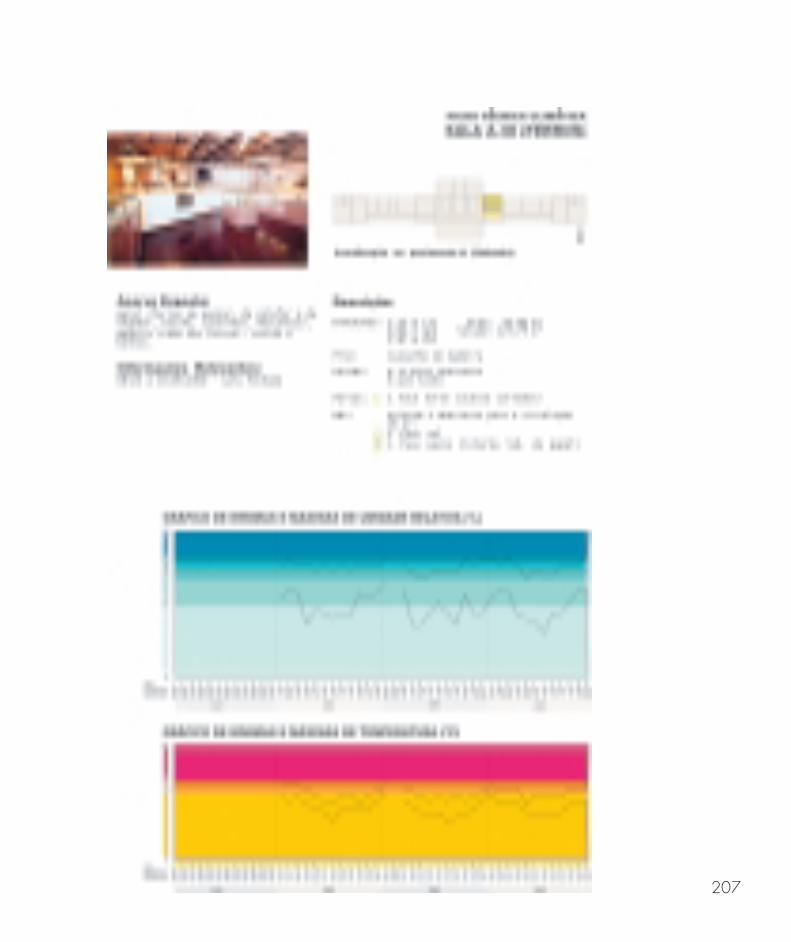
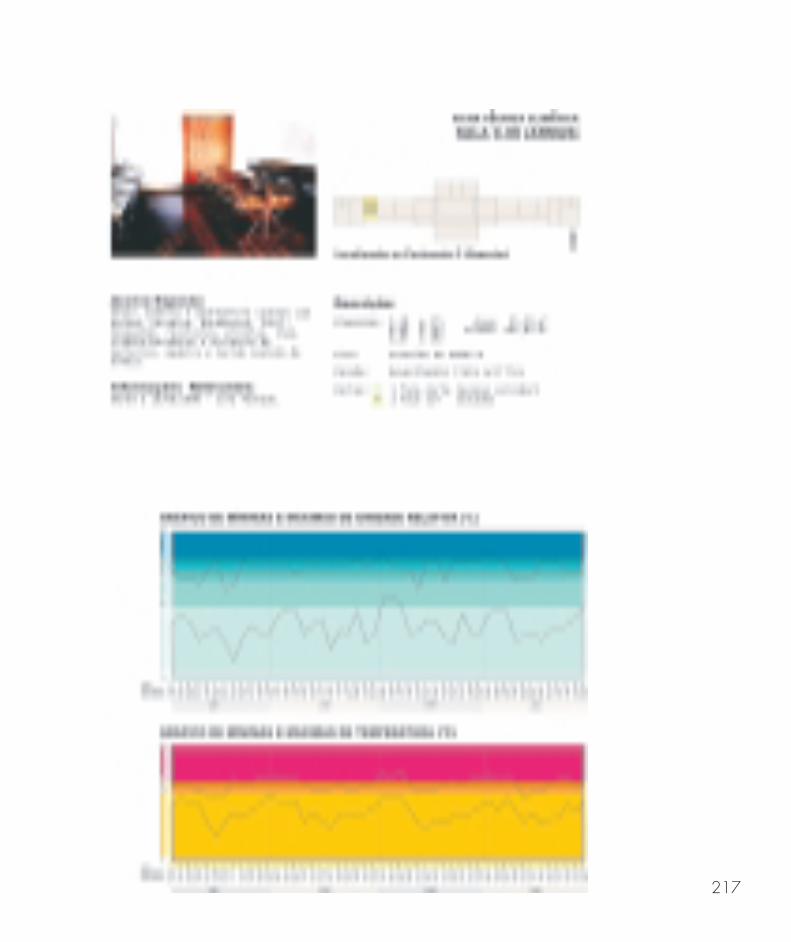
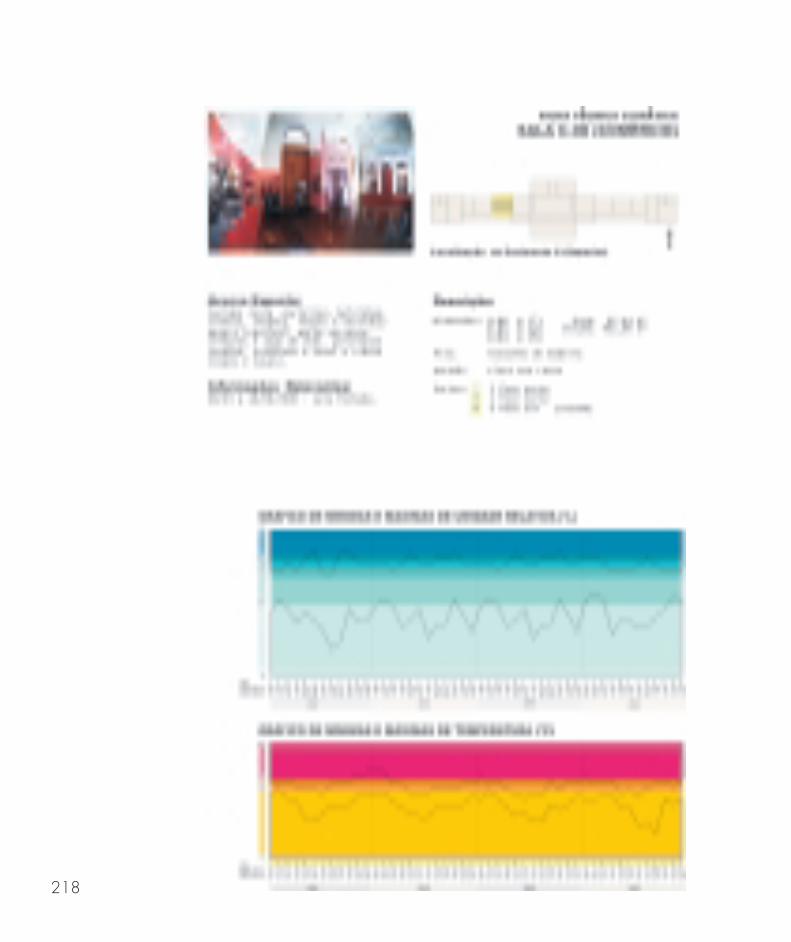
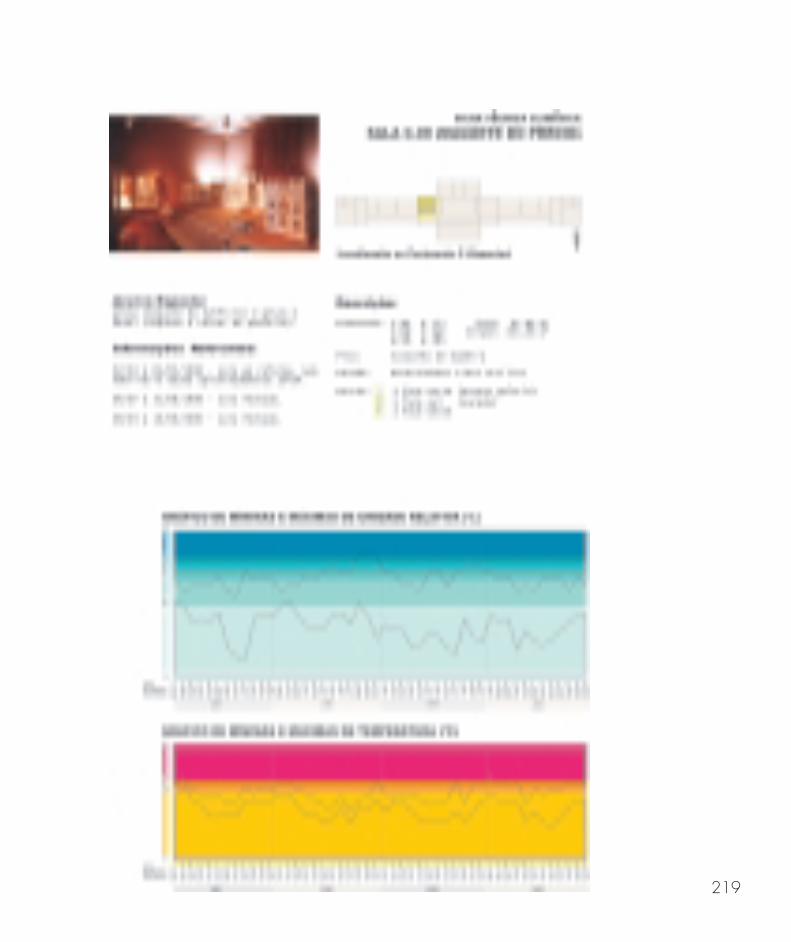
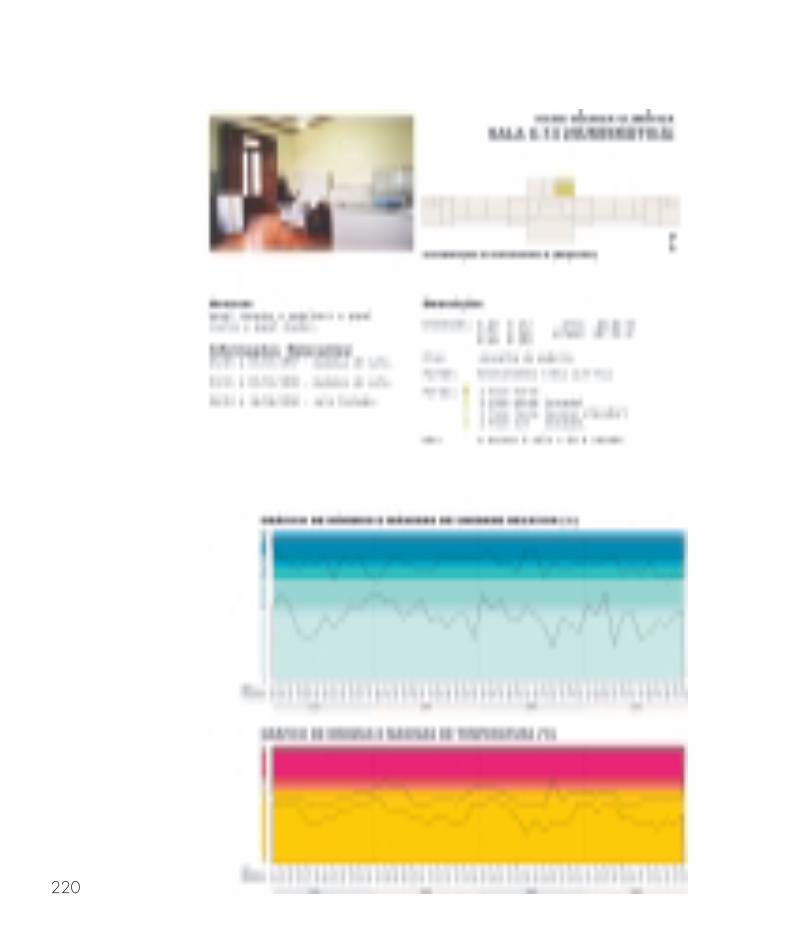
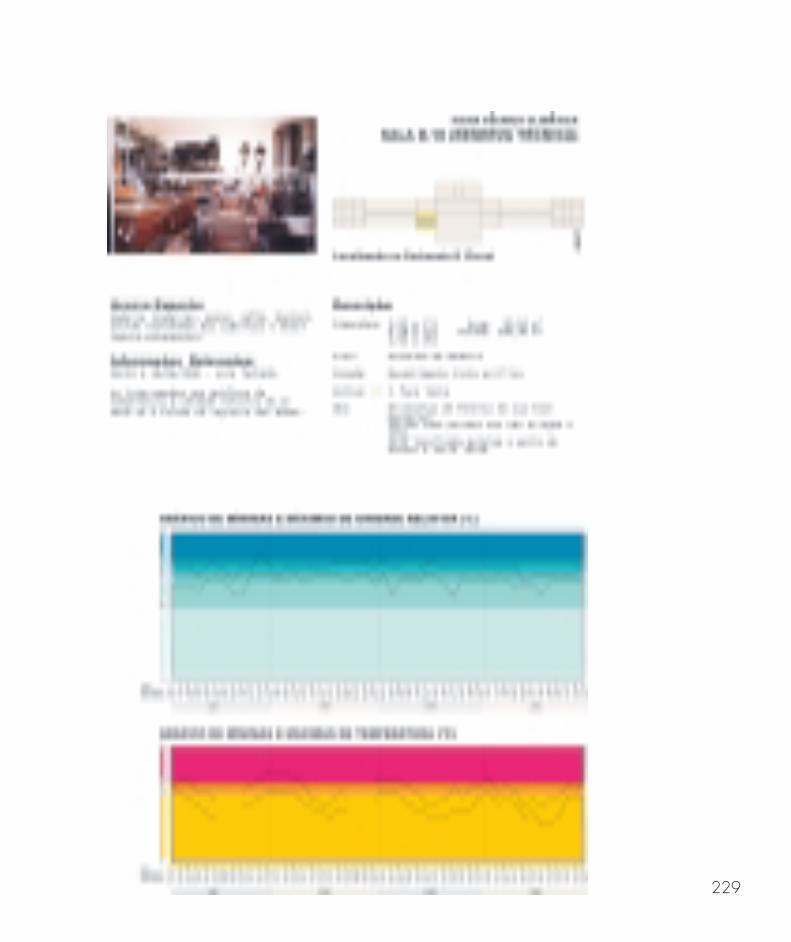
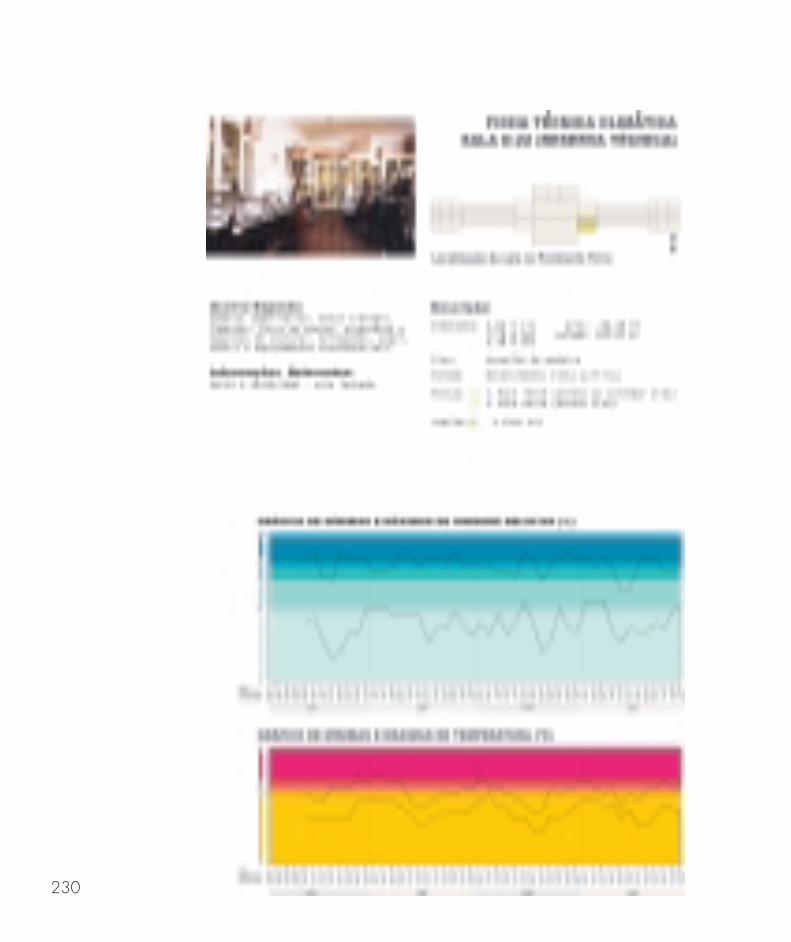
Once communication was identified as the main issue, another type ofplan started to be developed. Carta Climática an individual plan of each spacemonitored, in which, besides the RH and the temperature data, information likeroom´s dimensions and finishings, number of doors, windows etc, collectionsexposed, recent modifications, visitors’s access, lighting and percentage ofhygroscopic materials is shown together.
201
Conclusion
Brazil is a huge country and climate diversity is one of its characteristics.It is time for museums and research centres in the country to invest more deeply inenvironmental studies, but also to make conservation information simple and availableto the museum community as a whole. Exchange of information and experiences,successful or not, should be stimulated. University museums like Museu Paulista cancontribute to this exchange by not only divulging the data recorded but alsodeveloping, adapting and sharing simple conservation practices.
Acknowledgements
The author would like to thank:. Dinah Eastop (The Textile Conservation Centre, University of Southampton) for
her precious comments on this paper and project;. Prof. Dr. Tarik Rezende de Azevedo from Laboratório de Climatologia e
Biogeografia do Departamento de Geografia da FFLCH/USP - who joined theproject in 2002;
. Christine May Kauffman Fidalgo for her technical support and constantencouragement;
. Alexandre Henrique da Silva, who planned and created all Cartas Climáticas;
. Lincoln Seiji Tejima for his research on São Paulo’s climate;
. Fapesp – Fundação de Amparo à Pesquisa do Estado de São Paulo.
REFERENCES
ASHLEY-SMITH, Jonathan. Risk assessment for object conservation. London: Butterworth-Heinemann, 1999. 358 p.
CABRAL, Edson. Análise das alterações climáticas da cidade de São Paulo (1887-1995) no contextoda expansão de sua mancha urbana”. 1997. Dissertação (Mestrado) – Faculdade de Filosofia,Letras e Ciências Humanas, Universidade de São Paulo, São Paulo, 1997.
CASSAR, May. Environmental management: guidelines for museums and galleries. London:Routledge, 1997. 164 p.
DREWES, Jeanne (Org.). Selected bibliography: tropical preservation. Baltimore: Johns HopkinsUniversity, 1998. 3 p.
GOMES, José C. Parque da Independência – normas e diretrizes para a proteção ambiental epaisagística. São Paulo: CONDEPHAAT, 1976.
MICHALSKI, Stefan. Relative Humidity: A discussion of correct/incorrect values. In: ICOMCOMMITTEE FOR CONSERVATION, 10., 1993, Washington. Meeting... p. 624-629.
202
KERSCHNER, Richard L.; BAKER, Jennifer. Practical climate control: a selected annotatedbibliography. Disponível em: <WWW reference: http://palimpsest.standford.edu/byauth/kerschner/ccibiblio.html>.
PEARSON, Colin. Preserving Collections in Tropical Countries. Conservation, The GCI Newsletter,Los Angeles, v. 12, n. 2, p. 17-18, 1997.
TARIFA, José R.; ARMANI, Gustavo. ”Unidades Climáticas Urbanas da cidade de São Paulo In: ATLASAmbiental do Município de São Paulo. São Paulo: Laboratório de Climatologia, Universidade de SãoPaulo, 2000.
TESHIMA, Lincoln S. O meio físico da cidade de São Paulo. São Paulo: Museu Paulista da USP, 2001,10 p. Inédito.
TOMÁS, Denis Dorighello. Comportamento da umidade relativa do ar em centros urbanos: oexemplo da metrópole de São Paulo. 1999. Dissertação (Mestrado) – Faculdade de Filosofia, Letrase Ciências Humanas, Universidade de São Paulo, São Paulo, 1999.
Artigo apresentado em 7/2003. Aprovado em 9/2003.
203
Projeto de Monitoramento Ambiental
Plantas Temáticas e Fichas Técnicas Climáticas
Coordenação geral: Teresa Cristina Toledo de Paula
Criação dos primeiros gráficos em Excel R : Luciano A. Beraldo
Coleta e transferência de dados até 2000: Teresa Cristina Toledo de Paula
1 .1 .1 .1 .1 . Plantas Temáticas – Microclimas do Museu Paulista
Projeto Gráfico: Christine May Kaufmann Fidalgo
Concepção: Lincoln Seiji Tejima
Christine May Kaufmann Fidalgo
Teresa Cristina Toledo de Paula
Execução e transferência de dados: Lincoln Seiji Tejima (1997-1999)
Alexandre Henrique da Silva (2000)
Assistência em informática: Leandro Luiz dos Santos Regina
Luciano A. Beraldo
Tomas Adamavicius
2.2.2.2.2. Fichas Técnicas Climáticas
Projeto Gráfico: Christine May Kaufmann Fidalgo
Concepção: Alexandre Henrique da Silva
Christine May Kaufmann Fidalgo
Teresa Cristina Toledo de Paula
Execução e transferência de dados e imagens: Alexandre Henrique da Silva
Fotografias: Hélio Nobre
José Rosael
Assistência em informática: Leandro Luiz dos Santos Regina
Luciano A. Beraldo
Tomas Adamavicius
Observações:
1. Nem todas as áreas estudadas começaram a ser monitoradas na mesma data;
2. Algumas informações estão registradas apenas na primeira Planta Temática;
3. Não existe uma ficha técnica climática para a sala C-7 (fechada) embora ela tenha sido monitorada no
período e conste nas Plantas Temáticas;
4. Todas as áreas com acervo, cujos responsáveis aderiram ao projeto, foram monitoradas.
204

205
206
207
208
209
210
211
212

213
214
215
216
217
218
219
220
221
222
223
224
225
226
227
228
229
230
231
232
233
234
235
236
237
238
239
240
241
242
243
244
245
246
247
248
249
250
251
252
253
254
255
256
257
258
259
260
261
262
263
264
265
266
267
268
269
270
271
272
273

274
275
276
277
278
327
Influência da radiação de luz sobre acervos museológicos
Norma Ciaflone Cassares, Yara Lígia Mello Moreira
O texto analisa a ação e os efeitos da radiação de luz sobre acervo museológico. Considera-se aluz como fator de dano produzindo alterações físicas e químicas sobre a estrutura molecular dosmateriais dos objetos, que ocorrem sempre em conjunto com as condições ambientais e não deforma isolada. Aponta critérios técnicos, referências, relativos aos níveis de iluminação e ao tempode exposição dos objetos.PALAVRAS-CHAVE: Conservação. Luz. Museus. Acervos.Anais do Museu Paulista. São Paulo. N. Sér. v. 8/9. p.177-192 (2000-2001). Editado em 2003.
Influence of the light radiation on the museum’s collections
Norma Ciaflone Cassares, Yara Lígia Mello Moreira
The text analyses the actions and effects of light on the museum’s collections. Light is considered ofharmful effects leading to physical and chemical changes on the molecular structure of the materialsof the objects, which always happen together with the environmental conditions rather than alone. Itpoints out towards technical criteria, references, related to the levels of light and the exposure time ofthe objects.KEYWORDS: Conservation. Light. Museums. Collections.Anais do Museu Paulista. São Paulo. N. Sér. v. 8/9. p.177-192 (2000-2001). Editado em 2003.
Conservação de coleções em ambientes tropicais: coletando e comunicando dados do MuseuPaulista/USP, Brasil (1997-2000)
Teresa Cristina Toledo de Paula
As atividades de monitoramento e controle ambiental nas regiões temperadas originaram osparâmetros e práticas hoje estabelecidos mundialmente para a conservação de acervos; taisparâmetros e práticas, entretanto, podem não ser adequados à conservação de acervos emregiões tropicais. Este trabalho apresenta uma pesquisa sobre as condições ambientais em museude região tropical, o Museu Paulista da Universidade de São Paulo. Trinta e três salas, halls ecorredores nos quatro pavimentos do Museu Paulista têm sido monitorados por termo-higrógrafosdesde 1997. Grandes variações na UR (30-98%) e temperatura (12-35 graus C) foram registradas.O efeito nocivo sobre as coleções, esperável em situações climáticas tão inconstantes, não foiencontrado onde há ventilação apropriada. O monitoramento possibilitou, também, a identificaçãode áreas de alto risco, onde ações localizadas podem ser introduzidas de forma econômica.Desenvolver um modo efetivo de comunicar essas informações ambientais à equipe do museumostrou-se vital à implementação de medidas sustentáveis de monitoramento e controle climáticos.PALAVRAS-CHAVE: Clima em Museu. Clima Tropical. Clima Brasileiro. Museus Brasileiros. Monitoramento Ambiental.Anais do Museu Paulista. São Paulo. N. Sér. v. 8/9. p.193-278 (2000-2001). Editado em 2003.
Caring for Collections in Tropical Environments: Collecting and Communicating Data at MuseuPaulista/USP, Brasil (1997-2000)
Teresa Cristina Toledo de Paula
The monitoring and environment control activities in the temperate regions have originated theparameters and the actions now established, world widely, for the conservation of the collections;such parameters and the actions, nevertheless, may not be adequate for the conservation of thecollections in tropical regions. This work presents a research about the environmental conditions ina museum in a tropical region, the Museum of the University of São Paulo (Museu Paulista daUniversidade de São Paulo). Thirty-three rooms, halls and corridors in the four of the museums floorshave been monitored with thermo hygrographs since 1997. Huge variations in the UR (30-98%)and temperature (12-35 degrees C) have been registered. The harmful effect on the collections,expected in so changeable climatic situations, has not been found where there is proper ventilation.The monitoring has also enabled the identification of the high-risk areas, where local actions canbe introduced in an economical way. Developing an effective way of passing ahead this environmentinformation to the museum’s staff has been proved vital for the implementation of sustainable measuresof monitoring and climatic control.KEYWORDS: Climate in a Museum. Tropical Climate. Brazilian Climate. Brazilian Museums. Environmental Monitoring.Anais do Museu Paulista. São Paulo. N. Sér. v. 8/9. p.193-278 (2000-2001). Editado em 2003.