Embed Size (px)
Citation preview
ANNUAL REPORT2014/15
Stawell VIC 3380 | (03) 5358 8500 | www.srh.org.au
ST
AW
EL
L R
EG
ION
AL
HE
ALT
H A
NN
UA
L R
EP
OR
T 2
014
-15
Caring for our Community

ORGANISATIONALVALUESTrust
We act openly and honestly as individuals
and as a team.
Respect
We treat each other with respect and courtesy and
value the opinions and contributions of others.
Accountability
We each take personal responsibility
for our decisions and actions.
Communication
We encourage the sharing of information within
our team and with the community.
Safety
We are committed to the safety of our
workforce and our customers.
Front Cover
Mrs Sue Terbos - Allied Health Assistance
Mrs Irene Young with Ozzie
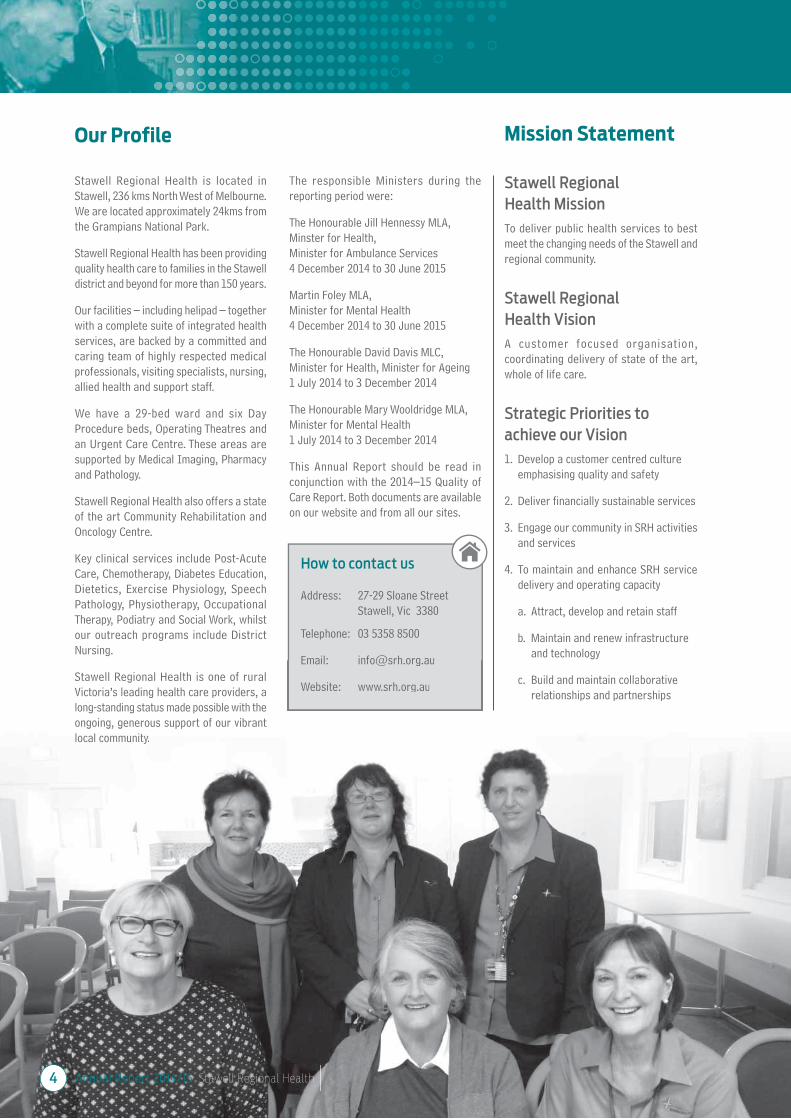
Inside Front Cover
Mrs Mary Bruce – Director of Clinical Services Stawell Regional Health
Mr Howard Cooper – Board Chairman Stawell Regional Health
Ms Emma Kealy MP – Member for Lowan
Ms Nicole Nicholson – Allied Health Assistant
Back Cover
Ms Ella Mannix – Allied Health Assistant
Mr Gordon Williams - Stawell Mens Shed
Mr Andrew Reeves - Stawell Mens Shed
Inside Back Cover
Stawell Primary School children visiting Stawell Regional Health Theatre and
Great Western Primary School children visiting Macpherson Smith Residential Care
Photography
Mrs Kerri Kingston
Board Chair’s Report.......................................................................................................................................... 5
Organisational Structure ................................................................................................................................... 6
Board of Management ....................................................................................................................................... 7
Year in Review................................................................................................................................................. 8-9
Major Acquisitions and Projects ........................................................................................................................ 9
Financial Overview ........................................................................................................................................ 9-10
Performance Indicators ................................................................................................................................... 10
Human Resources Report ........................................................................................................................... 10-11
Occupational Health and Safety ................................................................................................................. 12-13
Compliance Statements ................................................................................................................................... 14
Objectives, Functions, Powers and Duties of SRH .......................................................................................... 15
Statement of Priorities for 2014-2015 ....................................................................................................... 16-20
Statutory Reporting Requirements ............................................................................................................. 21-22
Disclosure Index .............................................................................................................................................. 23
Financial Declaration ....................................................................................................................................... 24
VAGO Report .............................................................................................................................................. 25-26
Financial Statements ................................................................................................................................. 27-68
CONTENTS
Stawell Regional Health is located in
Stawell, 236 kms North West of Melbourne.
We are located approximately 24kms from
the Grampians National Park.
Stawell Regional Health has been providing
quality health care to families in the Stawell
district and beyond for more than 150 years.
Our facilities – including helipad – together
with a complete suite of integrated health
services, are backed by a committed and
caring team of highly respected medical
professionals, visiting specialists, nursing,
allied health and support staff.
We have a 29-bed ward and six Day
Procedure beds, Operating Theatres and
an Urgent Care Centre. These areas are
supported by Medical Imaging, Pharmacy
and Pathology.
Stawell Regional Health also offers a state
of the art Community Rehabilitation and
Oncology Centre.
Key clinical services include Post-Acute
Care, Chemotherapy, Diabetes Education,
Dietetics, Exercise Physiology, Speech
Pathology, Physiotherapy, Occupational
Therapy, Podiatry and Social Work, whilst
our outreach programs include District
Nursing.
Stawell Regional Health is one of rural
Victoria’s leading health care providers, a
long-standing status made possible with the
ongoing, generous support of our vibrant
local community.
The responsible Ministers during the
reporting period were:
The Honourable Jill Hennessy MLA,
Minster for Health,
Minister for Ambulance Services
4 December 2014 to 30 June 2015
Martin Foley MLA,
Minister for Mental Health
4 December 2014 to 30 June 2015
The Honourable David Davis MLC,
Minister for Health, Minister for Ageing
1 July 2014 to 3 December 2014
The Honourable Mary Wooldridge MLA,
Minister for Mental Health
1 July 2014 to 3 December 2014
This Annual Report should be read in
conjunction with the 2014–15 Quality of
Care Report. Both documents are available
on our website and from all our sites.
Our Profile
Stawell Regional
Health Mission
To deliver public health services to best
meet the changing needs of the Stawell and
regional community.
Stawell Regional
Health Vision
A customer focused organisation,
coordinating delivery of state of the art,
whole of life care.
Strategic Priorities to
achieve our Vision
1. Develop a customer centred culture
emphasising quality and safety
2. Deliver financially sustainable services
3. Engage our community in SRH activities
and services
4. To maintain and enhance SRH service
delivery and operating capacity
a. Attract, develop and retain staff
b. Maintain and renew infrastructure
and technology
c. Build and maintain collaborative
relationships and partnerships
Mission Statement
How to contact us
Address: 27-29 Sloane Street
Stawell, Vic 3380
Telephone: 03 5358 8500
Email: [email protected]
Website: www.srh.org.auStawell Regional Health is one of rural
Victoria’s leading health care providers, a
long-standing status made possible with the
ongoing, generous support of our vibrant
local community.
c. Build and maintain collaborative
relationships and partnerships
Email: [email protected]
Website: www.srh.org.au
Annual Report 2014/15 Stawell Regional Health4
Annual Report 2014/15 Stawell Regional Health 5
In accordance with the Financial Management Act 1994,
I am pleased to present the Report of Operations for
Stawell Regional Health for the year ending 30 June 2015.
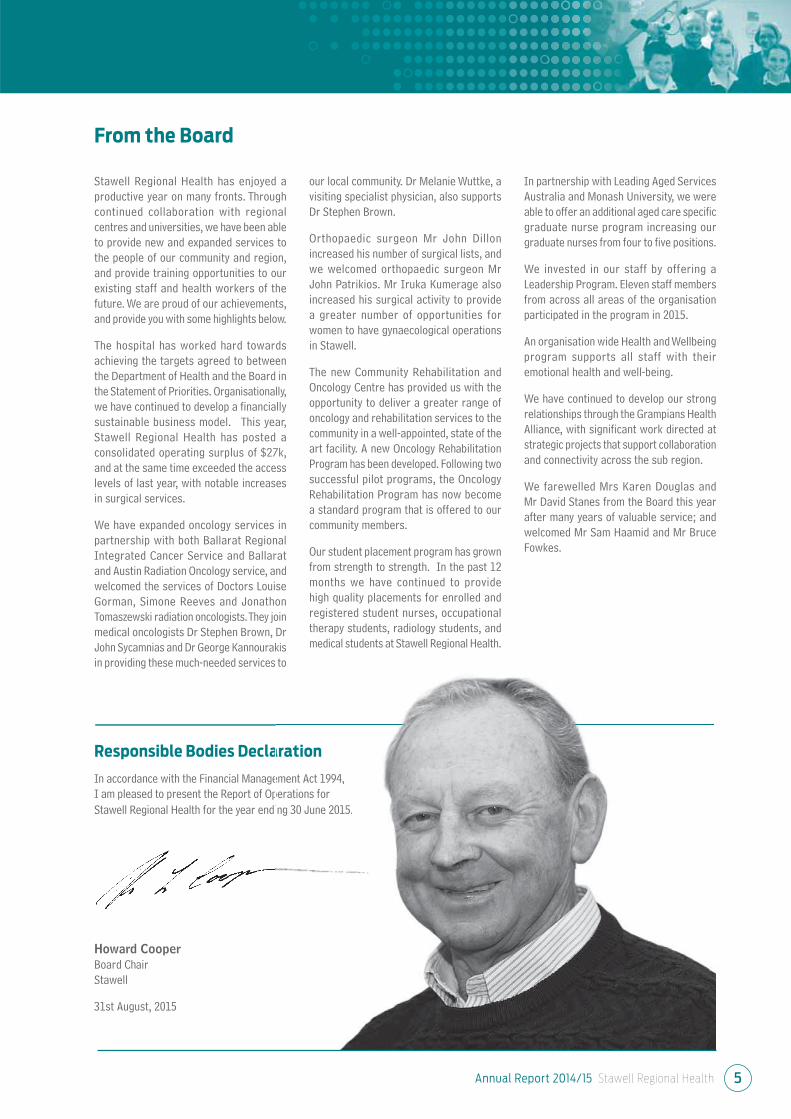
Howard Cooper
Board Chair
Stawell
31st August, 2015
Stawell Regional Health has enjoyed a
productive year on many fronts. Through
continued collaboration with regional
centres and universities, we have been able
to provide new and expanded services to
the people of our community and region,
and provide training opportunities to our
existing staff and health workers of the
future. We are proud of our achievements,
and provide you with some highlights below.
The hospital has worked hard towards
achieving the targets agreed to between
the Department of Health and the Board in
the Statement of Priorities. Organisationally,
we have continued to develop a financially
sustainable business model. This year,
Stawell Regional Health has posted a
consolidated operating surplus of $27k,
and at the same time exceeded the access
levels of last year, with notable increases
in surgical services.
We have expanded oncology services in
partnership with both Ballarat Regional
Integrated Cancer Service and Ballarat
and Austin Radiation Oncology service, and
welcomed the services of Doctors Louise
Gorman, Simone Reeves and Jonathon
Tomaszewski radiation oncologists. They join
medical oncologists Dr Stephen Brown, Dr
John Sycamnias and Dr George Kannourakis
in providing these much-needed services to
our local community. Dr Melanie Wuttke, a
visiting specialist physician, also supports
Dr Stephen Brown.
Orthopaedic surgeon Mr John Dillon
increased his number of surgical lists, and
we welcomed orthopaedic surgeon Mr
John Patrikios. Mr Iruka Kumerage also
increased his surgical activity to provide
a greater number of opportunities for
women to have gynaecological operations
in Stawell.
The new Community Rehabilitation and
Oncology Centre has provided us with the
opportunity to deliver a greater range of
oncology and rehabilitation services to the
community in a well-appointed, state of the
art facility. A new Oncology Rehabilitation
Program has been developed. Following two
successful pilot programs, the Oncology
Rehabilitation Program has now become
a standard program that is offered to our
community members.
Our student placement program has grown
from strength to strength. In the past 12
months we have continued to provide
high quality placements for enrolled and
registered student nurses, occupational
therapy students, radiology students, and
medical students at Stawell Regional Health.
In partnership with Leading Aged Services
Australia and Monash University, we were
able to offer an additional aged care specific
graduate nurse program increasing our
graduate nurses from four to five positions.
We invested in our staff by offering a
Leadership Program. Eleven staff members
from across all areas of the organisation
participated in the program in 2015.
An organisation wide Health and Wellbeing
program supports all staff with their
emotional health and well-being.
We have continued to develop our strong
relationships through the Grampians Health
Alliance, with significant work directed at
strategic projects that support collaboration
and connectivity across the sub region.
We farewelled Mrs Karen Douglas and
Mr David Stanes from the Board this year
after many years of valuable service; and
welcomed Mr Sam Haamid and Mr Bruce
Fowkes.
From the Board
Responsible Bodies Declaration
ement Act 1994,
perations for
ing 30 June 2015.
kis
to
medical students at Stawell Regional Health.
aration
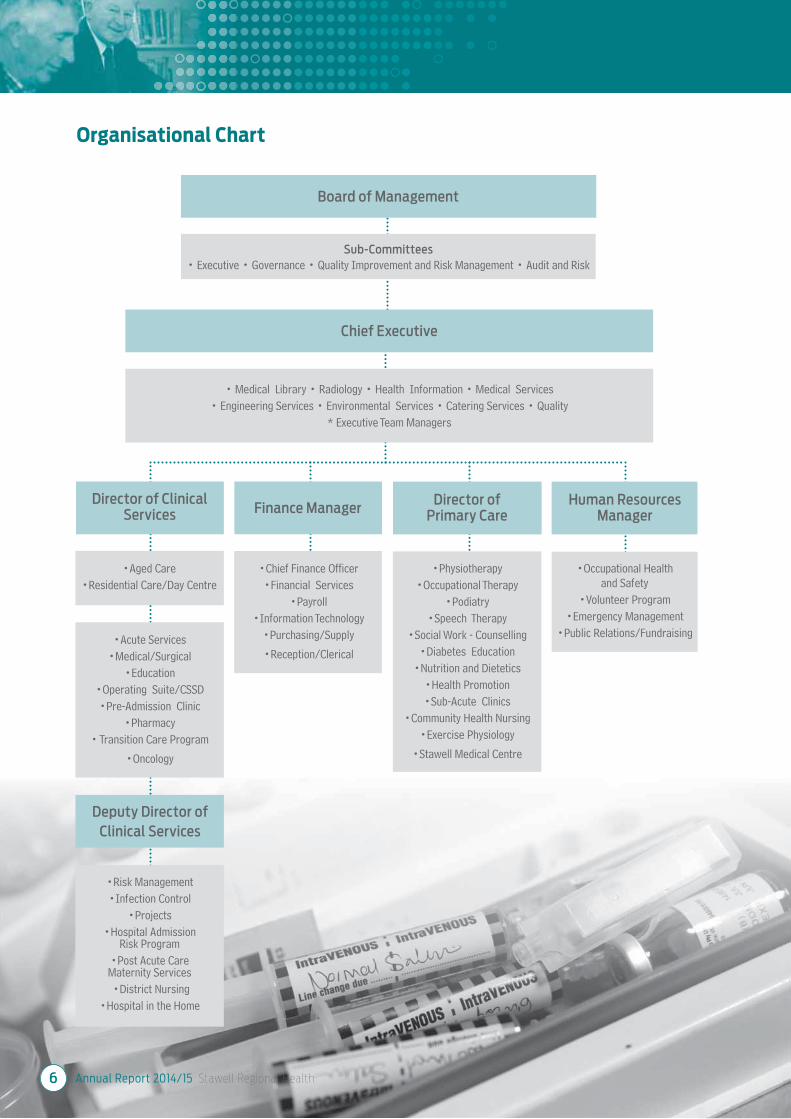
Board of Management
Chief Executive
Sub-Committees
• Executive • Governance • Quality Improvement and Risk Management • Audit and Risk
• Medical Library • Radiology • Health Information • Medical Services
• Engineering Services • Environmental Services • Catering Services • Quality
* Executive Team Managers
Organisational Chart
Director of ClinicalServices Finance Manager
Director ofPrimary Care
Human ResourcesManager
•Aged Care
•Residential Care/Day Centre
•Acute Services
•Medical/Surgical
•Education
•Operating Suite/CSSD
•Pre-Admission Clinic
•Pharmacy
• Transition Care Program
•Oncology
Deputy Director of
Clinical Services
•Risk Management
•Infection Control
•Projects
•Hospital AdmissionRisk Program
•Post Acute CareMaternity Services
•District Nursing
•Hospital in the Home
•Chief Finance Officer
•Financial Services
•Payroll
•Information Technology
•Purchasing/Supply
•Reception/Clerical
•Physiotherapy
•Occupational Therapy
•Podiatry
•Speech Therapy
•Social Work - Counselling
•Diabetes Education
•Nutrition and Dietetics
•Health Promotion
•Sub-Acute Clinics
•Community Health Nursing
•Exercise Physiology
•Stawell Medical Centre
•Occupational Healthand Safety
•Volunteer Program
•Emergency Management
•Public Relations/Fundraising
Annual Report 2014/15 Stawell Regional Health6

Annual Report 2014/15 Stawell Regional Health 7
Primary Producer
Howard Cooper
Date Appointed: 1st April 1999Board President, Board Representative on Quality Improvement and Risk Management and Audit and Risk Committees
Accountant
Lynn Jensz
Date Appointed: 1st July, 2008, Board Vice PresidentBoard Representative on Board Executive.
l 1999
y
nd Risk
Retired SchoolPrincipal
Peter Martin
Date Appointed: 1st April, 1999, Board Representative on Governance and Audit and Risk and Medical Appointments Committees.
, ive
s.
Mum
Rhian Jones
Date Appointed: 20th November 2013, Board Representative on Board Executive, Governance and Medical Appointment Committees.
Postal Manager
Australia Post Stawell
Joan Brilliant
Date Appointed: 1st October 1986, Board Representative on Quality Improvement andRisk Management Committee.
Retired Chief Executive
Ross Hatton
Date Appointed: 1st July, 2008, Board Representative on Audit and Risk Committee.
ll
oberative t and
Retired Councillor
Barry Marrow
Date Appointed: 1st July, 2013, Board Representative on Quality Improvement and Risk Management and Governance Committees.
Board of Management
Business Compliance
Sam Haamid
Date Appointed: 1st July, 2014, Board Representative on Audit and Risk Committee.
Retired Registered Nurse
Bruce Fowkes
Date Appointed: 1st July, 2014, Board Representative on Audit and Risk, Quality Improvement and Risk Management and Medical Appointments Committees.
Annual Report 2014/15 Stawell Regional Health8
Community Rehabilitation
and Oncology Centre
The recently completed Community
Rehabilitation and Oncology Centre (CRC)
has been utilised to almost full capacity
during the last 12 months, with a greater
number of rehabilitation programs and
individual treatment sessions provided to
the community.
The purpose-built facility is the base for
inpatient and outpatient rehabilitation
services such as exercise physiology,
physiotherapy, occupational therapy and
speech pathology. Several rehabilitation
programs are being conducted in the
gym, and include the gait and balance
rehabilitation program, pulmonary
rehabilitation, and cardiac rehabilitation.
The new eight week oncology rehabilitation
program is now a permanent service offered
to our community members living with
cancer.
The new oncology centre is a state of the
art treatment centre for people requiring
chemotherapy and reviews with their
oncologist. The treatment areas are
well-designed with fantastic views of the
Grampians from each treatment chair.
Oncology services are offered by three
medical oncologists and three radiation
oncologists, who are supported by the
oncology nurses and an experienced regional
oncology Nurse Practitioner. Dedicated
community volunteers, an integral part
of our team, are often present to support
our patients waiting for appointments and
treatment.
The well-appointed consulting rooms are
utilized by a number of other consulting
specialists including orthopaedic surgeons,
general surgeons, paediatricians,
rheumatologists, ophthalmologists and an
ear, nose and throat specialist, to name a few.
Local shearer Aaron Hemley, who raised in
excess of $120,000 towards the oncology
unit during his huge shearing marathon,
is immortalised in an action photo in the
oncology unit.
Productive Series
SRH has continued to progress the
Productive Series project. The Productive
Series was implemented in selected health
services across Victoria by the Department
of Health and Human Services in 2013.
Stawell Regional Health participated in the
three areas of:
1. Productive Leader
2. Productive Ward
3. Productive Operating Theatre
Outcomes have seen quality improvements,
particularly in Simpson Ward and Perioperative
Services, with time management and system
changes improving patient care. Key staff in
these areas continue to work and engage all
staff: nursing, medical, support services and
managers in the “Productive Series’ approach
to improving care and systems. Patients and
visitors are able to read and be involved in
the improvements by way of display boards
and communication boards clearly showing
examples of the objectives of “Great Care”
and can see the improvements being made.
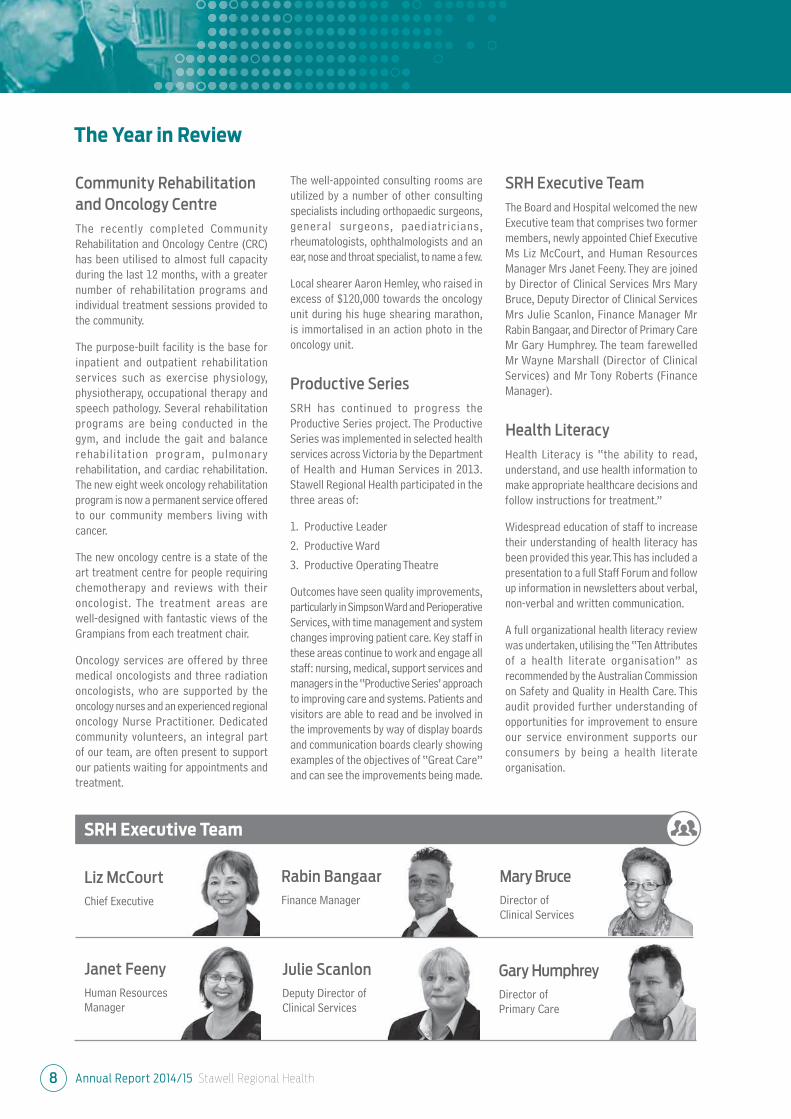
SRH Executive Team
The Board and Hospital welcomed the new
Executive team that comprises two former
members, newly appointed Chief Executive
Ms Liz McCourt, and Human Resources
Manager Mrs Janet Feeny. They are joined
by Director of Clinical Services Mrs Mary
Bruce, Deputy Director of Clinical Services
Mrs Julie Scanlon, Finance Manager Mr
Rabin Bangaar, and Director of Primary Care
Mr Gary Humphrey. The team farewelled
Mr Wayne Marshall (Director of Clinical
Services) and Mr Tony Roberts (Finance
Manager).
Health Literacy
Health Literacy is “the ability to read,
understand, and use health information to
make appropriate healthcare decisions and
follow instructions for treatment.”
Widespread education of staff to increase
their understanding of health literacy has
been provided this year. This has included a
presentation to a full Staff Forum and follow
up information in newsletters about verbal,
non-verbal and written communication.
A full organizational health literacy review
was undertaken, utilising the “Ten Attributes
of a health literate organisation” as
recommended by the Australian Commission
on Safety and Quality in Health Care. This
audit provided further understanding of
opportunities for improvement to ensure
our service environment supports our
consumers by being a health literate
organisation.
The Year in Review
Liz McCourt
Chief Executive
Janet Feeny
Human Resources Manager
Rabin Bangaar
Finance Manager
Julie Scanlon
Deputy Director of Clinical Services
Mary Bruce
Director of Clinical Services
SRH Executive Team
Gary Humphrey
Director of Primary Care
Annual Report 2014/15 Stawell Regional Health 9
New Doctors coming to Stawell
Stawell Regional Health welcomed the following new doctors: Dr Louise Gorman, Dr Simone Reeves, Dr Jonathon Tomaszewski, Dr Melanie Wuttke, and new orthopaedic surgeon, Mr John Patrikios.
There was some movement in the team at the Stawell Medical Centre this year with husband and wife Doctors Venkat Komerelly and Swetha Bandaru returning after studying at Ballarat Health Services during 2014. They have had the full support of the hospital in pursuing their interests in anaesthetics and obstetrics, and we are excited that they have
rejoined the team.
End of Life Care Pathway
Working with Grampians Regional Palliative Care Consortium, SRH has introduced an End
of Life Palliative Care pathway in Macpherson Smith Residential Care.
This regional initiative has been implemented over six months by a project worker leading our team in developing protocols and ensuring all residents, families and all staff groups (medical, nursing, allied health and support services), have been educated in the principles of End of Life Care and use
of the pathway.
Advance Care Planning
A number of clinicians in community, acute and residential care are now trained to complete Advance Care Plans. An electronic referral process has been introduced for staff across acute and community settings to refer consumers to trained staff for completion of
Advance Care Plans.
Consumer Engagement
Consumers have been playing a larger role in our health services, with the Consumer Representative role established on the SRH Quality Improvement and Risk Management Committee in January 2015.
The Quality Manager and Chief Executive developed and implemented a program of visits to community service groups. Seven service groups were visited and provided with opportunity for questions and feedback.
In September 2014, the SRH Board successfully conducted an Open Access Board Meeting in a local rural community. In addition to the Board meeting, a presentation was provided to the community members on
pelvic floor health.
Financial Overview
In 2014/2015, Stawell Regional Health has
continued its’ commitment to the mission
of delivering high quality health services to
the community.
The expansion of services has been possible
following the completion of several large
capital projects. This has been supported
by increased business unit growth and, as a
result, new and extended services have seen
patient access targets exceeded.
Stawell Regional Health continued to deliver
a surplus in 2015, although lower than the
previous year. The staffing of the new CRC
building for Primary Care has increased our
labour costs substantially. With the increase
in service delivery and local shortage of
skilled staff, we had engaged a higher
proportion of locum medical, physiotherapy
and agency nursing staff. Whilst this has
helped us deliver the needed health care
support for the community, it has resulted
in higher operating expenditure.
Total Consolidated Operating Revenue
(Before Capital items) increased by $0.13M
or 0.53% on 2014. This was reflective of
growth in Business Unit income as well
as State and Commonwealth government
grant income.
In line with revenue growth, Total
Consolidated Operating Expenses increased
by $1.05M or 4.47% on 2014 figures.
Labour expenses increased by $0.47M
(2.80%) on 2014. These expenses totalling
$17.43M increased as a result of employing
additional staff, award increases and
movements in employee entitlements.
Supplies and Consumables expenses
increased by $0.8M or 25.67% primarily as a
result of increased chemotherapy drug costs.
Capital Purpose Income increased by
$2.04M, as we had no major capital works
grants received in 2015.
In 2015, consolidated operating activities
for the year resulted in a net cash outflow
of $0.64M. Of this, $.57M was invested into
Capital assets. Overall, consolidated cash
holdings increased by $73k for the year, with
the total cash on hand figure amounting to
$8.1M at 30th of June 2015.
Major Acquisitions and Projects
Building Works $
Community Rehabilitation Centre $24,598
Hospital - Wireless Replacement Network $87,108
Macpherson Smith Residential Care $12,215
Plant and Medical Equipment $
Hospital Beds $87,935
CXE Pumps $7,200
OPMI surgical microscope $17,302
Contour Multi X Trolleys $43,500
Kitchen Convotherm Oven $18,290
2014/15 major acquisitions and projects include:
Annual Report 2014/15 Stawell Regional Health10
Financial Overview
Human Resource Report
Investing in Our People
SRH Values
The leadership team of senior and middle
managers across the organisation have
continued work to embed the organisations’
values into the everyday care of our
patients, residents and consumers. The
team of managers meet monthly to share
information and ideas about services
and activities across the departments.
This forum, led by the Executive team,
has strengthened relationships and
understanding between different service
areas and aims to improve patient service
outcomes. It has also enabled improvements
in service planning and introduction of
change in the organisation.
People Matter Survey 2014/15
People Matter Survey is undertaken every
year through the Victorian Public Sector
Commission and measures employee
perceptions of how well the organisation
is performing in applying the values and
principles of the Public Sector Administration
Act 2004 in the workplace. Stawell Regional
Health has been undertaking the Survey
since its inception in 2008. Trended data
from our People Matter Survey shows
the organisation improving in both rates
of response and individual metric trends
across all areas of the public sector values
and principles.
Numbers of staff responding to the Survey
shown in Table 1, indicate a significant
increase in comparison to previous years.
49% of staff completed the Survey this year,
in comparison to previous years.
In this past year, the Senior leadership team
has worked to address recommendations
from staff and the issues highlighted in
the Survey regarding Change Management
within our organisation. A Plan was
developed with the Leadership Team that
was communicated to staff to seek out
ideas for improving change management
practices. In particular, employees
highlighted through the Survey Results that
they sought more information about change
and more opportunities to provide input
when change is being considered.
The Executive team increased their time in
staff departments, in particular attending
staff meetings across services to provide
information regarding current planning
and to receive direct feedback from staff
regarding their department and its needs.
The Chief Executive’s office has provided
agendas and minutes for Staff Forums to all
staff, with meetings scheduled well ahead
to enable staff and managers to participate.
Attendance at these forums has increased
over the past twelve months.
Leadership Program
Our Transforming Leaders program which
commenced in November 2014, provided a
series of workshops to twelve staff across
a six month period that continued to focus
on building leadership capacity within the
organisation. Staff involved were required
2015 2014 2013 2012
49% 23% 19% 32%
Table 1 People Matter Response Rates
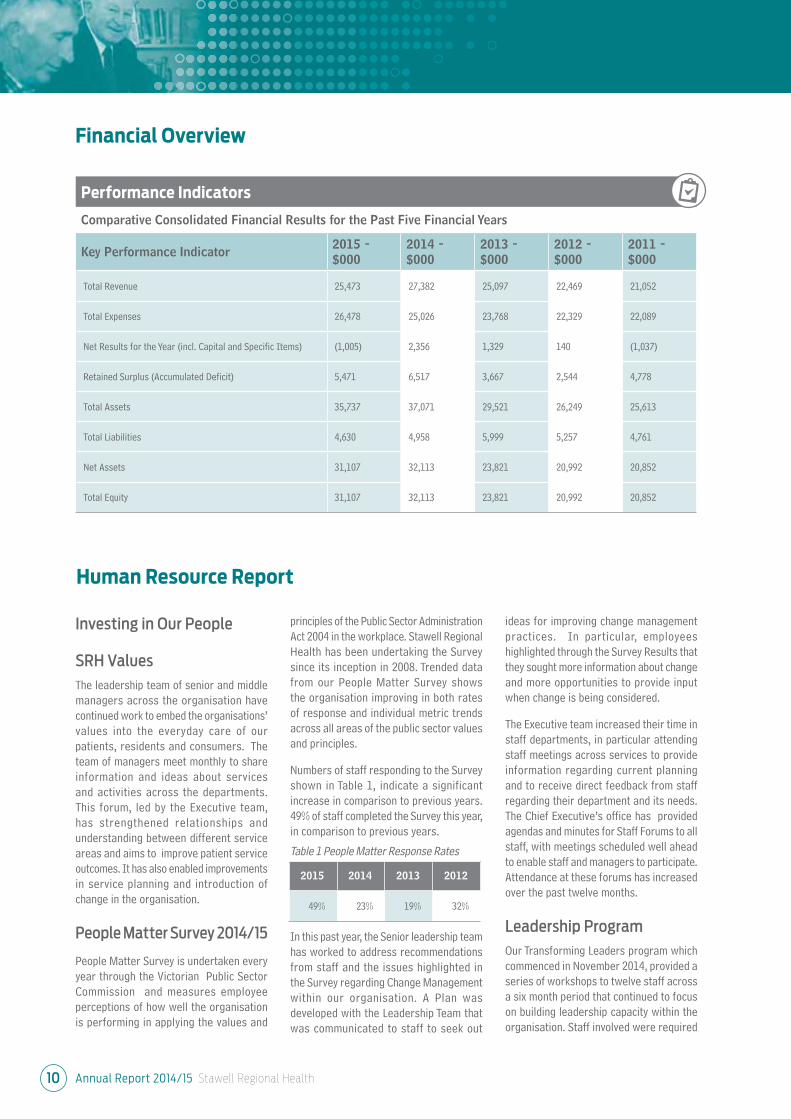
Performance Indicators
Comparative Consolidated Financial Results for the Past Five Financial Years
Key Performance Indicator2015 -
$000
2014 -
$000
2013 -
$000
2012 -
$000
2011 -
$000
Total Revenue 25,473 27,382 25,097 22,469 21,052
Total Expenses 26,478 25,026 23,768 22,329 22,089
Net Results for the Year (incl. Capital and Specific Items) (1,005) 2,356 1,329 140 (1,037)
Retained Surplus (Accumulated Deficit) 5,471 6,517 3,667 2,544 4,778
Total Assets 35,737 37,071 29,521 26,249 25,613
Total Liabilities 4,630 4,958 5,999 5,257 4,761
Net Assets 31,107 32,113 23,821 20,992 20,852
Total Equity 31,107 32,113 23,821 20,992 20,852
Annual Report 2014/15 Stawell Regional Health 11
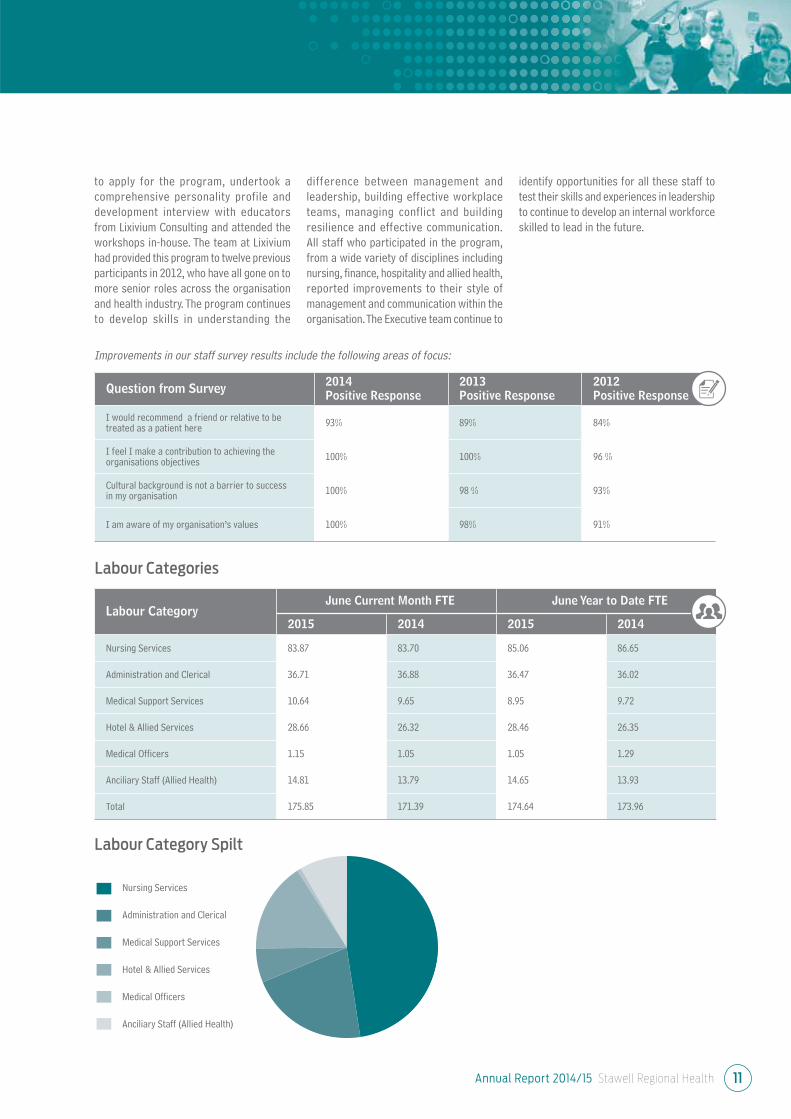
Question from Survey2014Positive Response
2013Positive Response
2012Positive Response
I would recommend a friend or relative to betreated as a patient here
93% 89% 84%
I feel I make a contribution to achieving theorganisations objectives
100% 100% 96 %
Cultural background is not a barrier to successin my organisation
100% 98 % 93%
I am aware of my organisation’s values 100% 98% 91%
Improvements in our staff survey results include the following areas of focus:
to apply for the program, undertook a
comprehensive personality profile and
development interview with educators
from Lixivium Consulting and attended the
workshops in-house. The team at Lixivium
had provided this program to twelve previous
participants in 2012, who have all gone on to
more senior roles across the organisation
and health industry. The program continues
to develop skills in understanding the
difference between management and
leadership, building effective workplace
teams, managing conflict and building
resilience and effective communication.
All staff who participated in the program,
from a wide variety of disciplines including
nursing, finance, hospitality and allied health,
reported improvements to their style of
management and communication within the
organisation. The Executive team continue to
identify opportunities for all these staff to
test their skills and experiences in leadership
to continue to develop an internal workforce
skilled to lead in the future.
Labour CategoryJune Current Month FTE June Year to Date FTE
2015 2014 2015 2014
Nursing Services 83.87 83.70 85.06 86.65
Administration and Clerical 36.71 36.88 36.47 36.02
Medical Support Services 10.64 9.65 8.95 9.72
Hotel & Allied Services 28.66 26.32 28.46 26.35
Medical Officers 1.15 1.05 1.05 1.29
Anciliary Staff (Allied Health) 14.81 13.79 14.65 13.93
Total 175.85 171.39 174.64 173.96
Labour Categories
Labour Category Spilt
Nursing Services
Administration and Clerical
Medical Support Services
Hotel & Allied Services
Medical Officers
Anciliary Staff (Allied Health)
Annual Report 2014/15 Stawell Regional Health12
The organisation supported the OH&S Officer
to achieve his Diploma of Occupational
Health and Safety during the past twelve
months. This commitment has provided
additional opportunities to improve safety
practices within the organisation.
Emergency Management
Summer bushfire threats continue to
be monitored during the fire session.
The availability of information through
online sources regarding the event of a
fire has allowed for increased and timely
monitoring. Testing of the Code Brown
External Emergency policy, through a
multidisciplinary table top drill early in
the year involving senior members of the
organisation, led to the development of an
Emergency Management Resource folder.
The folder provides information that assists
in identifying the degree of the threat to
SRH and its departments, contact details
for key staff, maps of the district, as well as
information required to manage the response
for senior employees whilst off site or in the
event that communications are limited.
SRH identifies October as the start of the
fire season and the organisation provides
Summer Preparedness Education. The
education is delivered by the Country Fire
Authority (CFA). This education is targeted
at employees who, as part of their role,
travel outside the township boundaries,
however all employees are invited to attend.
The education focuses on actions for safety
when confronted by a fire when staff are
located in a vehicle or offsite location. SRH
vehicles used for delivery of services are
equipped with Fire Bags containing PPE
(Personal Protective Equipment) identified in
consultation with the CFA. Fire bags include
woollen blanket for protection from radiant
heat, torch to assist with visibility , bottled
water for hydration, P1 or P2 face mask for
protection from inhalation of smoke, sturdy
gloves for protection from hot surfaces and
eye protection from smoke and debris. All
PPE is reviewed annually to ensure it is in
good condition,operational and within the
use by date.
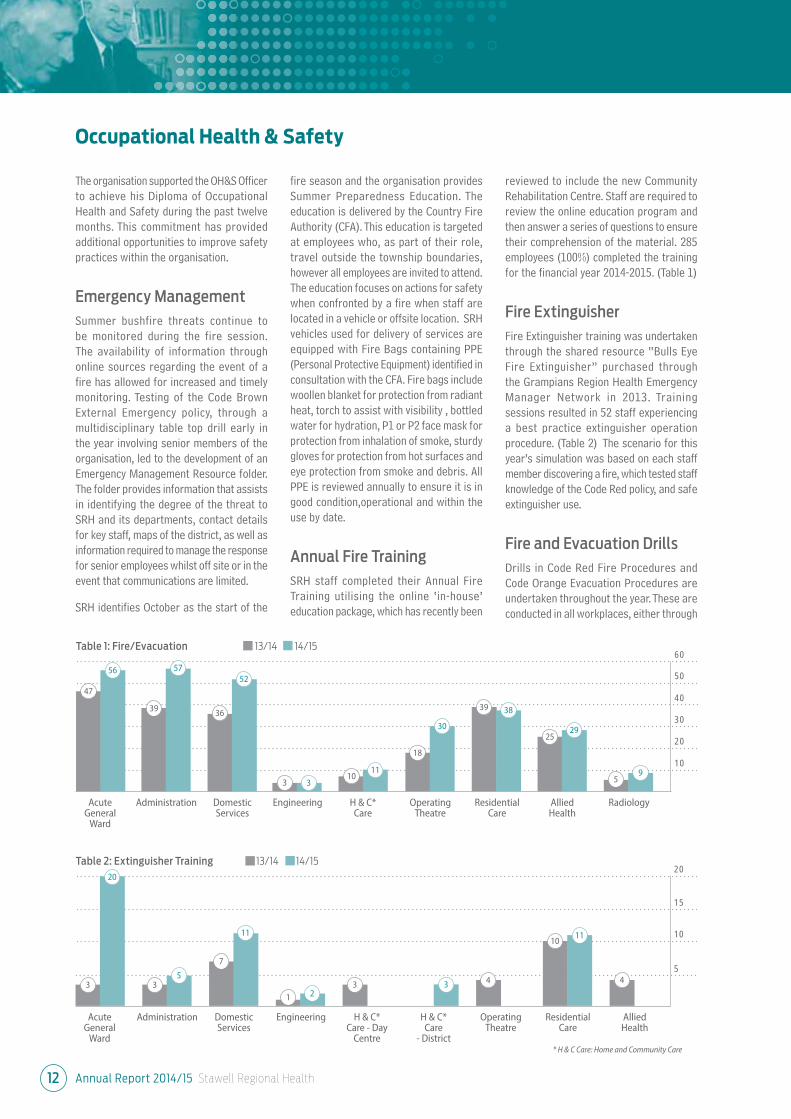
Annual Fire Training
SRH staff completed their Annual Fire
Training utilising the online ‘in-house’
education package, which has recently been
reviewed to include the new Community
Rehabilitation Centre. Staff are required to
review the online education program and
then answer a series of questions to ensure
their comprehension of the material. 285
employees (100%) completed the training
for the financial year 2014-2015. (Table 1)
Fire Extinguisher
Fire Extinguisher training was undertaken
through the shared resource “Bulls Eye
Fire Extinguisher” purchased through
the Grampians Region Health Emergency
Manager Network in 2013. Training
sessions resulted in 52 staff experiencing
a best practice extinguisher operation
procedure. (Table 2) The scenario for this
year’s simulation was based on each staff
member discovering a fire, which tested staff
knowledge of the Code Red policy, and safe
extinguisher use.
Fire and Evacuation Drills
Drills in Code Red Fire Procedures and
Code Orange Evacuation Procedures are
undertaken throughout the year. These are
conducted in all workplaces, either through
Occupational Health & Safety
AcuteGeneral
Ward
50
60
40
30
20
10
47
56
39
57
36
52
3 310
11
18
30
39 38
2529
59
Administration Domestic Services
Engineering H & C*Care
Operating Theatre
Residential Care
Allied Health
Radiology
AcuteGeneral
Ward
15
20
10
5
3
20
35
7
11
1 23 3 4
1011
4
Administration Domestic Services
Engineering H & C* Care - Day
Centre
H & C*Care
- District
Operating Theatre
Residential Care
Allied Health
Table 1: Fire/Evacuation 13/14 14/15
Table 2: Extinguisher Training 13/14 14/15
* H & C Care: Home and Community Care
Annual Report 2014/15 Stawell Regional Health 13
25
30
20
15
10
5
35
2 Moderate 3 Mild 4 No Harm/ Near Miss 5 Unknown
table-top scenarios or active testing. The
active drill is intended to test staff response
to sounding alarms, emergency alerts and
managing an evacuation. Other Codes tested
included Code Purple Bomb Threat and Code
Black Personal Threat.
Incident Reporting
All incidents across the organisation are
reported by staff through the Victorian Health
Incident Management System (VHIMS). When
an incident is entered, the system generates
emails notifying the responsible persons that
an incident has occurred. The responsible
people across the organisation include the
manager of the department, Risk Manager,
OH&S Officer and the Executive Team. The
notification system assists the management
team to provide a quick response to incidents
that occur in the workplace, enabling
hazard and risk management to prevent or
ameliorate staff injuries.
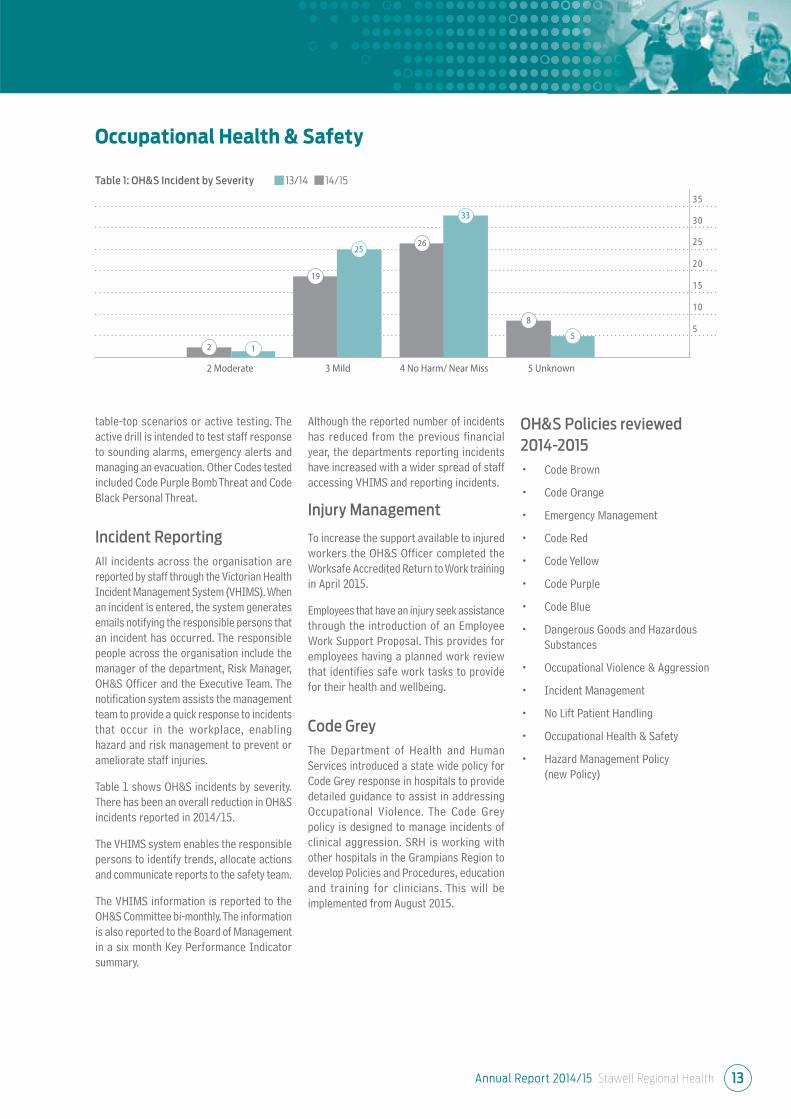
Table 1 shows OH&S incidents by severity.
There has been an overall reduction in OH&S
incidents reported in 2014/15.
The VHIMS system enables the responsible
persons to identify trends, allocate actions
and communicate reports to the safety team.
The VHIMS information is reported to the
OH&S Committee bi-monthly. The information
is also reported to the Board of Management
in a six month Key Performance Indicator
summary.
Although the reported number of incidents
has reduced from the previous financial
year, the departments reporting incidents
have increased with a wider spread of staff
accessing VHIMS and reporting incidents.
Injury Management
To increase the support available to injured
workers the OH&S Officer completed the
Worksafe Accredited Return to Work training
in April 2015.
Employees that have an injury seek assistance
through the introduction of an Employee
Work Support Proposal. This provides for
employees having a planned work review
that identifies safe work tasks to provide
for their health and wellbeing.
Code Grey
The Department of Health and Human
Services introduced a state wide policy for
Code Grey response in hospitals to provide
detailed guidance to assist in addressing
Occupational Violence. The Code Grey
policy is designed to manage incidents of
clinical aggression. SRH is working with
other hospitals in the Grampians Region to
develop Policies and Procedures, education
and training for clinicians. This will be
implemented from August 2015.
OH&S Policies reviewed
2014-2015
• Code Brown
• Code Orange
• Emergency Management
• Code Red
• Code Yellow
• Code Purple
• Code Blue
• Dangerous Goods and Hazardous
Substances
• Occupational Violence & Aggression
• Incident Management
• No Lift Patient Handling
• Occupational Health & Safety
• Hazard Management Policy
(new Policy)
Occupational Health & Safety
2 1
19
2526
33
8
5
Table 1: OH&S Incident by Severity 13/14 14/15
Annual Report 2014/15 Stawell Regional Health14
Attestation for Compliance with the Australian/New Zealand Risk Management Standard
Attestation for compliance with the Ministerial Standing Direction 4.5.5.1 - Insurance
I, Howard Cooper, certify that Stawell Regional Health has complied with Ministerial Direction 4.5.5.1 - Insurance.
I, Howard Cooper, certify that Stawell Regional Health has risk management processes in place consistent with the AS/NZS
ISO 31000:2009 Standard and an internal control system is in place that enables the Executive to understand, manage and
satisfactorily control risk exposures. Stawell Regional Health verifies this assurance and that the risk profile of Stawell Regional
Health has been critically reviewed within the last 12 months.
Howard Cooper
Board Chair
Stawell
31st August 2015
Howard Cooper
Board Chair
Stawell
31st August 2015
Other Information
Consistent with FRD 22F (Section 6.18)
the items listed below have been retained
by Stawell Regional Health Service and
are available to the relevant Ministers,
Members of Parliament and the public
on request (subject to the freedom of
information requirements):
(a) Declarations of pecuniary
interests have been duly
completed by all relevant officers
(b) Details of shares held by senior
officers as nominee or held
beneficially;
(c) Details of publications produced
by the entity about itself, and how
these can be obtained
(d) Details of changes in prices, fees,
charges, rates and levies charged
by the Health Service;
(e) Details of any major external
reviews carried out on the Health
Service;
(f) Details of major research and
development activities undertaken
by the Health Service that are not
otherwise covered either in the
Report of Operations or in a
document that contains the
financial statements and Report
of Operations;
(g) Details of overseas visits
undertaken including a summary
of the objectives and outcomes of
each visit;
(h) Details of major promotional,
public relations and marketing
activities undertaken by the
Health Service to develop
community awareness of the
Health Service and its services;
(i) Details of assessments and
measures undertaken to improve
the occupational health and safety
of employees;
(j) General statement on industrial
relations within the Health
Service and details of time lost
through industrial accidents
and disputes, which is not
otherwise detailed in the Report
of Operations;
(k) A list of major committees
sponsored by the Health Service,
the purposes of each committee
and the extent to which those
purposes have been achieved;
(l) Details of all consultancies and
contractors including consultants/
contractors engaged, services
provided, and expenditure
committed for each engagement.
Annual Report 2014/15 Stawell Regional Health 15
Summary of Services
Stawell Regional Health (SRH) is a public
agency established under the Health
Services Act 1988. We provide public
health and ancillary services as authorised
under the Act, and operate residential care
services under the Aged Care Act 1997.
Providing strategic direction to SRH is
a Board of Management, consisting of
individuals appointed by the Minister for
Health under the Health Services Act. Our
Chief Executive Officer determines how
services are delivered. During the period
of 1 July 2014 to 3 December 2014, we
reported to the responsible Minister for
Health and Ageing, The Hon David Davis
MLC. During the period 4 December 2014
to 30 June 2015, we reported to the
responsible Minister for Heath, Minister for
Ambulance Services, The Hon Jill Hennessy
MLA.
Objectives, Functions, Powers and Duties
of Stawell Regional HealthFundraising
In 2014-2015 we were extremely appreciative of the following fundraising efforts:
The Community Association of Halls Gap donated over $7,200 to purchase two infusion pumps for our Oncology Service. This started our journey of upgrading and replacing all the Oncology pumps.
The Hospital Auxiliary purchased over $20,000 of equipment. This includes three Colleague Single Channel Pumps for the administration of medication; a fridge with an ice maker, and a buffet for Macpherson Smith Residential Care, eleven temporal thermometers and various educational tools for our students.
The Y-Zetts purchased over $10,000 of equipment including an Accuvein, which assists our nurses in “finding a vein” when taking blood tests and administering medication. The Y-Zetts have also purchased needle sets and a needle driver to administer medication.
The Bookworm Gallery have supported the Macpherson Smith Residential Care residents with the purchase of outdoor lifestyle equipment. They have also supported the Oncology Unit with the purchase of an Intravenous Infusion Pump.
The intrepid cyclists of Tour De Cure came through town and donated enough money to Stawell Regional Health to purchase two Vital Sign monitors on stands.
Stawell Quilters, Stawell Line Dancers and Senior Citizens all made donations to the Oncology Service which allowed Stawell Regional Health to replace the final pump required to upgrade all the infusion pumps in the Oncology Service.
The donation from the Navarre Football Club was used to purchase education resources for staff, nursing and medical students including an intravenous pump.
Conundrum Holdings, Stawell Quarry, has been a long term supporter of Stawell Regional Health, assisting us in our work of caring for the community. We have been able to purchase many items of equipment with donations received from Conundrum.
We have had many kind and generous organisations and individuals donate to our health service to maintain and develop our facility as one of the region’s leading hospitals. Thank you to each and every one of you.
Allied Health
• Audiology (visiting)• Community Health Nursing• Continence Clinic• Diabetes Education• Exercise Physiology• Nutrition & Dietetics• Health Promotion• Occupational Therapy• Physiotherapy• Podiatry• Social Work
• Speech Pathology
Community Services• Planned Activities Group (Bennett
Centre for Community Activities)• District Nursing Service• ‘Hospital in the Home’• Post Acute Care• Transition Care Program• Hospital Admission Risk Program
(HARP)
Medical
• Day Oncology Unit
• Acute Care
Medical Imaging
• X-ray• CT
• Ultrasound
Residential Aged Care
• Residential Aged Care Facility
• Aged Care Assessment Service
Rural Primary Care
• Allied Health/Community Services to outlying communities
• Support forBudja Budja Aboriginal
Health Service at Halls Gap
Specialties
• General• Endoscopy• Gynaecology• Obstetrics• Ear, Nose and Throat• Urology• Orthopaedics• Ophthalmology• Medical Oncology• Paediatrics• Rheumatology
• Radiation Oncology
Surgical and Anaesthetic Services
• Pre Admission Clinic• Day Procedure Unit• Operating Suite / Sterilising
Department
St John of God Pathology
Annual Report 2014/15 Stawell Regional Health16
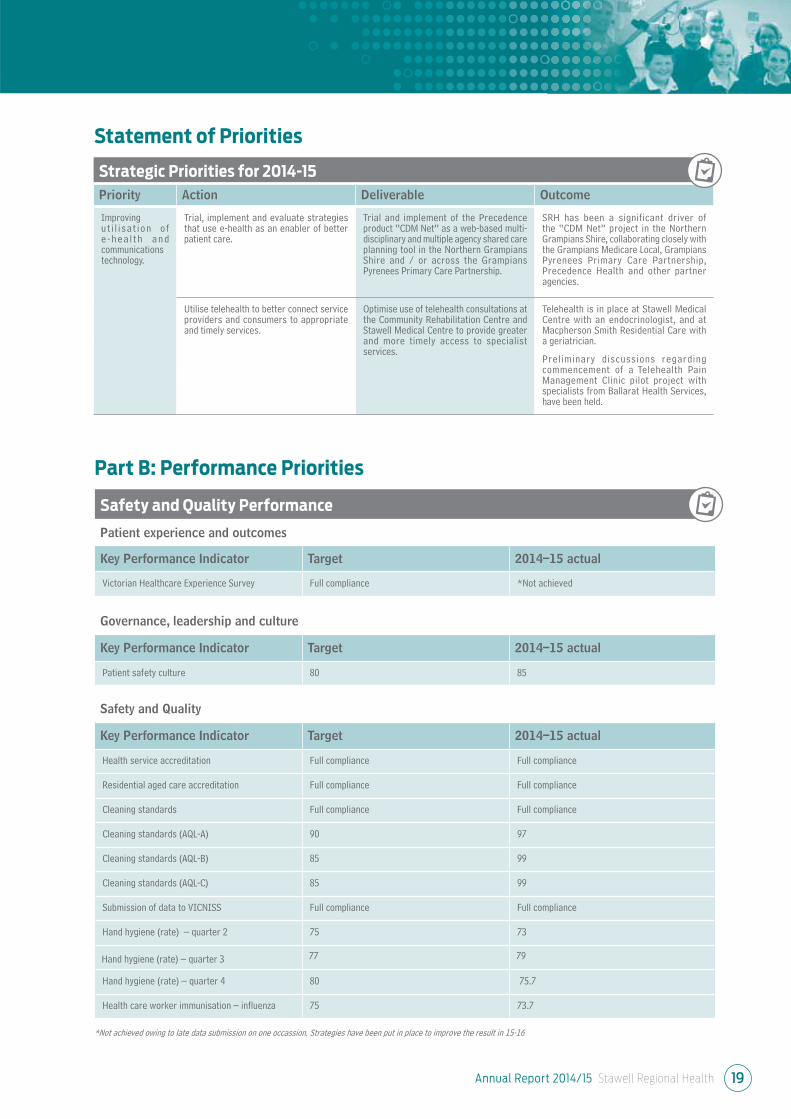
Strategic Priorities for 2014-15
Priority Action Deliverable Outcome
Developing a system that is responsive to people’s needs
Develop an organisational policy for the provision of safe, high quality end of life care in acute and subacute settings with clear guidance about the role of, and access to, specialist palliative care.
In collaboration with Grampians Palliative Care, develop and implement policies and processes to provide high quality end of life care in the acute and subacute settings including referral pathways to access specialist palliative care.
SRH has worked with Grampians Regional Palliative Care Consortium to introduce the End of Life Palliative Care pathway in our residential care facility.
Policies and procedures have been developed, and staff have been educated in their use.
This pathway will be introduced into the acute setting in the next year with engagement of Visiting Medical Officers and acute care staff.
Staff in the sub-acute and community settings refer to the social worker to facilitate Advance Care Planning sessions with consumers.
The oncology unit staff are implementing more robust referrals for allied health specialist care and Advance Care Planning.
Implement an organisation-wide policy for responding to clinical and non-clinical violence and aggression by patients, staff and visitors (including code grey) that aligns with department guidance (2014).
Through the Grampians Region Health Emergency Managers Network and in partnership with Ambulance Victoria, Victoria Police and other key stakeholders, develop an organisation-wide policy for responding to clinical and non-clinical violence and aggression by patients, staff and visitors (which includes Code Grey responses).
Draft Code Grey Policy developed.
Training for Code Grey Response using the Management of Clinical Aggression tool is under development as a regional model through Grampians Regional Health Emergency Managers Network.
Progress partnerships with other services to improve outcomes for regional and rural patients.
Continue to develop partnership arrangements with other agencies such as Ballarat Health Services (BHS) and Ballarat Austin Regional Oncology Centre to enhance service provision including:
• the establishment of a Radiation Oncology Outreach service
• the provision of support to Maryborough and District Health Service in establishing their Day Stay Oncology Service through sharing of intellectual and clinical knowledge and liaison.
Three Ballarat Austin Radiation Oncology Centre specialists have commenced consulting at SRH.
Oncology staff are involved with Grampians Integrated Cancer Service projects.
The Oncology Nurse Practitioner provides fortnightly support to SRH staff to enhance service provision.
The regional Oncology Nurse Practitioner and Oncology staff have provided support to Maryborough and District Health Service.
Implement formal advance care planning structures and processes, including putting into place a system for preparing and/or receiving, and documenting advance care plans in partnership with patients, carers and substitute decision makers.
Further to the prior year’s completion of an Advanced Care Planning (ACP) Framework:
• educate more staff about ACP
• consolidate ACP in programs across acute, aged care and community at SRH
• complete and audit an increased number of ACPs.
A number of clinicians in community, acute and residential care are now trained to complete Advance Care Plans.
Electronic referral process introduced for staff across acute and community settings to refer consumers to trained staff for completion of Advance Care Plans.
Completion of an Advance Care Plan is part of the admission to SRH Macpherson Smith Residential Care.
Statement of Priorities
Annual Report 2014/15 Stawell Regional Health 17
Strategic Priorities for 2014-15
Priority Action Deliverable Outcome
Improving every Victorian’s health status and experiences
Support local implementation of the Victorian Health and Wellbeing Plan 2011–2015 through collaboration with key partners such as Local Government, Medicare Locals, community health services and other agencies (for example Women’s Health Victoria and VACCHO).
SRH will be actively involved in the Grampians Pyrenees Primary Care Partnership, and actively collaborate with the Medicare Local and other partners such as Grampians Community Health and Budja Budja Aboriginal Co-Operative in the delivery of health and well-being initiatives.
SRH will implement strategies from the Healthy Together Victoria project to improve health in the workplace.
SRH continues to have an active role in the Grampians Pyrenees Primary Care Partnership (shared Chair position with East Wimmera Health Service); and Chair role on the Early Intervention in Chronic Disease Management Steering Committee.
Representation on Grampians Pyrenees Primary Care Partnership Integrated Health Promotion and Prevention network.
Active participation in the Grampians Food Alliance on both Steering Committee and Working Groups
Active participation in the Grampians Pyrenees Aboriginal Health Sub – Committee.
Development of formal contract with Budja Budja Aboriginal Co-Operative around service delivery.
Support of the Budja Budja Aboriginal Co-Operative community with participation in the Rural Workforce Agency Victoria Outreach program.
Improving every Victorian’s health status and experiences
Use consumer feedback to improve person and family centred care, health service practice and patient experience.
Establish consumer representative role on the Stawell Regional Health Quality Improvement and Risk Management Committee.
To support health literacy, implement a consumer feedback tool to be utilised by consumer groups to review consumer information and documentation.
Consumer Representative role established on Quality Improvement and Risk Management Committee, effective January 2015.
Quality Manager and Chief Executive have developed and are implementing visits to service groups. A minimum of six service groups will be visited and provided with opportunity for questions and feedback by July 2015.
The feedback tool collects consumer feedback from at least five consumers on newly developed Allied Health patient information brochures / handouts. Feedback has been used to inform changes to format and content prior to publishing of documents.
Improving every Victorian’s health status and experiences
Improve health literacy and support informed choice and shared decision-making by responding to the health information needs of service users.
Audit SRH Health Literacy using the Enliven Organisational Health Literacy Self-assessment Resource to gather base line data against the 10 attributes of a health literate organisation recommended by the Australian Commission on Safety and Quality in Health Care.
Audit measuring levels of Health Literacy against the 10 Attributes of a Health Literate Organisation completed in 2014.
Two year Action Plan developed to address identified gaps.
Expanding service, workforce and system capacity
Develop and implement a workforce immunisation plan that includes pre-employment screening and immunisation assessment for existing staff that work in high risk areas in order to align with Australian infection control and immunisation guidelines.
In collaboration with an Infection Control Practitioner, develop a workforce immunisation plan that includes pre-employment screening and immunisation assessment for new staff and review of existing staff, for those that work in identified high risk areas.
Immunisation workforce plan developed, and includes development of infection control liaison nurses with specialist skills.
Data base developed recording staff immunisation status including new employees, volunteers and board members.
Build workforce capability and sustainability by supporting formal and informal clinical education and training for staff and health students, in particular inter-professional learning.
Commence implementation of the action plan derived from the self-assessment that has been conducted using the Best Practice Clinical Learning Environment Framework.
Review library space with a view to enhancing online learning access and expanding online tools and resources available for SRH staff, contractors and volunteers.
SRH continues to meet the goals of the Best Practice Clinical Learning Environment quality action plan.
Significant progress in developing the orientation process for new staff, including locums, and students to the organisation.
Development of resources and skills in delivery of simulated healthcare education.
Statement of Priorities
Annual Report 2014/15 Stawell Regional Health18
Strategic Priorities for 2014-15
Priority Action Deliverable Outcome
Expanding service, workforce and system capacity
Support excellence in clinical training through productive engagement in clinical training networks and developing health education partnerships across the continuum of learning.
In partnership with Deakin University complete refurbishment of the Clinical Skills Laboratory in the Community Rehabilitation Centre.
Investigate relationships with regional partners such as BHS to optimise education opportunities and infrastructure.
Proposal for library update is a work in progress, and is at the “planning and proposal” to executive stage.
Refurbishment completed of a Simulation Room for training purposes.
Education Manager is a member of the Grampians Region Clinical Training Network.
The Education Department collaborates with the Ballarat Health Services education team on provision of regional education opportunities.
Increasing the system’s financial sustainability and productivity.
Identify and Implement practice change to enhance asset management.
Review Asset Management Policy supporting further development of the Asset Replacement Schedule (ARS).
Internal Audit conducted into Asset Management, Action Plan developed.
Reduce health service administrative costs. Analyse administrative costs relating to internal procurement practices and identify opportunities for cost reduction in line with best practice procurement strategies. For example Health Purchasing Victoria contracts.
SRH Chief Finance Officer identified.
Alignment with Health Purchasing Victoria Policies will be finalised by end 2015-16.
Implementing continuous improvements and innovation
Develop a focus on ‘systems thinking’ to drive improved integration and networking across health care settings.
Continue implementation of Productive Ward and Productive Operating Theatre programs.
Productive Ward work has continued with focus on the clinical handover module.
The Patient Experience Tracker is providing patient feedback to staff.
The Productive Operating Theatre Post Observations Final Report was submitted in June 2015. Staff are continuing this work through the department quality plans.
Implementing continuous improvements and innovation
Drive improved health outcomes through a strong focus on patient-centred care in the planning, delivery and evaluation of services, and the development of new models for putting patients first.
Continue development of model of care in Oncology Service and evaluate.
Investigate models of care to support Urgent Care Centre and Acute Ward requirements, including the use of Rural and Isolated Practice Endorsed Registered Nurse (RIPERN) trained staff.
The Oncology Rehabilitation Program has become a core component of the suite of services offered to oncology patients.
Review of on-call arrangements around Urgent Care Centre support.
One nursing staff training in Rural and Isolated Practice Endorsed Registered Nurse (RIPERN) and developing policies around the Model. The full-time “RIPERN” qualified staff member has left SRH, hence the model had not been implemented for medication management at the time of this report.
Increasing accountability & transparency
Undertake an annual board assessment to identify and develop board capability to ensure all board members are well equipped to effectively discharge their responsibilities.
Complete annual board assessment and utilise findings to continue to develop new and existing board member skills supporting governance and accountability.
Undertake an Open Access Board Meeting in a local rural community and evaluate the outcome to support on-going implementation.
Annual Board Assessment completed.
Action Plan under development.
Successful Open Access Board Meeting conducted in September 2014.
Demonstrate a strategic focus and commitment to aged care by responding to community need as well as the Commonwealth Living Longer Living Better reforms.
Implement Dementia Support Program through appointment of “Memory Support Nurse”.
Implement activities from the Three Year Active Service Plan Review.
Dementia Support Program established.
Memory Support Nurse appointed October 2014. Referrals received from across the sub region including Ararat, St Arnaud, and Beaufort
Active Service Model implementation continues with the Allied Health and Community and Complex Care teams, including Home And Community Care programs implementing person centred screening and care planning. Promotion of referrals to exercise physiologist and group programs undertaken.
Statement of Priorities
Annual Report 2014/15 Stawell Regional Health 19
Strategic Priorities for 2014-15
Priority Action Deliverable Outcome
Improving u t i l i sa t ion o f e - h e a l t h a n d communications technology.
Trial, implement and evaluate strategies that use e-health as an enabler of better patient care.
Trial and implement of the Precedence product “CDM Net” as a web-based multi-disciplinary and multiple agency shared care planning tool in the Northern Grampians Shire and / or across the Grampians Pyrenees Primary Care Partnership.
SRH has been a significant driver of the “CDM Net” project in the Northern Grampians Shire, collaborating closely with the Grampians Medicare Local, Grampians Pyrenees Primary Care Partnership, Precedence Health and other partner agencies.
Utilise telehealth to better connect service providers and consumers to appropriate and timely services.
Optimise use of telehealth consultations at the Community Rehabilitation Centre and Stawell Medical Centre to provide greater and more timely access to specialist services.
Telehealth is in place at Stawell Medical Centre with an endocrinologist, and at Macpherson Smith Residential Care with a geriatrician.
Preliminary discussions regarding commencement of a Telehealth Pain Management Clinic pilot project with specialists from Ballarat Health Services, have been held.
Statement of Priorities
Safety and Quality Performance
Patient experience and outcomes
Key Performance Indicator Target 2014–15 actual
Victorian Healthcare Experience Survey Full compliance *Not achieved
Governance, leadership and culture
Key Performance Indicator Target 2014–15 actual
Patient safety culture 80 85
Safety and Quality
Key Performance Indicator Target 2014–15 actual
Health service accreditation Full compliance Full compliance
Residential aged care accreditation Full compliance Full compliance
Cleaning standards Full compliance Full compliance
Cleaning standards (AQL-A) 90 97
Cleaning standards (AQL-B) 85 99
Cleaning standards (AQL-C) 85 99
Submission of data to VICNISS Full compliance Full compliance
Hand hygiene (rate) – quarter 2 75 73
Hand hygiene (rate) – quarter 3 77 79
Hand hygiene (rate) – quarter 4 80 75.7
Health care worker immunisation – influenza 75 73.7
Part B: Performance Priorities
*Not achieved owing to late data submission on one occassion. Strategies have been put in place to improve the result in 15-16
Annual Report 2014/15 Stawell Regional Health20
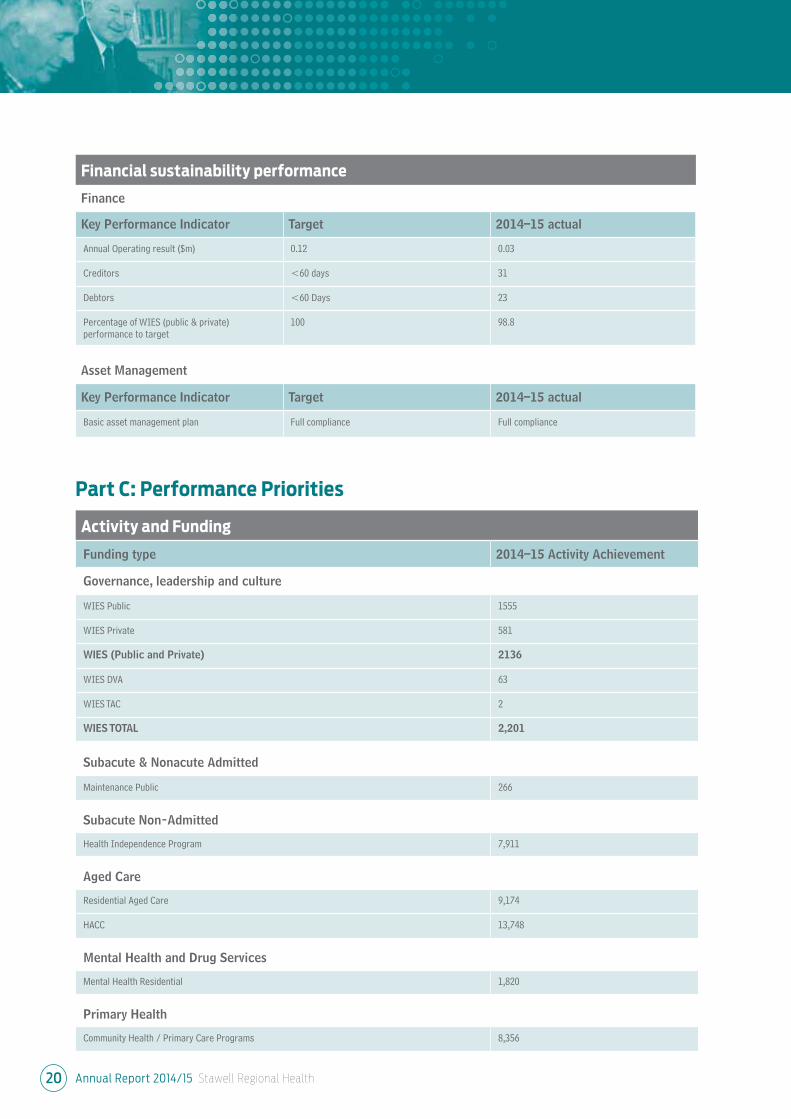
Activity and Funding
Funding type 2014–15 Activity Achievement
Governance, leadership and culture
WIES Public 1555
WIES Private 581
WIES (Public and Private) 2136
WIES DVA 63
WIES TAC 2
WIES TOTAL 2,201
Subacute & Nonacute Admitted
Maintenance Public 266
Subacute Non-Admitted
Health Independence Program 7,911
Aged Care
Residential Aged Care 9,174
HACC 13,748
Mental Health and Drug Services
Mental Health Residential 1,820
Primary Health
Community Health / Primary Care Programs 8,356
Part C: Performance Priorities
Financial sustainability performance
Finance
Key Performance Indicator Target 2014–15 actual
Annual Operating result ($m) 0.12 0.03
Creditors <60 days 31
Debtors <60 Days 23
Percentage of WIES (public & private) performance to target
100 98.8
Asset Management
Key Performance Indicator Target 2014–15 actual
Basic asset management plan Full compliance Full compliance
Annual Report 2014/15 Stawell Regional Health 21
Pecuniary interests
Members of the Board of Management
are required under the Hospital By-Laws
to declare their pecuniary interest in any
matter that may be discussed by the Board
or Board Sub-Committees.
Equal Opportunity
Stawell Regional Health (SRH) is committed
to providing an Equal Employment
Opportunity (EEO) work environment
for both existing and prospective staff
members. It is the responsibility of each
and every employee within SRH to observe
EEO principles.
The Chief Executive Officer or their appointed
delegates have primary responsibility
for all aspects of the Equal Employment
Opportunity Policy and related programs
within SRH.
Hospital fees
The Hospital charges fees in accordance
with the Department of Health and Human
Services (Vic), Department of Health and
Ageing and Home and Community Care
(HACC) directives.
Compliance with Data Vic
Access Policy
Consistent with the DataVic Access Policy
issued by the Victorian Government
in 2012, the information included in
this Annual Report will be available at
http://www.data.vic.gov.au in machine
readable format.
Staffing profile
A total of 279 persons were employed by
Stawell Regional Health: During this period
Full time 69, Part time 134 and Casual 76.
Compliance with the
Building Act 1993
BUILDING STANDARDS AND
CONDITION ASSESSMENTS
Fire audits and risk assessments are
undertaken by consultant fire engineers
in compliance with the Department of
Health Fire Risk Management Engineering
Guidelines Series 7. Recommendations from
the fire audits and risk assessments are
actioned in conjunction with the Department
of Health and Human Services to maintain
a high degree of fire safety. All bed-based
facilities are audited at intervals of a
maximum of five years. Stawell Regional
Health was last audited on 12th January
2010 by ARUP Fire (Fire Engineers) and
Brian Sherwell & Associates (Building
Surveyor). The current five year cycle audits
have commenced. Stawell Regional Health
has contracted Brian Sherwell & Associates
to carry out the audits. A plan is in place
to guide and prioritise actions arising from
these reviews.
ESSENTIAL SAFETY MEASURES
MAINTENANCE
In accordance with regulatory requirements,
service and maintenance records are kept
to enable completion of an annual Essential
Safety Measures Report for all properties
owned by Stawell Regional Health. This is
confirmation that all essential services are
operational at the required level of
performance. Records and reports are
retained on the premises for inspection by
all relevant authorities.
Legislative Compliance
Stawell Regional Health uses the Riskman
Software System to record and manage
risk, and Board Assurance on Compliance
e-System (BACeS) to manage compliance
obligations in line with State and
Commonwealth legislation and Australian
Standards.
Industrial Relations
Stawell Regional Health experienced no
days of work lost due to industrial activity
during the year ending 30 June, 2015.
Publications
Stawell Regional Health produces a number
of publications for the community to assist
them to gain a better understanding of our
services and programs. They include the
Annual Report, Quality of Care Report and a
range of patient information brochures that
are available throughout Stawell Regional
Health.
The Annual Report is presented at the
Annual General Meeting each year.
Protected Disclosure
Act 2012
Stawell Regional Health is committed to
the aims and objectives of the Protected
Disclosure Act 2012 (the Act). Stawell
Regional Health Service addresses this
through leadership and management,
including raising awareness of the act and
educating staff.
Statutory Reporting Requirements
Consultancies
Details of all consultancies of $10,000 or greater can be found on our website: www.srh.org.au
In 2014-15 there were no individual consultancies where the total fees payable to the consultants were over $10,000.
In 2014–15 there were four consultancies where the total fees payable to the consultants were under $10,000. The total
expenditure incurred during 2014-15 in relation to these consultancies was $6,380.46 (GST exclusive).
Annual Report 2014/15 Stawell Regional Health22
Statutory Reporting Requirements
Attestation on Data Integrity
I, Liz McCourt, certify that Stawell Regional Health has put in place appropriate internal controls and processes to ensure that reported
data reasonably reflects actual performance. Stawell Regional Health has critically reviewed these controls and processes during the year.
Liz McCourt
Chief Executive
Stawell
31st August, 2015
Stawell Regional Health incorporates Macpherson Smith Residential Care, Stawell Medical Centre and the Bennett Centre for Community
Activities, Sloane Street, Stawell Victoria 3380. Phone (03) 5358 8500 Fax (03) 5358 3553 Email: [email protected] Web: www.srh.org.au
Freedom of Information
Stawell Regional Health has received 13
requests for information under the Freedom
of Information Act (1982) during the 2014-15
financial year, a decrease of one (1) on the
previous financial year.
• Ten cases were granted in full
• No cases where the records were
destroyed.
• No requests for access were denied
• Two cases where no documents
were available
• In one case the request was not
proceeded with
• There were no cases where the
requests were not finalised at the
time of reporting.
Victorian Industry
Participation Policy
Stawell Regional Health complies with the
Victorian Industry Participation Policy Act
2003.
Competitive Neutrality
All competitive neutrality requirements were
met in accordance with the requirements
of the Government policy statement,
Competitive Neutrality Policy Victoria and
subsequent reforms.
Financial Management
Act 1994
In accordance with the Direction of the
Minister for Finance, the information
has been prepared and is available to
the relevant Minister, and Members of
Parliament.
Disability Action Plan (DAP)
Stawell Regional Health has developed
a Disability Action Plan, with input from
departments across the Service, to combine
key details around the current and future
needs of service and access for people with
a disability.
Further implementation, including evaluation
and review, will be undertaken in the near
future through the Executive to continue to
determine key priorities in current strategic
planning processes.
Carers Recognition Act 2012
Stawell Regional Health has taken measures
to ensure awareness and understanding
of care relationship principles, in line with
Section 11 of the Carer’s Recognition Act 2012.
Publication of Annual Reports
Stawell Regional Health complies with the
Standard Requirements for the Publication
of Annual Reports.
Reporting on Office Based
Environmental Data
Stawell Regional Health is committed to
reducing our greenhouse footprint, and
conducts Environmental Meetings each
quarter to achieve a reduction in water
consumption and landfill and increase
recycling rates and energy efficiency.
Environmental data is reported to the
Department of Health and Human Services
via the Agency Information Management
System (AIMS).
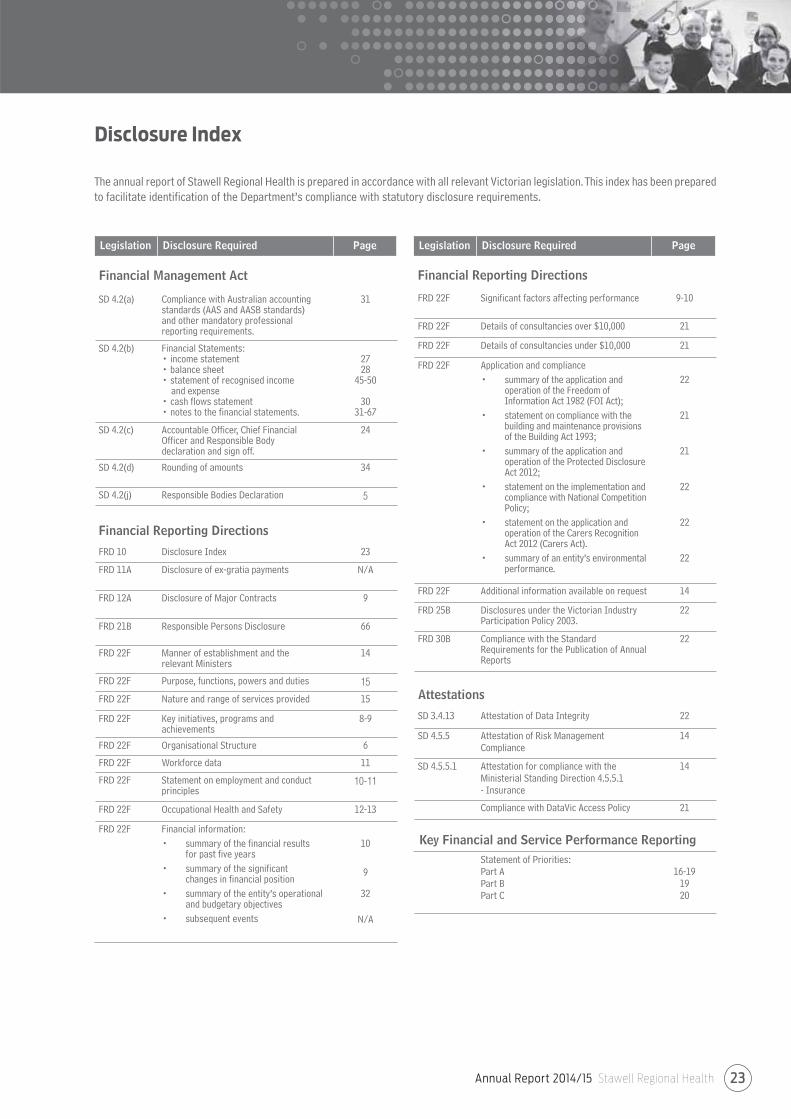
Annual Report 2014/15 Stawell Regional Health 23
SD 4.2(a) Compliance with Australian accounting standards (AAS and AASB standards)and other mandatory professional reporting requirements.
31
SD 4.2(b) Financial Statements:• income statement • balance sheet• statement of recognised income and expense• cash flows statement• notes to the financial statements.
2728
45-50
3031-67
SD 4.2(c) Accountable Officer, Chief Financial Officer and Responsible Body declaration and sign off.
24
SD 4.2(d) Rounding of amounts 34
SD 4.2(j) Responsible Bodies Declaration 5
Financial Reporting Directions
FRD 10 Disclosure Index 23
FRD 11A Disclosure of ex-gratia payments N/A
FRD 12A Disclosure of Major Contracts 9
FRD 21B Responsible Persons Disclosure 66
FRD 22F Manner of establishment and therelevant Ministers
14
FRD 22F Purpose, functions, powers and duties 15
FRD 22F Nature and range of services provided 15
FRD 22F Key initiatives, programs andachievements
8-9
FRD 22F Organisational Structure 6
FRD 22F Workforce data 11
FRD 22F Statement on employment and conduct principles
10-11
FRD 22F Occupational Health and Safety 12-13
FRD 22F Financial information:
• summary of the financial resultsfor past five years
• summary of the significantchanges in financial position
• summary of the entity’s operational and budgetary objectives
• subsequent events
10
9
32
N/A
Disclosure Index
The annual report of Stawell Regional Health is prepared in accordance with all relevant Victorian legislation. This index has been prepared
to facilitate identification of the Department’s compliance with statutory disclosure requirements.
Financial Reporting Directions
FRD 22F Significant factors affecting performance 9-10
FRD 22F Details of consultancies over $10,000 21
FRD 22F Details of consultancies under $10,000 21
FRD 22F Application and compliance
• summary of the application and operation of the Freedom of Information Act 1982 (FOI Act);
• statement on compliance with the building and maintenance provisions of the Building Act 1993;
• summary of the application and operation of the Protected Disclosure Act 2012;
• statement on the implementation and compliance with National Competition Policy;
• statement on the application and operation of the Carers Recognition Act 2012 (Carers Act).
• summary of an entity’s environmental performance.
22
21
21
22
22
22
FRD 22F Additional information available on request 14
FRD 25B Disclosures under the Victorian Industry Participation Policy 2003.
22
FRD 30B Compliance with the Standard Requirements for the Publication of Annual Reports
22
Attestations
SD 3.4.13 Attestation of Data Integrity 22
SD 4.5.5 Attestation of Risk Management Compliance
14
SD 4.5.5.1 Attestation for compliance with the Ministerial Standing Direction 4.5.5.1 - Insurance
14
Compliance with DataVic Access Policy 21
Key Financial and Service Performance Reporting
Statement of Priorities:Part APart BPart C
16-191920
Legislation Disclosure Required Page
Financial Management Act
Legislation Disclosure Required Page
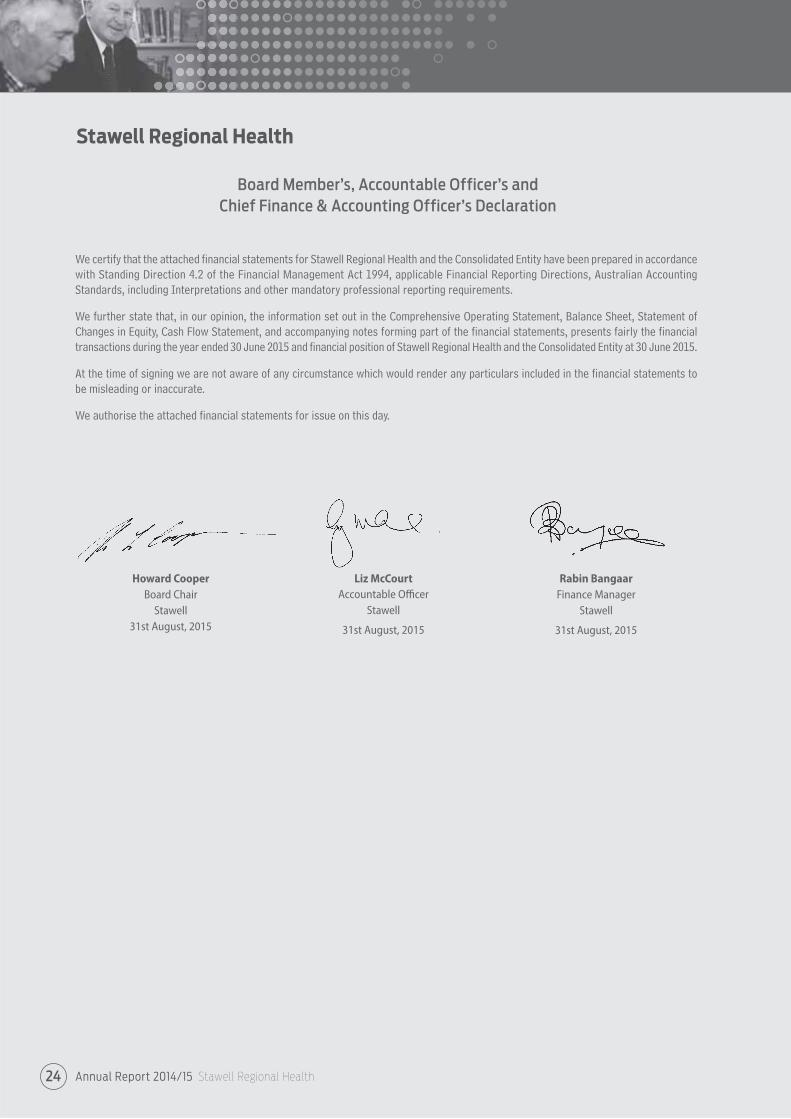
We certify that the attached financial statements for Stawell Regional Health and the Consolidated Entity have been prepared in accordance
with Standing Direction 4.2 of the Financial Management Act 1994, applicable Financial Reporting Directions, Australian Accounting
Standards, including Interpretations and other mandatory professional reporting requirements.
We further state that, in our opinion, the information set out in the Comprehensive Operating Statement, Balance Sheet, Statement of
Changes in Equity, Cash Flow Statement, and accompanying notes forming part of the financial statements, presents fairly the financial
transactions during the year ended 30 June 2015 and financial position of Stawell Regional Health and the Consolidated Entity at 30 June 2015.
At the time of signing we are not aware of any circumstance which would render any particulars included in the financial statements to
be misleading or inaccurate.
We authorise the attached financial statements for issue on this day.
Howard Cooper
Board Chair
Stawell
31st August, 2015
Liz McCourt
Accountable Offi cer
Stawell
31st August, 2015
Rabin Bangaar
Finance Manager
Stawell
31st August, 2015
Board Member’s, Accountable Officer’s and
Chief Finance & Accounting Officer’s Declaration
Stawell Regional Health
Annual Report 2014/15 Stawell Regional Health24
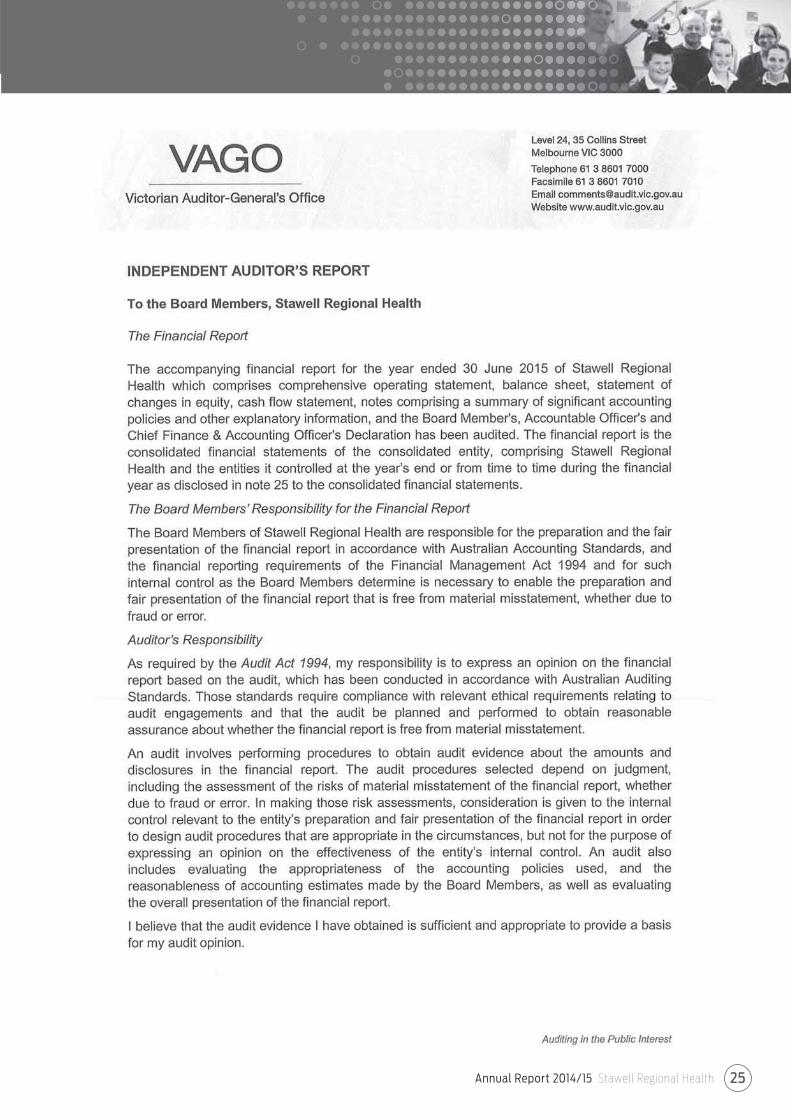
Annual Report 2014/15 Stawell Regional Health 25
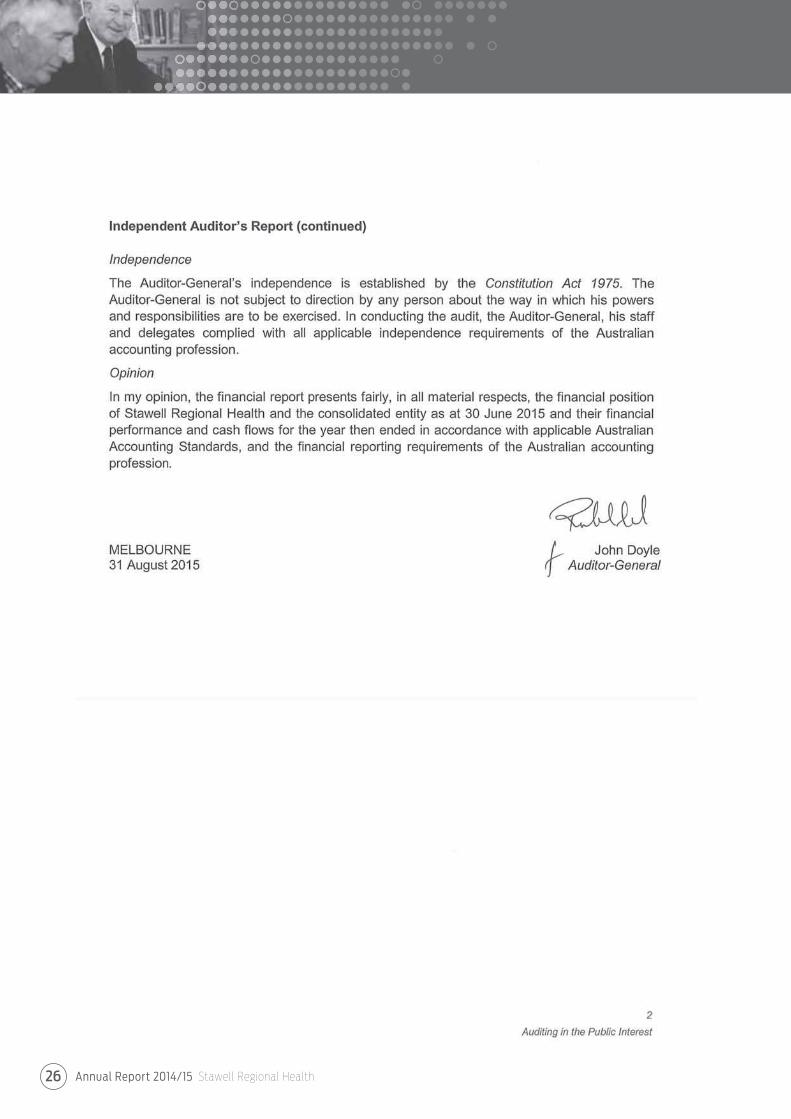
Annual Report 2014/15 Stawell Regional Health26
Annual Report 2014/15 Stawell Regional Health 27
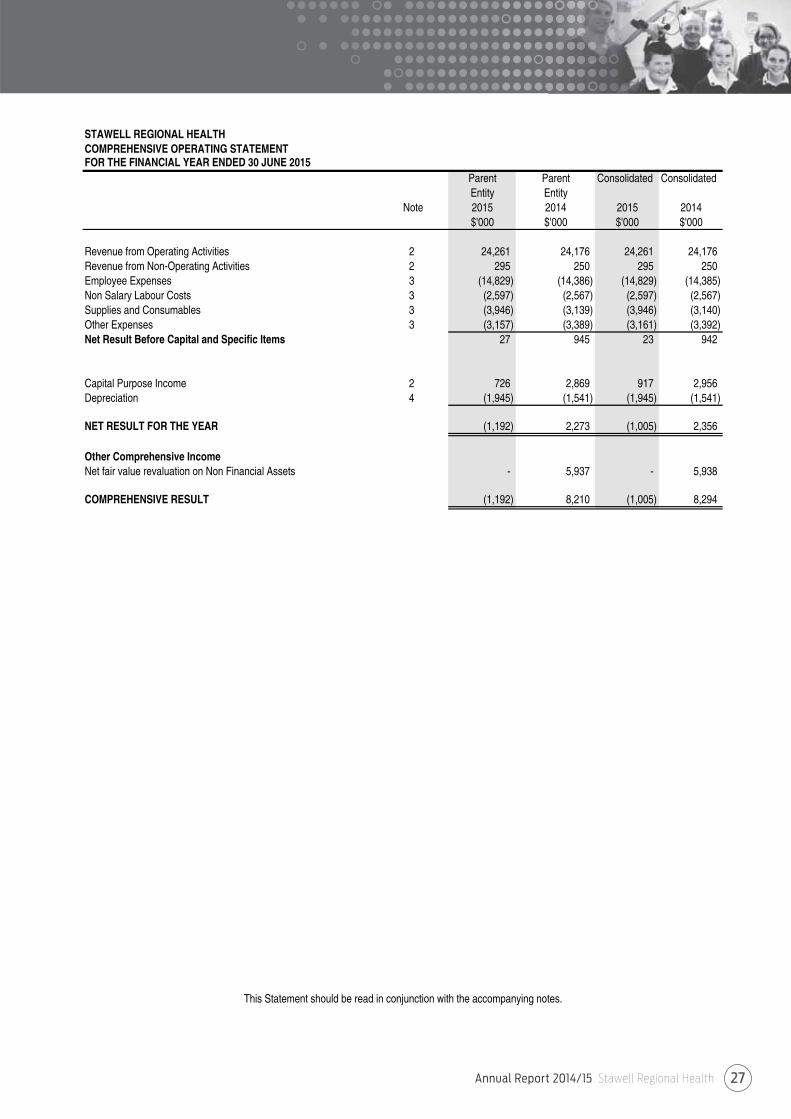
STAWELL REGIONAL HEALTHCOMPREHENSIVE OPERATING STATEMENTFOR THE FINANCIAL YEAR ENDED 30 JUNE 2015
Parent Parent Consolidated ConsolidatedEntity Entity
Note 2015 2014 2015 2014$'000 $'000 $'000 $'000
Revenue from Operating Activities 2 24,261 24,176 24,261 24,176 Revenue from Non-Operating Activities 2 295 250 295 250 Employee Expenses 3 (14,829) (14,386) (14,829) (14,385) Non Salary Labour Costs 3 (2,597) (2,567) (2,597) (2,567) Supplies and Consumables 3 (3,946) (3,139) (3,946) (3,140) Other Expenses 3 (3,157) (3,389) (3,161) (3,392) Net Result Before Capital and Specific Items 27 945 23 942
Capital Purpose Income 2 726 2,869 917 2,956 Depreciation 4 (1,945) (1,541) (1,945) (1,541)
NET RESULT FOR THE YEAR (1,192) 2,273 (1,005) 2,356
Other Comprehensive IncomeNet fair value revaluation on Non Financial Assets - 5,937 - 5,938
COMPREHENSIVE RESULT (1,192) 8,210 (1,005) 8,294
This Statement should be read in conjunction with the accompanying notes.
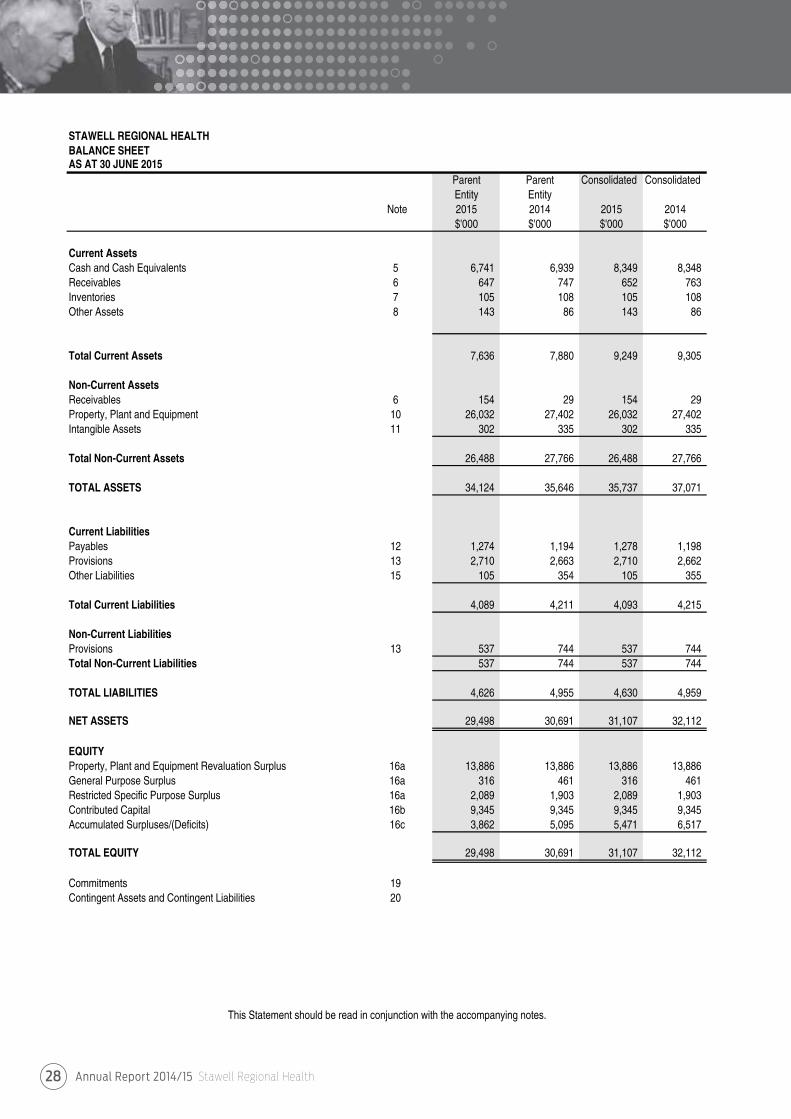
Annual Report 2014/15 Stawell Regional Health28
STAWELL REGIONAL HEALTHBALANCE SHEETAS AT 30 JUNE 2015
Parent Parent Consolidated ConsolidatedEntity Entity
Note 2015 2014 2015 2014$'000 $'000 $'000 $'000
Current AssetsCash and Cash Equivalents 5 6,741 6,939 8,349 8,348 Receivables 6 647 747 652 763 Inventories 7 105 108 105 108 Other Assets 8 143 86 143 86
Total Current Assets 7,636 7,880 9,249 9,305
Non-Current AssetsReceivables 6 154 29 154 29 Property, Plant and Equipment 10 26,032 27,402 26,032 27,402 Intangible Assets 11 302 335 302 335
Total Non-Current Assets 26,488 27,766 26,488 27,766
TOTAL ASSETS 34,124 35,646 35,737 37,071
Current LiabilitiesPayables 12 1,274 1,194 1,278 1,198 Provisions 13 2,710 2,663 2,710 2,662 Other Liabilities 15 105 354 105 355
Total Current Liabilities 4,089 4,211 4,093 4,215
Non-Current LiabilitiesProvisions 13 537 744 537 744 Total Non-Current Liabilities 537 744 537 744
TOTAL LIABILITIES 4,626 4,955 4,630 4,959
NET ASSETS 29,498 30,691 31,107 32,112
EQUITYProperty, Plant and Equipment Revaluation Surplus 16a 13,886 13,886 13,886 13,886 General Purpose Surplus 16a 316 461 316 461 Restricted Specific Purpose Surplus 16a 2,089 1,903 2,089 1,903 Contributed Capital 16b 9,345 9,345 9,345 9,345 Accumulated Surpluses/(Deficits) 16c 3,862 5,095 5,471 6,517
TOTAL EQUITY 29,498 30,691 31,107 32,112
Commitments 19Contingent Assets and Contingent Liabilities 20
This Statement should be read in conjunction with the accompanying notes.
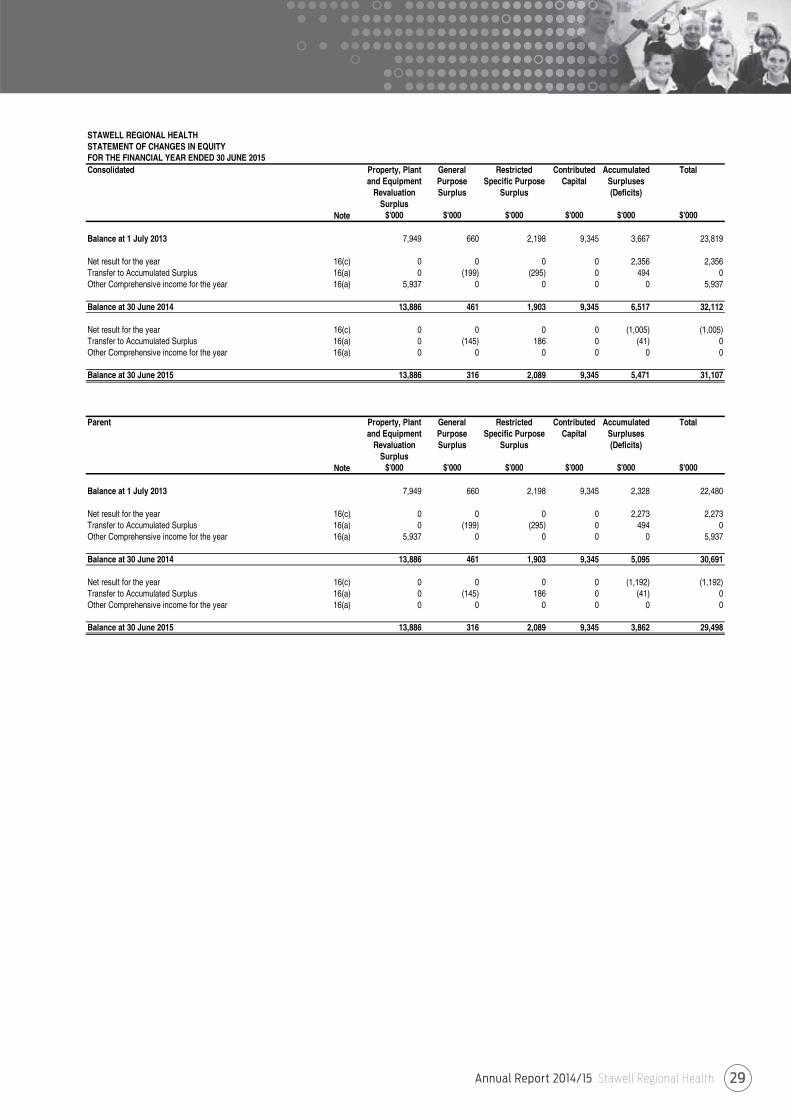
Annual Report 2014/15 Stawell Regional Health 29
STAWELL REGIONAL HEALTHSTATEMENT OF CHANGES IN EQUITYFOR THE FINANCIAL YEAR ENDED 30 JUNE 2015Consolidated Property, Plant General Restricted Contributed Accumulated Total
and Equipment Purpose Specific Purpose Capital SurplusesRevaluation Surplus Surplus (Deficits)
SurplusNote $'000 $'000 $'000 $'000 $'000 $'000
Balance at 1 July 2013 7,949 660 2,198 9,345 3,667 23,819
Net result for the year 16(c) 0 0 0 0 2,356 2,356Transfer to Accumulated Surplus 16(a) 0 (199) (295) 0 494 0Other Comprehensive income for the year 16(a) 5,937 0 0 0 0 5,937
Balance at 30 June 2014 13,886 461 1,903 9,345 6,517 32,112
Net result for the year 16(c) 0 0 0 0 (1,005) (1,005)Transfer to Accumulated Surplus 16(a) 0 (145) 186 0 (41) 0Other Comprehensive income for the year 16(a) 0 0 0 0 0 0
Balance at 30 June 2015 13,886 316 2,089 9,345 5,471 31,107
Parent Property, Plant General Restricted Contributed Accumulated Totaland Equipment Purpose Specific Purpose Capital Surpluses
Revaluation Surplus Surplus (Deficits)Surplus
Note $'000 $'000 $'000 $'000 $'000 $'000
Balance at 1 July 2013 7,949 660 2,198 9,345 2,328 22,480
Net result for the year 16(c) 0 0 0 0 2,273 2,273Transfer to Accumulated Surplus 16(a) 0 (199) (295) 0 494 0Other Comprehensive income for the year 16(a) 5,937 0 0 0 0 5,937
Balance at 30 June 2014 13,886 461 1,903 9,345 5,095 30,691
Net result for the year 16(c) 0 0 0 0 (1,192) (1,192)Transfer to Accumulated Surplus 16(a) 0 (145) 186 0 (41) 0Other Comprehensive income for the year 16(a) 0 0 0 0 0 0
Balance at 30 June 2015 13,886 316 2,089 9,345 3,862 29,498
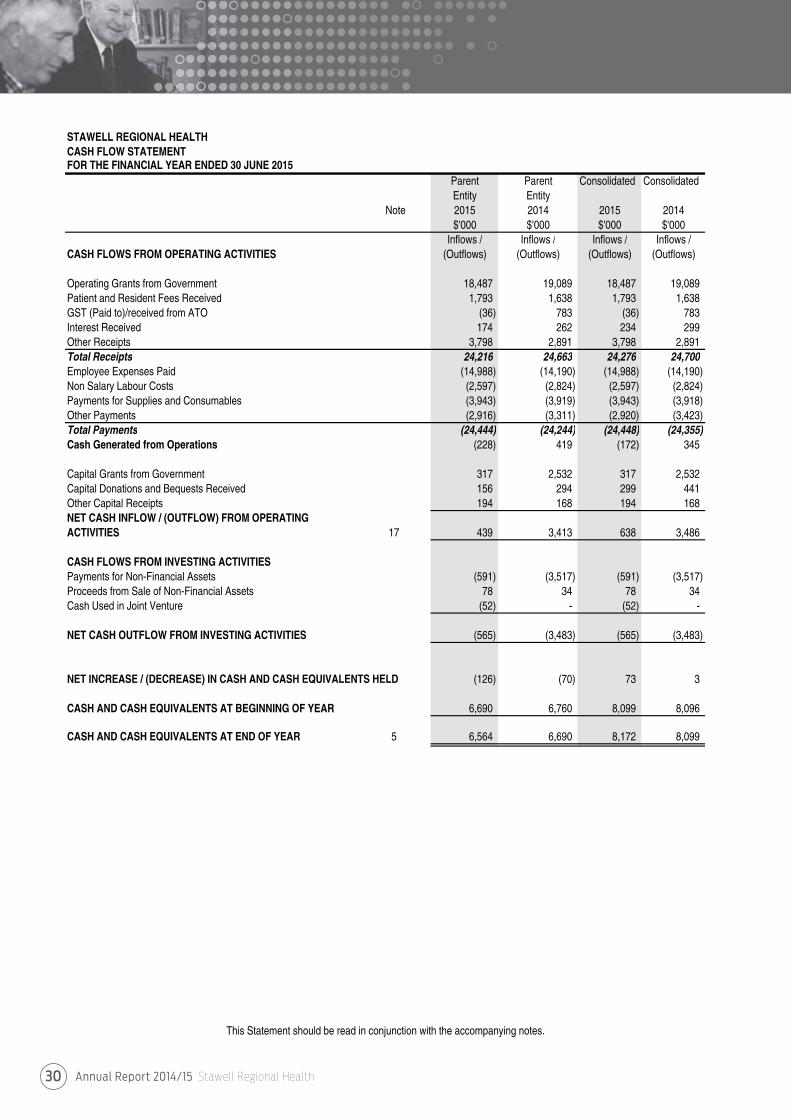
Annual Report 2014/15 Stawell Regional Health30
STAWELL REGIONAL HEALTHCASH FLOW STATEMENT FOR THE FINANCIAL YEAR ENDED 30 JUNE 2015
Parent Parent Consolidated ConsolidatedEntity Entity
Note 2015 2014 2015 2014$'000 $'000 $'000 $'000
Inflows / Inflows / Inflows / Inflows /CASH FLOWS FROM OPERATING ACTIVITIES (Outflows) (Outflows) (Outflows) (Outflows)
Operating Grants from Government 18,487 19,089 18,487 19,089 Patient and Resident Fees Received 1,793 1,638 1,793 1,638 GST (Paid to)/received from ATO (36) 783 (36) 783 Interest Received 174 262 234 299 Other Receipts 3,798 2,891 3,798 2,891 Total Receipts 24,216 24,663 24,276 24,700 Employee Expenses Paid (14,988) (14,190) (14,988) (14,190) Non Salary Labour Costs (2,597) (2,824) (2,597) (2,824) Payments for Supplies and Consumables (3,943) (3,919) (3,943) (3,918) Other Payments (2,916) (3,311) (2,920) (3,423) Total Payments (24,444) (24,244) (24,448) (24,355) Cash Generated from Operations (228) 419 (172) 345
Capital Grants from Government 317 2,532 317 2,532 Capital Donations and Bequests Received 156 294 299 441 Other Capital Receipts 194 168 194 168 NET CASH INFLOW / (OUTFLOW) FROM OPERATINGACTIVITIES 17 439 3,413 638 3,486
CASH FLOWS FROM INVESTING ACTIVITIESPayments for Non-Financial Assets (591) (3,517) (591) (3,517) Proceeds from Sale of Non-Financial Assets 78 34 78 34 Cash Used in Joint Venture (52) - (52) -
NET CASH OUTFLOW FROM INVESTING ACTIVITIES (565) (3,483) (565) (3,483)
NET INCREASE / (DECREASE) IN CASH AND CASH EQUIVALENTS HELD (126) (70) 73 3
CASH AND CASH EQUIVALENTS AT BEGINNING OF YEAR 6,690 6,760 8,099 8,096
CASH AND CASH EQUIVALENTS AT END OF YEAR 5 6,564 6,690 8,172 8,099
This Statement should be read in conjunction with the accompanying notes.
Annual Report 2014/15 Stawell Regional Health 31
Stawell Regional Health Notes to Financial Statements
30 June 2015
NOTE 1 : SUMMARY OF SIGNIFICANT ACCOUNTING POLICIESThese annual financial statements represent the audited general purpose financial statements for Stawell Regional Health for the period ending 30 June 2015. The purpose of the report is to provide users with information about the Health Services' stewardship of resources entrusted to it.
(a) Statement of complianceThese financial statements are general purpose financial statements which have been prepared in accordance with the Financial Management Act 1994, and applicable Australian Accounting Standards (AASs), which include interpretations issued by the Australian Accounting Standards Board (AASB). They are presented in a manner consistent with the requirements of AASB 101 Presentation of Financial Statements.
The financial statements also comply with relevant Financial Reporting Directions (FRDs) issued by the Department of Treasury andFinance, and relevant Standing Directions (SDs) authorised by the Minister for Finance.
The Health Service is a not-for profit entity and therefore applies the additional AUS paragraphs applicable to "not-for-profit" HealthServices under the AAS's.
The annual financial statements were authorised for issue by the Board of Stawell Regional Health on:27th August, 2015.
(b) Basis of accounting preparation and measurementAccounting policies are selected and applied in a manner which ensures that the resulting financial information satisfies the conceptsof relevance and reliability, thereby ensuring that the substance of the underlying transactions or other events is reported.
The accounting policies set out below have been applied in preparing the financial statements for the year ended 30 June 2015,and the comparative information presented in these financial statements for the year ended 30 June 2014.
The going concern basis was used to prepare the financial statements.
These financial statements are presented in Australian Dollars, the functional and presentation currency of the Health Service.
The financial statements, except for cash flow information, have been prepared using the accrual basis of accounting.Under the accrual basis, items are recognised as assets, liabilities, equity, income or expenses when they satisfy the definitionsand recognition criteria for those items, that is they are recognised in the reporting period to which they relate, regardless of whencash is received or paid.
The financial statements are prepared in accordance with the historical cost convention, except for:
• Non-current physical assets, which subsequent to acquisition, are measured at a revalued amount being their fair value at the date of the revaluation less any subsequent accumulated depreciation and subsequent impairment losses. Revaluations are made and are reassessed with sufficient regularity to ensure that the carrying amounts do not materially differ from their fair values;
• Derivative financial instruments, managed investment schemes, certain debt securities, and investment properties after initial recognition, which are measured at fair value with changes reflected in the comprehensive operating statement (fair value through profit and loss);
• Available-for-sale investments which are measured at fair value with movements reflected in equity until the asset is derecognised (i.e. other comprehensive income - items that may be reclassified subsequent to net result); and
• The fair value of assets other than land is generally based on their depreciated replacement value.
Judgements, estimates and assumptions are required to be made about the carrying values of assets and liabilities that are not readily apparent from other sources. The estimates and associated assumptions are based on professional judgements derived from historical experience and various other factors that are believed to be reasonable under the circumstances.Actual results may differ from these estimates.
Consistent with AASB 13 Fair Value Measurement, Stawell Regional Health determines the policies and procedures for both recurring fair value measurements such as property, plant and equipment, investment properties and financial instruments, and fornon-recurring fair value measurements such as non-financial physical assets held for sale, in accordance with the requirements of AASB 13 and the relevant FRDs.
All assets and liabilities for which fair value is measured or disclosed in the financial statements are categorised within the fair value hierarchy, described as follows, based on the lowest level input that is significant to the fair value measurement as a whole:
• Level 1 – Quoted (unadjusted) market prices in active markets for identical assets or liabilities• Level 2 – Valuation techniques for which the lowest level input that is significant to the fair value measurement is directly or indirectly observable• Level 3 – Valuation techniques for which the lowest level input that is significant to the fair value measurement is unobservable.
Annual Report 2014/15 Stawell Regional Health32
Stawell Regional Health Notes to Financial Statements
30 June 2015
(b) Basis of accounting preparation and measurement (Continued)For the purpose of fair value disclosures, Stawell Regional Health has determined classes of assets and liabilities on the basis of the nature, characteristics and risks of the asset or liability and the level of the fair value hierarchy as explained above.
In addition, Stawell Regional Health determines whether transfers have occurred between levels in the hierarchy by re-assessing categorisation (based on the lowest level input that is significant to the fair value measurement as a whole) at the end of each reporting period.
The Valuer-General Victoria (VGV) is Stawell Regional Health’s independent valuation agency.
Stawell Regional Health, in conjunction with VGV and Cosgraves Property advisers monitors the changes in the fair value of each asset and liability through relevant data sources to determine whether revaluation is required.
The estimates and underlying assumptions are reviewed on an ongoing basis. Revisions to accounting estimates are recognised in theperiod in which the estimate is revised if the revision affects only that period or in the period of the revision, and future periods if the revision affects both current and future periods. Judgements and assumptions made by management in the application of AASs that have significant effects on the financial statements and estimates, with a risk of material adjustments in the subsequent reporting period, relate to:
• the fair value of land, buildings, infrastructure, plant and equipment (refer to Note 1(k));• superannuation expense (refer to Note 1(h)); and• actuarial assumptions for employee benefit provisions based on likely tenure of existing staff, patterns of leave claims, future salary movements and future discount rates (refer to Note 1(i)).
(c) Reporting Entity The financial statements includes all the controlled activities of Stawell Regional Health.
Its principal address is: Sloane StreetStawell, Victoria 3380
A description of the nature of Stawell Regional Health's operations and its principal activities is included in the report of operations,which does not form part of these financial statements.
Objectives and fundingStawell Regional Health's overall objective is to provide quality health care and support services that meets the needs of theircommunity in a safe and friendly environment for all clients and staff, as well as improve the quality of life for all Victorians.
Stawell Regional Health is predominately funded by accrual based grant funding for the provision of outputs.
(d) Principles of ConsolidationIn accordance with AASB 10 Consolidated Financial Statements:
• The consolidated financial statements of Stawell Regional Health incorporates the assets and liabilities of all entities controlledby Stawell Regional Health as at 30 June 2015, and their income and expenses for that part of the reporting period in whichcontrol existed; and
• The consolidated financial statements exclude bodies of Stawell Regional Health that are not controlled by Stawell RegionalHealth, and therefore are not consolidated.
• Control exists when Stawell Regional Health has the power to govern the financial and operating policies of a Health Serviceso as to obtain benefits from its activities. In assessing control, potential voting rights that presently are exercisable are taken intoaccount. The consolidated financial statements include the audited financial statements of the controlled entities listed in note 25.
Where control of an entity is obtained during the financial period, its results are included in the comprehensive operating statementfrom the date on which control commenced. Where control ceases during a financial period, the entity's results are included for thatpart of the period in which control existed. Where dissimilar accounting policies are adopted by entities and their effect is consideredmaterial, adjustments are made to ensure consistent policies are adopted in these financial statements.
Entities consolidated into Stawell Regional Health reporting entity include:- Stawell Regional Health Foundation
Intersegment TransactionsTransactions between segments within Stawell Regional Health have been eliminated to reflect the extent of Stawell Regional Health's operations as a group.
Jointly controlled assets or operationsInterest in jointly controlled assets or operations are not consolidated by Stawell Regional Health, but are accounted for inaccordance with the policy outlined in Note 1(k) Financial Assets.

Annual Report 2014/15 Stawell Regional Health 33
Stawell Regional Health Notes to Financial Statements
30 June 2015
(e) Scope and presentation of financial statementsFund AccountingThe Stawell Regional Health operates on a fund accounting basis and maintains three funds: Operating, Specific Purpose and Capital Funds. Stawell Regional Health's Capital and Specific Purpose Funds include unspent capital donations and receipts from fundraising activities conducted solely in respect of these funds.
Services Supported by Health Services Agreement and Services Supported by Hospitaland Community Initiatives.Activities classified as Services Supported by Health Services Agreement (HSA) are substantially funded by the Department ofHealth and Human Services and include Residential Aged Care Services (RACS) and are also funded from other sources suchas the Commonwealth, patients and residents, while Services Supported by Hospital and Community Initiatives (H&CI) are fundedby the Health Service's own activities or local initiatives and/or the Commonwealth.
Residential Aged Care ServiceResidential Aged Care Service operations are an integral part of Stawell Regional Health Service and shares its resources. An apportionment of land and buildings has been made based on floor space. The results of the two operations have been segregated based on actual revenue earned and expenditure incurred by each operation in notes 2 and 3 to the financial statements.
Comprehensive operating statementThe comprehensive operating statement includes the subtotal entitled 'Net Result Before Capital and Specific Items' to enhance theunderstanding of the financial performance of Stawell Regional Health. This subtotal reports the result excluding items suchas capital grants, assets received or provided free of charge, depreciation, expenditure using capital purpose income and items ofa unusual nature and amount such as specific income and expenses. The exclusion of these items is made to enhance matchingof income and expenses so as to facilitate the comparability and consistency of results between years and Victorian Public Health Services. The 'Net Result Before Capital and Specific Items' is used by the management of Stawell Regional Health, the Departmentof Health and Human Services and the Victorian Government to measure the ongoing operating performance of Health Services.
Capital and specific items, which are excluded from this sub-total comprise:* Capital purpose income, which comprises all tied grants, donations and bequests received for the purpose of acquiring
non-current assets, such as capital works and plant and equipment.It also includes donations of plant and equipment (refer note 1 (g)). Consequently the recognition of revenue as capital purpose income is based on the intention of the provider of the revenue at the time the revenue is provided;
* Specific income/expense, comprises the following items, where material:* Voluntary departure packages* Write-down of inventories* Non-current asset revaluation increments/decrements* Non-current assets lost or found* Forgiveness of loans* Reversals of provisions* Voluntary changes in accounting policies (which are not required by an accounting standard * or other authoritative pronouncement of the Australian Accounting Standards Board);
* Impairment of financial and non-financial assets, includes all impairment losses (and reversal of previous impairment losses),which have been recognised in accordance with note 1 (j);
* Depreciation as described in note 1 (h);
* Assets provided or received free of charge, as described in note 1 (g); and
* Expenditure using capital purpose income, comprises expenditure which either falls below the asset capitalisation threshold,or doesn't meet asset recognition criteria and therefore does not result in the recognition of an asset in the balance sheet,where funding for that expenditure is from capital purpose income.
Balance sheetAssets and liabilities are categorised either as current or non-current (non-current being those assets or liabilities expectedto be recovered / settled more than 12 months after reporting period), are disclosed in the notes where relevant.
Statement of changes in equityThe statement of changes in equity presents reconciliations of each non-owner and owner changes in equity from the opening balance at the beginning of the reporting period to the closing balance at the end of the reporting period. It also shows separately changesdue to amounts recognised in the comprehensive result and amounts recognised in other comprehensive income.
Cash Flow StatementCash flows are classified according to whether or not they arise from operating activities, investing activities, or financing activities. Thisclassification is consistent with requirements under AASB 107 Statement of Cash Flows .
For the cash flow statement presentation purposes, cash and cash equivalents includes bank overdrafts, which are included as current
Annual Report 2014/15 Stawell Regional Health34
Stawell Regional Health Notes to Financial Statements
30 June 2015
(e) Scope and presentation of financial statements (Continued)Rounding All amounts shown in the financial statements are expressed to the nearest dollar unless otherwise stated.
Minor discrepancies in tables between totals and sum of components are due to rounding.
Comparative InformationThere have been no changes to comparative information which require additional disclosure.
(f) Change in accounting policiesAASB 10 Consolidated financial statementsAASB 10 provides a new approach to determine whether an entity has control over another entity, and therefore must present consolidated financial statements. The new approach requires the satisfaction of all three criteria for control to exist over an entityfor financial reporting purposes:
(a) The investor has power over the investee;(b) The investor has exposure, or rights to variable returns from its involvement with the investee; and(c) The investor has the ability to use its power over the investee to affect the amount of investor's returns.
Based on the new criteria prescribed in AASB 10, Stawell Regional Health has reviewed the existing arrangements to determineif there are any additional entities that need to be consolidated into the group. Based on this review Stawell Regional Health hasdetermined there are no additional entities required to be consolidated in accordance with AASB 10.
AASB 11 Joint ArrangementsIn accordance with AASB 11, there are two types of joint arrangements, i.e. joint operations and joint ventures. Joint operationsarise where the investors have rights to the assets and obligations for the liabilities of an arrangement. A joint operator accounts forits share of the assets, liabilities, revenue and expenses. Joint ventures arise where the investors have rights to the net assets of thearrangement; joint ventures are accounted for under the equity method. Proportionate consolidation of joint ventures is no longer permitted.
Stawell Regional Health has reviewed its existing contractual arrangements with other entities to ensure they are aligned with thenew classifications under AASB 11.
Stawell Regional Health has accounted for the following interests in associates and joint ventures using the joint operation method: - Grampians Rural Health Alliance
AASB 12 Disclosure of Interests in Other EntitiesAASB 12 Disclosure of Interests in Other Entities prescribes the disclosure requirements for an entity's interests in subsidiaries,associates and joint arrangements; and extends to the entity's association with unconsolidated structured entities.
Stawell Regional Health has disclosed information about its interests in associates and joint ventures, including any significantsjudgement and assumptions used in determining the type of joint arrangement in which it has an interest.
Early adoption of new StandardsAccounting Standard AASB 2015-7 Fair Value disclosures of Not-for-Profit Public Sector Entities was issued on 13th July 2015 forapplication from 1 July 2016. Stawell Regional Health have elected to adopt this standard early and apply the changes tothe 2014-15 financial statements.
The amended standard provides relief to not-for-profit public sector entities from making certain specified disclosures about thefair value measurement of assets within the scope of AASB 116 Property, Plant and Equipment which are held for their currentservice potential rather than to generate future cash inflows.
This is a disclosure impact only, with no current or future financial impact expected.
(g) Income from transactionsIncome is recognised in accordance with AASB 118 Revenue and is recognised as to the extent that it is probable that the economicbenefits will flow to Stawell Regional Health and the income can be reliably measured at fair value. Unearned income at reporting dateis reported as income received in advance.
Amounts disclosed as revenue are, where applicable, net of returns, allowances and duties and taxes.
Government Grants and other transfers of income (other than contributions by owners)In accordance with AASB 1004 Contributions, government grants and other transfers of income (other than contributions by ownersare recognised as income when the Health Service gains control of the underlying assets irrespective of whether conditions areimposed on the Health Service's use of the contributions.
Contributions are deferred as income in advance when the Health Service has a present obligation to repay them and the presentobligations can be reliably measured.
Annual Report 2014/15 Stawell Regional Health 35
Stawell Regional Health Notes to Financial Statements
30 June 2015
(g) Income from transactions (Continued)Indirect Contributions from the Department of Health and Human Services- Insurance is recognised as revenue following advice from the Department of Health and Human Services.- Long Service Leave (LSL) - Revenue is recognised upon finalisation of movements in LSL liability in line with the arrangements
set out in the Metropolitan Health and Aged Care Services Division Hospital Circular 05/2013 (update for 2013-14).
Patient and Resident FeesPatient fees are recognised as revenue at the time invoices are raised.
Private Practice FeesPrivate Practice fees are recognised as revenue at the time invoices are raised.
Revenue from commercial activitiesRevenue from commercial activities such as provision of meals to external users is recognised at the time the invoices are raised.
Donations and Other BequestsDonations and bequests are recognised as revenue when received. If donations are for a special purpose, they may beappropriated to a surplus, such as specific restricted purpose surplus.
Interest RevenueInterest revenue is recognised on a time proportionate basis that takes in account the effective yield of the financial asset.
Sale of investmentsThe gain/loss on the sale of investments is recognised when the investment is realised.
Fair value of assets and services received free of charge or for nominal considerationResources received free of charge or for nominal consideration are recognised at their fair value when the transferee obtainscontrol over them, irrespective of whether restrictions or conditions are imposed over the use of the contributions, unless receivedfrom another Health Service or agency as a consequence of a restructuring of administrative arrangements. In the latter case, suchtransfer will be recognised at carrying value. Contributions in the form of services are only recognised when a fair value can bereliably determined and the services would have been purchased if not donated.
(h) Expense recognitionExpenses are recognised as they are incurred and reported in the financial year to which they relate.
Cost of goods soldCost of goods sold are recognised when the sale of an item occurs by transferring the cost or value of the item/s from inventories.
Employee expensesEmployee expenses include:• Wages and salaries;• Annual leave;• Sick leave;• Long service leave; and• Superannuation expenses which are reported differently depending upon whether employees are members of defined benefit or defined contribution plans.
Defined contribution superannuation plansIn relation to defined contributions (i.e. accumulation) superannuation plans, the associated expense is simply the employercontributions that are paid or payable in respect of employees who are members of these plans during the reporting period. Contributions to defined contribution superannuation plans are expensed when incurred.
Defined benefit superannuation plansThe amount charged to the comprehensive operating statement in respect of defined benefit superannuation plans represents thecontributions made by the Health Service to the superannuation plans in respect of the services of current Health Service staff duringreporting period. Superannuation contributions are made to the plans based on the relevant rules of each plan, and are basedupon actuarial advice.
Employees of the Stawell Regional Health are entitled to receive superannuation benefits and Stawell Regional Health contributesto both the defined benefit and defined contribution plans. The defined benefit plans provide benefits based on years based onyears of service and final average salary.
The name and details of the major employee superannuation funds and contributions made by Stawell Regional Healthare disclosed in Note 14: Superannuation.
Annual Report 2014/15 Stawell Regional Health36
Stawell Regional Health Notes to Financial Statements
30 June 2015
(h) Expense recognition (Continued)DepreciationAll infrastructure assets, buildings, plant and equipment and other non-financial physical assets that have finite useful livesare depreciated (i.e. excludes land assets held for sale, and investment properties). Depreciation begins when the asset isavailable for use, which is when it is in the location and condition necessary for it to be capable of operating in a manner intended by management.
Intangible produced assets with finite lives are depreciated as an expense from transactions on a systematic basis over the asset's useful life. Depreciation is generally calculated on a straight line basis, at a rate that allocates the asset value, less any estimated residual value over its estimated useful life. Estimates of the remaining useful lives and depreciation method for all assets are reviewed at least annually, and adjustments made where appropriate. This depreciation charge is not funded by the Department of Health and Human Services. Assets with a cost in excess of $1,000 are capitalised and depreciatedhas been provided on depreciable assets so as to allocate their cost or valuation over their estimated useful lives.
The following table indicates the expected useful lives of non-current assets on which the depreciation charges are based.2015 2014
Buildings- Structure Shell Building Fabric 5 to 50 years 5 to 50 years- Site Engineering Services and Central Plant 5 to 50 years 5 to 50 yearsCentral Plant- Fit Out 5 to 50 years 5 to 50 years- Trunk Reticulated Building Systems 5 to 50 years 5 to 50 yearsPlant and Equipment 5 to 15 years 5 to 15 yearsMedical Equipment 5 to 15 years 5 to 15 yearsComputers and Communication 3 to 5 years 3 to 5 yearsFurniture and Fittings 5 to 15 years 5 to 15 yearsMotor Vehicles 7 years 7 years
As part of the buildings valuation, building values were separated into components and each component assessed for its usefullife which is represented above.
Intangible produced assets with finite lives are depreciated as an expense on a systematic basis over the asset's useful life.
AmortisationAmortisation is allocated to intangible non-produced assets with finite useful lives on a systematic (typically straight-line) basis over the asset’s useful life. Amortisation begins when the asset is available for use, that is, when it is in the location and condition necessary for it to be capable of operating in the manner intended by management. The consumption of intangible non-produced assets with finite useful lives is classified as amortisation.
The amortisation period and the amortisation method for an intangible asset with a finite useful life are reviewed at least at the end of each annual reporting period. In addition, an assessment is made at each reporting date to determine whether there are indicators that theintangible asset concerned is impaired. If so, the asset concerned is tested as to whether its carrying value exceeds its recoverable amount.
Intangible assets with indefinite useful lives are not amortised, but are tested for impairment annually or whenever there is an indication that the asset may be impaired. The useful lives of intangible assets that are not being amortised are reviewed each period to determine whether events and circumstances continue to support an indefinite useful life assessment for that asset. In addition, the Health Service tests all intangible assets with indefinite useful lives for impairment by comparing the recoverable amount for each asset with its carrying amount:• annually; and• whenever there is an indication that the intangible asset may be impairedAny excess of the carrying amount over the recoverable amount is recognised as an impairment loss.
Intangible assets with finite useful lives are amortised over 3-5 years (2014: 3-5 years).
Other operating expensesOther operating expenses generally represent the day-to-day running costs incurred in normal operating and include:
Supplies and ConsumablesSupplies and service costs which are recognised as an expense in the reporting period in which they are incurred. The carrying amounts of any inventories held for distribution are expenses when distributed.
Bad and Doubtful DebtsRefer to note 1 (k) Impairment of financial assets.
Fair value of assets, services and resources provided free of charge or for nominal considerationContributions of resources provided free of charge or for nominal consideration are recognised at their fair value when the transferee obtains control over them, irrespective of whether restrictions or conditions are imposed over the use of the contributions, unless received from another agency as a consequence of a restructuring of administrative arrangements. In the latter case, such a transfer will be recognised at it's carrying value. Contributions in the form of services are only
Annual Report 2014/15 Stawell Regional Health 37
Stawell Regional Health Notes to Financial Statements
30 June 2015
(i) Other comprehensive incomeOther comprehensive income measure the change in volume or value of assets or liabilities that do not result from transactions.
Net Gain / (Loss) on Non-Financial AssetsNet gain / (loss) on non-financial assets and liabilities includes realised and unrealised gains and losses as follows:
Net gain/(loss) on disposal of Non-Financial AssetsAny gain or loss on the disposal of non-financial assets is recognised at the date of disposal and is the difference between proceeds and the carrying value of the asset at the time.
Impairment of Non-Financial AssetsGoodwill and intangible assets with indefinite useful lives (and intangible assets not available for use) are tested annually for impairment and whenever there is an indication that the asset may be impaired. Refer to Note 1 (k) Assets.
(j) Financial InstrumentsFinancial instruments arise out of contractual agreements that give rise to a financial asset of one entity and a financial liability or equity instrument of another entity. Due to the nature of Stawell Regional Health's activities, certain financial assets and financial liabilities arise under statute rather than a contract. Such financial assets and financial liabilities do not meet the definition of financial instruments in AASB 132 Financial Instruments: Presentation. For example, statutory receivables arising from taxes,fines and penalties do not meet the definition of financial instruments as they do not arise under contract.
Where relevant, for note disclosure purposes, a distinction is made between those financial assets and financial liabilities that meetthe definition of financial instruments in accordance with AASB 132 and those that do not.
The following refers to financial instruments unless otherwise stated.
Categories of non-derivative financial instruments
Reclassification of financial instruments at fair value through profit or lossFinancial instrument assets that meet the definition of loans and receivables may be reclassified out of the fair value through profitand loss category into the loans and receivables category, where they would have met the definition of loans and receivables hadthey not been required to be classified as fair value through profit and loss. In these cases, the financial instrument assets may be reclassified out of the fair value through profit and loss category, if there is the intention and ability to hold them for the foreseeable future or until maturity.
Loans and receivablesLoans and receivables are financial instrument assets with fixed and determinable payments that are not quoted on an active market.These assets are initially recognised at fair value plus any directly attributable transaction costs. Subsequent to initial measurement,loans and receivables are measured at amortised cost using the effective interest method, less any impairment.
Loans and receivables category includes cash and deposits (refer to Note 1(k)), term deposits with maturity greater than threemonths, trade receivables, loans and other receivables, but not statutory receivables.
Available-for-sale financial assetsAvailable-for-sale financial instrument assets are those designated as available-for-sale or not classified in any other category offinancial instrument asset. Such assets are initially recognised at fair value. Subsequent to initial recognition, gains and lossesarising from changes in fair value are recognised in 'other comprehensive income' until the investment is disposed of or is determinedto be impaired, at which time the cumulative gain or loss previously recognised in equity is included in net result for the period. Fairvalue is determined in the manner described in Note 18.
Reclassification of available-for-sale financial assetsAvailable-for sale financial instrument assets that meet the definition of loans and receivables may be classified into the loans and receivables category if there is the intention and ability to hold them for the foreseeable future or until maturity.
(k) AssetsCash and Cash EquivalentsCash and cash equivalents recognised on the balance sheet comprise cash on hand and cash at bank, deposits at call and highly liquid investments with an original maturity of three months or less, which are held for the purpose of meeting short term cash commitments rather than for investment purposes, which are readily convertible to known amounts of cash and are subject to insignificant risk of changes in value.
For cash flow statement presentation purposes, cash and cash equivalents include bank overdrafts, which are included as liabilities on the balance sheet.
Annual Report 2014/15 Stawell Regional Health38
Stawell Regional Health Notes to Financial Statements
30 June 2015
(k) Assets (Continued)ReceivablesReceivables consist of: - Contractual receivables, which includes of mainly debtors in relation to goods and services, loans to third parties, accrued investment income, and finance lease receivables; and - Statutory receivables, which includes predominantly amounts owing from the Victorian Government and Goods and Services Tax ("GST") input tax credits recoverable.
Receivables that are contractual are classified as financial instruments and categorised as loans and receivables. Statutoryreceivables are recognised and measured similarly to contractual receivables (except for impairment), but are not classified asfinancial instruments because they do not arise from a contract.
Receivables are recognised initially at fair value and subsequently measured at amortised cost, using the effective interest ratemethod, less any accumulated impairment.
Trade debtors are carried at nominal amounts due and are due for settlement within 30 days from the date of recognition. Collectabilityof debts is reviewed on an ongoing basis, and debts which are known to be uncollectible are written off. A provision for doubtful debtis recognised when there is objective evidence that an impairment loss has occurred. Bad debts are written off when identified.
Investments and other financial assetsInvestments are recognised and derecognised on trade date where purchase or sale of an investment is under a contract whoseterms require delivery of the investment within the timeframe established by the market concerned, and are initially measured at fairvalue, net of transaction costs.
Investments are classified in the following categories: - Financial assets at fair value through profit or loss; - Held-to-maturity; - Loans and receivables; and - Available-for-sale financial assets.
The Stawell Regional Health classifies its other financial assets between current and non-current assets based on the purpose forwhich the assets were acquired. Management determines the classification of its other financial assets at initial recognition.
Stawell Regional Health assesses at each balance sheet date whether a financial asset or group of financial assets is impaired.
All financial assets, except those measured at fair value through profit and loss are subject to annual review for impairment.
InventoriesInventories include goods and other property held either for sale, consumption or for distribution at no or nominal cost in the ordinarycourse of business operations. It excludes depreciable assets.
Inventories held for distribution are measured at cost, adjusted for any loss of service potential. All other inventories, including land held forincluding land held for sale, are measured at the lower of cost and net realisable value.
Inventories acquired for no cost or nominal considerations are measured at current replacement cost at the date of acquisition.
The basis used in assessing loss of service potential for inventories held for distribution include current replacement cost and technical orfunctional obsolescence. Technical obsolescence occurs when an item still functions for some or all of the tasks it was originally acquired todo, but no longer matches existing technologies. Functional obsolescence occurs when an item no longer functions the way it did when itwas first acquired.
Cost for inventory is measured on the basis of weighted average cost.
Property, Plant and EquipmentAll non-current physical assets are measured initially at cost and subsequently revalued at fair value less accumulated depreciationand impairment. Where an asset is acquired for no or nominal cost, the cost is its fair value at the date of acquisition. Assetstransferred as part of a merger / machinery of government are transferred at their carrying amount.
More details about the valuation techniques and inputs used in determining the fair value of non-financial physical assets are discussed in Note 10 Property, plant and equipment .
Crown Land is measured at fair value with regard to the property's highest and best use after due consideration is made for any legal or physical restrictions imposed on the asset, public announcements or commitments made in relation to the intended use of the asset. Theoretical opportunities that may be available in relation to the asset(s) are not taken into account until it is virtually certain that any restriction will no longer apply. Therefore, unless otherwise disclosed, the current use of these non-financial physical assets will be their highest and best uses.
Land and Buildings are recognised initially at cost and subsequently measured at fair value less accumulated depreciation andimpairment.
Plant, Equipment and Vehicles are recognised initially at cost and subsequently measured at fair value less accumulated depreciation

Annual Report 2014/15 Stawell Regional Health 39
Stawell Regional Health Notes to Financial Statements
30 June 2015
(k) Assets (Continued)Revaluations of Non-current Physical AssetsNon-Current physical assets are measured at fair value and are revalued in accordance with FRD 103F Non-current physical assets.This revaluation process normally occurs at least every five years, based upon the asset's Government Purpose Classification but mayoccur more frequently if fair value assessments indicate material changes in values. Independent valuers are used to conduct these scheduled revaluations and any interim revaluations are determined in accordance with the requirements of the FRDs. Revaluationincrements or decrements arise from differences between an asset's carrying value and fair value.
Revaluation increments are recognised in 'other comprehensive income' and are credited directly to the assetrevaluation surplus except that, to the extent that an increment reverses a revaluation decrement in respect of that same class of asset previously recognised as an expense in the net result, the increment is recognised as income in the net result.
Revaluation decrements are recognised in 'other comprehensive income' to the extent that a credit balance existsin the asset revaluation surplus in respect of the same class of property, plant and equipment.Revaluation increases and revaluation decreases relating to individual assets within an asset class are offset against one another within that class but are not offset in respect of assets in different classes.
Revaluation surplus is not transferred to accumulated funds on derecognition of the relevant asset.
In accordance with FRD 103F Stawell Regional Health's non-current physical assets were assessed to determine whether revaluation of the non-current physical assets was required. This assessment did not identify any significant movements that would require a revaluation.
PrepaymentsOther non-financial assets include prepayments which represent payments in advance of receipt of goods or services or that part of expenditure made in one accounting period covering a term extending beyond that period.
Disposal of Non-Financial AssetsAny gain or loss on the sale of non-financial assets is recognised in the comprehensive operating statement. Refer tonote 1(h) - 'other comprehensive income'.
Impairment of Non-Financial AssetsGoodwill and intangible assets with indefinite lives (and intangible assets not yet available for use) are tested annuallyfor impairment (as described below) and whenever there is an indication that the asset may be impaired.
All other non-financial assets are assessed annually for indications of impairment, except for:• inventories;• financial assets;• investment properties that are measured at fair value;• non-current physical assets held for sale; and• assets arising from construction contracts.
If there is an indication of impairment, the assets concerned are tested as to whether their carrying value exceeds their possible recoverable amount. Where an asset's carrying value exceeds its recoverable amount, the difference is written-off as an expense except to the extentthat the write-down can be debited to an asset revaluation surplus amount applicable to that same class of asset.
If there is an indication that there has been a reversal in the estimate of an asset's recoverable amount since the last impairment loss wasrecognised, the carrying amount shall be increased to its recoverable amount. This reversal of the impairment loss occurs only to the extentthat the asset's carrying amount does not exceed the carrying amount that would have been determined, net of depreciation or amortisationif no impairment loss had been recognised in prior years.
It is deemed that, in the event of the loss or destruction of an asset, the future economic benefits arising from the use of the asset will beunless a specific decision to the contrary has been made. The recoverable amount for most assets is measured at the higher ofdepreciated replacement cost and fair value less costs to sell. Recoverable amount for assets held primarily to generate net cash inflowsis measured at the higher of the present value of future cash flows expected to be obtained from the asset and fair value less costs to sell.
Annual Report 2014/15 Stawell Regional Health40
Stawell Regional Health Notes to Financial Statements
30 June 2015
(k) Assets (Continued)Joint control is the contractually agreed sharing of control of an arrangement, which exists only when decisions about therelevant activities require the unanimous consent of the parties sharing control. Joint ventures are joint arrangements wherebyStawell Regional Health, via its joint control of the arrangement, has rights to the net assets of the arrangements.
Interests in joint ventures are accounted for in the financial statements using the equity method, as applied to investments in associates and are disclosed as required by AASB 12.
Investments in joint operationsIn respect of any interest in joint operations, Stawell Regional Health recognises in the financial statements:
• its assets, including its share of any assets held jointly;• any liabilities including its share of liabilities that it had incurred;• its revenue from the sale of its share of the output from the joint operation;• its share of the revenue from the sale of the output by the operation; and• its expenses, including its share of any expenses incurred jointly.
Derecognition of financial assetsA financial asset (or, where applicable, a part of a financial asset or part of a group of similar financial assets) is derecognised when:- the rights to receive cash flows from the asset have expired; or - the Health Service retains the right to receive cash flows from the asset, but has assumed an obligation to pay them in full without material delay to a third party under a 'pass through' arrangement; or- the Health Service has transferred its rights to receive cash flows from the asset and either:
(a) has transferred substantially all the risks and rewards of the asset; or(b) has neither transferred nor retained substantially all the risks and rewards of the asset, but has transferred control of the asset.
Where the Health Service has neither transferred nor retained substantially all the risks and rewards or transferred control, theasset is recognised to the extent of the Health Service's continuing involvement in the asset.
Impairment of financial assetsAt the end of each reporting period Stawell Regional Health assesses whether there is objective evidence that a financialasset or group of financial assets is impaired. All financial instrument assets, except those measured at fair value through profit and loss,are subject to annual review for impairment.
Receivables are assessed for bad and doubtful debts on a regular basis. Bad debts considered as written off and allowances fordoubtful receivables are expensed. Bad debts written off by mutual consent and the allowance for doubtful debts are classifiedas 'other comprehensive income' in the net result.
The amount of the allowance is the difference between the financial asset's carrying amount and the present value of estimated future cashcash flows, discounted at the effective interest rate.
Where the fair value of an investment in an equity instrument at balance date has reduced by 20 percent or more than its cost price or where its fair value has been less than its cost price for a period of 12 or more months, the financial asset is treated as impaired.
In order to determine an appropriate fair value as at 30 June 2015 for its portfolio of financial assets, Stawell Regional Health obtained a valuation based on the best available advice using an estimated market value through a reputable financial institution.This value was compared against valuation methodologies provided by the issuer as at 30 June 2015. These methodologies were critiqued and considered to be consistent with standard market valuation techniques.
In assessing impairment of statutory (non-contractual) financial assets, which are not financial instruments, professional judgement is applied in assessing materiality using estimates, averages and other computational methods in accordance with AASB 136 Impairment of Assets.
Net Gain/(Loss) on Financial InstrumentsNet Gain/(Loss) on financial instruments includes: - realised and unrealised gains and losses from revaluations of financial instruments that are designated at fair value through profit or loss or loss or held-for-trading;- Impairment and reversal of impairment for financial instruments at amortised cost; and- disposals of financial assets and derecognition of financial liabilities.
Revaluations of Financial Instruments at Fair ValueThe revaluation gain/(loss) on financial instruments at fair value excludes dividends or interest earned on financial assets.
Annual Report 2014/15 Stawell Regional Health 41
Stawell Regional Health Notes to Financial Statements
30 June 2015
(l) LiabilitiesPayablesPayables consist of:- contractual payables which consist predominantly of accounts payable representing liabilities for goods and services provided to theHealth Service prior to the end of the financial year that are unpaid, and arise when the Health Service becomes obliged to make futurepayments in respect of the purchase of those goods and services. The normal credit terms for accounts payable are usually Nett 30 days.
- statutory payables, such as goods and services tax and fringe benefits tax payables.
Contractual payables are classified as financial instruments and are initially recognised at fair value, and then subsequently carried at amortised cost. Statutory payables are recognised and measured similarly to contractual payables, but are not classified as financial instruments and not included in the category of financial liabilities at amortised cost, because they do not arise from a contract.
ProvisionsProvisions are recognised when the Health Service has a present obligation, the future sacrifice of economic benefits is probable, and the amount of the provision can be measured reliably.
The amount recognised as a provision is the best estimate of the consideration required to settle the present obligation at reporting date, taking into account the risks and uncertainties surrounding the obligation. Where a provision is measured using the cash flows estimatedto settle the present obligation, its carrying amount is the present value of those cash flows, using a discount rate that reflects the time valueof money and risks specific to the provision. When some or all of the economic benefits required to settle a provision are expected to be received from a third party, the receivable is recognised as an asset if it is virtually certain that recovery will be received and the amountof the receivable can be measured reliably.
Employee BenefitsThis provision arises for benefits accruing to employees in respect of wages and salaries, annual leave and longservice leave for services rendered to the reporting date.
Wages and Salaries, Annual Leave and Accrued Days OffLiabilities for wages and salaries, including non-monetary benefits and annual leave are all recognised in the provision for employee benefits as ‘current liabilities’, because the health service does not have an unconditional right to defer settlements of these liabilities.
Depending on the expectation of the timing of settlement, liabilities for wages and salaries and annual leave aremeasured at:
• Undiscounted value – if the health service expects to wholly settle within 12 months; or• Present value – if the health service does not expect to wholly settle within 12 months.
Long Service Leave (LSL)Liability for LSL is recognised in the provision for employee benefits.
Unconditional LSL is disclosed in the notes to the financial statements as a current liability, even where the health service does not expect to settle the liability within 12 months because it will not have the unconditional right to defer the settlement of the entitlement should an employee take leave within 12 months.
The components of this current LSL liability are measured at:• Undiscounted value – if the health service expects to wholly settle within 12 months; and• Present value – if the health service does not expect to wholly settle within 12 months.
Conditional LSL is disclosed as a non-current liability. There is an unconditional right to defer the settlement of the entitlement until the employee has completed the requisite years of service. This non-current LSL liability is measured at present value.
Any gain or loss followed revaluation of the present value of non-current LSL liability is recognised as a transaction, except tothe extent that a gain or loss arises due to changes in bond interest rates for which it is then recognised as an other economic flow.
Termination BenefitsTermination benefits are payable when employment is terminated before the normal retirement date or when an employee decidesto accept an offer of benefits in exchange for the termination of employment.
The health service recognises termination benefits when it is demonstrably committed to either terminating the employment of current employees according to a detailed formal plan without possibility of withdrawal or providing termination benefits as a result of an offer made to encourage voluntary redundancy. Benefits falling due more than 12 months after the end of the reporting period are discounted to present value.
On-CostsProvisions for on-costs, such as payroll tax, workers compensation, superannuation are recognised separately from the provision for employee benefits.
Superannuation LiabilitiesStawell Regional Health does not recognise any unfunded defined benefit liability in respect of the superannuation plans
Annual Report 2014/15 Stawell Regional Health42
Stawell Regional Health Notes to Financial Statements
30 June 2015
(m) LeasesA lease is a right to use an asset for an agreed period of time in exchange for payment. Leases are classified at their inception as either operating or finance leases based on the economic substance of the agreement so as to reflect the risked and rewards incidental to ownership.
Leases of property, plant and equipment are classified as finance leases whenever the terms of the lease transfer substantially all the risks and rewards of ownership to the lessee.
All other leases are classified as operating leases.
Operating leasesOperating lease payment, including any contingent rentals, are recognised as an expense in the comprehensive operating statement on a straight line basis over the lease term, except where another systematic basis is more representative of the time pattern of thebenefits derived from the use of the leased asset. The leased asset is not recognised in the balance sheet.
(n) EquityContributed CapitalConsistent with Australian Accounting Interpretation 1038 Contributions by Owners Made to Wholly-Owned Public Sector Entities andFRD 119A Contributions by Owners , appropriations for additions to the net asset base have been designated as contributed capital. Other transfers that are in the nature of contributions or distributions, that have been designated as contributed capital are also treated as contributed capital.
Transfers of net assets arising from administrative restructurings are treated as contributions by owners. Transfers of net liabilities arising from administrative restructures are to go through the comprehensive operating statement.
Property, plant and equipment revaluation surplusThe asset revaluation surplus is used to record increments and decrements on the revaluation of non-current physical assets.
General Purpose SurplusThe general purpose surplus is used to record transfers to and from general surplus, share of increments in surplus attributable to associates and jointly controlled operations. Stawell Regional Health uses the general purpose surplus for General Donor Funds and other Capital Works, such as the wireless network for building automation.
Specific restricted purpose surplusA specific restricted purpose surplus is established where the Health Service has possession or title to the funds but has no discretion toamend or vary the restriction and/or condition underlying the funds received.
(o) Commitments Commitments for future expenditure include operating and capital commitments arising from contracts. These commitments are disclosedby way of a note (refer to note 19) at their nominal value and are inclusive of the goods and services tax ("GST") payable.In addition, where it is considered appropriate and provides additional relevant information to users, the net present values of significantindividual projects are stated. These future expenditures cease to be disclosed as commitments once the related liabilities are recognisedon the balance sheet.
(p) Contingent assets and contingent liabilitiesContingent assets and contingent liabilities are not recognised in the balance sheet, but are disclosed by way of note and, if quantifiable,are measured at nominal value. Contingent assets and contingent liabilities are presented inclusive of GST receivable or payablerespectively.
(q) Goods and Services Tax ("GST")Income, expenses and assets are recognised net of the amount of associated GST, unless the GST incurred is not recoverable from the taxation authority. In this case it is recognised as part of the cost of acquisition of the asset or as part of the expense.
Receivables and payables are stated inclusive of the amount of GST receivable or payable. The net amount of GST recoverable from, or payable to, the taxation authority is included with other receivables or payables in the balance sheet.
Cash flows are presented on a gross basis. The GST components of cash flows arising from investing or financing activities which arerecoverable from, or payable to the taxation authority, are presented as operating cash flow.
Commitments and contingent assets and liabilities are presented on a gross basis.
Annual Report 2014/15 Stawell Regional Health 43
Stawell Regional Health Notes to Financial Statements
30 June 2015
(r) AASs issued that are not yet effectiveCertain new Australian accounting standards have been published that are not mandatory for the 30 June 2015 reporting period.DTF assesses the impact of all these new standards and advises the Health Service of their applicability and early adoption where applicable.
As at 30 June 2015, the following standards and interpretations had been issued by the AASB but were not yet effective.They become effective for the first financial statements for reporting periods commencing after the stated operative dates as detailedin the table below. Stawell Regional Health has not and does not intend to adopt these standards early.
Standard / Summary Applicable for Impact on HealthInterpretation reporting periods Service's Annual
beginning on StatementsAASB 9 Financial Instruments The key changes include the simplified 1 January 2018 The assessment has identified that the
requirements for the classification and financial impact of available for sale (AFS)measurement of financial assets, a assets will now be reported through new hedging accounting model and a other comprehensive income (OCI) andrevised impairment loss model to no longer recycled to the profit and loss.recognise impairment losses earlier, While the preliminary assessment has as opposed to the current approach not identified any material impact arising that recognises impairment only when from AASB 9, it will continue to be incurred. monitored and assessed.
AASB 15 Revenue from The core principle of AASB 15 requires 1 Jan 2017 The changes in revenue recognition Contracts with Customers an entity to recognise revenue when (Exposure Draft requirements in AASB 15 may result in
the entity satisfies a performance 263 - potential changes to the timing and amount of obligation by transferring a promised deferral to 1 Jan revenue recorded in the financial good or service to a customer. 2018). statements. The Standard will also
require additional disclosures on servicerevenue and contract modifications.A potential impact will be the upfront recognition of revenue from licenses that cover multiple reporting periods. Revenue that was deferred and amortised over a period may now need to be recognised immediately as a transitional adjustment against the opening returned earnings if there are no former performance obligations outstanding.
AASB 2014 1 Amendments to Amends various AASs to reflect the 1 Jan 2018 This amending standard will defer the Australian Accounting Standards AASB's decision to defer the mandatory application period of AASB 9 to the [Part E Financial Instruments] application date of AASB 9 to annual 2018-19 reporting period in accordance
reporting periods beginning on or after with the transition requirements.1 January 2018 as a consequence of Chapter 6 Hedge Accounting, and to amend reduced disclosure
AASB 2014 4 Amendments to Amends AASB 116 Property, Plant and 1 Jan 2016 The assessment has indicated that Australian Accounting Equipment and AASB 138 Intangible there is no expected impact as the Standards – Clarification of Assets to: revenue-based method is not used for Acceptable Methods of - establish the principle for the basis depreciation and amortisation. Depreciation and Amortisation of depreciation and amortisation as [AASB 116 & AASB 138] being the expected pattern of
consumption of the future economic benefits of an asset;
- prohibit the use of revenue based methods to calculate the depreciation or amortisation of an asset, tangible or intangible, because revenue generally reflects the pattern of economic benefits that are generated from operating the business, rather than the consumption through the use of the asset.
AASB 2014 9 Amendments to Amends AASB 127 Separate Financial 1 Jan 2016 The assessment indicates that there is Australian Accounting Statements to allow entities to use the no expected impact as the entity will Standards – Equity Method in equity method of accounting for continue to account for the investments in Separate Financial Statements investments in subsidiaries, joint subsidiaries, joint ventures and associates [AASB 1, 127 & 128] ventures and associates in their using the cost method as mandated if
separate financial statements. separate financial statements arepresented in accordance with FRD 113A.
Annual Report 2014/15 Stawell Regional Health44
Stawell Regional Health Notes to Financial Statements
30 June 2015
(r) AASs issued that are not yet effective (Continued)
Standard / Summary Applicable for Impact on HealthInterpretation reporting periods Service's Annual
beginning on StatementsAASB 2014 10 Amendments to AASB 2014-10 amends AASB 10 1 Jan 2016 The assessment has indicated that Australian Accounting Consolidated Financial Statements there is limited impact, as the revisions Standards – Sale or Contribution and AASB 128 Investments in to AASB 10 and AASB 128 are guidance of Assets between an Investor Associates to ensure consistent in nature.and its Associate or Joint Venture treatment in dealing with the sale or [AASB 10 & AASB 128] contribution of assets between an
investor and its associate or joint venture. The amendments require that:
- a full gain or loss to be recognised by the investor when a transaction involves a business (whether it is housed in a subsidiary or not); and
- a partial gain or loss to be recognised by the parent when a transaction involves assets that do not constitute a business, even if these assets are housed in a subsidiary.
AASB 2015 6 Amendments to The Amendments extend the scope of 1 July 2016 The amending standard will result in Australian Accounting AASB 124 Related Party Disclosures to extended disclosures on the entity's key Standards – Extending Related not-for-profit public sector entities. A management personnel (KMP), and the Party Disclosures to Not-for-Profit guidance has been included to assist related party transactions. Public Sector Entities the application of the Standard by [AASB 10, AASB 124 & not-for-profit public sector entities. AASB 1049]
In addition to the new standards above, the AASB has issued a list of amending standards that are not effective for the 2014-15 reporting period (as listed below). In general, these amending standards include editorial and references changes that are expected to have insignificant impacts on public sector reporting. The AASB Interpretation in the list below is also not effective for the 2014-15 reporting period and is considered to have insignificant impacts on public sector reporting.
- AASB 2010-7 Amendments to Australian Accounting Standards arising from AASB 9 (December 2010).- AASB 2011-7 Amendments to Australian Accounting Standards arising from the Consolidation and Joint Arrangements Standards.- 2013-1 Amendments to AASB 1049 – Relocation of Budgetary Reporting Requirements.- 2013-3 Amendments to AASB 136 – Recoverable Amount Disclosures for Non-Financial Assets. - 2013-4 Amendments to Australian Accounting Standards – Novation of Derivatives and Continuation of Hedge Accounting.- 2013-5 Amendments to Australian Accounting Standards – Investment Entities- 2013-6 Amendments to AASB 136 arising from Reduced Disclosure Requirements- 2013-7 Amendments to AASB 1038 arising from AASB 10 in relation to consolidation and interests of policy holders- 2013-9 Amendments to Australian Accounting Standards – Conceptual Framework, Materiality and Financial Instruments- AASB Interpretation 21 Levies.
(s) Category GroupsStawell Regional Health has used the following category groups for reporting purposes for the current and previous financial years.
Admitted Patient Services (Admitted Patients) comprises all acute and subacute admitted patient services, where services aredelivered in public hospitals.
Aged Care comprises a range of in home, specialist geriatric, residential care and community based programs and support services, suchas Home and Community Care (HACC) that are targeted to older people, people with a disability, and their carers.
Primary, Community and Dental Health comprises a range of home based, community based, community, primary health and dentalservices including health promotion and counselling, physiotherapy, speech therapy, podiatry and occupational therapy and a range ofdental health services.
Residential Aged Care including Mental Health (RAC incl. Mental Health) referred to in the past as psychogeriatric residential services, comprises those Commonwealth-licensed residential aged care services in receipt of supplementary funding from the departmentunder the mental health program. It excludes all other residential services funded under the mental health program, such as mental healthfunded community care units (CCUs) and secure extended care units (SECs).
Other Services not reported elsewhere - (Other) comprises services not separately classified above, including: Public Health Servicesincluding laboratory testing, blood borne viruses / sexually transmitted infections clinical services, Kooris liaison officers, immunisation andscreening services, drugs services including drug withdrawal, counselling and the needle and syringe program, Disability services including aids and equipment and flexible support packages to people with a disability, Community Care programs including sexual assault

Annual Report 2014/15 Stawell Regional Health 45
Stawell Regional Health Notes to the Financial Statements
30 June 2015
Note 2: ANALYSIS OF REVENUE BY SOURCE Admitted Outpatients Ambulatory RAC incl. Aged Primary Other TOTALPatients Mental Health Care Health
2015 2015 2015 2015 2015 2015 2015 2015$'000 $'000 $'000 $'000 $'000 $'000 $'000 $'000
Government Grants 11,832 553 516 2,710 664 2,175 0 18,450Indirect Contributions by Department of Healthand Human Services 148 0 0 0 0 0 0 148Patient and Resident Fees 900 26 0 645 131 85 0 1,787Grampians Rural Health Alliance 0 0 0 0 0 0 301 301Commercial Activities & Specific Purpose Funds 0 0 0 0 0 0 2,553 2,553Other Revenue from Operating Activities 846 27 46 0 23 42 38 1,022
Total Revenue from Operating Activities 13,726 606 562 3,355 818 2,302 2,892 24,261
Interest and Dividends 0 0 0 0 0 0 209 209Other Revenue from Non Operating Activities 82 0 0 3 0 1 0 86
Total Revenue from Non-Operating Activities 82 0 0 3 0 1 209 295
Capital Purpose Income 0 0 0 0 0 0 869 869Capital Interest 0 0 0 0 0 0 48 48
Total Capital Purpose Income 0 0 0 0 0 0 917 917
TOTAL REVENUE 13,808 606 562 3,358 818 2,303 4,018 25,473
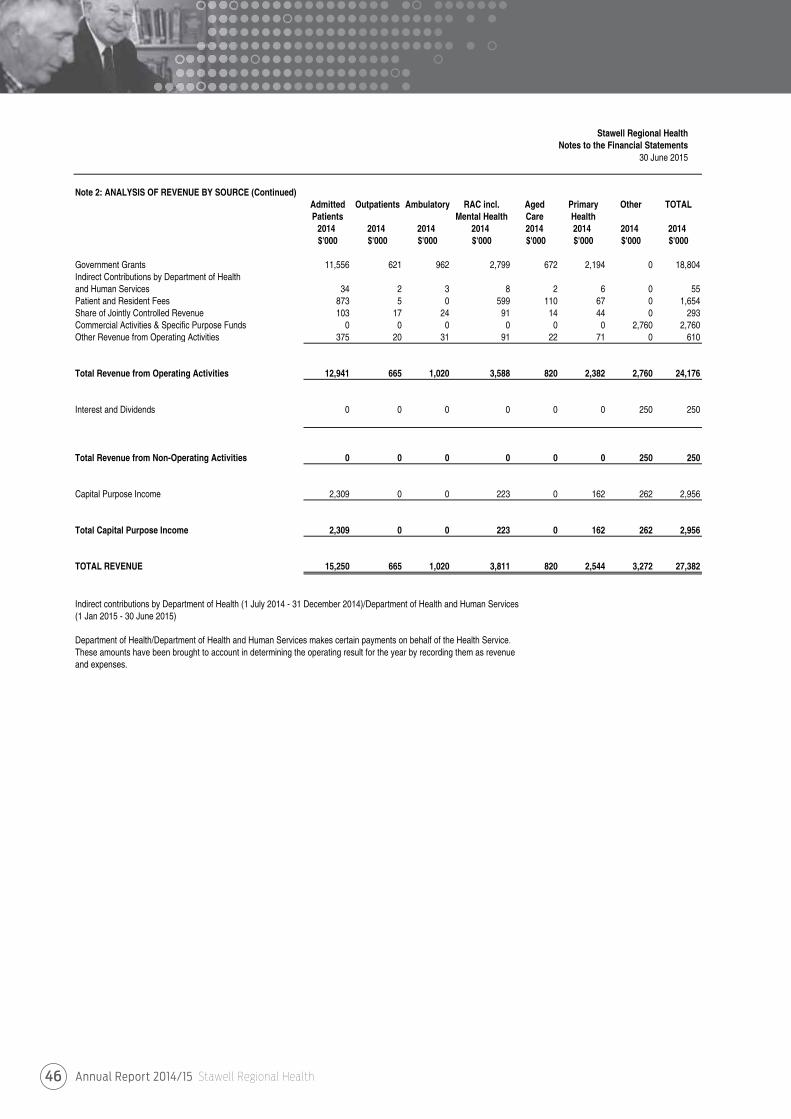
Annual Report 2014/15 Stawell Regional Health46
Stawell Regional Health Notes to the Financial Statements
30 June 2015
Note 2: ANALYSIS OF REVENUE BY SOURCE (Continued)Admitted Outpatients Ambulatory RAC incl. Aged Primary Other TOTALPatients Mental Health Care Health
2014 2014 2014 2014 2014 2014 2014 2014$'000 $'000 $'000 $'000 $'000 $'000 $'000 $'000
Government Grants 11,556 621 962 2,799 672 2,194 0 18,804Indirect Contributions by Department of Healthand Human Services 34 2 3 8 2 6 0 55Patient and Resident Fees 873 5 0 599 110 67 0 1,654Share of Jointly Controlled Revenue 103 17 24 91 14 44 0 293Commercial Activities & Specific Purpose Funds 0 0 0 0 0 0 2,760 2,760Other Revenue from Operating Activities 375 20 31 91 22 71 0 610
Total Revenue from Operating Activities 12,941 665 1,020 3,588 820 2,382 2,760 24,176
Interest and Dividends 0 0 0 0 0 0 250 250
Total Revenue from Non-Operating Activities 0 0 0 0 0 0 250 250
Capital Purpose Income 2,309 0 0 223 0 162 262 2,956
Total Capital Purpose Income 2,309 0 0 223 0 162 262 2,956
TOTAL REVENUE 15,250 665 1,020 3,811 820 2,544 3,272 27,382
Indirect contributions by Department of Health (1 July 2014 - 31 December 2014)/Department of Health and Human Services(1 Jan 2015 - 30 June 2015)
Department of Health/Department of Health and Human Services makes certain payments on behalf of the Health Service.These amounts have been brought to account in determining the operating result for the year by recording them as revenue and expenses.
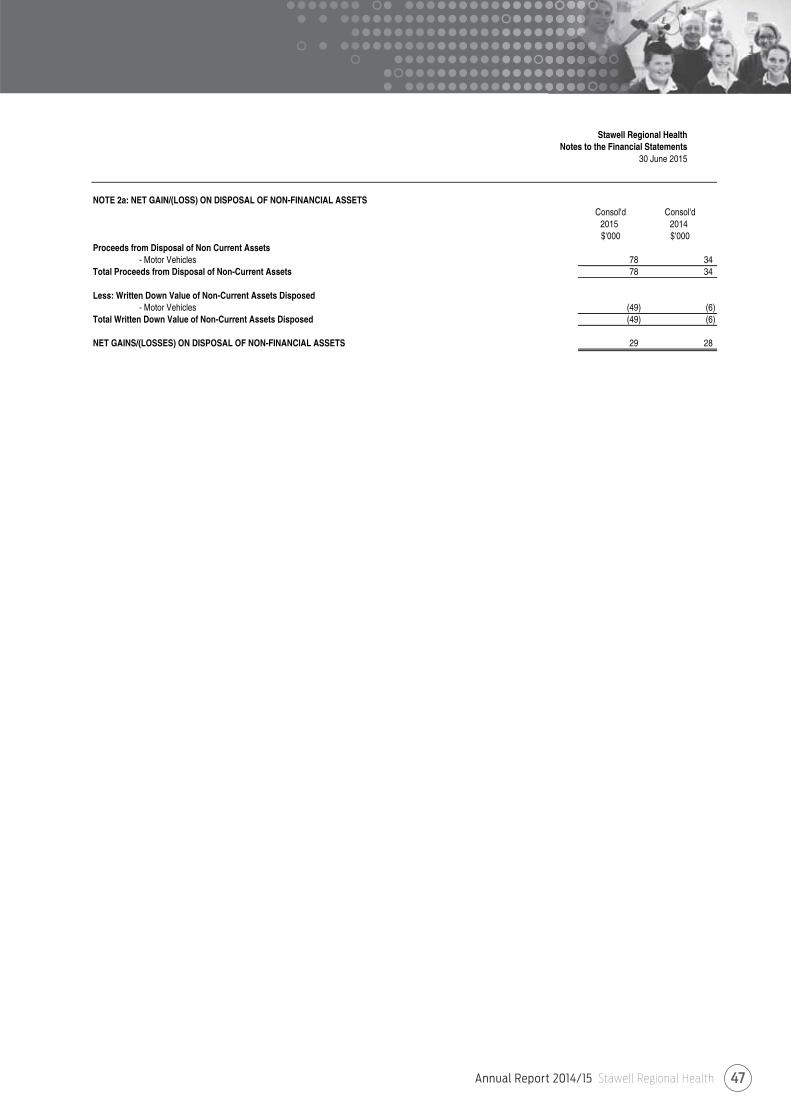
Annual Report 2014/15 Stawell Regional Health 47
Stawell Regional HealthNotes to the Financial Statements
30 June 2015
NOTE 2a: NET GAIN/(LOSS) ON DISPOSAL OF NON-FINANCIAL ASSETSConsol'd Consol'd
2015 2014$'000 $'000
Proceeds from Disposal of Non Current Assets - Motor Vehicles 78 34
Total Proceeds from Disposal of Non-Current Assets 78 34
Less: Written Down Value of Non-Current Assets Disposed - Motor Vehicles (49) (6)
Total Written Down Value of Non-Current Assets Disposed (49) (6)
NET GAINS/(LOSSES) ON DISPOSAL OF NON-FINANCIAL ASSETS 29 28
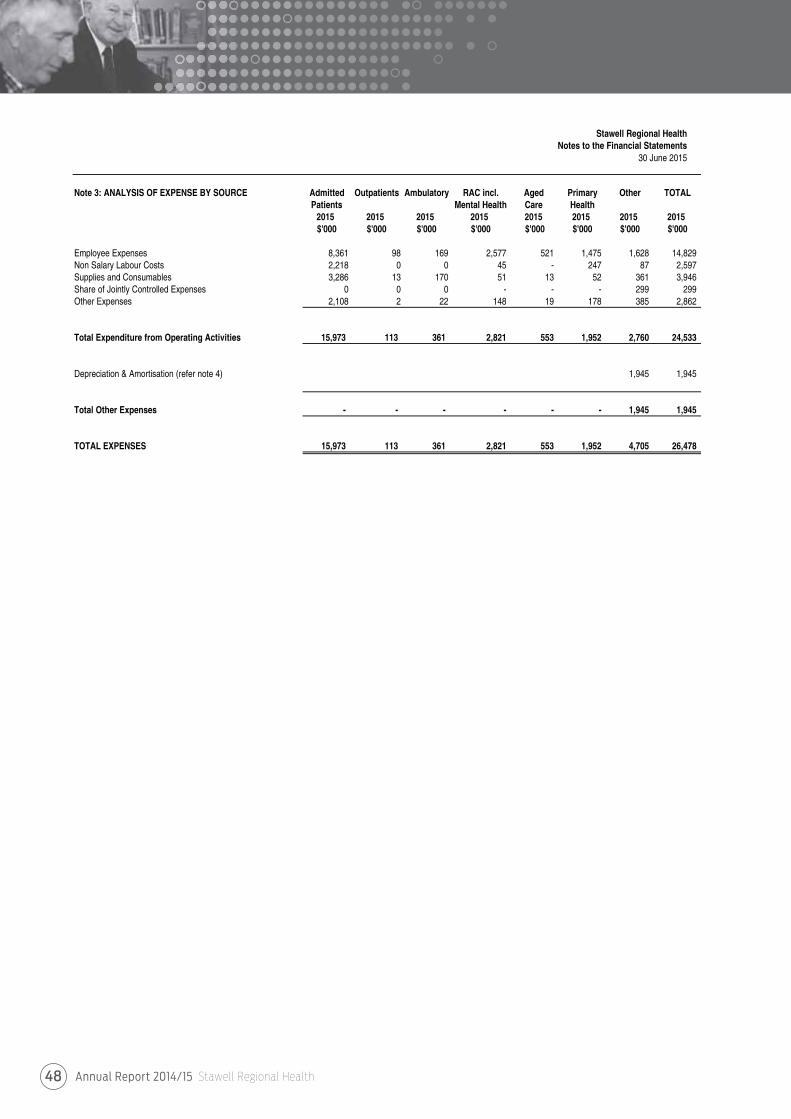
Annual Report 2014/15 Stawell Regional Health48
Stawell Regional Health Notes to the Financial Statements
30 June 2015
Note 3: ANALYSIS OF EXPENSE BY SOURCE Admitted Outpatients Ambulatory RAC incl. Aged Primary Other TOTALPatients Mental Health Care Health
2015 2015 2015 2015 2015 2015 2015 2015$'000 $'000 $'000 $'000 $'000 $'000 $'000 $'000
Employee Expenses 8,361 98 169 2,577 521 1,475 1,628 14,829 Non Salary Labour Costs 2,218 0 0 45 - 247 87 2,597 Supplies and Consumables 3,286 13 170 51 13 52 361 3,946 Share of Jointly Controlled Expenses 0 0 0 - - - 299 299 Other Expenses 2,108 2 22 148 19 178 385 2,862
Total Expenditure from Operating Activities 15,973 113 361 2,821 553 1,952 2,760 24,533
Depreciation & Amortisation (refer note 4) 1,945 1,945
Total Other Expenses - - - - - - 1,945 1,945
TOTAL EXPENSES 15,973 113 361 2,821 553 1,952 4,705 26,478
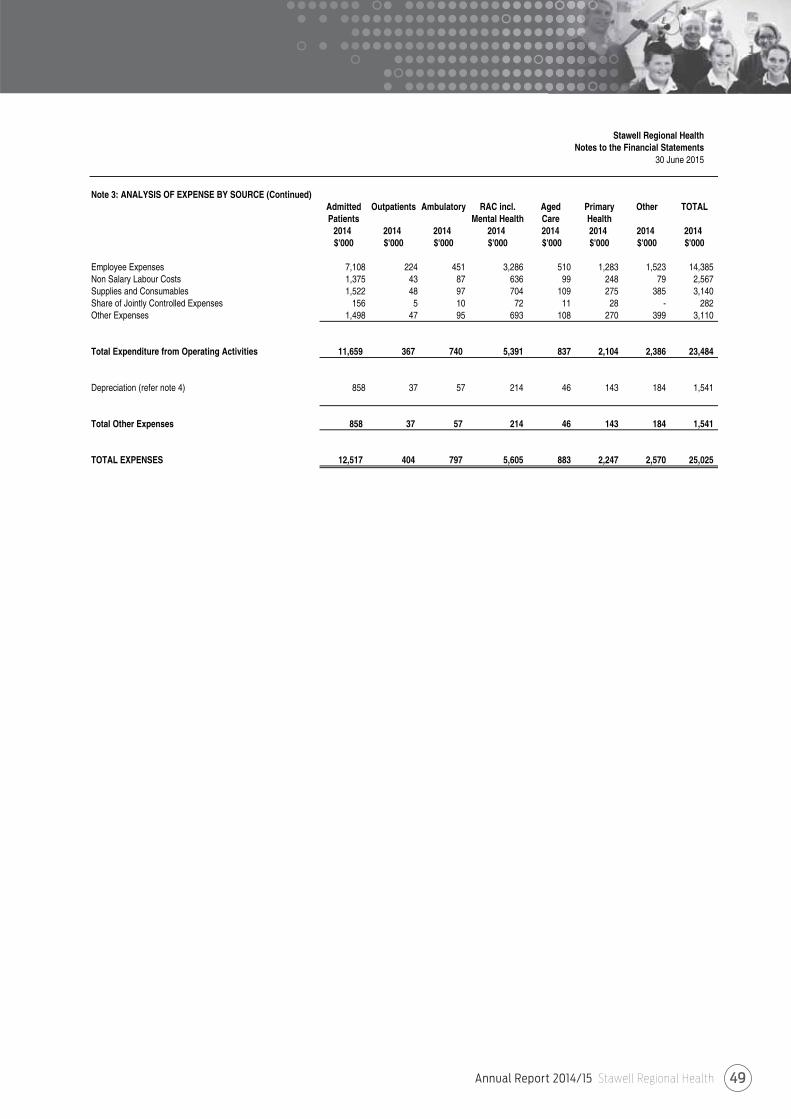
Annual Report 2014/15 Stawell Regional Health 49
Stawell Regional Health Notes to the Financial Statements
30 June 2015
Note 3: ANALYSIS OF EXPENSE BY SOURCE (Continued)Admitted Outpatients Ambulatory RAC incl. Aged Primary Other TOTALPatients Mental Health Care Health
2014 2014 2014 2014 2014 2014 2014 2014$'000 $'000 $'000 $'000 $'000 $'000 $'000 $'000
Employee Expenses 7,108 224 451 3,286 510 1,283 1,523 14,385 Non Salary Labour Costs 1,375 43 87 636 99 248 79 2,567 Supplies and Consumables 1,522 48 97 704 109 275 385 3,140 Share of Jointly Controlled Expenses 156 5 10 72 11 28 - 282 Other Expenses 1,498 47 95 693 108 270 399 3,110
Total Expenditure from Operating Activities 11,659 367 740 5,391 837 2,104 2,386 23,484
Depreciation (refer note 4) 858 37 57 214 46 143 184 1,541
Total Other Expenses 858 37 57 214 46 143 184 1,541
TOTAL EXPENSES 12,517 404 797 5,605 883 2,247 2,570 25,025
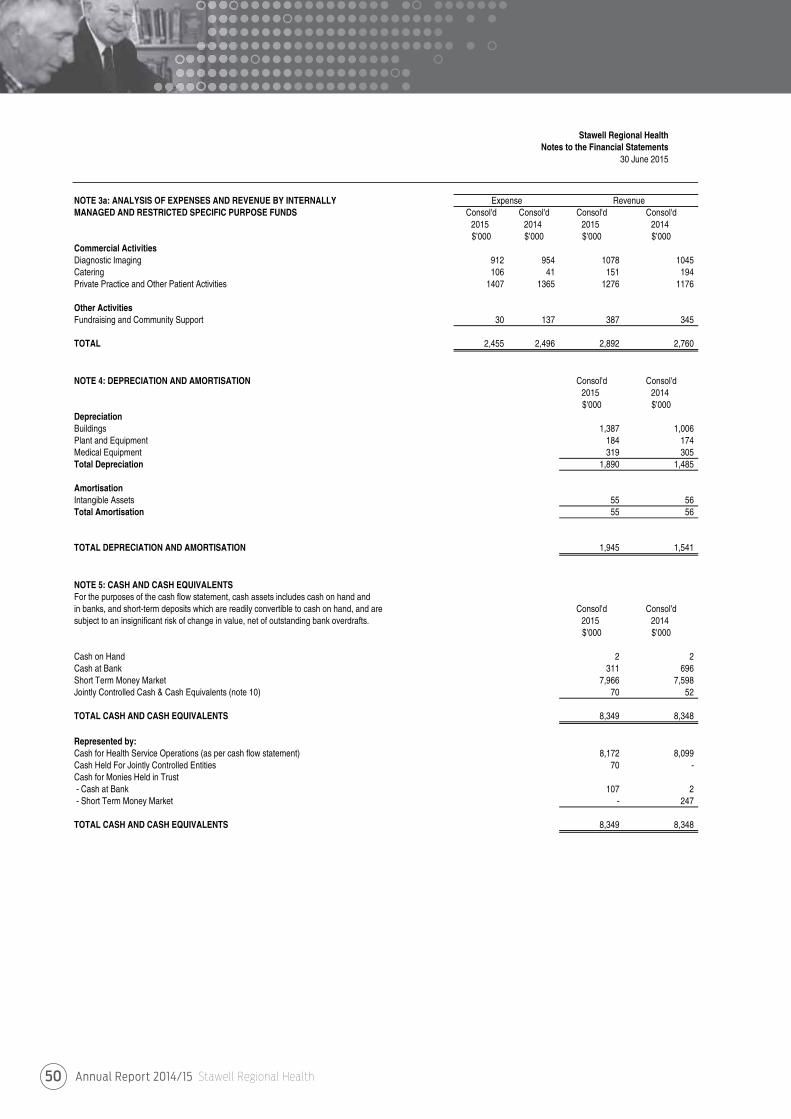
Annual Report 2014/15 Stawell Regional Health50
Stawell Regional HealthNotes to the Financial Statements
30 June 2015
NOTE 3a: ANALYSIS OF EXPENSES AND REVENUE BY INTERNALLYMANAGED AND RESTRICTED SPECIFIC PURPOSE FUNDS Consol'd Consol'd Consol'd Consol'd
2015 2014 2015 2014$'000 $'000 $'000 $'000
Commercial ActivitiesDiagnostic Imaging 912 954 1078 1045Catering 106 41 151 194Private Practice and Other Patient Activities 1407 1365 1276 1176
Other ActivitiesFundraising and Community Support 30 137 387 345
TOTAL 2,455 2,496 2,892 2,760
NOTE 4: DEPRECIATION AND AMORTISATION Consol'd Consol'd2015 2014$'000 $'000
DepreciationBuildings 1,387 1,006 Plant and Equipment 184 174 Medical Equipment 319 305 Total Depreciation 1,890 1,485
AmortisationIntangible Assets 55 56 Total Amortisation 55 56
TOTAL DEPRECIATION AND AMORTISATION 1,945 1,541
NOTE 5: CASH AND CASH EQUIVALENTSFor the purposes of the cash flow statement, cash assets includes cash on hand and in banks, and short-term deposits which are readily convertible to cash on hand, and are Consol'd Consol'dsubject to an insignificant risk of change in value, net of outstanding bank overdrafts. 2015 2014
$'000 $'000
Cash on Hand 2 2 Cash at Bank 311 696 Short Term Money Market 7,966 7,598 Jointly Controlled Cash & Cash Equivalents (note 10) 70 52
TOTAL CASH AND CASH EQUIVALENTS 8,349 8,348
Represented by:Cash for Health Service Operations (as per cash flow statement) 8,172 8,099 Cash Held For Jointly Controlled Entities 70 - Cash for Monies Held in Trust- Cash at Bank 107 2 - Short Term Money Market - 247
TOTAL CASH AND CASH EQUIVALENTS 8,349 8,348
Expense Revenue
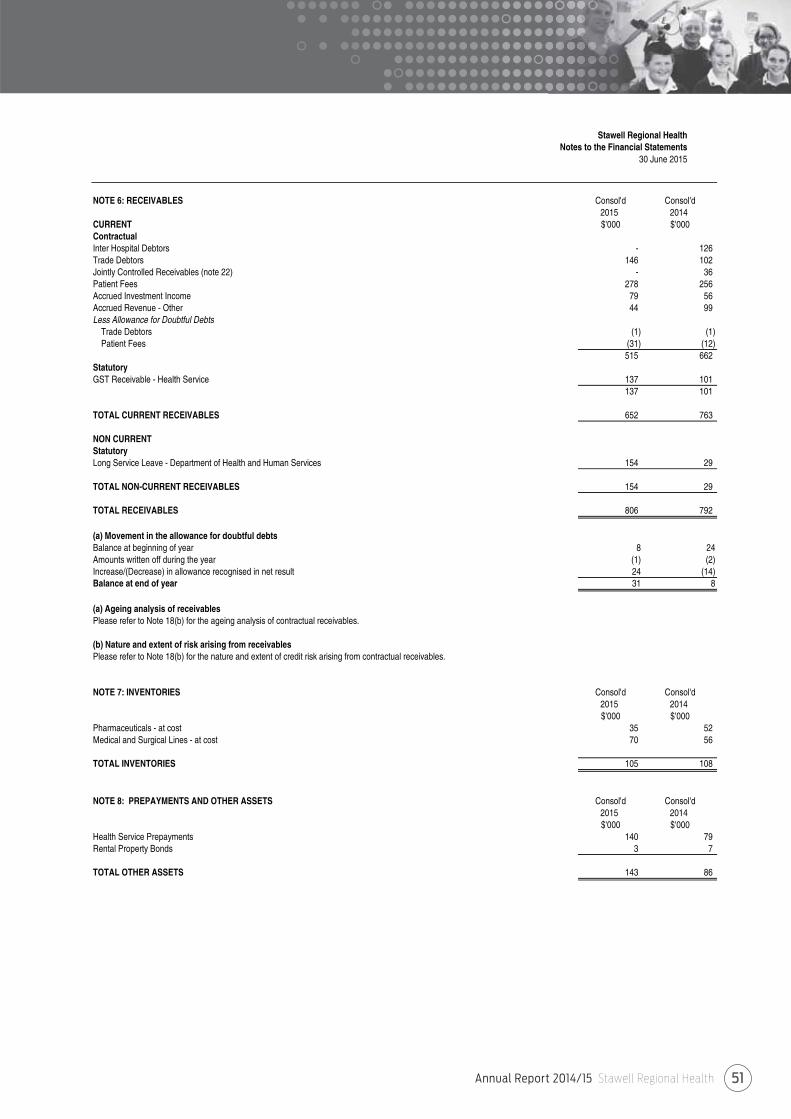
Annual Report 2014/15 Stawell Regional Health 51
Stawell Regional HealthNotes to the Financial Statements
30 June 2015
NOTE 6: RECEIVABLES Consol'd Consol'd2015 2014
CURRENT $'000 $'000ContractualInter Hospital Debtors - 126Trade Debtors 146 102 Jointly Controlled Receivables (note 22) - 36 Patient Fees 278 256 Accrued Investment Income 79 56 Accrued Revenue - Other 44 99 Less Allowance for Doubtful Debts
Trade Debtors (1) (1) Patient Fees (31) (12)
515 662 StatutoryGST Receivable - Health Service 137 101
137 101
TOTAL CURRENT RECEIVABLES 652 763
NON CURRENTStatutoryLong Service Leave - Department of Health and Human Services 154 29
TOTAL NON-CURRENT RECEIVABLES 154 29
TOTAL RECEIVABLES 806 792
(a) Movement in the allowance for doubtful debtsBalance at beginning of year 8 24Amounts written off during the year (1) (2)Increase/(Decrease) in allowance recognised in net result 24 (14)Balance at end of year 31 8
(a) Ageing analysis of receivablesPlease refer to Note 18(b) for the ageing analysis of contractual receivables.
(b) Nature and extent of risk arising from receivablesPlease refer to Note 18(b) for the nature and extent of credit risk arising from contractual receivables.
NOTE 7: INVENTORIES Consol'd Consol'd2015 2014$'000 $'000
Pharmaceuticals - at cost 35 52 Medical and Surgical Lines - at cost 70 56
TOTAL INVENTORIES 105 108
NOTE 8: PREPAYMENTS AND OTHER ASSETS Consol'd Consol'd2015 2014$'000 $'000
Health Service Prepayments 140 79 Rental Property Bonds 3 7
TOTAL OTHER ASSETS 143 86
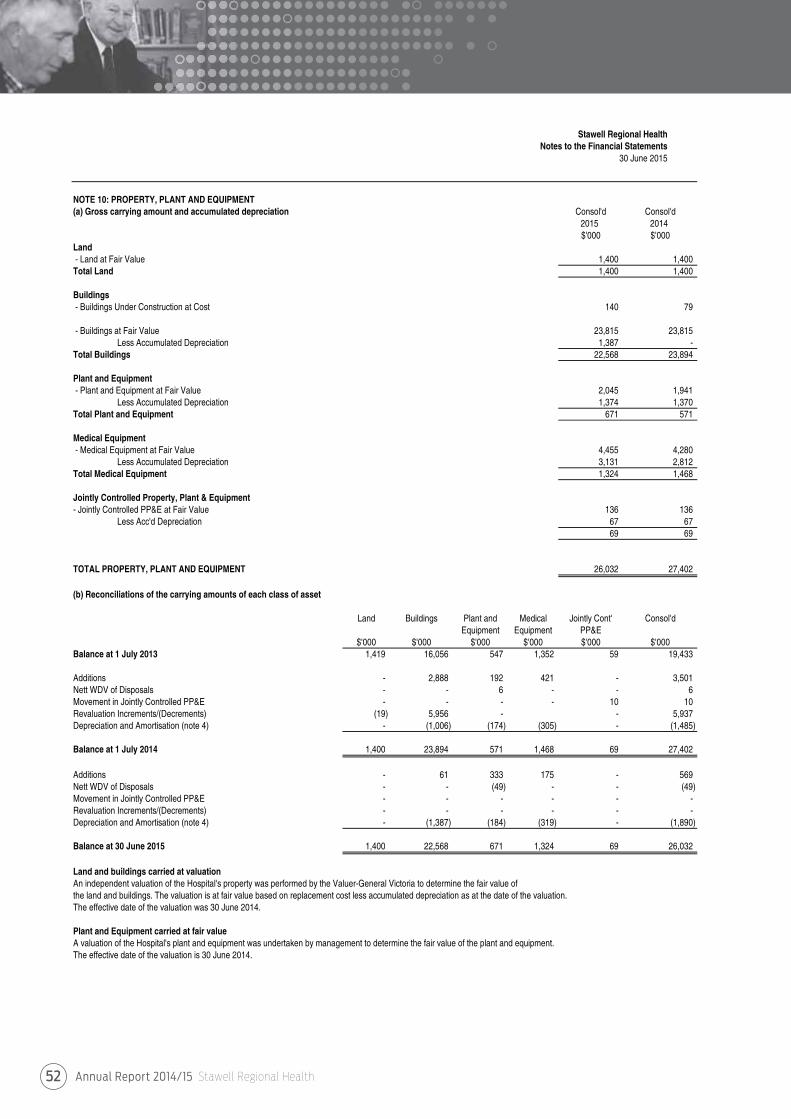
Annual Report 2014/15 Stawell Regional Health52
Stawell Regional HealthNotes to the Financial Statements
30 June 2015
NOTE 10: PROPERTY, PLANT AND EQUIPMENT(a) Gross carrying amount and accumulated depreciation Consol'd Consol'd
2015 2014$'000 $'000
Land- Land at Fair Value 1,400 1,400 Total Land 1,400 1,400
Buildings- Buildings Under Construction at Cost 140 79
- Buildings at Fair Value 23,815 23,815 Less Accumulated Depreciation 1,387 -
Total Buildings 22,568 23,894
Plant and Equipment- Plant and Equipment at Fair Value 2,045 1,941
Less Accumulated Depreciation 1,374 1,370 Total Plant and Equipment 671 571
Medical Equipment - Medical Equipment at Fair Value 4,455 4,280
Less Accumulated Depreciation 3,131 2,812 Total Medical Equipment 1,324 1,468
Jointly Controlled Property, Plant & Equipment- Jointly Controlled PP&E at Fair Value 136 136
Less Acc'd Depreciation 67 67 69 69
TOTAL PROPERTY, PLANT AND EQUIPMENT 26,032 27,402
(b) Reconciliations of the carrying amounts of each class of asset
Land Buildings Plant and Medical Jointly Cont' Consol'dEquipment Equipment PP&E
$'000 $'000 $'000 $'000 $'000 $'000Balance at 1 July 2013 1,419 16,056 547 1,352 59 19,433
Additions - 2,888 192 421 - 3,501 Nett WDV of Disposals - - 6 - - 6 Movement in Jointly Controlled PP&E - - - - 10 10 Revaluation Increments/(Decrements) (19) 5,956 - - 5,937 Depreciation and Amortisation (note 4) - (1,006) (174) (305) - (1,485)
Balance at 1 July 2014 1,400 23,894 571 1,468 69 27,402
Additions - 61 333 175 - 569 Nett WDV of Disposals - - (49) - - (49) Movement in Jointly Controlled PP&E - - - - - - Revaluation Increments/(Decrements) - - - - - - Depreciation and Amortisation (note 4) - (1,387) (184) (319) - (1,890)
Balance at 30 June 2015 1,400 22,568 671 1,324 69 26,032
Land and buildings carried at valuationAn independent valuation of the Hospital's property was performed by the Valuer-General Victoria to determine the fair value of the land and buildings. The valuation is at fair value based on replacement cost less accumulated depreciation as at the date of the valuation. The effective date of the valuation was 30 June 2014.
Plant and Equipment carried at fair valueA valuation of the Hospital's plant and equipment was undertaken by management to determine the fair value of the plant and equipment.The effective date of the valuation is 30 June 2014.
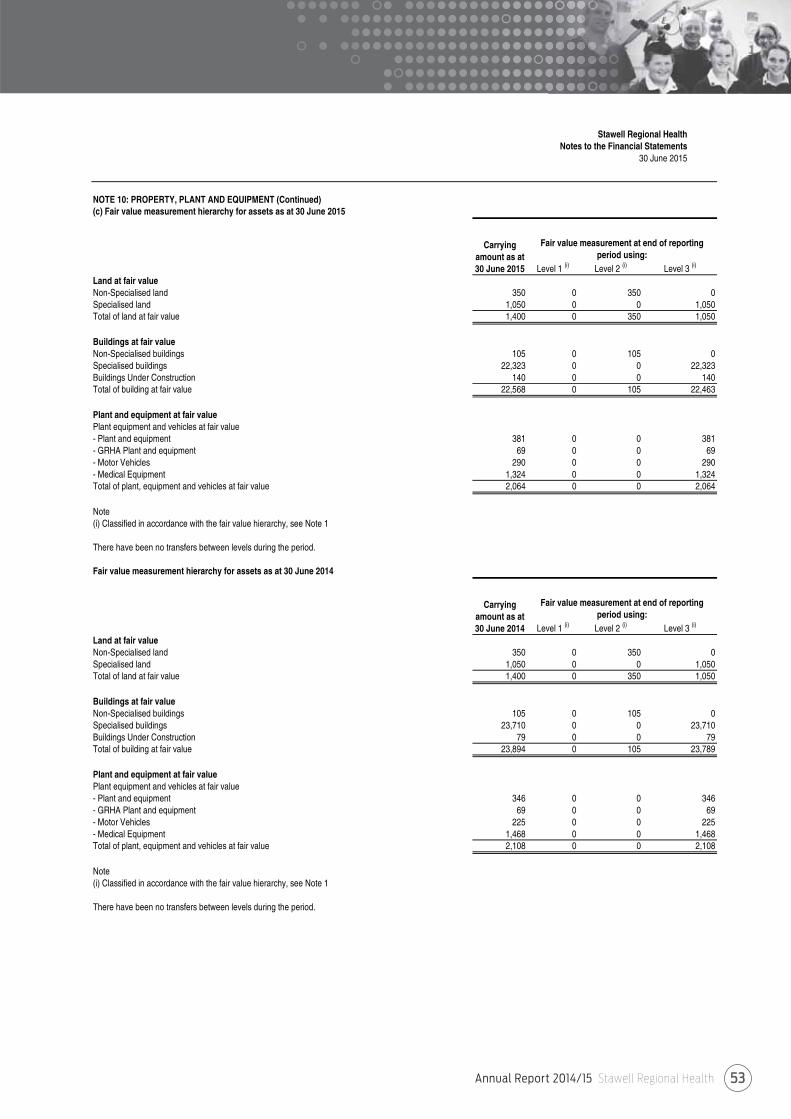
Annual Report 2014/15 Stawell Regional Health 53
Stawell Regional HealthNotes to the Financial Statements
30 June 2015
NOTE 10: PROPERTY, PLANT AND EQUIPMENT (Continued)(c) Fair value measurement hierarchy for assets as at 30 June 2015
Level 1 (i) Level 2 (i) Level 3 (i)
Land at fair valueNon-Specialised land 350 0 350 0Specialised land 1,050 0 0 1,050Total of land at fair value 1,400 0 350 1,050
Buildings at fair valueNon-Specialised buildings 105 0 105 0Specialised buildings 22,323 0 0 22,323Buildings Under Construction 140 0 0 140Total of building at fair value 22,568 0 105 22,463
Plant and equipment at fair valuePlant equipment and vehicles at fair value- Plant and equipment 381 0 0 381- GRHA Plant and equipment 69 0 0 69- Motor Vehicles 290 0 0 290- Medical Equipment 1,324 0 0 1,324Total of plant, equipment and vehicles at fair value 2,064 0 0 2,064
Note(i) Classified in accordance with the fair value hierarchy, see Note 1
There have been no transfers between levels during the period.
Fair value measurement hierarchy for assets as at 30 June 2014
Level 1 (i) Level 2 (i) Level 3 (i)
Land at fair valueNon-Specialised land 350 0 350 0Specialised land 1,050 0 0 1,050Total of land at fair value 1,400 0 350 1,050
Buildings at fair valueNon-Specialised buildings 105 0 105 0Specialised buildings 23,710 0 0 23,710Buildings Under Construction 79 0 0 79Total of building at fair value 23,894 0 105 23,789
Plant and equipment at fair valuePlant equipment and vehicles at fair value- Plant and equipment 346 0 0 346- GRHA Plant and equipment 69 0 0 69- Motor Vehicles 225 0 0 225- Medical Equipment 1,468 0 0 1,468Total of plant, equipment and vehicles at fair value 2,108 0 0 2,108
Note(i) Classified in accordance with the fair value hierarchy, see Note 1
There have been no transfers between levels during the period.
Carrying amount as at 30 June 2015
Fair value measurement at end of reporting period using:
Carrying amount as at 30 June 2014
Fair value measurement at end of reporting period using:
Annual Report 2014/15 Stawell Regional Health54
Stawell Regional HealthNotes to the Financial Statements
30 June 2015
NOTE 10: PROPERTY, PLANT AND EQUIPMENT (Continued)(c) Fair value measurement hierarchy for assets as at 30 June 2015 (Continued)Specialised land and specialised buildingsThe market approach is also used for specialised land and specialised buildings although is adjusted for the community service obligation (CSO) to reflect the specialised nature of the assets being valued. Specialised assets contain significant, unobservable adjustments;therefore these assets are classified as Level 3 under the market based direct comparison approach.
The CSO adjustment is a reflection of the valuer’s assessment of the impact of restrictions associated with an asset to the extent that is also equally applicable to market participants. This approach is in light of the highest and best use consideration required for fair value measurement, and takes into account the use of the asset that is physically possible, legally permissible and financially feasible. As adjustments of CSO are considered as significant unobservable inputs, specialised land would be classified as Level 3 assets.
For the health services, the depreciated replacement cost method is used for the majority of specialised buildings, adjusting for the associated depreciation. As depreciation adjustments are considered as significant and unobservable inputs in nature, specialisedbuildings are classified as Level 3 for fair value measurements.
An independent valuation of the Health Service’s specialised land and specialised buildings was performed by the Valuer-General Victoria. The valuation was performed using the market approach adjusted for CSO. The effective date of the valuation is 30 June 2014.
VehiclesThe Health Service acquires new vehicles and at times disposes of them before completion of their economic life. The process of acquisition, use and disposal in the market is managed by the Health Service who set relevant depreciation ratesduring use to reflect the consumption of the vehicles. As a result, the fair value of vehicles does not differ materially from the carrying value (depreciated cost).
Plant and equipmentPlant and equipment is held at carrying value (depreciated cost). When plant and equipment is specialised in use, such that it is rarely sold other than as part of a going concern, the depreciated replacement cost is used to estimate the fair value. Unless there is market evidence that current replacement costs are significantly different from the original acquisition cost, it is considered unlikely that depreciated replacement cost will be materially different from the existing carrying value.
There were no changes in valuation techniques throughout the period to 30 June 2015.
For all assets measured at fair value, the current use is considered the highest and best use.
(d) Reconciliation of Level 3 fair value as at 30 June 2015 Land BuildingsPlant and equipment Medical equipment
Opening Balance 1,050 23,789 640 1,468 Purchases (sales) - 61 284 175
Gains or losses recognised in net result- Depreciation - (1,387) (184) (319) Subtotal 1,050 22,463 740 1,324
Items recognised in other comprehensive income- Revaluation - - - - Subtotal - - - - Closing Balance 1,050 22,463 740 1,324
Unrealised gains/(losses) on non-financial assets - - - - 1,050 22,463 740 1,324
There have been no transfers between levels during the period.
Reconciliation of Level 3 fair value as at 30 June 2014 Land BuildingsPlant and equipment Medical equipment
Opening Balance 1,049 16,022 606 1,352 Purchases (sales) - 2,814 196 421
Gains or losses recognised in net result- Depreciation - (1,003) (174) (305) Subtotal 1,049 17,833 628 1,468
Items recognised in other comprehensive income- Revaluation 1 5,956 Subtotal 1 5,956 - - Closing Balance 1,050 23,789 628 1,468
Unrealised gains/(losses) on non-financial assets - - - - 1,050 23,789 628 1,468
There have been no transfers between levels during the period.
Annual Report 2014/15 Stawell Regional Health 55
Stawell Regional HealthNotes to the Financial Statements
30 June 2015
NOTE 10: PROPERTY, PLANT AND EQUIPMENT (Continued)(e) Description of significant unobservable inputs to Level 3 valuations:
Valuation
technique (i)
Significant unobservable
inputs
Market Approach
Community Service
Obligation (CSO)
adjustmentSpecialised buildings
Useful life of specialised buildings
Cost per unit
Misc Hospital Administrative EquipmentUseful life of
PPE
Cost per unit
Misc Hospital Medical Equipment & Machines
Useful life of PPE
Cost per unit
Useful life of PPE
NOTE 11: INTANGIBLE ASSETSConsol'd Consol'd
2015 2014$'000 $'000
Computer Software 475 453 Less Accumulated Amortisation 416 361
59 92
Business Goodwill 243 243
TOTAL INTANGIBLE ASSETS 302 335
Reconciliation of the carrying amounts of intangible assets at the beginning and end of the previous and current financial year:
Computer Business Software Goodwill Total
$'000 $'000 $'000Balance at 1 July 2013 148 243 391Additions 0 0 0Amortisation (note 4) 56 0 56Balance at 1 July 2014 92 243 335Additions 22 0 22Amortisation (note 4) 55 0 55Balance at 30 June 2015 59 243 302
Depreciated replacement
cost
Depreciated replacement
cost
Motor Vehicles
Depreciated replacement
cost
Medical equipment at fair value
Hospital-owned fleet vehicles
Plant and equipment at fair value
Specialised land
Hospital Site's
Direct cost per square metreDepreciated
replacement cost
Hospital Buildings
Annual Report 2014/15 Stawell Regional Health56
Stawell Regional HealthNotes to the Financial Statements
30 June 2015
NOTE 12: PAYABLES Consol'd Consol'd2015 2014
CURRENT $'000 $'000ContractualTrade Creditors 852 584 Jointly Controlled Payables 16 36 Accrued Expenses - Other 138 449
1,006 1,069 StatutoryDepartment of Health and Human Services 272 129
272 129 TOTAL PAYABLES 1,278 1,198
(a) Maturity analysis of payablesPlease refer to Note 18(c) for the ageing analysis of contractual payables.
(b) Nature and extent of risk arising from payablesPlease refer to Note 18(c) for the nature and extent of risks arising from contractual payables.
NOTE 13: PROVISIONS Consol'd Consol'd2015 2014
Current Provisions $'000 $'000Employee Benefits (i)Annual Leave (Note 13(a))- unconditional and expected to be settled within 12 months (ii) 888 581 - unconditional and expected to be settled after 12 months (iii) 70 65 Long Service Leave (Note 13(a))- unconditional and expected to be settled within 12 months (ii) 145 119 - unconditional and expected to be settled after 12 months (iii) 1,200 1,072 Accrued Days Off (Note 13(a))- unconditional and expected to be settled within 12 months (ii) 55 55 - unconditional and expected to be settled after 12 months (iii) - - Accrued Wages & Salaries (Note 13(a))- unconditional and expected to be settled within 12 months (ii) 71 549 - unconditional and expected to be settled after 12 months (iii) - -
2,429 2,441
Provisions related to employee benefit on-costs- unconditional and expected to be settled within 12 months (ii) 147 84 - unconditional and expected to be settled after 12 months (iii) 134 136
281 220 Total Current Provisions 2,710 2,662
Non-Current ProvisionsEmployee Benefits (i) (Note 13(a)) 486 664 Provisions related to employee benefit on-costs (Note 13(a) and Note 13(b)) 51 80 Total Non-Current Provisions 537 744
Total Provisions 3,247 3,406
(a) Employee Benefits and Related On-CostsCurrent Employee Benefits and Related On-CostsAnnual Leave Entitlements 1,083 726 Accrued Salaries and Wages 79 549 Accrued Days Off 61 55 Unconditional Long Service Leave Entitlements 1,487 1,332 Non-Current Employee Benefits and Related On-CostsConditional Annual Leave Entitlements (present value) 92 372 Conditional Long Service Leave Entitlements (ii) 445 372 Total Employee Benefits and Related On-Costs 3,247 3,406
(b) Movements in provisionsMovement in Long Service Leave:Balance at start of year 1,704 1,587 Provision made during the year- Revaluations 72 (72) - Expense Recognising Employee Service 313 404 Settlement made during the year (190) (215)
Balance at end of year 1,899 1,704
Notes:(i) Employee benefits consist of annual leave and long service leave accrued by employees. On-costs such as payroll tax and worker's compensation insurance are not employee benefits and are reflected as a separate provision.(ii) The amounts disclosed are at nominal values(iii) The amounts disclosed are at present values
Annual Report 2014/15 Stawell Regional Health 57
Stawell Regional HealthNotes to the Financial Statements
30 June 2015
NOTE 14: SUPERANNUATIONEmployees of the Health Service are entitled to receive superannuation benefits and the Health Service contributes to both defined benefit and defined contribution plans. The defined benefit plan(s) provides benefits based on years of service and final average salary.
The Health service does not recognise any defined benefit liability in respect of the plan(s) because the entity has no legal or constructiveobligation to pay future benefits relating to its employees; its only obligation is to pay superannuation contributions as they fall due. The Department of Treasury and Finance discloses the State's defined benefits liabilities in its disclosure for administered terms.
However superannuation contributions paid or payable for the reporting period are included as part of employee benefits in the comprehensive operating statement of the Health Service. The name, details and amounts expensed in relation to the major employeesuperannuation funds and contributions made by the Health Service are as follows:
Fund2015 2014 2015 2014$'000 $'000 $'000 $'000
Defined Benefit Plans: First State 110 133 - 5 Defined Contribution Plans: First State / HESTA / Other 1,131 1,067 - 40 Total 1,241 1,200 - 45
NOTE 15: OTHER LIABILITIES Consol'd Consol'd2015 2014$'000 $'000
CURRENTMonies Held in Trust*- Patient Monies Held in Trust 56 54 - Other Monies Held in Trust 49 195 Revenue in Advance - 106
TOTAL CURRENT 105 355
* Total Monies Held in TrustRepresented by the following assets:Cash Assets (refer to Note 5) 105 248 TOTAL OTHER LIABILITIES 105 248
Paid Contributionsfor the year
Outstanding Contributionsat Year End
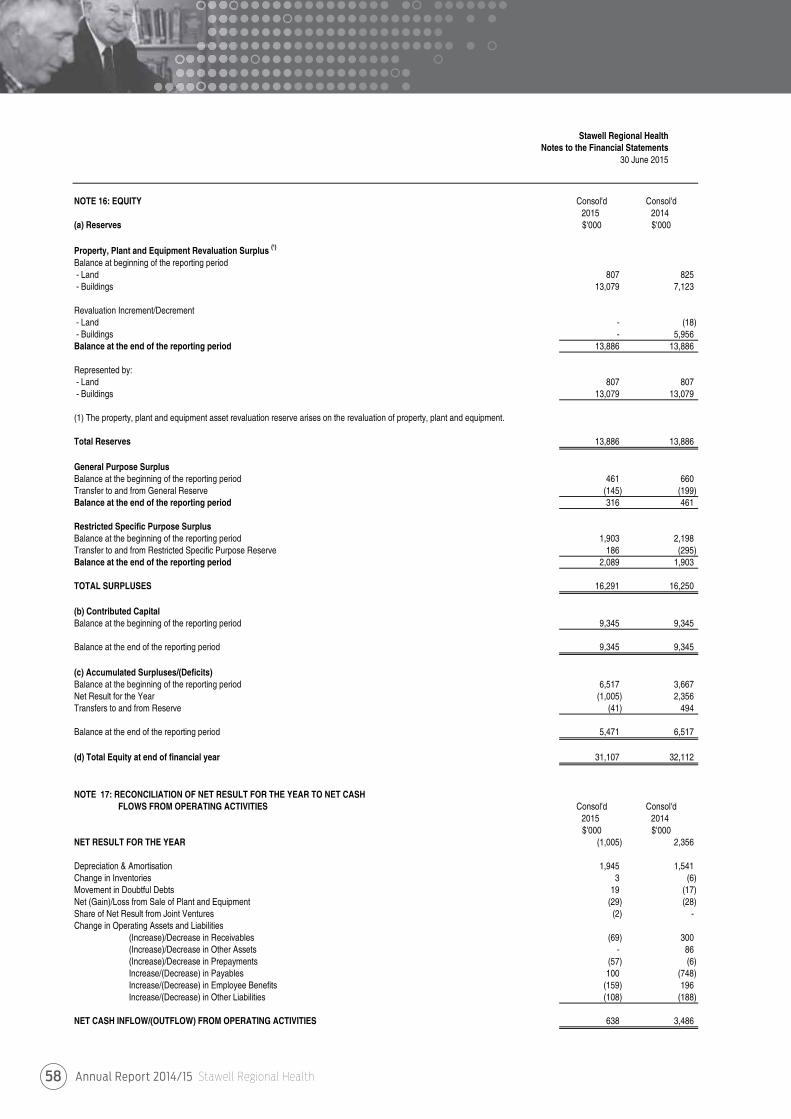
Annual Report 2014/15 Stawell Regional Health58
Stawell Regional HealthNotes to the Financial Statements
30 June 2015
NOTE 16: EQUITY Consol'd Consol'd2015 2014
(a) Reserves $'000 $'000
Property, Plant and Equipment Revaluation Surplus (¹)
Balance at beginning of the reporting period- Land 807 825 - Buildings 13,079 7,123
Revaluation Increment/Decrement- Land - (18) - Buildings - 5,956 Balance at the end of the reporting period 13,886 13,886
Represented by:- Land 807 807 - Buildings 13,079 13,079
(1) The property, plant and equipment asset revaluation reserve arises on the revaluation of property, plant and equipment.
Total Reserves 13,886 13,886
General Purpose SurplusBalance at the beginning of the reporting period 461 660 Transfer to and from General Reserve (145) (199) Balance at the end of the reporting period 316 461
Restricted Specific Purpose SurplusBalance at the beginning of the reporting period 1,903 2,198 Transfer to and from Restricted Specific Purpose Reserve 186 (295) Balance at the end of the reporting period 2,089 1,903
TOTAL SURPLUSES 16,291 16,250
(b) Contributed CapitalBalance at the beginning of the reporting period 9,345 9,345
Balance at the end of the reporting period 9,345 9,345
(c) Accumulated Surpluses/(Deficits)Balance at the beginning of the reporting period 6,517 3,667 Net Result for the Year (1,005) 2,356 Transfers to and from Reserve (41) 494
Balance at the end of the reporting period 5,471 6,517
(d) Total Equity at end of financial year 31,107 32,112
NOTE 17: RECONCILIATION OF NET RESULT FOR THE YEAR TO NET CASH FLOWS FROM OPERATING ACTIVITIES Consol'd Consol'd
2015 2014$'000 $'000
NET RESULT FOR THE YEAR (1,005) 2,356
Depreciation & Amortisation 1,945 1,541 Change in Inventories 3 (6) Movement in Doubtful Debts 19 (17) Net (Gain)/Loss from Sale of Plant and Equipment (29) (28) Share of Net Result from Joint Ventures (2) - Change in Operating Assets and Liabilities
(Increase)/Decrease in Receivables (69) 300 (Increase)/Decrease in Other Assets - 86 (Increase)/Decrease in Prepayments (57) (6) Increase/(Decrease) in Payables 100 (748) Increase/(Decrease) in Employee Benefits (159) 196 Increase/(Decrease) in Other Liabilities (108) (188)
NET CASH INFLOW/(OUTFLOW) FROM OPERATING ACTIVITIES 638 3,486
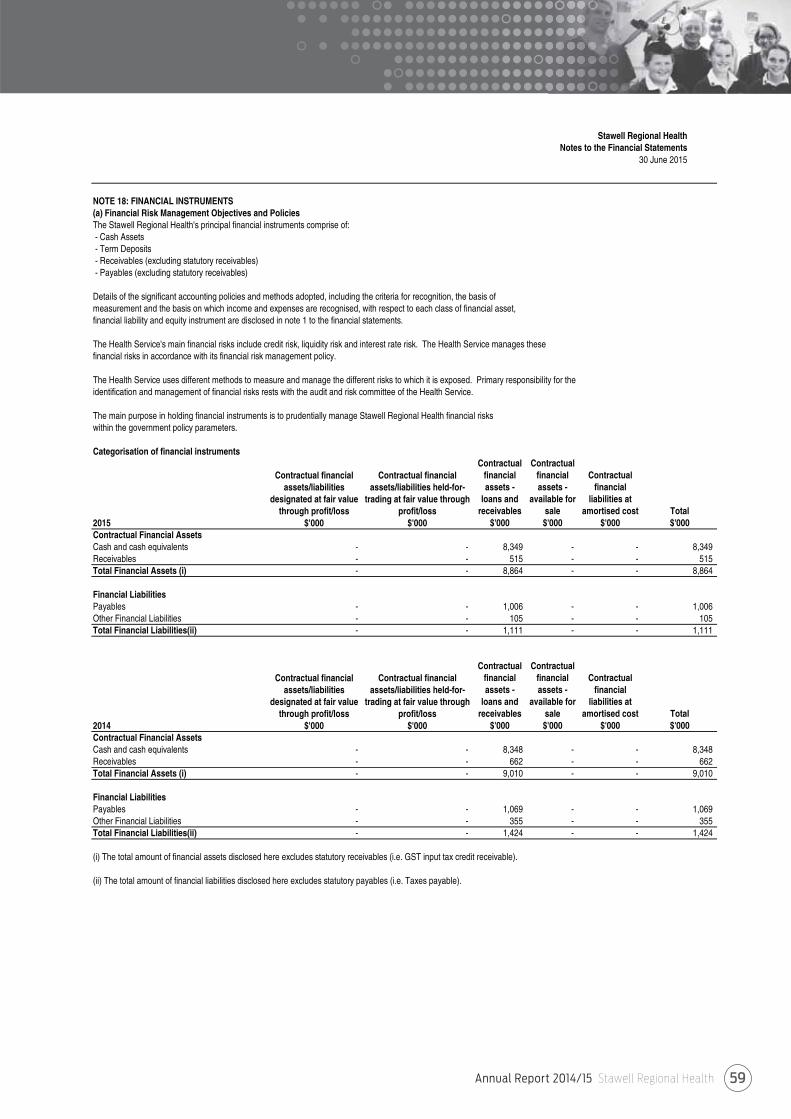
Annual Report 2014/15 Stawell Regional Health 59
Stawell Regional HealthNotes to the Financial Statements
30 June 2015
NOTE 18: FINANCIAL INSTRUMENTS(a) Financial Risk Management Objectives and PoliciesThe Stawell Regional Health's principal financial instruments comprise of:- Cash Assets- Term Deposits- Receivables (excluding statutory receivables)- Payables (excluding statutory receivables)
Details of the significant accounting policies and methods adopted, including the criteria for recognition, the basis of measurement and the basis on which income and expenses are recognised, with respect to each class of financial asset,financial liability and equity instrument are disclosed in note 1 to the financial statements.
The Health Service's main financial risks include credit risk, liquidity risk and interest rate risk. The Health Service manages thesefinancial risks in accordance with its financial risk management policy.
The Health Service uses different methods to measure and manage the different risks to which it is exposed. Primary responsibility for the identification and management of financial risks rests with the audit and risk committee of the Health Service.
The main purpose in holding financial instruments is to prudentially manage Stawell Regional Health financial riskswithin the government policy parameters.
Categorisation of financial instrumentsContractual
financial assets -
loans and receivables
Contractual financial assets -
available for sale
Contractual financial
liabilities at amortised cost Total
2015 $'000 $'000 $'000 $'000Contractual Financial Assets Cash and cash equivalents 8,349 - - 8,349 Receivables 515 - - 515 Total Financial Assets (i) 8,864 - - 8,864
Financial Liabilities Payables 1,006 - - 1,006 Other Financial Liabilities 105 - - 105 Total Financial Liabilities(ii) 1,111 - - 1,111
Contractual financial assets -
loans and receivables
Contractual financial assets -
available for sale
Contractual financial
liabilities at amortised cost Total
2014 $'000 $'000 $'000 $'000Contractual Financial Assets Cash and cash equivalents 8,348 - - 8,348 Receivables 662 - - 662 Total Financial Assets (i) 9,010 - - 9,010
Financial Liabilities Payables 1,069 - - 1,069 Other Financial Liabilities 355 - - 355 Total Financial Liabilities(ii) 1,424 - - 1,424
(i) The total amount of financial assets disclosed here excludes statutory receivables (i.e. GST input tax credit receivable).
(ii) The total amount of financial liabilities disclosed here excludes statutory payables (i.e. Taxes payable).
- -
- -
Contractual financial assets/liabilities held-for-
trading at fair value through profit/loss
- - - -
$'000 $'000
- -
$'000 $'000
- -
- - - -
Contractual financial assets/liabilities
designated at fair value through profit/loss
- -
Contractual financial assets/liabilities
designated at fair value through profit/loss
Contractual financial assets/liabilities held-for-
trading at fair value through profit/loss
- - - - - -
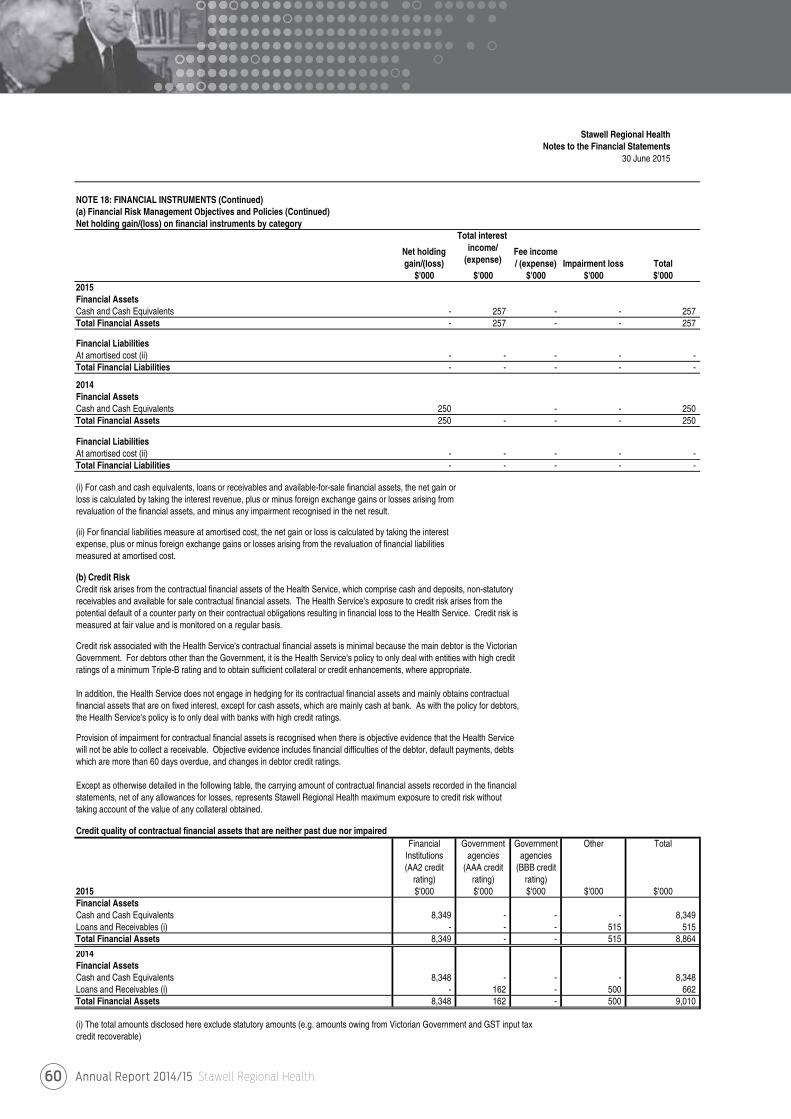
Annual Report 2014/15 Stawell Regional Health60
Stawell Regional HealthNotes to the Financial Statements
30 June 2015
NOTE 18: FINANCIAL INSTRUMENTS (Continued)(a) Financial Risk Management Objectives and Policies (Continued)Net holding gain/(loss) on financial instruments by category
Total interest income/
(expense) Total$'000 $'000 $'000 $'000 $'000
2015Financial AssetsCash and Cash Equivalents - 257 - - 257 Total Financial Assets - 257 - - 257
Financial LiabilitiesAt amortised cost (ii) - - - - - Total Financial Liabilities - - - - -
2014Financial AssetsCash and Cash Equivalents 250 - - 250 Total Financial Assets 250 - - - 250
Financial LiabilitiesAt amortised cost (ii) - - - - - Total Financial Liabilities - - - - -
(i) For cash and cash equivalents, loans or receivables and available-for-sale financial assets, the net gain orloss is calculated by taking the interest revenue, plus or minus foreign exchange gains or losses arising fromrevaluation of the financial assets, and minus any impairment recognised in the net result.
(ii) For financial liabilities measure at amortised cost, the net gain or loss is calculated by taking the interestexpense, plus or minus foreign exchange gains or losses arising from the revaluation of financial liabilitiesmeasured at amortised cost.
(b) Credit RiskCredit risk arises from the contractual financial assets of the Health Service, which comprise cash and deposits, non-statutoryreceivables and available for sale contractual financial assets. The Health Service's exposure to credit risk arises from thepotential default of a counter party on their contractual obligations resulting in financial loss to the Health Service. Credit risk ismeasured at fair value and is monitored on a regular basis.
Credit risk associated with the Health Service's contractual financial assets is minimal because the main debtor is the VictorianGovernment. For debtors other than the Government, it is the Health Service's policy to only deal with entities with high creditratings of a minimum Triple-B rating and to obtain sufficient collateral or credit enhancements, where appropriate.
In addition, the Health Service does not engage in hedging for its contractual financial assets and mainly obtains contractualfinancial assets that are on fixed interest, except for cash assets, which are mainly cash at bank. As with the policy for debtors,the Health Service's policy is to only deal with banks with high credit ratings.
Provision of impairment for contractual financial assets is recognised when there is objective evidence that the Health Servicewill not be able to collect a receivable. Objective evidence includes financial difficulties of the debtor, default payments, debtswhich are more than 60 days overdue, and changes in debtor credit ratings.
Except as otherwise detailed in the following table, the carrying amount of contractual financial assets recorded in the financialstatements, net of any allowances for losses, represents Stawell Regional Health maximum exposure to credit risk withouttaking account of the value of any collateral obtained.
Credit quality of contractual financial assets that are neither past due nor impairedFinancial Government Government Other Total
Institutions agencies agencies(AA2 credit (AAA credit (BBB credit
rating) rating) rating)2015 $'000 $'000 $'000 $'000 $'000Financial AssetsCash and Cash Equivalents 8,349 - - - 8,349 Loans and Receivables (i) - - - 515 515 Total Financial Assets 8,349 - - 515 8,864
2014Financial AssetsCash and Cash Equivalents 8,348 - - - 8,348 Loans and Receivables (i) - 162 - 500 662 Total Financial Assets 8,348 162 - 500 9,010
(i) The total amounts disclosed here exclude statutory amounts (e.g. amounts owing from Victorian Government and GST input taxcredit recoverable)
Impairment lossFee income / (expense)
Net holding gain/(loss)
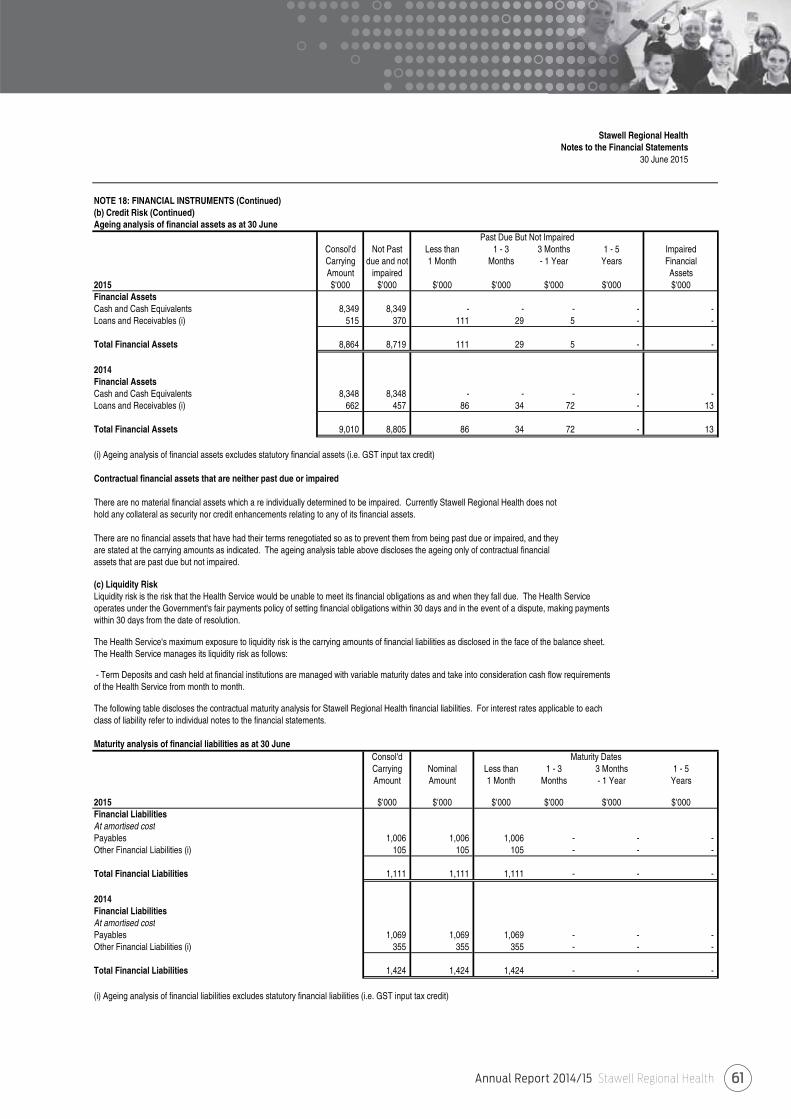
Annual Report 2014/15 Stawell Regional Health 61
Stawell Regional HealthNotes to the Financial Statements
30 June 2015
NOTE 18: FINANCIAL INSTRUMENTS (Continued)(b) Credit Risk (Continued)Ageing analysis of financial assets as at 30 June
Consol'd Not Past Less than 1 - 3 3 Months 1 - 5 ImpairedCarrying due and not 1 Month Months - 1 Year Years FinancialAmount impaired Assets
2015 $'000 $'000 $'000 $'000 $'000 $'000 $'000Financial AssetsCash and Cash Equivalents 8,349 8,349 - - - - - Loans and Receivables (i) 515 370 111 29 5 - -
Total Financial Assets 8,864 8,719 111 29 5 - -
2014Financial AssetsCash and Cash Equivalents 8,348 8,348 - - - - - Loans and Receivables (i) 662 457 86 34 72 - 13
Total Financial Assets 9,010 8,805 86 34 72 - 13
(i) Ageing analysis of financial assets excludes statutory financial assets (i.e. GST input tax credit)
Contractual financial assets that are neither past due or impaired
There are no material financial assets which a re individually determined to be impaired. Currently Stawell Regional Health does nothold any collateral as security nor credit enhancements relating to any of its financial assets.
There are no financial assets that have had their terms renegotiated so as to prevent them from being past due or impaired, and theyare stated at the carrying amounts as indicated. The ageing analysis table above discloses the ageing only of contractual financialassets that are past due but not impaired.
(c) Liquidity RiskLiquidity risk is the risk that the Health Service would be unable to meet its financial obligations as and when they fall due. The Health Service operates under the Government's fair payments policy of setting financial obligations within 30 days and in the event of a dispute, making payments within 30 days from the date of resolution.
The Health Service's maximum exposure to liquidity risk is the carrying amounts of financial liabilities as disclosed in the face of the balance sheet. The Health Service manages its liquidity risk as follows:
- Term Deposits and cash held at financial institutions are managed with variable maturity dates and take into consideration cash flow requirements of the Health Service from month to month.
The following table discloses the contractual maturity analysis for Stawell Regional Health financial liabilities. For interest rates applicable to each class of liability refer to individual notes to the financial statements.
Maturity analysis of financial liabilities as at 30 JuneConsol'dCarrying Nominal Less than 1 - 3 3 Months 1 - 5Amount Amount 1 Month Months - 1 Year Years
2015 $'000 $'000 $'000 $'000 $'000 $'000Financial LiabilitiesAt amortised costPayables 1,006 1,006 1,006 - - - Other Financial Liabilities (i) 105 105 105 - - -
Total Financial Liabilities 1,111 1,111 1,111 - - -
2014Financial LiabilitiesAt amortised costPayables 1,069 1,069 1,069 - - - Other Financial Liabilities (i) 355 355 355 - - -
Total Financial Liabilities 1,424 1,424 1,424 - - -
(i) Ageing analysis of financial liabilities excludes statutory financial liabilities (i.e. GST input tax credit)
Past Due But Not Impaired
Maturity Dates
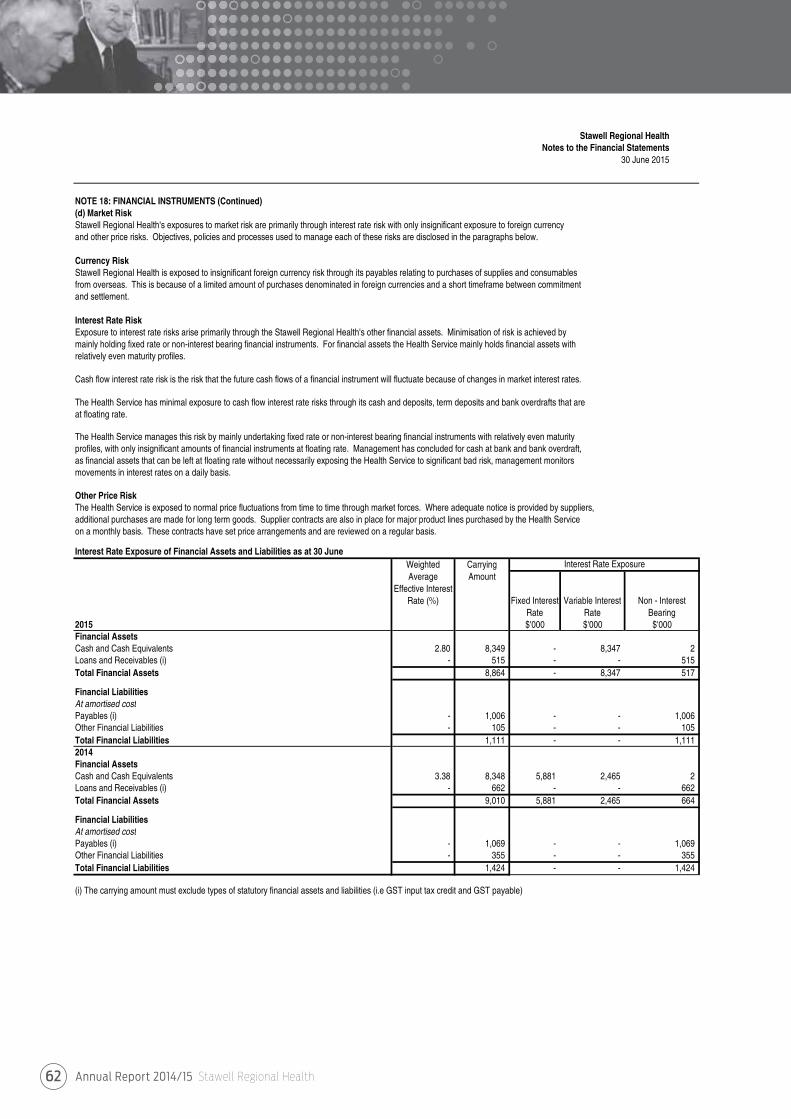
Annual Report 2014/15 Stawell Regional Health62
Stawell Regional HealthNotes to the Financial Statements
30 June 2015
NOTE 18: FINANCIAL INSTRUMENTS (Continued)(d) Market RiskStawell Regional Health's exposures to market risk are primarily through interest rate risk with only insignificant exposure to foreign currency and other price risks. Objectives, policies and processes used to manage each of these risks are disclosed in the paragraphs below.
Currency RiskStawell Regional Health is exposed to insignificant foreign currency risk through its payables relating to purchases of supplies and consumables from overseas. This is because of a limited amount of purchases denominated in foreign currencies and a short timeframe between commitment and settlement.
Interest Rate RiskExposure to interest rate risks arise primarily through the Stawell Regional Health's other financial assets. Minimisation of risk is achieved by mainly holding fixed rate or non-interest bearing financial instruments. For financial assets the Health Service mainly holds financial assets with relatively even maturity profiles.
Cash flow interest rate risk is the risk that the future cash flows of a financial instrument will fluctuate because of changes in market interest rates.
The Health Service has minimal exposure to cash flow interest rate risks through its cash and deposits, term deposits and bank overdrafts that areat floating rate.
The Health Service manages this risk by mainly undertaking fixed rate or non-interest bearing financial instruments with relatively even maturityprofiles, with only insignificant amounts of financial instruments at floating rate. Management has concluded for cash at bank and bank overdraft,as financial assets that can be left at floating rate without necessarily exposing the Health Service to significant bad risk, management monitorsmovements in interest rates on a daily basis.
Other Price RiskThe Health Service is exposed to normal price fluctuations from time to time through market forces. Where adequate notice is provided by suppliers, additional purchases are made for long term goods. Supplier contracts are also in place for major product lines purchased by the Health Service on a monthly basis. These contracts have set price arrangements and are reviewed on a regular basis.
Interest Rate Exposure of Financial Assets and Liabilities as at 30 June
2015 $'000 $'000 $'000Financial AssetsCash and Cash Equivalents 2.80 8,349 - 8,347 2 Loans and Receivables (i) - 515 - - 515 Total Financial Assets 8,864 - 8,347 517
Financial LiabilitiesAt amortised costPayables (i) - 1,006 - - 1,006 Other Financial Liabilities - 105 - - 105 Total Financial Liabilities 1,111 - - 1,111 2014Financial AssetsCash and Cash Equivalents 3.38 8,348 5,881 2,465 2 Loans and Receivables (i) - 662 - - 662 Total Financial Assets 9,010 5,881 2,465 664
Financial LiabilitiesAt amortised costPayables (i) - 1,069 - - 1,069 Other Financial Liabilities - 355 - - 355 Total Financial Liabilities 1,424 - - 1,424
(i) The carrying amount must exclude types of statutory financial assets and liabilities (i.e GST input tax credit and GST payable)
Variable Interest Rate
Carrying Amount
Interest Rate ExposureWeighted Average
Effective Interest Rate (%) Fixed Interest
RateNon - Interest
Bearing
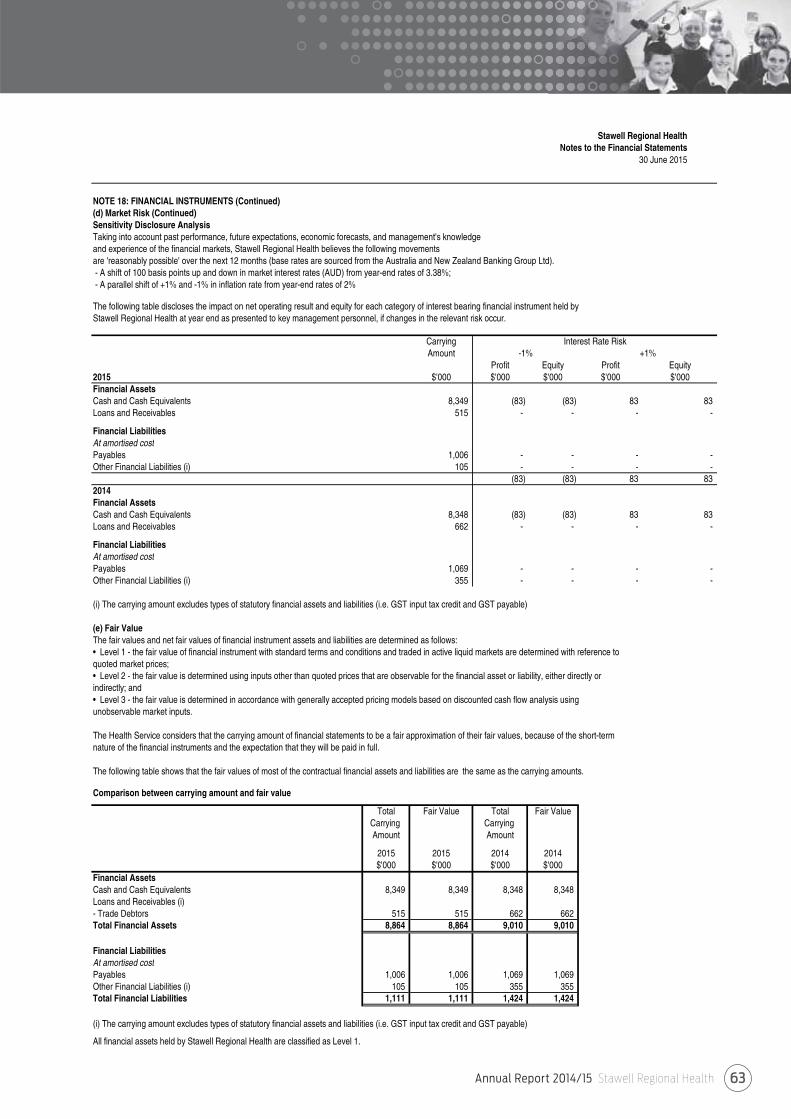
Annual Report 2014/15 Stawell Regional Health 63
Stawell Regional HealthNotes to the Financial Statements
30 June 2015
NOTE 18: FINANCIAL INSTRUMENTS (Continued)(d) Market Risk (Continued)Sensitivity Disclosure AnalysisTaking into account past performance, future expectations, economic forecasts, and management's knowledgeand experience of the financial markets, Stawell Regional Health believes the following movementsare 'reasonably possible' over the next 12 months (base rates are sourced from the Australia and New Zealand Banking Group Ltd).- A shift of 100 basis points up and down in market interest rates (AUD) from year-end rates of 3.38%;- A parallel shift of +1% and -1% in inflation rate from year-end rates of 2%
The following table discloses the impact on net operating result and equity for each category of interest bearing financial instrument held by Stawell Regional Health at year end as presented to key management personnel, if changes in the relevant risk occur.
CarryingAmount
Profit Equity Profit Equity2015 $'000 $'000 $'000 $'000 $'000Financial AssetsCash and Cash Equivalents 8,349 (83) (83) 83 83 Loans and Receivables 515 - - - -
Financial LiabilitiesAt amortised costPayables 1,006 - - - - Other Financial Liabilities (i) 105 - - - -
(83) (83) 83 83 2014Financial AssetsCash and Cash Equivalents 8,348 (83) (83) 83 83 Loans and Receivables 662 - - - -
Financial LiabilitiesAt amortised costPayables 1,069 - - - - Other Financial Liabilities (i) 355 - - - -
(i) The carrying amount excludes types of statutory financial assets and liabilities (i.e. GST input tax credit and GST payable)
(e) Fair ValueThe fair values and net fair values of financial instrument assets and liabilities are determined as follows:• Level 1 - the fair value of financial instrument with standard terms and conditions and traded in active liquid markets are determined with reference to quoted market prices;• Level 2 - the fair value is determined using inputs other than quoted prices that are observable for the financial asset or liability, either directly or indirectly; and• Level 3 - the fair value is determined in accordance with generally accepted pricing models based on discounted cash flow analysis using unobservable market inputs.
The Health Service considers that the carrying amount of financial statements to be a fair approximation of their fair values, because of the short-term nature of the financial instruments and the expectation that they will be paid in full.
The following table shows that the fair values of most of the contractual financial assets and liabilities are the same as the carrying amounts.
Comparison between carrying amount and fair value
Total Fair Value Total Fair ValueCarrying Carrying Amount Amount
2015 2015 2014 2014$'000 $'000 $'000 $'000
Financial AssetsCash and Cash Equivalents 8,349 8,349 8,348 8,348 Loans and Receivables (i)- Trade Debtors 515 515 662 662 Total Financial Assets 8,864 8,864 9,010 9,010
Financial LiabilitiesAt amortised costPayables 1,006 1,006 1,069 1,069 Other Financial Liabilities (i) 105 105 355 355 Total Financial Liabilities 1,111 1,111 1,424 1,424
(i) The carrying amount excludes types of statutory financial assets and liabilities (i.e. GST input tax credit and GST payable)
All financial assets held by Stawell Regional Health are classified as Level 1.
Interest Rate Risk-1% +1%
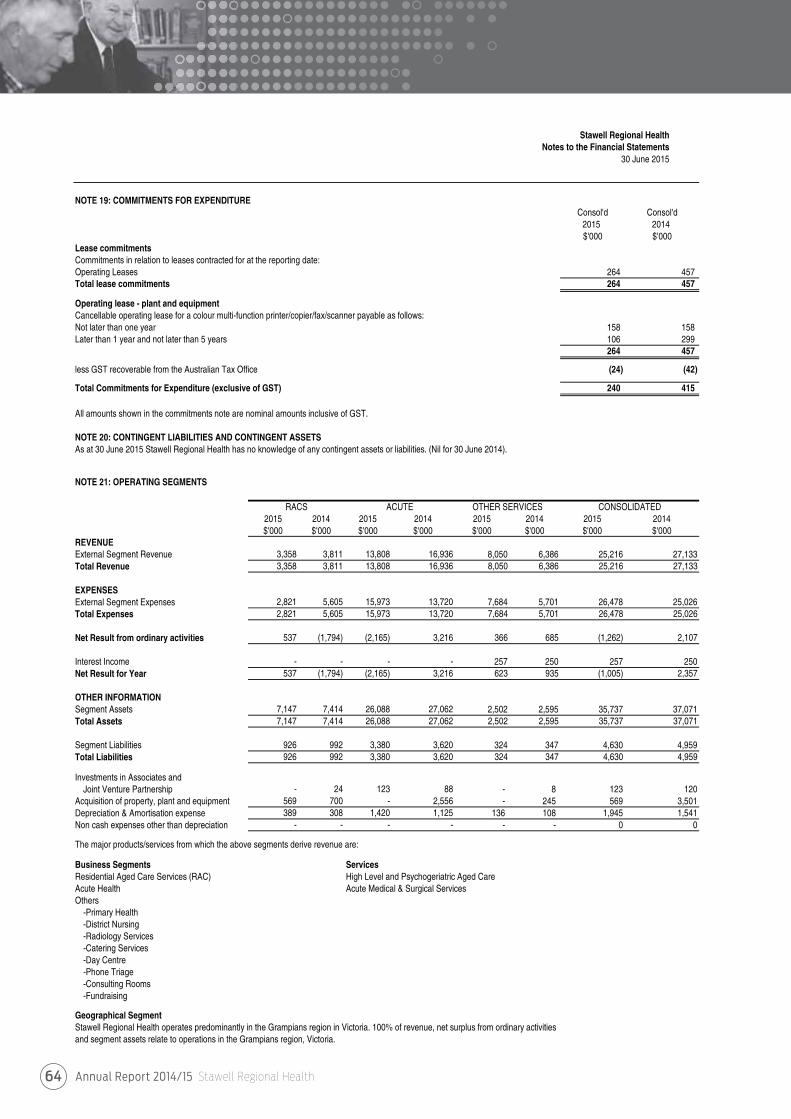
Annual Report 2014/15 Stawell Regional Health64
Stawell Regional HealthNotes to the Financial Statements
30 June 2015
NOTE 19: COMMITMENTS FOR EXPENDITUREConsol'd Consol'd
2015 2014$'000 $'000
Lease commitmentsCommitments in relation to leases contracted for at the reporting date:Operating Leases 264 457 Total lease commitments 264 457
Operating lease - plant and equipmentCancellable operating lease for a colour multi-function printer/copier/fax/scanner payable as follows: Not later than one year 158 158 Later than 1 year and not later than 5 years 106 299
264 457
less GST recoverable from the Australian Tax Office (24) (42)
Total Commitments for Expenditure (exclusive of GST) 240 415
All amounts shown in the commitments note are nominal amounts inclusive of GST.
NOTE 20: CONTINGENT LIABILITIES AND CONTINGENT ASSETSAs at 30 June 2015 Stawell Regional Health has no knowledge of any contingent assets or liabilities. (Nil for 30 June 2014).
NOTE 21: OPERATING SEGMENTS
RACS ACUTE OTHER SERVICES CONSOLIDATED2015 2014 2015 2014 2015 2014 2015 2014$'000 $'000 $'000 $'000 $'000 $'000 $'000 $'000
REVENUEExternal Segment Revenue 3,358 3,811 13,808 16,936 8,050 6,386 25,216 27,133Total Revenue 3,358 3,811 13,808 16,936 8,050 6,386 25,216 27,133
EXPENSESExternal Segment Expenses 2,821 5,605 15,973 13,720 7,684 5,701 26,478 25,026Total Expenses 2,821 5,605 15,973 13,720 7,684 5,701 26,478 25,026
Net Result from ordinary activities 537 (1,794) (2,165) 3,216 366 685 (1,262) 2,107
Interest Income - - - - 257 250 257 250Net Result for Year 537 (1,794) (2,165) 3,216 623 935 (1,005) 2,357
OTHER INFORMATIONSegment Assets 7,147 7,414 26,088 27,062 2,502 2,595 35,737 37,071Total Assets 7,147 7,414 26,088 27,062 2,502 2,595 35,737 37,071
Segment Liabilities 926 992 3,380 3,620 324 347 4,630 4,959Total Liabilities 926 992 3,380 3,620 324 347 4,630 4,959
Investments in Associates and Joint Venture Partnership - 24 123 88 - 8 123 120
Acquisition of property, plant and equipment 569 700 - 2,556 - 245 569 3,501Depreciation & Amortisation expense 389 308 1,420 1,125 136 108 1,945 1,541Non cash expenses other than depreciation - - - - - - 0 0
The major products/services from which the above segments derive revenue are:
Business Segments ServicesResidential Aged Care Services (RAC) High Level and Psychogeriatric Aged CareAcute Health Acute Medical & Surgical ServicesOthers
-Primary Health-District Nursing-Radiology Services-Catering Services-Day Centre-Phone Triage-Consulting Rooms-Fundraising
Geographical SegmentStawell Regional Health operates predominantly in the Grampians region in Victoria. 100% of revenue, net surplus from ordinary activities and segment assets relate to operations in the Grampians region, Victoria.
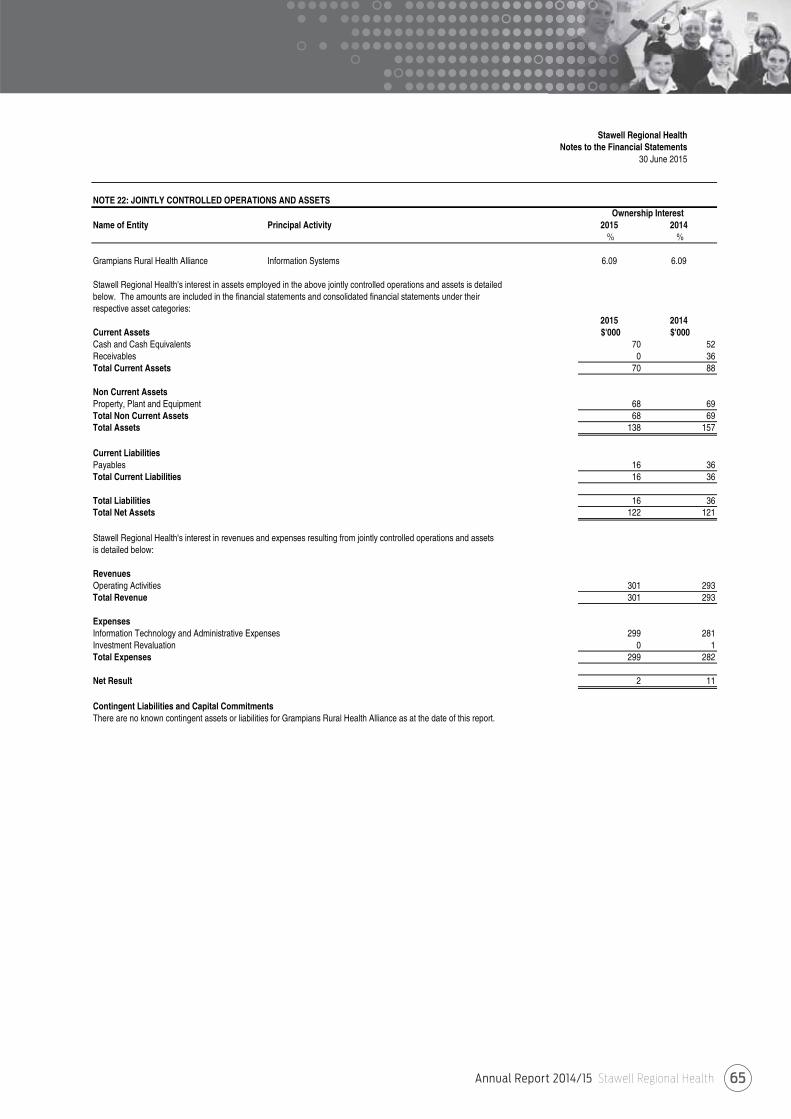
Annual Report 2014/15 Stawell Regional Health 65
Stawell Regional HealthNotes to the Financial Statements
30 June 2015
NOTE 22: JOINTLY CONTROLLED OPERATIONS AND ASSETS
Name of Entity Principal Activity 2015 2014% %
Grampians Rural Health Alliance Information Systems 6.09 6.09
Stawell Regional Health's interest in assets employed in the above jointly controlled operations and assets is detailedbelow. The amounts are included in the financial statements and consolidated financial statements under theirrespective asset categories:
2015 2014Current Assets $'000 $'000Cash and Cash Equivalents 70 52Receivables 0 36Total Current Assets 70 88
Non Current AssetsProperty, Plant and Equipment 68 69Total Non Current Assets 68 69Total Assets 138 157
Current LiabilitiesPayables 16 36Total Current Liabilities 16 36
Total Liabilities 16 36Total Net Assets 122 121
Stawell Regional Health's interest in revenues and expenses resulting from jointly controlled operations and assetsis detailed below:
RevenuesOperating Activities 301 293Total Revenue 301 293
ExpensesInformation Technology and Administrative Expenses 299 281Investment Revaluation 0 1Total Expenses 299 282
Net Result 2 11
Contingent Liabilities and Capital CommitmentsThere are no known contingent assets or liabilities for Grampians Rural Health Alliance as at the date of this report.
Ownership Interest
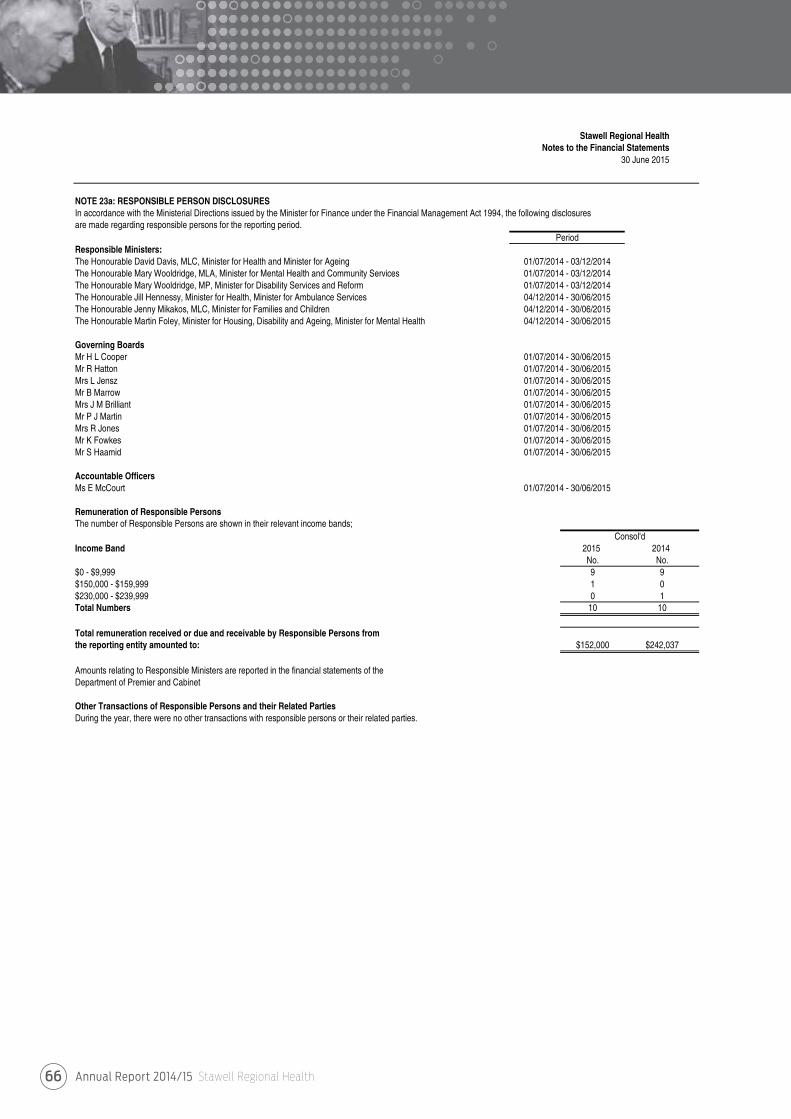
Annual Report 2014/15 Stawell Regional Health66
Stawell Regional HealthNotes to the Financial Statements
30 June 2015
NOTE 23a: RESPONSIBLE PERSON DISCLOSURESIn accordance with the Ministerial Directions issued by the Minister for Finance under the Financial Management Act 1994, the following disclosuresare made regarding responsible persons for the reporting period.
Responsible Ministers:The Honourable David Davis, MLC, Minister for Health and Minister for AgeingThe Honourable Mary Wooldridge, MLA, Minister for Mental Health and Community ServicesThe Honourable Mary Wooldridge, MP, Minister for Disability Services and ReformThe Honourable Jill Hennessy, Minister for Health, Minister for Ambulance ServicesThe Honourable Jenny Mikakos, MLC, Minister for Families and ChildrenThe Honourable Martin Foley, Minister for Housing, Disability and Ageing, Minister for Mental Health
Governing BoardsMr H L CooperMr R HattonMrs L JenszMr B MarrowMrs J M BrilliantMr P J MartinMrs R JonesMr K FowkesMr S Haamid
Accountable OfficersMs E McCourt
Remuneration of Responsible PersonsThe number of Responsible Persons are shown in their relevant income bands;
Income Band 2015 2014No. No.
$0 - $9,999 9 9$150,000 - $159,999 1 0$230,000 - $239,999 0 1Total Numbers 10 10
Total remuneration received or due and receivable by Responsible Persons fromthe reporting entity amounted to: $152,000 $242,037
Amounts relating to Responsible Ministers are reported in the financial statements of theDepartment of Premier and Cabinet
Other Transactions of Responsible Persons and their Related PartiesDuring the year, there were no other transactions with responsible persons or their related parties.
01/07/2014 - 03/12/201404/12/2014 - 30/06/2015
Period
01/07/2014 - 03/12/201401/07/2014 - 03/12/2014
04/12/2014 - 30/06/2015
01/07/2014 - 30/06/201501/07/2014 - 30/06/201501/07/2014 - 30/06/2015
01/07/2014 - 30/06/2015
01/07/2014 - 30/06/201501/07/2014 - 30/06/201501/07/2014 - 30/06/201501/07/2014 - 30/06/201501/07/2014 - 30/06/2015
Consol'd
01/07/2014 - 30/06/2015
04/12/2014 - 30/06/2015
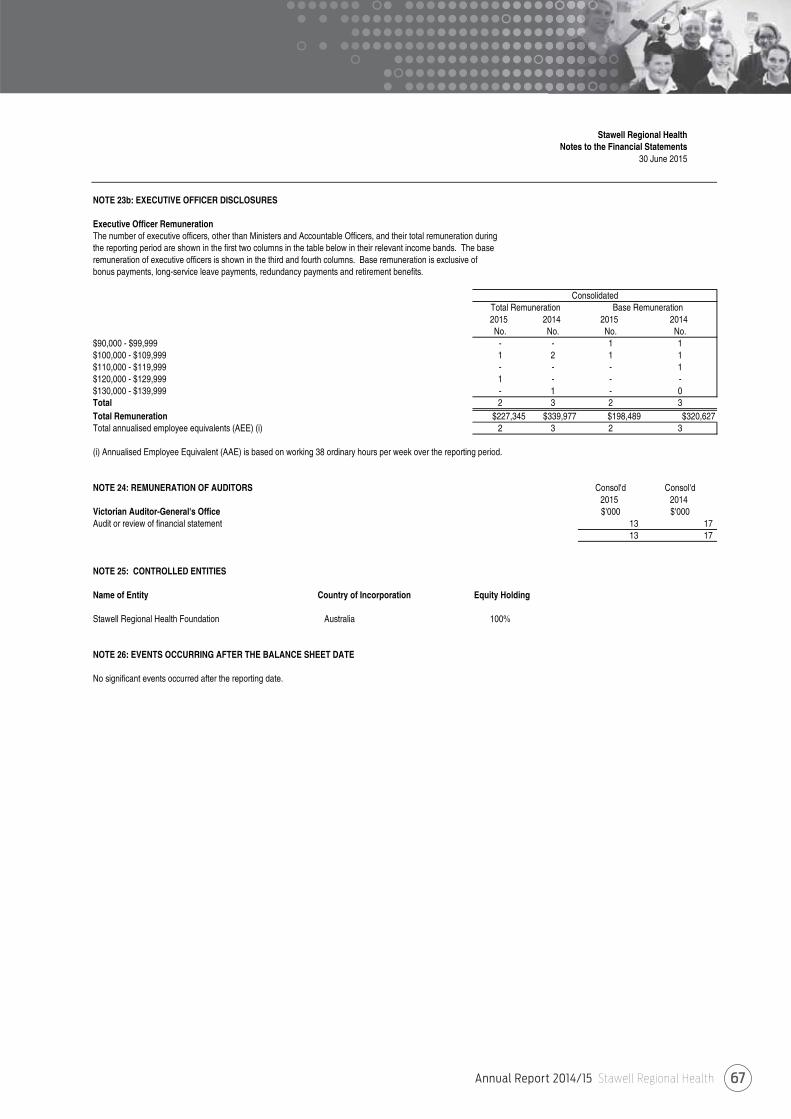
Annual Report 2014/15 Stawell Regional Health 67
Stawell Regional HealthNotes to the Financial Statements
30 June 2015
NOTE 23b: EXECUTIVE OFFICER DISCLOSURES
Executive Officer RemunerationThe number of executive officers, other than Ministers and Accountable Officers, and their total remuneration during the reporting period are shown in the first two columns in the table below in their relevant income bands. The base remuneration of executive officers is shown in the third and fourth columns. Base remuneration is exclusive ofbonus payments, long-service leave payments, redundancy payments and retirement benefits.
2015 2014 2015 2014No. No. No. No.
$90,000 - $99,999 - - 1 1$100,000 - $109,999 1 2 1 1$110,000 - $119,999 - - - 1$120,000 - $129,999 1 - - -$130,000 - $139,999 - 1 - 0Total 2 3 2 3Total Remuneration $227,345 $339,977 $198,489 $320,627Total annualised employee equivalents (AEE) (i) 2 3 2 3
(i) Annualised Employee Equivalent (AAE) is based on working 38 ordinary hours per week over the reporting period.
NOTE 24: REMUNERATION OF AUDITORS Consol'd Consol'd2015 2014
Victorian Auditor-General's Office $'000 $'000Audit or review of financial statement 13 17
13 17
NOTE 25: CONTROLLED ENTITIES
Name of Entity Country of Incorporation Equity Holding
Stawell Regional Health Foundation Australia 100%
NOTE 26: EVENTS OCCURRING AFTER THE BALANCE SHEET DATE
No significant events occurred after the reporting date.
ConsolidatedTotal Remuneration Base Remuneration
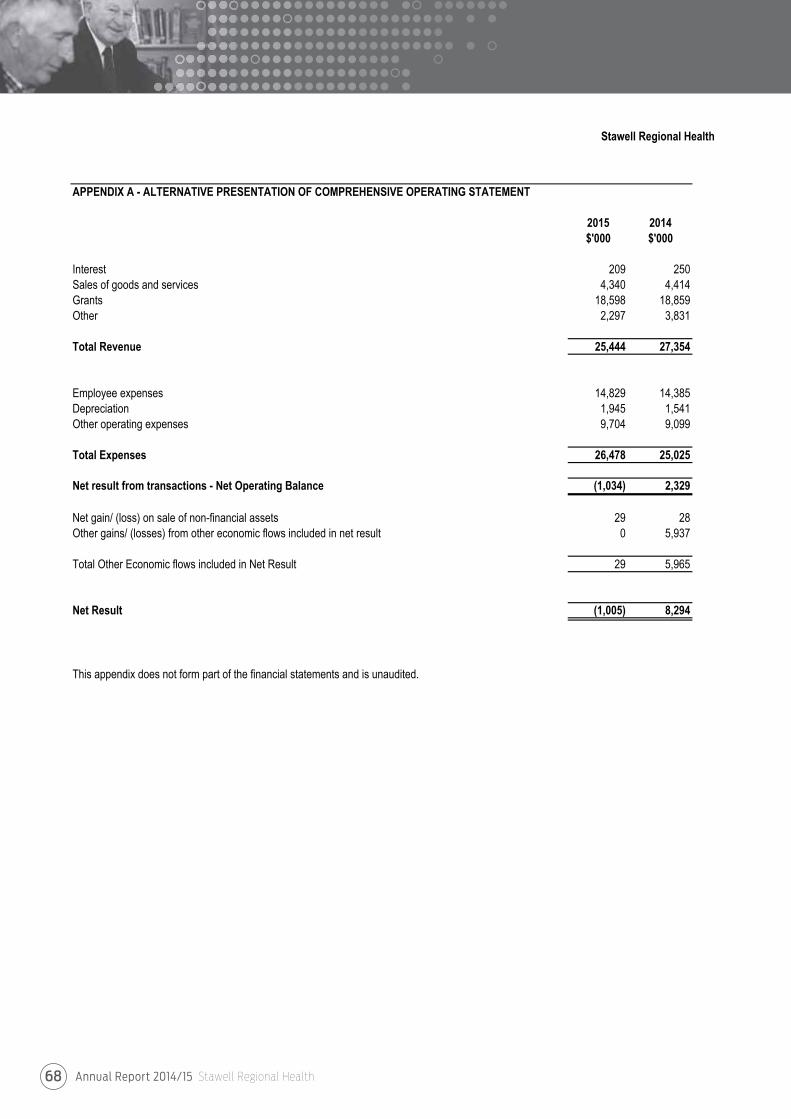
Annual Report 2014/15 Stawell Regional Health68

This page has been left intentionally blank
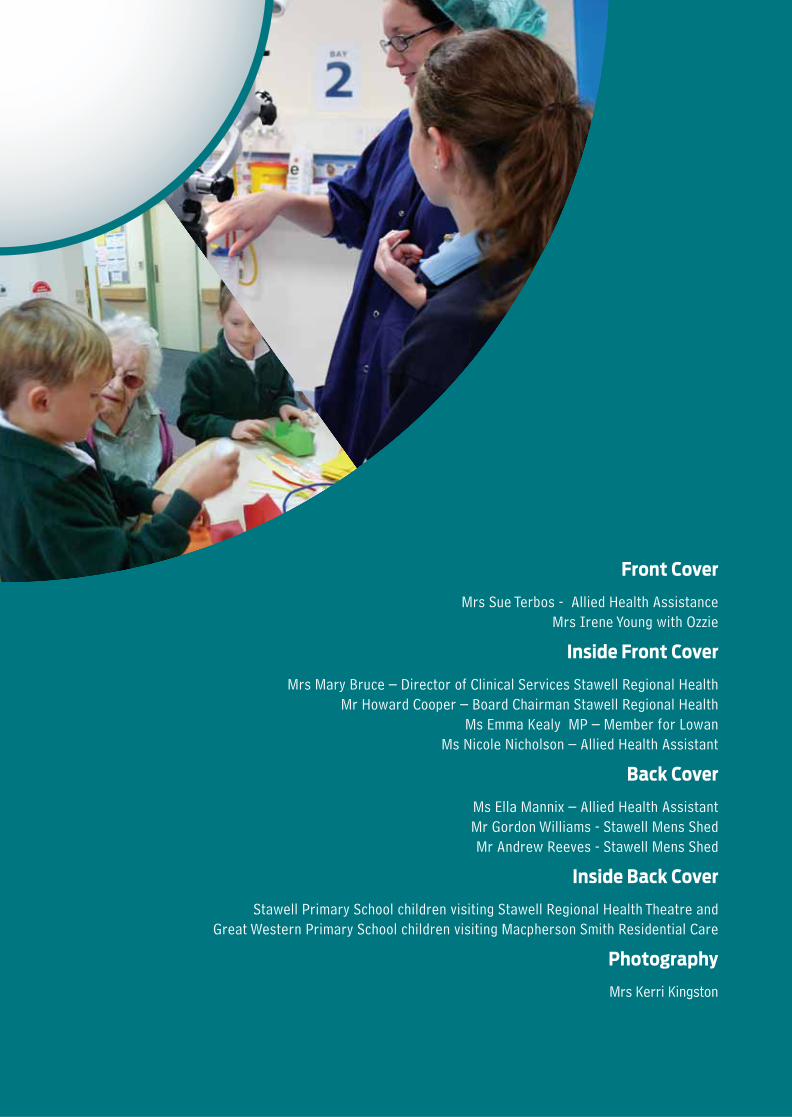
ORGANISATIONALVALUESTrust
We act openly and honestly as individuals
and as a team.
Respect
We treat each other with respect and courtesy and
value the opinions and contributions of others.
Accountability
We each take personal responsibility
for our decisions and actions.
Communication
We encourage the sharing of information within
our team and with the community.
Safety
We are committed to the safety of our
workforce and our customers.
Front Cover
Mrs Sue Terbos - Allied Health Assistance
Mrs Irene Young with Ozzie
Inside Front Cover
Mrs Mary Bruce – Director of Clinical Services Stawell Regional Health
Mr Howard Cooper – Board Chairman Stawell Regional Health
Ms Emma Kealy MP – Member for Lowan
Ms Nicole Nicholson – Allied Health Assistant
Back Cover
Ms Ella Mannix – Allied Health Assistant
Mr Gordon Williams - Stawell Mens Shed
Mr Andrew Reeves - Stawell Mens Shed
Inside Back Cover
Stawell Primary School children visiting Stawell Regional Health Theatre and
Great Western Primary School children visiting Macpherson Smith Residential Care
Photography
Mrs Kerri Kingston

ANNUAL REPORT2014/15
Stawell VIC 3380 | (03) 5358 8500 | www.srh.org.au
ST
AW
EL
L R
EG
ION
AL
HE
ALT
H A
NN
UA
L R
EP
OR
T 2
014
-15
Caring for our Community


![ee awe 3380 T a smc.manager@srh.org€¦ · Stawell Medical Centres Values and Mission align with those of Stawell Regional Health; ^ Á ooZ P]}vo, o ZD] ]}v In partnership with our](https://img.pdfslide.us/doc/110x75/6062f7fe9135270c3348247a/ee-awe-3380-t-a-smcmanagersrhorg-stawell-medical-centres-values-and-mission-align.jpg)