Embed Size (px)
Citation preview

arX
iv:a
stro
-ph/
0404
495v
1 2
6 A
pr 2
004
Mon. Not. R. Astron. Soc. 000, 1–?? (2002) Printed 2 December 2018 (MN LATEX style file v2.2)
Carina’s Defiant Finger: HST Observations of a
Photoevaporating Globule in NGC 3372⋆
Nathan Smith1†‡, Rodolfo H. Barba2, and Nolan R. Walborn31Center for Astrophysics and Space Astronomy, University of Colorado, 389 UCB, Boulder, CO 80309, USA2Departmento de Fisica, Universidad de La Serena, Benavente 980, La Serena, Chile3Space Telescope Science Institute, 3700 San Martin Drive, Baltimore, MD 21218, USA
Accepted 0000, Received 0000, in original form 0000
ABSTRACT
We present Hubble Space Telescope Wide Field Planetary Camera 2 images of aprominent externally-ionized molecular globule in the Carina Nebula (NGC 3372),supplemented with ground-based infrared images and visual-wavelength spectra. Thismolecular globule has a shape resembling a human hand, with an extended fingerthat points toward its likely source of ionizing radiation. Following an analysis ofthe spatially-resolved ionization structure and spectrum of the photoevaporative flowfrom the Finger, we conclude that the dominant ionizing source is either the WNLstar WR25 (HD 93162), the adjacent O4 If-type star Tr16-244, or perhaps both. Weestimate a mass-loss rate of ∼2×10⁻⁵ M⊙ yr−1 from the main evaporating surface ofthe globule, suggesting a remaining lifetime of 105.3 to 106 years. We find a total massfor the entire globule of more than 6 M⊙, in agreement with previous estimates. Thehydrogen column density through the globule derived from extinction measurementsis a few times 1022 cm−2, so the photodissociation region behind the ionization frontshould be limited to a thin layer compared to the size of the globule, in agreement withthe morphology seen in H2 images. Although a few reddened stars are seen within theboundary of the globule in near-infrared continuum images, these may be backgroundstars. We do not detect a reddened star at the apex of the finger, for example, downto a limiting magnitude of mK ≃17. However, considering the physical properties ofthe globule and the advancing ionization front, it appears that future star formationis likely in the Finger globule, induced by radiation-driven implosion.
Key words: H ii regions — ISM: globules — ISM: individual (NGC 3372) — stars:formation
1 INTRODUCTION
Compact bright-rimmed molecular globules are common inevolved massive star forming regions, and are among thelast vestiges of the molecular cloud that gave birth to theOB stars powering the H ii region (e.g., Bok & Reilly 1947).These globules are externally illuminated and are photoe-vaporated and photoionized by UV radiation. They typi-
⋆ Based in part on observations made with the NASA/ESA Hub-
ble Space Telescope, obtained at the Space Telescope Science In-stitute, which is operated by the Association of Universities forResearch in Astronomy, Inc., under NASA contract NAS5-26555.† Hubble Fellow; [email protected]‡ Visiting Astronomer, Cerro Tololo Inter-American Observatory,National Optical Astronomy Observatory, operated by the As-sociation of Universities for Research in Astronomy, Inc., undercooperative agreement with the National Science Foundation.
cally range in size from 0.1 to 1 pc, and appear strikingin [S ii] λλ6717,6731 and Hα emission arising in the limb-brightened surfaces of their thin ionization fronts. Famousexamples of this class of objects are Thackeray’s globulesin IC 2944 (Thackeray 1950; Reipurth et al. 2003), as wellas similar features in the Rosette Nebula (Herbig 1974), theGum Nebula (Hawarden & Brand 1976; Reipurth 1983), andthe Carina Nebula (Walborn 1975; Cox & Bronfman 1995).
Material evaporated from these clumps partly fills theinterior of an H ii region and may help stall the advanceof the main ionization front by absorbing incident Lymancontinuum radiation and converting it to a recombinationfront, but perhaps the most pertinent role played by theseglobules is that they are potential sites of continued starformation. Some globules show clear evidence for embed-ded star formation, while others do not (Reipurth 1983;Reipurth et al. 2003). If they are sites of star formation, one
c© 2002 RAS

2 N. Smith et al.
Figure 1. Large-scale image of the environment around the Finger, including the Keyhole and the background Carina nebula, η Car,WR25, and other stars. The [S ii] image shown here was obtained with the MOSAIC camera on the CTIO 4m telescope. The inset showsan enlargement of the Finger in the Hα filter, along with the orientation of the slit apertures used for spectra in Figure 5.
possibility is that they are simply dense cores that spon-taneously collapsed to form stars and were then uncoveredby the advancing ionization front. Another more intriguingidea is that pressure from the ionization-shock front at thesurface propagates through a globule and helps to overcomethe magnetic, turbulent, and thermal pressure that supportsit against collapse, thereby inducing a star to form in theglobule. This process of radiation-driven implosion is oftenreferred to as triggered star formation. However, direct andunambiguous observational evidence for actively triggeredstar formation remains elusive; the pillars in M16 may be anexample of this phenomenon (White et al. 1999; Hester et al.1996; Williams et al. 2001; McCaughrean & Andersen 2002).Numerous investigators have examined theoretical aspects ofthese evaporating globules, including details of the photoe-vaporative flows, their effect on the surrounding H ii region,the globule’s shaping, destruction, and acceleration (throughthe “rocket effect”), and the possibility of triggered collapseand star formation due to the pressure of the impinging ion-ization front (Oort & Spitzer 1955, Kahn 1969; Dyson 1973;Dyson et al. 1995; Elmegreen 1976; Bertoldi 1989; Bertoldi
& McKee 1990; Bertoldi & Draine 1996; Lizano et al. 1996;Gorti & Hollenbach 2002; Williams 1999; Williams et al.2001). The evolution of these globules depends strongly onthe incident UV radiation field, the initial size and densityof the globule, and other properties, so observations of themin a wide variety of different environments are useful.
A rich population of these globules resides in the Ca-rina Nebula (NGC 3372; d=2.3 kpc), with the most no-table grouping clustered around the famous Keyhole Nebula.Their emission from ionized, photodissociated, and molec-ular gas has been documented by several studies (Walborn1975; Deharveng & Maucherat 1975; Cox & Bronfman 1995;Brooks et al. 2000; Smith 2002; Rathborne et al. 2002).There are a dozen of these clumps around the Keyhole, withtypical masses of order 10 M⊙ (Cox & Bronfman 1995). Afew of these are seen only in silhouette, but most have brightH2 and polycyclic aromatic hydrocarbon (PAH) emissionfrom their illuminated surfaces (Brooks et al. 2000; Rath-borne et al. 2002). In addition, several dozen smaller fea-tures with diameters of only ∼5000 AU were recently dis-covered by Smith et al. (2003a), and additional proplyd can-
c© 2002 RAS, MNRAS 000, 1–??

Carina’s Defiant Finger 3
Table 1. Observations of the Finger
Telescope Instrument Filter or Exp. Time CommentEmiss. Lines (sec)
HST WFPC2 F502N, [O iii] λ5007 320 imageHST WFPC2 F656N, Hα, [N ii] 400 imageHST WFPC2 F673N, [S ii] λλ6717,6731 800 imageCTIO 4m OSIRIS J 120 image
CTIO 4m OSIRIS H 120 imageCTIO 4m OSIRIS K 120 imageCTIO 4m OSIRIS He i λ10830 720 imageCTIO 4m OSIRIS Pa β 720 imageCTIO 4m OSIRIS H2 1-0 S(1) 2.122 µm 1080 imageCTIO 1.5m RC Spec blue; 3600-7100 A 1200 long-slit, P.A.=69◦
CTIO 1.5m RC Spec red; 6250-9700 A 1200 long-slit, P.A.=69◦
didates are seen in our images (see below, and Barba et al. inprep.). They may be either large photoevaporating circum-stellar disks (proplyds) or very small cometary clouds thatare remnants of larger globules in more advanced stages ofphotoevaporation (e.g., Bertoldi & McKee 1990). It is notyet known if these smaller proplyd candidates or the largerglobules in Carina contain embedded protostars or collaps-ing cores that may someday form stars. However, one largeglobule in the southern part of the nebula has recently beenshown to harbor a Class i protostar that drives the HH 666jet (Smith et al. 2004). In any case, these globules presenta rare opportunity to study their associated phenomena inan environment powered by some of the hottest and mostmassive stars in the Galaxy (Walborn 1995; Walborn et al.2002), while still being located near to us and suffering littleinterstellar extinction.
In this paper we untertake a detailed analysis of oneparticularly striking bright-rimmed globule in the CarinaNebula (see Figure 1) that we call the “Finger” because of itsgesticulatory morphology (it has previously been identifiedas clump 4; Cox & Bronfman 1995). The defiant finger seemsto point toward its dominant UV source, and as such, allowsfor an interesting application of models of photoevaporatingglobules mentioned above. In §2 we discuss our observations,and in §3 and §4 we briefly discuss the results of our imagingand spectroscopy. In §5 we undertake a detailed analysis ofthe photoevaporative flow, and in §6 we discuss implicationsfor potential star formation in the globule.
2 OBSERVATIONS AND DATA REDUCTION
2.1 HST/WFPC2 Images
Images of the Keyhole Nebula were obtained on 1999 April18 with the Wide Field Planetary Camera 2 (WFPC2) in-strument onboard the Hubble Space Telescope (HST). Fourdifferent pointings were observed and combined to form alarge mosaic image, which has been released by the Hub-ble Heritage Team1. Here we focus on only a small por-tion of the total area observed, containing the globule thatwe call the Finger. Images were obtained through narrow-band filters F502N ([O iii] λ5007), F656N (Hα), and F673N
1 See http://oposite.stsci.edu/pubinfo/pr/2000/06/ .
([S ii] λλ6717,6731), as well as the broadband filters F469W,F555W, and F814W. Only the emission-line images will bediscussed here, however. Pairs of images in each narrow-band filter were combined and processed in the usual wayto remove cosmic rays and hot pixels, and to correct for ge-ometric distortion, as described in the HST Data Handbook(however, the images were not CTE corrected). Finally, theindividual frames were combined to form a single mosaicimage with a pixel scale of 0.′′0995. Subsections of the im-ages showing the region around the Finger are displayed inFigure 2, oriented with north up and east to the left.
2.2 Near-Infrared Images
Near-infrared (IR) images of the Finger and its immediateenvironment were obtained on 2003 February 25 with theOhio State IR Imaging Spectrometer (OSIRIS) mounted onthe CTIO 4m telescope. OSIRIS has a 1024×1024 NICMOS3array, with a pixel scale of 0.′′161. Only a portion of the arrayis illuminated in this configuration, yielding a field of viewof ∼1.′5. We obtained images in the broadband J , H , and Kfilters, as well as narrowband filters isolating He i λ10830,Paβ λ12818, and H2 1-0 S(1) λ21218. In each filter, severalindividual exposures were taken with small offsets betweenthem to correct for bad pixels on the array. The seeing dur-ing the observations was ∼0.′′8. There is no position on thesky near the Finger that is suitable for measuring the back-ground sky because of bright emission from the H ii regionand nearby star clusters, so for sky subtraction we noddedthe telescope to a position roughly 2◦ south. Flux calibra-tion was accomplished by measuring isolated stars from the2MASS catalog that were included in our field of view, andis valid to within about ±10%. The IR images were alignedwith the WFPC2 images and are shown in Figure 3.
2.3 Optical Spectroscopy
Low-resolution (R ∼ 700−1600) spectra from 3600 to 9700A were obtained on 2002 March 1 and 2 using the RC Spec-trograph on the CTIO 1.5-m telescope. Long-slit spectra ofthe Finger were obtained with the 1.′′5-wide slit aperture ori-ented at P.A.≈69◦ crossing through the middle of the globuleas shown in Figure 1. The pixel scale in the spatial directionwas 1.′′3. Spectra were obtained on two separate nights in
c© 2002 RAS, MNRAS 000, 1–??

4 N. Smith et al.
Figure 2. HST/WFPC2 images of the Finger. (a) F502N filter transmitting [O iii] λ5007; grayscale range from 2.4×10⁻¹⁴ (white)to 1.9×10⁻¹³ (black) ergs s−1 cm−2 arcsec−2. (b) F656N filter transmitting Hα; grayscale range from 5.4×10⁻¹⁴ (white) to 3×10⁻¹³
(black) ergs s−1 cm−2 arcsec−2. (c) F673N filter transmitting [S ii] λλ6717,6731; grayscale range from 4.2×10⁻¹⁵ (white) to 3.3×10⁻¹⁴
(black) ergs s−1 cm−2 arcsec−2. These observed flux levels were not corrected for reddening and extinction. The axes display offset inarcsec from an arbitrary central position in the globule.
two different wavelength ranges (blue, 3600-7100 A; and red,6250-9700 A), with total exposure times and other detailslisted in Table 1. Sky conditions were mostly photometric,although a few thin transient clouds were present when theblue spectrum was obtained. Flux calibration and telluricabsorption correction were accomplished using the standardstars LTT-3218 and LTT-2415.
From the resulting long-slit spectra, we extracted sev-eral one-dimensional (1-D) segments of the slit that sam-pled emission from the thin ionization front (IF), the ion-ized boundary layer (IBL), the total emission from the IFand IBL (TOT), and a nearby sample of the emission fromthe background Carina Nebula H ii region. The sizes of thesesubapertures are identified in Figures 1 and 5. The blue andred wavelength ranges of these extracted 1-D spectra weremerged to form a single 3600-9700 A spectrum for each po-sition, with a common dispersion of 2 A pixel−1; the averageof the two was taken in the region of the spectrum near Hαwhere the blue and red spectra overlapped (in the overlap re-gion, bright line fluxes agreed to within about ±5%, compa-rable to the assumed uncertainty). Finally, the backgroundH ii region spectrum was subtracted from the IF, IBL, andTOT spectra. The final flux-calibrated spectra are shown
in Figure 5. Observed intensities are listed in Table 2, rela-tive to Hβ=100. Uncertainties in these line intensities varydepending on the strength of the line and the measurementmethod. The integrated fluxes of isolated emission lines weremeasured; for these, brighter lines with I >10 typically havemeasurement errors of a few percent, and weaker lines mayhave uncertainties of ±10 to 15%. The uncertainties increasesomewhat at the blue edge of the spectrum. Blended pairs orgroups of lines were measured by fitting Gaussian profiles.For brighter blended lines like Hα+[N ii] and [S ii], the mea-surement uncertainty is typically 5 to 10%. Obviously, errorswill be on the high end for faint lines adjacent to bright lines,and errors will be on the low end for the brightest lines in apair or group, or lines in a pair with comparable intensity.
3 IMAGING RESULTS
Figures 2, 3, and 4 show imaging data concentrated on asmall region (less than 1 square arcminute) featuring theevaporating molecular globule that is the focus of this pa-per. Images showing the Keyhole Nebula and its environ-ment on a much larger spatial scale but with lower spatial
c© 2002 RAS, MNRAS 000, 1–??
Carina’s Defiant Finger 5
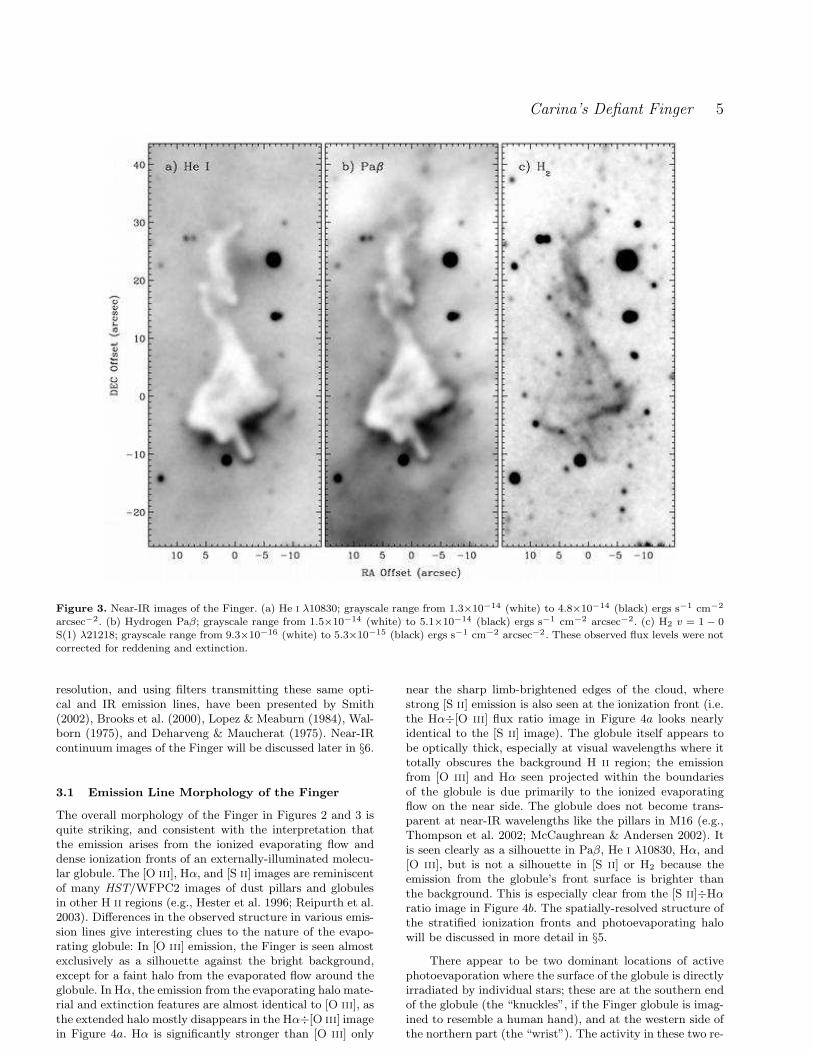
Figure 3. Near-IR images of the Finger. (a) He i λ10830; grayscale range from 1.3×10⁻¹⁴ (white) to 4.8×10⁻¹⁴ (black) ergs s−1 cm−2
arcsec−2. (b) Hydrogen Paβ; grayscale range from 1.5×10⁻¹⁴ (white) to 5.1×10⁻¹⁴ (black) ergs s−1 cm−2 arcsec−2. (c) H2 v = 1 − 0S(1) λ21218; grayscale range from 9.3×10⁻¹⁶ (white) to 5.3×10⁻¹⁵ (black) ergs s−1 cm−2 arcsec−2. These observed flux levels were notcorrected for reddening and extinction.
resolution, and using filters transmitting these same opti-cal and IR emission lines, have been presented by Smith(2002), Brooks et al. (2000), Lopez & Meaburn (1984), Wal-born (1975), and Deharveng & Maucherat (1975). Near-IRcontinuum images of the Finger will be discussed later in §6.
3.1 Emission Line Morphology of the Finger
The overall morphology of the Finger in Figures 2 and 3 isquite striking, and consistent with the interpretation thatthe emission arises from the ionized evaporating flow anddense ionization fronts of an externally-illuminated molecu-lar globule. The [O iii], Hα, and [S ii] images are reminiscentof many HST/WFPC2 images of dust pillars and globulesin other H ii regions (e.g., Hester et al. 1996; Reipurth et al.2003). Differences in the observed structure in various emis-sion lines give interesting clues to the nature of the evapo-rating globule: In [O iii] emission, the Finger is seen almostexclusively as a silhouette against the bright background,except for a faint halo from the evaporated flow around theglobule. In Hα, the emission from the evaporating halo mate-rial and extinction features are almost identical to [O iii], asthe extended halo mostly disappears in the Hα÷[O iii] imagein Figure 4a. Hα is significantly stronger than [O iii] only
near the sharp limb-brightened edges of the cloud, wherestrong [S ii] emission is also seen at the ionization front (i.e.the Hα÷[O iii] flux ratio image in Figure 4a looks nearlyidentical to the [S ii] image). The globule itself appears tobe optically thick, especially at visual wavelengths where ittotally obscures the background H ii region; the emissionfrom [O iii] and Hα seen projected within the boundariesof the globule is due primarily to the ionized evaporatingflow on the near side. The globule does not become trans-parent at near-IR wavelengths like the pillars in M16 (e.g.,Thompson et al. 2002; McCaughrean & Andersen 2002). Itis seen clearly as a silhouette in Paβ, He i λ10830, Hα, and[O iii], but is not a silhouette in [S ii] or H2 because theemission from the globule’s front surface is brighter thanthe background. This is especially clear from the [S ii]÷Hαratio image in Figure 4b. The spatially-resolved structure ofthe stratified ionization fronts and photoevaporating halowill be discussed in more detail in §5.
There appear to be two dominant locations of activephotoevaporation where the surface of the globule is directlyirradiated by individual stars; these are at the southern endof the globule (the “knuckles”, if the Finger globule is imag-ined to resemble a human hand), and at the western side ofthe northern part (the “wrist”). The activity in these two re-
c© 2002 RAS, MNRAS 000, 1–??

6 N. Smith et al.
Figure 4. Selected flux-ratio images of the Finger. (a) Hα÷[O iii] (F656N÷F502N) with the grayscale range from 1 (white) to 2.3(black). (b) [S ii]÷Hα (F673N÷F656N) with the grayscale range from 0.033 to 0.13. (c) The ground-based Paβ image divided by asmoothed HST/WFPC2 Hα image, with the grayscale range from 0.07 to 0.12. Note that the F656N Hα image is partially contaminatedby adjacent [N ii] lines, which affects the value of the flux ratios listed here. These flux ratios have been corrected for reddening andextinction, using E(B − V )=0.37 and R=4.8 (see text).
gions is highlighted best by emission from He i λ10830 (Fig-ure 3a) and H2 (Figure 3c). The He i line has a metastablelower level and is enhanced by collisions in dense ionized gas,such as that found in a dense ionized photoevaporative flow.H2 emission will be brightest in the photodissociation region(PDR) immediately behind the strongest ionization fronts,where a strong flux of FUV (Balmer continuum) photonspenetrates, or where the gas is heated by a shock or Lyαfrom the ionization front itself. Both He i and H2 are mostprominent in the two regions mentioned above: the “knuck-les” and the “wrist”. Relatively weak limb-brightened [S ii]emission is seen around the periphery of the globule, prob-ably caused by the ambient UV field and Lyα radiation.
The most obvious photoevaporating flow on the south-ern edge of the globule exhibits a thin straight finger pro-truding normal to a bright edge-on ionization front. Thisthin finger appears to identify its source of irradiation: Itpoints toward P.A.=208◦, close to the massive star WR25(HD 93162) at P.A.=219◦ relative to the Finger, althoughother early-type stars are seen along the same apparent tra-jectory. The ionizing source is addressed quantitatively in§5.2. Extending toward the south from this main ionizationfront is a large-scale ionized flow, prominent in [O iii], Hα,
and Paβ, where it fills the lower left corner in Figures 2a, 2b,and 3b. About 6′′ from the end of the finger, one can see anarc-shaped structure in these same emission lines; the den-sity here might be enhanced in a shock as the ram pressureof the photoevaporating flow off the globule balances thepressure of the ambient ionized gas in the H ii region. Fromconservation of momentum, this should occur at a distancefrom the globule’s center given roughly by rif (nif/nHII
)0.5,where nif and nHII
are the electron densities at the ioniza-tion front and in the H ii region, respectively, and rif is theradius of curvature of the ionization front. Electron densitiesare estimated below (Table 3), and the resulting distance isin reasonable agreement with the location of the shock.
Both of the main evaporating surfaces of the globuleare found at relatively flat interfaces (a large effective ra-dius of curvature). This may be an important factor in theirenhanced emission, as the radial density profile will fall offmore rapidly in a spherically divergent flow than from aplanar ionzation front. The northern evaporative flow (the“wrist”) is particularly interesting, as it may be caused by avery nearby star – the bright B star located only 10′′ to the
c© 2002 RAS, MNRAS 000, 1–??

Carina’s Defiant Finger 7
Figure 5. Spectra of gas associated with the Finger. The plotted quantity is the average specific intensity in the aperture size givenin each panel, and shown in Figure 1. (a) The spectrum of the ionization front (IF) on the side of the globule facing the main UV
source. (b) Same as Panel a but with a different intensity scale. (c) Spectrum of the ionized boundary layer (IBL, or “photoevaporativeflow”) associated with the main ionization front. (d) Spectrum of the total emission including both the ionization front and the ionizedboundary layer (note that the “total” emission shown here is not a simple average of the IF and IBL; the aperture used was slightlylarger than both the IF and IBL combined; see Figure 1). (e) Average spectrum of the background H ii region near the Finger.
west (Tr16-207; see Figure 1).2 The motivation for this con-jecture is that both the He i and H2 emission are localized,while most of the rest of the western side of the globule alsoappears relatively flat and normal to the same direction. Ifthe ionizing source were a luminous star at a large distance,we might expect to see a similar level of enhanced emis-sion all along the western side of the globule. A third regionof active photoevaporation may have a different UV sourcefrom the other two just mentioned; the southeast edge of theglobule shows enhanced emission in [S ii] and H2, most no-tably on the east side of the thin finger, while such emissionis not as strong on the west side of the same finger. The very
2 Additionally, we note that the northern part of the globuleappears to be curved with a radius of curvature of ∼10′′, andwith Tr16-207 located at the center of curvature.
luminous and massive evolved star η Carinae is located to-ward the southeast; η Car may have been a prodigious FUVsource in the recent past (more than 160 years ago) before itwas surrounded by its young circumstellar dust shell (Smithet al. 1998). The O4 V((f+)) star HDE 303308 is seen to-ward the east/southeast as well, and may add to the FUVflux striking the side of the Finger.
3.2 Proplyd Candidates?
The new HST/WFPC2 images also reveal a small group ofdistinct cometary clouds located immediately west of theFinger, the largest member of which has approximate di-mensions of 0.′′5×2′′ (about 1100×4500 AU). This objectclosely resembles the numerous “proplyd candidates” seenthroughout the Carina Nebula (Smith et al. 2003a). This ob-ject, which we denote 104430.2-593953 (following the nam-
c© 2002 RAS, MNRAS 000, 1–??

8 N. Smith et al.
Table 2. Observed and Dereddened Line Intensitiesa
λ(A) IF IF IBL IBL TOT TOT H ii H ii
and I.D. (Obs) (Dered.) (Obs) (Dered.) (Obs) (Dered.) (Obs) (Dered.)
3727 [O ii] 312 436 105 146 178 248 93.0 1303869 [Ne iii] 9.9 13.3 16.2 21.9 14.0 18.8 15.0 20.13889 H8+He i 19.1 25.5 22.2 29.7 21.7 29.0 20.2 27.13970 Hǫ+[Ne iii] 18.1 23.7 19.2 25.2 20.0 26.2 20.6 27.14026 He i 2.9 3.7 2.4 3.1 2.4 3.1 2.6 3.34073 [S ii] 3.9 5.0 ... ... 1.6 2.0 0.7 1.04102 Hδ 24.8 31.3 23.4 29.6 23.8 30.0 23.4 29.54340 Hγ 44.6 52.6 46.3 54.7 47.5 56.1 44.9 53.04363 [O iii] 0.8 0.9 1.3 1.6 0.8 0.9 4.9 5.74387 He i ... ... 0.9 1.1 0.8 0.9 0.5 0.64471 He i 4.1 4.7 4.3 4.9 4.5 5.1 4.9 5.64861 Hβ 100 100 100 100 100 100 100 1004922 He i 1.6 1.6 1.5 1.5 1.3 1.3 1.6 1.54959 [O iii] 51.7 50.1 83.8 81.2 77.1 74.7 99 96.15007 [O iii] 161 153 254 242 236 225 300 2865755 [N ii] 3.22 2.5 0.8 0.6 1.5 1.2 0.7 0.565876 He i 15.0 11.2 16.3 12.2 15.8 11.8 16.8 12.56300 [O i] 5.1 3.4 1.3 0.9 2.2 1.5 0.9 0.66312 [S iii] 2.5 1.7 1.4 0.9 1.6 1.1 1.4 1.06364 [O i] 1.8 1.2 0.6 0.4 0.8 0.5 0.3 0.26548 [N ii] 95.1 61.2 29.1 18.7 41.8 26.9 19.2 12.46563 Hα 339 217 439 281 383 246 442 2846583 [N ii] 280 179 68.3 43.7 114 73.0 37.5 24.06678 He i 3.4 2.1 6.2 3.9 5.4 3.4 6.3 3.96717 [S ii] 33.7 20.9 10.4 6.5 15.3 9.5 7.0 4.46731 [S ii] 47.7 29.6 11.4 7.1 19.2 11.9 5.9 3.67065 He i 4.6 2.7 4.7 2.7 4.1 2.4 5.0 2.97136 [Ar iii] 25.2 14.4 23.3 13.3 21.4 12.2 23.4 13.47237 [Ar iv] ... ... 1.2 0.7 ... ... 0.9 0.57281 He i ... ... 1.1 0.6 ... ... 1.3 0.77320 [O ii] 22.5 12.4 4.0 2.2 7.6 4.2 1.5 0.87330 [O ii] 20.4 11.2 3.1 1.7 6.7 3.6 1.3 0.77751 [Ar iii] 6.6 3.3 5.9 3.0 5.8 2.9 6.2 3.17774 O i ... ... 0.6 0.3 ... ... 0.6 0.38446 O i 3.9 1.7 ... ... ... ... 1.1 0.58750 Pa12 2.4 1.0 2.6 1.1 2.3 1.0 3.4 1.48863 Pa11 3.4 1.4 3.0 1.2 2.5 1.0 4.0 1.69015 Pa10 7.2 2.8 7.2 2.8 6.0 2.3 6.5 2.69069 [S iii] 68.1 26.6 66.3 25.9 59.4 23.2 86.9 34.09229 Pa9 6.9 2.6 7.2 2.7 5.8 2.2 7.6 2.99532 [S iii]+Pa8 219b 79.7b 215 78.5 145 52.8 300 1109711 [Fe ii] 16.1 5.7 13.2 4.7 12.4 4.4 9.3 3.3
a Observed line intensities were dereddened using the extinction law of Cardelli et al. (1989), with E(B − V )=0.37 and
RV = 4.8.b The intensity of [S iii] λ9532 was assumed to be 3×[S iii] λ9069 in the IF spectrum, since that line at that position partly
fell on a bad pixel on the detector.
ing convention of Smith et al. 2003a), is smaller than manyof the other cometary objects in Carina, but is still largerthan the proplyds seen in Orion and is apparently seen pri-marily in extinction and limb-brightened emission from Hαand [S ii]. The nature of these objects remains somewhatambiguous (are they analogues of Orion’s proplyds, starlesscometary clouds, or something in between?), but this imagehints that an HST imaging survey of Carina would uncovermany such objects that are missed in ground-based images.
4 SPECTROSCOPIC RESULTS
Figure 5 shows ground-based spectra extracted from thelong-slit data for sub-apertures identified in Figure 1. TheIF spectrum does not truly isolate emission from the thinionization front on the surface of the globule because theseground-based data lack the requisite spatial resolution. How-ever, emission in this sub-aperture is dominated by the limb-brightened emission from the IF; this is especially true forlow-ionization lines like [S ii], whereas much of the emissionin high-ionization lines like He i and [O iii] may originatein immediately adjacent regions. The IBL spectrum sam-ples the more extended photoevaporated flow, or the ion-
ized boundary layer that absorbs the hard UV photons in-
c© 2002 RAS, MNRAS 000, 1–??

Carina’s Defiant Finger 9
Figure 6. Observed reddening for hydrogen lines in the back-ground Carina Nebula H ii region near the Finger, relative to Hβ
(dots). The solid curve shows the reddening for E(B − V )=0.37or a logarithmic extinction at Hβ of c≃0.83 (assuming the ratioof total to selective extinction is RV =4.8).
cident upon the globule. The TOT spectrum includes boththe IF and the IBL, and is mainly useful for comparisonwith some diagnostic line ratios mentioned later. Finally,the background spectrum of the Carina Nebula is shownfor comparison; of course, this is a mixture of the high-ionization gas inside the H ii region with the ionization frontand photodissociation regions on the far side of the nebula.
The most notable aspect of the IF spectrum is itslow ionization, with strong [O ii] λλ3726,3729, [N ii]λλ6548,6583, and [S ii] λλ6717,6731 compared to Hα. Theselines are typically enhanced at the ionization front or just be-yond it if they are not collisionally de-excited; O has roughlythe same ionization potential as H, the ionization potentialof S is below 13.6 eV, and although the ionization poten-tial of N is 14.5 eV, it can be ionized from the excited 2Dstate by photons with energies as low as 12.1 eV. The IBLspectrum is intermediate in ionization and excitation be-tween the IF and the background H ii region, as expected.The IF and IBL spectra qualitatively resemble the low- andhigh-excitation spectra, respectively, of the similar photo-evaporating globule in the nearby open cluster NGC 3572(Smith et al. 2003b).
Table 2 lists observed and dereddened line intensitiesrelative to Hβ=100 for the various selected regions. Thereddening used to correct the observed line intensities wasdetermined by comparing observed strengths of hydrogenlines in the background H ii region to the Case B valuescalculated by Hummer & Storey (1987). As shown in Fig-ure 6, the observed Balmer and Paschen decrements sug-gest a value for E(B − V ) of roughly 0.37±0.03, using thereddening law of Cardelli, Clayton, & Mathis (1989) withRV = AV ÷ E(B − V ) ≈ 4.8, which is appropriate for lo-cal extinction from dust clouds around the Keyhole Nebula(Smith 1987; Smith 2002). The value of E(B − V )=0.37 wederive from nebular emission is close to the average value of0.47, and within the range of values of 0.25 to 0.64, as listed
Table 3. Parameters derived from Dereddened Line Intensities
Parameter units IF IBL Hii
ne [S ii] cm−3 2200±500 860±200 230±70
Te [N ii] K 9700±400 9800±400 12000±400Te [O iii] K 9700±700 10000±700 15200±1300Te [S iii] K 10000±1500 8000±1100 7200±900
Values for TOT from lines in Table 2 are not shown here, be-cause TOT contains distinct regions (IF and IBL) with differentphysical parameters.
for several bright O-type stars in Tr16 by Walborn (1995).Table 3 lists representative physical quantities like electrondensity and temperature derived from a standard deductivenebular analysis of the usual line ratios. These are usefulto guide the interpretation of the physics of the ionizationfront and photoevaporative flow discussed below.
5 ANALYSIS OF THE PHOTOEVAPORATIVEFLOW
Combining spectra with WFPC2 images that spatially re-solve the stratified IF on the globule’s surface provides apowerful diagnostic tool, and allows us to undertake a de-tailed analysis of the photoevaporative flow and the incidentUV field. From our narrowband images we made tracingsof the observed intensity normal to the IF at five differentpositions around the Finger, indicated as a through e inFigure 7. The corresponding intensity tracings at these fivepostions are shown in Figure 8a to e. Surface brightness inFigure 8 has been corrected for reddening and extinction,with E(B − V )=0.37 and R=4.8.
5.1 The Stratified Ionization Fronts of the Finger
All the tracings in Figure 8 show the same general stratifica-tion with respect to the IF (at position=0), although thereare some detailed differences. Starting from the left, H2 emis-sion peaks 0.′′5 to 1.′′5 (1200 to 3500 AU at d=2.3 kpc) behindthe IF, while [S ii], Hα, and Paβ then rise sharply. [S ii] peaksat the IF and decreases exponentially thereafter, while hy-drogen lines continue to rise, with their peak <∼ 0.′′25 outsidethe IF in most cases (except position b). [O iii] and He i risesharply at the IF (due to extinction by dust), reach a broadpeak (if any) outside the IF, and then decrease gradually atlarger distances. The narrowest [S ii] zones with a FWHMof ∼0.′′5 are spatially resolved by HST, but the widths ofsome of the narrow Paβ and He i zones are unresolved inthe ground-based images.
Far from the IF (∼7′′) the intensities of Hα and [O iii]are roughly equal in each set of tracings. Then, moving to-ward the IF, the intensities of Hα and [O iii] diverge as hardphotons capable of ionizing O+ to O2+ (with hν >35 eV) areeaten up by the photoevaporating flow and O2+ recombines(note the very strong [O ii] λλ3727,3729 at the IF in Figure5 and Table 2). At the same time, the strength of [S ii] tendsto increase in proportion to the difference between Hα and[O iii]. This is consistent with the qualitative similarity be-tween the [S ii] image (Figure 2c) and the [O iii]÷Hα ratio(Figure 4a). Although every position shares the same basic
c© 2002 RAS, MNRAS 000, 1–??
10 N. Smith et al.
ab c
d
e
11.5"
WR
25
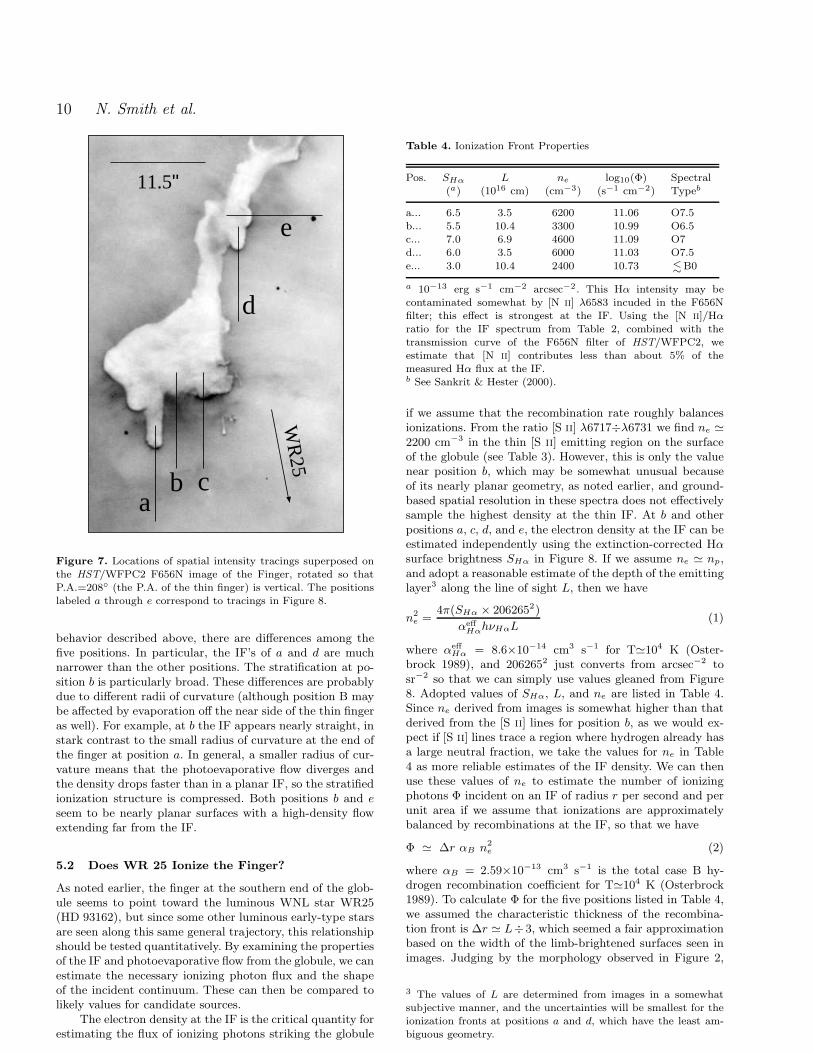
Figure 7. Locations of spatial intensity tracings superposed onthe HST/WFPC2 F656N image of the Finger, rotated so thatP.A.=208◦ (the P.A. of the thin finger) is vertical. The positionslabeled a through e correspond to tracings in Figure 8.
behavior described above, there are differences among thefive positions. In particular, the IF’s of a and d are muchnarrower than the other positions. The stratification at po-sition b is particularly broad. These differences are probablydue to different radii of curvature (although position B maybe affected by evaporation off the near side of the thin fingeras well). For example, at b the IF appears nearly straight, instark contrast to the small radius of curvature at the end ofthe finger at position a. In general, a smaller radius of cur-vature means that the photoevaporative flow diverges andthe density drops faster than in a planar IF, so the stratifiedionization structure is compressed. Both positions b and eseem to be nearly planar surfaces with a high-density flowextending far from the IF.
5.2 Does WR 25 Ionize the Finger?
As noted earlier, the finger at the southern end of the glob-ule seems to point toward the luminous WNL star WR25(HD 93162), but since some other luminous early-type starsare seen along this same general trajectory, this relationshipshould be tested quantitatively. By examining the propertiesof the IF and photoevaporative flow from the globule, we canestimate the necessary ionizing photon flux and the shapeof the incident continuum. These can then be compared tolikely values for candidate sources.
The electron density at the IF is the critical quantity forestimating the flux of ionizing photons striking the globule
Table 4. Ionization Front Properties
Pos. SHα L ne log10(Φ) Spectral(a) (1016 cm) (cm−3) (s−1 cm−2) Typeb
a... 6.5 3.5 6200 11.06 O7.5b... 5.5 10.4 3300 10.99 O6.5c... 7.0 6.9 4600 11.09 O7d... 6.0 3.5 6000 11.03 O7.5
e... 3.0 10.4 2400 10.73 <∼B0
a 10−13 erg s−1 cm−2 arcsec−2. This Hα intensity may becontaminated somewhat by [N ii] λ6583 incuded in the F656Nfilter; this effect is strongest at the IF. Using the [N ii]/Hα
ratio for the IF spectrum from Table 2, combined with thetransmission curve of the F656N filter of HST/WFPC2, weestimate that [N ii] contributes less than about 5% of themeasured Hα flux at the IF.b See Sankrit & Hester (2000).
if we assume that the recombination rate roughly balancesionizations. From the ratio [S ii] λ6717÷λ6731 we find ne ≃2200 cm−3 in the thin [S ii] emitting region on the surfaceof the globule (see Table 3). However, this is only the valuenear position b, which may be somewhat unusual becauseof its nearly planar geometry, as noted earlier, and ground-based spatial resolution in these spectra does not effectivelysample the highest density at the thin IF. At b and otherpositions a, c, d, and e, the electron density at the IF can beestimated independently using the extinction-corrected Hαsurface brightness SHα in Figure 8. If we assume ne ≃ np,and adopt a reasonable estimate of the depth of the emittinglayer3 along the line of sight L, then we have
n2e =
4π(SHα × 2062652)
αeffHαhνHαL
(1)
where αeffHα = 8.6×10⁻¹⁴ cm3 s−1 for T≃104 K (Oster-
brock 1989), and 2062652 just converts from arcsec−2 tosr−2 so that we can simply use values gleaned from Figure8. Adopted values of SHα, L, and ne are listed in Table 4.Since ne derived from images is somewhat higher than thatderived from the [S ii] lines for position b, as we would ex-pect if [S ii] lines trace a region where hydrogen already hasa large neutral fraction, we take the values for ne in Table4 as more reliable estimates of the IF density. We can thenuse these values of ne to estimate the number of ionizingphotons Φ incident on an IF of radius r per second and perunit area if we assume that ionizations are approximatelybalanced by recombinations at the IF, so that we have
Φ ≃ ∆r αB n2e (2)
where αB = 2.59×10⁻¹³ cm3 s−1 is the total case B hy-drogen recombination coefficient for T≃104 K (Osterbrock1989). To calculate Φ for the five positions listed in Table 4,we assumed the characteristic thickness of the recombina-tion front is ∆r ≃ L÷3, which seemed a fair approximationbased on the width of the limb-brightened surfaces seen inimages. Judging by the morphology observed in Figure 2,
3 The values of L are determined from images in a somewhatsubjective manner, and the uncertainties will be smallest for theionization fronts at positions a and d, which have the least am-biguous geometry.
c© 2002 RAS, MNRAS 000, 1–??

Carina’s Defiant Finger 11
Figure 8. Intensity tracings of the ionization fronts and photoevaporative flows from the surface of the globule. Panels a through e
correspond to the positions shown in Figure 7. The left side shows intensity tracings made from HST/WFPC2 images in the [O iii]λ5007 (F502N; crosses), Hα (F656N; thin line), and [S ii] λλ6717+6731 (F673N; thick line) filters. The right shows tracings made fromground-based near-IR images in the light of He i λ10830 (crosses), hydrogen Paβ (thin line), and H2 v = 1− 0 S(1) λ21218 (thick line).All fluxes have been corrected for extinction and reddening with E(B − V )=0.37 and R=4.8, as shown in Figure 6. In each filter, aconstant value was subtracted corresponding to the emission from the background H ii region far from the globule. Note that the weakerlines of [S ii] and H2 have been multiplied by factors of 5 and 25, respectively, for more effective comparison. The horizontal axis showsspatial position relative to the peak of the [S ii] emission, adopted as the nominal location of the ionization front. The star symbol inpanel (e) marks the position of a star (see Figure 7).
positions a through d all have the same ionizing source, andTable 4 indicates that all these positions have roughly thesame incident flux of ionizing photons, with an average oflog10(Φ)=11.04 s−1 cm−2. Position e has a lower incidentUV flux, with log10(Φ)≃10.7 s−1 cm−2. The disagreementbetween the values of Φ for positions a through d comparedto e is consistent with the apparent morphology in Figure2, where position e seems to have a different UV source.
The shape and relative intensities of various lines inFigure 8 can also be used to constrain the spectral type ofthe ionizing star, by comparison to detailed emission mod-els of photoevaporative flows. Sankrit & Hester (2000; SHhereafter) modeled ionized photoevaporative flows as seen inthe same optical emission line tracers as we observed withHST. SH found that while the maximum density at the IFdepends on the total ionizing flux but not on the shape of
the incident continuum, the ratio of [O iii] to Hα is sensitiveto the spectral type of the ionizing star. In Table 4 we listspectral types of the ionizing stars inferred from values ofthe peak [O iii]÷Hα ratio for positions a through e, corre-sponding to the models of SH with log10(Φ)≃11 s−1 cm−2
for positions a through d, and log10(Φ)≃10.7 s−1 cm−2 forposition e (see their Figure 8). We regard these character-istic spectral types as very rough estimates; they should betaken as representing the approximate ratio of photons withhν >∼ 35 eV to those with hν >∼ 13.6 eV, rather than the ac-tual spectral type of a main sequence star (SH also notedthat the derived properties differed depending on the typeof model atmosphere used).4 This is especially relevant to
4 When interpreting the characteristic spectral types, one should
c© 2002 RAS, MNRAS 000, 1–??

12 N. Smith et al.
Table 5. Candidate UV Sources
Star Spectral P.A. R log10(QH )
Type (deg) (parsec) (s−1)
WR25 WNL 219 2.82 50.1Tr16-244 O4 If 215 2.71 49.9HD 93205 O3.5 V ((f)) 176 2.96 49.5HD 93204 O5 V ((f)) 179 3.12 49.2-59◦2574 B1-B1.5 V 209 0.87 46.5
Spectral types are taken from Walborn et al. (2002) and Massey& Johnson (1993), R is the projected separation from the Fingermeasured in images, and ionizing photon fluxes for spectral typesare taken from Smith et al. (2002), except for WR25 where QH
is from models by Crowther et al. (1995). Also, HD 93205 is abinary, actually classified as O3.5 V ((f)) + O8 V, but the hottercomponent dominates the ionizing luminosity.
the possibility of WR25 as the ionizing source, as it is nota main-sequence star and has a strong wind (M = 10−4.4
M⊙ yr−1; Crowther et al. 1995). Also, these characteris-tic spectral types may underestimate the actual hardnessof the source energy distribution, since hard photons maybe absorbed in the ambient material between the star andthe Finger or by dust in the photoevaporative flow itself. Ingeneral, the peak [O iii]÷Hα ratios for positions a throughd are consistent with a characteristic spectral type of ∼O7or O7.5, according to the models by SH, while position e re-quires a source with a spectral type later than B0 (an [O iii]peak is weak or non-existent at position e).
Figure 9 shows the hydrogen-ionizing photon luminos-ity QH = 4πR2Φ that would be required at a distance R toproduce a flux of log10(Φ)=11.04 s−1 cm−2 at the surfaceof the Finger. This is compared to the actual values of QH
and R for stars that are potential sources of the UV fluxevaporating the Finger. QH values are taken from Smith etal. (2002) for the corresponding spectral type. For WR25we adopted QH from the models by Crowther et al. (1995;Crowther, private comm.; models by Smith et al. 2002 andCrowther et al. 1995 include line blanketing.) The positionsof these candidate source stars are identified in Figure 1 andtheir properties are collected in Table 5. Figure 9 shows twovalues for R: the separation on the sky given in Table 5, anda value that is a factor of
√2 larger to account for a possible
projection effect. From Figure 9 we conclude that the dom-inant source of ionization for the Finger is either the WNLstar WR25 (Crowther et al. 1995) or the neighboring O4 Ifstar Tr16-244 (star number 257 of Massey & Johnson 1993)— or perhaps both working together. It is somewhat unset-tling that the thin Finger appears to point toward a slightlyskewed position angle of ∼208◦, while WR25 is found atP.A.=219◦ and Tr16-244 is at P.A.=215◦, relative to theFinger; one might expect a feature like the Finger to pointdirectly toward its UV source. However, other factors mayaffect the appearance of photoionized columns as well (seeWilliams et al. 2001; Canto et al. 1998). The Finger doespoint almost exactly at CPD −59◦2574, but as an early Bstar, it does not even come close to providing the requiredionizing flux (Figure 9). Located directly south of the Fin-
also keep in mind recent revisions to the Teff scale for O stars(e.g., Martins et al. 2002).
Figure 9. The solid line labeled QH = 4πR2Φ shows the num-ber of hydrogen-ionizing photons QH that a star must emit at aseparation Rpc in order to ionize the Finger. QH is plotted for
several stars including WR25 at two different distances; the neardistance is just the projected separation on the sky, and the fardistance is an arbitrary factor of
√2 larger.
ger, the massive hot stars HD 93204 and HD 93205 alsoprovide insufficient ionization.
One further complication, however, is that the ioniz-ing continuum striking the Finger appears to be softer thanthat produced by either WR25 or Tr16-244. The spectraltype inferred from the [O iii]÷Hα ratio at the IF is onlyabout O7 (Table 4), whereas both likely UV sources havemuch earlier spectral types. We have not considered the ef-fect of the strong X-ray flux from WR25 (e.g., Raassen et al.2003; Seward et al. 1979). Since there are no other plausi-ble sources of ionization in this direction, this suggests thatthe incident radiation field is softened as it passes throughthe nebula and the IBL on its way to the Finger. From thespectrum of the IBL we would derive an earlier spectral typefrom the [O iii]÷Hα ratio than in the thin IF itself (Figure5 and Table 2).
5.3 Mass-Loss Rate and Lifetime
From 12CO(2-1) observations, Cox & Bronfman (1995) es-timated a characteristic mass for the Finger of ∼6 M⊙, butbecause the emission sampled mostly the warm surface ofthe cloud, they noted that the total mass of the globule isprobably 10 to 20 M⊙. This mass provides the reservoir forfuture photoevaporation, and allows us to estimate a likelyevaporation timescale for the cloud. If the evaporation of thecloud is dominated by the brightest southern IF, and if thegeometry can be approximated as a cylinder illuminated onone side, the mass loss rate is given roughly by
M ≃ πr2mHnHv (3)
c© 2002 RAS, MNRAS 000, 1–??

Carina’s Defiant Finger 13
where r is the characteristic radius of curvature of the cloudappropriate for the apparent size of the IF (∼1017.3 cm),and v is the speed of the evaporative flow through the IF.The electron density at the main evaporating surface (po-sitions c and d) is ∼4000 cm−3 (Table 4), while right atthe IF itself we typically have ne ≃ 0.7nH because the gasis not fully ionized (e.g., SH). If we assume that the mate-rial expands away from the ionization front at the isother-mal sound speed (v ≈10 km s−1), then M ≈ 2 × 10⁻⁵ M⊙
yr−1. In that case, the remaining lifetime of the entire cloudis 105.3 to 106 years; about 15% to 30% of the age of thenebula. The Finger and other associated molecular clumpsprobably represent the last vestiges of the original molecularcloud core that spawned Tr16, while significant reservoirs forfuture star formation exist in the neighboring giant molec-ular cloud (Grabelsky et al. 1988).
6 STAR FORMATION IN THE FINGER?
In addition to the emission-line images described above,near-IR images in the J , H , and K broadband filters wereobtained. A few reddened sources with mK ≃14 were de-tected within the boundaries of the globule, but these werepositioned randomly and could easily be chance alignmentsof background sources (these point sources can be seen inthe 2.122 µm H2 image in Figure 3c). A few of these K-bandsources seem preferentially located near the limb-brightenededges of the globule, but no reddened stars were detectednear the southern ionization front or inside the thin “finger”protruding from it, as one might have expected. However,that doesn’t necessarily mean that no stars are currentlyforming here or that no stars will form in the future. Belowwe estimate the amount of extinction in the Finger and theK-band source that could be hidden, as well as other per-tinent quantities like the column density and mass in theFinger and its associated globule. Then we discuss implica-tions for current and future star formation in this globule.
6.1 Extinction and Dust Mass
The Finger globule is seen as a silhouette in [O iii], Hα, He iλ10830, and Paβ, so tracings through the globule in theseemission lines can be used to estimate the optical depth,mass column density, and total mass of the globule. Fig-ure 10 shows representative cross-cuts through the middleof the globule and through the thin finger (perpendicular totracing “a” in Figure 7). Differences in spatial resolution be-tween the HST and ground-based data aside, it is clear thatthe minimum emission intensity in the center of each trac-ing Iλ increases with wavelength. Thus, the globule becomestranslucent at the longer near-IR wavelengths. Interpretingthese tracings is not entirely straightforward, however, be-cause the Finger is not a simple silhouette blocking lightfrom a background source — instead, it is a bright-rimmedglobule suspended inside the H ii region. Thus, some frac-tion of the observed minimum intensity originates along ourline-of-sight to the Finger or near its surface. For example, itwould not be unreasonable to assume that roughly half theintensity for each line in Figure 10 is foreground emission.Since the globule has a flat-bottom profile and negligible
Figure 10. Normalized intensity cuts (a) through a narrow sec-tion near the middle of the globule and (b) through the thin ex-tended finger for several emission lines. These tracings are usefulfor assessing the extinction in the globule (see text §6.1).
limb brightening in [O iii], we can make a crude correc-tion for this foreground emission if we assume that the glob-ule is optically thick and “black” in the [O iii] line. Then,the effective transmission at a given wavelength is given by(Iλ − IO3)/(1− IO3), where IO3 is the minimum flux in the[O iii] line in the middle of the globule. Contamination fromthe IBL is probably worst in Hα and Paβ, so using the He i
λ10830 line, we estimate an effective transmission throughthe middle of the globule of roughly 30%, and a correspond-ing optical depth (τ ) of ∼1.2 at a wavelength of 1.08 µm.Similarly, for the thin finger we estimate a slightly higher τof ∼1.5 at 1.08 µm. The dust-mass column density is givenby
mDUST
≃ 4aρτ
3 Qabs
(4)
where a ≈ 0.1 µm is the assumed grain radius (large grainsdominate the opacity), ρ ≈ 1 g cm−3 is the average grainmass density, and Qabs=0.04 is the extinction coefficient at1.08 µm (e.g., Draine & Lee 1984). Then, with 1.2<∼ τ <∼ 1.5at 1.08 µm, we have characteristic dust-mass column densi-ties of 4 to 5×10⁻⁴ g cm−2. If we integrate over the entireprojected area of the globule, and assume a typical gas:dustmass ratio of 100:1 (this is the dominant source of uncer-tainty), then we find a total mass for the Finger globule of 6to 8 M⊙. Likewise, the mass of the small clump at the end ofthe thin finger is of order 0.1 to 0.2 M⊙. The correspondinghydrogen column density through the globule is NH ≈ 2 to3×1022 cm−2.
c© 2002 RAS, MNRAS 000, 1–??

14 N. Smith et al.
The excellent agreement with the mass of 6 M⊙ derivedfor the globule by Cox & Bronfman (1995) is fortuitous,given the large inherent uncertainty in the assumed gas:dustmass ratio. In fact, just as Cox & Bronfman noted thattheir value was an underestimate because the CO emissionwas dominated by warm outer layers of the globule, ours isprobably an underestimate because some parts of the fingermay be optically thick even at 1 to 2 µm and may hideadditional mass.
In our images, the K-band detection limit for pointsources projected against the uneven background emissionassociated with the Finger globule is mK ≃17. The extinc-tion estimated above could then hide an intrinsic mK ≃15.5source from detection. At 2.3 kpc, this corresponds to anabsolute K magnitude of roughly 3.5 to 4, or a young starof roughly 0.3 to 0.5 M⊙. (Note that this is comparable tothe minimum mass of dust and gas within the end of thethin finger.) Considering our detection limit we cannot ruleout the possibility that a low-mass star has already formedat the end of the finger, so deeper JHK images with highspatial resolution are desirable.
6.2 Future Star Formation in the Finger?
Even though we have found no direct evidence for newly-formed stars within the Finger, this globule and others like itin Carina may still be likely sites of future star formation. In§5.3 we found that the remaining lifetime before the globuleevaporates away is of order 105.3 to 106 years, which is longerthan the average free-fall time for the whole globule, andis plenty of time to allow a dense clump to collapse andform a protostar that would survive exposure to the interiorof the H ii region. Thus, it is worth a closer look at thephysical conditions within the globule and its advancing IF.In particular, we ask whether the formation of a star maybe triggered by radiation-driven implosion. We consider twocases: the main southern IF working on the body of theglobule, and the end of the thin finger protruding from it.
6.2.1 The Main Ionization Front
With a characteristic radius of ∼10′′ or ∼3×1017 cm, theJeans mass for the whole globule is ∼2 M⊙ (T/10 K). Thus,with a temperature of 10 - 40 K (e.g. Cox & Bronfman 1995),a mass larger than 6 M⊙ makes it plausible that the globulecan collapse to form stars — or at least, one could argue thatthe globule is on the verge of collapse under self gravity,neglecting rotation and magnetic support. Thus, externalpressure may play an important role in the globule’s future.
When evaluating if radiation-driven implosion is impor-tant, we must consider pressure balance between the ioniza-tion front (Pif ) and the pressure inside the neutral globule(P0). We have
Pif = nekTe +mHnev2 (5)
P0 =ρ0
µmH
kT + ρ0σ2 +
B2
8π(6)
where mHnev2 is the back pressure from the photoevapora-
tive flow launched from the IF (roughly equal to nekT ), ρ0is the mass density, µ is the mean molecular weight, ρ0σ
2 isthe inferred turbulent pressure of the molecular gas, and the
last term in equation (6) is the magnetic pressure inside thecloud. The electron density and temperature of the IF areroughly 4000 cm−3 and 104 K (Tables 3 and 4), respectively,the average mass density ρ0 inside the cloud is ∼2×10⁻¹⁹ gcm−3 (see §6.1), and σ is roughly 1.1 km s−1 inferred fromCO line widths of 2.7 km s−1 (Cox & Bronfman 1995). If weneglect magnetic fields5, we find Pif/P0 ≃ 5. Thus, a sig-nificant external overpressure may be causing the globue tocollapse. If magnetic pressure is to support the globule, theperpendicular component of the magnetic field that wouldbe required is ∼5×10⁻⁴ G. Interestingly, in their analysis ofthe pillars of the Eagle Nebula, White et al. (1999) find asimilar field of B ≃ 5.4×10⁻⁴ G (in fact, many of the phys-ical parameters of the Finger resemble those estimated forthe M16 pillars). However, as noted by those authors, a fieldof this strength would broaden the observed line width to>∼ 4 km s−1 because of Alfvenic motions, which is broader
than the CO linewidth of 2.7 km s−1 reported by Cox &Bronfman (1995) for the Finger. Thus, we find it likely thatradiaton-driven implosion at the IF may be triggering theformation of low-mass stars in the globule.
6.2.2 The Thin Finger
The thin finger protruding from the IF presents a somewhatdifferent case, because it is smaller and denser than the mainglobule. One might expect that it was much denser than itsintial surroundings, and that it has come into pressure equi-librium with the IF, since it has obviously resisted evapora-tion more than adjacent areas of the initial cloud (see alsoWilliams et al. 2001). We approximate the end of the thinfinger as a spherical globule with radius 5×1016 cm, a massof >∼ 0.2 M⊙ (see §6.1), and a corresponding mass density of
∼10−18 g cm−3. The Jeans mass is then ∼0.3 M⊙ (T/10 K),and again, we find it plausible that the dense clump may bein the process of collapsing to form a star — especially if 0.2M⊙ is an underestimate of the clump’s mass because of highoptical depth as noted earlier. Following the analysis above,we find Pif/P0 ≃ 1.4. This is considerably more uncertainthan for the main globule above, because turbulence dom-inates the internal pressure, and we do not know to whatextent the value of σ used above applies to the small finger-tip (this uncertainty also precludes a meaningful estimate ofthe magnetic field needed to halt collapse). Thus, the mostlikely scenario may be that the fingertip is in pressure equi-librium, and that a slowly-advancing D-type (dense) IF iseating into the fingertip, and the shock from the IF has longago passed through the clump. If a star is to form here, theprocess should already be underway. The fingertip may con-tain a faint low-mass protostar that has escaped detectionin our images, or it may have a very young Class 0 proto-star. In the latter case, thermal IR emission from a densehot core would be difficult to detect, as it would be maskedby thermal emission from the adjacent warm IF and PDR.
5 Note that turbulence dominates over thermal pressure, and wehave neglected rotation because the straight edges of the thinfinger protruding from the globule suggest that it has maintainedthe same orientation for its evaporation timescale of 105 years.
c© 2002 RAS, MNRAS 000, 1–??

Carina’s Defiant Finger 15
7 CONCLUSIONS
We have presented optical narrow-band HST/WFPC2 im-ages, ground-based optical spectra, and near-IR images ofthe “Finger” – a photoevaporating molecular globule in thecore of the Carina Nebula. The main conclusions of this workare the following:
1. The Finger globule exhibits an interesting morphol-ogy, with a thin extended middle finger apparently pointingtoward its source of ionizing photons. The spatially-resolvedstructure of the stratified ionization fronts are consistentwith the interpretation of the Finger as an optically-thickphotoevaporating molecular globule, similar to structuresoften seen in HST images of H ii regions.
2. Quantitatively, electron densities and the correspond-ing flux of ionizing photons incident upon the southward-facing ionization fronts of the Finger indicate that the dom-inant UV source is either WR25 (a late-type Wolf-Rayetstar), Tr16-244 (O4 If), or perhaps both. This is reassuring,since the finger points to within a few degrees of these stars.
3. The mass-loss rate for the main evaporating surfaceof the globule is of order 2×10⁻⁵ M⊙ yr−1.
4. From extinction measurements, we estimate an av-erage hydrogen column density of a few times 1022 cm−2
through the globule, and a total mass (assuming a gas:dustmass ratio of 100:1) of at least 6 M⊙, in agreement with in-dependent estimates from molecular studies. This is an un-derestimate if the globule contains clumps that are optically-thick in the near-IR.
5. The remaining lifetime of the globule before it is evap-orated away is of order 105.3 to 106 years.
6. Several reddened stars are seen projected within theboundaries of the Finger globule, but whether or not thesesources are newly-formed stars that are physically associatedwith the globule is uncertain. No reddened star is seen atthe apex of the thin protruding finger or immediately behindthe main ionization front, down to a limit of mK ≃ 17.
7. Considering the properties of the advancing ioniza-tion front, it appears likely that stars are currently form-ing or will soon form in the globule, triggered by radiation-driven implosion. At the main ionization front we find anexternal overpressure of a factor of ∼5, and a smaller over-pressure (>∼ 1) at the end of the thin finger.
ACKNOWLEDGMENTSWe thank John Bally for supplying the ground-based [S ii] image used
in Figure 1, and we benefitted from helpful discussions with Paul Crowther
regarding models of WR25. Support was provided by NASA through grant
HF-01166.01A from the Space Telescope Science Institute, which is oper-
ated by the Association of Universities for Research in Astronomy, Inc.,
under NASA contract NAS 5-26555. NOAO funded N.S.’s travel to Chile
and accommodations while at CTIO. Some travel support was also provided
by NASA grant NAG-12279 to the University of Colorado.
REFERENCES
Bertoldi, F. 1989, ApJ, 346, 735Bertoldi, F., & McKee, C.F. 1990, ApJ, 354, 529Bertoldi, F., & Draine, B.T. 1996, ApJ, 458, 222Bok, B.J., & Reilly, E.F. 1947, ApJ., 105, 255
Brooks, K.J., Burton, M.G., Rathborne, J.M., Ashley, M.C.B., &Storey, J.W.V. 2000, MNRAS, 319, 95
Canto, J., Raga, A.C., Steffen, W., Shapiro, P.R. 1998, ApJ, 502,695
Cardelli, J.A., Clayton, G.C., & Mathis, J.S. 1989, ApJ, 345, 245
Cox, P., & Bronfman, L. 1995, A&A, 299, 583Crowther, P.A., Smith, L.J., Hillier, D.J., & Schmutz, W. 1995,
A&A, 293, 427Deharveng, L., & Maucherat, M. 1975, A&A, 41, 27Draine, B.T., & Lee, H.M. 1984, ApJ, 285, 89Dyson, J.E. 1973, A&A, 27, 459Dyson, J.E.. et al. 1995, MNRAS, 227, 700Elmegreen, B.G. 1976, ApJ, 205, 405Gorti, U., & Hollenbach, D. 2002, ApJ, 573, 215Grabelsky, D.A., Cohen, R.S., Bronfman, L., & Thaddeus, P.
1988, ApJ, 331, 181Hawarden, T.G., & Brand, P.W.J.L. 1976, MNRAS, 175, 19Herbig, G.H. 1974, PASP, 86, 604Hester, J.J., et al. 1996, AJ, 111, 2349Hummer, ,D.G., & Storey, P.J. 1987, MNRAS, 224, 801Kahn, F.D. 1969, Physica, 41, 172Lizano, S., Canto, J., Garay, G., & Hollenbach, D. 1996, ApJ,
468, 739Lopez, J.A., & Meaburn, J. 1984, MNRAS, 211, 267Martins, F., Schaerer, D., & Hillier, D.J. 2002, A&A, 382, 999Massey, P., & Johnson, J. 1993, AJ, 105, 980McCaughrean, M.J., & Andersen, M. 2002, A&A, 389, 513Oort, J.H., & Spitzer, L. 1955, ApJ, 121, 6Osterbrock, D.E. 1989, Astrophysics of Gaseous Nebulae and Ac-
tive Galactic Nuclei (Mill Valley: University Science)Raassen, A.J.J., van der Hucht, K.A., Mewe, R., Antokhin, I.I.,
Rauw, G., Vreux, J.M., Schmutz, W., & Gudel, M. 2003, A&A,402, 653
Rathborne, J.M., Burton, M.G., Brooks, K.J., Cohen, M., Ashley,M.C.B., & Storey, J.W.V. 2002, MNRAS, 331, 85
Reipurth, B. 1983, A&A, 17, 183Reipurth, B., Raga, A., & Heathcote, S. 2003, AJ, 126, 1925Sankrit, R., & Hester, J.J. 2000, ApJ, 535, 847Seward, F.D., et al. 1979, ApJ, 234, L55Smith, L.J., Norris, R.P.F., & Crowther, P.A. 2002, MNRAS, 337,
1309Smith, N. 2002, MNRAS, 331, 7Smith, N., Bally, J., & Brooks, K.J. 2004, AJ, in pressSmith, N., Bally, J., & Morse, J.A. 2003a, ApJ, 587, L105Smith, N., Gehrz, R.D., & Krautter, J. 1998, AJ, 116, 1332Smith, N., Morse, J.A., Bally, J., & Phelps, R.L. 2003b, PASP,
115, 342Smith, R.G. 1987, MNRAS, 277, 943Thackeray, A.D. 1950, MNRAS, 110, 529Thompson, R.I., Smith, B.A., & Hester, J.J. 2002, ApJ, 570, 749Walborn, N.R. 1975, ApJ, 202, L129
Walborn, N.R. 1995, RevMexAA, Ser. Conf., 2, 51Walborn, N.R., et al. 2002, AJ, 123, 2754White, G.J., et al. 1999, A&A, 342, 233Williams, R.J.R. 1999, MNRAS, 310, 789Williams, R.J.R., Ward-Thompson, D., & Whitworth, A.P. 2001,
MNRAS, 327, 788
c© 2002 RAS, MNRAS 000, 1–??