Embed Size (px)
Citation preview
1
CARICOM Foreign Direct Investment Flows
Preeya Shalini Mohan ([email protected])
&
Patrick Kent Watson1 ([email protected])
Sir Arthur Lewis Institute of Social and Economic Studies
University of the West Indies St. Augustine
Trinidad & Tobago
Tel: (868) 662-6965 Fax: (868) 645-6329
Abstract
Foreign direct investment (FDI) flows to the Caribbean play a critical role in relation to growth
and development. This paper provides evidence about the nature and pattern of CARICOM FDI
flows. A Gravity model, estimated using the Hausman-Taylor procedure for panel data, is used
to explain such flows between a selection of CARICOM and OECD countries. Income in both
the host and destination countries play a significant role in FDI flows, as do the level of financial
development and tax regime in the host country, and the existence of trading and service
agreements between host and destination countries. Policy recommendations are made to improve
the flows to and within CARICOM markets.
JEL Classification: F21; F36; G11; G34
Keywords: Foreign direct investment flows; CARICOM, Gravity Model
January 2012
1Corresponding author.
1
Introduction
The extent of globalization and financial integration has caused cross-border
Foreign Direct Investment (FDI) flows to increase exponentially since the 1980’s,
outpacing growth in world trade and GDP (UNCTAD 2008). In the existing
literature, primary focus is on FDI flows arising out of industrialized countries
and the larger developing countries of Latin America, Asia and Africa while the
study of FDI flows among small countries, such as those in the CARICOM2
region, is relatively limited. Where they do exist, studies of CARICOM FDI to
date focus mainly on its theoretical aspects (Craigwell 2006).
This paper is an attempt to fill that knowledge gap. It offers both a theoretical
explanation and empirical evidence about the nature and pattern of CARICOM
FDI flows and a Gravity model is used to explain such flows between OECD and
CARICOM countries. The OECD countries are chosen because they are the
largest source of such flows into the CARICOM region.
It is a matter of debate whether these flows are useful for a country’s development
or whether they do more harm than good. There is some evidence that FDI flows
may be associated with increasing economic growth and development: the World
Bank (2010), for instance, suggests that increases in these flows are associated
with higher growth in GDP per capita and vice versa. Furthermore, although
inflows to low income economies have historically been lower than inflows into
high income economies, since 2005, inflows into low income economies have
2 CARICOM (the Caribbean Community and Common Market) is a grouping of 14 Caribbean
countries: Antigua & Barbuda, Belize, Grenada, Montserrat, St. Vincent & the Grenadines, The Bahamas, British Virgin Islands, Guyana, St. Kitts & Nevis, Suriname, Barbados, Dominica, Jamaica, Saint Lucia and Trinidad & Tobago.
2
been higher and the growth in GDP per capita of these countries correspondingly
higher. As a consequence, low income countries, and even not-so-low income
countries like those of the CARICOM region, continue to adopt loose capital
control policies and pursue an agenda of open capital markets to encourage such
flows. On the other hand, arguments have been put forward about the volatility
and possible dangers associated with these flows, but Grabel (1999) makes the
important point that, despite such arguments, it is unrealistic for countries to cut
them off. Instead, appropriate policies and institutions should be put in place to
maximize the benefits from these flows and minimize their costs.
A major problem faced in attempting a study like this one is the lack of data on
FDI inflows and outflows by geographic source and destination for Caribbean
countries (Harrison 2005). All Central Banks of the CARICOM region, except
that of Trinidad & Tobago, do not have data on FDI inflows and outflows by
source and destination. The United Nations Conference on Trade and
Development (UNCTAD) also has data on FDI inflows and outflows for Trinidad
& Tobago only and cover the period 1990 to 2002.
The rest of this paper is structured as follows: in the following section, stylized
facts about CARICOM cross-border equity flows are presented. This is followed
by some theoretical considerations about the principal determinants of such flows,
which is then used in the construction of the gravity model employed to
investigate the FDI outflows of a selection of CARICOM and OECD countries.
The results obtained from the estimation of this model by the Hausman-Taylor
estimator are then discussed, then followed by policy recommendations, which
3
are based both on the stylized facts and the results of the estimation of the gravity
model. The paper then concludes.
CARICOM FDI flows: some stylized facts
CARICOM FDI is primarily Greenfield3 investments, which is not unusual for
developing countries as foreign investors find that there are not many suitable
firms to merge with or acquire. Among CARICOM countries, Trinidad & Tobago
is both the main recipient and investor of FDI. Compared to its regional
counterparts, Trinidad and Tobago is a relatively high-income country, with stable
inflation and exchange rates and relatively more developed financial markets.
Trinidad & Tobago is also the only country in that grouping that has
disaggregated FDI data, which makes measuring CARICOM cross-county FDI
difficult.
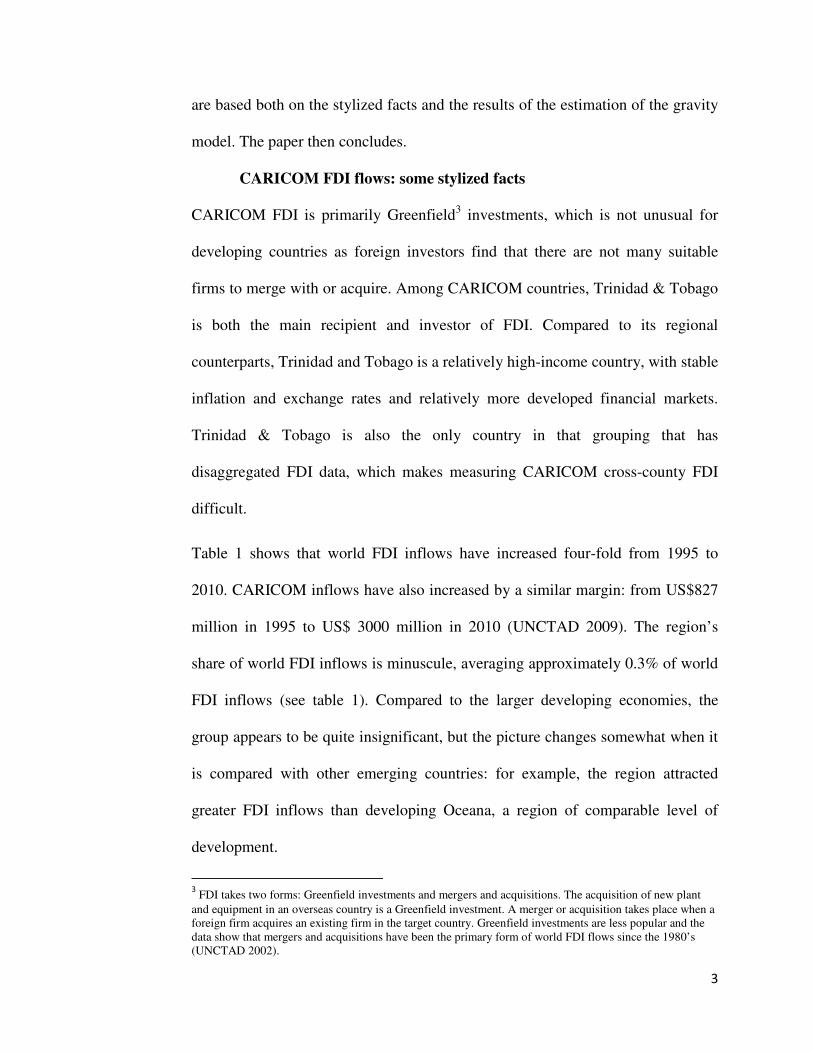
Table 1 shows that world FDI inflows have increased four-fold from 1995 to
2010. CARICOM inflows have also increased by a similar margin: from US$827
million in 1995 to US$ 3000 million in 2010 (UNCTAD 2009). The region’s
share of world FDI inflows is minuscule, averaging approximately 0.3% of world
FDI inflows (see table 1). Compared to the larger developing economies, the
group appears to be quite insignificant, but the picture changes somewhat when it
is compared with other emerging countries: for example, the region attracted
greater FDI inflows than developing Oceana, a region of comparable level of
development.
3 FDI takes two forms: Greenfield investments and mergers and acquisitions. The acquisition of new plant
and equipment in an overseas country is a Greenfield investment. A merger or acquisition takes place when a foreign firm acquires an existing firm in the target country. Greenfield investments are less popular and the data show that mergers and acquisitions have been the primary form of world FDI flows since the 1980’s (UNCTAD 2002).
4
Table 1: FDI inflows by region for selected years (US$ 000’s Millions) (Percentage of World Share shown)
Region 1995 2000 2005 2010
Developed 221.0 (65%) 1118.0 (81%) 613.0 (63%) 602 (48%)
Developing 116.0 (34%) 257.0 (19%) 329.0 (34%) 574 (46%)
CARICOM 0.8 (0.2%) 1.9 (0.1%) 3.4 (0.4%) 3 (0.3%)
Developing Oceana 0.7 (0.2%) 0.2 (0.1%) 0.2 (0.03%) 1.5 (0.05%)
Developing Africa 6 (1.7%) 10 (0.7%) 38 (3.9%) 55 (5.2%)
Developing America 30.0 (9%) 98.0 (7%) 77.0 (8%) 159 (8.5%)
Developing Asia 80.1 (24%) 148.6 (11%) 213.8 (22%) 358 (22.9%)
World 341.0 1382.0 973.0 1244.0
Source: UNCTAD, FDI database.
CARICOM countries, however, experienced significant reductions in FDI inflows
in 2008 and 2009 because of the global financial crisis which began in the second
half of 2007. World inflows fell from US$ 1.7 trillion in 2008 to US$ 1.2 trillion
in 2009. In 2010, however, there were signs of recovery and world FDI inflows
were estimated to rise to approximately US$1.4 trillion and to US$1.8 trillion in
2010 and 2011 respectively (UNCTAD’s World Investment Report 2009).
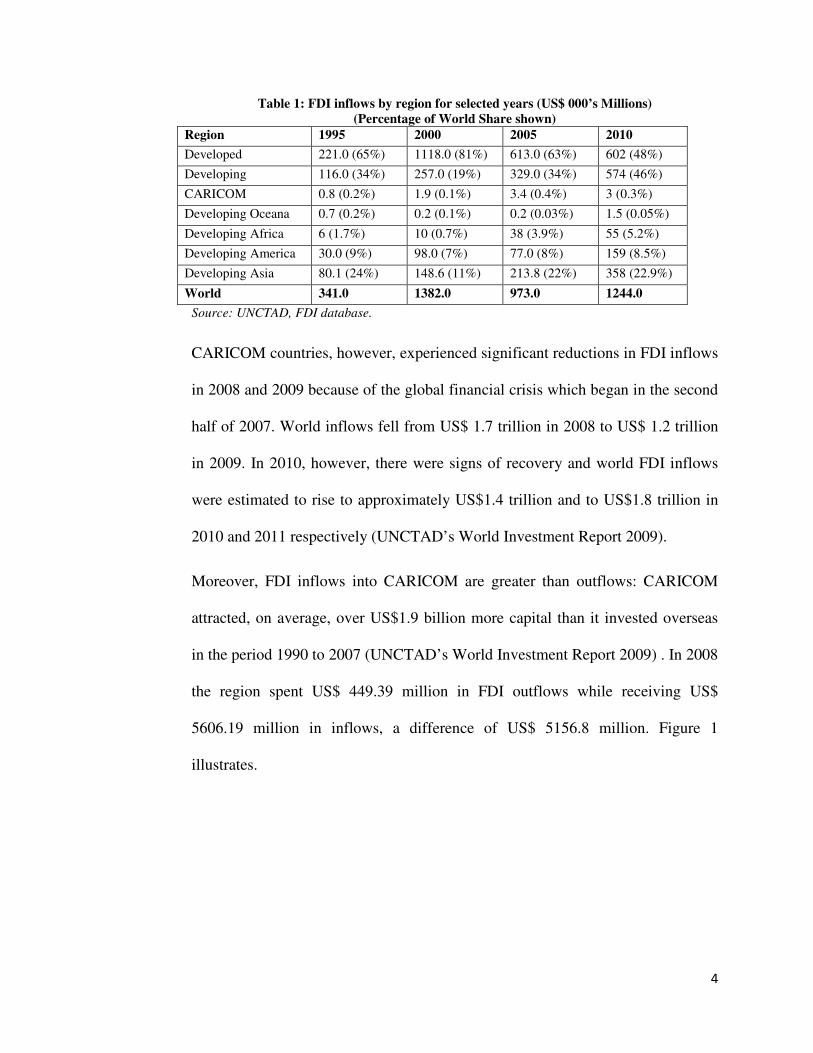
Moreover, FDI inflows into CARICOM are greater than outflows: CARICOM
attracted, on average, over US$1.9 billion more capital than it invested overseas
in the period 1990 to 2007 (UNCTAD’s World Investment Report 2009) . In 2008
the region spent US$ 449.39 million in FDI outflows while receiving US$
5606.19 million in inflows, a difference of US$ 5156.8 million. Figure 1
illustrates.
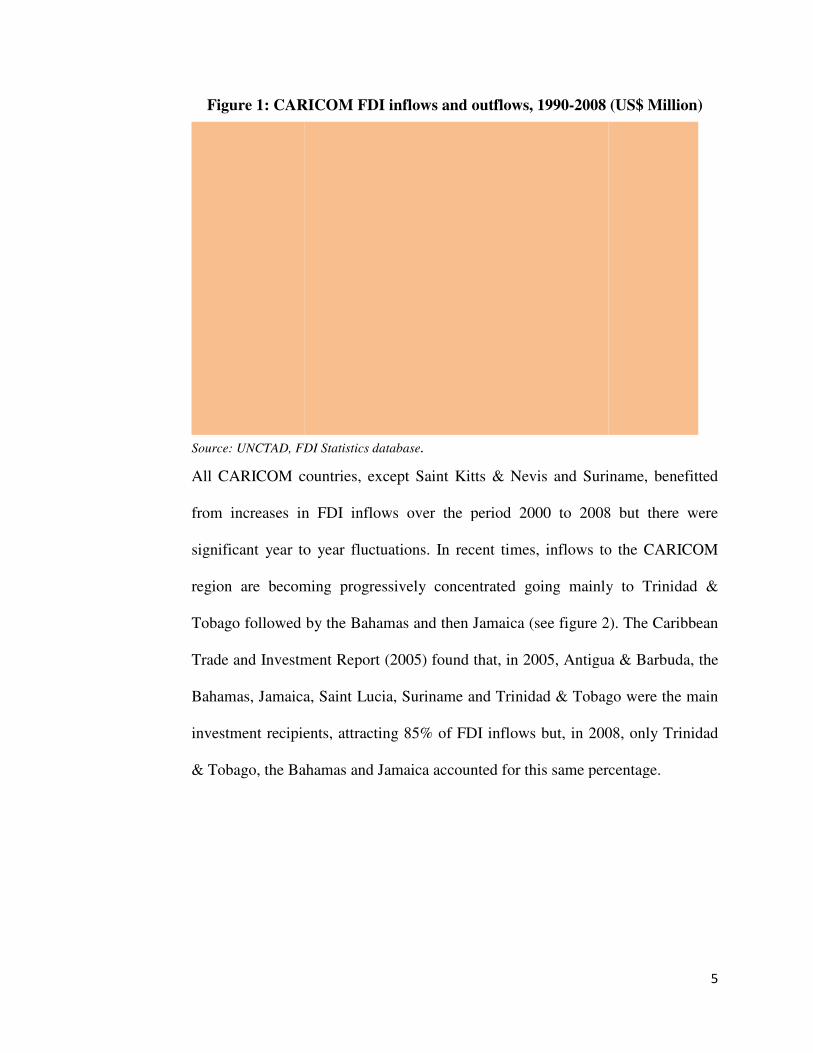
Figure 1: CARICOM FDI inflows and o
Source: UNCTAD, FDI Statistics database
All CARICOM countries
from increases in
significant year to ye
region are becoming progressively concentrated
Tobago followed by the Bahamas and then Jamaica (see figure 2)
Trade and Investment Report (2005) found tha
Bahamas, Jamaica, Saint Lucia, Suriname and Trinidad
investment recipients
& Tobago, the Bahamas and Jamaica
1: CARICOM FDI inflows and outflows, 1990-2008 (
FDI Statistics database.
CARICOM countries, except Saint Kitts & Nevis and Suriname
in FDI inflows over the period 2000 to 2008 but
significant year to year fluctuations. In recent times, inflows to the CARICOM
region are becoming progressively concentrated going mainly to Trinidad &
Tobago followed by the Bahamas and then Jamaica (see figure 2)
Trade and Investment Report (2005) found that, in 2005, Antigua & Barbuda, t
ahamas, Jamaica, Saint Lucia, Suriname and Trinidad & Tobago were the main
investment recipients, attracting 85% of FDI inflows but, in 2008, only Trinidad
the Bahamas and Jamaica accounted for this same percentage.
5
2008 (US$ Million)
Nevis and Suriname, benefitted
over the period 2000 to 2008 but there were
inflows to the CARICOM
going mainly to Trinidad &
Tobago followed by the Bahamas and then Jamaica (see figure 2). The Caribbean
t, in 2005, Antigua & Barbuda, the
Tobago were the main
but, in 2008, only Trinidad
his same percentage.
Figure 2: CARICOM FDI
Source: UNCTAD, FDI database.
The UNCTAD’s
Trinidad & Tobago as having high FDI
Guyana were classified as having
Haiti and Suriname were
ranked the Bahamas
countries in terms of
Guyana 11th in 2007,
ranked 40th in 2004
CARICOM FDI inflows, 2000-2008(US$ Million)
Source: UNCTAD, FDI database.
World Investment Report (2008) classified the Bahamas and
Tobago as having high FDI performance and potential,
classified as having high FDI performance but low potential while
Haiti and Suriname were considered to be underperformers. T
ranked the Bahamas 5th, Jamaica 26th and Trinidad & Tobago 54
countries in terms of FDI inflows for 2007. Additionally, the report ranke
in 2007, which is a significant improvement given that Guyana
in 2004. Although Trinidad & Tobago fell from 15th in 2004 to 54
6
World Investment Report (2008) classified the Bahamas and
performance and potential, Jamaica and
formance but low potential while
underperformers. The report also
and Trinidad & Tobago 54th out of 141
Additionally, the report ranked
ignificant improvement given that Guyana was
in 2004 to 54th in
7
2007, it still accounts for the highest level of CARICOM inflows owing to its
large hydrocarbon industry. It also has the highest inward FDI potential, ranking
45th worldwide in 2007.
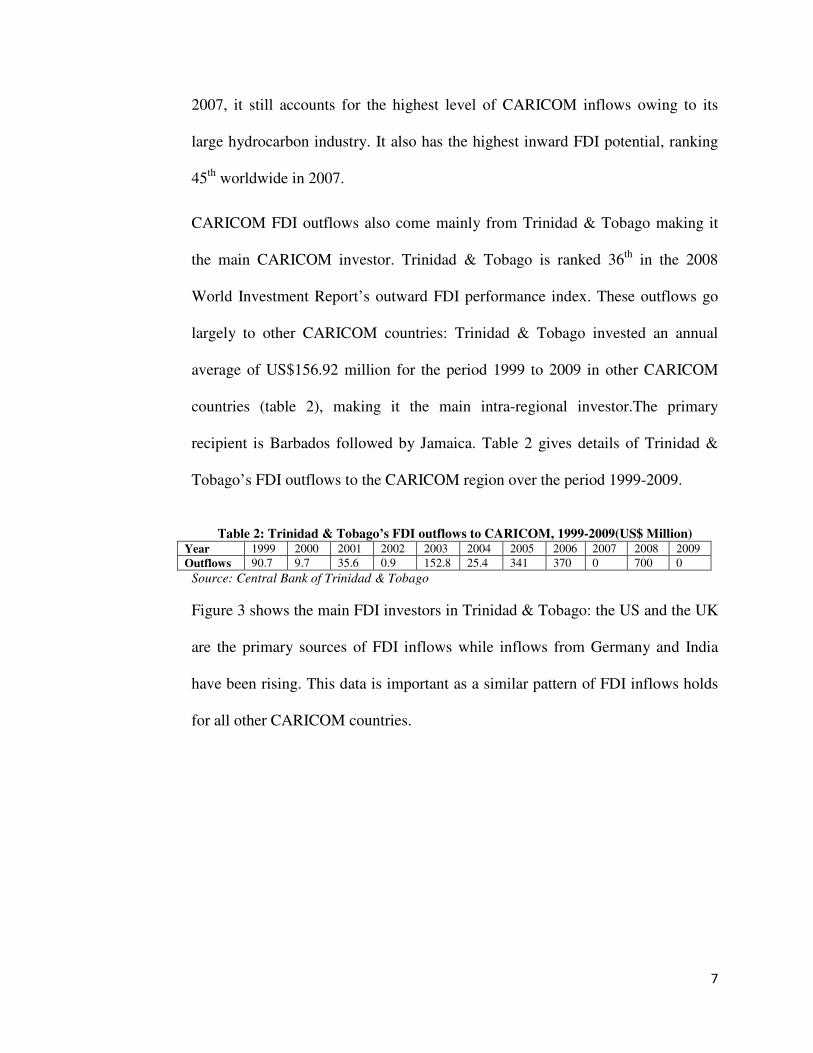
CARICOM FDI outflows also come mainly from Trinidad & Tobago making it
the main CARICOM investor. Trinidad & Tobago is ranked 36th in the 2008
World Investment Report’s outward FDI performance index. These outflows go
largely to other CARICOM countries: Trinidad & Tobago invested an annual
average of US$156.92 million for the period 1999 to 2009 in other CARICOM
countries (table 2), making it the main intra-regional investor.The primary
recipient is Barbados followed by Jamaica. Table 2 gives details of Trinidad &
Tobago’s FDI outflows to the CARICOM region over the period 1999-2009.
Table 2: Trinidad & Tobago’s FDI outflows to CARICOM, 1999-2009(US$ Million)
Year 1999 2000 2001 2002 2003 2004 2005 2006 2007 2008 2009
Outflows 90.7 9.7 35.6 0.9 152.8 25.4 341 370 0 700 0
Source: Central Bank of Trinidad & Tobago
Figure 3 shows the main FDI investors in Trinidad & Tobago: the US and the UK
are the primary sources of FDI inflows while inflows from Germany and India
have been rising. This data is important as a similar pattern of FDI inflows holds
for all other CARICOM countries.
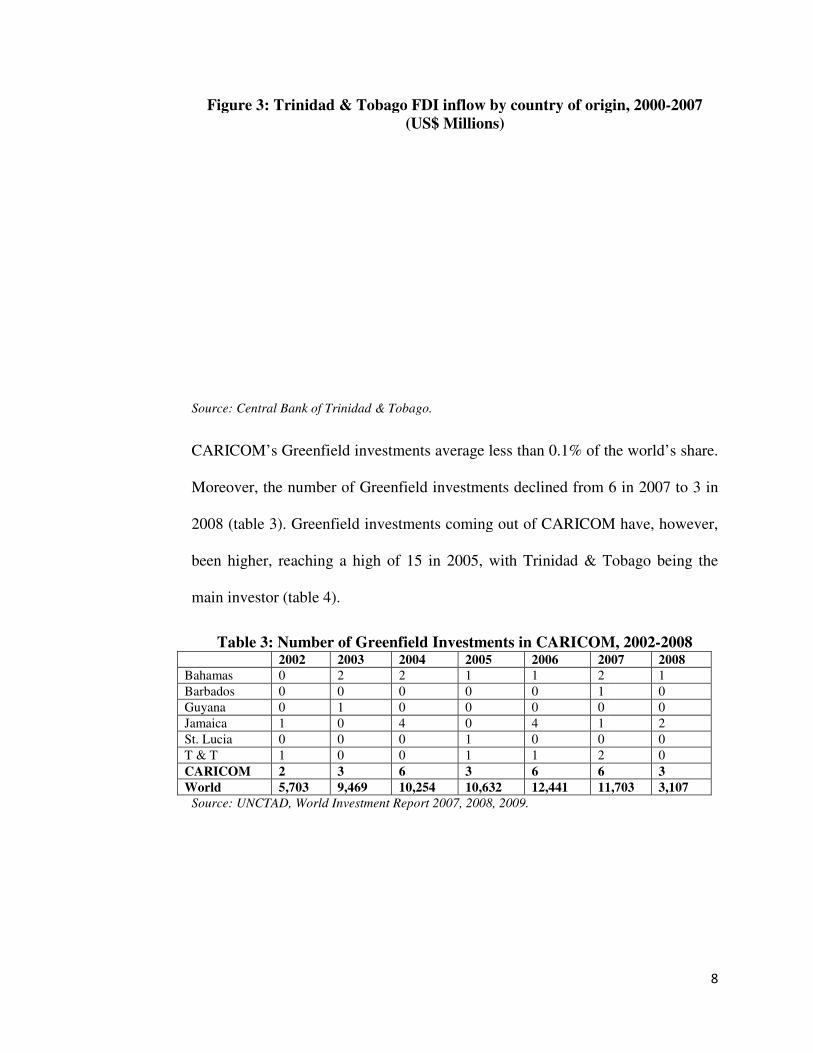
Figure 3: Trinidad & Tobago
Source: Central Bank of
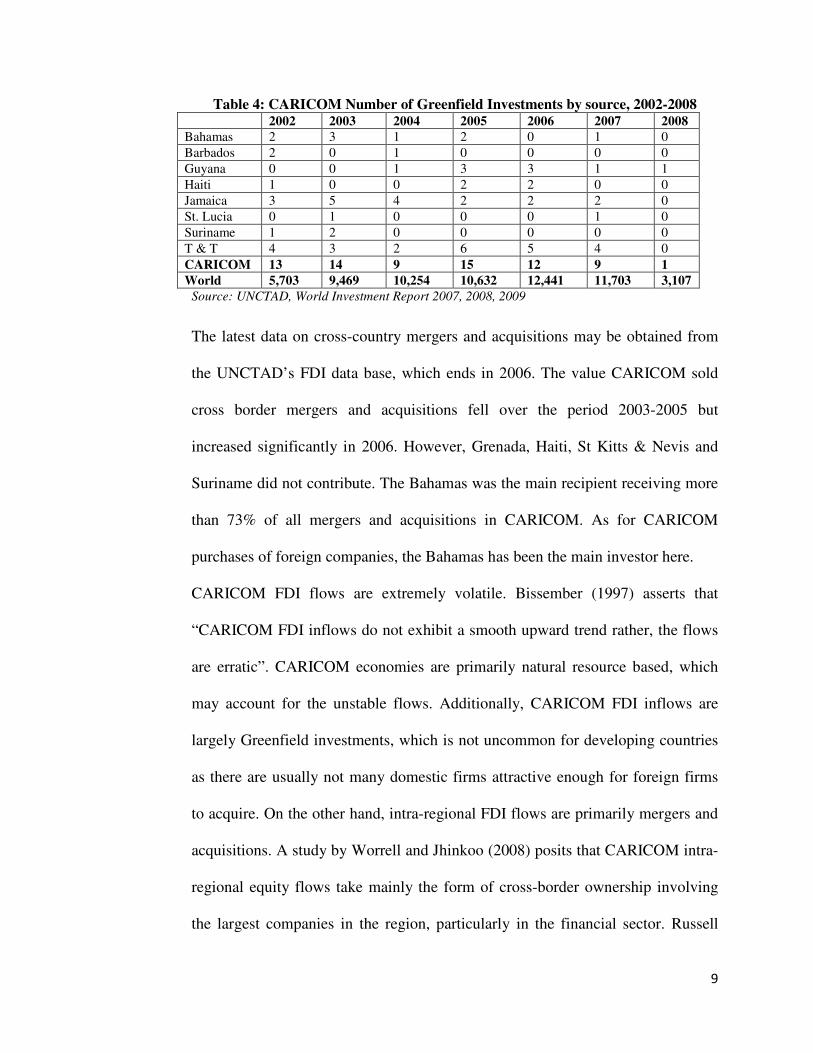
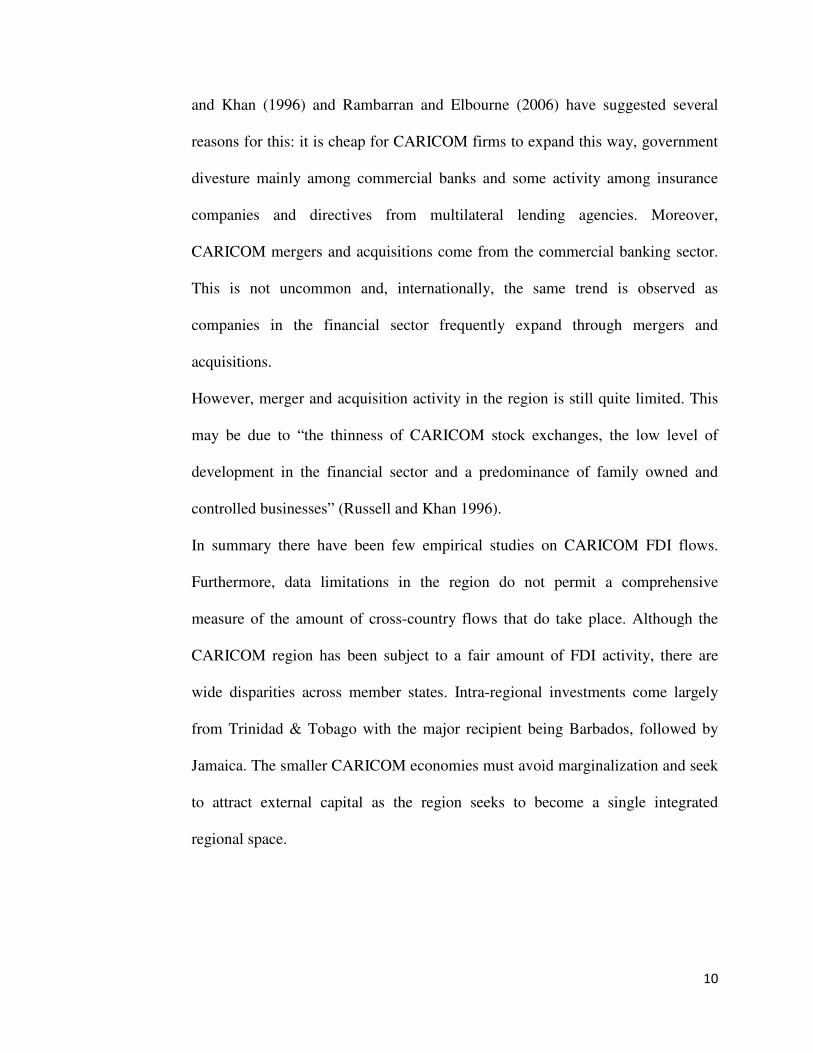
CARICOM’s Greenfield investments average less than 0.1% of the world’s share
Moreover, the number of Greenfield investments declined from
2008 (table 3). Greenfield investments coming out of CARICOM have
been higher, reaching a high of
main investor (table 4
Table 3: Number of 2002Bahamas 0
Barbados 0
Guyana 0
Jamaica 1
St. Lucia 0
T & T 1
CARICOM 2
World 5,703Source: UNCTAD, World Investment Report 2007, 2008, 2009.
Figure 3: Trinidad & Tobago FDI inflow by country of origin, 2000(US$ Millions)
Source: Central Bank of Trinidad & Tobago.
CARICOM’s Greenfield investments average less than 0.1% of the world’s share
Moreover, the number of Greenfield investments declined from
). Greenfield investments coming out of CARICOM have
been higher, reaching a high of 15 in 2005, with Trinidad & Tobago
or (table 4).
Number of Greenfield Investments in CARICOM, 2002 2003 2004 2005 2006 2007
2 2 1 1 2
0 0 0 0 1
1 0 0 0 0
0 4 0 4 1
0 0 1 0 0
0 0 1 1 2
3 6 3 6 6
5,703 9,469 10,254 10,632 12,441 11,703UNCTAD, World Investment Report 2007, 2008, 2009.
8
inflow by country of origin, 2000-2007
CARICOM’s Greenfield investments average less than 0.1% of the world’s share.
6 in 2007 to 3 in
). Greenfield investments coming out of CARICOM have, however,
Trinidad & Tobago being the
in CARICOM, 2002-2008 2007 2008
1
0
0
2
0
0
3
11,703 3,107
9
Table 4: CARICOM Number of Greenfield Investments by source, 2002-2008 2002 2003 2004 2005 2006 2007 2008 Bahamas 2 3 1 2 0 1 0
Barbados 2 0 1 0 0 0 0
Guyana 0 0 1 3 3 1 1
Haiti 1 0 0 2 2 0 0
Jamaica 3 5 4 2 2 2 0
St. Lucia 0 1 0 0 0 1 0
Suriname 1 2 0 0 0 0 0
T & T 4 3 2 6 5 4 0
CARICOM 13 14 9 15 12 9 1 World 5,703 9,469 10,254 10,632 12,441 11,703 3,107
Source: UNCTAD, World Investment Report 2007, 2008, 2009
The latest data on cross-country mergers and acquisitions may be obtained from
the UNCTAD’s FDI data base, which ends in 2006. The value CARICOM sold
cross border mergers and acquisitions fell over the period 2003-2005 but
increased significantly in 2006. However, Grenada, Haiti, St Kitts & Nevis and
Suriname did not contribute. The Bahamas was the main recipient receiving more
than 73% of all mergers and acquisitions in CARICOM. As for CARICOM
purchases of foreign companies, the Bahamas has been the main investor here.
CARICOM FDI flows are extremely volatile. Bissember (1997) asserts that
“CARICOM FDI inflows do not exhibit a smooth upward trend rather, the flows
are erratic”. CARICOM economies are primarily natural resource based, which
may account for the unstable flows. Additionally, CARICOM FDI inflows are
largely Greenfield investments, which is not uncommon for developing countries
as there are usually not many domestic firms attractive enough for foreign firms
to acquire. On the other hand, intra-regional FDI flows are primarily mergers and
acquisitions. A study by Worrell and Jhinkoo (2008) posits that CARICOM intra-
regional equity flows take mainly the form of cross-border ownership involving
the largest companies in the region, particularly in the financial sector. Russell
10
and Khan (1996) and Rambarran and Elbourne (2006) have suggested several
reasons for this: it is cheap for CARICOM firms to expand this way, government
divesture mainly among commercial banks and some activity among insurance
companies and directives from multilateral lending agencies. Moreover,
CARICOM mergers and acquisitions come from the commercial banking sector.
This is not uncommon and, internationally, the same trend is observed as
companies in the financial sector frequently expand through mergers and
acquisitions.
However, merger and acquisition activity in the region is still quite limited. This
may be due to “the thinness of CARICOM stock exchanges, the low level of
development in the financial sector and a predominance of family owned and
controlled businesses” (Russell and Khan 1996).
In summary there have been few empirical studies on CARICOM FDI flows.
Furthermore, data limitations in the region do not permit a comprehensive
measure of the amount of cross-country flows that do take place. Although the
CARICOM region has been subject to a fair amount of FDI activity, there are
wide disparities across member states. Intra-regional investments come largely
from Trinidad & Tobago with the major recipient being Barbados, followed by
Jamaica. The smaller CARICOM economies must avoid marginalization and seek
to attract external capital as the region seeks to become a single integrated
regional space.
11
Theoretical Considerations
Possible determinants of FDI flows have been identified in the literature as
economic size, macroeconomic stability, level of financial sophistication, trade,
transactions cost, geography, common culture, information asymmetries, the level
of financial liberalization, institutional, political and legal factors. See for
example Portes and Rey (2005), Di Giovanni (2005), Portes et al (2001) and
Tesar, and Werner (1994). These factors are divided into external “push’ factors
and domestic “pull” factors. Push factors are forces which act to drive investors
away from an investment and pull factors are what draws investors to a new
location.
The literature identifies the size of the economy of both the investor and target
countries as primary determinants of FDI flows (Di Giovanni 2005): the larger the
size of a country’s GDP, the more it becomes attractive to foreign investors, who
see greater profit opportunities there, but also the more that country itself has the
wherewithal to invest elsewhere. Foreign investors also tend to consider the
inflation and exchange rates of the host country: high inflation and unstable
exchange rates tend to discourage FDI (Froot and Stein 1991 and Grosse and
Trevino 1996).
Investment also seems to flow from, and flow to countries with relatively
developed financial markets (Hijzen et al 2007). Financial markets provide the
necessary capital to undertake costly foreign investment. .
Trade flows and FDI flows are also related. See for example Brainard (1997),
Markusen (2002), Carr et al (2001) and Blonigen et al (2003). According to the
12
“tariff-jumping” hypothesis foreign firms enter domestic markets through exports
or by setting up a local subsidiary: as export costs increase, mainly through the
implementation of higher tariffs, foreign firms are more likely to set up a local
branch creating a negative relationship between FDI and trade. However,
empirical models also provide evidence that FDI and trade are directly related.
The breakup of the production process, the large distribution of global networks
and improvements in communication and production technology have been
identified as reasons for this finding. Moreover, Regional Trade and Service
Agreements (RTSAs) may also affect FDI since they normally include clauses
favouring investment and rules which regulate such cross-border investment (Di
Giovanni 2005).
The greater the distance between the investor and the host country, the higher the
‘transactions costs’ are likely to be, and this is likely to reduce FDI. However,
empirical evidence shows that FDI and distance are positively related (Portes and
Rey 2005, Di Giovanni 2005 and Tesar and Werner 1994). On the other hand, a
common culture and legal system would logically tend to encourage FDI (Buch,
Gayle and De Long 2004). The tax regime in the host country can also act to
attract or discourage FDI: the more oppressive it is, the less the likely FDI flows
(Di Giovanni 2005).
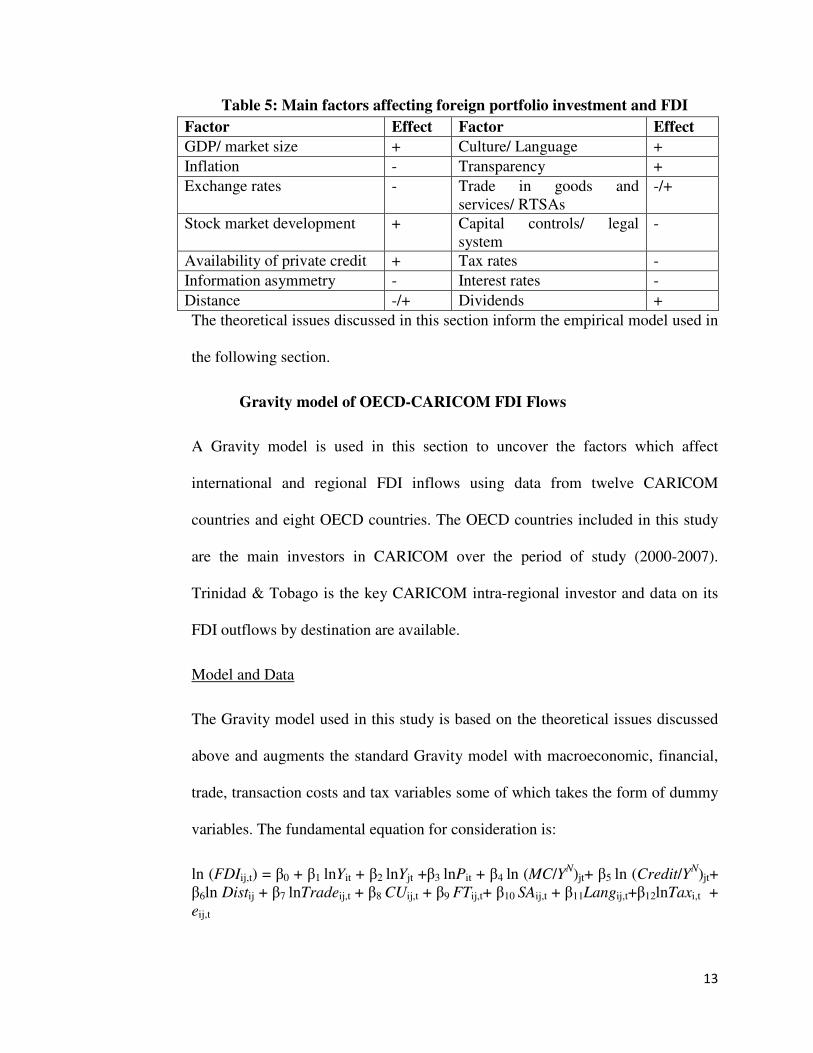
Table 5 summarizes the main factor affecting FDI.
13
Table 5: Main factors affecting foreign portfolio investment and FDI
Factor Effect Factor Effect
GDP/ market size + Culture/ Language +
Inflation - Transparency +
Exchange rates - Trade in goods and services/ RTSAs
-/+
Stock market development + Capital controls/ legal system
-
Availability of private credit + Tax rates -
Information asymmetry - Interest rates -
Distance -/+ Dividends +
The theoretical issues discussed in this section inform the empirical model used in
the following section.
Gravity model of OECD-CARICOM FDI Flows
A Gravity model is used in this section to uncover the factors which affect
international and regional FDI inflows using data from twelve CARICOM
countries and eight OECD countries. The OECD countries included in this study
are the main investors in CARICOM over the period of study (2000-2007).
Trinidad & Tobago is the key CARICOM intra-regional investor and data on its
FDI outflows by destination are available.
Model and Data
The Gravity model used in this study is based on the theoretical issues discussed
above and augments the standard Gravity model with macroeconomic, financial,
trade, transaction costs and tax variables some of which takes the form of dummy
variables. The fundamental equation for consideration is:
ln (FDIij,t) = β0 + β1 lnYit + β2 lnYjt +β3 lnPit + β4 ln (MC/YN)jt+ β5 ln (Credit/YN)jt+ β6ln Distij + β7 lnTradeij,t + β8 CUij,t + β9 FTij,t+ β10 SAij,t + β11Langij,t+β12lnTaxi,t + eij,t
14
where “i” is the target country, “j” the investor country, t represents time, FDIij,t
measures gross FDI outflows from country i to country j in year t, Y real GDP, P
the price level, MC stock market capitalization, Credit is credit provided by the
private sector (bank and other non bank financial institutions), YN nominal GDP,
Distij the distance between the capital cities of countries i and j, Tradeij is real
goods trade flow from country i to j, CUij is a dummy variable equal to1 if
countries i and j belong to a common Customs Union, FTij is a dummy variable
equal to 1 if countries i and j belong to a common Free Trade Agreement, SAij is a
dummy variable equal to 1 if i and j belong to a common Service Agreement,
Langi,j is a dummy variable equal to 1 if countries i and j share a common
language, Tax is the average corporate tax rate and eij,t is the error term assumed
to be normally distributed with zero mean and variance equal to 1. Based on what
appears in table 9 above, a priori, the coefficients of Y, Trade, MC, Credit and
Lang should be positively signed while P and Tax are expected to be negatively
signed. Dist, FT, CU and SA may be either positively or negatively signed.
A panel of annual data, covering the period 2000-2007 for twelve CARCOM and
eight OECD countries, is used. FDI data were taken from two sources: the
OECD’s data base, which gives FDI inflows and outflows of all OECD countries
to the rest of the world in millions of US dollars for the period 2000-2007 and
Trinidad & Tobago’s Balance of Payments Annual Report (2008). The OECD
countries represented are France, Germany, Hungary, Luxembourg, Mexico,
Netherlands, the UK and the US while the CARICOM countries are Antigua &
Barbuda, Bahamas, Barbados, Belize, Dominica, Grenada, Haiti, Jamaica, St.
15
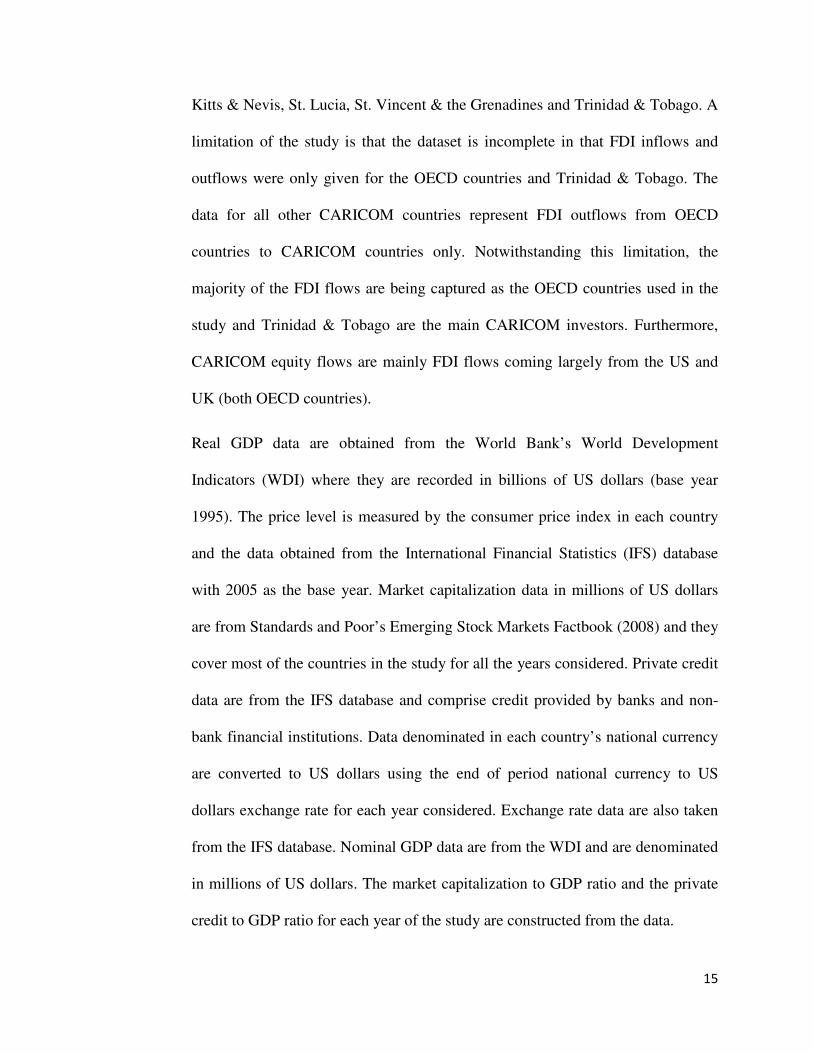
Kitts & Nevis, St. Lucia, St. Vincent & the Grenadines and Trinidad & Tobago. A
limitation of the study is that the dataset is incomplete in that FDI inflows and
outflows were only given for the OECD countries and Trinidad & Tobago. The
data for all other CARICOM countries represent FDI outflows from OECD
countries to CARICOM countries only. Notwithstanding this limitation, the
majority of the FDI flows are being captured as the OECD countries used in the
study and Trinidad & Tobago are the main CARICOM investors. Furthermore,
CARICOM equity flows are mainly FDI flows coming largely from the US and
UK (both OECD countries).
Real GDP data are obtained from the World Bank’s World Development
Indicators (WDI) where they are recorded in billions of US dollars (base year
1995). The price level is measured by the consumer price index in each country
and the data obtained from the International Financial Statistics (IFS) database
with 2005 as the base year. Market capitalization data in millions of US dollars
are from Standards and Poor’s Emerging Stock Markets Factbook (2008) and they
cover most of the countries in the study for all the years considered. Private credit
data are from the IFS database and comprise credit provided by banks and non-
bank financial institutions. Data denominated in each country’s national currency
are converted to US dollars using the end of period national currency to US
dollars exchange rate for each year considered. Exchange rate data are also taken
from the IFS database. Nominal GDP data are from the WDI and are denominated
in millions of US dollars. The market capitalization to GDP ratio and the private
credit to GDP ratio for each year of the study are constructed from the data.
16
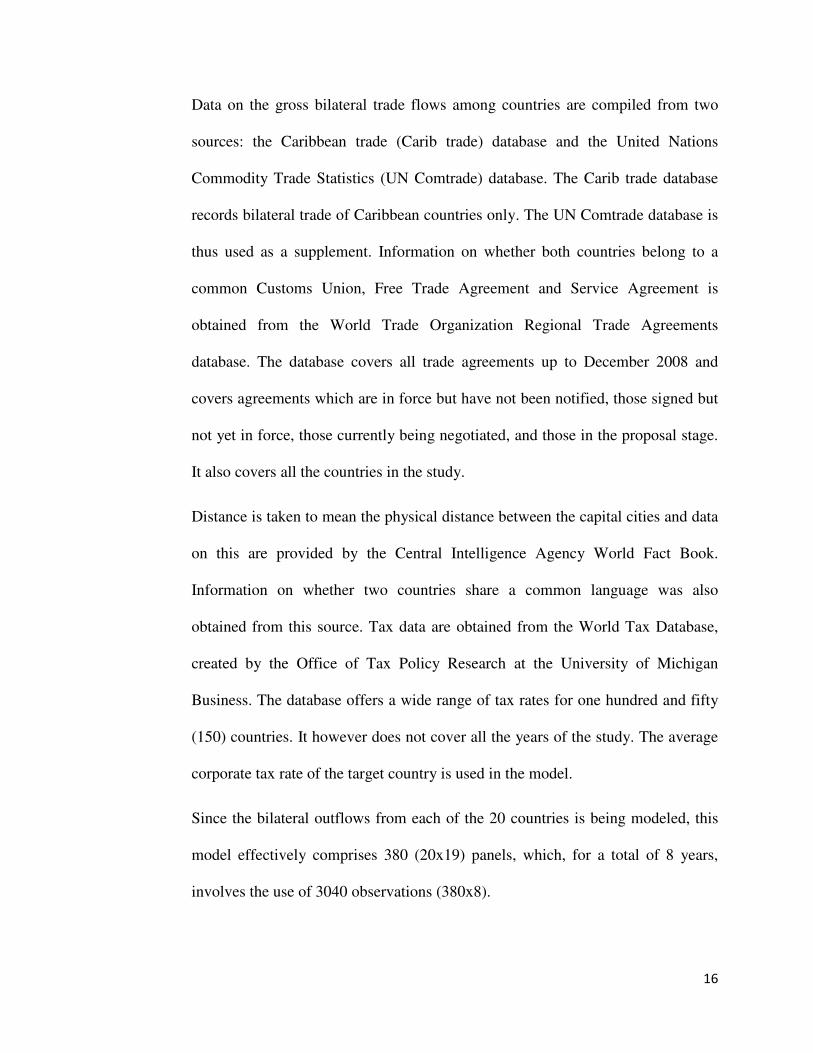
Data on the gross bilateral trade flows among countries are compiled from two
sources: the Caribbean trade (Carib trade) database and the United Nations
Commodity Trade Statistics (UN Comtrade) database. The Carib trade database
records bilateral trade of Caribbean countries only. The UN Comtrade database is
thus used as a supplement. Information on whether both countries belong to a
common Customs Union, Free Trade Agreement and Service Agreement is
obtained from the World Trade Organization Regional Trade Agreements
database. The database covers all trade agreements up to December 2008 and
covers agreements which are in force but have not been notified, those signed but
not yet in force, those currently being negotiated, and those in the proposal stage.
It also covers all the countries in the study.
Distance is taken to mean the physical distance between the capital cities and data
on this are provided by the Central Intelligence Agency World Fact Book.
Information on whether two countries share a common language was also
obtained from this source. Tax data are obtained from the World Tax Database,
created by the Office of Tax Policy Research at the University of Michigan
Business. The database offers a wide range of tax rates for one hundred and fifty
(150) countries. It however does not cover all the years of the study. The average
corporate tax rate of the target country is used in the model.
Since the bilateral outflows from each of the 20 countries is being modeled, this
model effectively comprises 380 (20x19) panels, which, for a total of 8 years,
involves the use of 3040 observations (380x8).
17
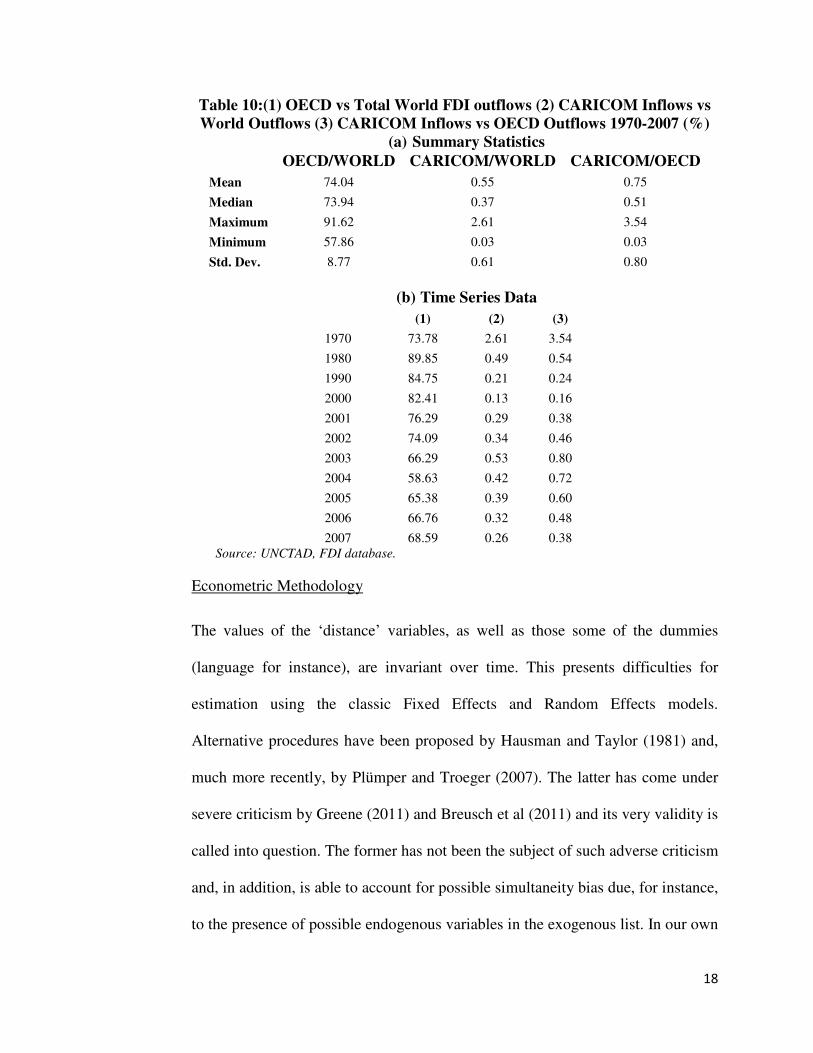
Table 10 (a)-(b) below shows some basic statistical information about the ratio of
OECD to world FDI outflows, of CARICOM FDI inflows to world FDI outflows
and of CARICOM FDI inflows to OECD FDI outflows. FDI outflows from
OECD countries account for a consistently large share of world flows over the
period 1970-2007: on average, they account for 74% of the total over the period,
with a maximum of 92% and a minimum of 58%. CARICOM inflows, on the
other hand, are a miniscule proportion of world outflows with an average of
0.55% over the period 1970-2007, a maximum of 2.61% and a minimum of
0.03%.
18
Table 10:(1) OECD vs Total World FDI outflows (2) CARICOM Inflows vs World Outflows (3) CARICOM Inflows vs OECD Outflows 1970-2007 (%)
(a) Summary Statistics OECD/WORLD CARICOM/WORLD CARICOM/OECD
Mean 74.04 0.55 0.75
Median 73.94 0.37 0.51
Maximum 91.62 2.61 3.54
Minimum 57.86 0.03 0.03
Std. Dev. 8.77 0.61 0.80
(b) Time Series Data
(1) (2) (3)
1970 73.78 2.61 3.54
1980 89.85 0.49 0.54
1990 84.75 0.21 0.24
2000 82.41 0.13 0.16
2001 76.29 0.29 0.38
2002 74.09 0.34 0.46
2003 66.29 0.53 0.80
2004 58.63 0.42 0.72
2005 65.38 0.39 0.60
2006 66.76 0.32 0.48
2007 68.59 0.26 0.38 Source: UNCTAD, FDI database.
Econometric Methodology
The values of the ‘distance’ variables, as well as those some of the dummies
(language for instance), are invariant over time. This presents difficulties for
estimation using the classic Fixed Effects and Random Effects models.
Alternative procedures have been proposed by Hausman and Taylor (1981) and,
much more recently, by Plümper and Troeger (2007). The latter has come under
severe criticism by Greene (2011) and Breusch et al (2011) and its very validity is
called into question. The former has not been the subject of such adverse criticism
and, in addition, is able to account for possible simultaneity bias due, for instance,
to the presence of possible endogenous variables in the exogenous list. In our own
19
model, two such are possible, Yi and Yj, given that they too may be a function of
the outflows. For this reason, the Hausman-Taylor estimator is used here. The
STATA routine, XTHTAYLOR, is used.
Analysis of results
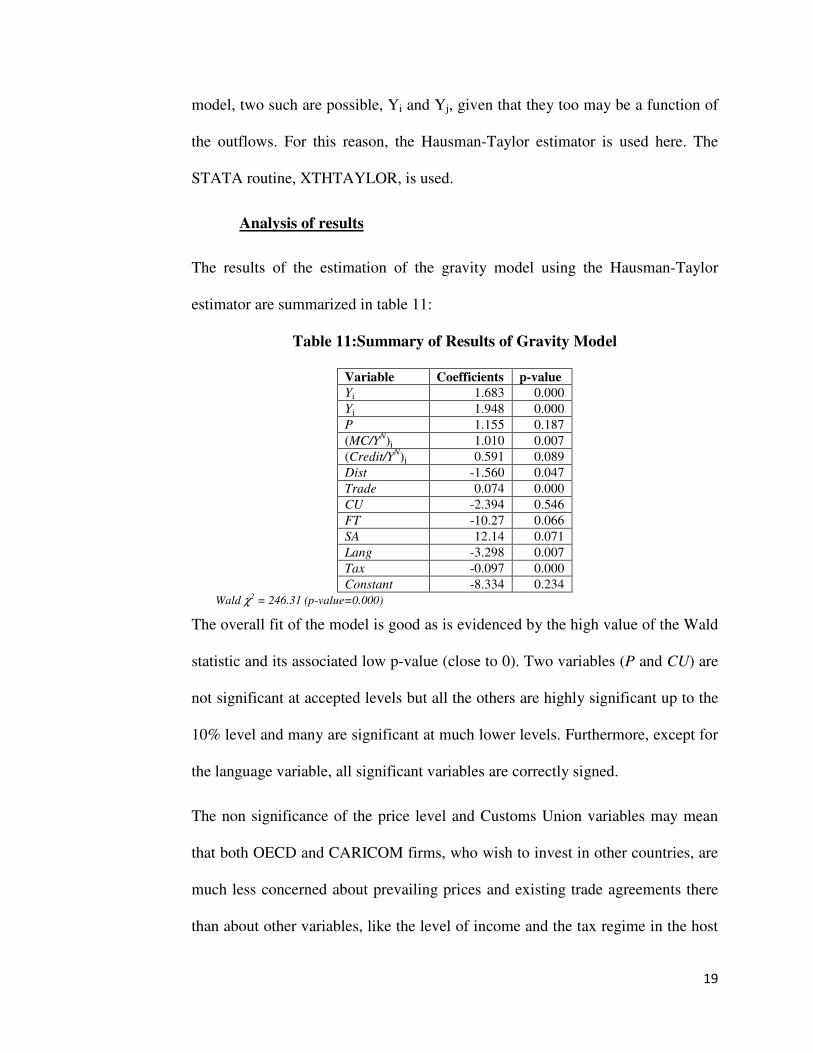
The results of the estimation of the gravity model using the Hausman-Taylor
estimator are summarized in table 11:
Table 11:Summary of Results of Gravity Model
Variable Coefficients p-value Yi 1.683 0.000
Yj 1.948 0.000
P 1.155 0.187
(MC/YN)j 1.010 0.007
(Credit/YN)j 0.591 0.089
Dist -1.560 0.047
Trade 0.074 0.000
CU -2.394 0.546
FT -10.27 0.066
SA 12.14 0.071
Lang -3.298 0.007
Tax -0.097 0.000
Constant -8.334 0.234 Wald χ2 = 246.31 (p-value=0.000)
The overall fit of the model is good as is evidenced by the high value of the Wald
statistic and its associated low p-value (close to 0). Two variables (P and CU) are
not significant at accepted levels but all the others are highly significant up to the
10% level and many are significant at much lower levels. Furthermore, except for
the language variable, all significant variables are correctly signed.
The non significance of the price level and Customs Union variables may mean
that both OECD and CARICOM firms, who wish to invest in other countries, are
much less concerned about prevailing prices and existing trade agreements there
than about other variables, like the level of income and the tax regime in the host
20
country. Di Giovanni (2005) also found trade agreements were not significant
(and negatively signed).
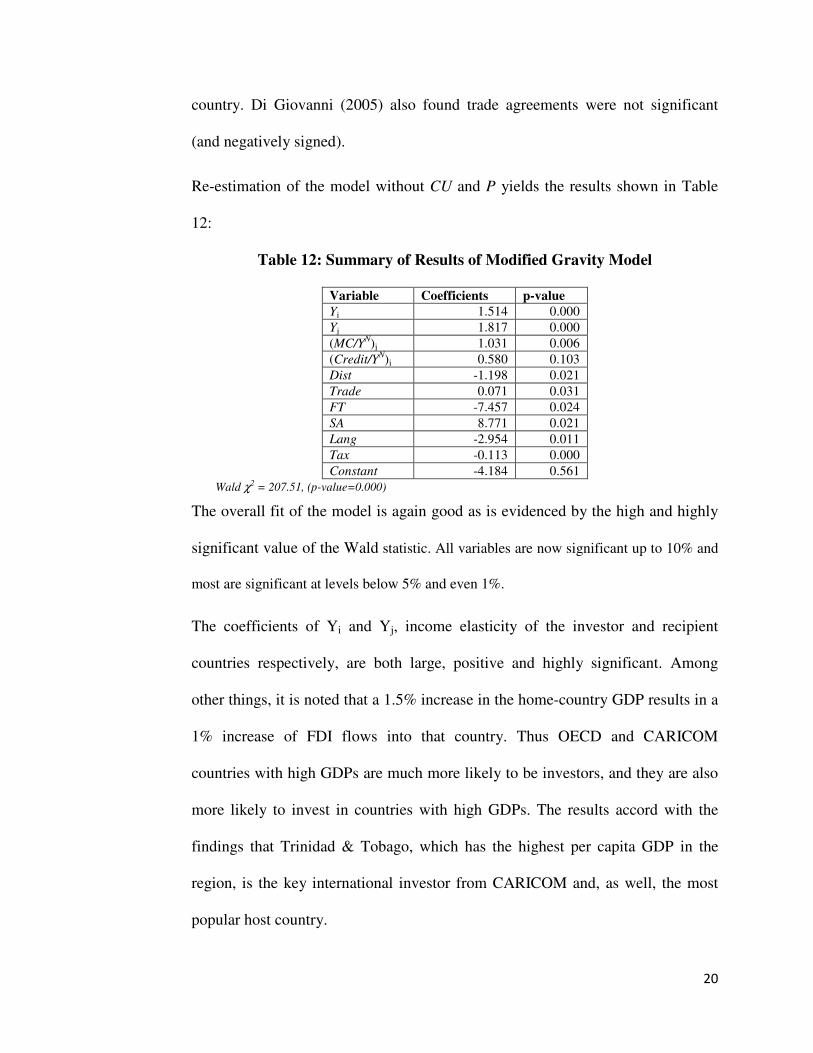
Re-estimation of the model without CU and P yields the results shown in Table
12:
Table 12: Summary of Results of Modified Gravity Model
Variable Coefficients p-value Yi 1.514 0.000
Yj 1.817 0.000
(MC/YN)j 1.031 0.006
(Credit/YN)j 0.580 0.103
Dist -1.198 0.021
Trade 0.071 0.031
FT -7.457 0.024
SA 8.771 0.021
Lang -2.954 0.011
Tax -0.113 0.000
Constant -4.184 0.561 Wald χ2 = 207.51, (p-value=0.000)
The overall fit of the model is again good as is evidenced by the high and highly
significant value of the Wald statistic. All variables are now significant up to 10% and
most are significant at levels below 5% and even 1%.
The coefficients of Yi and Yj, income elasticity of the investor and recipient
countries respectively, are both large, positive and highly significant. Among
other things, it is noted that a 1.5% increase in the home-country GDP results in a
1% increase of FDI flows into that country. Thus OECD and CARICOM
countries with high GDPs are much more likely to be investors, and they are also
more likely to invest in countries with high GDPs. The results accord with the
findings that Trinidad & Tobago, which has the highest per capita GDP in the
region, is the key international investor from CARICOM and, as well, the most
popular host country.
21
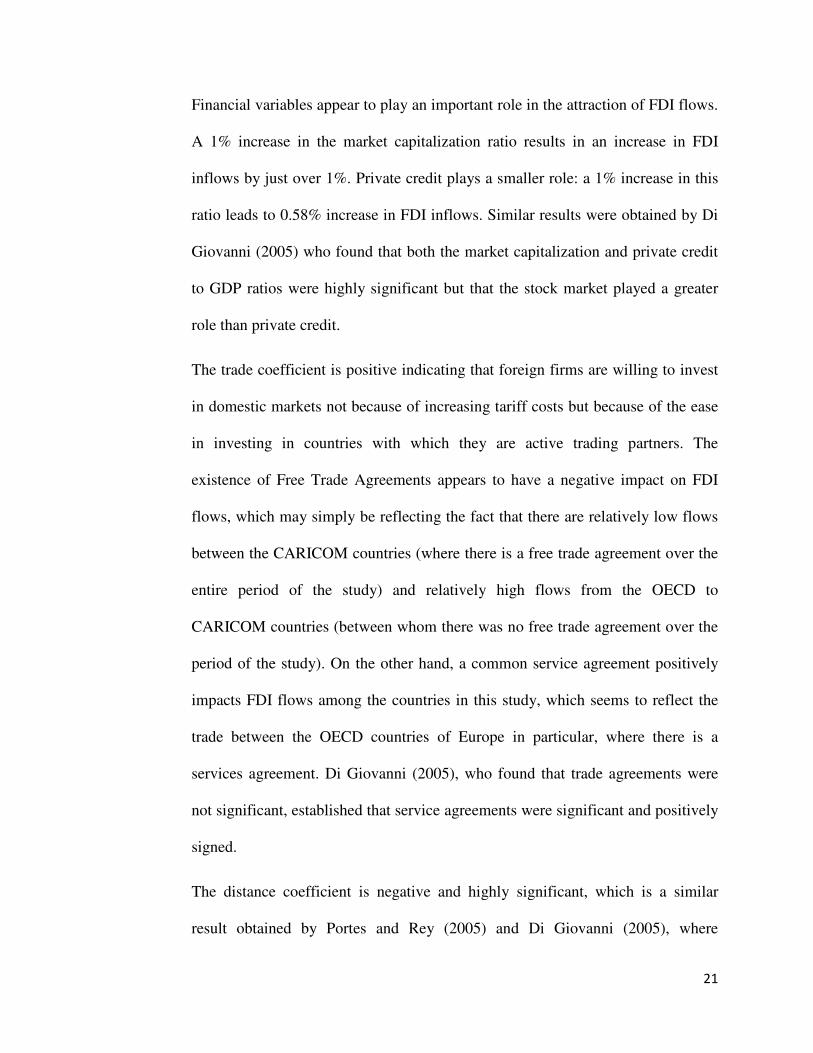
Financial variables appear to play an important role in the attraction of FDI flows.
A 1% increase in the market capitalization ratio results in an increase in FDI
inflows by just over 1%. Private credit plays a smaller role: a 1% increase in this
ratio leads to 0.58% increase in FDI inflows. Similar results were obtained by Di
Giovanni (2005) who found that both the market capitalization and private credit
to GDP ratios were highly significant but that the stock market played a greater
role than private credit.
The trade coefficient is positive indicating that foreign firms are willing to invest
in domestic markets not because of increasing tariff costs but because of the ease
in investing in countries with which they are active trading partners. The
existence of Free Trade Agreements appears to have a negative impact on FDI
flows, which may simply be reflecting the fact that there are relatively low flows
between the CARICOM countries (where there is a free trade agreement over the
entire period of the study) and relatively high flows from the OECD to
CARICOM countries (between whom there was no free trade agreement over the
period of the study). On the other hand, a common service agreement positively
impacts FDI flows among the countries in this study, which seems to reflect the
trade between the OECD countries of Europe in particular, where there is a
services agreement. Di Giovanni (2005), who found that trade agreements were
not significant, established that service agreements were significant and positively
signed.
The distance coefficient is negative and highly significant, which is a similar
result obtained by Portes and Rey (2005) and Di Giovanni (2005), where
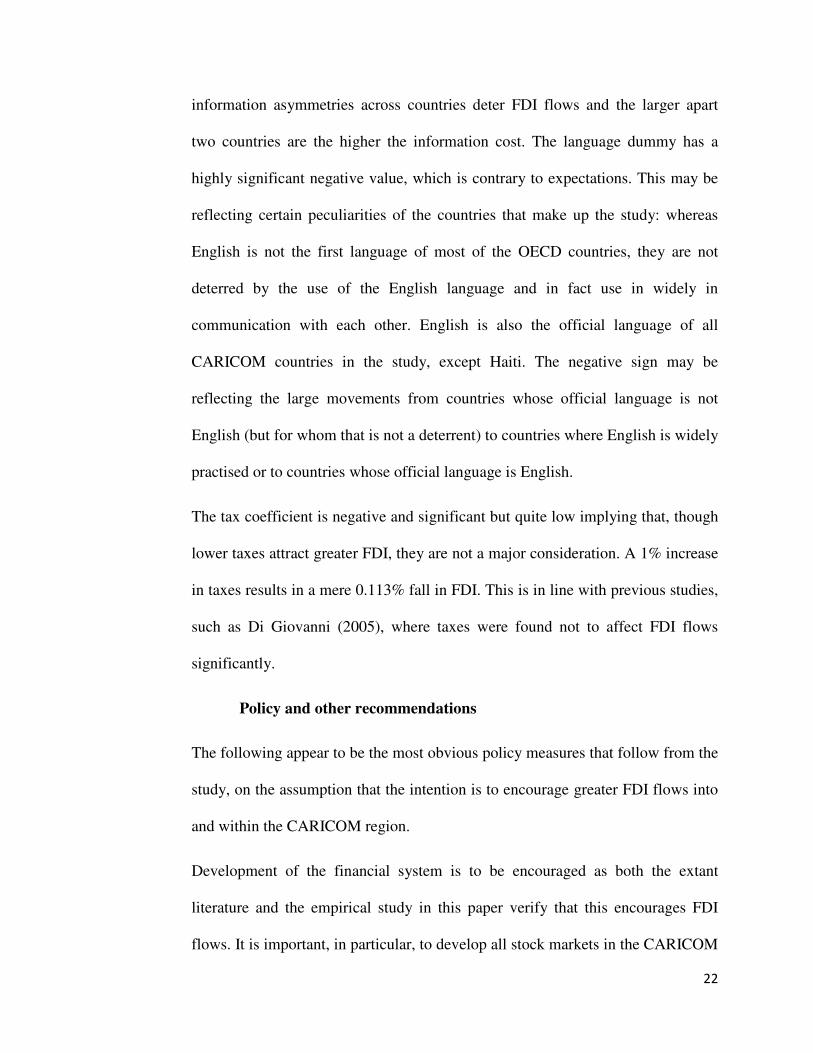
22
information asymmetries across countries deter FDI flows and the larger apart
two countries are the higher the information cost. The language dummy has a
highly significant negative value, which is contrary to expectations. This may be
reflecting certain peculiarities of the countries that make up the study: whereas
English is not the first language of most of the OECD countries, they are not
deterred by the use of the English language and in fact use in widely in
communication with each other. English is also the official language of all
CARICOM countries in the study, except Haiti. The negative sign may be
reflecting the large movements from countries whose official language is not
English (but for whom that is not a deterrent) to countries where English is widely
practised or to countries whose official language is English.
The tax coefficient is negative and significant but quite low implying that, though
lower taxes attract greater FDI, they are not a major consideration. A 1% increase
in taxes results in a mere 0.113% fall in FDI. This is in line with previous studies,
such as Di Giovanni (2005), where taxes were found not to affect FDI flows
significantly.
Policy and other recommendations
The following appear to be the most obvious policy measures that follow from the
study, on the assumption that the intention is to encourage greater FDI flows into
and within the CARICOM region.
Development of the financial system is to be encouraged as both the extant
literature and the empirical study in this paper verify that this encourages FDI
flows. It is important, in particular, to develop all stock markets in the CARICOM
23
region through the listing of more local companies. Both the literature studied and
the empirical study show that FDI flows increase with increasing market
capitalization. This may require interventions to lower listing fees which would
have the effect of encouraging more listings (and even cross-listings) and,
consequently, more FDI activity in the form of mergers and acquisitions. It may
also require interventions at the level of families who own most of the businesses
that may be listed.
The fact that each domestic stock exchange is at a different level of development
may also pose another hindrance to FDI flows, particularly within the CARICOM
region. It is therefore necessary that all exchanges be brought to the same level of
sophistication. Special efforts must be made to develop the less active exchanges
(Suriname, Haiti, Guyana and Belize), including the introduction of electronic
trading platforms, since it has been shown that FDI activity in the region is
favoured when the exchanges are at a similar level of sophistication. All
exchanges must then work closely together to attract more firms to list and by
extension cross-list.
Listing and cross-listing of stocks may not be the only way to encourage
CARICOM FDI flows. Cross-listing, for instance, takes various forms and
CARICOM firms have to date engaged mainly in ordinary listing whereby a firm
lists its shares for trading on at least two exchanges (its domestic exchange and a
foreign exchange). To increase intra-regional flows, CARICOM countries have to
implement modern trading systems.
24
Governments of the region should aim at a friendlier tax regime since both the
study of the literature and this study show that FDI flows increase in the presence
of lower taxes.
Finally, the Central Banks of the region must take steps to develop procedures for
recording the inflows, by country of origin, and outflows, by country of
destination, of both portfolio and foreign direct investment. This would ensure
empirical testing in the future to better understand these flows.
Conclusion
This study provides evidence about the nature and pattern of CARICOM FDI
flows and provides an explanation for FDI flows between OECD and CARICOM
countries. FDI inflows come mainly from the US and the UK and intra-regional
FDI outflows originate mainly from Trinidad & Tobago followed by the Bahamas
and Jamaica. Trinidad & Tobago is also the key recipient of FDI inflows followed
by the Bahamas and Jamaica.
Growth in GDP will go a long way to improving the levels of cross-border flows.
The financial systems and private credit facilities must be expanded and
oppressive tax regimes avoided. International trade must also be encouraged and
further enhanced though not necessarily through trade agreements.
References
Bissember, E.1997. A Regional Capital Market.Paper presented at the Annual
Monetary Studies Conference, Caribbean Centre for Monetary Studies, October
1997
25
Blonigen, B.A., R.B. Davies. and K. Head. 2003. Estimating the Knowledge-
Capital Model of the Multinational Enterprise. American Economic Review. 93:
980-94.
Brainard, S.L. 1997. An Empirical Assessment of the Proximity-Concentration
Trade-Off Between Multinational Sales and Trade. American Economic Review.
87(4): 520-44.
Breusch, T., M.B.Ward, M. H. Nguyen and T.Kompas.2011. On the Fixed Effects
Vector decomposition. Political Analysis. 19(2): 123-134.
Buch, C. and G. DeLong.2004. Cross-border Bank Mergers: What lures the rare
animal? Journal of Banking & Finance. 28(9): 2077-2102.
Caribbean Trade and Investment Report 2005: Corporate Integration and Cross-
border Development. Caribbean Community (CARICOM) Secretariat. Available
online:
http://www.caricom.org/jsp/community/regional_issues/ctir2005_index.jsp.
Carr, D.L., J.R. Markusen and K.E. Maskus. 2001. Estimating the Knowledge-
Capital model of the Multinational Enterprise. American Economic Review. 91(3):
693-708.
Craigwell, R. 2006. Foreign Direct Investment and Employment in the English
and Dutch-Speaking Caribbean. Project prepared for ILO, Trinidad and Tobago.
Di Giovanni, J. 2005. What Drives Capital Flows? The case of cross-border
merger and acquisition activity and financial deepening.Journal of International
Economics.65: 127-149.
Froot, K.A. and J.C. Stein. 1991 Exchange Rates and Foreign Direct Investment:
An Imperfect Capital Markets Approach, Quarterly Journal of Economics.106:
1191-1217.
26
Grabel,I. 1999. Emerging Stock Markets and Third World development: The
Post-Keynesian Case of Pessimism. Foundations of International Economics.
Greene, W. H. 2011. Fixed Effects Vector Decomposition: A Magical Solution to
the Problem of Time Invariant Variables in Fixed Effects Models?Political
Analysis. 19(2): 135-146.
Grosse, R. and L.J. Trevino.1996. Foreign Direct Investment in the United States:
an Analysis by Country of Origin. Journal of World Business. 39(3): 233-243.
Harrison, P. 2005. Expert Meeting on Capacity Building in the Area of FDI: Data
Compilation and Policy Formulation in Developing Countries. Caribbean
Community, Guyana. http://www.unctad.org/en/docs//c2em18d3_en.pdf
Hausman.J. and W.Taylor. 1981. Panel Data and Unobservable Individual
Effects. Econometrica. 49(6): 1377-1398.
Hijzen, A., H. Gorg and M. Manchin. 2007. Cross-border Mergers and
Acquisitions and the Role of Trade Costs. European Economic Review. 52(5):
849–866.
Markusen, J.R. 2002. Multinational Firms and the Theory of International Trade.
The MIT Press, Cambridge.
Portes, R., R. Rey and Y. Oh. 2001. Information and Capital flows: The
determinants of transactions in financial assets. European Economic Review. 45:
783-796.
Portes, R. and R. Rey. 2005. The Determinants of Cross border Equity Flows.
Journal of International Economics.65: 269- 296.
27
Plümper, T. and V. Troeger. 2007. Efficient Estimation of Time-Invariant and
Rarely Changing Variables in Panel Data Analysis with UnitFixed
Effects.Political Analysis. 15(2): 124-139.
Rambarran, J. and C. Elbourne. 2006. Caribbean Mergers and Acquisitions
Recent Experiences and Lessons. Paper Presented at the Annual Monetary
Studies Conference, Caribbean Centre for Monetary Studies, October 2006.
Russell, P. and G.Khan. 1996 .Mergers and Acquisitions in the Financial Sector:
some issues and lessons for the Caribbean. Paper Presented at the Annual
Monetary Studies Conference, Caribbean Centre for Monetary Studies, October
1996.
Tesar, L.L. and I.M. Werner.1994. International Equity Transactions and U.S.
Portfolio Choice. Working paper 4611.National Bureau of Economic Research.
UNCTAD. 2009. World Investment Report, 2002-2009.
http://www.unctad.org/Templates/Page.asp?intItemID=1465
World Bank. 2010. World Development Indicators. The World Bank
Worrell, D. and J. Jhinkoo. 2008.The Extent of Financial Integration within
CARICOM. Paper Presented at the Annual Monetary Studies Conference,
Caribbean Centre for Money and Finance, November 2008.