Embed Size (px)
Citation preview
C A R F W o r k i n g P a p e r
CARF is presently supported by Bank of Tokyo-Mitsubishi UFJ, Ltd., Citigroup, Dai-ichi Mutual Life Insurance Company, Meiji Yasuda Life Insurance Company, Nippon Life Insurance Company, Nomura Holdings, Inc. and Sumitomo Mitsui Banking Corporation (in alphabetical order). This financial support enables us to issue CARF Working Papers.
CARF Working Papers can be downloaded without charge from: http://www.carf.e.u-tokyo.ac.jp/workingpaper/index.cgi
Working Papers are a series of manuscripts in their draft form. They are not intended for circulation or distribution except as indicated by the author. For that reason Working Papers may not be reproduced or distributed without the written consent of the author.
CARF-F-259
Japan’s Deleveraging since the 1990s and the Bank of Japan’s Monetary Policy: Some Comparisons with the U.S. Experience
since 2007
Kazuo Ueda The University of Tokyo
December 2011
1
December 2011
Japan’s Deleveraging since the 1990s and the Bank of Japan’s
Monetary Policy: Some Comparisons with the U.S. Experience since 2007
By Kazuo Ueda
This paper discusses the backgrounds for the stagnant behavior of the Japanese
economy during the last two decades and the failure of the Bank of Japan (BOJ) to turn
the economy around. I argue that the policy authorities did not act quickly enough to
mitigate the pain of the deleveraging process in the aftermath of the burst of land and
stock price bubble in the early 1990s. Thus, the process became overly severe and
protracted. The economy increasingly became vulnerable to negative external shocks
and the decline in its population. Use of non-conventional monetary policy measures
after deflationary expectations became entrenched substantially weakened their power
to stimulate the economy. The U.S. economy since 2007 has exhibited many of the
features seen for the Japanese economy during the last two decades; hence, the talk of
the Japanization of the U.S. economy. There are, however, many dissimilarities as well
as similarities between the two episodes. These are also discussed along with the
analysis of Japan’s two lost decades.
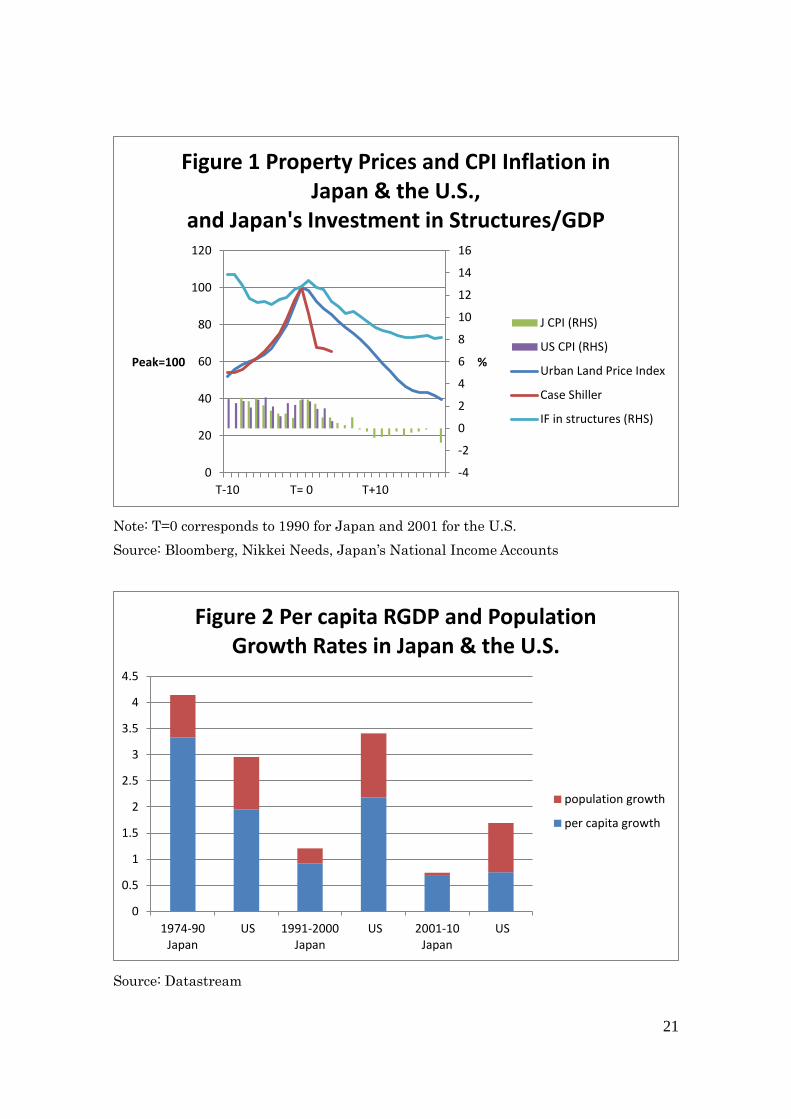
Popular discussions of Japan’s stagnation often focus on persistent deflation.
Figure 1 shows core CPI inflation and a representative property price index for Japan
and the U.S. since the peak of property prices, with the peak (T=0) assumed to be 1990
for Japan and 2006 for the U.S. In addition, it also plots investment in structures relative
to GDP in Japan.
Inflation in Japan has been in negative territory since 1998.1 There has been,
however, no tendency for the deflation to accelerate. The cumulative decrease in the
index since the late 1990s has been only about 5%. Thus, the classic debt-deflation type
dynamic has not been a major cause of economic stagnation. In contrast, declines in
property prices in Japan since the peak has been large and protracted—cumulating in a
60% decline at the time of writing. They led to significant deleveraging by financial
institutions and non-financial corporations, which put downward pressure on aggregate
demand for goods and services, especially, investment in structures, the component of
aggregate demand most sensitive to property prices. The figure shows that its
1 Japan’s CPI has been adjusted to purge the effects of the consumption tax rate hikes
in 1989 and 1997.
2
movements have been highly correlated with those of property prices.2 As may be seen
from the figure, this component of aggregate demand alone subtracted about 0.4% per
year from GDP growth during the 1990s. Such a negative feedback loop among asset
prices, economic activity and, as we discuss below, financial instability has been the key
feature of Japan’s stagnation. It is also interesting to note that both CPI inflation and
property prices in the U.S. since the recent financial crisis have followed closely that of
Japan in the 1990s, but inflation has so far avoided plunging into negative territory.
Adjustment in asset prices and real investment were to some extent inevitable
given the extent of the excesses created during the bubble period. The deleveraging
process, however, became extremely protracted as a result of a forbearance game played
by policymakers and financial institutions. Banks kept lending for a while to zombie
companies in order to avoid recognition of losses on their balance sheets, and the
authority stayed away for years from making the tough decision to recapitalize the
banks. This resulted in a huge buildup of bad loans and eventually in a serious credit
crunch in the late 1990s, which aggravated the declines in asset prices and deleveraging
by banks and nonfinancial corporations. Banks increasingly became risk averse and
stopped lending to risky, but promising projects. The economy slowly, but steadily lost
momentum and could not grow out of the negative shocks generated by external
financial crises in the late 1990s and 2000s, and the declines in its population that
started in the 2000s.
Deflation of the general price level did play a part in this process as well. It has
hindered the effectiveness of monetary easing. This is ironic because monetary policy
normally is a tool for avoiding deflation. Either the deleveraging forces outweighed the
capacity of monetary policy to stimulate the economy or the BOJ easing came a bit too
late. The BOJ tried to reverse the disinflation trend with fairly aggressive rate cuts—a
conventional monetary policy tool-- and brought the policy rate to near zero by late
1995, effectively hitting the zero lower bound (ZLB) constraint on interest rates.
Deflation, however, developed in response to economic weakness. The real interest rate
has stayed at higher levels than desirable, and undermined the power of a zero interest
rate to stimulate the economy, although it did not throw the economy into a deflationary
spiral. Since the late 1990s, the BOJ has adopted a variety of non-conventional
2 Investment in structures in the figure includes that by the government. There is no
good data to separate this component out. Assuming, however, that all investment by
the general government is investment in structures, an estimate of investment in
structures by private firms is obtained. It shows a similar, but slightly larger decline
during the 1990s, while it hits a bottom in the early 2000s and increases marginally
toward the late 2000s. This is due to the government’s policy to reduce public
investment in the 2000s.
3
monetary policy measures. They have supported the financial system and prevented
deflation from becoming worse, but have not turned the economy around. As I argue
below, non-conventional measures work by reducing risk premiums and long-short
interest rate spreads. The long period of economic stagnation had lowered these spreads
to minimum levels and limited the effectiveness of such measures as was the case for
conventional measures.
In the following I will describe in more detail the deleveraging experience in
Japan and then turn to discussing the experience of the BOJ to turn the economy around.
Comparisons with the U.S. experience since 2007 are offered at each stage of the
discussion.
1, Deleveraging in Japan during the Last Two Decades
Declines in Economic Growth and Productivity
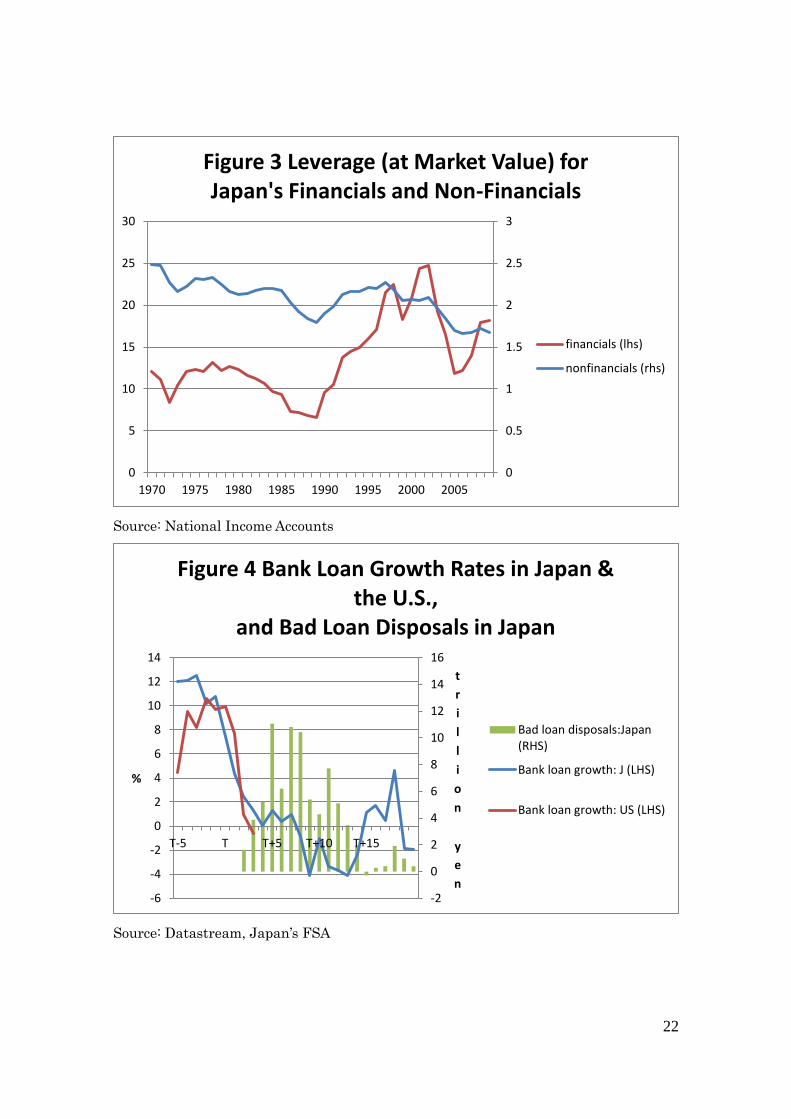
Figure 2 presents the average growth rate of per capita real GDP and population,
thus, also of aggregate real GDP, for Japan and the U.S. during three sub-periods since
the early 1970s. Japan’s aggregate growth rate declined sharply during the 1990s and
2000s. Regarding this, let us first note the sharp decline in the growth rate of labor
productivity, that is, the growth rate of per capita real GDP during the 1990s and 2000s.
Productivity in the 1990s and 2000s grew at a speed of less than one third of that in the
1974-1990 period. Secondly, population growth also declined sharply in the 1990s and
came to a halt in the 2000s, also contributing to the decrease in the growth of aggregate
real GDP. Hayashi and Prescott (2002) are among those who point out that declines in
total factor productivity growth was the major cause of Japan’s economic stagnation in
the 1990s. In their work, however, the reason for the decline in productivity growth is
not analyzed.
It is interesting to note that the difference in aggregate GDP growth rates between
Japan and the U.S. in the 2000s came almost entirely from that in population growth
rates. Put differently, the 2000s may have been a lost decade for the U.S. as well. It saw
a fairly serious recession in the early 2000s and the so-called great recession in the late
2000s. It is quite possible that the weakness of the U.S. economy was a factor behind
that of the Japanese economy during the period.
Asset Price Declines, Deleveraging and Forbearance Policy
As argued above, it is the declines in asset prices rather than consumer prices that
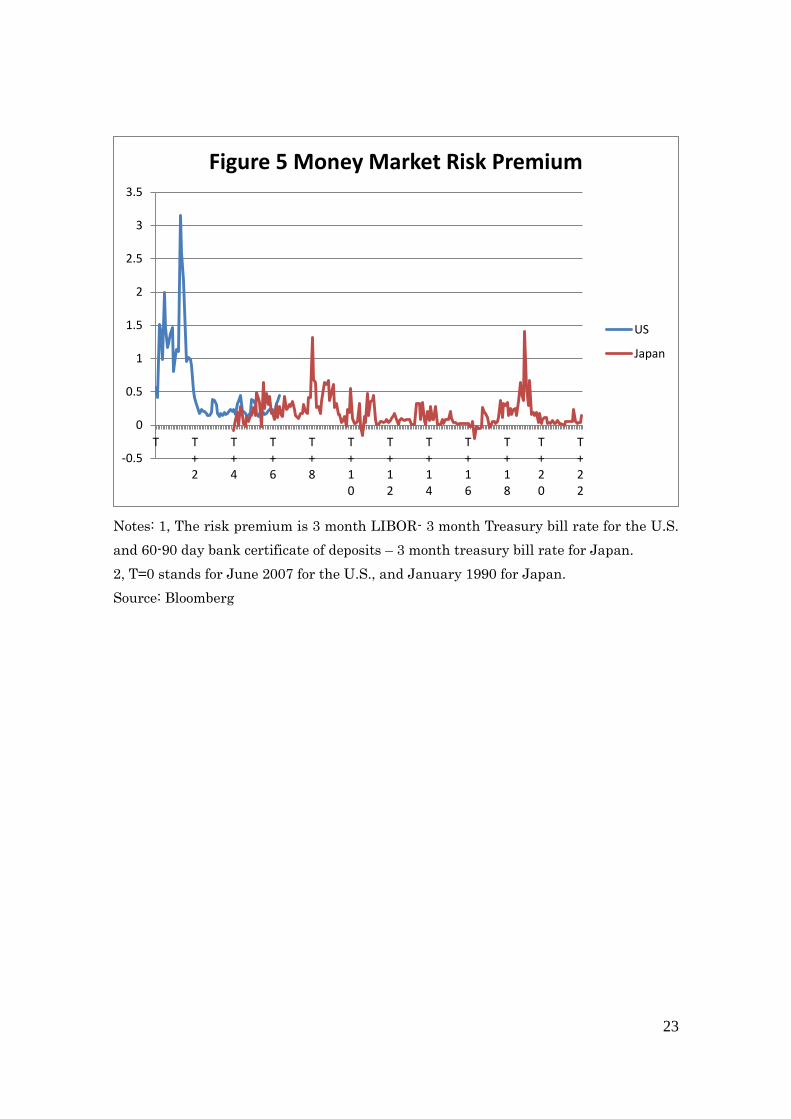
have generated serious negative effects on the Japanese economy. Figure 3 presents
4
estimates of the market value based leverage ratio for financials and non-financials.3
For both sectors, the ratio declined through the 1980s as stock and land prices increased.
The movement was reversed in the 1990s in response to the collapse in asset prices and,
in the banks’ case, to increased bad loan write-offs.4 The increases in leverage during
this period were, of course, unintentional; players in both sectors were attempting to
deleverage, but were overwhelmed by further declines in asset prices. Banks sold stocks
in net terms in large amounts in late 1990 toward early 1991 and then again for a
prolonged period between 1996 and 2006. Non-financials were net sellers of land in the
mid to late 1990s.5 Such sales obviously added to the declines in asset prices and made
the deleveraging process severe—a process observed again during 2007-09 in the U.S.
concerning many financial instruments. The resulting sharp increase in leverage for
financials, in particular, meant a corresponding decline in capital ratios and constrained
their risk taking behavior severely. Here, we already see a negative loop between
financial stability and asset prices. Leverage finally started to decrease in the late 1990s
for non-financials and in the early 2000s for financials. It had been an amazingly long
deleveraging process.
Despite the immediate effect on their balance sheets of the fall in stock prices and
their prospective deterioration through loans to property related sectors, banks’
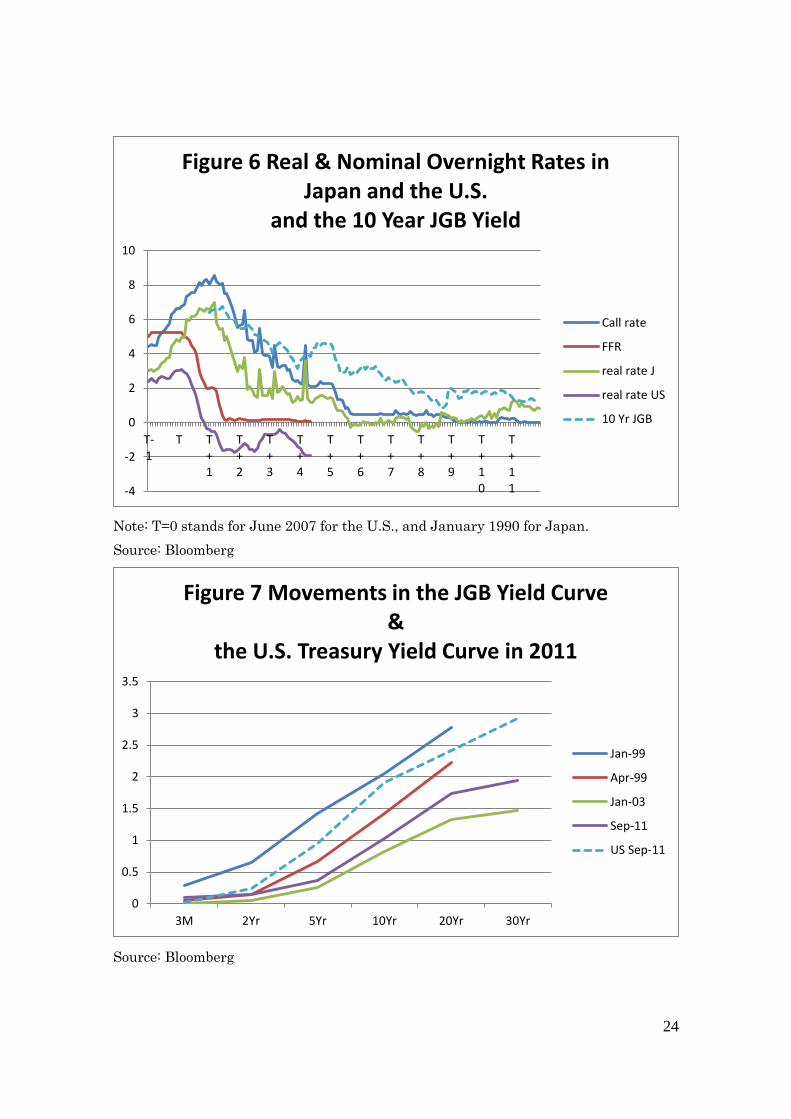
responses were limited in the early 1990s. Figure 4 shows bank loan growth rates before
and after the collapse in asset prices and the amount of bad loan disposals by Japan’s
large banks. The recent behavior of U.S. bank lending is also shown.6 Bank loan
growth in Japan fell sharply in the early 1990s, but stayed in positive territory until the
late 1990s. In fact, banks were still supporting zombie companies by rolling over loans.
Banks became earnest in bad loan disposal in year 1995 (=year T+5) onwards. By this
time bad loans probably had become much larger than would have been the case had
they been addressed in the early 1990s. The U.S. bank loan growth rate has followed
Japan’s pattern quite closely so far in a similar way to the movement in property prices,
which is suggestive of severe deleveraging taking place in the real sector.
Why was the response of Japanese banks so slow? The introduction of the BIS
3 The data are from Japan’s National Income Accounts. Unfortunately, financials
include broker-dealers, insurance companies and pension funds, in addition to deposit
taking banks. 4 Both banks and non-financial firms have held large amounts of equities.
Non-financial firms also have held real estate, while banks’ exposure to real estate has
been mainly through real estate related lendings. 5 See Figure A1 in the online Appendix. 6 In this chart the peak of asset prices in the U.S. is assumed to be 2007, the year the
stock prices peaked.
5
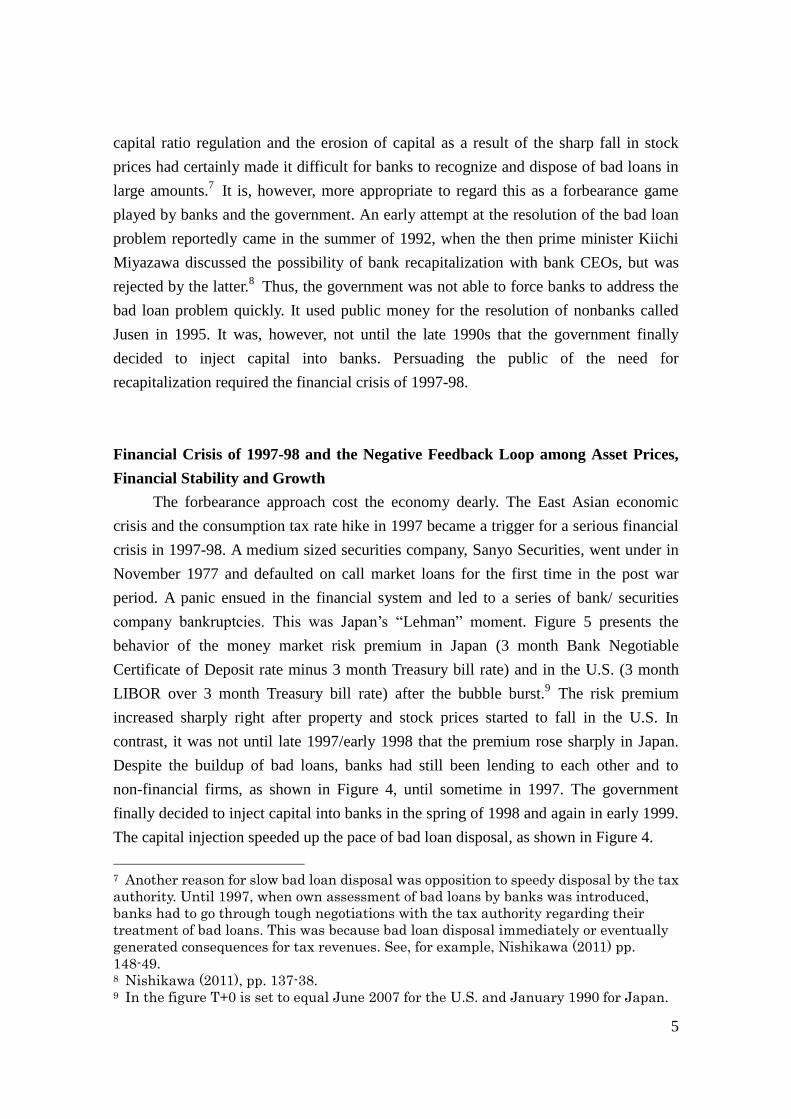
capital ratio regulation and the erosion of capital as a result of the sharp fall in stock
prices had certainly made it difficult for banks to recognize and dispose of bad loans in
large amounts.7 It is, however, more appropriate to regard this as a forbearance game
played by banks and the government. An early attempt at the resolution of the bad loan
problem reportedly came in the summer of 1992, when the then prime minister Kiichi
Miyazawa discussed the possibility of bank recapitalization with bank CEOs, but was
rejected by the latter.8 Thus, the government was not able to force banks to address the
bad loan problem quickly. It used public money for the resolution of nonbanks called
Jusen in 1995. It was, however, not until the late 1990s that the government finally
decided to inject capital into banks. Persuading the public of the need for
recapitalization required the financial crisis of 1997-98.
Financial Crisis of 1997-98 and the Negative Feedback Loop among Asset Prices,
Financial Stability and Growth
The forbearance approach cost the economy dearly. The East Asian economic
crisis and the consumption tax rate hike in 1997 became a trigger for a serious financial
crisis in 1997-98. A medium sized securities company, Sanyo Securities, went under in
November 1977 and defaulted on call market loans for the first time in the post war
period. A panic ensued in the financial system and led to a series of bank/ securities
company bankruptcies. This was Japan’s “Lehman” moment. Figure 5 presents the
behavior of the money market risk premium in Japan (3 month Bank Negotiable
Certificate of Deposit rate minus 3 month Treasury bill rate) and in the U.S. (3 month
LIBOR over 3 month Treasury bill rate) after the bubble burst.9 The risk premium
increased sharply right after property and stock prices started to fall in the U.S. In
contrast, it was not until late 1997/early 1998 that the premium rose sharply in Japan.
Despite the buildup of bad loans, banks had still been lending to each other and to
non-financial firms, as shown in Figure 4, until sometime in 1997. The government
finally decided to inject capital into banks in the spring of 1998 and again in early 1999.
The capital injection speeded up the pace of bad loan disposal, as shown in Figure 4.
7 Another reason for slow bad loan disposal was opposition to speedy disposal by the tax
authority. Until 1997, when own assessment of bad loans by banks was introduced,
banks had to go through tough negotiations with the tax authority regarding their
treatment of bad loans. This was because bad loan disposal immediately or eventually
generated consequences for tax revenues. See, for example, Nishikawa (2011) pp.
148-49. 8 Nishikawa (2011), pp. 137-38. 9 In the figure T+0 is set to equal June 2007 for the U.S. and January 1990 for Japan.
6
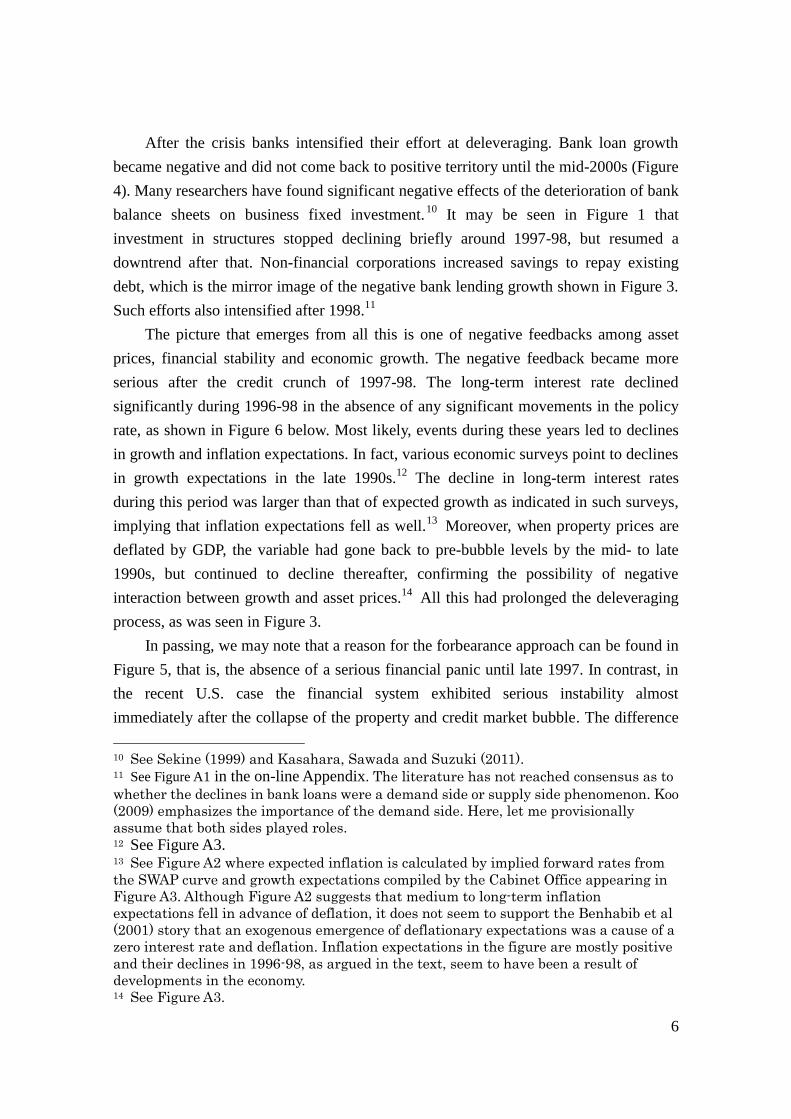
After the crisis banks intensified their effort at deleveraging. Bank loan growth
became negative and did not come back to positive territory until the mid-2000s (Figure
4). Many researchers have found significant negative effects of the deterioration of bank
balance sheets on business fixed investment.10
It may be seen in Figure 1 that
investment in structures stopped declining briefly around 1997-98, but resumed a
downtrend after that. Non-financial corporations increased savings to repay existing
debt, which is the mirror image of the negative bank lending growth shown in Figure 3.
Such efforts also intensified after 1998.11
The picture that emerges from all this is one of negative feedbacks among asset
prices, financial stability and economic growth. The negative feedback became more
serious after the credit crunch of 1997-98. The long-term interest rate declined
significantly during 1996-98 in the absence of any significant movements in the policy
rate, as shown in Figure 6 below. Most likely, events during these years led to declines
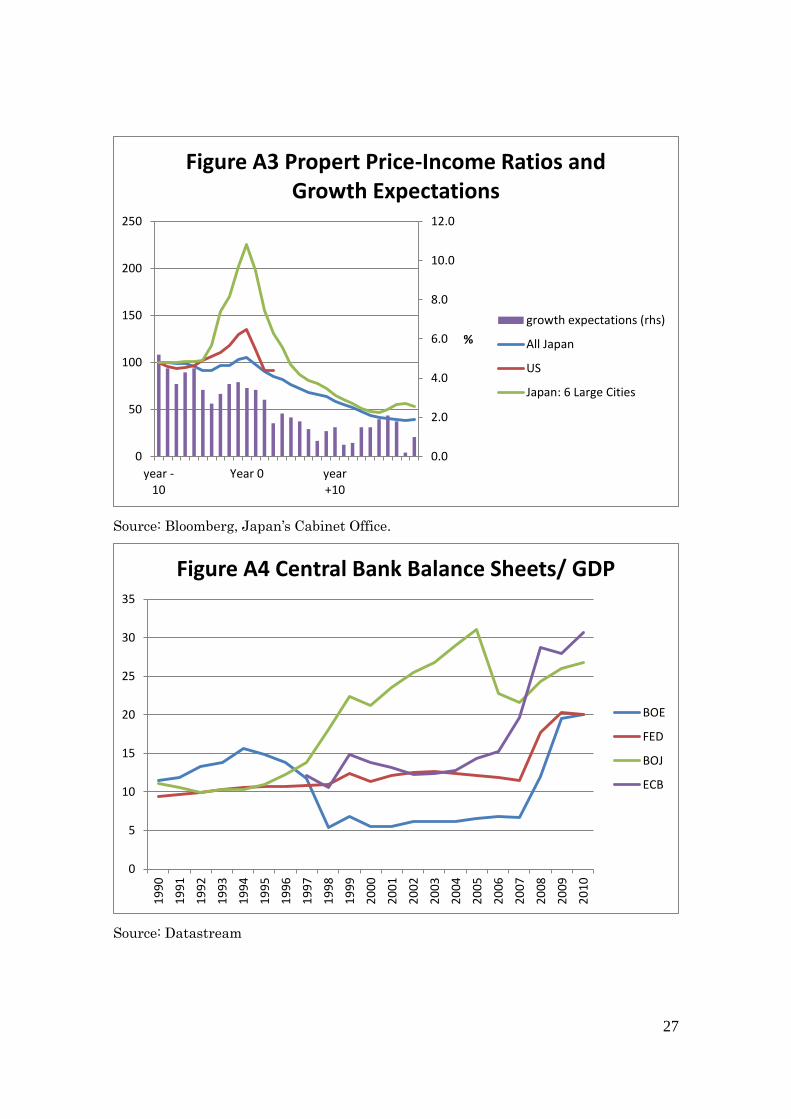
in growth and inflation expectations. In fact, various economic surveys point to declines
in growth expectations in the late 1990s.12
The decline in long-term interest rates
during this period was larger than that of expected growth as indicated in such surveys,
implying that inflation expectations fell as well.13
Moreover, when property prices are
deflated by GDP, the variable had gone back to pre-bubble levels by the mid- to late
1990s, but continued to decline thereafter, confirming the possibility of negative
interaction between growth and asset prices.14
All this had prolonged the deleveraging
process, as was seen in Figure 3.
In passing, we may note that a reason for the forbearance approach can be found in
Figure 5, that is, the absence of a serious financial panic until late 1997. In contrast, in
the recent U.S. case the financial system exhibited serious instability almost
immediately after the collapse of the property and credit market bubble. The difference
10 See Sekine (1999) and Kasahara, Sawada and Suzuki (2011). 11 See Figure A1 in the on-line Appendix. The literature has not reached consensus as to
whether the declines in bank loans were a demand side or supply side phenomenon. Koo
(2009) emphasizes the importance of the demand side. Here, let me provisionally
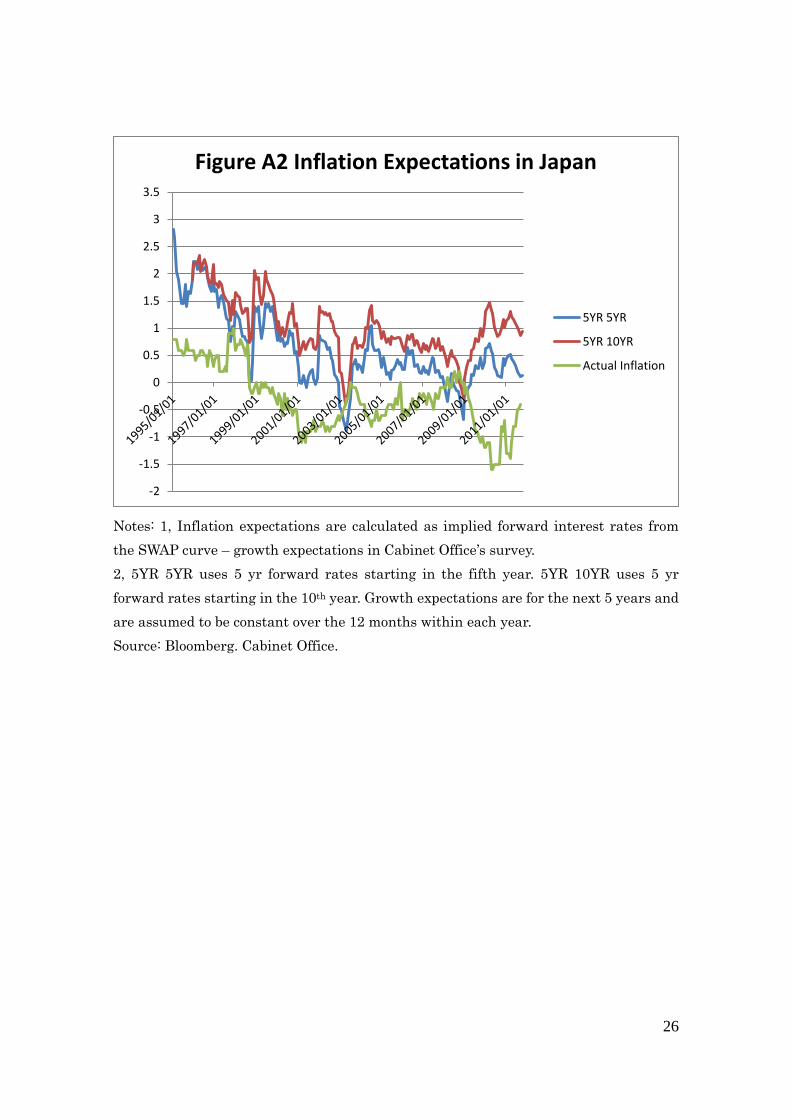
assume that both sides played roles. 12 See Figure A3. 13 See Figure A2 where expected inflation is calculated by implied forward rates from
the SWAP curve and growth expectations compiled by the Cabinet Office appearing in
Figure A3. Although Figure A2 suggests that medium to long-term inflation
expectations fell in advance of deflation, it does not seem to support the Benhabib et al
(2001) story that an exogenous emergence of deflationary expectations was a cause of a
zero interest rate and deflation. Inflation expectations in the figure are mostly positive
and their declines in 1996-98, as argued in the text, seem to have been a result of
developments in the economy. 14 See Figure A3.
7
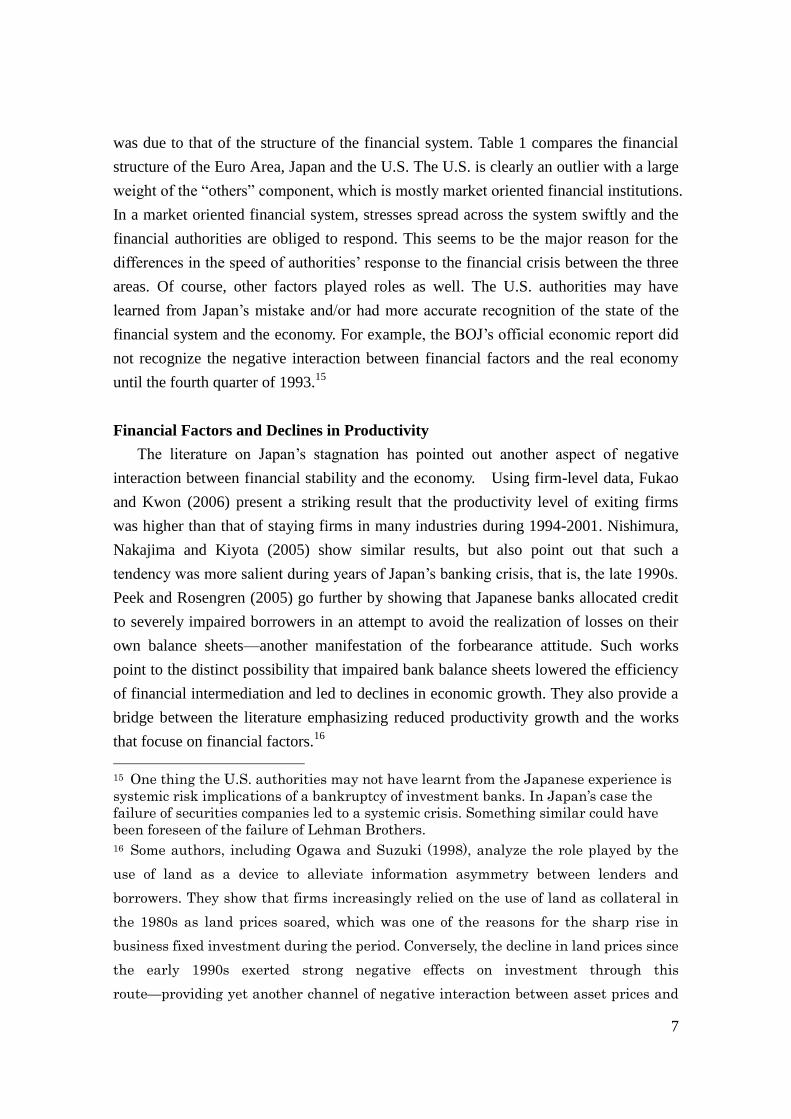
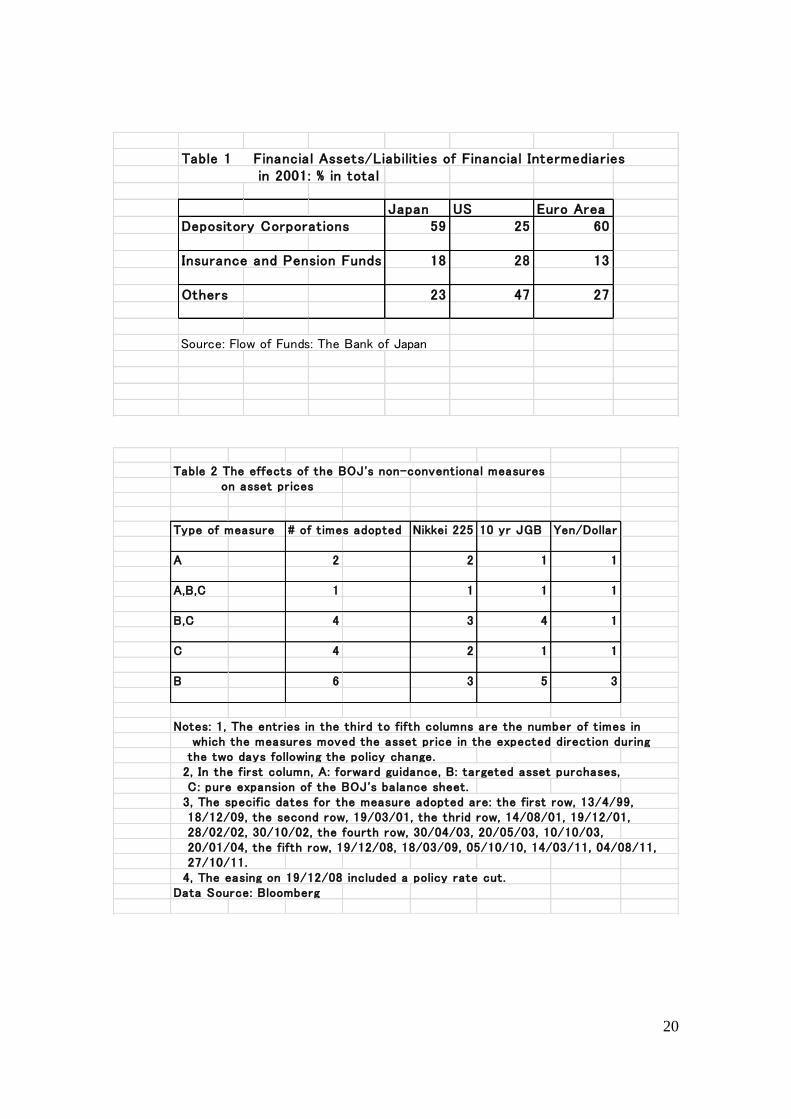
was due to that of the structure of the financial system. Table 1 compares the financial
structure of the Euro Area, Japan and the U.S. The U.S. is clearly an outlier with a large
weight of the “others” component, which is mostly market oriented financial institutions.
In a market oriented financial system, stresses spread across the system swiftly and the
financial authorities are obliged to respond. This seems to be the major reason for the
differences in the speed of authorities’ response to the financial crisis between the three
areas. Of course, other factors played roles as well. The U.S. authorities may have
learned from Japan’s mistake and/or had more accurate recognition of the state of the
financial system and the economy. For example, the BOJ’s official economic report did
not recognize the negative interaction between financial factors and the real economy
until the fourth quarter of 1993.15
Financial Factors and Declines in Productivity
The literature on Japan’s stagnation has pointed out another aspect of negative
interaction between financial stability and the economy. Using firm-level data, Fukao
and Kwon (2006) present a striking result that the productivity level of exiting firms
was higher than that of staying firms in many industries during 1994-2001. Nishimura,
Nakajima and Kiyota (2005) show similar results, but also point out that such a
tendency was more salient during years of Japan’s banking crisis, that is, the late 1990s.
Peek and Rosengren (2005) go further by showing that Japanese banks allocated credit
to severely impaired borrowers in an attempt to avoid the realization of losses on their
own balance sheets—another manifestation of the forbearance attitude. Such works
point to the distinct possibility that impaired bank balance sheets lowered the efficiency
of financial intermediation and led to declines in economic growth. They also provide a
bridge between the literature emphasizing reduced productivity growth and the works
that focuse on financial factors.16
15 One thing the U.S. authorities may not have learnt from the Japanese experience is
systemic risk implications of a bankruptcy of investment banks. In Japan’s case the
failure of securities companies led to a systemic crisis. Something similar could have
been foreseen of the failure of Lehman Brothers.
16 Some authors, including Ogawa and Suzuki (1998), analyze the role played by the
use of land as a device to alleviate information asymmetry between lenders and
borrowers. They show that firms increasingly relied on the use of land as collateral in
the 1980s as land prices soared, which was one of the reasons for the sharp rise in
business fixed investment during the period. Conversely, the decline in land prices since
the early 1990s exerted strong negative effects on investment through this
route—providing yet another channel of negative interaction between asset prices and
8
Thus, the economy has increasingly lost dynamism and expectations of low
growth and deflation have become entrenched. As a result, the financial crises
originating in foreign economies since the late 1990s have adversely affected the
economy perhaps more seriously than other economies. The expectation of declines in
population has affected housing and business fixed investment negatively. In this
environment the BOJ’s attempts to stimulate the economy have not had much of a
success at least so far. I now turn to this topic in the next section.
2, Addressing Financial Instability and Deflation: The BOJ’s Experience
Use of Conventional Monetary Policy
In the following I first review the BOJ’s experience with the use of the
conventional policy tool, the overnight rate, and then move on to discuss the more
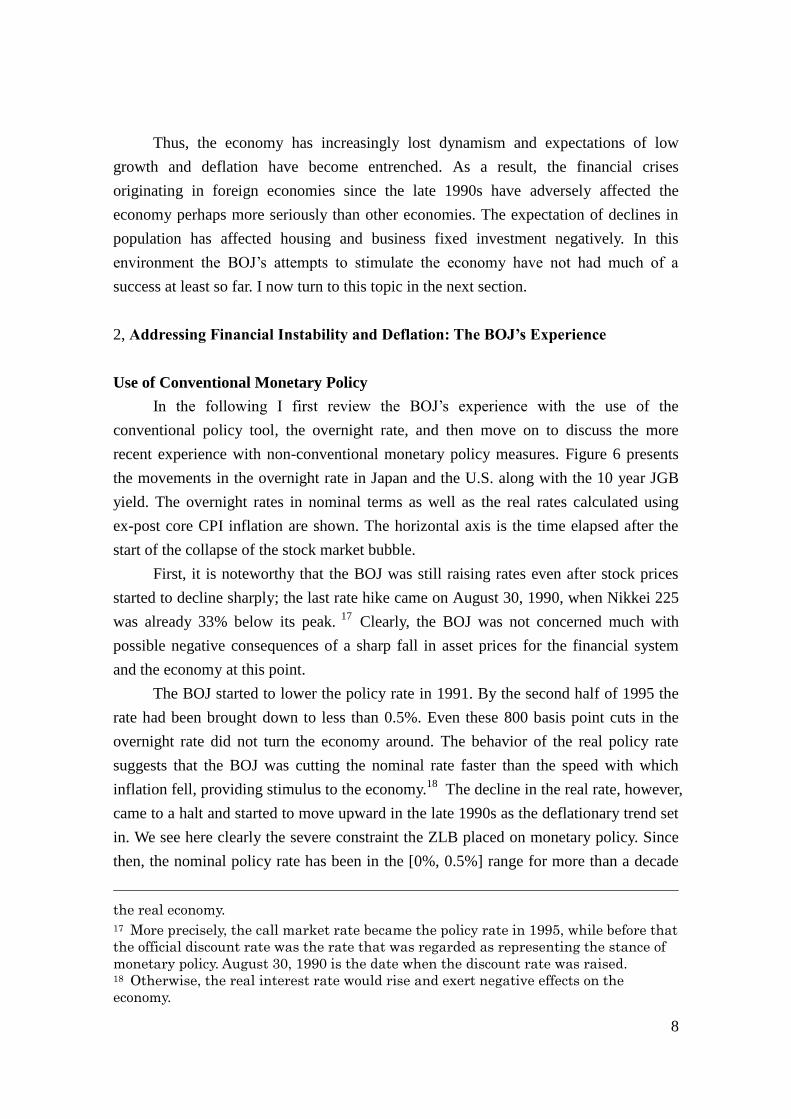
recent experience with non-conventional monetary policy measures. Figure 6 presents
the movements in the overnight rate in Japan and the U.S. along with the 10 year JGB
yield. The overnight rates in nominal terms as well as the real rates calculated using
ex-post core CPI inflation are shown. The horizontal axis is the time elapsed after the
start of the collapse of the stock market bubble.
First, it is noteworthy that the BOJ was still raising rates even after stock prices
started to decline sharply; the last rate hike came on August 30, 1990, when Nikkei 225
was already 33% below its peak. 17
Clearly, the BOJ was not concerned much with
possible negative consequences of a sharp fall in asset prices for the financial system
and the economy at this point.
The BOJ started to lower the policy rate in 1991. By the second half of 1995 the
rate had been brought down to less than 0.5%. Even these 800 basis point cuts in the
overnight rate did not turn the economy around. The behavior of the real policy rate
suggests that the BOJ was cutting the nominal rate faster than the speed with which
inflation fell, providing stimulus to the economy.18
The decline in the real rate, however,
came to a halt and started to move upward in the late 1990s as the deflationary trend set
in. We see here clearly the severe constraint the ZLB placed on monetary policy. Since
then, the nominal policy rate has been in the [0%, 0.5%] range for more than a decade
the real economy.
17 More precisely, the call market rate became the policy rate in 1995, while before that
the official discount rate was the rate that was regarded as representing the stance of
monetary policy. August 30, 1990 is the date when the discount rate was raised. 18 Otherwise, the real interest rate would rise and exert negative effects on the
economy.
9
and a half.
The behavior of the nominal and real federal funds rate in the same figure shows
that the Fed has reacted to the current financial crisis much more rapidly than did the
BOJ in the 1990s. The policy rate was brought down to near zero within one and a half
years of the start of the crisis. Given that inflation is still positive, the real rate has been
sharply negative. In contrast, the real policy rate was never below -0.5% in Japan in the
1990s. This is surely one of the reasons why the U.S. has avoided deflation so far.
What if the BOJ had embarked on a much more aggressive rate cut in the early
1990s bringing the real rate down to around -2% by 1992 or 1993? It would have surely
stimulated the economy significantly more than the actual policy adopted at that time
and possibly weakened the tendency for the yen to appreciate toward the mid 1990s,
although the precise magnitude of such effects is difficult to estimate. In reality,
however, policymakers’ goal at that time seems to have been avoiding the resurgence of
asset price bubble. There was no immediate stress felt in the financial system except the
declines in land and stock prices—which were a “good” thing. In contrast, the financial
crisis of 2007-08 was an important factor behind the Fed’s aggressive rate cuts. Such a
discussion raises the important question of the role financial stability considerations
should play in the determination of the policy rate. I do not have space to get into that,
and confine myself to pointing out the literature that gives an important role for
financial stability.19
In concluding the discussion of conventional monetary policy, it would be
appropriate to consider the reason for the failure of near zero policy rates to stimulate
the economy adequately. First, due to deflation, the real policy rate has been positive,
roughly in the zero to one and a half percent range since the mid-1990s, although it has
not become sharply positive. Second, deleveraging forces as discussed in the previous
section have undermined the stimulus provided by such low rates. Banks have been
tightening credit standards in making loans. Non-financial corporations have either been
forced by banks or tried hard themselves to repay debt. Given expectations of declines
in future property prices, not too many have borrowed money and bought properties.
Third, as the period of low interest rates has become protracted, the incentive to move
forward future investment to take advantage of low interest rates has diminished. Thus,
the interest rate elasticity of spending has declined, lowering the effectiveness of
monetary easing.
Use of Non-conventional Monetary Policy Measures
19 See, for example, Curdia & Woodford (2010).
10
Given the ZLB and the persistent deflation, the BOJ has adopted many
non-conventional monetary policy measures since the late 1990s. The review of the
measures is interesting in itself, but is also important in the light of similar measures
adopted by other central banks in developed economies since 2007. In the following I
first offer a conceptual typology of the measures and then a discussion of the
effectiveness of the measures.20
Monetary easing measures that can be adopted near the ZLB may be classified as
follows: (A) forward guidance—providing assurance to the market that the policy rate
will be lower in the future than currently expected; (B) changing the composition of the
central bank’s balance sheet so as to increase the central bank’s holdings of
non-traditional assets (targeted asset purchases); and (C) expanding the size of the
central bank’s balance sheet beyond the level required for a zero policy rate
(Quantitative Easing: QE).
In order to affect market expectations of future short rates under strategy A, the
central bank needs to commit to monetary easing even after the economy no longer
requires it. Then, the current market rates will be lowered up to a certain maturity, but
raised beyond that maturity because unnecessary easing in the future creates an
expectation of rising inflation. As such, however, the central bank has an incentive to
renege on the commitment ex post—one of the weaknesses of the strategy.
Strategy B may be further decomposed into two types: one, purchases of assets in
distressed markets, and, the other, those in more normal markets. The first has
sometimes been called credit easing and is aimed at containment of liquidity/risk
premiums in markets under stress. Allen and Gale (2007) and Curdia and Woodford
(2010) show that credit easing can be effective when there is a market failure in credit
markets. Even targeted asset purchases in more normal markets seem to require some
market imperfections such as investors’ segmentation across maturities in government
bond markets.
Many central banks, in their recent pursuit of strategy (B) since 2007, have not
mopped up the funds supplied, thus giving the appearance that they have been pursuing
QE.21
Thus, the distinction between the two strategies is a subtle one. In the following
let us take QE to be the strategy to pursue expansion of the size of central bank balance
sheet no matter what it buys, while with targeted asset purchases the focus is on what
the central bank buys.22
Unfortunately, it is not easy to find theoretical justification of
20 For more detail on these see Ueda (2012). 21 One exception has been the September 2011 Fed decision to buy long-term, and sell
an equal amount of short-term Treasury bonds—an operations twist. 22 An alternative definition of QE is expansion of central bank balance sheet by
11
QE beyond that for forward guidance or targeted asset purchases. A simple reason for
this is the following: if the economy is at the ZLB, it is satiated with liquidity. Hence,
attempts to add liquidity further do not seem to produce significant results.
It is worth mentioning that many of the non-conventional measures work by
lowering interest rate spreads and/or risk premiums. This is clear with forward guidance,
which is an attempt to narrow long-short interest rate spreads up to a certain maturity,
although it may widen the spreads beyond that maturity if it succeeds in raising
inflation/growth expectations. Credit easing is, by definition, an attempt to reduce
risk/liquidity premiums in markets that are temporarily dysfunctional. Asset purchases
in more normal markets also is an attempt at lowering the risk premium of the asset
bought with hopefully spillover effects on other assets through portfolio rebalancing.
Such a consideration suggests that there are limits to how far non-conventional
monetary policy measures can be used. Risk premiums cannot go below zero. Even at
positive levels, if they fall below certain levels by a central bank move, the central bank
is required to carry out large amounts of financial intermediation involving the asset in
question. If prolonged, there will be a serious loss of efficiency of intermediation.
Admittedly, these lower limits are not as well defined as in the case of the ZLB on the
policy interest rate. It still seems appropriate to argue for the existence of loose lower
bounds below which risk premiums cannot fall--Lower Bounds on spreads.23
As we see
below, the BOJ, with its extensive use of non-conventional measures, seems close to
hitting these lower bounds.
The BOJ: 1999-2011
The BOJ has employed non-conventional measures in three waves. First, the
so-called zero interest rate policy (ZIRP) was introduced in April 1999. The ZIRP was
not just a zero policy rate, but a commitment to maintain it “until deflationary concerns
were dispelled”, and thus was a major example of forward guidance.24
In August 2000,
the BOJ lifted the ZIRP and raised the overnight call market rate to 0.25 %.
The second wave came in the aftermath of the collapse of the IT bubble in 2001.
The BOJ adopted the quantitative easing policy--let us call it QEJ, Japan's version of
QE--in March 2001. QEJ contained all three components of non-conventional monetary
policy. There was QE, that is, the shift of the operational target of policy from the call
purchases of traditional asset, say, treasury bills. See Ueda (2012). 23 In the case of long-short interest rate spreads, these can become negative in general.
When the short rate is at the ZLB, however, the spreads cannot become negativ. 24
Some use the ZIRP to mean only a zero policy rate. Here it refers to the combination of a zero
rate and the commitment to maintain it until deflation ends.
12
rate to the current account balances (CAB) at the BOJ, essentially, bank reserves. This
framework was promised to be maintained until CPI inflation became stably positive
(forward guidance). And, the BOJ increased the amount of purchases of Japanese
Government Bonds (JGBs) from time to time to hit the target on the CAB—targeted
asset purchases. The target on the CABs was increased from approximately 5 trillion
yen at the introduction of QEJ in March 2001, an amount roughly 1 trillion yen greater
than the then-required reserves, to a range of approximately 30-35 trillion yen in
January 2004. QEJ was finally lifted in March 2006. The extent of the BOJ’s balance
sheet expansion was unprecedented at that time and is comparable to that of other
central banks during the late 2000s.
Third, in response to negative spillover effects on the Japanese economy of the
world financial crisis of 2007-09 the BOJ again resorted to many non-conventional
measures. Thus, it started term fund supplying operations at 3 months at a fixed rate of
0.1% in December 2009, later extended to 6 months. Since October 2010, it has
introduced the Comprehensive Monetary Easing Policy (CMP), the BOJ’s version of
targeted asset purchases, to buy commercial papers, corporate bonds, ETFs, REITs and
long-term JGBs. The BOJ has explicitly stated that “the Bank will encourage the decline
in longer-term interest rates and various risk premiums.” Forward guidance has also
been used in a slightly weaker form than in the ZIRP or QEJ periods. Since 2007, no
attempt has been made to target the size of the BOJ’s balance sheet. Throughout the
three phases, credit easing measures have been extensively employed to contain stresses
in the financial system.
A few remarks on the non-conventional measures adopted by other central banks
since 2007 are in order. Reflecting the severity of the credit/liquidity crunch, most
central banks adopted credit easing measures that fit the characteristics of the stresses in
the country. For example, the Fed lent to brokers and MMFs; the ECB bought covered
bonds. No central bank has created a target on a measure of the liability side of its
balance sheet, while most central banks have adopted targeted asset purchases whereby
a specified set of assets has been bought up to pre-determined amounts. The forward
guidance approach has been used by the Fed and the Bank of Canada, but in a much
weaker form than the BOJ during 1999-2006. These features seem to reflect the
judgment on the effectiveness of the measures adopted by the BOJ in earlier periods, to
which I now turn.
Evidence on the Effectiveness of the BOJ’s Measures
Given Japan’s persistent deflation and sub-par economic growth, one might think
13
that the measures adopted by the BOJ have had no effects on the economy. This is
certainly not the case. Among other things, various credit easing measures have
contained risk premiums and prevented the financial system from falling apart. For
example, Baba, Nakashima, Shigemi and Ueda (2006) and BOJ (2009) find that the
BOJ’s fund supplying operations reduced money market risk premiums almost to zero.
This can be seen informally in Figure 5 where the money market risk premium has been
kept at very low levels with only two exceptions, one, during Japan’s credit crunch
(1997-98, i.e., T=7,8) and, the other, right after the Lehman shock (T=18, 19).
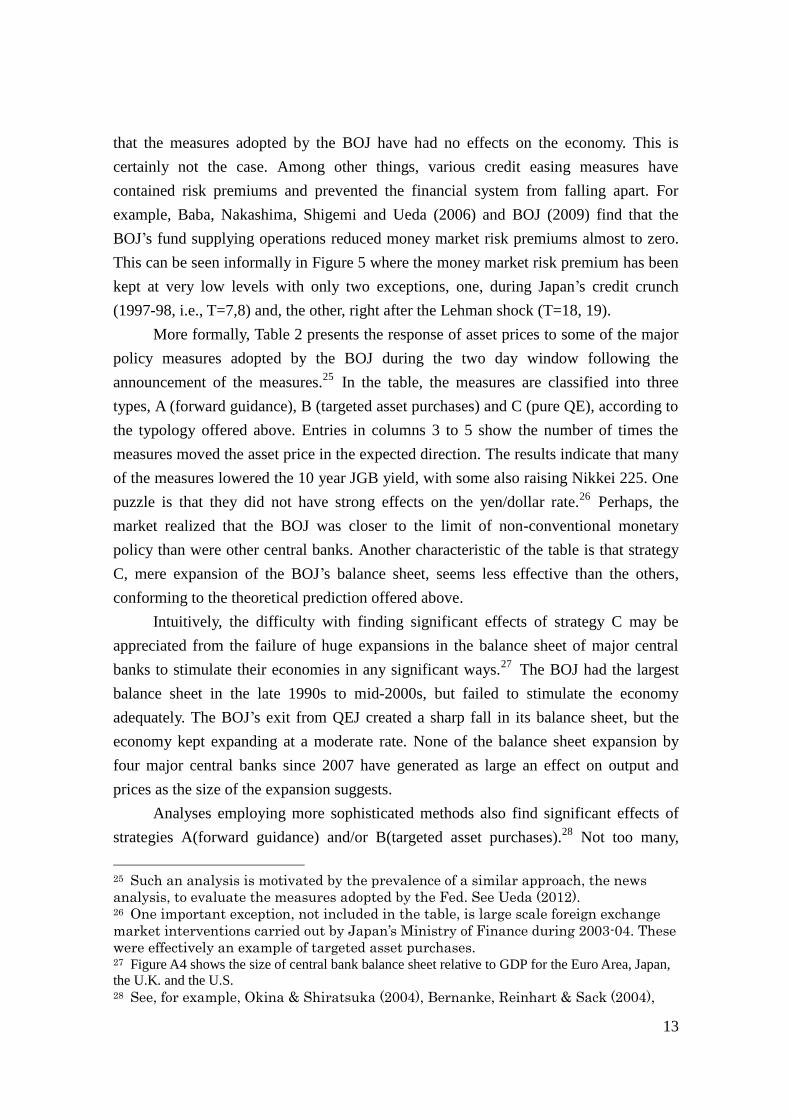
More formally, Table 2 presents the response of asset prices to some of the major
policy measures adopted by the BOJ during the two day window following the
announcement of the measures.25
In the table, the measures are classified into three
types, A (forward guidance), B (targeted asset purchases) and C (pure QE), according to
the typology offered above. Entries in columns 3 to 5 show the number of times the
measures moved the asset price in the expected direction. The results indicate that many
of the measures lowered the 10 year JGB yield, with some also raising Nikkei 225. One
puzzle is that they did not have strong effects on the yen/dollar rate.26
Perhaps, the
market realized that the BOJ was closer to the limit of non-conventional monetary
policy than were other central banks. Another characteristic of the table is that strategy
C, mere expansion of the BOJ’s balance sheet, seems less effective than the others,
conforming to the theoretical prediction offered above.
Intuitively, the difficulty with finding significant effects of strategy C may be
appreciated from the failure of huge expansions in the balance sheet of major central
banks to stimulate their economies in any significant ways.27
The BOJ had the largest
balance sheet in the late 1990s to mid-2000s, but failed to stimulate the economy
adequately. The BOJ’s exit from QEJ created a sharp fall in its balance sheet, but the
economy kept expanding at a moderate rate. None of the balance sheet expansion by
four major central banks since 2007 have generated as large an effect on output and
prices as the size of the expansion suggests.
Analyses employing more sophisticated methods also find significant effects of
strategies A(forward guidance) and/or B(targeted asset purchases).28
Not too many,
25 Such an analysis is motivated by the prevalence of a similar approach, the news
analysis, to evaluate the measures adopted by the Fed. See Ueda (2012). 26 One important exception, not included in the table, is large scale foreign exchange
market interventions carried out by Japan’s Ministry of Finance during 2003-04. These
were effectively an example of targeted asset purchases. 27 Figure A4 shows the size of central bank balance sheet relative to GDP for the Euro Area, Japan,
the U.K. and the U.S. 28 See, for example, Okina & Shiratsuka (2004), Bernanke, Reinhart & Sack (2004),
14
however, have found significant effects of Strategy C (pure expansion of central bank
balance sheet).29
To summarize, the effects of the BOJ’s non-conventional monetary
policy measures have been non-negligible. Liquidity provision stabilized the financial
system and forward guidance and/or targeted asset purchases lowered a range of interest
rates and supported the economy. This may be the major reason for the absence of
acceleration in deflation. Unfortunately, however, the measures have fallen short of
bringing inflation back into positive territory clearly.
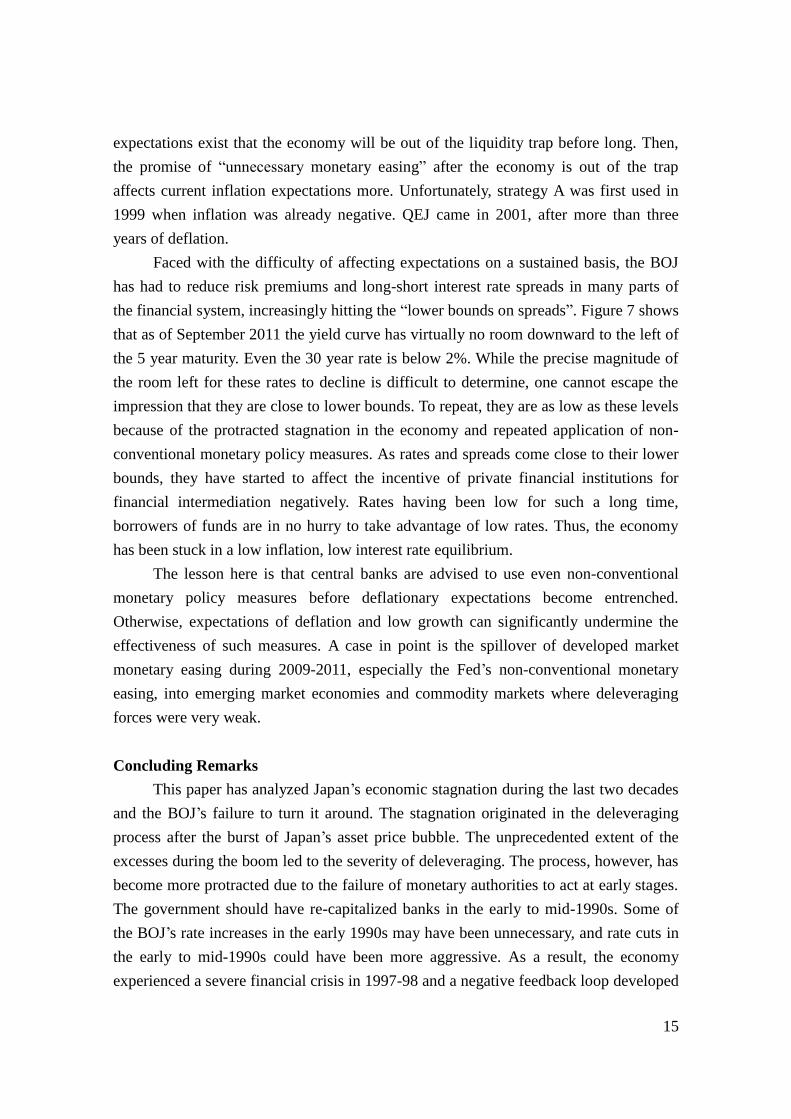
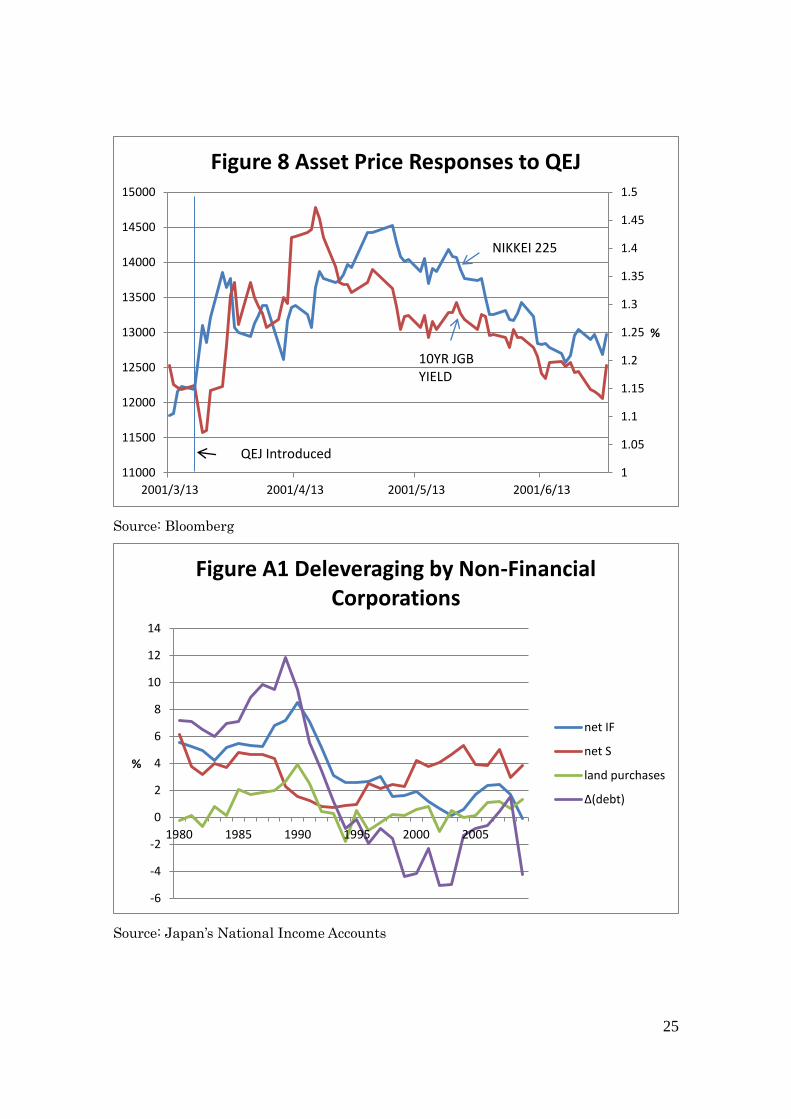
Figure 8 shows all this in a slightly different manner. Movements in the JGB yield
curve since the beginning of 1999 are plotted. It can be seen that the introduction of the
ZIRP in April 1999 shifted the curve downward, and QEJ, implemented in 2001, shifted
it further downward. Clearly, the two measures exerted more long-lasting effects on
interest rates than for just two days as was the case in Table 2. These, however, failed to
affect medium-term growth and/or inflation expectations positively; hence, the
downward shifts of the entire curve rather than those of a left portion of the curve
only.30
As argued above, the forward guidance strategy, if successful, would lower
expected future short rates up to a certain point in the future, but raise them beyond that.
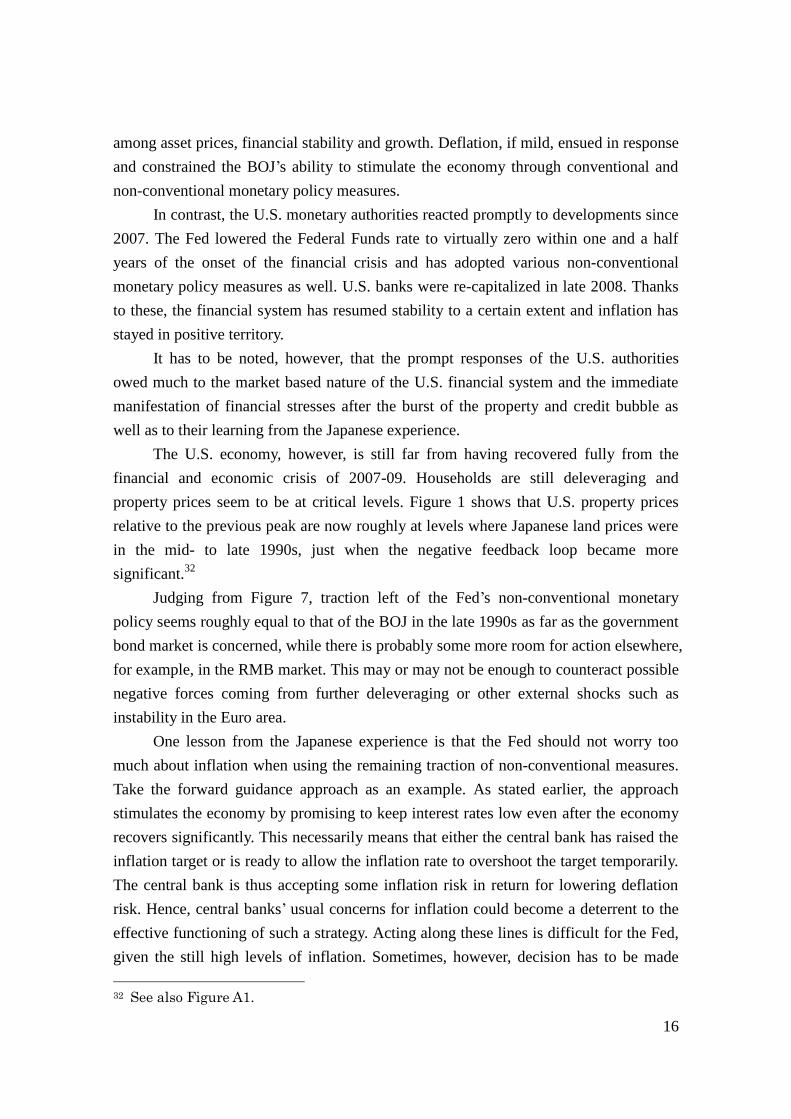
The second part did not materialize. One exception was a brief period following the
introduction of QEJ. As shown in Figure 8, the 10 year JGB rate declined sharply on the
day of the introduction of QEJ. Starting on the next day, however, the rate moved
upward and this continued for about a month. Stock prices also moved upward for one
and a half months, both seem to have been a favorable response to QEJ. Such responses,
however, soon gave way to weakness in the economy and asset prices came back to
pre-QEJ levels.31
The effects on expectations were only temporary. This seems to have
been a result of the adoption of the move after expectations of low/negative inflation
became entrenched.
The forward guidance strategy is more useful if it is introduced when
Baba et al. (2006) and Oda & Ueda (2007). 29 One exception is Honda, Kuroki & Tachibana (2007) who find, using VAR analysis,
that an expansion of the CAB exerted significant effects on stock prices and in turn on
output. Given the methodology, however, it is unclear which aspect of QEJ generated
such effects. The analysis also does not include a variable representing changes in
perceptions about the stability of the financial system and hence runs the risk of picking
up spurious correlation between money and output. 30 The picture does not change if implied forward interest rates are used in place of
long-term rates. For example, 10 year forward 10 year has been stable at around 3%
since 1998. There is a weak negative trend in 10 year forward 20 year in the 2000s. 31 It is interesting to note that the response of interest rates and stock prices in the U.S.
to the Fed’s QE2 during 2010-2011 was very similar to Figure 8, although the period of
favorable response was longer.
15
expectations exist that the economy will be out of the liquidity trap before long. Then,
the promise of “unnecessary monetary easing” after the economy is out of the trap
affects current inflation expectations more. Unfortunately, strategy A was first used in
1999 when inflation was already negative. QEJ came in 2001, after more than three
years of deflation.
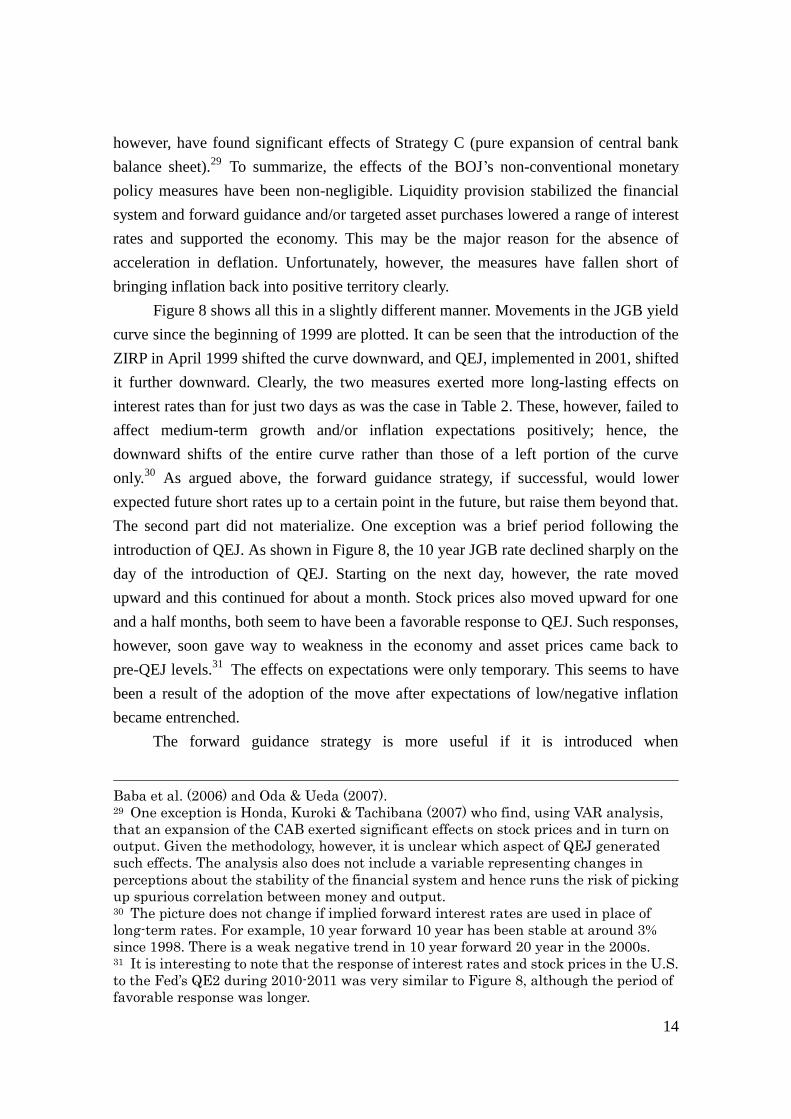
Faced with the difficulty of affecting expectations on a sustained basis, the BOJ
has had to reduce risk premiums and long-short interest rate spreads in many parts of
the financial system, increasingly hitting the “lower bounds on spreads”. Figure 7 shows
that as of September 2011 the yield curve has virtually no room downward to the left of
the 5 year maturity. Even the 30 year rate is below 2%. While the precise magnitude of
the room left for these rates to decline is difficult to determine, one cannot escape the
impression that they are close to lower bounds. To repeat, they are as low as these levels
because of the protracted stagnation in the economy and repeated application of non-
conventional monetary policy measures. As rates and spreads come close to their lower
bounds, they have started to affect the incentive of private financial institutions for
financial intermediation negatively. Rates having been low for such a long time,
borrowers of funds are in no hurry to take advantage of low rates. Thus, the economy
has been stuck in a low inflation, low interest rate equilibrium.
The lesson here is that central banks are advised to use even non-conventional
monetary policy measures before deflationary expectations become entrenched.
Otherwise, expectations of deflation and low growth can significantly undermine the
effectiveness of such measures. A case in point is the spillover of developed market
monetary easing during 2009-2011, especially the Fed’s non-conventional monetary
easing, into emerging market economies and commodity markets where deleveraging
forces were very weak.
Concluding Remarks
This paper has analyzed Japan’s economic stagnation during the last two decades
and the BOJ’s failure to turn it around. The stagnation originated in the deleveraging
process after the burst of Japan’s asset price bubble. The unprecedented extent of the
excesses during the boom led to the severity of deleveraging. The process, however, has
become more protracted due to the failure of monetary authorities to act at early stages.
The government should have re-capitalized banks in the early to mid-1990s. Some of
the BOJ’s rate increases in the early 1990s may have been unnecessary, and rate cuts in
the early to mid-1990s could have been more aggressive. As a result, the economy
experienced a severe financial crisis in 1997-98 and a negative feedback loop developed
16
among asset prices, financial stability and growth. Deflation, if mild, ensued in response
and constrained the BOJ’s ability to stimulate the economy through conventional and
non-conventional monetary policy measures.
In contrast, the U.S. monetary authorities reacted promptly to developments since
2007. The Fed lowered the Federal Funds rate to virtually zero within one and a half
years of the onset of the financial crisis and has adopted various non-conventional
monetary policy measures as well. U.S. banks were re-capitalized in late 2008. Thanks
to these, the financial system has resumed stability to a certain extent and inflation has
stayed in positive territory.
It has to be noted, however, that the prompt responses of the U.S. authorities
owed much to the market based nature of the U.S. financial system and the immediate
manifestation of financial stresses after the burst of the property and credit bubble as
well as to their learning from the Japanese experience.
The U.S. economy, however, is still far from having recovered fully from the
financial and economic crisis of 2007-09. Households are still deleveraging and
property prices seem to be at critical levels. Figure 1 shows that U.S. property prices
relative to the previous peak are now roughly at levels where Japanese land prices were
in the mid- to late 1990s, just when the negative feedback loop became more
significant.32
Judging from Figure 7, traction left of the Fed’s non-conventional monetary
policy seems roughly equal to that of the BOJ in the late 1990s as far as the government
bond market is concerned, while there is probably some more room for action elsewhere,
for example, in the RMB market. This may or may not be enough to counteract possible
negative forces coming from further deleveraging or other external shocks such as
instability in the Euro area.
One lesson from the Japanese experience is that the Fed should not worry too
much about inflation when using the remaining traction of non-conventional measures.
Take the forward guidance approach as an example. As stated earlier, the approach
stimulates the economy by promising to keep interest rates low even after the economy
recovers significantly. This necessarily means that either the central bank has raised the
inflation target or is ready to allow the inflation rate to overshoot the target temporarily.
The central bank is thus accepting some inflation risk in return for lowering deflation
risk. Hence, central banks’ usual concerns for inflation could become a deterrent to the
effective functioning of such a strategy. Acting along these lines is difficult for the Fed,
given the still high levels of inflation. Sometimes, however, decision has to be made
32 See also Figure A1.
17
about what risk one wants to minimize. The BOJ’s behavior in this respect was rather
halfhearted. It introduced a forward guidance approach in early 1999, promising that a
zero rate would be kept until deflationary concerns were dispelled, which should have
meant targeting a positive inflation rate. It exited from the framework, however, in
August 2000 when core inflation was -0.5%. Deliberations within the BOJ on the
“meaning of price stability” later that year were not able to determine whether price
stability meant a zero inflation or a positive inflation.33
Such confusion seems to have
cast a dark shadow on its communication policy in subsequent periods34
.
33 See BOJ (2000). 34 The BOJ exited from QEJ in March 2006 with a core CPI inflation rate of -0.5%
despite the promise of the continuation of QEJ until “inflation is stably positive.” This is
partially explained by the possibility that the BOJ had attached more importance to
headline inflation than its core. But headline inflation was -0.3% in August 2000 and
0.1% in March 2006. (In Japan headline inflation means e- energy and core,
ex-energy-food.) The BOJ later defined price stability more explicitly to mean 0% to 2%
with 1% being the preferred level for many board members.
18
References:
Allen, Franklin. & Douglas Gale. 2008. Understanding Financial Crises, Clarendon
Lectures in Finance, Oxford: Oxford University Press.
Baba, Naohiko, Motoharu Nakashima, Yosuke Shigemi & Kazuo Ueda (2006) “The
Bank of Japan’s Monetary Policy and Bank Risk Premiums in the Money
Market,” International Journal of Central Banking, Vol. 2, No.1, March,
pp.105-35.
Bank of Japan. 2000. “On Price Stability,” http://www.boj.or.jp/en/announcements/
release_2000/k001013a.htm/
_____. 2009. Financial Markets Report, Financial Markets Department,
August 31.
Benhabib, Jess, Stephanie Schmitt-Grohe &Martin Uribe. 2001. “The Perils of Taylor
Rules,” Journal of Economic Theory, Vol.96, pp.40-69.
Bernanke, Ben. S. & Vincent R. Reinhart & Brian P. Sack. 2004. “Monetary Policy
Alternatives at the Zero Bound: An Empirical Assessment,” Brookings Papers on
Economic Activity, 2:2004, pp. 1-78.
Clarida, Richard. 2010. "What Has--and Has Not--Been Learned about Monetary Policy
in a Low Inflation Environment? A Review of the 2000s," paper presented at the
Federal Reserve Bank of Boston 55th Economic Conference, October 14-16,
Boston.
Curdia, Vasco. & Michael Woodford. 2010. “The Central-Bank Balance Sheet as an
Instrument of Monetary Policy,” NBER Working Paper, 16208.
Fukao, Kyoji & Hyeog Ug Kwon. 2006. “Why Did Japan’s TFP Growth Slow Down in
The Lost Decade? An Empirical Analysis Based on Firm-Level Data of
Manufacturing Firms,” Japanese Economic Review, Vol.57, No.2, pp. 195-228.
Fuhrer, Jeff, Giovanni Olivei and Geoffrey Tootel. 2012. “Inflation Dynamics when
Inflation is Near Zero, forthcoming in the Journal of Money, Credit and Banking.
Gagnon, Joseph, Matthew Raskin, Julie Remache and Brian Sack (2010) "Large Scale
Asset Purchases by the Federal Reserve: Did They Work?" Federal Reserve Bank
of New York Staff Report 441.
Hayashi, Fumio, and Edward C. Prescott. 2002. “The 1990s in Japan: A Lost Decade,”
Review of Economic Dynamics, Vol.5, pp. 206-35.
Honda, Yuzo, Yoshihiro Kuroki and Minoru Tachibana.2007. “An Injection of Base
Money at Zero Interest Rates: Empirical Evidence from the Japanese Experience
2001-2006.” Osaka University, Discussion Papers in Economics and Business, No.
19
07-08.
Kasahara, Hiroyuki, Yasuyuki Sawada and Michio Suzuki. 2011. “Investment and
Borrowing Constraints: Evidence from Japanese Firms,” paper presented at the
Japan Project Meeting of the NBER, Tokyo.
Koo, Richard, C. 2009. The Holy Grail of Macroeconomics. Singapore: John Wiley and
Sons (Asia) Pte. Ltd.
McCauley, Robert N. & Kazuo Ueda (2009) “Government Debt Management at Low
Interest Rates,” BIS Quarterly Review, June, pp.35-51.
Nishikwa, Yoshifumi. 2011. Autobiography of Yoshifumi Nishikawa (in Japanese).
Tokyo: Kodansha.
Nishimura, Kiyohiko G., Takanobu Nakajima & Kozo Kiyota. 2005. “Does the Natural
Selection Mechanism Still Work in Severe Recessions? Examination of the
Japanese Economy in the 1990s,” Journal of Economic Behavior & Organization,
Vol.58, pp.53-78.
Oda, Nobuyuki & Kazuo Ueda (2007) “The Effects of the Bank of Japan’s Zero Interest
Rate Commitment and Quantitative Monetary Easing on the Yield Curve: A
Macro-Finance Approach,” Japanese Economic Review, Vo. 58, No.3, September,
pp.302-28.
Ogawa, Kazuo and Kazuyuki Suzuki. 1998. “Land Value and Corporate Investment:
Evidence from Japanese Panel Data,” Journal of the Japanese and International
Economies, Vol.12, pp.232-49.
Okina, Kunio & Shigenori Shiratsuka. 2004. “Policy Commitment and Expectation
Formation:Japan’s Experience under Zero Interest Rates,” North American
Journal of Economics and Finance, Vol. 15, No.1, pp.75-100.
Peek Joe & Eric S. Rosengren. 2005. “Unnatural Selection: Perverse Incentives and the
Misallocation of Credit in Japan,” American Economic Review, Vol. 95, No.4, pp.
1144-66.
Sekine, Toshitaka. 1999. “Firm Investment and Balance-Sheet Problems in Japan,” IMF
Working Paper, WP/99/111.
Taylor, John. 2007. Global Financial Warriors, NY: W. W. Norton & Company, Inc.
Ueda, Kazuo. 2012. “The Effectiveness of Non-traditional Monetary Policy Measures:
The Case of the Bank of Japan,” forthcoming in Japanese Economic Review.
Ugai, H. 2007. “Effects of the Quantitative Easing Policy: A Survey of Empirical
Analysis,” Monetary and Economic Studies, Vo.25, No.1, Bank of Japan, pp.1-47.
20
Table 1 Financial Assets/Liabilit ies of Financial Intermediaries in 2001: % in total
Japan US Euro AreaDepository Corporations 59 25 60
Insurance and Pension Funds 18 28 13
Others 23 47 27
Source: Flow of Funds: The Bank of Japan
Table 2 The effects of the BOJ's non-conventional measures on asset prices
Type of measure # of t imes adopted Nikkei 225 10 yr JGB Yen/Dollar
A 2 2 1 1
A,B,C 1 1 1 1
B,C 4 3 4 1
C 4 2 1 1
B 6 3 5 3
Notes: 1, The entries in the third to fifth columns are the number of t imes in which the measures moved the asset price in the expected direction during the two days following the policy change. 2, In the first column, A: forward guidance, B: targeted asset purchases, C: pure expansion of the BOJ's balance sheet. 3, The specific dates for the measure adopted are: the first row, 13/4/99, 18/12/09, the second row, 19/03/01, the thrid row, 14/08/01, 19/12/01, 28/02/02, 30/10/02, the fourth row, 30/04/03, 20/05/03, 10/10/03, 20/01/04, the fifth row, 19/12/08, 18/03/09, 05/10/10, 14/03/11, 04/08/11, 27/10/11. 4, The easing on 19/12/08 included a policy rate cut.Data Source: Bloomberg
21
Note: T=0 corresponds to 1990 for Japan and 2001 for the U.S.
Source: Bloomberg, Nikkei Needs, Japan’s National Income Accounts
Source: Datastream
-4
-2
0
2
4
6
8
10
12
14
16
0
20
40
60
80
100
120
T-10 T= 0 T+10
% Peak=100
Figure 1 Property Prices and CPI Inflation in Japan & the U.S.,
and Japan's Investment in Structures/GDP
J CPI (RHS)
US CPI (RHS)
Urban Land Price Index
Case Shiller
IF in structures (RHS)
0
0.5
1
1.5
2
2.5
3
3.5
4
4.5
1974-90Japan
US 1991-2000Japan
US 2001-10Japan
US
Figure 2 Per capita RGDP and Population Growth Rates in Japan & the U.S.
population growth
per capita growth
22
Source: National Income Accounts
Source: Datastream, Japan’s FSA
0
0.5
1
1.5
2
2.5
3
0
5
10
15
20
25
30
1970 1975 1980 1985 1990 1995 2000 2005
Figure 3 Leverage (at Market Value) for Japan's Financials and Non-Financials
financials (lhs)
nonfinancials (rhs)
-2
0
2
4
6
8
10
12
14
16
-6
-4
-2
0
2
4
6
8
10
12
14
T-5 T T+5 T+10 T+15
t
r
i
l
l
i
o
n
y
e
n
%
Figure 4 Bank Loan Growth Rates in Japan & the U.S.,
and Bad Loan Disposals in Japan
Bad loan disposals:Japan(RHS)
Bank loan growth: J (LHS)
Bank loan growth: US (LHS)
23
Notes: 1, The risk premium is 3 month LIBOR- 3 month Treasury bill rate for the U.S.
and 60-90 day bank certificate of deposits – 3 month treasury bill rate for Japan.
2, T=0 stands for June 2007 for the U.S., and January 1990 for Japan.
Source: Bloomberg
-0.5
0
0.5
1
1.5
2
2.5
3
3.5
T T+2
T+4
T+6
T+8
T+10
T+12
T+14
T+16
T+18
T+20
T+22
Figure 5 Money Market Risk Premium
US
Japan
24
Note: T=0 stands for June 2007 for the U.S., and January 1990 for Japan.
Source: Bloomberg
Source: Bloomberg
-4
-2
0
2
4
6
8
10
T-1
T T+1
T+2
T+3
T+4
T+5
T+6
T+7
T+8
T+9
T+10
T+11
Figure 6 Real & Nominal Overnight Rates in Japan and the U.S.
and the 10 Year JGB Yield
Call rate
FFR
real rate J
real rate US
10 Yr JGB
0
0.5
1
1.5
2
2.5
3
3.5
3M 2Yr 5Yr 10Yr 20Yr 30Yr
Figure 7 Movements in the JGB Yield Curve &
the U.S. Treasury Yield Curve in 2011
Jan-99
Apr-99
Jan-03
Sep-11
US Sep-11
25
Source: Bloomberg
Source: Japan’s National Income Accounts
1
1.05
1.1
1.15
1.2
1.25
1.3
1.35
1.4
1.45
1.5
11000
11500
12000
12500
13000
13500
14000
14500
15000
2001/3/13 2001/4/13 2001/5/13 2001/6/13
%
Figure 8 Asset Price Responses to QEJ
QEJ Introduced
NIKKEI 225
10YR JGB YIELD
-6
-4
-2
0
2
4
6
8
10
12
14
1980 1985 1990 1995 2000 2005
%
Figure A1 Deleveraging by Non-Financial Corporations
net IF
net S
land purchases
Δ(debt)
26
Notes: 1, Inflation expectations are calculated as implied forward interest rates from
the SWAP curve – growth expectations in Cabinet Office’s survey.
2, 5YR 5YR uses 5 yr forward rates starting in the fifth year. 5YR 10YR uses 5 yr
forward rates starting in the 10th year. Growth expectations are for the next 5 years and
are assumed to be constant over the 12 months within each year.
Source: Bloomberg. Cabinet Office.
-2
-1.5
-1
-0.5
0
0.5
1
1.5
2
2.5
3
3.5
Figure A2 Inflation Expectations in Japan
5YR 5YR
5YR 10YR
Actual Inflation
27
Source: Bloomberg, Japan’s Cabinet Office.
Source: Datastream
0.0
2.0
4.0
6.0
8.0
10.0
12.0
0
50
100
150
200
250
year -10
Year 0 year+10
%
Figure A3 Propert Price-Income Ratios and Growth Expectations
growth expectations (rhs)
All Japan
US
Japan: 6 Large Cities
0
5
10
15
20
25
30
35
19
90
19
91
19
92
19
93
19
94
19
95
19
96
19
97
19
98
19
99
20
00
20
01
20
02
20
03
20
04
20
05
20
06
20
07
20
08
20
09
20
10
Figure A4 Central Bank Balance Sheets/ GDP
BOE
FED
BOJ
ECB