Embed Size (px)
Citation preview

1BISA/PSA Career Trajectories Report June 2021
Career trajectories in UK departments of politics and international relationsA report for the British International Studies Association and the Political Studies Association
Chris Hanretty
June 2021

2BISA/PSA Career Trajectories Report June 2021
Contents
Executive Summary 3
Introduction 5
Context 6
Literature 8
Literature directly relevant to career trajectories 8
Literature indirectly relevant to career trajectories 9
Journal review decisions 9
Citations 9
Teaching evaluations 10
Grant success 10
Other factors 10
Data 11
Source of the data 11
The scope of the data 12
Variables found in the data 13
Variables not found in the data 14
Data processing 14
Descriptive statistics 15
Descriptive statistics over time 17
How does this compare to other disciplines in the social sciences? 18
Attainment 19
Promotion 21
Exit 24
Conclusions 27
References 29
Appendix 31
3BISA/PSA Career Trajectories Report June 2021
• In the 2018/19 academic year (the most recent year for which data is available), 61% of staff were male, and 78% were white.
• Between 2012/13 (the earliest year for which data is available) and 2018/19, the proportion of female staff increased from 33% to 39%; the proportion of staff from an ethnic minority increased from 9.3% to 13.2%.
• Men and white members of staff are over-represented at senior levels compared to their proportion in the academic workforce more generally. 29% of senior academics (senior lecturers, readers, professors) are female; 13% are from an ethnic minority.
This report is about the careers of academics working in politics departments at universities
in the United Kingdom. It focuses on three processes: attainment, promotion, and exit. Attainment means the academic rank achieved by an individual at a single point in time, and in particular whether an individual has attained senior academic rank by becoming a Senior Lecturer, Reader, or Professor. Promotion means any move from a more junior to a more senior academic rank, but in this report usually means moving to Senior Lecturer, Reader or Professor. Exit means ceasing to work in UK higher education.
The report models how these process are affected by different demographic characteristics of academic staff. In particular, the report looks at how attainment, promotion and exit are affected by sex, ethnicity, known disability, and nationality. These are all demographic characteristics of staff which are recorded by universities and submitted to the Higher Education Statistics Agency (HESA), and the terms used to refer to these characteristics reflect the terms used by universities and by HESA in collating this information.
The use of anonymized staff records from HESA means that this report provides the fullest picture yet of the characteristics of academics working in politics departments. However, the use of anonymized staff records also brings with it certain restrictions. In some analyses, categories have had to be collapsed in order to ensure that no tables contain counts of five individuals or less. The report also does not discuss differences between specific institutions.
The report uses a variety of methods to analyse HESA data. The first substantive part of the report provides descriptive statistics of the number of individuals employed in politics departments according to different characteristics considered individually
and jointly. The report then goes on to analyse attainment through an ordinal logistic regression; and to analyse promotion and exit through non-parametric survival models. In these statistical models, the characteristics listed above (sex, ethnicity, known disability and nationality) are included alongside control variables specifying each individual’s contract type (part-time or full-time; fixed-term or open-ended) and the length of time since their first job in UK higher education.
The principal conclusions of the report are as follows. Concerning staff employed in politics departments, the report finds that:
Executive Summary

4BISA/PSA Career Trajectories Report June 2021
• There is insufficient data to draw conclusions about the impact of sex and ethnicity on the chances of promotion for individuals who began work in UK higher education in or after the academic year 2012/13.
• Members of staff from an ethnic minority were 2 percentage points more likely to exit employment in higher education in any given year in the period 2012/13 to 2018/19.
• EU nationals were 3 percentage points more likely to exit over the same period; non-UK, non-EU nationals were 2.3 percentage points more likely to exit.
• Controlling for length of experience in higher education, members of staff from an ethnic minority are 5.6 percentage points less likely to be in a senior position (senior lecturer, reader, professor).
• Controlling for length of experience in higher education, female members of staff are 6.2 percentage points less likely to be in a senior position (senior lecturer, reader, professor).
Because these conclusions refer to a particular period in time, and because the analysis of promotion is limited by the number of people who entered UK higher education for the first time
in this period, this analysis should be repeated in future years to determine whether departments of politics remain the kinds of places that ethnic minority staff members leave at higher rates.
Concerning exit:
Concerning promotion, the report finds that:
Concerning attainment, the report finds that:
Chris Hanretty is Professor of Politics at Royal Holloway, University of London. His research interests include electoral representation and the behaviour of judges.

5BISA/PSA Career Trajectories Report June 2021
Over three thousand people are employed by UK higher education providers to carry
out research and teaching in the field of politics and international relations. These members of staff have different characteristics. They differ in their contractual relationship (whether on a fixed-term or open-ended contract, or on a part-time or full-time contract) and in certain demographic characteristics like age, ethnicity and sex.1 Precisely how many people fall into categories defined by these characteristics is a major theme of this report. Most of the three thousand people employed in departments of politics and international relations have a common interest in continuing and advancing their career. Career advancement can take many different forms: for staff on open-ended contracts, an important form of career advancement is promotion to a lower to a higher academic rank – for example, from Lecturer to Senior Lecturer, or from Senior Lecturer to Reader or Professor. For staff on fixed-term contracts, promotion may be a less important objective than securing permanent employment. Each year, across all contract levels and contract types, around 12% of individuals carrying out research and teaching in politics and international relations cease academic employment. Whilst for some these exits may have been voluntary (for example: due to retirement), many exits are not freely chosen. The promotion and retention decisions taken by universities and departments are therefore hugely important.
It is particularly important to know whether decisions in relation to promotion and retention are affected by individual characteristics, and in particular by individual characteristics which are protected in legislation. If staff with a particular (protected) characteristic are treated less favourably in promotion or retention decisions, holding all other (relevant) factors constant, then this is an unlawful form of discrimination. Phrased differently: if decisions taken in relation to promotion and retention are not to be unlawful, then any observed aggregate disparities between individuals with different characteristics have to be justified by appeals to other relevant characteristics, appeals which might be implausible on the face of it.2
Studying career progression is difficult. Universities do not publish cross-institutionally comparable records of staff employed in teaching and research. Departmental websites list some staff currently employed in departments of politics and international relations (or departments with a similar focus), but do not always do so consistently. Even if departmental websites reported staff in a consistent fashion, it would still be extremely difficult to collect this information over time and match individuals who moved between institutions.3 Existing studies of career promotion have often had to rely on printed “college catalogs” found in some US institutions, where staff mobility between institutions is much less common than it is in the UK (Box-Steffensmeier et al.,
Introduction
Studying career progression is difficult.
Universities do not publish cross-
institutionally comparable
records of staff employed in
teaching and research
1 In this report, I typically refer to sex rather than gender. I do this because the HESA data analysed in this report contain information about the sex of members of staff rather than the gender of members of staff. Questions about gender identity entered the HESA staff record only in the 2017/18 academic year.
2 This is comparable to the situation in legislatures, where “if men do not enjoy a ‘natural superiority of talent’, it is unsafe to assume that a legislature comprised disproportionately of men provides the ideal balance for good representation” (Murray, 2014, p. 523, emphasis added).

6BISA/PSA Career Trajectories Report June 2021
2015; Kaminski and Geisler, 2012). As a result, we have few quantitative studies of career progression which track individuals over time, and (as far as I am aware) no quantitative studies of career progression in the UK. Some scholars have taken it as axiomatic that “women are less likely to be promoted… or… get jobs in the first place” (Savigny, 2014, p. 794), but our knowledge of career trajectories, and how it is affected by individuals’ ascriptive characteristics, is generally limited (Emejulu, 2019, p. 204), and more limited than, say, our knowledge of how journal reviewing decisions or teaching evaluations are affected by gender.
In this report, I try to fill this gap in our knowledge of career progression. I use administrative data from the Higher Education Statistics Agency (HESA) to identify associations between different characteristics and three different outcomes:
The advantage of using administrative data to study these outcomes is that administrative data is broadly consistent, is compiled on a regular annual basis, and represents the entire population of individuals rather than a (possibly self-selecting) sample. The disadvantage of using administrative data is that the analysis is limited to characteristics captured by this particular administrative process. I focus primarily on sex, ethnicity and disability, and secondarily on nationality. After reviewing the extant literature, I describe the administrative data, noting absences from the data and restrictions on its re-use. I set out the method I use to study promotion and exit (survival analysis) and present separate analyses of promotion and exit. These analyses show that we cannot, when controlling for a range of background characteristics, confidently identify disparities in promotion prospects between individuals of different sexes, or between White British/Scottish members of staff and members of staff from an ethnic minority. We can, however, identify groups which are more likely to exit academic employment: members of ethnic minorities and non-UK nationals are more likely to exit HE. In the conclusion I set out some recommendations which I believe flow from these findings.
Context
This report concerns higher education providers who deliver courses in Politics and International Relations. Higher education in the UK is delivered by universities and other higher education institutions. Politics and International Relations as a degree subject is taught almost exclusively in universities or constituent parts of the University of London, rather than by other higher education providers. Almost all universities covered in this report are “public” institutions in the sense that they receive the majority of their funding from the government, but are still notionally independent (non-state) institutions.4 As such, the main external constraint on university decisions in relation to attainment,
• The likelihood, at a given point in time, of attaining a higher or lower academic rank (“attainment”).
• The likelihood, for individuals who first started in UK higher education between 2012/13 and 2018/19, of being promoted.
• The risk, for all individuals working in UK higher education departments of politics and international relations between 2012/13 and 2018/19, of exiting UK higher education.
3 Thus, although Bates et al. (2012) and Pflaeger Young et al. (2020) study the composition of departments at two points in time, they do not match individuals across those two points in time. I discuss the match between HESA statistics and the statistics in Pflaeger Young et al. (2020) below.
4 The University of Buckingham – an entirely private university – is a notable exception, but because the institution field in the HESA data has been obfuscated to prevent de-anonymization, the University of Buckingham is not identified separately in this report.

7BISA/PSA Career Trajectories Report June 2021
promotion and exit is the same employment and non-discrimination law that governs employers generally.
Of particular importance is the Equality Act 2010, which protects individuals against direct or indirect discrimination because of age, gender reassignment, marital status, pregnancy, disability, race, religion or belief, sex and sexual orientation (“protected characteristics”). As far as appointments are concerned, universities may only favour under-represented groups when deciding between candidates of equal merit (i.e., as a “tie-breaker” condition). As far as employment protection is concerned, academic staff in UK universities on open-ended contracts may be dismissed for redundancy or for good cause. Redundancy includes cases where universities wish to close whole department or end a particular type of activity.5 Good cause relates to “conduct, capabilities or the qualifications required for the type of work for which the academic was employed” (Dnes and Seaton, 1998, p. 497). Staff on a fixed-term contract do not have a right to renewal of their contract, but are protected against unfair dismissal. Staff employed on fixed-term contracts for four years or more become permanent employees. There are exceptions for a small number of staff appointed before the Education Act 1988, who continue to enjoy academic tenure as that term is understood in the United States.
Although universities are private institutions, they are subject to extensive reporting requirements, including requirements to report matters relating to staff. Information on the characteristics of staff employed in higher education institutions is provided by the Higher Education Statistics Agency (HESA), a quasi-public body which has certain powers under the Higher Education and Research Act 2017. Universities submit information on their staff to HESA, which makes available summary statistics on the characteristics of university staff according to different characteristics. These summary statistics show that in 2018/19 academic staff in higher education
institutions were majority white (76%) and male (54%).6 Averaging across all departments, academic staff with higher rank are also more likely to be white and male.
Previous studies have shown that gendered patterns are also found in departments of politics and international relations. Pflaeger Young et al. (2020) found that women make up 36% of staff listed on university websites as carrying out teaching and research in politics and international relations, but only 24% of Professors. That same article, however, noted that further research was needed to identify differences by ethnicity.
Over-representation of particular characteristics matters at least in part because, under certain assumptions, it deprives the academic community of talented individuals. If (for example) the distribution of interest in, and aptitude for, teaching and research in politics and international relations is not different for men and women, then the best way of maximizing talent in politics and international relations is to recruit and promote individuals in proportion to their presence in the broader population, however that is defined. This claim, whilst raising further questions,7 gives an important merit-based argument for the representation of different characteristics in departments of politics and international relations.8
These patterns (of over-representation of men and over-representation of the majority ethnic group both in general and in particular at more senior levels) are not unique to the UK. They are also found in other countries, even countries which have otherwise impressive records on gender equality. Sweden has the third lowest level of gender disparity in the world according to the UN’s Gender Inequality Index, and yet women make up only 30% of full professors of politics in Swedish universities (Carlsson et al., 2020, fig. 1). The primary factors that cause these patterns are therefore unlikely to be specific to any one country or educational context.
5 It is not always clear how narrowly a “type of activity” may be defined. The University of Leicester is currently (May 2021) dismissing staff who carry out research in critical management studies and political economy, which are research clusters in their School of Business, and which jointly employ sixteen individuals. See Anna McKie, “UK universities cutting jobs accused of exploiting pandemic”, Times Higher Education, 1st February 2021.
6 OC025 Chart 2, and DT025 Table 2, as found on https://www.hesa.ac.uk/data-and-analysis/staff/working-in-he/characteristics, last accessed 7th January 2021.
7 These questions might include: what is the relevant population? Must this population be defined by reference to populations (such as the population of PhD students) which are themselves subject to biases in recruitment? Most generally, is interest in politics different across genders (Fraile and Gomez, 2017)?
8 By identifying this merit-based argument I am not implying that there are no other good reasons for caring about the representation of different characteristics in the academy.
Of particular importance is the
Equality Act 2010, which protects
individuals against direct or indirect
discrimination because of age, gender reassignment, marital
status, pregnancy, disability, race, religion
or belief, sex and sexual orientation

8BISA/PSA Career Trajectories Report June 2021
Literature
In this section I summarise literature on (i) academic careers in general and (ii) academic outcomes which might feature as inputs to hiring and promotion decisions. It is important to note that most of this literature deals with gender, with very few studies of the impact of ethnicity and no studies that I am aware of on the impact of disability.9
Literature directly relevant to career trajectories
Because following individuals over time is difficult and relies either on access to administrative data or difficult-to-source college yearbooks or directories, there have been relatively few studies of career trajectories in general, and fewer studies still of career trajectories of individuals in politics and international relations specifically.
The study by Box-Steffensmeier et al. (2015) is like this report in that it analyses career trajectories using survival models. The study analyses retention, grants of tenure and promotion to full professor in social science faculties in nineteen US universities between 1990 and 2009. The authors find no significant gender differences in retention, some gender differences in grants of tenure (men are more likely to be granted tenure) and report inconclusive findings with respect to promotion. The study did not control for indications of research quality.
The study by Brower and James (2020) is like this report in that it uses administrative data, and specifically data collected as part of New Zealand’s Performance Based Research Fund (PBRF). As part of the PBRF, individual researchers submit a small portfolio of their best research, which is graded. Unlike the UK’s Research Excellence Framework, individual-level scores are produced, but these scores are only made available to the individual in question and their faculty dean or pro-vice chancellor. Immediate line-managers (for example: heads of department) do not see these scores.
Brower and James use data from two separate PBRF exercises (2003 and 2013) to analyse attainment and salary in New Zealand. They find that the odds of attaining full professor are between two and three times greater for men compared to women with an equally strong PBRF research score and age.
The articles by Box-Steffensmeier et al. (2015) and Brower and James (2020) concern respectively the social sciences and university research generally. By contrast, Schröder et al (2021) study exclusively attainment of full professor in German departments of political science. They control for a range of characteristics other than gender (publications, PhD-awarding institution, awards, mobility and parenthood). They find no significant differences between male and female candidates. They suggest that their results “fit the ‘leaky pipeline’ hypothesis in political science, which suggests that women get fewer professorships because they are less likely to stay in academia long enough to reach the advanced career stages that lead to a professorship” (Schröder et al, 2021).
A slightly older article by Hesli et al. (2012) examines rank attainment in the United States. The authors find that women are (statistically and substantively) significantly less likely to be promoted from assistant professor to associate professor, but that there are no significant gender differences in promotion from associate to full professor, nor any significant differences with respect to ethnicity. These effect sizes are large, with women having odds of promotion that are half the odds of men.
These findings suggest that there is either no, a modest, or a strong positive relationship between being male and attaining a higher academic rank. Inconsistencies in the literature can be accounted for by different analytical strategies used. Unequal patterns of attainment at a single point in time can arise even if there is no bias in promotion. This can happen if men and women (or members of other groups defined by certain protected characteristics) leave the
9 Brown and Leigh (2018) discuss the proportion of academics who declare a health condition or impairment, but focus more on the decision to disclose such a condition rather than its consequences.
Because following individuals over time is difficult and relies
either on access to administrative data
or difficult-to-source college yearbooks
or directories, there have been relatively
few studies of career trajectories in general

9BISA/PSA Career Trajectories Report June 2021
profession at different rates. Generally, the effects found in longitudinal studies of promotion (of the kind discussed above) are smaller than the effects found in single-point-in-time studies of attainment.
More consistent evidence comes from studies which present academics with hypothetical candidates (who vary in their gender and in other hiring-relevant characteristics) and ask them to evaluate those candidates. These studies generally show that faculty members have a preference for female over male candidates, and ethnic minority candidates over candidates from the largest ethnic group (Williams and Ceci, 2015; Carey et al., 2018, Carlson et al., 2020). Thus, to the extent that there are differences by gender in respect of hiring and promotion, these differences are unlikely to be due to a conscious preference for individuals of a particular gender, but rather by gendered patterns in hiring or promotion-relevant characteristics. I turn now to some of these other characteristics.
Literature indirectly relevant to career trajectories
There is a considerable body of literature on the way gender affects intermediate academic outcomes. Here I review the literature on journal review decisions, citations, teaching evaluations and grant success. Each of these can be an input to a subsequent promotion decision, and so evidence of strong effects of demographic characteristics on these outcomes would explain why disparities in career trajectories can persist despite stated and revealed preferences for more diverse faculty. In this subsection I omit certain other intermediate outcomes which might be inputs to promotion decisions (and for which gender, ethnicity or disability might play an important role), but which have been less studied. Impact and engagement, for example, has been discussed as a gendered area of academic life (Savigny 2020), but one which is hard to assess systematically outside of large scale administrative
exercises like the Research Excellence Framework.
Journal review decisions
A recent symposium in PS: Political Science and Politics brought together editors from several different journals in political science (American Political Science Review, International Studies Quarterly, Political Behavior, Comparative Political Studies, World Politics) to review gender effects in relation to editorial outcomes (König & Ropers, 2018; Nedal & Nexon, 2018; Peterson, 2018; Samuels, 2018; Tudor & Yashar, 2018). Three editorial teams (König & Ropers, 2018; Samuels, 2018; Tudor & Yashar, 2018) found significant gender differences: articles submitted by a single male author were significantly more likely to receive a desk-reject than articles submitted by a single female author or by teams of authors of the same or different genders. No editorial team found gender differences in acceptance decisions controlling for review scores. These findings in respect of desk rejections have also been found in studies of submissions to EPS (Stockemer et al. 2020) and European Political Science Review (Closa et al., 2020). Because the symposium dealt with administrative data on submissions, it was not able to identify gender differences in the rate at which men and women submit articles. A follow-up survey of members of North American political science departments (Djupe et al. 2018) suggested that gendered differences in rates of submission account for much of the gender gap in publications.
Citations
There is some evidence to suggest that articles written by women are cited less often than articles written by men when controlling for journal. This is true for political science (Dion et al., 2018) and international relations (Mitchell et al., 2013, cf. Ostby et al. 2013). This pattern is generated by a Matthew effect (to those who have, more will be given), whereby individuals, because they are more
More consistent evidence comes
from studies which present academics with hypothetical
candidates (who vary in their
gender and in other hiring-relevant
characteristics) and ask them to evaluate
those candidates

10BISA/PSA Career Trajectories Report June 2021
likely to cite work by others of the same gender, generate citations that are predominantly male when the subfield is predominantly male. This pattern may not be robust to the inclusion of other control variables which affect how ex ante likely an article is to be cited (Lynn et al., 2019). These findings on per-article citations should be distinguished from total career citations, which may be much higher for men than women because of a greater total volume of articles.
Teaching evaluations
There is considerable evidence of gender biases in student evaluations. This evidence shows that evaluations of female instructors are more negative than evaluations of male instructors. The strongest evidence of this comes from classes where individuals are randomly assigned to instructors of different genders (Boring, 2017), where the course content is identical (Chávez & Mitchell, 2020) or where the same instructor presents online as alternately male or female (MacNell et al., 2015). Ethnicity biases have been less studied than gender biases: Chávez & Mitchell (2020) reports no ethnicity bias comparing white and Hispanic instructors in a Texas institution.
Grant success
Generally, more grant money is given to male researchers than female researchers. There are different overlapping explanations as to why this is the case:• There are more male researchers
than there are female researchers;• Male researchers are more likely
to apply for grants than are female researchers, paralleling the “submission gap” in publications noted above;
• Conditional on applying, male researchers apply for more money than do female researchers;
• Conditional on applications and their characteristics, male researchers are more likely to be successful in their grant applications than are female researchers
Considering the UK, Boyle et al. (2015), in an analysis of the principal investigators of ESRC grant applications between 2008 and 2013, find that men are more likely to apply for grants, but that success rates of men and women are approximately equal (at ~18%). They give no clear answer as to whether male researchers apply for larger grants than female researchers: they show that, conditional on rank, award sizes are broadly similar, but they note that “the smaller number of female professors” accounts for several differences in the patterns they study. Overall, they find that 41% of ESRC funding went to women, less than the 41% of academic posts held by women. This is very different to the figure reported by Gonzalez Ginocchio et al. (2020), who find that, over the period 2006 to 2018, around 20% of ESRC funding in politics went to women. This finding depends on the authors’ coding decisions in relation to ESRC grants. Ideally, the ESRC would be able to provide statistics based on subject classifications provided by the grant applicants themselves, as well as providing an analysis by ethnicity.10
More generally, Bornmann et al. (2007), in a meta-analysis of studies of gender differences in grant success, finds that the odds of success for men are around 7% greater, and that (in a world where 50% of grant applications are successful) the difference in the probability of expected grant success is around 4%. This meta-analysis includes studies of grants in many different fields, and so the average effect may be a poor guide to the effects in any particular national and disciplinary context.
Other factors
Citations, research outputs and proxy evaluations of teaching quality are important parts of how cases for promotion and/or hiring are constructed, but other factors can also matter. Consider “academic service” or administrative tasks within a department: there is a common impression that female faculty members in the United States are called
10 The ESRC has promised to look in more detail at the patterns identified by Gonzalez Ginocchio et al. See https://twitter.com/ESRC/status/1368864570220163074?s=20 The ESRC provides statistics on awards by ethnicity, but these have not been analysed in the same detail as Boyle et al. (2015).
There is considerable evidence of gender
biases in student evaluations. This
evidence shows that evaluations of female instructors are more negative
than evaluations of male instructors

11BISA/PSA Career Trajectories Report June 2021
on to perform more academic service, and/or put greater effort in to these roles (Pyke, 2011); greater attention to service tasks may, if it detracts from research and teaching tasks, be under-valued by hiring and/or recruitment exercises which under-value or ignore entirely this kind of work.
One important but prestigious form of “academic service” is participation in the editorial board of a journal, an awards committee, or a REF panel. Gonzalez Ginocchio et al. (2020) find that the percentage of male members of the board of Political Studies has decreased from 77% (1998) to 54% (2018), and the percentage of male members of successive RAE/REF panels has decreased from 74% (2000) to 50% (2020).11 The same article, however, reports some alarming figures in relation to awards or prizes:
“Since 1998, the Harrison Prize for the author(s) of the best article in Political Studies has been awarded to 27 different men but to only 1 woman (in 2010). Between 1987 and [2016/17]... the Mackenzie prize given to the authors of the best book in political studies has been awarded to 33 men and 1 woman (in [2016/17])”
The article originally referred to the period 1987 to 2017. I have amended the quote to make the period more precise. This matters because the 2017/18 prize was awarded to a mixed-gender team
These disparities are much greater than the gender disparities in the book awards organized by sections of the American Political Science Association (Tatalovich and Frendreis, 2019). Because awards and prizes are more difficult to study systematically than are journal articles, it has been difficult to relate factors like awards to hiring and/or promotion decisions. If we make the reasonable assumption that awards and prizes do matter positively for hiring and promotion decisions, then the gendered patterns that Gonzalez Ginocchio et al (2020) point out should be a source of alarm.
Data
Like several of the studies discussed above, this study uses administrative data to track academics over time. In this section, I describe this data, paying particular attention to the variables present in the data (and further variables which can be constructed on top of these variables), but also discussing variables not found in the data due to its character as an administrative data-set released under conditions designed to prevent de-anonymization.
Source of the data
The source of the data used in the report is the Higher Education Statistics Agency (HESA), a quasi-public body which compiles statistics about staff and students in UK higher education. Universities submit information on their staff to HESA, which makes available summary statistics on the characteristics of university staff according to different characteristics. HESA sells “tailored datasets” which provide further details. The release of these tailored data-sets is governed by HESA’s obligations as a data controller, and in particular its obligation to preserve anonymity.
The data-set used here is a “tailored dataset” in this sense, and conditions govern its (re-)use. Some of these conditions affect the analysis here. For example: the data-set contains a unique employer identifier, but this unique employer identifier is an obfuscated version of the UK Provider Reference Number (UKPRN), the code used to track higher education providers. As a result, these employment records cannot be matched with institution-level participation in schemes like Athena SWAN or the Race Equality Charter.
Additionally, whilst the data-set itself contains information which could potentially be used to identify individual members of staff through a process of jigsaw identification, any re-use of the data may not enable such de-anonymization. As a result, this report does not include any cross-tabulations where there are
11 It is worth noting that since 2016 the prizes awarded by the PSA have changed significantly: Thomson and Kenny (2020), p. 5.

12BISA/PSA Career Trajectories Report June 2021
fewer than five people in each cell of the table. Additionally, the report does not include any four-way cross-tabulations (for example: the count of (i) female (ii) professors from (iii) an ethnic minority who are (iv) British nationals), and many of the two and three-way cross-tabulations have been produced after collapsing categories (for example: collapsing academic ranks into more senior and more junior ranks).
The scope of the data
The data includes all individuals who had one or more employment contracts with a higher education provider, or in respect of whom the HEP was obliged to pay National Insurance contributions, as of the 1st December of each academic year. Each individual may appear in the data more than once for a given reporting year where that individual has more than one employment contract, or where that individual carries out more than one activity for the HEP. Examples of individuals who have a single employment contract but who carry out multiple contracted activities include academics who carry out line-management duties, and may appear in the data in their capacity as a line manager to a given unit, and may also appear in their capacity as an individual carrying out research and teaching.
All individuals in the data possess a HESA staff identifier, a “unique code allocated to staff when they are first entered onto the HESA Staff record [which] remains with the member of staff for the whole of their career within higher education.” There is no central record linking staff identifiers to named individuals, and so the responsibility is on institutions to either create HESA identifiers, or seek out a previous identifier for hires from other institutions. The first two digits of the staff identifier give the last two digits of the calendar year in which the individual first took up a contractual position within UK higher education.12
As far as the temporal scope of the data is concerned, the data includes all academic staff (excluding
“atypical staff”) employed between the academic year 2012/13 and the academic year 2018/19 inclusive. More specifically, the data captures staff active on the 1st December during each reporting period. The data starts in 2012/13 because this is the first year in which staff reports were compiled on a consistent basis. The data ends in 2018/19 because processing of 2019/20 data only ended in the middle of January 2021 after this report was begun.
The data excludes “atypical staff”, but it is not always clear what is meant by this phrase. The HESA website gives the following definition:
“Atypical staff are those whose working arrangements are not permanent, involve complex employment relationships and/or involve work away from the supervision of the normal work provider. These may be characterised by a high degree of flexibility for both the work provider and the working person, and may involve a triangular relationship that includes an agent... Atypical contracts meet one or more of the following conditions: (a) are for less than four consecutive weeks - meaning that no statement of terms and conditions needs to be issued, (b) are for one-off/short-term tasks - for example answering phones during clearing, staging an exhibition, organising a conference... (c) involve work away from the supervision of the normal work provider - but not as part of teaching
12 See https://www.hesa.ac.uk/collection/c15025/a/staffid
As far as the temporal scope
of the data is concerned, the data
includes all academic staff (excluding “atypical staff”)
employed between the academic year
2012/13 and the academic year
2018/19 inclusive

13BISA/PSA Career Trajectories Report June 2021
company schemes or for teaching and research supervision associated with the provision of distance learning education, (d) involve a high degree of flexibility often in a contract to work as and when required - for example conference catering, student ambassadors, student demonstrators”.
Additionally, some staff, although they do not meet the conditions here, would not be captured by the data because they would not be employed as of the census date of the 1st December – for example, teaching assistants who were recruited to take seminars on a module which runs only in the spring term, and which therefore began employment at the start of January.
Variables found in the data
The data contains information on:• The (obfuscated) identity of the
HE provider and the region of the HE provider;
• Whether or not the HE provider is a “pre-1992” institution, a “post-1992” institution, or does not fit in either of these categories;
• The “contract level” of the staff member and their activity;
• The mode of employment (full-time or part-time) and the terms of employment (open-ended or fixed-term);
• The staff member’s sex, ethnicity, nationality and disability status;
• The “cost centre” for each staff member
Staff contract level and cost centre correspond roughly to academic rank and department, but there are important qualifications. The mapping between cost centres and departments is not one-to-one: in some situations, multiple departments may be grouped into a single cost centre, and “exceptionally”13 staff may be allocated across multiple
cost centres. The mapping between contract levels and academic rank is less clear. The contract levels in the data, together with HESA combined level descriptions,14 are as follows:• F1 Professor (“senior Academic
appointments which may carry the title of Professor but which do not have departmental line management responsibilities”)
• F2 Function head (“Full managerial responsibility for one or more activities and provides input into policy formation for those activities. Responsible for staff within the area of activity. Has delegated responsibility for budget setting and management within an area of activity”)
• I0 Senior lecturer (pre-92), principal lecturer (post-92), Reader, Principal Research fellow
• J0 Lecturer B (pre-92), Senior Lecturer (post-92), Senior Research Fellow
• K0 Lecturer A (pre-92), Lecturer (post-92), Research fellow, Researcher (senior research assistant), Teaching fellow
• L0 Research assistant, Teaching assistant
These contract levels allow the creation of proxies for career advancement, but the mapping between changes in contract levels and career advancement is inexact. Career advancement may occur without a change in contract level. For example: an individual may be promoted from Senior Lecturer to Reader (or Associate Professor), which would ordinarily be regarded as a promotion and a step forward in one’s career, but this promotion may not involve a change in contract level, since both job titles map on to contract level I0. Conversely, changes in contract level may not correspond to career advancement: a move from Senior Lecturer in a post-1992 university to Senior Lecturer in a pre-1992 university says more about the status hierarchies in UK higher education than it does about career advancement.
The variables included in the data include a number of variables which are protected characteristics under the Equality Act (sex, ethnicity, nationality,
13 See https://www.hesa.ac.uk/collection/c18041/a/accentre
14 See https://www.hesa.ac.uk/collection/c17025/combined_levels

14BISA/PSA Career Trajectories Report June 2021
and disability status), together with characteristics which are not protected but which are relevant for career progression, such as the nature of the individual’s contract, whether or not they work full-time or part-time, and their existing contract level. Other variables are included because they are bound up with how contract levels are recorded (for example: whether or not the employing institution is a pre- or post-1992 institution).
Variables not found in the data
The data does not include several characteristics which are protected characteristics under the Equality Act. Some of these characteristics are characteristics which are not commonly recorded by employers for the purposes of HESA returns. Gender reassignment, marital status, pregnancy, and “religion or belief” are examples of such characteristics. Age, however, is a protected characteristic which does form part of institutions’ HESA returns. Age is not present in this data release because the inclusion of information about individuals’ age, even in a coarsened form, makes it much easier to identify individuals. Where age is recorded as a year, then knowing a particular individuals’ age (or approximate age) can, when combined with their gender and rank, allow identification of the employing university. For cross-sectional data, age can be reported not as a single year, but as an age range. This allows information about age to be used without significant increases in the ability of data users to identify specific individuals. However, given that this data is panel data, data users will still be able to identify individual years of age for those individuals who cross an age category during the period of observation (for example: an individual who moves from a “30 to 39” category to a “40 to 49” category between December 2016 and December 2017 must have been born between December 1977 and December 1978.
Although age is not recorded in the data, there is a proxy measure of experience within the sector. As
noted above, the first two digits of each HESA staff identifier ought to give the year of first employment in the HE sector. Although it is wrong in general to equate “years since first employment in the sector” with “years of experience working in the sector”, years since first employment can proxy experience where a large proportion of the workforce either stays in higher education or leaves not to return. This proxy for experience also acts as an upper bound on age: individuals who first started work in HE in 2003 must have been at least 16 in that year, and so cannot have been born later than 1987, though they may of course have been born much earlier than that. Thus, although the omission of age is a regrettable consequence of the need to avoid the risk of de-anonymisation, the presence of a proxy for experience allows us to capture some patterns which are age-related.
Data processing
The HESA supplied data is administrative data based on employment records. As such, it retains certain features which complicate the analysis somewhat. Here I describe how I have filtered the data and assessed data quality.
I begin my analysis by filtering the data, keeping only individuals who have ever had an academic contract during the period 2012/13 to 2018/19, and only individuals who have ever worked in cost centre 128, “Politics and international studies”. I remove individuals who are part of a senior management team, who are heads of school or faculty, or who are “function heads”. I then “collapse” the data, so that each individual only appears once in any given year. I take the following steps in order:• Where there are multiple entries
corresponding to different cost centres, I take the entry corresponding to politics and international studies;
• Where there are multiple entries corresponding to different function (academic versus non-academic), I take the academic employment relationship;
Age is not present in this data
release because the inclusion of
information about individuals’ age,
even in a coarsened form, makes it much
easier to identify individuals

15BISA/PSA Career Trajectories Report June 2021
• Where there are multiple entries corresponding to different contract types, I take the open-ended contract over the fixed-term contract;
• Where there are multiple entries corresponding to different mode of employment, I take the full-time employment relationship;
• Where there are multiple entries corresponding to different contract levels, I take the entry with the higher contract level;
• Where there are multiple entries, I take the entry with the higher proportion of the week worked;
• Where none of the preceding steps have collapsed the data to a single individual, I randomly selected between entries
Many of these steps affect only a very small number of individuals. It is an open question whether the presence of individuals with (for example) contemporaneous full-time and part-time roles reflects errors in the data or genuine and unusual employment patterns.
We can indirectly assess the quality of the data by looking at the distribution of “years since first employment”, created on the basis
of the HESA staff identifier. Since this staff identifier has, as its first two digits, the year of entry into the sector, the distribution of this variable should show a distribution which is truncated at 2018 (the last year of the data), and which shows progressively fewer individuals who started in the sector in earlier years.
Figure 1 shows this distribution, and shows that the distribution of “first years of employment” is broadly as we would expect, except for a significant number of individuals whose HESA staff identifiers imply that they were first employed in 2000. It’s implausible to suggest that the higher education sector hired this many new starts in that year: all other spikes in the data (for example, the spike in 2013/14 before the census date for the 2014 REF) are much smaller relative to adjacent years. This spike is likely an artefact of the data. In the analyses of attainment and exit that follow, I carry out my analyses twice: once for all individuals in the data, and once for all individuals except those recorded as starting in 2000.15
Descriptive statistics
Table 1 shows descriptive statistics for selected ascriptive characteristics of staff employed in politics and international relations in the academic year 2018/19. The numbers and percentages are counts and percentages of individuals, rather than full-time equivalents. These numbers refer to individuals whose subject in 2018/19 was recorded as “politics and international relations”; some of the analyses that follow consider individuals who have moved between subjects.
The number of staff reported in Table 1 (3,341) is higher than the number of staff in politics and international relations reported by Pflaeger Young et al. (2020) (2,553). That report, which was based on university websites, excluded some staff included here, and also excluded some departments (De Montfort, Hertfordshire, Leeds Trinity, Northampton and London South Bank). The number of institutions
15 Excluding these individuals is not necessary in the analysis of promotion, since the analysis of promotion considers only individuals appointed in 2012/13 or later.
0
100
200
300
1970 1980 1990 2000 2010 2020
Year of first employment in HE
Cou
nt o
f in
divi
dual
s
Year of first employment for individuals in politics and international relations as of December 2018
Figure 1

16BISA/PSA Career Trajectories Report June 2021
recorded in this data is slightly greater than the number in that report (87 compared to 82). Since the median institutions employs 28 staff, this accounts for a small portion of the difference: most of the difference is accounted for by greater coverage of staff members at lower grades: there is little difference in the counts of Professors (521 compared to 518), but a much greater difference in the proportion of staff employed at the lowest rank in each exercise.
Turning now to the different characteristics listed in the total, the figure given for the proportion of female staff in politics and international studies is higher than the figure given by Pflaeger Young et al. (2020). Pflaeger Young et al. (2020) report that 36% of political scientists in UK departments of politics are female, three percentage points fewer
than the figure given here. Figures for the proportion of female staff 2012/13 (not shown here) are also three to four percentage points lower than the equivalent figure in Bates et al. (2012). For both years the number of staff present in the HESA data is greater than the number of staff listed on the websites of university departments of political science, and more of the individuals not present on these websites (or, for various reasons, not counted by Bates et al. (2012) and Pflaeger Young et al. (2020)) are female.
Table 2 goes on to show some conditions of employment, again for the most recent year. Most staff (75%) are full-time staff, and the proportion of full-time staff is close to (but higher than) the proportion of staff on open-ended contract. The “modal” employment relationship is a full-time open-ended contract. The distribution of staff across contract levels appears plausible giving allowance for the way in which these levels are recorded, and the way in which these may imperfectly map on to titles (see above). Finally, compared to academia as a whole, a much greater proportion of staff in politics and international relations work in pre-1992 universities (85% compared to 63%).
I move on from these tables to reporting cross-tabulations of seniority by different characteristics. Table 3 gives the number of individuals at each staff level according to their sex, together with percentages indicating the proportions by staff level.16 The proportions of female staff by staff level are consistent with the figures reported elsewhere for senior staff: 22.6% of professors are female, compared to the figure of 24% given by Pflaeger Young et al. (2020).17 The proportion of men is always increasing when comparing more senior to more junior ranks.
Table 4 gives information on the number and proportion of individuals according to ethnicity, with three ethnic groups (Asian, Black, Mixed and Other) collapsed into a single ethnic minority category. Collapsing these categories into a single category is necessary to ensure that all cell
Ascriptive characteristics of staff in the most recent year (2018/19)
Characteristic N = 3,341
Sex
Female 1,294 (39%)
Male 2,047 (61%)
Ethnicity
Asian 211 (6.3%)
Black 38 (1.1%)
Mixed 106 (3.2%)
Not known 303 (9.1%)
Other 87 (2.6%)
White 2,596 (78%)
Nationality
EU 876 (26%)
Non-EU 599 (18%)
Not known 20 (0.6%)
UK 1,846 (55%)
Table 1
Characteristics of staff contracts in the most recent year (2018/19)
Table 2
Characteristic N = 3,341
Contract type
Fixed-term 1,010 (30%)
Open-ended 2,331 (70%)
Full time 2,518 (75%)
Staff level
RA/TA 36 (1.1%)
TF/L 1,134 (34%)
L/SL 855 (26%)
SL/Reader 795 (24%)
Professor 521 (16%)
Pre/post-1992 institution
Post 490 (15%)
Pre 2,851 (85%)
Seniority by gender in the most recent year
Table 3
Gender RA/TA TF/L L/SL SL/Reader Professor
Female 15 518 374 269 118
(41.7%) (45.7%) (43.7%) (33.8%) (22.6%)
Male 21 616 481 526 403
(58.3%) (54.3%) (56.3%) (66.2%) (77.4%)
16 Staff members who reported a sex other than male or female have been excluded from the table, as the cell counts featuring breakdowns by additional characteristics were less than five, and a condition of this use of the data is suppression of cell counts which are potentially disclosive.
17 This comparison is approximate: Pflaeger Young et al. deal with gender, as inferred from name and appearance (Heath-Kelly 2020), whilst this report deals with sex as recorded by employing institutions.

17BISA/PSA Career Trajectories Report June 2021
counts are greater than five, which is a condition of the use of the data. In the appendix I show a table which instead collapses academic ranks and retains the full range of ethnicity categories.
Table 4 shows that the majority of staff at all staff levels are white. White staff are least common amongst research and teaching assistants, but the proportion of staff whose ethnicity is not known is also highest amongst this group. The proportion of staff who are white is also always increasing when comparing more senior to more junior ranks.
Because of the large number of individual characteristics, it is not possible to show all possible cross-tabulations of characteristics here. The
appendix to the report includes all possible two-way and three-way cross-tabulations of individual characteristics for individuals employed in 2018/19.
Descriptive statistics over time
In order to demonstrate changes over time, I plot the proportion of staff that are female, and the proportion of staff belonging to an ethnic minority. I do this separately for each year for all staff, and for staff at the two most senior ranks (“SL/Reader”, “Professor”). This is plotted in Figure 2. The figure shows constant increases in the proportion of female staff at all levels and at senior levels, but only inconstant progress for staff from ethnic minorities.
The slope of both lines is shallow. The proportion of staff that are female, and the proportion of senior staff that are female, increase at the same rate of four-fifths of one percentage point per year. If these trends were to have continued after 2018/19, then the proportion of female staff should now (2020/21) match the proportion of female PGR students in politics (40%: Pflaeger Young et al. (2020), fig. 1), and would reach 50% by the academic year 2033/34. Women would only make up half of senior lecturers/readers and professors by 2045/46. I do not repeat these calculations for the proportion of staff who belong to an ethnic minority both because the trend is more uncertain (there are years where there is no change in the proportion) and because the proportion of ethnic minority individuals in the broader UK population is changing comparatively rapidly.18 Progress in relation to a static target might therefore be misleading.
Table 4
Ethnicity RA/TA TF/L L/SL SL/Reader Professor
Ethnic minority 9 208 109 82 34
(25%) (18.3%) (12.7%) (10.3%) (6.5%)
Not known 7 119 65 60 52
(19.4%) (10.5%) (7.6%) (7.5%) (10%)
White 20 807 681 653 435
(55.6%) (71.2%) (79.6%) (82.1%) (83.5%)
Seniority by ethnicity in the most recent year
All (39%)
All (13%)
SL/Reader orProfessor (29%)
SL/Reader orProfessor (9%)
Female staff
Ethnic minority staff
0.0%
10.0%
20.0%
30.0%
40.0%
50.0%
2012/13 2013/14 2014/15 2015/16 2016/17 2017/18 2018/19
Academic year
Prop
orti
on
Figure 2
Proportion of all staff that are female (blue solid line) or from an ethnic minority (orange solid line). Dashed lines give proportions of staff at senior levels (senior lecturer/reader or professor) who are female or from an ethnic minority.
18 The proportion of the UK population that is White British is projected to fall from 86.9% in 2011 to 74.5% by 2061 (Lomax et al., 2020).

18BISA/PSA Career Trajectories Report June 2021
How does this compare to other disciplines in the social sciences?
The previous section showed the proportions of staff in departments of politics according to different characteristics. These proportions are never high or low in an absolute sense, but are only ever high or low according to some reference group. Different possible reference groups include the UK population, the UK working age population, the population of students
studying politics, or the population of PGR students studying politics. Here I compare the situation in departments of politics and international relations to the situation in other departments in the social sciences.
I consider proportions of staff according to two characteristics: sex and ethnicity. For each characteristic and each subject, I calculate the proportion of staff in that area who belong to the traditionally minority group (female staff, ethnic minority staff). I also calculate the association between membership in the minority group and higher staff level. I do this by calculating the ratio of senior staff (individuals with contract levels SL/Reader or Professor) to junior staff (individuals with contract levels below SL/Reader or Professor). I do this separately for female and male members of staff. I then divide these two numbers. Numbers below one indicate that women are under-represented at senior levels. For example: in politics and international relations we know from Table 2 that there are 481 senior female academics (329 + 152), and 1105 junior academics, for a ratio of 0.44. The equivalent ratio for men is 0.82. The ratio between these two quantities is 0.54.
The top panel of Figure 3 shows that the proportion of female staff in politics and international relations is greater than the proportion of female staff in economics, and approximately equal to the proportion in geography. However, the proportion for politics and international relations is lower than the proportions in business and management, law, or sociology. The relative seniority of female staff in politics and international relations is greater than in economics or geography, but lower than in business and management, law, or sociology. Generally, disciplines with more female staff have a greater proportion of female staff in senior roles.
The bottom panel of Figure 3 shows that the proportion of BAME staff in politics and international relations is greater than the proportion of BAME staff in geography, social work, and sociology. However, the proportion
Anthropology
Archaeology
Area studies
Business and management
Economics
Geography
Law
Politics
Social work/social policy
Sociology
0.4
0.5
0.6
0.7
60.0%
Proportion of academic staff that are female
Rati
o of
sen
ior
to ju
nior
fem
ale
acad
emic
s,di
vide
d by
rat
io o
f se
nior
to
juni
or m
ale
acad
emic
s
Anthropology
Archaeology
Area studies
Business and management
Economics
Geography
Law
Politics
Social work/social policy
Sociology
0.5
0.6
0.7
0.8
10% 20%
Proportion of academic staff from ethnic minorities
Rati
o of
sen
ior
to ju
nior
eth
nic
min
orit
y ac
adem
ics,
divi
ded
by r
atio
of
seni
or t
o ju
nior
whi
te a
cade
mic
s
30.0% 40.0% 50.0%
0.8
Anthropology
Archaeology
Area studies
Business and management
Economics
Geography
Law
Politics
Social work/social policy
Sociology
0.4
0.5
0.6
0.7
60.0%
Proportion of academic staff that are female
Rati
o of
sen
ior
to ju
nior
fem
ale
acad
emic
s,di
vide
d by
rat
io o
f se
nior
to
juni
or m
ale
acad
emic
s
Anthropology
Archaeology
Area studies
Business and management
Economics
Geography
Law
Politics
Social work/social policy
Sociology
0.5
0.6
0.7
0.8
10% 20%
Proportion of academic staff from ethnic minorities
Rati
o of
sen
ior
to ju
nior
eth
nic
min
orit
y ac
adem
ics,
divi
ded
by r
atio
of
seni
or t
o ju
nior
whi
te a
cade
mic
s
30.0% 40.0% 50.0%
0.8
Patterns of presence and seniority in other social scientific disciplines
Figure 3
19BISA/PSA Career Trajectories Report June 2021
is lower than the proportion in economics or business and management. The relative seniority of BAME staff in politics and international relations is lower than any other social science discipline. Generally, there is no strong relationship between the proportion of BAME staff in each discipline, and the relative seniority of those staff.
Attainment
These figures on relative seniority provide an initial insight into patterns of attainment in the profession. By attainment, I mean, “the contract level staff members currently have”, independently of the process by which they arrived at that contract level (through promotion or through initial recruitment at that level). Modelling attainment allows us to identify whether any of the bivariate associations between staff level and individual characteristics such as sex or ethnicity (described in the previous section) are still present when controlling for other variables which are relevant for attainment, such as length of experience or contract type.
In this section, I model the attainment of staff members as a function of several different variables. These variables are grouped into three categories:• demographic characteristics
of sex, ethnicity, disability, nationality
• contractual characteristics such as full-time status and contract type (open-ended versus fixed-term)
• control characteristics which may be associated both with demographic characteristics and attainment, such as experience, region, and whether or not the employer is a pre/ or post-1992 institution, together with a random number which encodes the employing institution
Most of these variables are recorded as dummy variables, where a value of one indicates possession of some characteristic and zero the lack of that characteristic. By convention, the largest group within each category is taken as the reference group, and
so there are dummy variables for female, ethnic minority and disabled staff rather than dummy variables for male or white staff or staff with no known disability. One exception is experience, which is a continuous variable created using the HESA staff identifier. “Experience” just means “years since first employment in HE”. Note that experience does not appear as a term in the results tables, because experience is modelled flexibly as a spline, which does not have a single coefficient but many piecewise terms. In this respect experience is similar to “region” and “institution”, which enter into the model as random effects, and which are not reported in the model tables.
I model attainment in two different ways. I first model attainment as an ordered variable with five levels: RA/TA, TF/Lecturer, Lecturer/Senior Lecturer, Senior Lecturer/Reader, and Professor. As noted above, these are labels I have attached to different HESA categories, and these labels may correspond to different titles in different institutions (particularly for universities which have adopted the nomenclature of Assistant/Associate/Full Professor). I use an ordered logistic regression to model attainment, described by Bürkner & Vuorre (2019) as a “cumulative model”. The coefficients in this model show the association, on the log odds of moving into a more senior category, of a one-unit change in the relevant independent variable. Coefficients greater than zero indicate that membership in a category, or having more of the relevant variable, is associated with higher attainment.
I also model attainment as attaining one of two senior ranks (SL/Reader or Professor). I use a logistic regression to model attainment understood in this way. The results from this logistic regression are not qualitatively different to the results of the ordered logistic regression. Because the logistic regression has a simpler interpretation, I estimate model-derived quantities of interest using the logistic regression rather than the ordered logistic regression.
Both the ordered logistic and logistic regression models are estimated using
Most of these variables are
recorded as dummy variables,
where a value of one indicates
possession of some characteristic and
zero the lack of that characteristic
20BISA/PSA Career Trajectories Report June 2021
Bayesian methods. Bayesian methods are appropriate for circumstances where researchers have access to the whole population of data rather than a sample. Rather than talking about findings which are “statistically significant” or “not statistically significant”, “Bayesians” talk directly about the probability that a particular coefficient is positive or negative. Where the probability that a particular coefficient is positive (or negative, as the case may be), I shall talk not about significant results, but about findings we can have high confidence in.
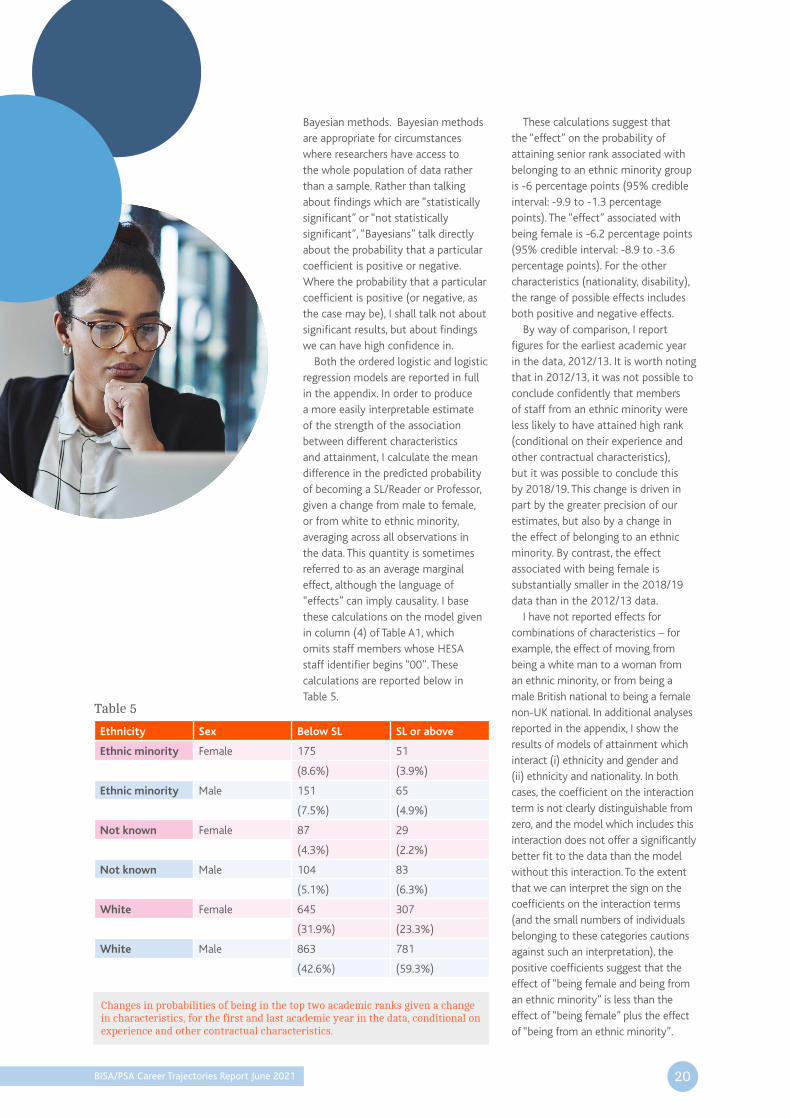
Both the ordered logistic and logistic regression models are reported in full in the appendix. In order to produce a more easily interpretable estimate of the strength of the association between different characteristics and attainment, I calculate the mean difference in the predicted probability of becoming a SL/Reader or Professor, given a change from male to female, or from white to ethnic minority, averaging across all observations in the data. This quantity is sometimes referred to as an average marginal effect, although the language of “effects” can imply causality. I base these calculations on the model given in column (4) of Table A1, which omits staff members whose HESA staff identifier begins “00”. These calculations are reported below in Table 5.
These calculations suggest that the “effect” on the probability of attaining senior rank associated with belonging to an ethnic minority group is -6 percentage points (95% credible interval: -9.9 to -1.3 percentage points). The “effect” associated with being female is -6.2 percentage points (95% credible interval: -8.9 to -3.6 percentage points). For the other characteristics (nationality, disability), the range of possible effects includes both positive and negative effects.
By way of comparison, I report figures for the earliest academic year in the data, 2012/13. It is worth noting that in 2012/13, it was not possible to conclude confidently that members of staff from an ethnic minority were less likely to have attained high rank (conditional on their experience and other contractual characteristics), but it was possible to conclude this by 2018/19. This change is driven in part by the greater precision of our estimates, but also by a change in the effect of belonging to an ethnic minority. By contrast, the effect associated with being female is substantially smaller in the 2018/19 data than in the 2012/13 data.
I have not reported effects for combinations of characteristics – for example, the effect of moving from being a white man to a woman from an ethnic minority, or from being a male British national to being a female non-UK national. In additional analyses reported in the appendix, I show the results of models of attainment which interact (i) ethnicity and gender and (ii) ethnicity and nationality. In both cases, the coefficient on the interaction term is not clearly distinguishable from zero, and the model which includes this interaction does not offer a significantly better fit to the data than the model without this interaction. To the extent that we can interpret the sign on the coefficients on the interaction terms (and the small numbers of individuals belonging to these categories cautions against such an interpretation), the positive coefficients suggest that the effect of “being female and being from an ethnic minority” is less than the effect of “being female” plus the effect of “being from an ethnic minority”.
Ethnicity Sex Below SL SL or above
Ethnic minority Female 175 51
(8.6%) (3.9%)
Ethnic minority Male 151 65
(7.5%) (4.9%)
Not known Female 87 29
(4.3%) (2.2%)
Not known Male 104 83
(5.1%) (6.3%)
White Female 645 307
(31.9%) (23.3%)
White Male 863 781
(42.6%) (59.3%)
Table 5
Changes in probabilities of being in the top two academic ranks given a change in characteristics, for the first and last academic year in the data, conditional on experience and other contractual characteristics.

21BISA/PSA Career Trajectories Report June 2021
Promotion
The associations described in the previous section on attainment show relationships between different characteristics and attainment, conditional on a proxy for experience based on HESA staff identifiers. The patterns identified are compatible with several different mechanisms, including:• appointing white men at higher
ranks upon initial entry;• promoting white men quicker;
and• disproportionate exit, such that
ethnic minority or female staff members exit early leaving a disproportionate number of white men in senior positions.
One of the advantages of the panel data from HESA is that it is possible to track (a subset of) individuals from their initial appointment to any subsequent promotion. In this section, I study the career trajectories of individuals taking up a role in higher education from 2012/13 onwards, and who were not appointed directly to one of the top two staff levels (SL/Reader or Professor). For these individuals, I am able to control directly for experience, rather than use a proxy derived from the HESA staff number. I model their trajectory using a survival model: a statistical model used when an event or state has either happened/been reached already, or has not happened yet, without any further implication that it will not happen in the future.
One of the disadvantages of following individuals appointed for the first time in 2012/13 or later is that this substantially reduces the size of the sample available for analysis. I take some steps to mitigate this. Because individuals can be promoted “into” a role in politics and international relations, as well as being promoted “out of” this field, my analysis here includes individuals who have, at any time in this period, worked in politics and international relations. The analysis therefore concerns a slightly different set of individuals than the individuals described in Tables 1 – 3. With these individuals now included in
the analysis, the number of individuals appointed after the academic year 2012/13 to ranks lower than SL/Reader or Professor is just 1,727. The reduction in the number of individuals, and the short time period considered, make it more difficult to find effects in which we can be confident, even where those effects are similar in magnitude to the effects implied by the analysis of attainment.
A further disadvantage of following individuals appointed for the first time in 2012/13 or later is that it severely conditions the analysis of the effects of sex in promotion, as these are mediated by parenthood. Assume for the sake of argument that individuals embark on an academic career after having started university at the age of 18 and having studied for seven years (a 3 + 1 + 3 model). Such an individual might enter the data at 25, and exit the data after six years at the age of 31. However, the average (mean) age of mothers at the birth of their first child is, for mothers with a degree, 33 years of age.19 This “averaged” individual would therefore exit the data before having a child. This stylised representation is obviously inaccurate, but not grossly so, and the errors may offset one another (for example: individuals may start academic careers later, but may also have children later). Thus, to the extent that the effects of sex in promotion are mediated through parenthood, the estimates here are likely to under-estimate these effects.
Promotion takes many different forms, and with a large number of different staff levels (5 in total) it would be possible to create many different measures of promotion (promotion from RA/TA to any higher staff level; promotion from Lecturer to any higher staff level, and so on). Here, I operationalize promotion as involving a transition between being an RA/TA, Lecturer, or Lecturer/Senior Lecturer, to being a Senior Lecturer/Reader or Professor, as those levels are defined in the HESA data. Although this measure of promotion ignores certain meaningful career events, it is consistent with the analysis given above of attainment of senior rank.
19 Office for National Statistics, “Mean age of mother at birth of first child, by highest achieved educational qualification, 1996 to 2016, England and Wales”, available online at https://www.ons.gov.uk/peoplepopulationandcommunity/birthsdeathsandmarriages/conceptionandfertilityrates/ adhocs/008981meanageofmotheratbirthoffirstchild byhighestachievededucationalqualification 1996to2016englandandwales. The ONS does not report separately mean ages by post-graduate qualifications
One of the advantages of the
panel data from HESA is that it
is possible to track (a subset of) individuals
from their initial appointment to any subsequent
promotion

22BISA/PSA Career Trajectories Report June 2021
In order to visualize staff promotion over time, I use a Kaplan-Meier plot. A Kaplan-Meier plot is the simplest way of visualizing trajectories in a way which respects the censoring of observations, or the way in which we only know whether individuals have been promoted yet, rather than ever will be promoted. Here, of course, we are not interested in “survival trajectories”, but in the chances of promotion, and its converse, remaining at the same rank. The plot shows, for each time point, the proportion of individuals who are still “at risk” of promotion, or who have not been promoted yet.
Figure 4(a) shows the Kaplan-Meier plot for all individuals who entered the data after the first year (2012/13). The line shows the probability of remaining at lower-rank for individuals at each year. The lower the line, the greater the probability of promotion. The line is constructed as follows: in the second year of employment (the earliest possible time at which one can be promoted), the number of promotion events recorded was 11, and the number of individuals “at risk” was 1666. The promotion rate is therefore 16/1666 = 0.66%, and the “survival rate” is one minus the promotion rate, or 99.4%. At time 3 (the third year of employment), there were 1032 individuals at risk (the original 1666, minus those were promoted or exited or who were “right-censored”
All
0%
25%
50%
75%
100%
1 2 3 4 5 6 7
Year of employment
Prop
orti
on o
f in
divi
dual
sst
ayin
g at
sam
e ra
nk
(a) All
Female
Male
0%
25%
50%
75%
100%
1 2 3 4 5 6 7
Year of employment
Prop
orti
on o
f in
divi
dual
sst
ayin
g at
sam
e ra
nk
(b) by gender
Ethnic minority
White/not known
0%
25%
50%
75%
100%
1 2 3 4 5 6 7
Year of employment
Prop
orti
on o
f in
divi
dual
sst
ayin
g at
sam
e ra
nk
(c) by ethnicity
KnownNot known
0%
25%
50%
75%
100%
1 2 3 4 5 6 7
Year of employment
Prop
orti
on o
f in
divi
dual
sst
ayin
g at
sam
e ra
nk
(d) by known disability
because we reached the end of the period analysed), and of these 23 were promoted. The risk at this point is therefore 23/1032, and the survival risk is 1 - 23/1032 = 97.8%. In order to get the point plotted in the Kaplan-Meier curve, we multiply the probability at time 2 times the probability at time 3. Figure 1(a) tells us that at time 6 (= the 6th year of employment, or 5 years after starting) the probability that an individual who entered as a lecturer or L/SL is promoted to SL/Reader or Professor is around 22%, but it could be as low as 18% or as high as 26%.
Other Kaplan-Meier plots are shown in Figures 4(b) - 4(d). These plots show separate curves for different groups. The “higher” the curve, the more likely that group is to remain at its rank. The plots show that promotion is slower for women than for men; is approximately equal for white staff and staff from ethnic minorities; and is quicker for staff with known disabilities than it is for staff with no known disabilities. However, none of these differences are statistically significant, as can be seen from the way the coloured ribbons extending either side of the trend lines always overlap. Overlaps exist even where the differences are large because of the small number of individuals involved. This is most obviously the case when comparing individuals with a known disability to individuals without such a disability.
Kaplan-Meier plots of promotion by characteristic
Figure 4

23BISA/PSA Career Trajectories Report June 2021
Kaplan-Meier plots are helpful for visual differences in the risk of promotion according to characteristics taken one at a time. However, to move beyond an analysis of single characteristics, it is necessary to estimate an appropriate statistical model. Here I use a Cox proportional hazards regression model. Models of this kind assume that different characteristics multiply some underlying risk of promotion, and that the underlying risk of promotion across time is the same for all individuals within the same stratum. Where different groups of individuals have different underlying risk profiles across time, these groups can be given different underlying or baseline risks which are multiplied by the same set of characteristics. Characteristics can therefore either define different strata or multiply a baseline risk. As with all regression models involving discrete outcomes, variables which are “perfect predictors” of the outcome must be discarded. My data covers individuals appointed for the first time to a position in higher education after 2012/13, and who were not appointed directly to the rank of SL/Reader or Professor. I also exclude individuals who were appointed as RA or TA. I exclude these individuals because “being an RA or TA” is a perfect predictor of “not being promoted in a six-year period”. I use as my predictor variables many of the same variables
used above, including gender, ethnicity, and the presence of a known disability. I also include some additional variables. One additional variable is the current rank of the individual (whether Lecturer or Lecturer/Senior Lecturer). The other additional variable is whether or not the individual, directly prior to their appointment, was working in a higher education provider overseas. This is necessary to account for heterogeneity amongst “new starts”: whilst the HESA data provides complete coverage of individuals once they enter the UK higher education system, individuals may of course be new to UK higher education whilst having significant experience gained in other jurisdictions.
I use as variables defining strata the interaction between full-time/part-time contract types, and open-ended versus fixed-term contract types. This means (for example) that I am assuming that individuals who are otherwise alike but who are on full-time contracts face a different underlying risk of promotion to individuals on part-time contracts, but that otherwise alike individuals who both have full-time open-ended positions have the same underlying risk. Including these contract type variables as variables defining strata is necessary to avoid violations of the proportional hazard assumption. Because individuals in this analysis can move between institutions, I do not include region or institution random intercepts in the model. In other respects (method of estimation, priors used) the model is similar to the model used to analyse attainment.
As before, I report the details of the model in an , and instead report changes in the probability of promotion associated with changes in relevant ascriptive characteristics. These are shown in Table 6. In no case can we be confident that having a particular ascriptive characteristic is associated with a promotion advantage or disadvantage. All of the changes in predicted probabilities are small, but this is to be expected given that these are changes in the probability of being promoted in a given year, and the probability of being
Change Change in probability of being SL/Reader(2012/13)
Change in probability of being SL/Reader(2018/19)
Ethnic minority (v. white)
-4.5% -5.6%
[-11%, +2%] [-9.9%, -1.3%]
Female (v. male) -10.2% -6.2%
[-14%, -6.4%] [-8.9%, -3.6%]
Known disability (v. no known disability)
-1.2% -1.4%
[-12.4%, +9.8%] [-7.9%, +5.1%]
EU national (v. UK) +5.9% +2.6%
[+0.7%, +11.5%] [-1.4%, +6.4%]
Non-EU national (v. UK)
-2% -2.3%
[-6.7%, +2.5%] [-5.6%, +1%]
Table 6
Changes in the probability of promotion given a change in an ascriptive characteristic, conditional on experience and other contractual characteristics

24BISA/PSA Career Trajectories Report June 2021
promoted in a given year is always relatively small. Even small changes can have large consequences when compounded over multiple years. An effect size of -2 percentage points, repeated over ten years, would reduce the probability of being promoted by (1 – 0.02)10 = 82% of the baseline probability. An effect this large would probably be regarded as substantively significant, and so further research is necessary to render these estimates more precise. Repeating this analysis five to seven years from now would enable a much larger group of individuals to be followed over time, and would have greater power to detect differences in promotion prospects.
Exit
Promotion is one outcome that can usefully be studied by following individuals over time. The same is true for exit from academia. Exit from academia is not recorded directly in HESA data, since the data records only individuals working in academia. Exit is, however, implied by the data. An individual exits UK higher education if an individual was featured in the data in some year and does not feature in the following year.
Exiting from UK higher education is not the same as exiting HE, or exiting politics and international relations. Because the data only covers individuals employed in UK HE institutions, it cannot distinguish between an individual who does not appear in a given year because they have started work in another country, and an individual who does not appear in a given year but who is still working in the UK. Nor can the data distinguish between different types of exit: individuals may exit because of their own volition, because they were made redundant, or because a fixed-term contract came to an end and because the individual was not able to obtain a subsequent job.
Exiting from UK higher education is also broader than “exiting the UK study of politics and international relations”. Because the data contains information on all academics
employed in UK higher education institutions (and not just academics working in politics and international relations), I am able to identify cases where an individual has switched from one subject area to another. There might be grounds for studying exit from politics and international relations as a distinct phenomenon: it would be important to know whether our disciplinary climate was so bad as to cause many individuals to seek out appointments in departments of sociology or philosophy or economics. However, because switches of subject are rare, and may result from awkward cases (individuals with multiple employment functions; individuals in organisations which reorganise), I keep my focus on exit from UK higher education.
Exit from UK higher education can, like promotion, be studied using Kaplan-Meier plots and the tools of survival analysis. Unlike the section on promotion above, my analysis of exit from UK HE includes all individuals in the data, and uses as a control variable the length of experience of UK HE implied by each individuals’ HESA staff number. As in my analysis of attainment, I estimate models on all individuals and all individuals except those with a HESA identifier beginning in 00.
Exit from UK HE is uncommon, but not perhaps as uncommon as staff on open-ended contracts might think. In the average year, 12.18 percent of individuals employed exited UK HE the following year, with 2146 exits in total. A small number of individuals (56) exited HE more than once. Most departures (1315 of 2146) were departures of staff on fixed-term contracts.
As before, I show Kaplan-Meier plots of exit from UK higher education. These show the association between one characteristic at a time and staying in higher education. The top left panel (Figure 5(a)) shows the overall survival rate over time. Because we have information from the staff identifier as to the first year each staff member started working in a UK higher education institution, we are able to estimate survival curves over a

25BISA/PSA Career Trajectories Report June 2021
much longer period. That is: we know the approximate shape of the survival curve between twenty and thirty years, even though our data only spans six years, because there are individuals who are recorded as having started work in UK higher education in the mid-nineteen eighties.
Figure 5(a) shows that the one-year survival rate is quite low, at just over 75%. Thus, although the average probability of exit for any given person is low (12%), this average includes individuals for whom the risk of exit
is very high (individuals in their first year) and individuals for whom the risk of exit is very low (individuals at ten or twenty years). The survival rate decreases from three-quarters to one-half after three years, and from one-half to one-third in the sixth year. Changes in the survival rate after the sixth year are very small – of the order of one or one-half a percentage point.
Figures 5(b) to 5(d) go beyond this to examine exit by different protected characteristics. The plotted curves are not easily distinguishable in Figures 5(b) (gender) and 5(d) (disability). The survival curves do seem different when plotted separately for individuals of different ethnicity (Figure 5(c)). However, it is possible that these differences (or similarities) will change when modelling survival as an outcome of several different variables, including not just protected characteristics but also contractual status.
Models of exit are reported in the appendix, but changes in the probability of exit are reported in Table 7. The table shows that two characteristics are reliably associated with higher rates of exit: belonging to an ethnic minority, and being a national of a country other than the UK. These characteristics have different implications for exit from UK higher education. Having citizenship of a country other than the UK can signify ties to another country, familiarity
All0%
25%
50%
75%
100%
0 10 20 30 40
Year of employment
Prop
orti
on o
f in
divi
dual
sst
ayin
g in
UK
HE
(a) All
Female
Male0%
25%
50%
75%
100%
0 10 20 30 40
Year of employment
Prop
orti
on o
f in
divi
dual
sst
ayin
g in
UK
HE
(b) by gender
Ethnicminority
White/not known
0%
25%
50%
75%
100%
0 10 20 30 40
Year of employment
Prop
orti
on o
f in
divi
dual
sst
ayin
g in
UK
HE
(c) by ethnicity
KnownNot known
0%
25%
50%
75%
100%
0 10 20 30 40
Year of employment
Prop
orti
on o
f in
divi
dual
sst
ayin
g in
UK
HE
(d) by known disability
Figure 5
Kaplan-Meier plots of exit by characteristic
Changes in probability of promotion given a change in an ascriptive characteristic, conditional on experience and other contractual characteristics
Change Change in probability of promotion
Ethnic minority (v. white) -0.4%
[-2.1%, +1.1%]
Female (v. male) -0.2%
[-1.3%, +0.9%]
Known disability (v. no known disability) +1.8%
[-0.8%, +3.9%]
EU national (v. UK) +1%
[-0.5%, +2.5%]
Non-EU national (v. UK) +0.7%
[-0.6%, +2%]
Table 7

26BISA/PSA Career Trajectories Report June 2021
with that country’s labour market and educational system, and thus greater opportunities of exit to academic employment in that country. At the same time, although citizenship of another country can offer greater employment opportunities outside the UK, the past few years have seen many colleagues exit UK higher education as a result of factors which were outside of their control (i.e., the UK’s exit from the European Union) rather than as a result of increased or additional opportunities in their home country.20
The size of the effect of belonging to an ethnic minority is substantial. Recall that these are changes in the probability of exit in a single year, and that therefore the cumulative impact of these differences can be much larger. Consider, as an example, a closed academic population of 3,000 individuals made up of equal numbers of white staff and staff from ethnic minorities, and where rates of exit are 8% for white staff and 10% for ethnic minorities. After 10 years, the number of white staff will have shrunk to 651 individuals (1,500 times (100% – 8%) to the power 10). At the same time, the number of ethnic minority staff will have shrunk much further to 523 individuals. What was (by construction) a population split 50:50 across these two categories is now majority (55:45) white after just ten years.
Although the effect (on the probability of exit) of being female is
not clearly distinguishable from zero, it comes close, and the lower range of the credible interval reported in the table is roughly as large in size as the effect of belonging to an ethnic minority (though in the opposite direction). In discussion of the findings of the model relating to attainment, I noted that gendered differences in attainment might arise through differential patterns of exit, and in particular that a greater proportion of men might attain professorial rank if women were more likely to exit. Since the relationship between gender and exit seems, if anything, to be the other way round, there may be an argument for expecting (in the long run) a greater proportion of women amongst professors than amongst academic staff generally.
Changes in probability of exit given a change in an ascriptive characteristic, conditional on experience and other contractual characteristics
Change Change in probability of exit
Ethnic minority (v. white) +2%
[+0.3%, +3.6%]
Female (v. male) -1.1%
[-2.3%, +0.1%]
Known disability (v. no known disability) +0.6%
[-2.3%, +3.2%]
EU national (v. UK) +3.1%
[+1.5%, +4.8%]
Non-EU national (v. UK) +2.3%
[+1%, +3.7%]
Table 8
20 See, for example, Anna Fazackerley, “Gender pay gap expert among top professors quitting Brexit Britain”, The Guardian, 25th March 2019

27BISA/PSA Career Trajectories Report June 2021
The descriptive statistics concerning ethnicity are new, and are more difficult to interpret. The proportion of staff within departments of politics and international relations who belong to an ethnic minority is comparable to other adjacent disciplines, but politics and international relations is regrettably distinctive in having a low proportion of ethnic minority members of staff in senior positions. The trends over time with respect to seniority are also more difficult to interpret given the small numbers of staff involved. The small numbers of staff involved also make it more difficult to analyze the representation of specific ethnic minorities. There ought to be a discussion about why there are fewer than forty black members of staff working in politics and international relations, but that discussion is unlikely to be a discussion where statistical modelling can be of much use.
The descriptive statistics presented in this report are important, but the greater part of the report deals with models of particular processes, and specifically attainment, promotion and exit. In some sense, these models also offer a form of description, albeit a description of a more complicated kind. These models allow me to say, for example, that differences in attainment between white staff and staff from ethnic minorities remain when controlling for length of experience in the sector and type of institution. That is not the same as saying there is a causal link between ethnicity and contract level,21 but it does show that some common responses to sex- or ethnicity-related disparities (“the problem will fix itself in a few years as cohorts move through”) are not well-grounded.
The model of attainment shows that white staff, and male staff, are more likely to have higher attainment
than staff from ethnic minorities, or female staff. This is true when controlling for experience, disability status, terms and conditions of employment, and university group and region. Comparing models estimated separately on the first and last years of data: although the sex differences in attainment have diminished, differences in attainment by ethnicity have grown over the period.
The model of promotion does not allow me confidently to identify differences in promotion prospects by sex or ethnicity. In saying this, it is important to note that the precision of estimates in a statistical model depends to a great extent on the size of the available data, and that in following individuals first appointed during or after the 2012/13 academic year I have much less data to work with. It is also important to note that these data, because they follow individuals from their first appointment, may not capture the effects of parenthood. These are important limitations of the analysis. Unfortunately, they are not limitations that can be remedied in the short-term. In the medium to long-term, it will be possible to repeat this analysis, and revise the conclusions accordingly.
The model of exit shows that staff from ethnic minorities, together with staff with a non-UK nationality, are more likely to exit UK higher education. Once again, these findings control for experience, sex, disability status, terms and conditions of employment, and university group and region. Staff from an ethnic minority are two percentage points more likely to exit UK higher education in any given year.
Having found these patterns, it is reasonable to ask what practical recommendations flow from these findings for staff in departments of politics and international relations, for
21 Beyond the usual circumspection about inferring causality from observational data, there is a reasonable argument to the effect that making causal claims about characteristics which are constitutive of one’s identity (or which are seemingly immutable) is misguided. On the most common conception of causation used in the social sciences, a causal effect is simply the difference between the outcome in this world and the outcome in a counterfactual world where the subject was different in one specific respect – but if I were female instead of male, I might not be me anymore. On this, see Sen & Wasow (2016).
In this report I have provided statistics on career trajectories in UK departments of politics and
international relations. Some of these statistics are purely descriptive. I have, for example, provided information on the number of ethnic minority staff at different academic ranks. This information has no complicated statistical model standing behind it – and yet despite being such a basic quantity, I am not aware of any other publication which has reported this information.
The descriptive statistics concerning sex are broadly consistent with past research on the composition of UK political science. The proportion of staff that are female is increasing over time, but is unlikely to reach 50% in the short to medium term (say, within the next ten years). The study of politics is likely to continue to have a greater proportion of male staff than other adjacent disciplines like sociology or law. A lower proportion of senior staff (SL/Reader or Professor) are female, and whilst this proportion is increasing, it starts from a much lower baseline.
Conclusions
28BISA/PSA Career Trajectories Report June 2021
heads of department, and for deans of faculty. The provision of information alone, although it can form part of a package of recommendations (Bhopal & Jackson, 2013, p. 18, “systematic regular monitoring is needed”), is usually not sufficient to change behaviour, particularly in the absence of specific behavioural recommendations. At the same time, however, it is important to note that UK Higher Education already has two schemes which are designed to improve equality between genders and ethnic groups in the Athena SWAN and Race Equality Charter respectively. Whilst these schemes are not perfect, and sometimes struggle to demonstrate an over-time impact on the proportion of female staff or staff from an ethnic minority (Graves et al., 2019, p. 10; Oloyede et al., 2021, p. 136), they provide a structure for thinking through how different departmental processes can affect people of different genders and ethnicities. There is no sector-specific scheme for disabilities, but many universities participate in the Disability Confident scheme.
Are particular patterns in this report that lead to recommendations specific to departments of politics and international relations? In writing this report, I have been struck by the relative attention given to issues of recruitment and promotion compared to exit. We do not talk about exit very much – or if we do, we discuss it under different and not entirely congruent headings like precarity. It should be a matter of significant concern for heads of department and deans of faculty that members of staff from ethnic minorities exit at higher rates. Several recommendations in relation to exit flow from this. Managers should carry out equality impact assessments in relation to proposed redundancies. Heads of Department should feel empowered to argue for retention payments in order to retain staff from ethnic minorities, and (in case these measures are not enough to retain staff) should conduct “exit interviews” with staff leaving. In general, managers should act so as to improve the working environment such that it
becomes more welcoming to staff from ethnic minorities and reduces disproportionate rates of exit.
A second set of recommendations stems from considering departments of politics and international relations alongside other departments in the social sciences. In hiring, where departments are required to have an interview panel member drawn from a separate but cognate discipline, politics departments should look to departments which have higher rates of gender diversity and lower disparities in seniority by gender. In practice this may mean looking less to economics and more to departments of management, law and sociology. A similar recommendation applies to promotions where promotions committees do not have a fixed constitution.
A third set of recommendations stems from one area which is only indirectly considered by the report, namely appointment. I noted that sex differences in attainment could result from men being hired at different initial levels. One recommendation therefore is to review the rate at which departments recruit at senior levels, with particular attention paid to the recruitment on a part-time basis of professors of practice who have achieved distinction in other fields (for example, former MPs), and the advertising of open-rank positions where a successful candidate might be able to negotiate an increase in title or salary and thereby accentuate gendered differences in the degree to which candidates negotiate after offer (Stuhlmacher & Walters, 1999).
It may be that no single institutional response is adequate to the challenges and disparities set out in this report. But knowing about these disparities is the first step to combatting them. May we – all of us who teach and research in politics and international relations – now act so as to ensure that over the coming years these disparities do not grow but instead ebb away.
Knowing about these disparities is the first
step in combating
them
29BISA/PSA Career Trajectories Report June 2021
References• Bates, S., Jenkins, L., & Pflaeger, Z. (2012). Women in the profession: The composition of UK
political science departments by sex. Politics, 32(3), 139–152.
• Bhopal, K., & Jackson, J. (2013). The experiences of Black and ethnic minority academics: Multiple identities and career progression. Southampton: University of Southampton EPSRC.
• Boring, A. (2017). Gender biases in student evaluations of teaching. Journal of Public Economics, 145, 27–41.
• Bornmann, L., Mutz, R., & Daniel, H.-D. (2007). Gender differences in grant peer review: A meta-analysis. Journal of Informetrics, 1(3), 226–238.
• Box-Steffensmeier, J. M., Cunha, R. C., Varbanov, R. A., Hoh, Y. S., Knisley, M. L., & Holmes, M. A. (2015). Survival analysis of faculty retention and promotion in the social sciences by gender. PloS One, 10(11), e0143093.
• Boyle, P. J., Smith, L. K., Cooper, N. J., Williams, K. S., & O’Connor, H. (2015). Gender balance: Women are funded more fairly in social science. Nature News, 525(7568), 181.
• Brower, A., & James, A. (2020). Research performance and age explain less than half of the gender pay gap in New Zealand universities. Plos One, 15(1), e0226392.
• Brown, N., & Leigh, J. (2018). Ableism in academia: Where are the disabled and ill academics? Disability & Society, 33(6), 985–989.
• Bürkner, P.-C., & Vuorre, M. (2019). Ordinal regression models in psychology: A tutorial. Advances in Methods and Practices in Psychological Science, 2(1), 77–101.
• Carey, J. M., Carman, K. R., Clayton, K. P., Horiuchi, Y., Htun, M., & Ortiz, B. (2018). Who wants to hire a more diverse faculty? A conjoint analysis of faculty and student preferences for gender and racial/ethnic diversity. Politics, Groups, and Identities, 1–19.
• Carlsson, M., Finseraas, H., Midtbøen, A. H., & Rafnsdòttir, G. L. (2020). Gender bias in academic recruitment? Evidence from a survey experiment in the Nordic region.
• Chávez, K., & Mitchell, K. M. (2020). Exploring bias in student evaluations: Gender, race, and ethnicity. PS: Political Science & Politics, 53(2), 270–274.
• Closa, C., Moury, C., Novakova, Z., Qvortrup, M., & Ribeiro, B. (2020). Mind the (submission) gap: EPSR gender data and female authors publishing perceptions. European Political Science, 19, 428–442.
• Dion, M. L., Sumner, J. L., & Mitchell, S. M. (2018). Gendered citation patterns across political science and social science methodology fields. Political Analysis, 26(3), 312–327.
• Dnes, A. W., & Seaton, J. S. (1998). The reform of academic tenure in the United Kingdom. International Review of Law and Economics, 18(4), 491–509.
• Emejulu, A. (2019). Can political science decolonise? A response to Neema Begum and Rima Saini. Political Studies Review, 17(2), 202–206.
• Fraile, M., & Gomez, R. (2017). Bridging the enduring gender gap in political interest in Europe: The relevance of promoting gender equality. European Journal of Political Research, 56(3), 601–618.
• Gonzalez Ginocchio, B., Hindmoor, A., & Stanley, L. (2020). Pluralism and political studies in the UK: A pilot study into who gets what in the discipline. Political Studies Review. Online early access.
• Graves, A., Rowell, A., & Hunsicker, E. (2019). An impact evaluation of the ATHENA Swan charter (2019). Equalities Challenge Unit. https://www.ecu.ac.uk/wp-content/uploads/2019/08/Athena-SWAN-Impact-Evaluation-2019.pdf
• Heath-Kelly, C. (2020). Rejoinder: Women in the Profession? Assuming Gender in the Analysis of the Composition of UK Politics Departments. Political Studies Review, 19(1), 37-38.
• Hesli, V. L., Lee, J. M., & Mitchell, S. M. (2012). Predicting rank attainment in political science: What else besides publications affects promotion? PS: Political Science & Politics, 45(3), 475–492.
• Kaminski, D., & Geisler, C. (2012). Survival analysis of faculty retention in science and engineering by gender. Science, 335(6070), 864–866.

30BISA/PSA Career Trajectories Report June 2021
• König, T., & Ropers, G. (2018). Gender and editorial outcomes at the American Political Science Review. PS: Political Science & Politics, 51(4), 849–853.
• Lomax, N., Wohland, P., Rees, P., & Norman, P. (2020). The impacts of international migration on the UK’s ethnic populations. Journal of Ethnic and Migration Studies, 46(1), 177–199.
• Lynn, F. B., Noonan, M. C., Sauder, M., & Andersson, M. A. (2019). A rare case of gender parity in academia. Social Forces, 98(2), 518–547.
• MacNell, L., Driscoll, A., & Hunt, A. N. (2015). What’s in a name: Exposing gender bias in student ratings of teaching. Innovative Higher Education, 40(4), 291–303.
• Mitchell, S. M., Lange, S., & Brus, H. (2013). Gendered citation patterns in international relations journals. International Studies Perspectives, 14(4), 485–492.
• Murray, R. (2014). Quotas for men: Reframing gender quotas as a means of improving representation for all. American Political Science Review, 108(3), 520–532.
• Nedal, D. K., & Nexon, D. H. (2018). Gender in the International Studies Quarterly review process. PS: Political Science & Politics, 51(4), 859–865.
• Oloyede, F. D., Christoffersen, A., & Cornish, T. (2021). Race equality charter review. https://www.advance-he.ac.uk/knowledge-hub/race-equality-charter-review-phase-2
• Østby, G., Strand, H., Nordås, R., & Gleditsch, N. P. (2013). Gender gap or gender bias in peace research? Publication patterns and citation rates for Journal of Peace Research, 1983–2008. International Studies Perspectives, 14(4), 493–506.
• Peterson, D. A. (2018). Author gender and editorial outcomes at Political Behavior. PS: Political Science & Politics, 51(4), 866–869.
• Pflaeger Young, Z., Amery, F., Holden Bates, S., McKay, S., Miller, C., Billings, T., Hayton, R., Holt, M., Khatri, J., Marvin, M., & others. (2020). Women in the profession: An update on the gendered composition of the discipline and political science departments in the UK. Political Studies Review, 1478929920905503.
• Pyke, K. (2011). Service and gender inequity among faculty. PS: Political Science & Politics, 44(1), 85–87.
• Samuels, D. (2018). Gender and editorial outcomes at Comparative Political Studies. PS: Political Science & Politics, 51(4), 854–858.
• Savigny, H. (2014). Women, know your limits: Cultural sexism in academia. Gender and Education, 26(7), 794–809.
• Savigny, H. (2020). The violence of impact: Unpacking relations between gender, media and politics. Political Studies Review, 18(2), 277–293.
• Schröder, M., Lutter, M., & Habicht, I. M. (2021). Publishing, signaling, social capital, and gender: Determinants of becoming a tenured professor in German political science. PLOS One, 16(1), e0243514.
• Sen, M., & Wasow, O. (2016). Race as a bundle of sticks: Designs that estimate effects of seemingly immutable characteristics. Annual Review of Political Science, 19.
• Stockemer, D., Blair, A., & Rashkova, E. (2020). The distribution of authors and reviewers in EPS. European Political Science, 1–10.
• Stuhlmacher, A. F., & Walters, A. E. (1999). Gender differences in negotiation outcome: A meta-analysis. Personnel Psychology, 52(3), 653–677.
• Tatalovich, R., & Frendreis, J. (2019). Winning awards and gaining recognition: An impact analysis of APSA section book prizes. The Social Science Journal, 56(3), 316–323.
• Thomson, J., & Kenny, M. (2020). Politics and international relations: A gendered discipline. Political Studies Review, 1478929920956863.
• Tudor, C. L., & Yashar, D. J. (2018). Gender and the editorial process: World Politics, 2007–2017. PS: Political Science & Politics, 51(4), 870–880.
• Williams, W. M., & Ceci, S. J. (2015). National hiring experiments reveal 2:1 faculty preference for women on STEM tenure track. Proceedings of the National Academy of Sciences, 112(17), 5360–5365.

31BISA/PSA Career Trajectories Report June 2021
AppendixTable A1: Models of attainment. Models (1) and (2) are ordinal regression models where academic ranks are the outcome; models (3) and (4) are logistic regression models where the outcome is attaining SL/Reader. Models (2) and (4) omit staff whose HESA staff ID begins 00.
(1) (2) (3) (4)
Sex: Female -0.327 -0.287 -0.473 -0.454 [-0.476, -0.177] [-0.442, -0.134] [-0.677, -0.271] [-0.659, -0.261]
Sex: Other 0.039 0.048 -0.049 0.007 [-4.826, 4.975] [-4.705, 4.768] [-4.811, 4.774] [-4.949, 5.107]
Ethnicity: BAME -0.447 -0.447 -0.402 -0.411 [-0.668, -0.222] [-0.677, -0.211] [-0.708, -0.092] [-0.732, -0.093]
Ethnicity: Not known 0.020 0.047 0.024 0.030 [-0.230, 0.271] [-0.223, 0.316] [-0.334, 0.385] [-0.336, 0.397]
Has known disability -0.188 -0.262 -0.059 -0.101 [-0.524, 0.157] [-0.624, 0.111] [-0.517, 0.394] [-0.587, 0.380]
Nationality: EU national -0.165 -0.142 -0.178 -0.169 [-0.333, 0.008] [-0.316, 0.041] [-0.414, 0.057] [-0.410, 0.070]
Nationality: non-EU national 0.246 0.254 0.166 0.188 [0.040, 0.453] [0.036, 0.462] [-0.119, 0.443] [-0.103, 0.463]
Nationality: Not known 0.787 0.695 0.890 0.884 [-0.165, 1.764] [-0.247, 1.653] [-0.531, 2.370] [-0.538, 2.361]
Part-time -0.745 -0.889 -0.614 -0.678 [-0.950, -0.533] [-1.107, -0.671] [-0.902, -0.333] [-0.988, -0.390]
Fixed-term contract -2.615 -2.680 -2.187 -2.259 [-2.843, -2.390] [-2.924, -2.444] [-2.504, -1.870] [-2.607, -1.919]
Pre-1992 provider 1.251 1.198 1.615 1.515 [0.861, 1.644] [0.805, 1.600] [1.149, 2.107] [1.058, 2.000]
Intercept: RA/TA to L -6.601 -6.642 [-7.110, -6.085] [-7.182, -6.118]
Intercept: TF/L to L/SL -1.011 -0.941 [-1.368, -0.656] [-1.312, -0.579]
Intercept: L/SL to SL/Reader 1.026 1.131 [0.672, 1.387] [0.765, 1.511]
Intercept: SL/Reader to Professor 2.940 3.070 [2.576, 3.313] [2.691, 3.467]
Intercept: to SL/Reader or Professor -1.342 -1.404 [-1.807, -0.920] [-1.852, -0.969]
Num.Obs. 3341 3109 3341 3109
R2 0.540 0.512 0.443 0.408
R2 Marg. 0.501 0.466 0.404 0.361
ELPD -3411.8 -3149.7 -1432.8 -1352.5
ELPD s.e. 47.4 46.2 33.1 31.4
LOOIC 6823.6 6299.3 2865.6 2705.0
LOOIC s.e. 94.8 92.4 66.3 62.8
WAIC 6821.7 6298.4 2863.8 2704.2
RMSE 0.56 0.55

32BISA/PSA Career Trajectories Report June 2021
Table A2: Alternative models of attainment including interactions between ethnicity and gender (1) and ethnicity and nationality (2).
(1) (2)
(Intercept) -1.388 -1.391 [-1.839, -0.967] [-1.827, -0.955]
Sex: Female -0.521 -0.454 [-0.740, -0.307] [-0.668, -0.244]
Sex: other 0.025 0.019 [-4.792, 4.967] [-4.961, 5.140]
Ethnicity: ethnic minority -0.658 -0.568 [-1.109, -0.225] [-0.996, -0.153]
Ethnicity: unknown 0.030 0.035 [-0.333, 0.386] [-0.316, 0.393]
Known disability -0.092 -0.106 [-0.582, 0.377] [-0.591, 0.366]
Nationality: non-EU 0.187 0.110 [-0.093, 0.471] [-0.209, 0.429]
Nationality: EU -0.165 -0.177 [-0.404, 0.079] [-0.411, 0.064]
Nationality: not known 0.870 0.889 [-0.486, 2.332] [-0.471, 2.312]
Contract: part-time -0.679 -0.684 [-0.995, -0.374] [-0.993, -0.373]
Contract: fixed term -2.256 -2.258 [-2.605, -1.928] [-2.609, -1.934]
Pre-1992 provider 1.521 1.518 [1.067, 1.980] [1.042, 1.995]
Female and ethnic minority 0.522 [-0.056, 1.114]
Ethnic minority and non-EU national 0.358 [-0.292, 0.988]
Num.Obs. 3109 3109
R2 0.411 0.411
R2 Marg. 0.364 0.365
ELPD -1344.0 -1344.7
ELPD s.e. 31.6 31.5
LOOIC 2687.9 2689.4
LOOIC s.e. 63.1 63.0
WAIC 2687.4 2688.9
RMSE 0.55 0.55
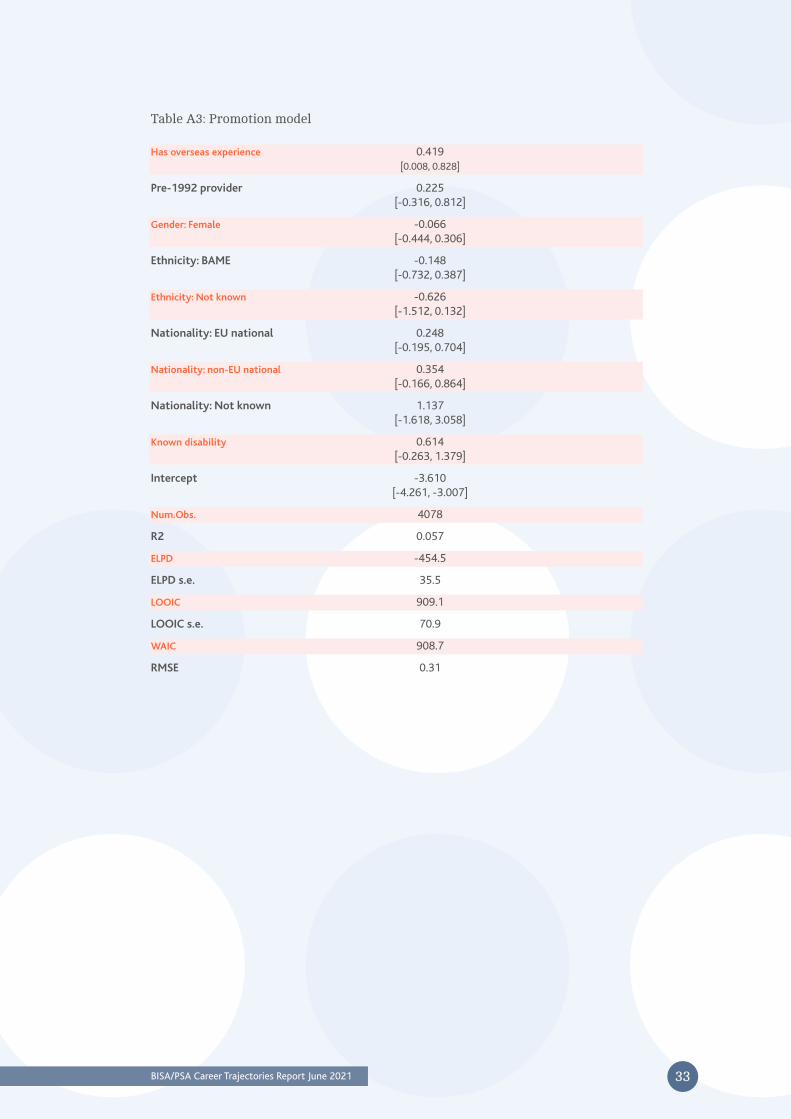
33BISA/PSA Career Trajectories Report June 2021
Has overseas experience 0.419 [0.008, 0.828]
Pre-1992 provider 0.225 [-0.316, 0.812]
Gender: Female -0.066 [-0.444, 0.306]
Ethnicity: BAME -0.148 [-0.732, 0.387]
Ethnicity: Not known -0.626 [-1.512, 0.132]
Nationality: EU national 0.248 [-0.195, 0.704]
Nationality: non-EU national 0.354 [-0.166, 0.864]
Nationality: Not known 1.137 [-1.618, 3.058]
Known disability 0.614 [-0.263, 1.379]
Intercept -3.610 [-4.261, -3.007]
Num.Obs. 4078
R2 0.057
ELPD -454.5
ELPD s.e. 35.5
LOOIC 909.1
LOOIC s.e. 70.9
WAIC 908.7
RMSE 0.31
Table A3: Promotion model

34BISA/PSA Career Trajectories Report June 2021
Table A4: Exit model. Model (2) excludes staff whose HESA staff identifier begins 00.
Professor (compared to TF/L.) 0.449 0.401 [0.272, 0.631] [0.202, 0.599]
RA/TA (compared to TF/L.) 0.520 0.512 [0.225, 0.798] [0.228, 0.790]
SL/Reader (compared to TF/L.) 0.074 0.071 [-0.111, 0.258] [-0.130, 0.269]
Has overseas experience -0.093 -0.100 [-0.229, 0.040] [-0.235, 0.037]
Pre-1992 provider -0.056 -0.074 [-0.246, 0.127] [-0.264, 0.119]
Gender: Female -0.084 -0.088 [-0.173, 0.012] [-0.183, 0.007]
Gender: Other 0.042 -0.004 [-4.898, 5.044] [-4.836, 4.836]
Ethnicity: BAME 0.147 0.159 [0.011, 0.276] [0.022, 0.295]
Ethnicity: Not known 0.070 0.077 [-0.079, 0.211] [-0.075, 0.227]
Nationality: EU national 0.159 0.188 [0.054, 0.264] [0.077, 0.297]
Nationality: non-EU national 0.243 0.253 [0.114, 0.373] [0.122, 0.384]
Nationality: Not known 0.177 0.228 [-0.204, 0.543] [-0.178, 0.608]
Intercept -3.049 -3.059 [-3.247, -2.854] [-3.266, -2.861]
Num.Obs. 17600 15967
algorithm sampling sampling
pss 4000.000 4000.000
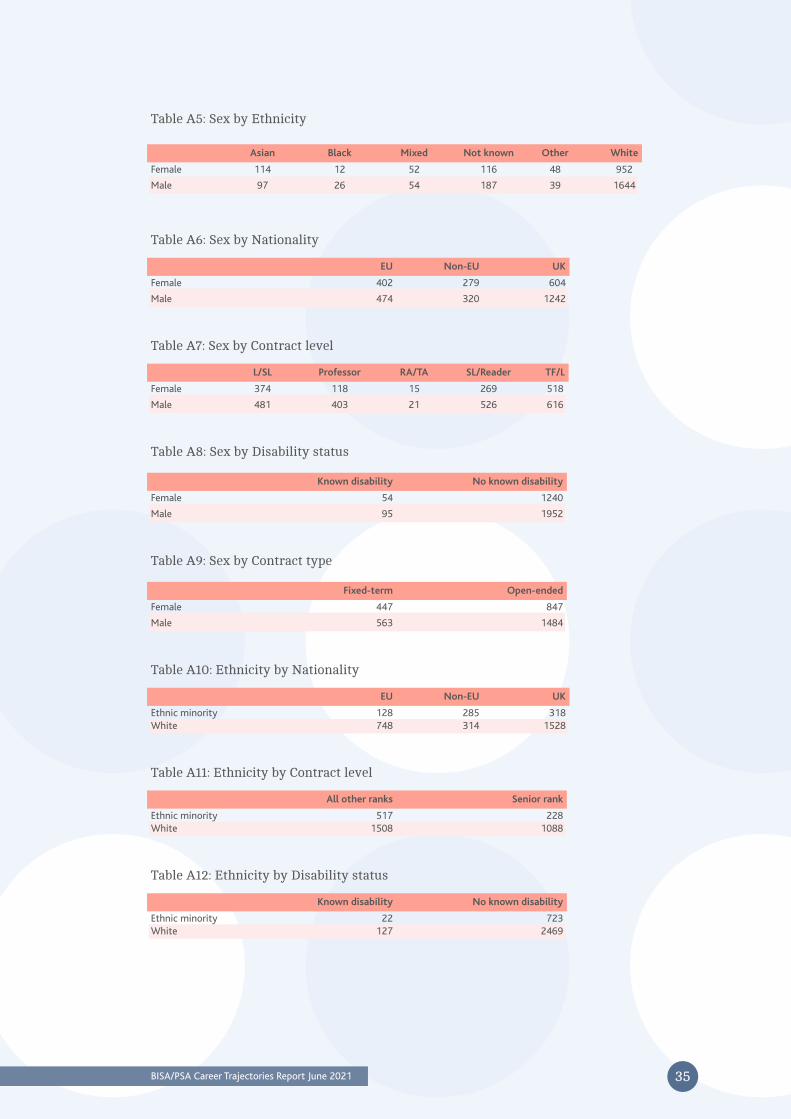
35BISA/PSA Career Trajectories Report June 2021
Table A5: Sex by Ethnicity
Asian Black Mixed Not known Other White
Female 114 12 52 116 48 952
Male 97 26 54 187 39 1644
Table A6: Sex by Nationality
EU Non-EU UK
Female 402 279 604
Male 474 320 1242
Table A7: Sex by Contract level
L/SL Professor RA/TA SL/Reader TF/L
Female 374 118 15 269 518
Male 481 403 21 526 616
Table A8: Sex by Disability status
Known disability No known disability
Female 54 1240
Male 95 1952
Table A9: Sex by Contract type
Fixed-term Open-ended
Female 447 847
Male 563 1484
Table A10: Ethnicity by Nationality
EU Non-EU UK
Ethnic minority 128 285 318White 748 314 1528
Table A11: Ethnicity by Contract level
All other ranks Senior rank
Ethnic minority 517 228White 1508 1088
Table A12: Ethnicity by Disability status
Known disability No known disability
Ethnic minority 22 723White 127 2469

36BISA/PSA Career Trajectories Report June 2021
Table A13: Ethnicity by Contract type
Fixed-term Open-ended
Asian 65 146Black 28 10Mixed 57 49Not known 121 182Other 33 54White 706 1890
Table A14: Nationality by Contract level
L/SL Professor RA/TA SL/Reader TF/L
EU 247 75 6 210 338Non-EU 162 76 8 120 233UK 445 364 22 460 555
Table A15: Nationality by Disability status
Known disability No known disability
EU 23 853Non-EU 18 581UK 108 1738
Table A16: Nationality by Contract type
Fixed-term Open-ended
EU 282 594Non-EU 215 384UK 506 1340
Table A17: Contract level by Disability status
Known disability No known disability
All other ranks 101 1924Senior rank 48 1268
Table A18: Contract level by Contract type
Fixed-term Open-ended
All other ranks 943 1082Senior rank 67 1249
Table A19: Disability status by Contract type
Fixed-term Open-ended
Known disability 64 85No known disability 946 2246

37BISA/PSA Career Trajectories Report June 2021
Table A20: Sex by Ethnicity by Nationality
Sex Ethnicity Nationality Freq
Female Ethnic minority EU 65Male Ethnic minority EU 63Female White EU 337Male White EU 411Female Ethnic minority Non-EU 141Male Ethnic minority Non-EU 144Female White Non-EU 138Male White Non-EU 176Female Ethnic minority UK 130Male Ethnic minority UK 188Female White UK 474Male White UK 1054
Table A21: Sex by Ethnicity by Contract level
Sex Ethnicity Contract level Freq
Female Ethnic minority All other ranks 262Male Ethnic minority All other ranks 255Female White All other ranks 645Male White All other ranks 863Female Ethnic minority Senior rank 80Male Ethnic minority Senior rank 148Female White Senior rank 307Male White Senior rank 781
Table A22: Sex by Ethnicity by Disability status
Sex Ethnicity Disability status Freq
Female Ethnic minority Known disability 10Male Ethnic minority Known disability 12Female White Known disability 44Male White Known disability 83Female Ethnic minority No known disability 332Male Ethnic minority No known disability 391Female White No known disability 908Male White No known disability 1561
Table A23: Sex by Ethnicity by Contract type
Sex Ethnicity Contract type Freq
Female Ethnic minority Fixed-term 153Male Ethnic minority Fixed-term 151Female White Fixed-term 294Male White Fixed-term 412Female Ethnic minority Open-ended 189Male Ethnic minority Open-ended 252Female White Open-ended 658Male White Open-ended 1232

38BISA/PSA Career Trajectories Report June 2021
Table A24: Sex by Nationality by Contract level
Sex Nationality Contract level Freq
Female EU All other ranks 296Male EU All other ranks 295Female Non-EU All other ranks 201Male Non-EU All other ranks 202Female UK All other ranks 406Male UK All other ranks 616Female EU Senior rank 106Male EU Senior rank 179Female Non-EU Senior rank 78Male Non-EU Senior rank 118Female UK Senior rank 198Male UK Senior rank 626
Table A25: Sex by Nationality by Disability status
Sex Nationality Disability status Freq
Female EU Known disability 12Male EU Known disability 11Female Non-EU Known disability 10Male Non-EU Known disability 8Female UK Known disability 32Male UK Known disability 76Female EU No known disability 390Male EU No known disability 463Female Non-EU No known disability 269Male Non-EU No known disability 312Female UK No known disability 572Male UK No known disability 1166
Table A26: Sex by Nationality by Contract type
Sex Nationality Contract type Freq
Female EU Fixed-term 144Male EU Fixed-term 138Female Non-EU Fixed-term 103Male Non-EU Fixed-term 112Female UK Fixed-term 197Male UK Fixed-term 309Female EU Open-ended 258Male EU Open-ended 336Female Non-EU Open-ended 176Male Non-EU Open-ended 208Female UK Open-ended 407Male UK Open-ended 933
Table A27: Sex by Contract level by Disability status
Sex Contract level Disability status Freq
Female All other ranks Known disability 37Male All other ranks Known disability 64Female Senior rank Known disability 17Male Senior rank Known disability 31Female All other ranks No known disability 870Male All other ranks No known disability 1054Female Senior rank No known disability 370Male Senior rank No known disability 898

39BISA/PSA Career Trajectories Report June 2021
Table A28: Sex by Contract level by Contract type
Sex Contract level Contract type Freq
Female All other ranks Fixed-term 425Male All other ranks Fixed-term 518Female Senior rank Fixed-term 22Male Senior rank Fixed-term 45Female All other ranks Open-ended 482Male All other ranks Open-ended 600Female Senior rank Open-ended 365Male Senior rank Open-ended 884
Table A29: Sex by Disability status by Contract type
Sex Disability status Contract type Freq
Female Known disability Fixed-term 24Male Known disability Fixed-term 40Female No known disability Fixed-term 423Male No known disability Fixed-term 523Female Known disability Open-ended 30Male Known disability Open-ended 55Female No known disability Open-ended 817Male No known disability Open-ended 1429
Table A30: Ethnicity by Nationality by Contract level
Ethnicity Nationality Contract level Freq
Ethnic minority EU All other ranks 95White EU All other ranks 496Ethnic minority Non-EU All other ranks 211White Non-EU All other ranks 192Ethnic minority UK All other ranks 206White UK All other ranks 816Ethnic minority EU Senior rank 33White EU Senior rank 252Ethnic minority Non-EU Senior rank 74White Non-EU Senior rank 122Ethnic minority UK Senior rank 112White UK Senior rank 712
Table A31: Ethnicity by Nationality by Contract type
Ethnicity Nationality Contract type Freq
Ethnic minority EU Fixed-term 59White EU Fixed-term 223Ethnic minority Non-EU Fixed-term 131White Non-EU Fixed-term 84Ethnic minority UK Fixed-term 111White UK Fixed-term 395Ethnic minority EU Open-ended 69White EU Open-ended 525Ethnic minority Non-EU Open-ended 154White Non-EU Open-ended 230Ethnic minority UK Open-ended 207White UK Open-ended 1133
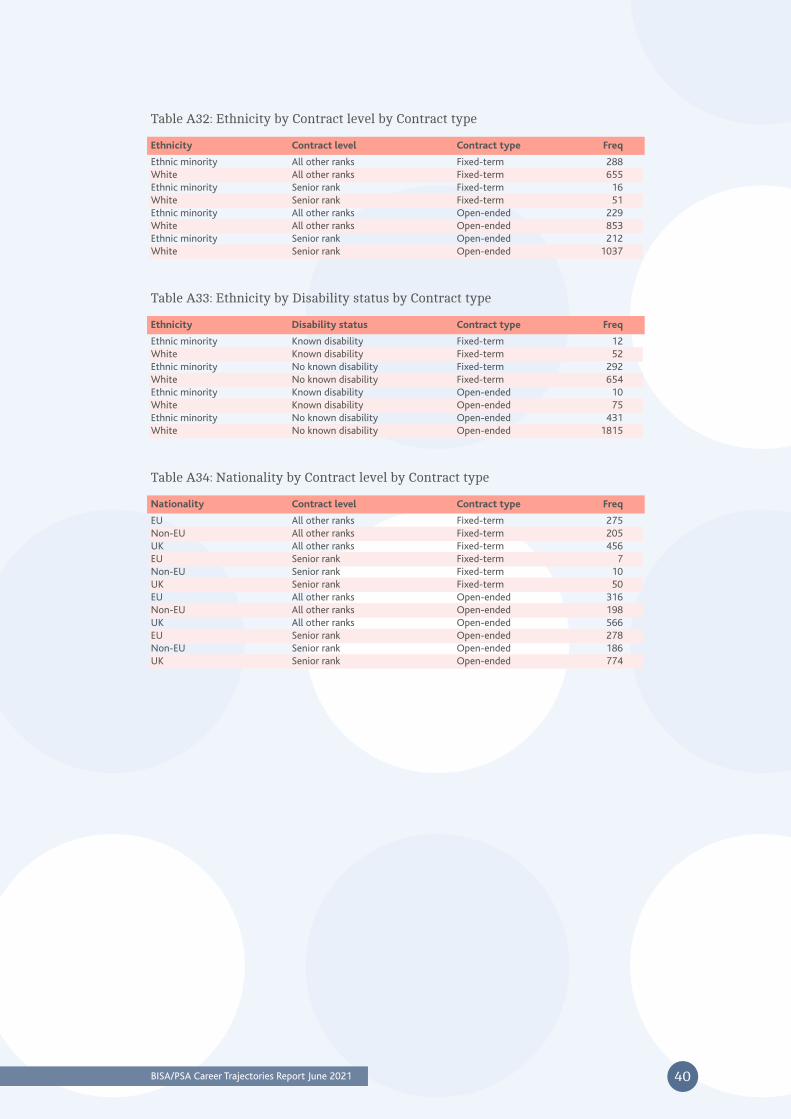
40BISA/PSA Career Trajectories Report June 2021
Table A32: Ethnicity by Contract level by Contract type
Ethnicity Contract level Contract type Freq
Ethnic minority All other ranks Fixed-term 288White All other ranks Fixed-term 655Ethnic minority Senior rank Fixed-term 16White Senior rank Fixed-term 51Ethnic minority All other ranks Open-ended 229White All other ranks Open-ended 853Ethnic minority Senior rank Open-ended 212White Senior rank Open-ended 1037
Table A33: Ethnicity by Disability status by Contract type
Ethnicity Disability status Contract type Freq
Ethnic minority Known disability Fixed-term 12White Known disability Fixed-term 52Ethnic minority No known disability Fixed-term 292White No known disability Fixed-term 654Ethnic minority Known disability Open-ended 10White Known disability Open-ended 75Ethnic minority No known disability Open-ended 431White No known disability Open-ended 1815
Table A34: Nationality by Contract level by Contract type
Nationality Contract level Contract type Freq
EU All other ranks Fixed-term 275Non-EU All other ranks Fixed-term 205UK All other ranks Fixed-term 456EU Senior rank Fixed-term 7Non-EU Senior rank Fixed-term 10UK Senior rank Fixed-term 50EU All other ranks Open-ended 316Non-EU All other ranks Open-ended 198UK All other ranks Open-ended 566EU Senior rank Open-ended 278Non-EU Senior rank Open-ended 186UK Senior rank Open-ended 774

41BISA/PSA Career Trajectories Report June 2021