Embed Size (px)
Citation preview

CARe Seminar on ReinsuranceCAS Online Event – June 1-2, 2020
Wheels: Commercial Auto, Another Dip in the Road Concurrent Session 1, Monday, June 1, 1:30- 2:45 p.m.
• John Buchanan, FCAS, MAAA, Managing Principal, Verisk/ISO
• Terry Knull, FCAS, MAAA, CPCU, Actuary/Underwriting Manager, Swiss Re

© 2020 Insurance Services Office, Inc. All rights reserved. 2
Antitrust Notice
The Casualty Actuarial Society is committed to adhering strictly to the letter and spirit of the antitrust laws. Seminars conducted under the auspices of the CAS are designed solely to provide a forum for the expression of various points of view on topics described in the programs or agendas for such meetings.
Under no circumstances shall CAS seminars be used as a means for competing companies or firms to reach any understanding –expressed or implied – that restricts competition or in any way impairs the ability of members to exercise independent business judgment regarding matters affecting competition.
It is the responsibility of all seminar participants to be aware of antitrust regulations, to prevent any written or verbal discussions that appear to violate these laws, and to adhere in every respect to the CAS antitrust compliance policy.

© 2020 Insurance Services Office, Inc. All rights reserved. 3
This CARe presentation provides an update and summary of the materials that were presented at this recent CAS Webinar. These
webinars are part of the “Wheels” series that have been presented at various CAS events over the last four years, tracking the ups and downs of this line.
The CAS webinar, along with the prior sessions, go into much more detail than can be covered in this session. In particular, the interested reader is encouraged to go to these prior recorded sessions to delve into more background on the loss and rating components of the commercial auto underwriting cycle, the effect of the emergence lag on results, pressures on increased limits, and a detailed investigation into social inflation.
Commercial Auto – Update to CAS Webinar – May 21, 2020

© 2020 Insurance Services Office, Inc. All rights reserved. 4
Concurrent Session 1 - Wheels: Commercial Auto, Another Dip in the Road
• This session provides a year-end 2019 holistic update to the Commercial Auto industry
experience and trends, most recently presented at the May CAS On-line Webinar (“as
part of the 4-year Wheels series”). In addition to reviewing items such as lengthening
LDFs and large loss pressures on ILFs, a comparison between commercial and personal
auto trends will be presented.
• A company actuary/underwriting managers perspective will be given on the state of
the market, including the expected impact of various societal and jury impacts.
Impacts on the portfolio and potential underwriting responses, as well as discussion of
the significant issues and pausing impacts from Covid-19, will be given.
• To also help frame potential scenarios, this session will Include a historical look to prior
shock events including the Great Recession on premium level dips, troughs and
recovery shapes, and a framework for measuring similar impacts under various Covid-
19 emerging scenarios. A conceptual actuarial triangle approach to estimating
various Covid components will also be given.
© 2020 Insurance Services Office, Inc. All rights reserved. 5
CS 1 Agenda - Wheels: Commercial Auto, Another Dip in the Road
• Introduction and commercial auto update – John 20 mins– Overall industry results through 12/31/2019 – ups and downs over the last decade
– Review trends, LDFs, loss ratios, segments, ground-up vs excess, competitive underwriting
cycle, rate changes, emergence lags, ILF pressures
– Review of personal auto vs. commercial auto trends and results
• An actuary/underwriting managers perspective – Terry 20 mins– State of the market for commercial and personal auto
– Future auto trends, including societal factors, jury impact, etc…
– Impact on portfolio loss ratios & reserving
• COVID – John/Terry 25 mins (15/5/5Q)– Great Recession – dips, troughs, recoveries, shapes
– Relevance to Covid – market sizing, shelter / pause / emergence issues
– Actuarial triangle principles applied to Covid emergence analysis
– Company perspective
• Q&A 10 mins

© 2020 Insurance Services Office, Inc. All rights reserved. 6© 2017 Verisk Analytics, Inc. All rights reserved. 6© 2019 Insurance Services Office, Inc. All rights reserved. 6
Commercial Auto
Views from 2010 - 2019

© 2020 Insurance Services Office, Inc. All rights reserved. 7
Holistic view at 2010:• On level Loss ratios going
down since 2004• Frequencies steadily reducing from early 2000s• Severities overall recently flat, and 1.6% for the last 7 years• Relatively quick LDF duration
- avg GU reported loss = 1.2 yrs- avg paid = 2.4 yrs
• Moderate reductions in rates since 2005• Mostly BI claims – but their trends ok as well• This interconnected on-level line graphs show what various IELRs would be at current rate levels (useful for residual trend analysis)
• Overall, the 2010 on-level loss ratio compared to long term is 8 pts better (60.0% long-term vs. 51.9% current)
Commercial Auto – View at 2010

© 2020 Insurance Services Office, Inc. All rights reserved. 8
TTT Actual vs. Expected (ERLI Warning) – Excess Layer 900x100k
+15.2%
Commercial Auto – View at 2010
Check to see if any early
warning development signs
in various layers and
components.
Overall ok, except AY 2009
indicates a bit of a blip up –
252M expected, but 290M
actual, or 15.2% adverse
development.
© 2020 Insurance Services Office, Inc. All rights reserved. 9
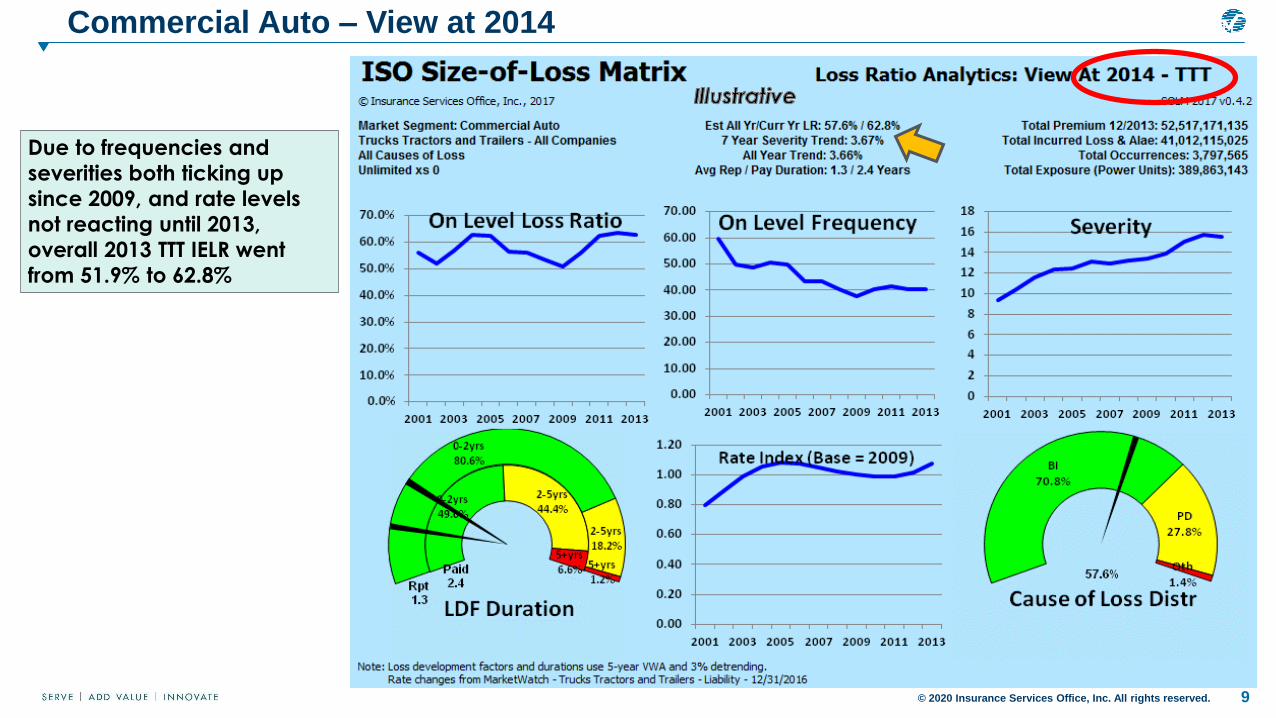
Commercial Auto – View at 2014
Due to frequencies and
severities both ticking up
since 2009, and rate levels
not reacting until 2013,
overall 2013 TTT IELR went
from 51.9% to 62.8%

© 2020 Insurance Services Office, Inc. All rights reserved. 10
Source: ISO MarketWatch – released 6/15/2016; further details in Commercial Actuarial Panel – December 2016
Incremental Rate Changes Through 3/31/2016 - Liability & Physical Damage
Commercial Auto – View at 2016
Rates reducing from 2005
to 2011, and importantly
didn’t go positive until
2012 even though loss
trends changed direction
3 years earlier.
Larger policies, in general
have larger rate
reductions, and back to
flat early 2016.

© 2020 Insurance Services Office, Inc. All rights reserved. 11
Commercial Auto – TTT - ERLI Warning through 2015 – Calendar Year
Commercial Auto – View at 2016
Each calendar year since 2010
had adverse development
due to lengthening loss
development factors.
Calendar year 2014 being by
far the most adverse, with all
accident years contributing.
First look at 2015 appears to
be not as adverse as prior
years.
© 2020 Insurance Services Office, Inc. All rights reserved. 12
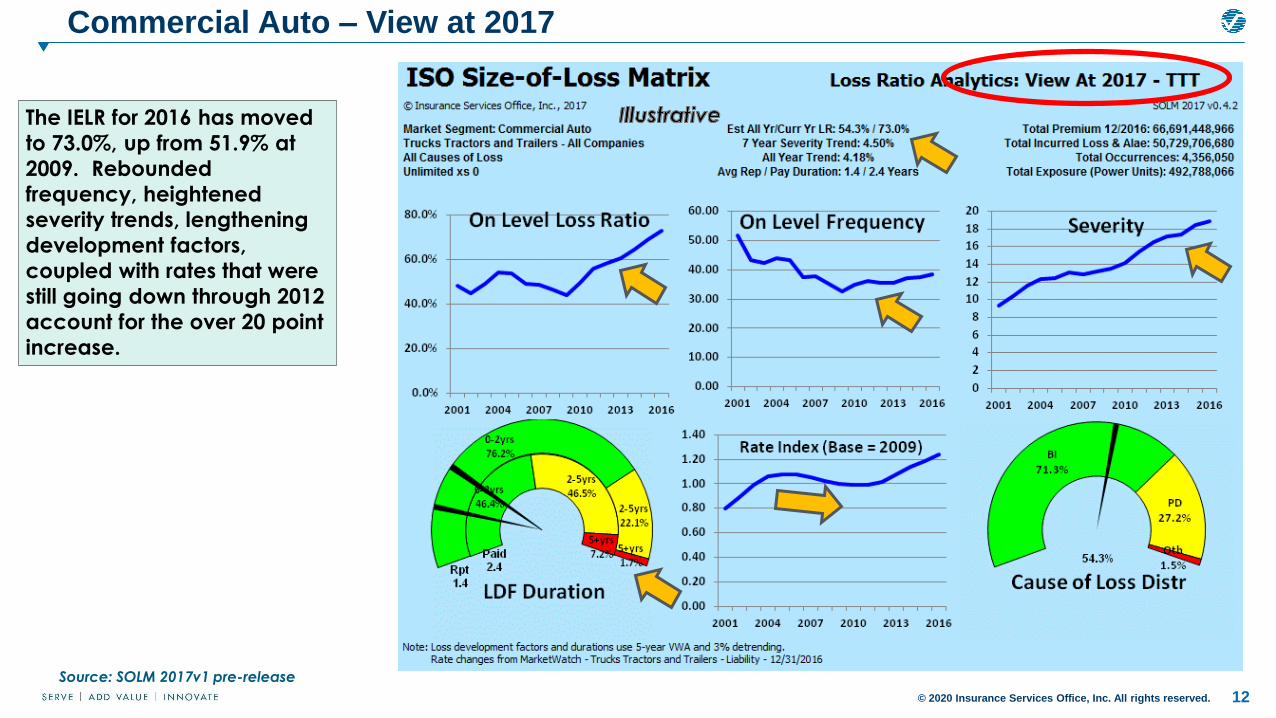
Source: SOLM 2017v1 pre-release
Commercial Auto – View at 2017
The IELR for 2016 has moved
to 73.0%, up from 51.9% at
2009. Rebounded
frequency, heightened
severity trends, lengthening
development factors,
coupled with rates that were
still going down through 2012
account for the over 20 point
increase.

© 2020 Insurance Services Office, Inc. All rights reserved. 13© 2017 Verisk Analytics, Inc. All rights reserved. 13© 2019 Insurance Services Office, Inc. All rights reserved. 13
Commercial Auto
View at 2020

© 2020 Insurance Services Office, Inc. All rights reserved. 14
Source: SOLM 2020v1 pre-release (using expanded MarketWatch method 3-new and renewal including impacts from ILFs)
Commercial Auto – View at 2020
There has been a steady decline in
on-level results since 2009, with
some initial apparent improvement
in 2019. The decline was due to
significantly higher average
severity trends (1.6% 7-year trend
2009 to now 6.1%), reversal of
steep frequency reductions, and
significantly lengthening LDF tail.
For 2019, the steady improvement
in rates, now in the 6-8% range,
appears to somewhat reverse the
higher loss levels.
Note that the above statistics don’t
reflect a potential under-reporting
of losses that may have occurred
during 1st qtr 2020 processing. This
may cause future additional tail
lengthening in 2020, among other
various Covid pause issues.

© 2020 Insurance Services Office, Inc. All rights reserved. 15
Comparison of Results using On-level premium vs. Power Units - TTT
Source: SOLM 2020v1 pre-release; losses developed using 3-yr VWA; uses ISO MarketWatch 12/31/2019 rate changes –CA-TTT Liability; power units in months
Commercial Auto – View at 2020
Overall increase in cost up by
52% per power unit, and up by
44% per on-level premium.
Leveling off of results since
2016 under both methods. The
apparent modest
improvement shown in 2019
may be due to some potential
under reporting of losses
processed in early 2020.

© 2020 Insurance Services Office, Inc. All rights reserved. 16Source: SOLM 2019v1 pre-release using on-level premium as base
Commercial Auto – View at 2020
Bodily injury is a somewhat
larger portion of total (74.6%
vs. 70.3% in 2009), and
longer average reported loss
and payment duration.
BI shows somewhat higher
frequency trends but
somewhat lower severity
trends than total.

© 2020 Insurance Services Office, Inc. All rights reserved. 17Source: SOLM 2019v1 pre-release using on-level premium as base
Commercial Auto – View at 2020
PD excess of 10k shows
mostly increasing frequency
trends beyond 3% and
somewhat higher overall
average severity trends,
rising from 10k in 2008 to 16k
in 2019 (60% increase)

© 2020 Insurance Services Office, Inc. All rights reserved. 18Source: SOLM 2019v1 pre-release using on-level premium as base
Commercial Auto – View at 2020
Continued significant
pressure on increased limits
factors for layer 4.9M xs of
100k, going from low 20% in
2009 to around 35%
currently, driven by higher
frequency and steady
severity trend.

© 2020 Insurance Services Office, Inc. All rights reserved. 19Source: SOLM 2019v1 pre-release using on-level premium as base
Commercial Auto – View at 2020 - PPT
Private Passenger Types,
which accounts for about
10% of the 8 Cau markets we
analyze, continues
significant adverse loss ratio
trend since 2009. The current
loss ratio is 83.6%, vs. long-
term on-level average of
54.8%.
Higher overall recent severity
trends (7-year 7.1%),
coupled with rate changes
that aren’t nearly as high as
most of the other Cau lines,
accounts for the
deterioration.

© 2020 Insurance Services Office, Inc. All rights reserved. 20
Continuing Reported Lengthening Loss Development – 4.9M xs 100k
Commercial Auto – View at 2020 – All CAu
While excess LDF factors have
continued to get longer over the last decade, the deterioration has accelerated in the last 4 calendar years 2016 to 2019.
All views at 2020 use 3-year averages – if use more recent or
trend LDFs, indications would be higher.

© 2020 Insurance Services Office, Inc. All rights reserved. 21
TTT – Reserve Run-off Test @12/31/2019 – 4.9M xs 100k
Sources: Using pre-release SOLM 2019 v2 – mechanical selections of VWA (100% 7-year)
Comparing to initial selected excess losses at 12 months using a mechanical 7-year average, produces deterioration over 10% for accident years 2009 to 2016.
All subsequent years continue the same pattern of deterioration.
Commercial Auto – View at 2020
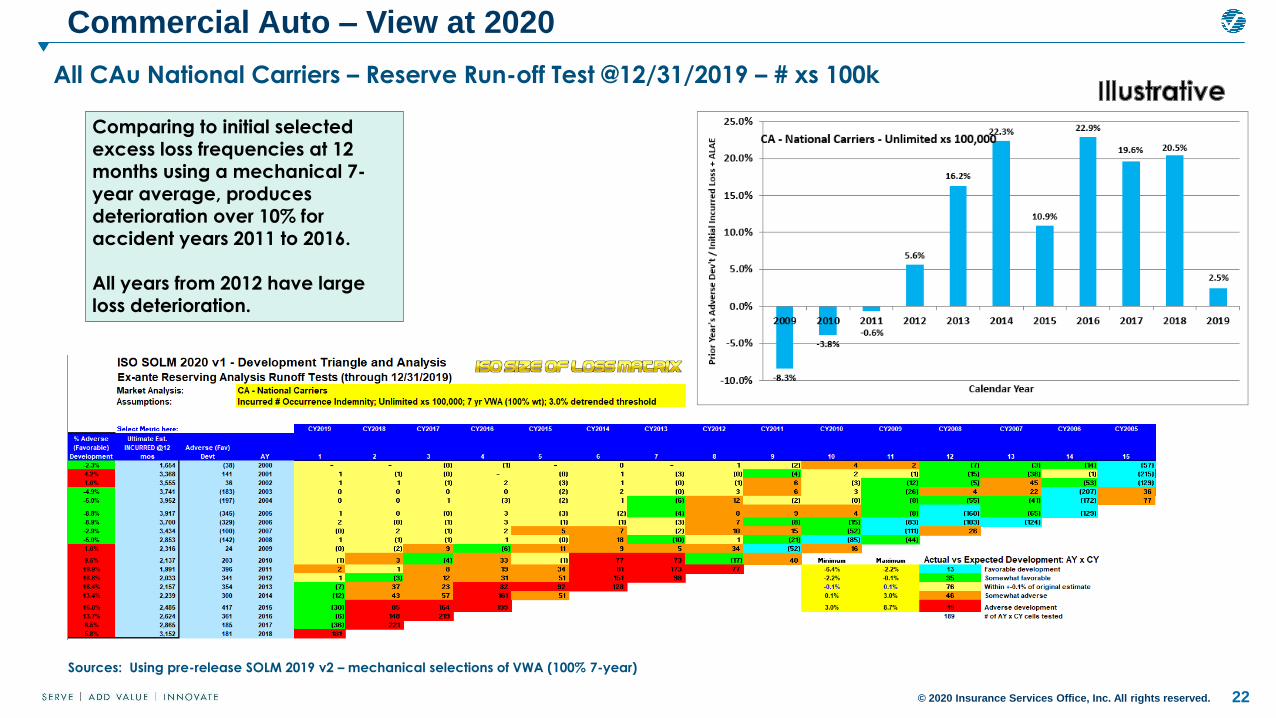
© 2020 Insurance Services Office, Inc. All rights reserved. 22
All CAu National Carriers – Reserve Run-off Test @12/31/2019 – # xs 100k
Sources: Using pre-release SOLM 2019 v2 – mechanical selections of VWA (100% 7-year)
Commercial Auto – View at 2020
Comparing to initial selected
excess loss frequencies at 12 months using a mechanical 7-year average, produces deterioration over 10% for accident years 2011 to 2016.
All years from 2012 have large loss deterioration.

© 2020 Insurance Services Office, Inc. All rights reserved. 23
Note: Total loss ratios (2001-2016) use 20 year loss triangles and all-year LDFs; each individual company uses credibility weightedall-year industry factors, split between Fast and Slow for apriori
Source: Verisk Monday Webinar – 10/1/2018 – John Buchanan, Marni Wasserman (recorded)
Underwriting Cycle Analysis – Initial Investigation
Research done over the last few years was centered around investigating why company results were so dramatically different from each other. Like the LDF patterns, we found companies had strikingly different results.
We investigated things like how correlated are capital size and reinsurance ceded to results. We did find there was some impact of each, but not overwhelming.

© 2020 Insurance Services Office, Inc. All rights reserved. 24
Underwriting Cycle Analysis – Further Investigation Profit / LDF Speed
Note: See Verisk Monday Webinar on link between LDF Speed and Profitability (9/11/2017 – J. Buchanan and M. Wasserman)
However when investigating LDF Speed and Profitability, we found a significant correlation. Companies that don’t recognize the are longer than industry
LDFs, very strongly have much worse ultimate loss ratios. Almost every one of the 44 markets we analyzed (besides short-tail property lines) experienced this important connection.
© 2020 Insurance Services Office, Inc. All rights reserved. 25
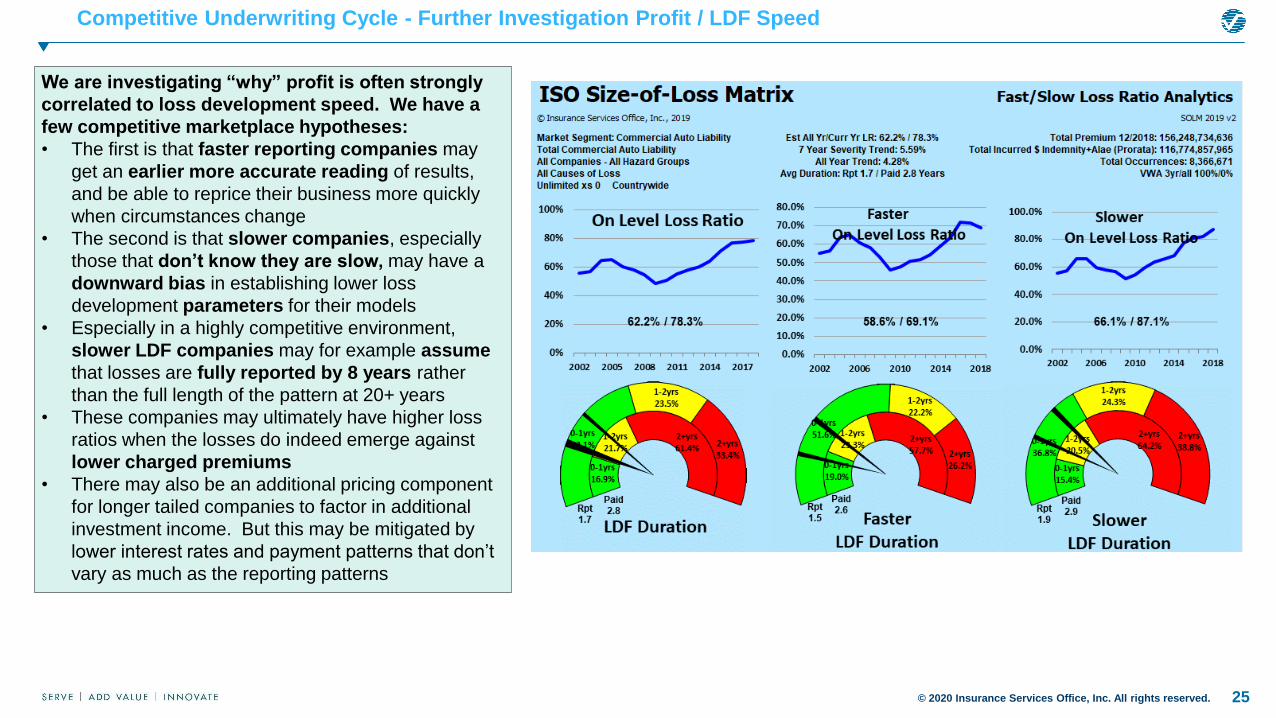
Competitive Underwriting Cycle - Further Investigation Profit / LDF Speed
We are investigating “why” profit is often strongly
correlated to loss development speed. We have a
few competitive marketplace hypotheses:
• The first is that faster reporting companies may
get an earlier more accurate reading of results,
and be able to reprice their business more quickly
when circumstances change
• The second is that slower companies, especially
those that don’t know they are slow, may have a
downward bias in establishing lower loss
development parameters for their models
• Especially in a highly competitive environment,
slower LDF companies may for example assume
that losses are fully reported by 8 years rather
than the full length of the pattern at 20+ years
• These companies may ultimately have higher loss
ratios when the losses do indeed emerge against
lower charged premiums
• There may also be an additional pricing component
for longer tailed companies to factor in additional
investment income. But this may be mitigated by
lower interest rates and payment patterns that don’t
vary as much as the reporting patterns

© 2020 Insurance Services Office, Inc. All rights reserved. 26
Commercial Auto – State Group XExpected Loss 900x100 based on AS Circular ILF
Underwriting Cycle Analysis – Bringing in ILF Component
Note: Weights provided in the circular can be used to combine expected loss percentages from state groups and classes.

© 2020 Insurance Services Office, Inc. All rights reserved. 27
Commercial Auto – State Group X900 x 100 – Partial Loss Ratio (3% detrended)
Underwriting Cycle Analysis – Bringing in ILF Component
Note: premiums are on-leveled to 12/31/2018 using ISO MWDB Method 2 (new and renewal) indications
additional adjustments for historical changes in deductibles, limits and other exposure adjustments would be required for a full comparison to AS Circular ILF results

© 2020 Insurance Services Office, Inc. All rights reserved. 28
Review of Reported and Paid, $ and # Settlement Patterns by Company Speed; Introduce 3/6 mo.lags
Adjusting Case Reserving and Settlement Patterns under Covid - Framework

© 2020 Insurance Services Office, Inc. All rights reserved. 29© 2017 Verisk Analytics, Inc. All rights reserved. 29© 2019 Insurance Services Office, Inc. All rights reserved. 29
Personal AutoView at 2019

© 2020 Insurance Services Office, Inc. All rights reserved. 30
Personal vs. Commercial Auto – View at 2019
Personal Auto Paid Severity
trends tend to be lower than
that of Commercial Auto.
7 Yr All Yr
Liability Personal 3.79% 2.87%
Commercial 5.69% 4.30%
Physical
Damage
Personal 3.91% 2.51%
Commercial 3.44% 4.24%
Total Personal 3.83% 2.76%
Commercial 5.21% 4.29%

© 2020 Insurance Services Office, Inc. All rights reserved. 31
Personal vs. Commercial Auto – View at 2019
Personal Auto Paid Frequency
trends tend to be higher than
that of Commercial Auto, but
both sets are relatively flat or
negative.
7 Yr All Yr
Liability Personal 0.29% -0.87%
Commercial 0.39% -3.01%
Physical
Damage
Personal -0.06% -1.20%
Commercial -1.65% -2.70%
Total Personal 0.15% -1.10%
Commercial -0.04% -2.94%

© 2020 Insurance Services Office, Inc. All rights reserved. 32
Personal vs. Commercial Auto – View at 2019
Personal Auto Pure Premium
trends tend to be lower than
Commercial Auto in the more
recent years, but somewhat
higher over all years.
7 Yr All Yr
Liability Personal 4.08% 2.00%
Commercial 6.10% 1.16%
Physical
Damage
Personal 3.85% 1.32%
Commercial 1.73% 1.43%
Total Personal 3.98% 1.66%
Commercial 5.17% 1.22%


Casualty Actuarial Society
Reinsurance Seminar
Terry Knull – Team Leader Casualty Treaty Underwriting, Swiss Re North America

35
State of the Market

General ObservationsCommercial Auto
36
• Elevated loss & comb ratios due to loss trend and adverse development ($1.8B in 2018)
• CAL 2018 Combined ratio @ 108.1%, 8th
year in a row above 100%. 2019 is estimated at 107.0%
• Rising rates; high single digits (but not enough)
• Frequency pressure is driven by increased utilization, distracted driving, and driver shortages.
• Plaintiff attorney interest in 8 figure court awards for severe cases, a new litigation revenue stream. This and other forms of social inflation put pressure on severity.
• Technology such as ADAS & cameras will lead to reduction in accidents but take-up is slow
• TNC growth, Uber and Lyft IPOs in 2019
Covid Update:Most commercial vehicles still traveling due to essential servicesSome safety restrictions relaxed due to crisis

37
Commercial Auto Market SnapshotNet Basis
10 year CY LR (%)
-2.3-5.1-1.9
3.2 3.8 4.0 7.9 8.7 7.1 6.8
12 132009 1610 11 1514 17 2018
7760
69 7560 64 70 70
78 77
PYD
(Pts)
1530
2009 Rate Loss trends 2018
75
60
Historical change in AY LR, %
Severity
Loss trends by severity and frequency
Frequency
2018142008 10 12 16
60
40
80
100
120
140
2008
120
1210 14
60
16 201840
80
100
140
60 67 73 73 74 75 76 79 79 7510 year ultimate AY LR (%)
Source: SNL, CIAB, Swiss Re, Conning
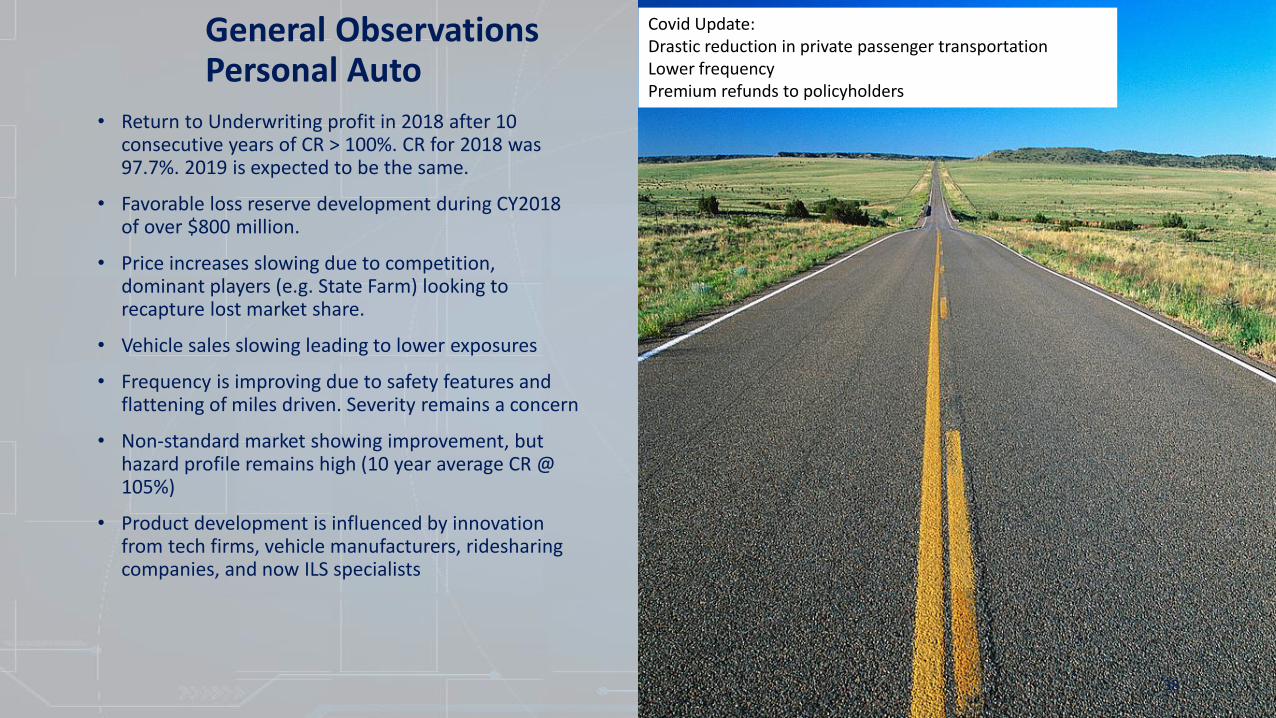
• Return to Underwriting profit in 2018 after 10 consecutive years of CR > 100%. CR for 2018 was 97.7%. 2019 is expected to be the same.
• Favorable loss reserve development during CY2018 of over $800 million.
• Price increases slowing due to competition, dominant players (e.g. State Farm) looking to recapture lost market share.
• Vehicle sales slowing leading to lower exposures
• Frequency is improving due to safety features and flattening of miles driven. Severity remains a concern
• Non-standard market showing improvement, but hazard profile remains high (10 year average CR @ 105%)
• Product development is influenced by innovation from tech firms, vehicle manufacturers, ridesharing companies, and now ILS specialists
General ObservationsPersonal Auto
38
Covid Update:Drastic reduction in private passenger transportationLower frequencyPremium refunds to policyholders

39
Macro drivers Impact Comments
Reserve releasesReserve releases running out; adverse development for GL, Umbrella, Financial Lines, ? Workers Compensation
Rate trendsMotor rates increases plateaued, WC rates decreasing, and Liability rates up/ momentum increasing
Economic activityThe COVID lockdowns have led to an unprecedented drop in activity. Real GDP is projected to contract 6.4% in 2020 with only a partial rebound next year. The unemployment rate has spiked to post-Depression records and is not expected to reach pre-crisis lows over the forecast horizon
Yield curve Long tail lines extremely sensitive to investment income; yield curve movements impact profitability. Interest rates projected to remain low for even longer amid economic hit and unprecedented monetary policy actions
Health care costsAs health care costs rise, claim costs increase, some PPACA provisions help keep medical inflation relatively low (vs. historical peaks)
Emerging Risks Marijuana, Autonomous Vehicles, 3D Printing, Pandemic, Climate change, Opioids, etc…
Loss TrendsIncreasing severity due to property events, non-correlated, non-systemic large losses, deep pockets, motor impact on umbrella, temporary frequency reduction due to COVID impact on economy
Key Trends for Casualty

Confidential
May 2020
Environmental Factors Impact Comments
Reduced gas pricesSaudi Arabia and Russia driving the gas price down. COVID-19 shelter in place significantly reducing demand and prices. Consumption expect to rebound later this year with 2021 still at reduced levels compared to 2019.
UnemploymentThe unemployment rate caused by COVID-19 sky rocketed. It was 4.4% in March and expected to be 15+% in April. The hope is that this is short term and will rebound quickly once there is some resolution of COVID-19. Beware of increased frequency to follow.
Trucking industryCOVID-19 crisis has granted temporary latitude for drivers to transport increased size and weight limits (this varies by state). Truck companies are out in full force looking for drivers. Driver shortage has been exacerbated by COVID-19, for a variety of reasons
Distracted Driving Distracted driving continues to be a concern. Data is improving but still not fully reliable.
Slow down of new vehicle sales Vehicle sales are down 34% YOY as of March 31.
Rate ChangesPersonal lines carriers were having competitive pressure on rates before the Coronavirus. Unclear how premium rebates and future rate filings will be impacted. Will the DOI require rate decreases?
Advanced technologyShould lead to fewer accidents. Does this offset distracted driving?Increase in repair costs.
Trends: Current Auto Drivers
Positive impact on portfolio Negative impact on portfolio Neutral impact Impact uncertain
40
COVID-19: There are reports that severity is increasing because of more speeding on open roadways.
Although claim counts are down, it may not be for all types of claims
Social Distancing

Confidential
May 2020
P&C Rate increases for US large and mid-size accounts still below year 2000 levelThe most exposed accounts are the least adequately priced
41
41
25% gap
Last hard market

Confidential
May 2020
0%
2%
4%
6%
8%
10%
12%
14%
16%
18%
20%
1961 1966 1971 1976 1981 1986 1991 1996 2001 2006 2011 2016 2021F 2026F
PCE CMS
Source: Datastream and CMS
CMS forecast→
• PCE = Nominal dollar expenditures (price x quantity) on healthcare as measured by the Personal Consumption Expenditures component of Gross Domestic Product
• CMS = Nominal dollar expenditures on healthcare as measured by the Centers for Medicare and Medicaid Services
• The correlation between the two annual yoy series is 95.3% (1961-2018); on average, historic data shows health expenditure growth for PCE yoy is 0.2% higher than CMS estimates.
• The average CMS projection through 2027 is 5.6%.
• KEY TAKEAWAY
• After a decade (2001-2011) of declining Health spending levels, yoy growth has increased, partly driven by coverage expansion under ACA after 2014, BUT
• the projection of 5.6% is lower than the long term average
Comments & Actions
Health spending is a key indicator of Medical Cost InflationMedical Inflation drives Bodily Injury loss severity
YoY Growth in Healthcare Spending
42

What is Social Inflation?
• Defined by PLUS as capturing “an increased propensity to sue; rising jury awards and expanding judicial theories beyond the 4 corners of a contract.”
• Rising costs of insurance claims resulting from: – Anti-corporate sentiment – Growing Wealth and Income gap– Increased litigation– Broader definitions of liability– More plaintiff friendly legal decisions– Composition of juries (millennials)– Larger compensatory jury awards
43

The term social inflation generally refers to the increase in compensation costs over and above basic economic trends. These include societal trends such as changing attitudes, expanding concepts of liability, a rising willingness to resolve conflict via the legal system, large defense costs, nuclear verdicts and a generally more plaintiff-friendly environment.
Swiss Re’s definition of social inflation
44
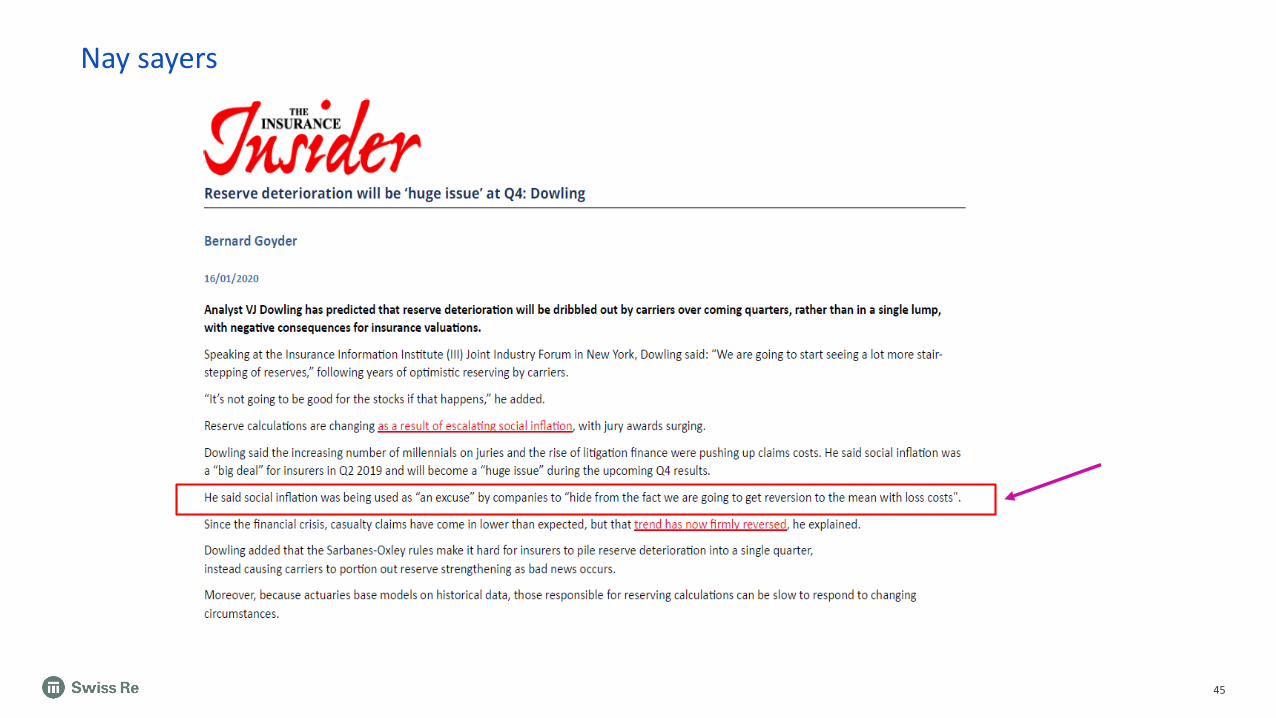
Nay sayers
45

Nay sayers
46

47
Claims Trend: Top 50 U.S. Verdicts 2014-2018
Data compiled for AIG by Shaub, Ahmuty, Citrin & Spratt
$27.70 $30.74
$39.13 $41.75
$54.33
$20.00
$25.00
$30.00
$35.00
$40.00
$45.00
$50.00
$55.00
$60.00
2014 2015 2016 2017 2018
Median - Top 50 U.S. Verdicts($Millions)
• Median of the top 50 single plaintiff bodily injury award has almost doubled from 2014 – 2018 due to increasing frequency of severe large losses
• Increase in “pile on litigation”, once recalls/investigations are announced, more suits filed by municipalities, investors, consumers, etc.
• Juries desensitized to the value of a dollar and highly publicized mega verdicts are the new normal
• Millennials continue to take leadership roles in jury deliberations (studies indicate median awards from millennial juries are double prior historical awards)
• Juries discount facts on liability apportionment and are sympathetic to severely injured plaintiffs
• Plaintiff’s bar very coordinated, share strategies rapidly & efficiently, and spending more on legal advertising and marketing than ever before
• Reptile theory & Kardashian effect continue unabated
• Health Hazard & Medical device verdicts continue to drive the increasing awards
• The anti-corporation movement gained momentum after such scandals as Enron and the financial crisis of 2007-2008, juries take this bias to the courtroom
• Litigation funding has quadrupled between 2013 – 2016 increasing the volume of legal actions
Comments
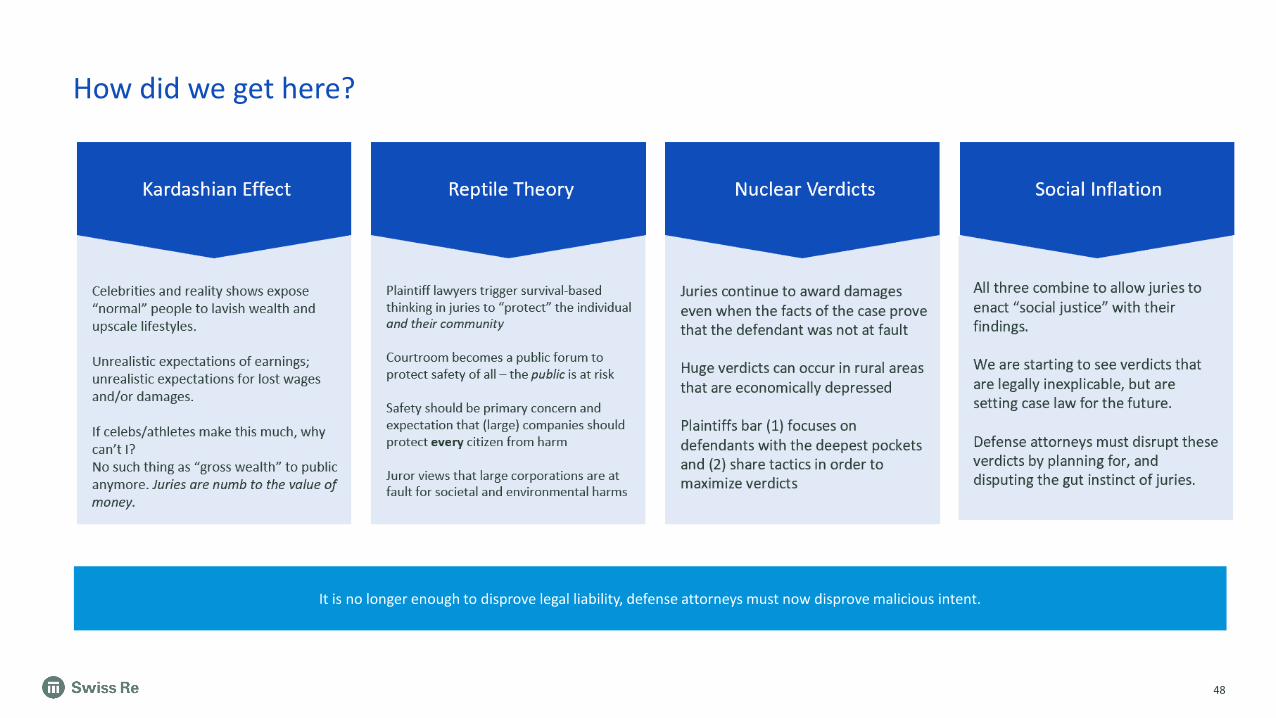
How did we get here?
48
It is no longer enough to disprove legal liability, defense attorneys must now disprove malicious intent.
Celebrities and reality shows expose “normal” people to lavish wealth and upscale lifestyles.
Unrealistic expectations of earnings; unrealistic expectations for lost wages and/or damages.
If celebs/athletes make this much, why can’t I? No such thing as “gross wealth” to public anymore. Juries are numb to the value of money.
Plaintiff lawyers trigger survival-based thinking in juries to “protect” the individual and their community
Courtroom becomes a public forum to protect safety of all – the public is at risk
Safety should be primary concern and expectation that (large) companies should protect every citizen from harm
Juror views that large corporations are at fault for societal and environmental harms
Juries continue to award damages even when the facts of the case prove that the defendant was not at fault
Huge verdicts can occur in rural areas that are economically depressed
Plaintiffs bar (1) focuses on defendants with the deepest pockets and (2) share tactics in order to maximize verdicts
Kardashian Effect Reptile Theory Nuclear Verdicts Social Inflation
All three combine to allow juries to enact “social justice” with their findings.
We are starting to see verdicts that are legally inexplicable, but are setting case law for the future.
Defense attorneys must disrupt these verdicts by planning for, and disputing the gut instinct of juries.
49
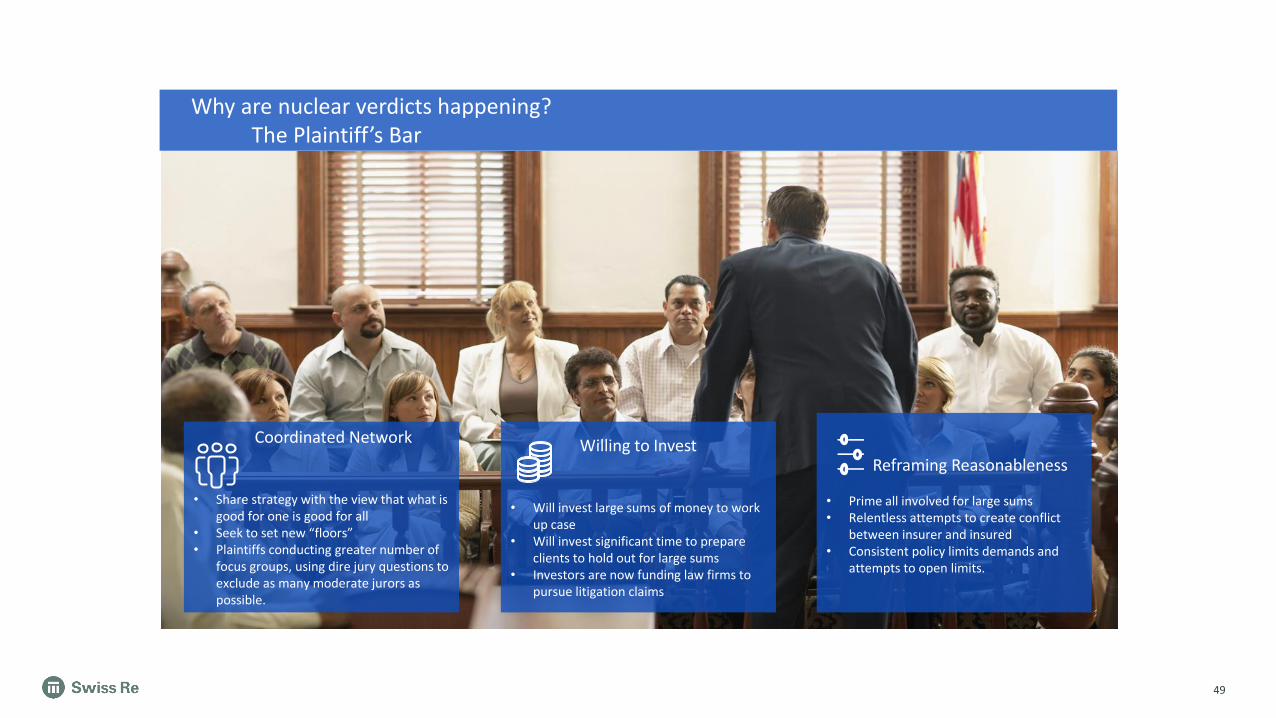
Reframing Reasonableness
• Prime all involved for large sums• Relentless attempts to create conflict
between insurer and insured• Consistent policy limits demands and
attempts to open limits.
Willing to Invest
• Will invest large sums of money to work up case
• Will invest significant time to prepare clients to hold out for large sums
• Investors are now funding law firms to pursue litigation claims
Coordinated Network
• Share strategy with the view that what is good for one is good for all
• Seek to set new “floors”• Plaintiffs conducting greater number of
focus groups, using dire jury questions to exclude as many moderate jurors as possible.
Why are nuclear verdicts happening? The Plaintiff’s Bar

50
What about the role of juries?
35% of jurors would add lawyer fees to a damages
award, even if instructed not to
45% of jurors admit sympathy
affects their attitudes about a
lawsuit
42% of jurors would decide a
case based not on the law but on
what they believe is fair
72% would assume a case has merit if it “makes it to a
courtroom”
Millennial juries tend to be more socially conscious, sympathetic to injured plaintiffs, and significantly more likely to award damages and hold corporations to a higher standard than past generations.

Auto tort cases in state courts have strongly increased between 2014 and 2018
51
125
130
135
140
145
150
155
160
165
2012 2017
Auto Tort Case Load (per 100k population)
20162013 20152014 2018
+7%
+4.2%
+6.7%
+3.1%
6.56.66.76.86.97.07.17.27.37.47.5
20162013 2018
Medmal Case Load (per 100k population)
2012 2014 2015 2017
-1.4%
+5.6%
• Auto tort cases filed with US state courts have seen a significant uptick starting in 2014 (22% increase from 2014 to 2018)
• Medmal cases experienced a spike of 5.6% from 2017 to 2018 after having more moderately increased in the preceding years.
Source: Court Statistics Project http://www.courtstatistics.org/State basis: 14 states with at least 6 years of reporting (2012 missing for some states) - AK/CT/IA/KS/MI/NE/NH/NJ/PA/PR/SC/TX/WA/WI
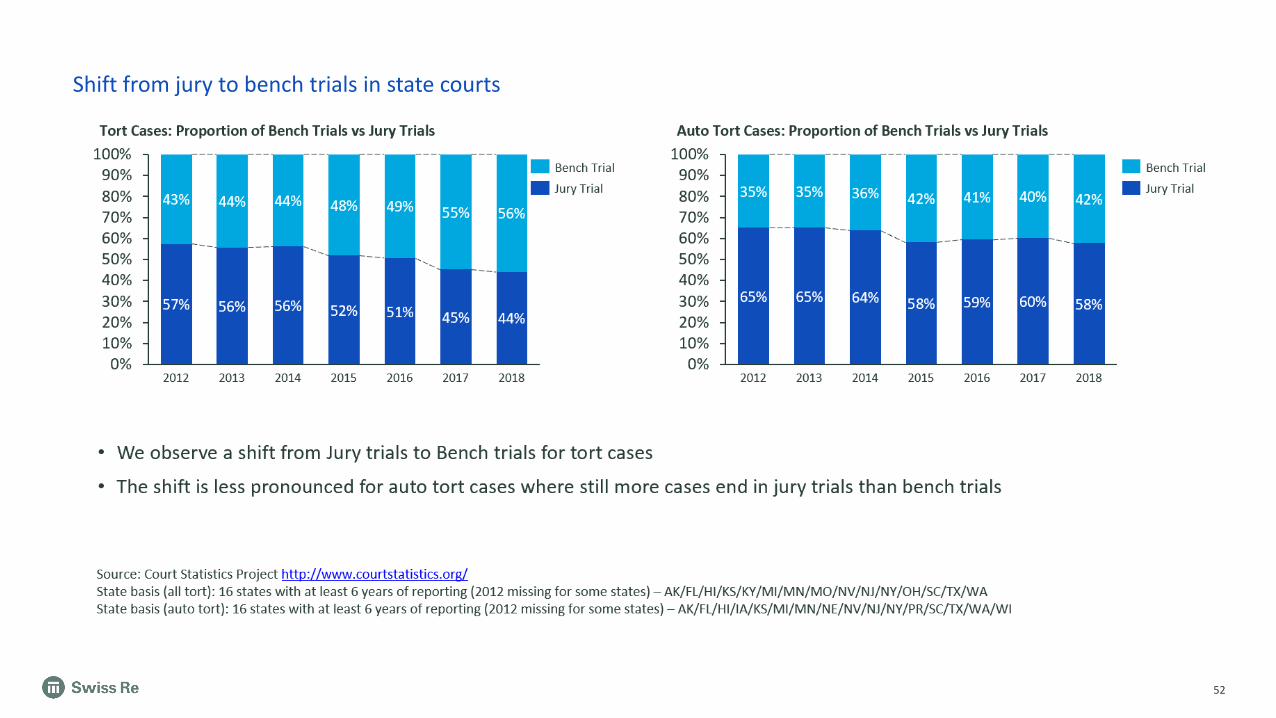
Shift from jury to bench trials in state courts
52
57% 56% 56% 52% 51% 45% 44%
43% 44% 44% 48% 49% 55% 56%
0%10%20%30%40%50%60%70%80%90%
100%
2016 201820132012
Tort Cases: Proportion of Bench Trials vs Jury Trials
2014 20172015
Bench Trial
Jury Trial
65% 65% 64% 58% 59% 60% 58%
35% 35% 36% 42% 41% 40% 42%
0%10%20%30%40%50%60%70%80%90%
100%
Auto Tort Cases: Proportion of Bench Trials vs Jury Trials
2012 201820142013 20172015 2016
Bench Trial
Jury Trial
• We observe a shift from Jury trials to Bench trials for tort cases
• The shift is less pronounced for auto tort cases where still more cases end in jury trials than bench trials
Source: Court Statistics Project http://www.courtstatistics.org/State basis (all tort): 16 states with at least 6 years of reporting (2012 missing for some states) – AK/FL/HI/KS/KY/MI/MN/MO/NV/NJ/NY/OH/SC/TX/WAState basis (auto tort): 16 states with at least 6 years of reporting (2012 missing for some states) – AK/FL/HI/IA/KS/MI/MN/NE/NV/NJ/NY/PR/SC/TX/WA/WI

Tort reform – little activity in recent years
53
0.0
0.1
0.2
0.3
0.4
0.5
0.6
0.7
0.8
0.9
1985 1990 1995 2000 2005 2010 2015 2020
Proportion of states having enacted ATRA supported reforms
Class Actions Product LiabilityPunitive Damages
Source: American Tort Reform Association (ATRA) - http://www.atra.org/resources/tort-reform-records/The graph shows the proportion of states that have enacted ATRA supported reforms since 1986. Reforms prior to 1986 are not tracked.
• Hardly any ATRA-supported tort reform has been enacted since 2013 for class actions, punitive damages or product liability.
• To the contrary, several states have struck down punitive damage reforms as unconstitutional (Illinois, Kentucky and Missouri)

Confidential
May 2020
Environmental FactorsExpected Impact
Comments
Plaintiff attorney focus on motor and nuclear verdicts
Plaintiff’s bar focus on traditional bodily injury. De-sensitized & anti-corporate juries are driving increase in large losses. Possibility Millennials will make up more of the juries the remainder of the year as older people stay home because of COVID-19.
Distracted DrivingDistracted Driving is expected to continue. However, smartphone penetration has little room to increase and vehicle cockpit innovations continue to be prevalent. This puts frequency at an elevated level, but not necessarily increasing anymore.
Telematics adoption & usage based insurance
Poised for rapid growth in the U.S. Continued improvement in cost, convenience, and effectiveness.
Safety Innovation & Autonomous Vehicles
Accident avoidance systems common in new vehicles. AEB (automating emergency braking) targeted 100% by 2022. High autonomous vehicles expected in maybe a decade (not full autonomous). Average age of vehicle is increasing, new tech will trickle down to the population, delaying full benefits.
Ride Sharing Real-time algorithms are making this very efficient. Potential for multiple customers to the same destination. Implications are huge for less congestion, fewer drunk drivers, and less pollution.
Soaring repair costs Safety innovations and increase in autonomous features are driving up cost to replace or repair vehicle.
Medical inflationStrong increases in the cost of hospital services and prescription drugs. Same problems exist in healthcare with inefficiencies and utilization rather than prevention. As of Q4 2019, healthcare inflation was 5.3% (the average before the 08 collapse was 6%)
MarijuanaDC and 11 states legal for recreational use with more to come. Conflicting studies on whether frequency is increased permanently.
Trends: Key Trends we see for the Future
Positive impact on portfolio Negative impact on portfolio Neutral impact Impact uncertain
54
COVID-19: Driving behavior may change forever. More acceptance of work from home. It might speed up the use of telematics and mileage based pricing.

0 20 40 60 80 100
Dram Shop
Gas
Boat
Hotel
Construction Defect
Apartment Management
Crime
Weather
Train
Contractual
Nursing Home
Libel & Slander
Sexual Molestation
Premise Liability
Wildfire
Balcony
Personal Auto
Product
Fire
Liability
Commercial Auto
Millions
Sum of SR Reserve
Sum of SR Incurred
Product
Total Incurred Amount To Swiss Re in millions
Commercial Auto
77
Personal Auto
14
20
14
Liability
Motor loss impact on Umbrella is Significant Top 200 Umbrella XOL losses (2010-2017)
Claim Counts
40% (count) and 43% (total incurred) of our largest 200 Umbrella XOL losses are from Commercial Auto
55

2019 Schedule P Analysis - Casualty Lines 56
Ultimate Loss Ratios – Industry Booked vs ProjectedCommercial Auto Liability
09-19 Excl AmTrust Schedule P Industry Booked Ultimate Loss Ratios - Commercial Auto Liability Swiss Re Actuarial Projections
Accident
Year
Earned
Premium
(000s) As of 12 As of 24 As of 36 As of 48 As of 60 As of 72 As of 84 As of 96 As of 108 As of 120
(Adv)/ Fav
from 12
to
Current
Reported
Loss
Ratio
Paid
Method
Reported
Method Selected
Carried -
Selected
1997 12,188,203 77.8% 78.3% 79.9% 81.8% 83.5% 83.9% 83.9% 83.7% 83.8% 83.7% -5.9%
1998 12,093,751 77.0% 78.7% 81.8% 85.2% 86.4% 86.8% 86.5% 86.4% 86.1% 86.1% -9.1%
1999 11,992,467 78.5% 83.7% 88.0% 91.3% 92.6% 92.5% 92.8% 92.6% 92.4% 92.4% -13.9%
2000 12,870,674 77.3% 80.8% 84.2% 86.6% 88.0% 88.9% 88.6% 88.5% 88.5% 88.4% -11.1%
2001 13,900,917 73.3% 73.2% 75.7% 77.6% 78.7% 78.2% 77.9% 77.9% 77.6% 77.5% -4.2%
2002 15,724,627 66.6% 64.9% 66.4% 66.9% 66.9% 66.8% 66.4% 66.3% 66.1% 66.0% 0.6%
2003 17,429,980 63.6% 61.5% 61.1% 61.2% 60.8% 60.5% 60.2% 59.9% 59.8% 59.7% 3.9%
2004 18,711,968 61.5% 58.6% 58.2% 57.9% 57.3% 57.4% 56.9% 56.8% 56.7% 56.7% 4.9%
2005 19,121,586 60.8% 59.1% 58.3% 58.2% 57.8% 57.5% 57.1% 57.0% 56.8% 56.7% 4.1%
2006 19,041,946 61.6% 59.8% 59.2% 58.9% 58.3% 57.8% 57.8% 57.7% 57.5% 57.5% 4.1%
2007 18,899,073 61.9% 61.1% 60.9% 60.7% 60.1% 60.2% 60.0% 59.9% 59.8% 59.7% 2.2%
2008 17,884,154 62.4% 61.4% 61.3% 61.0% 61.0% 60.9% 60.9% 60.8% 60.8% 60.7% 1.7%
2009 16,739,915 62.7% 60.5% 60.4% 60.1% 60.2% 60.0% 59.9% 59.7% 59.7% 59.7% 2.9%
2010 15,864,610 64.7% 64.9% 65.9% 66.8% 67.5% 67.7% 67.5% 67.3% 67.3% 67.4% -2.6% 67.1% 67.4% 67.4% 67.4% 0.0%
2011 15,941,869 65.6% 68.3% 70.0% 71.0% 72.4% 72.5% 72.4% 72.5% 72.6% -7.0% 72.1% 72.6% 72.6% 72.6% 0.0%
2012 16,339,409 66.2% 68.2% 69.6% 71.7% 72.5% 72.6% 72.6% 72.6% -6.5% 71.9% 72.6% 72.6% 72.6% 0.0%
2013 17,459,867 65.6% 67.2% 70.6% 72.7% 73.5% 73.5% 73.9% -8.2% 73.0% 73.9% 73.9% 73.9% 0.0%
2014 18,552,623 65.3% 68.5% 71.6% 73.2% 74.5% 74.8% -9.5% 73.5% 75.2% 75.2% 75.2% -0.4%
2015 19,803,697 66.2% 70.0% 72.8% 74.7% 76.0% -9.8% 74.0% 76.8% 76.9% 76.8% -0.8%
2016 20,443,983 69.3% 72.2% 75.2% 77.9% -8.6% 73.0% 79.5% 79.6% 79.5% -1.6%
2017 21,430,109 70.7% 72.9% 76.2% -5.5% 66.6% 79.9% 80.0% 80.0% -3.8%
2018 24,863,191 69.7% 72.8% -3.2% 54.6% 78.1% 78.4% 78.2% -5.4%
2019 27,680,318 70.9% 37.1% 73.4% 77.2% 75.3% -4.4%
Loss Ratio for Combined Ratio of 100 = 64.6%
∆ vs 12 < -5.0% < -3.8% < -2.5% < -1.3% > 1.3% > 2.5% > 3.8% > 5.0% 2010-2019 Total Ind Reserves
2010-2019 Reserve Red/ (Def)
Heat Map range (input) +/ - : 5% 2010-2018 Prior Yr Devt
38,367,910
(3,954,249)
(2,473,006)
• Since AY 2010, industry booked loss ratios are higher than the initial projection as of 12 months.
• Every AY year from 2010 to 2018 had adverse devt. in CY 2019.
• 2018 Premium level increase is due in part to US tax reform (less intragroup, offshore cessions)
• Premium levels in 2019 are up 11%. Even so, early chain ladder indications point to adverse development.

2019 Schedule P Analysis - Casualty Lines 57
Ultimate Loss Ratios – Industry Booked vs ProjectedPersonal Auto Liability
Schedule P Ultimate Loss Ratio Selections - Private Passenger Auto Liability Actuarial Projections
Accident
Year
Earned Premium
(000s) As of 12 As of 24 As of 36 As of 48 As of 60 As of 72 As of 84 As of 96 As of 108 As of 120
(Adv)/ Fav
from 12 to
Current Paid Method
Reported
Method Selected
Carried -
Selected
1997 68,239,065 72.9% 70.4% 69.5% 69.1% 68.9% 68.8% 68.8% 68.8% 68.8% 68.8% 4.1%
1998 68,901,300 71.5% 70.3% 70.1% 69.8% 69.8% 69.8% 69.8% 69.7% 69.8% 69.8% 1.7%
1999 68,836,544 75.0% 74.9% 74.8% 74.9% 74.8% 74.8% 74.8% 74.9% 74.8% 74.8% 0.2%
2000 69,147,087 79.0% 79.4% 79.6% 79.7% 79.7% 79.8% 79.8% 79.8% 79.9% 79.9% -0.9%
2001 72,567,709 78.4% 78.0% 77.8% 77.9% 78.1% 78.0% 78.0% 78.0% 78.0% 78.0% 0.4%
2002 79,248,275 76.0% 75.1% 74.7% 74.8% 74.7% 74.6% 74.5% 74.5% 74.5% 74.5% 1.5%
2003 86,800,351 71.0% 68.7% 67.8% 67.6% 67.4% 67.4% 67.3% 67.2% 67.2% 67.2% 3.9%
2004 91,906,472 67.8% 65.2% 64.3% 63.9% 63.6% 63.5% 63.5% 63.4% 63.4% 63.4% 4.4%
2005 94,278,316 67.1% 64.8% 64.1% 63.8% 63.5% 63.4% 63.2% 63.2% 63.2% 63.2% 3.9%
2006 95,333,340 65.8% 65.0% 64.5% 64.1% 63.7% 63.5% 63.5% 63.4% 63.4% 63.4% 2.4%
2007 94,735,725 68.8% 68.4% 67.9% 67.5% 67.1% 66.9% 66.9% 66.8% 66.8% 66.8% 2.0%
2008 93,293,839 69.4% 68.8% 68.1% 67.6% 67.3% 67.2% 67.1% 67.1% 67.1% 67.1% 2.3%
2009 93,336,052 72.9% 72.0% 71.2% 70.7% 70.4% 70.5% 70.5% 70.4% 70.4% 70.4% 2.5%
2010 95,292,721 73.5% 72.4% 71.6% 71.5% 71.3% 71.4% 71.3% 71.2% 71.2% 71.2% 2.3% 71.3% 71.3% 71.3% -0.1%
2011 98,157,391 72.1% 70.8% 70.7% 70.7% 70.6% 70.5% 70.5% 70.5% 70.5% 1.6% 70.5% 70.5% 70.5% 0.0%
2012 100,636,845 71.5% 70.8% 70.7% 70.6% 70.5% 70.4% 70.4% 70.4% 1.1% 70.4% 70.4% 70.4% 0.0%
2013 101,545,356 72.5% 72.3% 72.4% 72.5% 72.3% 72.2% 72.2% 0.2% 72.3% 72.2% 72.3% 0.0%
2014 116,823,393 65.8% 66.1% 66.4% 66.4% 66.2% 66.1% -0.3% 66.2% 66.1% 66.2% 0.0%
2015 114,209,842 72.9% 74.5% 75.0% 75.1% 75.1% -2.2% 75.4% 75.1% 75.2% -0.2%
2016 121,334,359 75.1% 75.7% 76.0% 76.1% -1.1% 76.6% 76.1% 76.3% -0.2%
2017 130,585,644 72.3% 71.7% 71.8% 0.5% 71.9% 71.4% 71.7% 0.1%
2018 141,446,071 69.4% 69.2% 0.3% 68.8% 68.4% 68.6% 0.6%
2019 146,164,596 70.4% 68.9% 69.2% 69.1% 1.3%
Loss Ratio for Combined Ratio of 100 = 64.6%
∆ vs 12 < -5.0% < -3.8% < -2.5% < -1.3% > 1.3% > 2.5% > 3.8% > 5.0% 2010-19 Reserve Redundancy/ (Deficiency)
= 2,111,694 1.7%
• Since AY 2012, Industry booked loss ratios are not consistently higher than the initial projection as of 12 months.
• Every AY year from 2010 to 2018 exhibits only modest development in CY 2019.
• 2018 Premium level increase is due in part to US tax reform (less intragroup, offshore cessions)
• Premium levels in 2019 are up 3%.

2019 Schedule P Analysis - Casualty Lines
09-19 Excl AmTrust Schedule P Industry Booked Ultimate Loss Ratios - Other Liability: Occurrence Swiss Re Actuarial Projections
Accident
Year
Earned
Premium
(000s) As of 12 As of 24 As of 36 As of 48 As of 60 As of 72 As of 84 As of 96 As of 108 As of 120
(Adv)/ Fav
from 12
to
Current
Reported
Loss
Ratio
Paid
Method
Reported
Method Selected
Carried -
Selected
1997 12,399,909 80.9% 81.5% 82.5% 81.1% 82.0% 83.8% 83.3% 84.7% 86.3% 87.5% -6.6%
1998 13,182,174 82.3% 83.0% 85.6% 88.5% 91.6% 91.2% 95.3% 97.9% 98.7% 99.0% -16.7%
1999 12,278,962 79.1% 81.0% 82.8% 89.0% 91.7% 95.5% 99.9% 101.9% 101.9% 105.4% -26.2%
2000 12,308,791 79.2% 79.6% 84.2% 90.2% 96.4% 98.2% 99.0% 100.3% 100.6% 101.0% -21.8%
2001 12,969,558 89.4% 91.0% 91.6% 94.7% 98.7% 100.7% 102.1% 101.5% 102.2% 102.8% -13.4%
2002 17,331,029 72.1% 71.8% 73.9% 77.0% 78.5% 79.0% 79.1% 79.6% 80.3% 80.8% -8.7%
2003 22,093,965 69.3% 66.3% 66.1% 65.2% 63.6% 62.9% 62.9% 63.1% 62.7% 62.3% 7.0%
2004 25,655,794 68.3% 60.8% 57.9% 55.9% 54.8% 54.6% 53.9% 53.4% 52.9% 52.9% 15.4%
2005 25,637,314 65.5% 61.5% 59.6% 56.6% 55.9% 54.8% 53.9% 53.5% 53.2% 53.6% 11.9%
2006 28,381,175 63.9% 61.9% 58.6% 57.1% 56.1% 54.5% 53.9% 52.8% 52.3% 52.2% 11.7%
2007 28,083,816 66.1% 63.7% 61.9% 61.9% 60.3% 60.0% 58.6% 57.8% 57.5% 57.2% 8.9%
2008 26,287,610 67.3% 65.6% 65.5% 62.8% 62.5% 61.6% 60.8% 60.0% 59.7% 59.6% 7.6%
2009 24,817,098 69.1% 68.4% 66.2% 63.9% 63.0% 61.8% 61.0% 61.3% 60.5% 60.4% 8.7%
2010 23,159,755 68.4% 68.0% 67.9% 66.4% 66.0% 65.3% 65.3% 64.5% 64.4% 64.5% 3.9% 60.6% 64.5% 64.5% 64.5% 0.0%
2011 22,944,250 67.0% 67.0% 67.2% 67.0% 66.9% 67.2% 66.6% 66.4% 66.8% 0.2% 62.0% 66.8% 66.8% 66.8% 0.0%
2012 24,094,289 64.8% 64.7% 64.1% 64.6% 64.5% 64.9% 64.4% 64.5% 0.3% 58.8% 64.6% 64.5% 64.5% 0.0%
2013 25,852,430 62.3% 61.7% 62.4% 63.7% 63.4% 63.4% 63.7% -1.4% 57.5% 64.7% 64.4% 64.4% -0.7%
2014 28,100,614 61.7% 61.1% 62.8% 62.0% 62.8% 64.2% -2.5% 55.7% 66.7% 65.1% 65.1% -0.9%
2015 28,946,170 61.6% 63.6% 63.1% 64.2% 66.7% -5.1% 55.7% 72.3% 70.2% 71.3% -4.5%
2016 29,186,378 63.7% 64.1% 65.0% 66.7% -3.0% 48.5% 70.2% 69.3% 69.7% -3.1%
2017 29,601,342 63.3% 64.9% 67.0% -3.7% 40.7% 69.9% 72.5% 71.2% -4.2%
2018 35,764,839 64.4% 65.6% -1.1% 28.0% 74.1% 70.3% 72.2% -6.7%
2019 38,037,782 66.5% 15.1% 85.0% 75.4% 75.4% -8.8%
Loss Ratio for Combined Ratio of 100 = 62.3%
∆ vs 12 < -5.0% < -3.8% < -2.5% < -1.3% > 1.3% > 2.5% > 3.8% > 5.0% 2010-2019 Total Ind Reserves
2010-2019 Reserve Red/ (Def)
Heat Map range (input) +/ - : 5% 2010-2018 Prior Yr Devt
79,073,926
(9,632,014)
(2,821,666)
58
Ultimate Loss Ratios – Industry Booked vs ProjectedOther Liability Occurrence – (Mostly Excludes Professional and D&O)
• Since AY 2013, Industry booked loss ratios are higher than the initial projection as of 12 months.
• Every AY year from 2010 to 2018 had adverse devt. in CY 2019.
• 2018 Premium level increase is due in part to US tax reform (less intragroup, offshore cessions)
• Premium levels in 2019 are up 6%. Even so early chain ladder indications show adverse development.

COVID-19: Frustrating or ameliorating social inflation?
59
• Most experts predict same or increased levels of social inflation
• Why?
• Frustration with large corporations not taking ‘adequate’ precautions on behalf of employees
• Blending frustration with government actions with corporations: reducing workforce, employment, ‘little man’ loses
• Frustration and increased sense of fear, lack of control, powerlessness, identification with victim mentality, finding villains

What about the Court System during COVID-19
60

What about the Court System during COVID-19
61

COVID-19 Impact on Modes of Transportation
Swiss Re Data (mostly Europe)
62

Increase in Speeding during COVID-19
Swiss Re Data (mostly Europe)
63
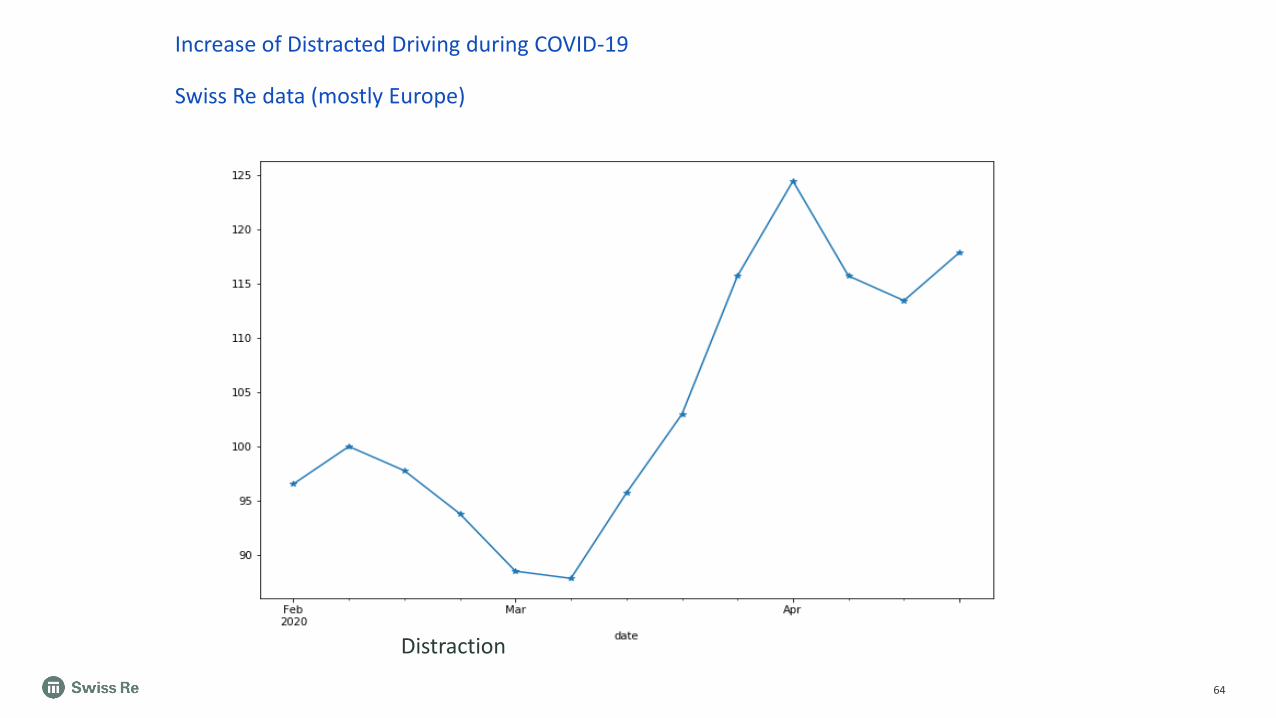
Increase of Distracted Driving during COVID-19
Swiss Re data (mostly Europe)
64
Distraction

Sean Devlin | CAS Spring Meeting | May 2019 65

© 2020 Insurance Services Office, Inc. All rights reserved. 66© 2017 Verisk Analytics, Inc. All rights reserved. 66© 2019 Insurance Services Office, Inc. All rights reserved. 66
COVID-19 Analysis

© 2020 Insurance Services Office, Inc. All rights reserved. 67
Yield Curve – 10 Year Treasury Bills
The Yield Curve for 10 Year Treasure Bills began falling at the end of 2006, prior to the official start of the Great Recession in December 2007.
Source: https://www.macrotrends.net/2016/10-year-treasury-bond-rate-yield-chart
Great Recession early Indicators
Prior Shock Events Analysis – Great Recession
© 2020 Insurance Services Office, Inc. All rights reserved. 68
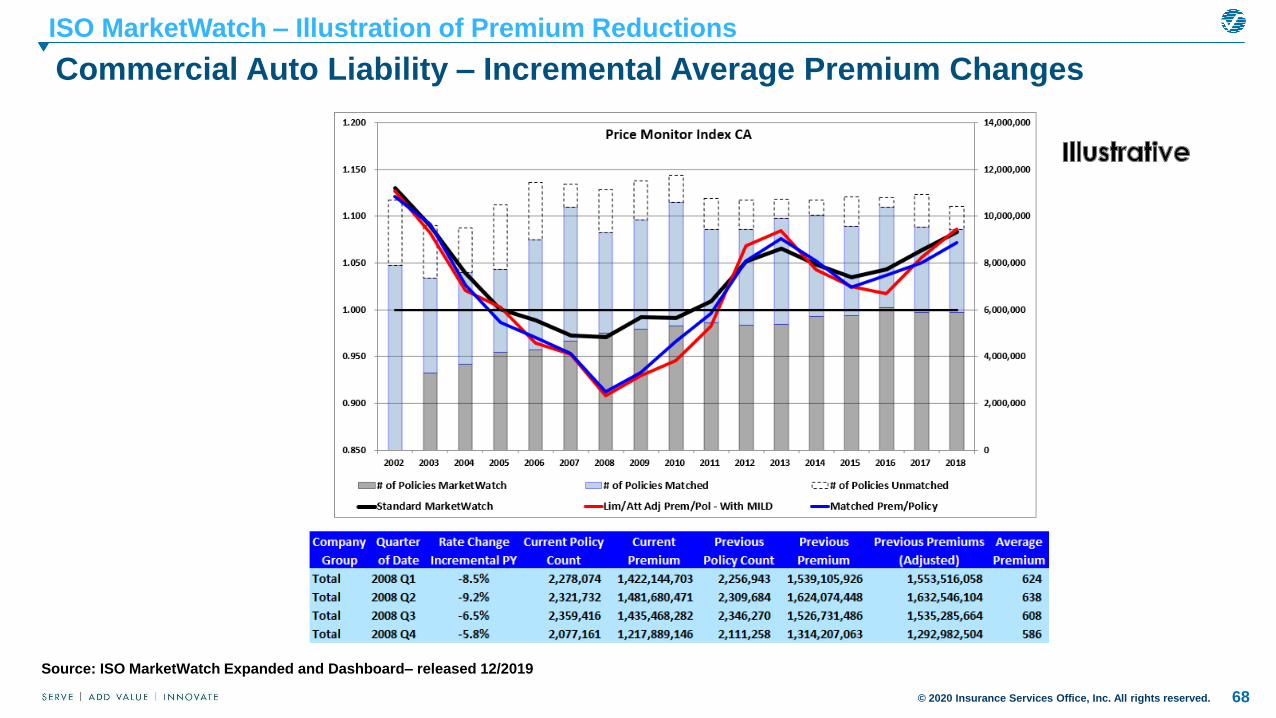
ISO MarketWatch – Illustration of Premium Reductions
Commercial Auto Liability – Incremental Average Premium Changes
Source: ISO MarketWatch Expanded and Dashboard– released 12/2019
© 2020 Insurance Services Office, Inc. All rights reserved. 69
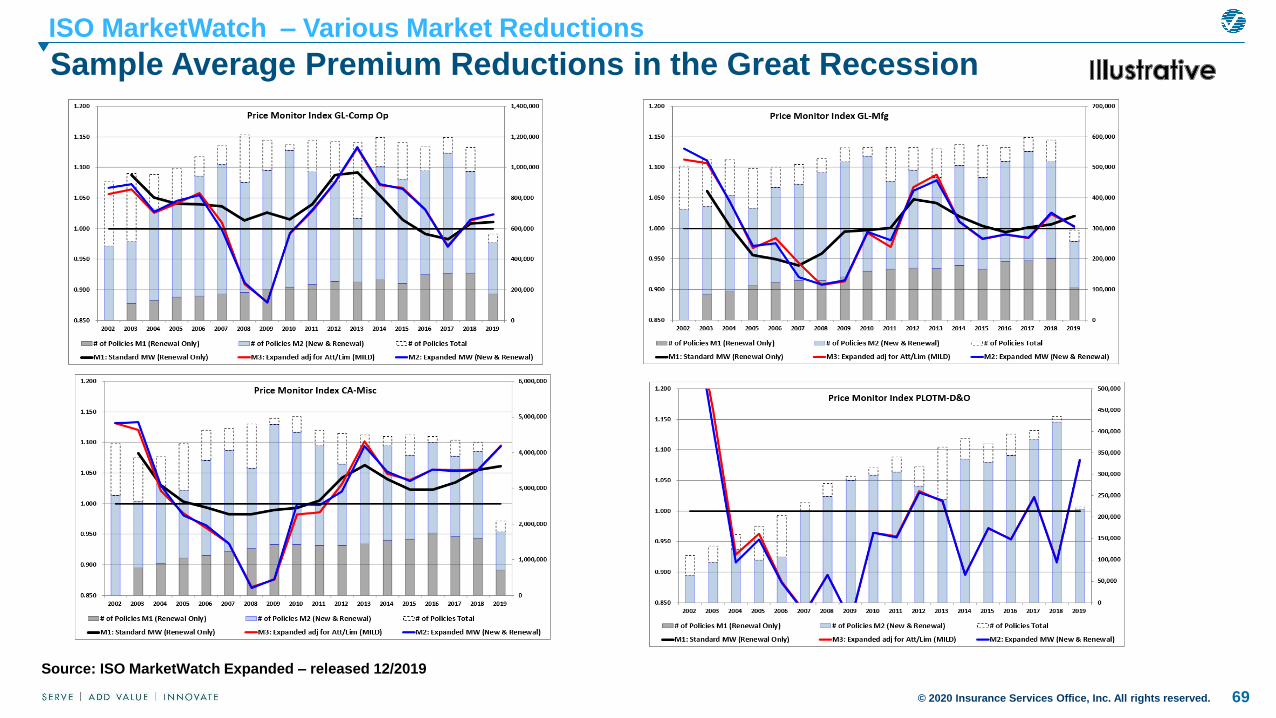
Sample Average Premium Reductions in the Great Recession
ISO MarketWatch – Various Market Reductions
Source: ISO MarketWatch Expanded – released 12/2019

© 2020 Insurance Services Office, Inc. All rights reserved. 70
Prior Shock Events Analysis – Great Recession
Analyzing Premium Declines – Sample Reductions and Shapes by LOB/Market
Source: ISO MarketWatch – released 12/2019

© 2020 Insurance Services Office, Inc. All rights reserved. 71
Source: ISO MarketWatch
Prior Shock Events Analysis – Great Recession
Analyzing Premium Declines – Summary by LOB/Market
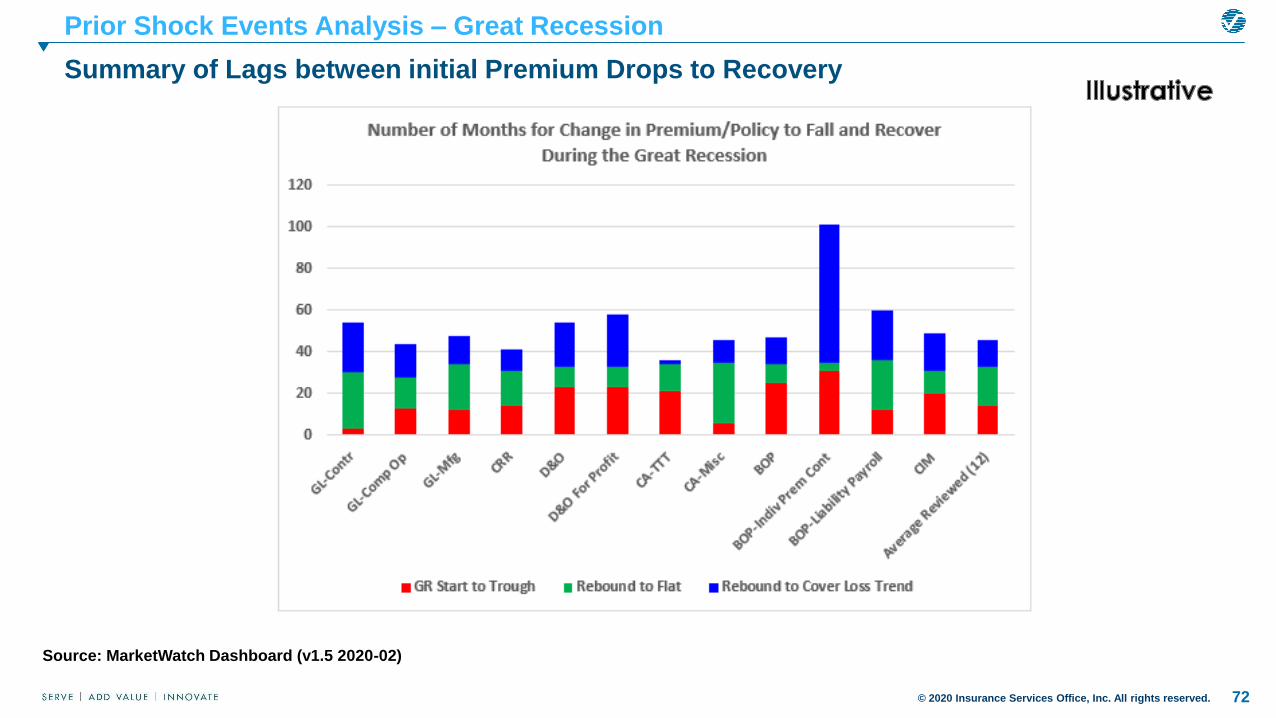
© 2020 Insurance Services Office, Inc. All rights reserved. 72
Source: MarketWatch Dashboard (v1.5 2020-02)
Prior Shock Events Analysis – Great Recession
Summary of Lags between initial Premium Drops to Recovery

© 2020 Insurance Services Office, Inc. All rights reserved. 73
Source: ISO MarketWatch – released 12/2019
Covid extension will involve judgments under various viral scenarios as to depth, duration, and shape (V, U, W, WW, L, extended L,…)
Prior Shock Events Analysis
Covid – Market Impact / LDF Speed Up / Slow Down Impact Framework

© 2020 Insurance Services Office, Inc. All rights reserved. 74
Current COVID impacts during stay-at-home: Auto
• Highly variable based on location, vehicle type, usage, coverage
• Based on early statistical/claim data
• Personal Auto
– Frequency impact: -30% to -60%
– Severity impact: +5% to +35%
– Pure Premium impact -20% to -50%
• Commercial Auto
– Frequency impact: -50% to -70%
– Severity impact: 0% to +20%
– Pure Premium impact -40% to -70%

© 2020 Insurance Services Office, Inc. All rights reserved. 75
Current COVID impacts during stay-at-home: Auto
– Mileage down approximately 45 to 50% (according to mobility data)
– Claim activity highly correlated to driving index
. Source: https://www.apple.com/covid19/mobility

© 2020 Insurance Services Office, Inc. All rights reserved. 76

© 2020 Insurance Services Office, Inc. All rights reserved. 77
Covid Actuarial Analysis
New Covid case reproduction number by state and shelter order – base case (5/4/2020)
These exhibits show the last 7-day
and 3-day cases by state and shelter
order, as well as Rt, the effective
reproduction number. States are split
between those who are sheltered, vs.
reopened, vs. never sheltered as of
5/4/2020. The top exhibit displays
raw new cases, while the bottom
adjusts the cases to per million per
capita.
Reviewing these periodically will help
show the effect of the reopening
orders. Other factors such as amount
of testing and testing quality would
need to be considered.
Source: compiled by ISO using data from https://rt.live/
© 2020 Insurance Services Office, Inc. All rights reserved. 78
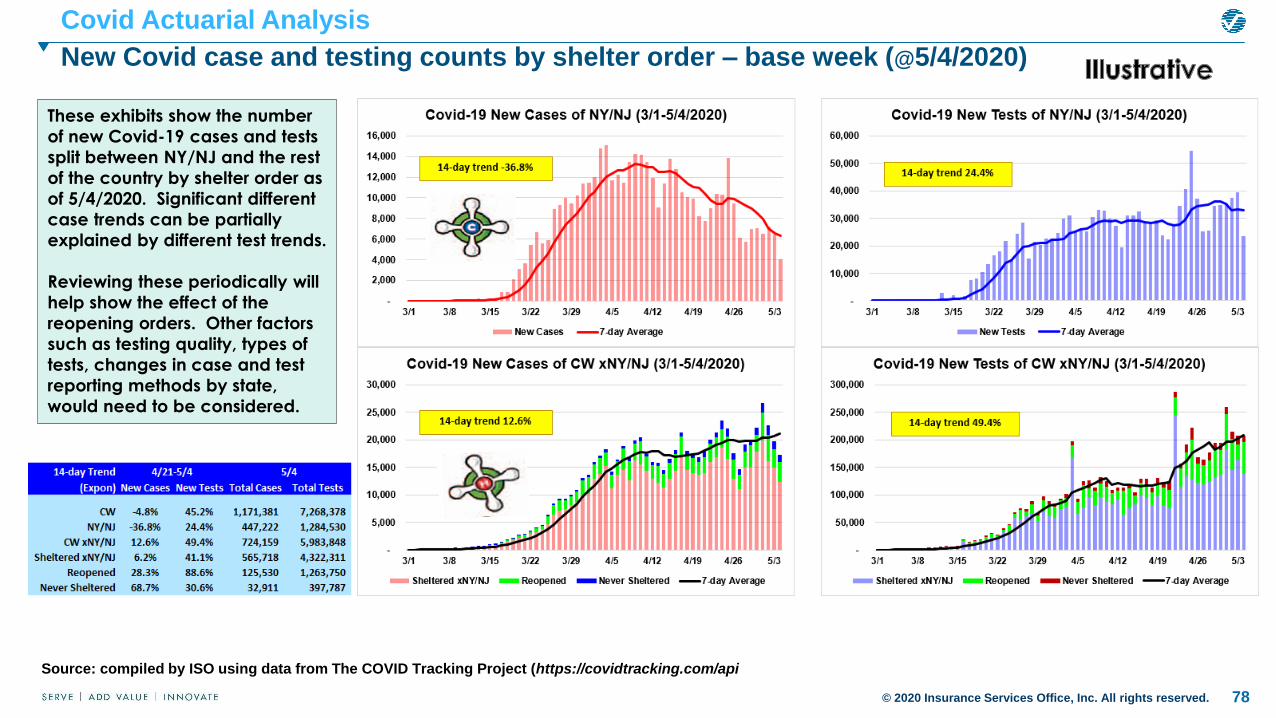
Covid Actuarial Analysis
New Covid case and testing counts by shelter order – base week (@5/4/2020)
These exhibits show the number
of new Covid-19 cases and tests
split between NY/NJ and the rest
of the country by shelter order as
of 5/4/2020. Significant different
case trends can be partially
explained by different test trends.
Reviewing these periodically will
help show the effect of the
reopening orders. Other factors
such as testing quality, types of
tests, changes in case and test
reporting methods by state,
would need to be considered.
Source: compiled by ISO using data from The COVID Tracking Project (https://covidtracking.com/api

© 2020 Insurance Services Office, Inc. All rights reserved. 79
Covid Actuarial Analysis
Conceptual Framework of Tracking Covid Exposure through to Hospitalizations and Fatalities
These exhibits show how actuarial science can be used to help analyze the
various Covid stages. Conceptually, if the right kind of linked data was captured,
the process from initial exposure and positive cases through to recovery or death
could be tracked. E.g. with robust exposure identification and contact tracing,
all those exposed in say the 1st week of April, could be tracked through testing,
positive cases, hospitalizations, ICU admissions, intubations and eventual either
recovery or death. That process and statistics, which can take weeks or even
months, can be used to estimate later cohorts via standard actuarial triangle
procedures. Scenario testing, such as shelter policy, can then be tested.
Source: compiled by ISO using data from The COVID Tracking Project (https://covidtracking.com/api

© 2020 Insurance Services Office, Inc. All rights reserved. 80
Covid Actuarial Analysis
Expected Covid – Emergence Lag Analogy
“Imagine taking a shower when
there's a long delay time
between turning a knob and the
water temperature changing.
Getting to the right water
temperature will be difficult,
because it's hard to control
something when there's a long
delay in the feedback signal.
One of the problems with
reopening under COVID-19 is
that, due to the long period of
incubation and asymptomatic
spread, we only see the impact
of our behavior a couple of
weeks later. If we just reopen
blindly because things seem OK
right now, the problem will
repeat: invisible community
spread followed by the hospital
system could be overwhelmed
again in a few weeks.”
Source: article Physician Insurer – 4th quarter 2011 (J. Buchanan, FCAS); quote Mt. Sinai researcher (D. Sachs, Assistant Professor, Genetics and Genomic Sciences)

© 2020 Insurance Services Office, Inc. All rights reserved. 81
Covid Actuarial Analysis (article under construction)
Information Emergence Lag and Wrong Signaling – Going Viral

© 2020 Insurance Services Office, Inc. All rights reserved. 82
Getting Personal – Grandfathers, Insurance, and Distracted Driving
Distracted Driving sessions now available by Zoom.For teens, kids, and seniors alike. https://youtu.be/zlPVOsfE0eQ

© 2020 Insurance Services Office, Inc. All rights reserved. 83
John W. Buchanan, FCAS, MAAAVerisk / ISO
John Buchanan, FCAS, MAAA, is a principal in charge of ISO's Excess and Reinsurance Division. He has over 30 years of experience
as a front-line pricing actuary and consultant in the US, London, and other international reinsurance marketplaces.
In John's career, he has conceptualized, developed and implemented extensive benchmarking and modeling services for various
reinsurers, excess carriers, and industry groups. He has pioneered extensive work to extend information gathered in mature
benchmarking markets, and applying the information to International markets making use of local and customized knowledge. He was
a frontline sign-off actuary for many domestic and international lines of business. While a consultant, he was the main contact for the
Reinsurance Association of America and the Reinsurance Research Council of Canada as well as working extensively with the London
and European reinsurance market through the Casualty Actuaries in Reinsurance in London. He also formed and chaired the multi-
discipline joint IFoA-CAS International Pricing Research Working Party. The resulting paper, “Analyzing the Disconnect Between the
Reinsurance Submission and Global Underwriter's Needs ‐ Property Per Risk”, won the prestigious 2016 IFoA UK Brian Hey and the
2019 CAS US Hachemeister awards.
John's professional accomplishments also include being heavily involved with many international meteorological groups including
NOAA, UK-Met, GLOBE, ACRE, and was chairperson of the CAS Climate Change Student Outreach subcommittee. He is on the
CARe committee responsible for many of the annual CARe conference educational tracks, and previously at the CAS Ratemaking
Seminar. He has been a moderator and panelist at dozens of industry seminars on the topic of domestic and international reinsurance
pricing, the underwriting cycle, international benchmarking, etc.
Prior to joining Verisk, John was a Senior Vice President at Platinum Underwriters (previously St. Paul Reinsurance), a Principal at
Tillinghast (now Towers Watson), and a Senior Consultant at KPMG, Peat Marwick. He has also competed and won many medals and
trophies as an amateur in the Global Salsa Championships, and is determined to write the book "The Mathematician's Guide to Salsa
Dancing". He has also written and directed a few sponsored films entitled “Franklin Climate Change” and “Cuba People to People”
with the latter selected to run at various film festivals and described in September 2018 CAS actuarial review article.
83

Terry A Knull, FCAS, MAAA, CPCUSwiss Re Atrium Corporation
Terry Knull, FCAS, MAAA, CPCU is a Team leader in the Actuarial
and Underwriting department for Swiss Re North America.
▪ Terry currently leads a team of 5 underwriters and actuaries
covering mostly regional casualty business
▪ 30 years of experience in the insurance industry with the last 20
years in reinsurance with Swiss Re. Prior to that I worked in the
primary insurance arena doing both pricing and reserving work
▪ My focus the last several years has been on automobile
business, both commercial and personal (including non-
standard auto)
84

© 2020 Insurance Services Office, Inc. All rights reserved. 85© 2017 Verisk Analytics, Inc. All rights reserved. 85© 2019 Insurance Services Office, Inc. All rights reserved. 85
No part of this presentation may be copied or redistributed without the prior written consent of Insurance Services Office, Inc. This material was used
exclusively as an exhibit to an oral presentation. It may not be, nor should it be relied upon as reflecting, a complete record of the discussion.
© Insurance Services Office, Inc., 2020
http://www.verisk.com/iso/excess-reinsurance


![Levels of Determinism in Workers’ Compensation Reinsurance Commutations [PCAS 1999] Gary Blumsohn Arch Reinsurance Company gblumsohn@archreco.com CARe](https://img.pdfslide.us/doc/110x75/56649dce5503460f94ac20e3/levels-of-determinism-in-workers-compensation-reinsurance-commutations-pcas.jpg)