Embed Size (px)
Citation preview
CARDINIA SHIRE COUNCILANNUAL FINANCIAL REPORT
For the Year Ended 30 June 2015
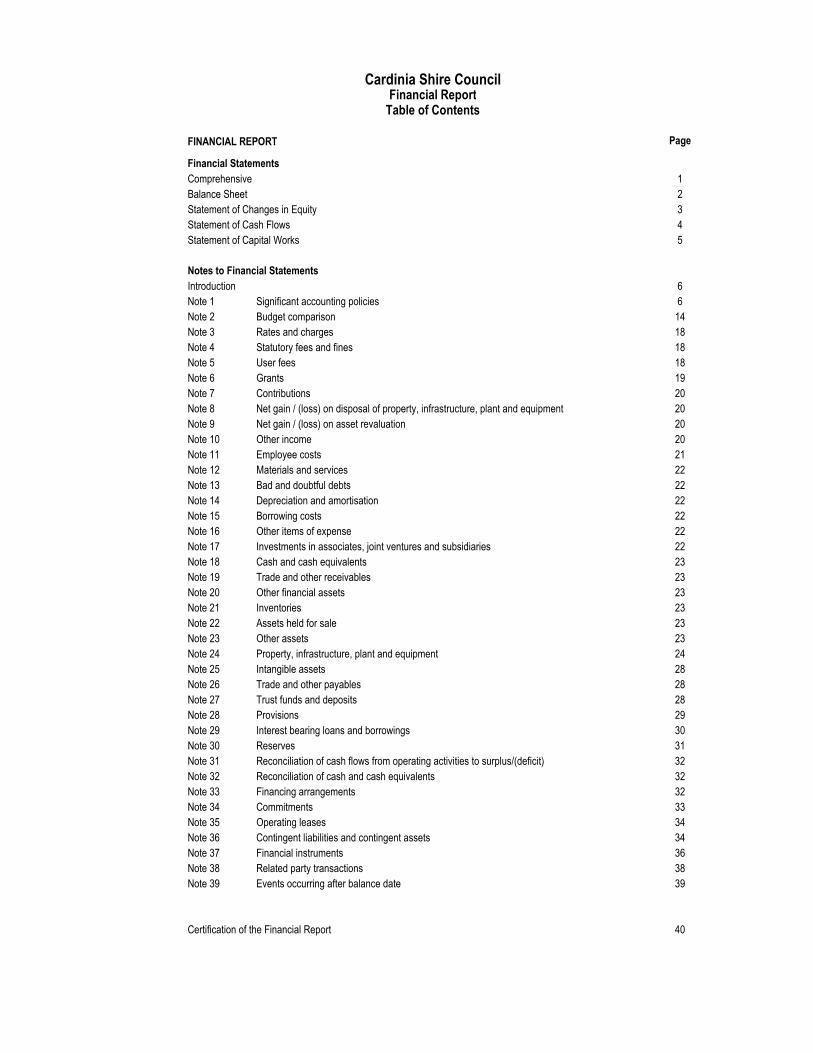
Page
Comprehensive 1
2
3
4
5
6
Note 1 Significant accounting policies 6
Note 2 Budget comparison 14
Note 3 Rates and charges 18
Note 4 Statutory fees and fines 18
Note 5 User fees 18
Note 6 Grants 19
Note 7 Contributions 20
Note 8 Net gain / (loss) on disposal of property, infrastructure, plant and equipment 20
Note 9 Net gain / (loss) on asset revaluation 20
Note 10 Other income 20
Note 11 Employee costs 21
Note 12 Materials and services 22
Note 13 Bad and doubtful debts 22
Note 14 Depreciation and amortisation 22
Note 15 Borrowing costs 22
Note 16 Other items of expense 22
Note 17 Investments in associates, joint ventures and subsidiaries 22
Note 18 Cash and cash equivalents 23
Note 19 Trade and other receivables 23
Note 20 Other financial assets 23
Note 21 Inventories 23
Note 22 Assets held for sale 23
Note 23 Other assets 23
Note 24 Property, infrastructure, plant and equipment 24
Note 25 Intangible assets 28
Note 26 Trade and other payables 28
Note 27 Trust funds and deposits 28
Note 28 Provisions 29
Note 29 Interest bearing loans and borrowings 30
Note 30 Reserves 31
Note 31 Reconciliation of cash flows from operating activities to surplus/(deficit) 32
Note 32 Reconciliation of cash and cash equivalents 32
Note 33 Financing arrangements 32
Note 34 Commitments 33
Note 35 Operating leases 34
Note 36 Contingent liabilities and contingent assets 34
Note 37 Financial instruments 36
Note 38 Related party transactions 38
Note 39 Events occurring after balance date 39
40
Statement of Changes in Equity
Statement of Cash Flows
Certification of the Financial Report
Notes to Financial Statements
Introduction
Statement of Capital Works
Balance Sheet
Cardinia Shire Council
FINANCIAL REPORT
Financial Statements
Table of ContentsFinancial Report
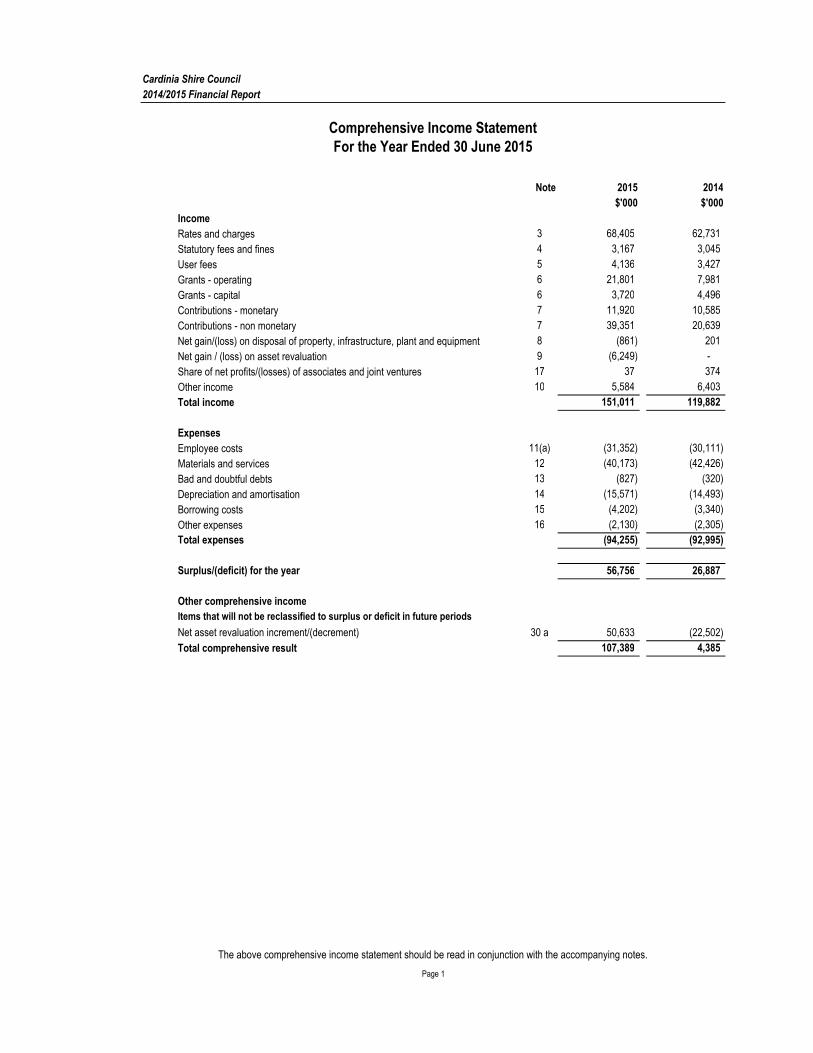
Cardinia Shire Council
2014/2015 Financial Report
Note 2015 2014
$'000 $'000
Income
Rates and charges 3 68,405 62,731
Statutory fees and fines 4 3,167 3,045
User fees 5 4,136 3,427
Grants - operating 6 21,801 7,981
Grants - capital 6 3,720 4,496
Contributions - monetary 7 11,920 10,585
Contributions - non monetary 7 39,351 20,639
Net gain/(loss) on disposal of property, infrastructure, plant and equipment 8 (861) 201
Net gain / (loss) on asset revaluation 9 (6,249) -
Share of net profits/(losses) of associates and joint ventures 17 37 374
Other income 10 5,584 6,403
Total income 151,011 119,882
Expenses
Employee costs 11(a) (31,352) (30,111)
Materials and services 12 (40,173) (42,426)
Bad and doubtful debts 13 (827) (320)
Depreciation and amortisation 14 (15,571) (14,493)
Borrowing costs 15 (4,202) (3,340)
Other expenses 16 (2,130) (2,305)
Total expenses (94,255) (92,995)
Surplus/(deficit) for the year 56,756 26,887
Other comprehensive income
Items that will not be reclassified to surplus or deficit in future periods
Net asset revaluation increment/(decrement) 30 a 50,633 (22,502)
Total comprehensive result 107,389 4,385
For the Year Ended 30 June 2015Comprehensive Income Statement
Page 1
The above comprehensive income statement should be read in conjunction with the accompanying notes.

Cardinia Shire Council
2014/2015 Financial Report
Note 2015 2014
$'000 $'000
Assets
Current assets
Cash and cash equivalents 18 16,644 5,441
Trade and other receivables 19 16,763 21,648
Other financial assets 20 19,767 19,088
Inventories 21 16 26
Non-current assets classified as held for sale - Land 22 8,726 11,029
Other assets 23 560 705
Total current assets 62,476 57,937
Non-current assets
Trade and other receivables 19 761 -
Investments in associates 17 1,432 1,395
Property, infrastructure, plant and equipment 24 904,743 780,377
Intangible assets 25 382 190
Total non-current assets 907,318 781,962
Total assets 969,794 839,899
Liabilities
Current liabilities
Trade and other payables 26 14,182 11,961
Trust funds and deposits 27 5,405 3,271
Provisions 28 5,624 4,704
Interest-bearing loans and borrowings 29 6,296 9,427
Total current liabilities 31,507 29,363
Non-current liabilities
Provisions 28 1,593 2,531
Interest-bearing loans and borrowings 29 55,742 36,068
Total non-current liabilities 57,335 38,599
Total liabilities 88,842 67,962
Net assets 880,952 771,937
Equity
Accumulated surplus 566,351 507,767
Reserves 30 314,601 264,170
Total Equity 880,952 771,937
As at 30 June 2015Balance Sheet
Page 2
The above balance sheet should be read in conjunction with the accompanying notes.
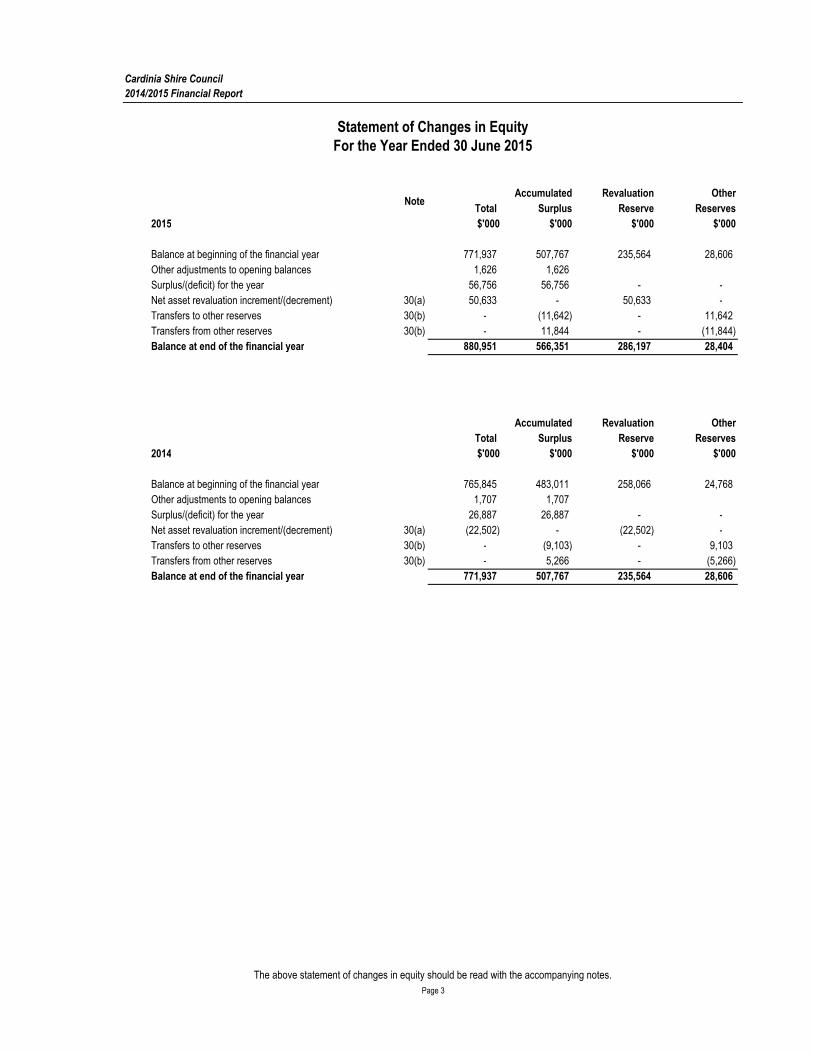
Cardinia Shire Council
Accumulated Revaluation Other
Total Surplus Reserve Reserves
2015 $'000 $'000 $'000 $'000
Balance at beginning of the financial year 771,937 507,767 235,564 28,606
Other adjustments to opening balances 1,626 1,626
Surplus/(deficit) for the year 56,756 56,756 - -
Net asset revaluation increment/(decrement) 30(a) 50,633 - 50,633 -
Transfers to other reserves 30(b) - (11,642) - 11,642
Transfers from other reserves 30(b) - 11,844 - (11,844)
Balance at end of the financial year 880,951 566,351 286,197 28,404
Accumulated Revaluation Other
Total Surplus Reserve Reserves
2014 $'000 $'000 $'000 $'000
Balance at beginning of the financial year 765,845 483,011 258,066 24,768
Other adjustments to opening balances 1,707 1,707
Surplus/(deficit) for the year 26,887 26,887 - -
Net asset revaluation increment/(decrement) 30(a) (22,502) - (22,502) -
Transfers to other reserves 30(b) - (9,103) - 9,103
Transfers from other reserves 30(b) - 5,266 - (5,266)
Balance at end of the financial year 771,937 507,767 235,564 28,606
2014/2015 Financial Report
Statement of Changes in Equity
Page 3
Note
For the Year Ended 30 June 2015
The above statement of changes in equity should be read with the accompanying notes.
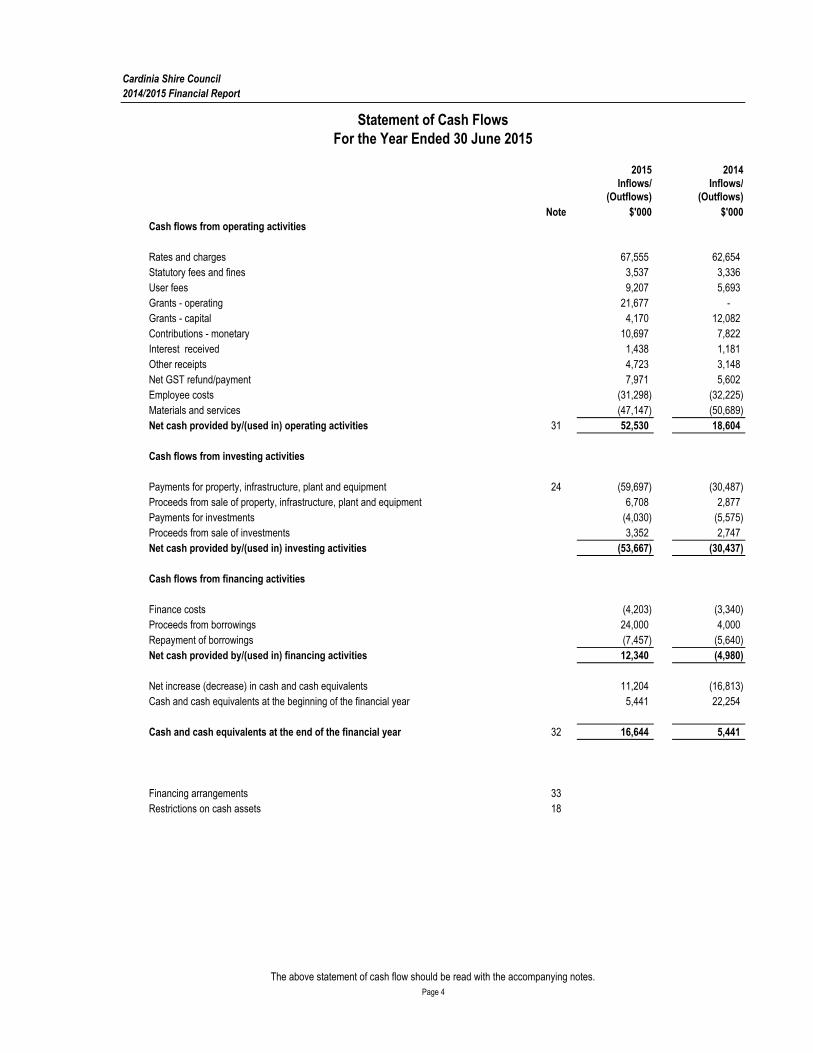
Cardinia Shire Council
2015 2014Inflows/ Inflows/
(Outflows) (Outflows)
Note $'000 $'000
Cash flows from operating activities
Rates and charges 67,555 62,654
Statutory fees and fines 3,537 3,336
User fees 9,207 5,693
Grants - operating 21,677 -
Grants - capital 4,170 12,082
Contributions - monetary 10,697 7,822
Interest received 1,438 1,181
Other receipts 4,723 3,148
Net GST refund/payment 7,971 5,602
Employee costs (31,298) (32,225)
Materials and services (47,147) (50,689)
Net cash provided by/(used in) operating activities 31 52,530 18,604
Cash flows from investing activities
Payments for property, infrastructure, plant and equipment 24 (59,697) (30,487)
Proceeds from sale of property, infrastructure, plant and equipment 6,708 2,877
Payments for investments (4,030) (5,575)
Proceeds from sale of investments 3,352 2,747
Net cash provided by/(used in) investing activities (53,667) (30,437)
Cash flows from financing activities
Finance costs (4,203) (3,340)
Proceeds from borrowings 24,000 4,000
Repayment of borrowings (7,457) (5,640)
Net cash provided by/(used in) financing activities 12,340 (4,980)
Net increase (decrease) in cash and cash equivalents 11,204 (16,813)
Cash and cash equivalents at the beginning of the financial year 5,441 22,254
Cash and cash equivalents at the end of the financial year 32 16,644 5,441
Financing arrangements 33
Restrictions on cash assets 18
2014/2015 Financial Report
Statement of Cash FlowsFor the Year Ended 30 June 2015
Page 4
The above statement of cash flow should be read with the accompanying notes.

Cardinia Shire Council
Note 2015 2014
$'000 $'000
Property
Land 6,205 3,269
Total land 6,205 3,269
Buildings 15,414 11,719
Building improvements 15,049
Total buildings 30,463 11,719
Total property 36,668 14,988
Plant and equipment
Plant, machinery and equipment 1,892 1,584
Fixtures, fittings and furniture 1,111 90
Computers and telecommunications 1,013 244
Total plant and equipment 4,016 1,918
Infrastructure
Roads 5,642 3,813
Bridges 193 406
Footpaths and cycleways 2,452 1,525
Drainage 1,318 1,480
Recreational, leisure and community facilities 4,105 2,564
Parks, open space and streetscapes 737 121
Off street car parks 452 632
Total infrastructure 14,899 10,542
Total capital works expenditure 55,583 27,448
Represented by:
New asset expenditure 45,122 16,393
Asset renewal expenditure 6,987 6,759
Asset upgrade expenditure 3,059 4,110
Other 415 186
Total capital works expenditure 55,583 27,448
2014/2015 Financial Report
Statement of Capital WorksFor the Year Ended 30 June 2015
Page 5
The above statement of capital works should be read with the accompanying notes.
Cardinia Shire Council
2014/2015 Financial Report
Introduction
The Cardinia Shire Council was established by an Order of the Governor in Council on 15 December
1994 and is a body corporate. The Council's main office is located at 20 Siding Avenue, Officer.
Statement of compliance
These financial statements are a general purpose financial report that consists of a Comprehensive
Income Statement, Balance Sheet, Statement of Changes in Equity, Statement of Cash Flows, Statement
of Capital Works and notes accompanying these financial statements. The general purpose financial
report complies with Australian Accounting Standards, other authoritative pronouncements of the
Australian Accounting Standards Board, the Local Government Act 1989 , and the Local Government
(Planning and Reporting) Regulations 2014 .
Note 1 Significant accounting policies
(a) Basis of accounting
The accrual basis of accounting has been used in the preparation of these financial statements, whereby
assets liabilities, equity, income and expenses are recognised in the reporting period to which they relate,
regardless of when cash is received or paid
Judgements, estimates and assumptions are required to be made about the carrying values of assets and
liabilities that are not readily apparent from other sources. The estimates and associated judgements are
based on professional judgement derived from historical experience and various other factors that are
believed to be reasonable under the circumstances. Actual results may differ from these estimates.
Revisions to accounting estimates are recognised in the period in which the estimate is revised and also
in future periods that are affected by the revision. Judgements and assumptions made by management in
the application of AAS's that have significant effects on the financial statements and estimates relate to:
- the fair value of land, buildings, infrastructure, plant and equipment (refer to note 1 (m) )
- the determination of depreciation for buildings, infrastructure, plant and equipment (refer to note 1 (n) )
- the determination of employee provisions (refer to note 1 (t) )
Unless otherwise stated, all accounting policies are consistent with those applied in the prior year. Where
appropriate, comparative figures have been amended to accord with current presentation, and disclosure
has been made of any material changes to comparatives.
Notes to the Financial ReportFor the Year Ended 30 June 2015
Page 6
Cardinia Shire Council
2014/2015 Financial Report
Note 1 Significant accounting policies (cont.)
(b) Changes in accounting policies
There have been no changes in accounting policies from the previous period.
(c) Committees of management
All entities controlled by Council that have material revenues, expenses, assets or liabilities, such as
committees of management, have been included in this financial report. Any transactions between these
entities and Council have been eliminated in full
(d) Accounting for investments in associates and joint arrangements
Associates
Associates are all entities over which Council has significant influence but not control or joint control.
Investments in associates are accounted for using the equity method of accounting, after initially being
recognised at cost.
(e) Revenue recognition
Income is recognised when the Council obtains control of the contribution or the right to receive the
contribution, it is probable that the economic benefits comprising the contribution will flow to the Council
and the amount of the contribution can be measured reliably.
Rates and Charges
Supplementary rates are recognised when a valuation and reassessment is completed and a
supplementary rates notice issued.
Statutory fees and fines
Statutory fees and fines (including parking fees and fines) are recognised as revenue when the service
has been provided, the payment is received, or when the penalty has been applied, whichever first
occurs.
User fees
User fees are recognised as revenue when the service has been provided or the payment is received,
whichever first occurs.
Grants
Grant income is recognised when Council obtains control of the contribution. This is normally obtained
upon their receipt (or acquittal) or upon earlier notification that a grant has been secured, and are valued
at their fair value at the date of transfer.
Where grants or contributions recognised as revenues during the financial year were obtained on
condition that they be expended in a particular manner or used over a particular period and those
conditions were undischarged at balance date, the unused grant or contribution is disclosed in note 6.
The note also discloses the amount of unused grant or contribution from prior years that was expended on
Council’s operations during the current year.
Notes to the Financial ReportFor the Year Ended 30 June 2015
Page 7
Cardinia Shire Council
2014/2015 Financial Report
Note 1 Significant accounting policies (cont.)
(e) Revenue recognition (Cont.)
Contributions
Monetary and non monetary contributions are recognised as revenue when Council obtains control over
the contributed asset.
Sale of property, infrastructure, plant and equipment
The profit or loss on sale of an asset is determined when control of the asset has irrevocably passed to
the buyer.
Interest
Interest is recognised as it is earned.
Rental
Rents are recognised as revenue when the payment is due or the payment is received, whichever first
occurs. Rental payments received in advance are recognised as a prepayment until they are due.
Other Income
Other income is measured at the fair value of the consideration received or receivable and is recognised
when Council gains control over the right to receive the income.
(f) Fair value measurement
Council measures certain assets and liabilities at fair value where required or permitted by Australian
Accounting Standards. AASB 13 Fair value measurement, aims to improve consistency and reduce
complexity by providing a definition of fair value and a single source of fair value measurement and
disclosure requirements for use across Australian Accounting Standards.
AASB 13 defines fair value as the price that would be received to sell an asset or paid to transfer a liability
in an orderly transaction between market participants at the measurement date. Fair value under AASB
13 is an exit price regardless of whether that price is directly observable or estimated using another
valuation technique.
All assets and liabilities for which fair value is measured or disclosed in the financial statements are
categorised within a fair value hierarchy, described as follows, based on the lowest level input that is
significant to the fair value measurement as a whole:
Level 1 — Quoted (unadjusted) market prices in active markets for identical assets or liabilities
Level 2 — Valuation techniques for which the lowest level input that is significant to the fair value
measurement is directly or indirectly observable; and
Level 3 — Valuation techniques for which the lowest level input that is significant to the fair value
measurement is unobservable.
For the purpose of fair value disclosures, Council has determined classes of assets and liabilities on the
basis of the nature, characteristics and risks of the asset or liability and the level of the fair value hierarchy
as explained above.
In addition, Council determines whether transfers have occurred between levels in the hierarchy by re-
assessing categorisation (based on the lowest level input that is significant to the fair value measurement
as a whole) at the end of each reporting period.
(g) Cash and cash equivalents
Cash and cash equivalents include cash on hand, deposits at call, and other highly liquid investments with
original maturities of 90 days or less, net of outstanding bank overdrafts.
Notes to the Financial ReportFor the Year Ended 30 June 2015
Page 8

Cardinia Shire Council
2014/2015 Financial Report
Note 1 Significant accounting policies (cont.)
(h) Trade and other receivables
Receivables are carried at amortised cost using the effective interest rate method. A provision for
doubtful debts is recognised when there is objective evidence that an impairment has occurred.
(i) Other financial assets
Other financial assets are valued at fair value, being market value, at balance date. Term deposits are
measured at amortised cost. Any unrealised gains and losses on holdings at balance date are recognised
as either a revenue or expense.
(j) Inventories
Inventories held for distribution are measured at cost adjusted when applicable for any loss of service
potential. Inventories are measured at the lower of cost and net realisable value.
All other inventories, including land held for sale, are measured at the lower of cost and net realisable
value. Where Inventories are acquired for no cost or nominal consideration, they are measured at current
replacement cost at the date of acquisition.
(k) Non-current assets classified as held for sale
A non-current asset classified as held for sale (including disposal groups) is measured at the lower of its
carrying amount and fair value less costs to sell, and are not subject to depreciation. Non-current assets,
disposal groups and related liabilities and assets are treated as current and classified as held for sale if
their carrying amount will be recovered through a sale transaction rather than through continuing use. This
condition is regarded as met only when the sale is highly probable and the asset's sale (or disposal group
sale) is expected to be completed within 12 months from the date of classification.
(l) Recognition and measurement of property, plant and equipment, infrastructure, intangibles
Acquisition
The purchase method of accounting is used for all acquisitions of assets, being the fair value of assets
provided as consideration at the date of acquisition plus any incidental costs attributable to the
acquisition. Fair value is the amount for which the asset could be exchanged between knowledgeable
willing parties in an arm's length transaction.
Where assets are constructed by Council, cost includes all materials used in construction, direct labour,
borrowing costs incurred during construction, and an appropriate share of directly attributable variable and
fixed overheads.
In accordance with Council's policy, the threshold limits detailed in Note 1 n have applied when
recognising assets within an applicable asset class and unless otherwise stated are consistent with the
prior year.
Revaluation
Subsequent to the initial recognition of assets, non-current physical assets, other than plant and
equipment, are measured at their fair value, being the price that would be received to sell an asset or paid
to transfer a liability in an orderly transaction between market participants at the measurement date. At
balance date, the Council reviewed the carrying value of the individual classes of assets measured at fair
value to ensure that each asset materially approximated its fair value. Where the carrying value
materially differed from the fair value at balance date, the class of asset was revalued.
Fair value valuations are determined in accordance with a valuation hierarchy. Changes to the valuation
hierarchy will only occur if an external change in the restrictions or limitations of use on an asset result in
changes to the permissible or practical highest and best use of the asset. Further details regarding the
fair value hierarchy are disclosed at Note 24, Property, infrastructure, plant and equipment, and
infrastructure.
In addition, Council undertakes a formal revaluation of land, buildings, and infrastructure assets on a
regular basis ranging from 1 to 4 years. The valuation is performed either by experienced council officers
or independent experts.
Where the assets are revalued, the revaluation increments are credited directly to the asset revaluation
reserve except to the extent that an increment reverses a prior year decrement for that class of asset that
had been recognised as an expense in which case the increment is recognised as revenue up to the
amount of the expense. Revaluation decrements are recognised as an expense except where prior
increments are included in the asset revaluation reserve for that class of asset in which case the
decrement is taken to the reserve to the extent of the remaining increments. Within the same class of
assets, revaluation increments and decrements within the year are offset.
Notes to the Financial ReportFor the Year Ended 30 June 2015
Page 9

Cardinia Shire Council
2014/2015 Financial Report
Note 1 Significant accounting policies (cont.)
(l) Recognition and measurement of property, plant and equipment, infrastructure, intangibles (cont'd)
Land under roads
Land under roads acquired after 30 June 2008 is brought to account using the cost basis. Council does
not recognise land under roads that it controlled prior to that period in its financial report.
(m) Depreciation and amortisation of property, infrastructure, plant and equipment and intangibles
Buildings, land improvements, plant and equipment, infrastructure, and other assets having limited useful
lives are systematically depreciated over their useful lives to the Council in a manner which reflects
consumption of the service potential embodied in those assets. Estimates of remaining useful lives and
residual values are made on a regular basis with major asset classes reassessed annually. Depreciation
rates and methods are reviewed annually.
Where assets have separate identifiable components that are subject to regular replacement, these
components are assigned distinct useful lives and residual values and a separate depreciation rate is
determined for each component.
Road earthworks are not depreciated on the basis that they are assessed as not having a limited useful
life.
Straight line depreciation is charged based on the residual useful life as determined each year.
Depreciation periods used are listed below and are consistent with the prior year unless otherwise stated.
Asset recognition thresholds and depreciation periods Depreciation
Period
Threshold
Limit
years $'000
Property
land - 10
land improvements - 10
Buildings
heritage buildings 10 - 200 5
buildings 10 - 200 5
building improvements 10 - 200 5
Plant and Equipment
plant, machinery and equipment 5 - 15 5
fixtures, fittings and furniture 8 - 15 5
computers and telecommunications 3 - 15 5
Infrastructure
road pavements and seals 10 - 70 10
road substructure 10 - 70 10
road formation and earthworks 0 10
road kerb, channel and minor culverts 10 - 70 10
bridges deck 20 - 100 10
bridges substructure 20 - 100 10
footpaths and cycleways 10 - 50 10
drainage 100 10
recreational, leisure and community facilities 10 - 100 5
parks, open space and streetscapes 10 - 100 5
off street car parks 10 - 70 10
Intangible assets
intangible assets 5 5
(n) Repairs and maintenance
Routine maintenance, repair costs, and minor renewal costs are expensed as incurred. Where the repair
relates to the replacement of a component of an asset and the cost exceeds the capitalisation threshold
the cost is capitalised and depreciated. The carrying value of the replaced asset is expensed.
Notes to the Financial ReportFor the Year Ended 30 June 2015
Page 10
Cardinia Shire Council
2014/2015 Financial Report
Note 1 Significant accounting policies (cont.)
(o) Investment property
Investment property, comprising freehold office complexes, is held to generate long-term rental yields.
Investment property is measured initially at cost, including transaction costs. Costs incurred subsequent
to initial acquisition are capitalised when it is probable that future economic benefit in excess of the
originally assessed performance of the asset will flow to the Council. Subsequent to initial recognition at
cost, investment property is carried at fair value, determined annually by independent valuers. Changes to
fair value are recorded in the comprehensive income statement in the period that they arise. Rental
income from the leasing of investment properties is recognised in the comprehensive income statement
on a straight line basis over the lease term.
(p) Impairment of assets
At each reporting date, the Council reviews the carrying value of its assets to determine whether there is
any indication that these assets have been impaired. If such an indication exists, the recoverable amount
of the asset, being the higher of the asset's fair value less costs to sell and value in use, is compared to
the assets carrying value. Any excess of the assets carrying value over its recoverable amount is
expensed to the comprehensive income statement, unless the asset is carried at the revalued amount in
which case, the impairment loss is recognised directly against the revaluation surplus in respect of the
same class of asset to the extent that the impairment loss does not exceed the amount in the revaluation
surplus for that same class of asset.
(q) Trust funds and deposits
Amounts received as deposits and retention amounts controlled by Council are recognised as trust funds
until they are returned, transferred in accordance with the purpose of the receipt, or forfeited (refer to Note
27).
(r) Borrowings
Borrowings are initially measured at fair value, being the cost of the interest bearing liabilities, net of
transaction costs. The measurement basis subsequent to initial recognition depends on whether the
Council has categorised its interest-bearing liabilities as either financial liabilities designated at fair value
through the profit and loss, or financial liabilities at amortised cost. Any difference between the initial
recognised amount and the redemption value is recognised in net result over the period of the borrowing
using the effective interest method.
The classification depends on the nature and purpose of the interest bearing liabilities. The Council
determines the classification of its interest bearing liabilities at initial recognition.
Borrowing costs
Borrowing costs are recognised as an expense in the period in which they are incurred, except where they
are capitalised as part of a qualifying asset constructed by Council. Except where specific borrowings are
obtained for the purpose of specific asset acquisition, the weighted average interest rate applicable to
borrowings at balance date, excluding borrowings associated with superannuation, is used to determine
the borrowing costs to be capitalised.
Borrowing costs include interest on bank overdrafts, interest on borrowings, and finance lease charges.
(s) Employee costs and benefits
The calculation of employee costs and benefits includes all relevant on-costs and are calculated as
follows at reporting date
Wages and salaries and annual leave
Liabilities for wages and salaries, including non-monetary benefits, annual leave and accumulated sick
leave expected to be wholly settled within 12 months of the reporting date are recognised in the provision
for employee benefits in respect of employee services up to the reporting date, classified as current
liabilities and measured at their nominal values.
Liabilities that are not expected to be wholly settled within 12 months of the reporting date are recognised
in the provision for employee benefits as current liabilities, measured at present value of the amounts
expected to be paid when the liabilities are settled using the remuneration rate expected to apply at the
time of settlement.
Page 11
Notes to the Financial ReportFor the Year Ended 30 June 2015

Cardinia Shire Council
2014/2015 Financial Report
Note 1 Significant accounting policies (cont.)
(s) Employee costs and benefits (cont.)
Long service leave
Liability for long service leave (LSL) is recognised in the provision for employee benefits.
Current Liability - unconditional LSL is disclosed as a current liability even when the council does not
expect to settle the liability within 12 months because it will not have the unconditional right to defer
settlement of the entitlement should an employee take leave within 12 months
The components of this current liability are measured at :
- present value - component that is not expected to be wholly settled within 12 months.
- nominal value - component that is expected to be wholly settled within 12 months.
Classification of employee costs
Non-current liability - conditional LSL that has been accrued, where an employee is yet to reach a
qualifying term of employment, is disclosed as a non - current liability. There is an unconditional right to
defer settlement of the entitlement until the employee has completed the requisite years of service.This non-current LSL liability is measured at present value.
(t) Leases
Finance leases
Leases of assets where substantially all the risks and rewards incidental to ownership of the asset, are
transferred to the Council are classified as finance leases. Finance leases are capitalised, recording an
asset and a liability at the lower of the fair value of the asset and the present value of the minimum lease
payments, including any guaranteed residual value. Lease payments are allocated between the reduction
of the lease liability and the interest expense. Leased assets are depreciated on a straight line basis over
their estimated useful lives to the Council where it is likely that the Council will obtain ownership of the
asset or over the term of the lease, whichever is the shorter. Leased assets are currently being amortised
over the term of the lease.
Operating leases
Lease payments for operating leases are required by the accounting standard to be recognised on a
straight line basis, rather than expensed in the years in which they are incurred.
(u) Goods and Services Tax (GST)
Revenues, expenses and assets are recognised net of the amount of GST, except where the amount of
GST incurred is not recoverable from the Australian Tax Office. In these circumstances the GST is
recognised as part of the cost of acquisition of the asset or as part of an item of the expense. Receivables
and payables in the balance sheet are shown inclusive of GST.
Cash flows are presented in the Statement of Cash flows on a gross basis, except for the GST
component of investing and financing activities, which are disclosed as operating cash flows.
(v) Financial guarantees
Financial guarantee contracts are not recognised as a liability in the balance sheet unless the lender has
exercised their right to call on the guarantee or Council has other reasons to believe that it is probably that
the right will be exercised. Details of guarantees that Council has provided, that are not recognised in the
balance sheet are disclosed at Note 36 Contingent Liabilities and Contingent Assets.
Notes to the Financial ReportFor the Year Ended 30 June 2015
Page 12

Cardinia Shire Council
2014/2015 Financial Report
Note 1 Significant accounting policies (cont.)
(w)
Contingent liabilities are not recognised in the Balance Sheet, but are disclosed by way of a note and, if
quantifiable, are measured at nominal value. Contingent assets and liabilities are presented inclusive of
GST receivable or payable respectively.
Commitments are not recognised in the Balance Sheet. Commitments are disclosed at their nominal
value by way of note and presented inclusive of the GST payable.
(x) Pending accounting standards
Certain new AASB's have been issued that are not mandatory for the 30 June 2015 reporting period.
Council has assessed these pending standards and has identified that no material impact will flow from
the application of these standards in future reporting periods.
(y) Rounding
Unless otherwise stated, amounts in the financial report have been rounded to the nearest thousand
dollars. Figures in the financial statement may not equate due to rounding.
For the Year Ended 30 June 2015
Page 13
Notes to the Financial Report
Contingent assets and contingent liabilities and commitments
Cardinia Shire Council
2014/2015 Financial Report
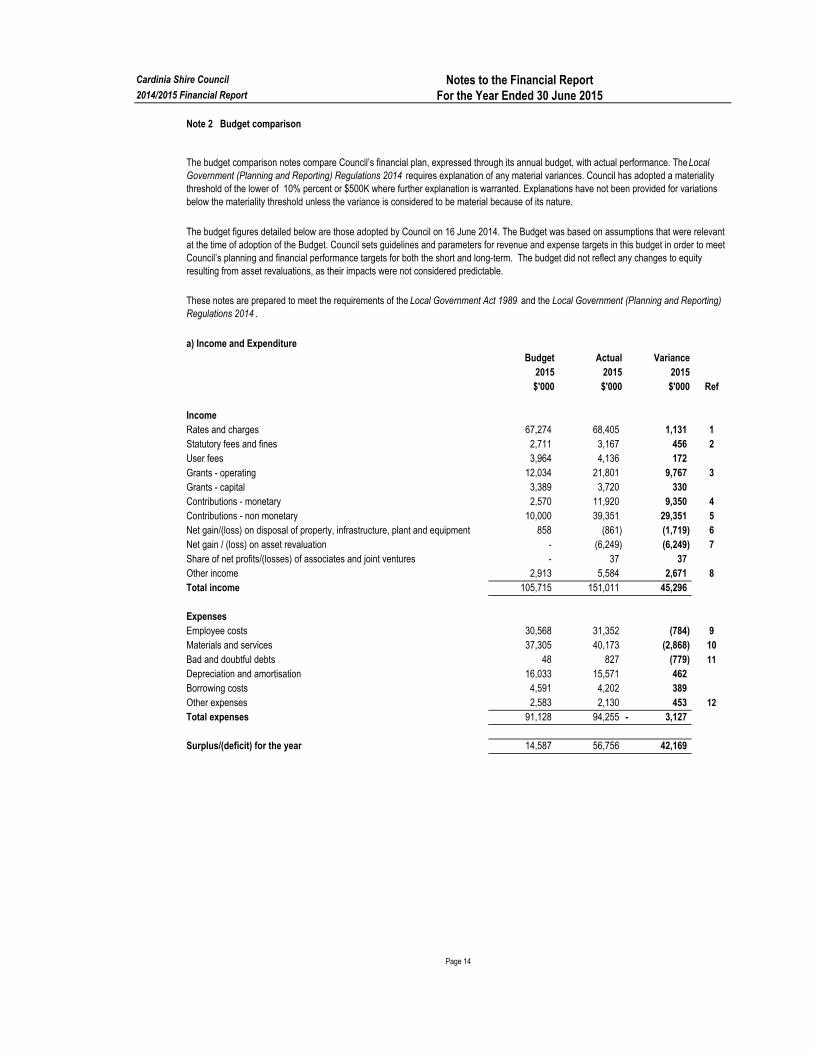
Note 2 Budget comparison
a) Income and Expenditure
Budget Actual Variance
2015 2015 2015
$'000 $'000 $'000 Ref
Income
Rates and charges 67,274 68,405 1,131 1
Statutory fees and fines 2,711 3,167 456 2
User fees 3,964 4,136 172
Grants - operating 12,034 21,801 9,767 3
Grants - capital 3,389 3,720 330
Contributions - monetary 2,570 11,920 9,350 4
Contributions - non monetary 10,000 39,351 29,351 5
Net gain/(loss) on disposal of property, infrastructure, plant and equipment 858 (861) (1,719) 6
Net gain / (loss) on asset revaluation - (6,249) (6,249) 7
Share of net profits/(losses) of associates and joint ventures - 37 37
Other income 2,913 5,584 2,671 8
Total income 105,715 151,011 45,296
Expenses
Employee costs 30,568 31,352 (784) 9
Materials and services 37,305 40,173 (2,868) 10
Bad and doubtful debts 48 827 (779) 11
Depreciation and amortisation 16,033 15,571 462
Borrowing costs 4,591 4,202 389
Other expenses 2,583 2,130 453 12
Total expenses 91,128 94,255 3,127-
Surplus/(deficit) for the year 14,587 56,756 42,169
The budget figures detailed below are those adopted by Council on 16 June 2014. The Budget was based on assumptions that were relevant
at the time of adoption of the Budget. Council sets guidelines and parameters for revenue and expense targets in this budget in order to meet
Council’s planning and financial performance targets for both the short and long-term. The budget did not reflect any changes to equity
resulting from asset revaluations, as their impacts were not considered predictable.
Page 14
Notes to the Financial ReportFor the Year Ended 30 June 2015
These notes are prepared to meet the requirements of the Local Government Act 1989 and the Local Government (Planning and Reporting)
Regulations 2014 .
The budget comparison notes compare Council’s financial plan, expressed through its annual budget, with actual performance. The Local
Government (Planning and Reporting) Regulations 2014 requires explanation of any material variances. Council has adopted a materiality
threshold of the lower of 10% percent or $500K where further explanation is warranted. Explanations have not been provided for variations
below the materiality threshold unless the variance is considered to be material because of its nature.
Cardinia Shire Council
2014/2015 Financial Report
Notes to the Financial ReportFor the Year Ended 30 June 2015
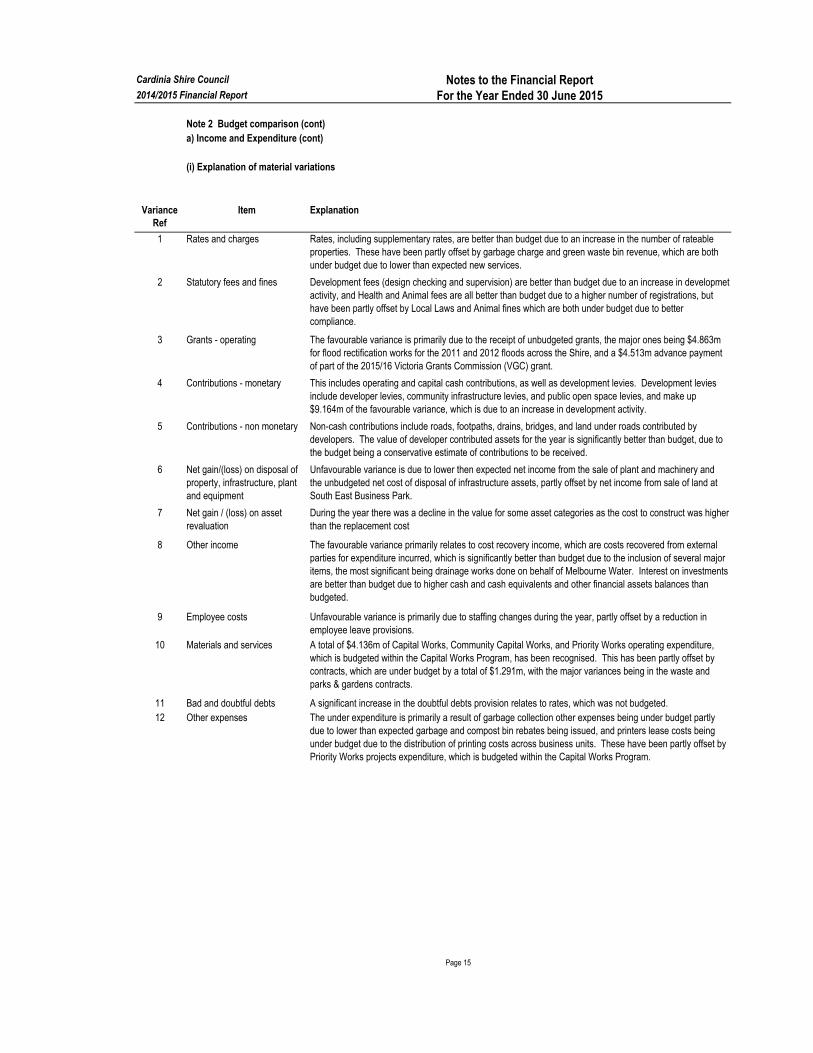
Note 2 Budget comparison (cont)
a) Income and Expenditure (cont)
(i) Explanation of material variations
Item Explanation
1 Rates and charges
2 Statutory fees and fines
3 Grants - operating
4 Contributions - monetary
5 Contributions - non monetary
6 Net gain/(loss) on disposal of
property, infrastructure, plant
and equipment
7 Net gain / (loss) on asset
revaluation
8 Other income
9 Employee costs
10 Materials and services
11 Bad and doubtful debts
12 Other expenses
Variance Ref
Development fees (design checking and supervision) are better than budget due to an increase in developmet
activity, and Health and Animal fees are all better than budget due to a higher number of registrations, but
have been partly offset by Local Laws and Animal fines which are both under budget due to better
compliance.
The favourable variance is primarily due to the receipt of unbudgeted grants, the major ones being $4.863m
for flood rectification works for the 2011 and 2012 floods across the Shire, and a $4.513m advance payment
of part of the 2015/16 Victoria Grants Commission (VGC) grant.
Rates, including supplementary rates, are better than budget due to an increase in the number of rateable
properties. These have been partly offset by garbage charge and green waste bin revenue, which are both
under budget due to lower than expected new services.
This includes operating and capital cash contributions, as well as development levies. Development levies
include developer levies, community infrastructure levies, and public open space levies, and make up
$9.164m of the favourable variance, which is due to an increase in development activity.
Unfavourable variance is due to lower then expected net income from the sale of plant and machinery and
the unbudgeted net cost of disposal of infrastructure assets, partly offset by net income from sale of land at
South East Business Park.
Page 15
Non-cash contributions include roads, footpaths, drains, bridges, and land under roads contributed by
developers. The value of developer contributed assets for the year is significantly better than budget, due to
the budget being a conservative estimate of contributions to be received.
The favourable variance primarily relates to cost recovery income, which are costs recovered from external
parties for expenditure incurred, which is significantly better than budget due to the inclusion of several major
items, the most significant being drainage works done on behalf of Melbourne Water. Interest on investments
are better than budget due to higher cash and cash equivalents and other financial assets balances than
budgeted.
A significant increase in the doubtful debts provision relates to rates, which was not budgeted.
The under expenditure is primarily a result of garbage collection other expenses being under budget partly
due to lower than expected garbage and compost bin rebates being issued, and printers lease costs being
under budget due to the distribution of printing costs across business units. These have been partly offset by
Priority Works projects expenditure, which is budgeted within the Capital Works Program.
During the year there was a decline in the value for some asset categories as the cost to construct was higher
than the replacement cost
A total of $4.136m of Capital Works, Community Capital Works, and Priority Works operating expenditure,
which is budgeted within the Capital Works Program, has been recognised. This has been partly offset by
contracts, which are under budget by a total of $1.291m, with the major variances being in the waste and
parks & gardens contracts.
Unfavourable variance is primarily due to staffing changes during the year, partly offset by a reduction in
employee leave provisions.
Cardinia Shire Council
2014/2015 Financial Report
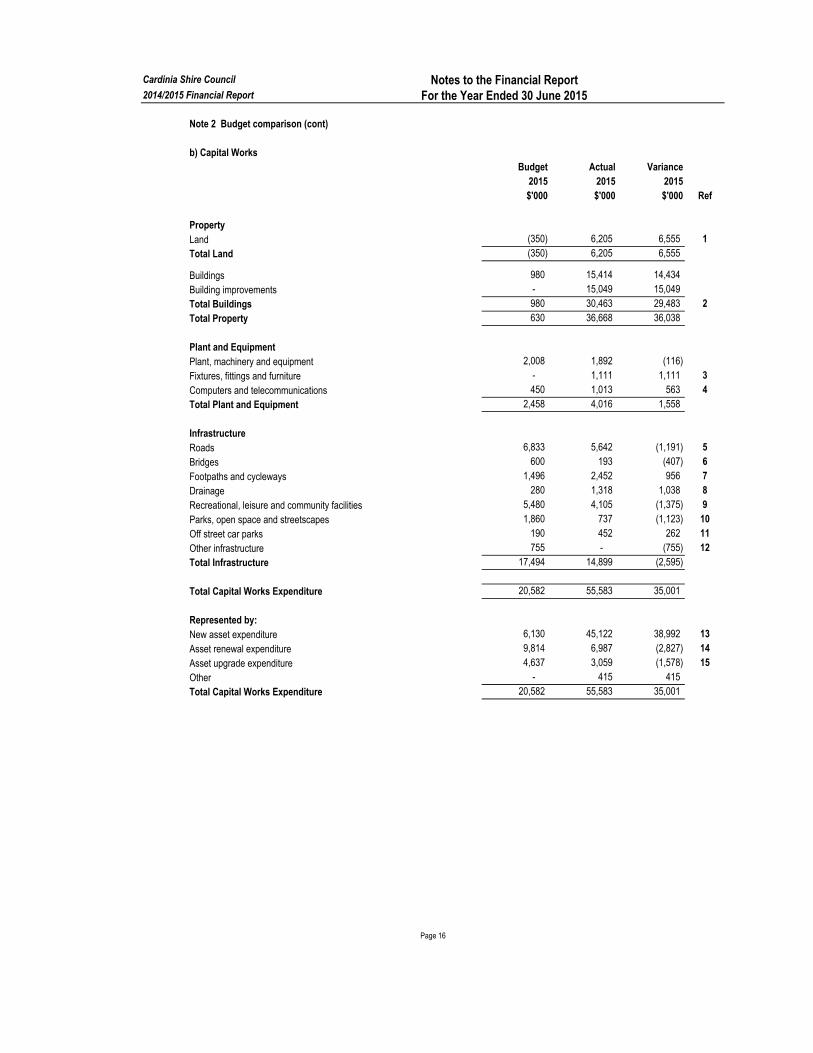
Note 2 Budget comparison (cont)
b) Capital Works
Budget Actual Variance
2015 2015 2015
$'000 $'000 $'000 Ref
Property
Land (350) 6,205 6,555 1
Total Land (350) 6,205 6,555
Buildings 980 15,414 14,434
Building improvements - 15,049 15,049
Total Buildings 980 30,463 29,483 2
Total Property 630 36,668 36,038
Plant and Equipment
Plant, machinery and equipment 2,008 1,892 (116)
Fixtures, fittings and furniture - 1,111 1,111 3
Computers and telecommunications 450 1,013 563 4
Total Plant and Equipment 2,458 4,016 1,558
Infrastructure
Roads 6,833 5,642 (1,191) 5
Bridges 600 193 (407) 6
Footpaths and cycleways 1,496 2,452 956 7
Drainage 280 1,318 1,038 8
Recreational, leisure and community facilities 5,480 4,105 (1,375) 9
Parks, open space and streetscapes 1,860 737 (1,123) 10
Off street car parks 190 452 262 11
Other infrastructure 755 - (755) 12
Total Infrastructure 17,494 14,899 (2,595)
Total Capital Works Expenditure 20,582 55,583 35,001
Represented by:
New asset expenditure 6,130 45,122 38,992 13
Asset renewal expenditure 9,814 6,987 (2,827) 14
Asset upgrade expenditure 4,637 3,059 (1,578) 15
Other - 415 415
Total Capital Works Expenditure 20,582 55,583 35,001
Notes to the Financial ReportFor the Year Ended 30 June 2015
Page 16
Cardinia Shire Council
2014/2015 Financial Report
Notes to the Financial ReportFor the Year Ended 30 June 2015
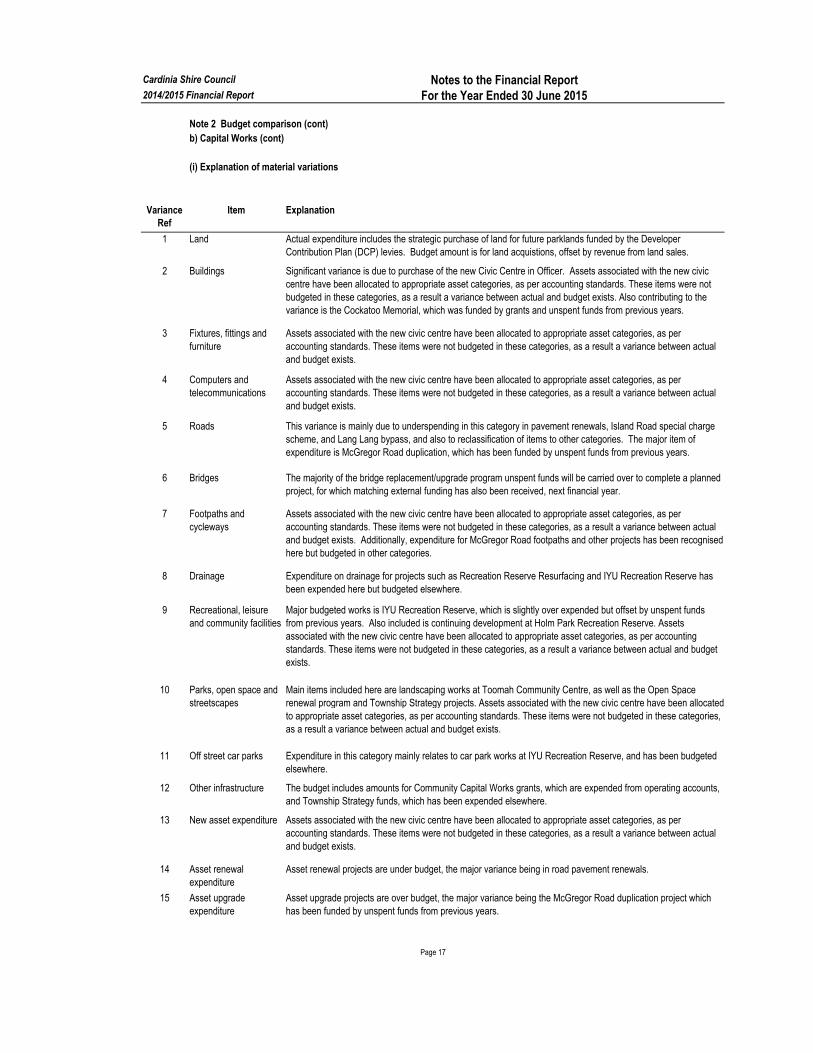
Note 2 Budget comparison (cont)
b) Capital Works (cont)
(i) Explanation of material variations
Item Explanation
1 Land
2 Buildings
3 Fixtures, fittings and
furniture
4 Computers and
telecommunications
5 Roads
6 Bridges
7 Footpaths and
cycleways
8 Drainage
9 Recreational, leisure
and community facilities
10 Parks, open space and
streetscapes
11 Off street car parks
12 Other infrastructure
13 New asset expenditure
14 Asset renewal
expenditure
15 Asset upgrade
expenditure
Page 17
Variance Ref
Actual expenditure includes the strategic purchase of land for future parklands funded by the Developer
Contribution Plan (DCP) levies. Budget amount is for land acquistions, offset by revenue from land sales.
Significant variance is due to purchase of the new Civic Centre in Officer. Assets associated with the new civic
centre have been allocated to appropriate asset categories, as per accounting standards. These items were not
budgeted in these categories, as a result a variance between actual and budget exists. Also contributing to the
variance is the Cockatoo Memorial, which was funded by grants and unspent funds from previous years.
Assets associated with the new civic centre have been allocated to appropriate asset categories, as per
accounting standards. These items were not budgeted in these categories, as a result a variance between actual
and budget exists.
Assets associated with the new civic centre have been allocated to appropriate asset categories, as per
accounting standards. These items were not budgeted in these categories, as a result a variance between actual
and budget exists.
This variance is mainly due to underspending in this category in pavement renewals, Island Road special charge
scheme, and Lang Lang bypass, and also to reclassification of items to other categories. The major item of
expenditure is McGregor Road duplication, which has been funded by unspent funds from previous years.
The majority of the bridge replacement/upgrade program unspent funds will be carried over to complete a planned
project, for which matching external funding has also been received, next financial year.
Assets associated with the new civic centre have been allocated to appropriate asset categories, as per
accounting standards. These items were not budgeted in these categories, as a result a variance between actual
and budget exists. Additionally, expenditure for McGregor Road footpaths and other projects has been recognised
here but budgeted in other categories.
Expenditure on drainage for projects such as Recreation Reserve Resurfacing and IYU Recreation Reserve has
been expended here but budgeted elsewhere.
Major budgeted works is IYU Recreation Reserve, which is slightly over expended but offset by unspent funds
from previous years. Also included is continuing development at Holm Park Recreation Reserve. Assets
associated with the new civic centre have been allocated to appropriate asset categories, as per accounting
standards. These items were not budgeted in these categories, as a result a variance between actual and budget
exists.
Main items included here are landscaping works at Toomah Community Centre, as well as the Open Space
renewal program and Township Strategy projects. Assets associated with the new civic centre have been allocated
to appropriate asset categories, as per accounting standards. These items were not budgeted in these categories,
as a result a variance between actual and budget exists.
Asset upgrade projects are over budget, the major variance being the McGregor Road duplication project which
has been funded by unspent funds from previous years.
Expenditure in this category mainly relates to car park works at IYU Recreation Reserve, and has been budgeted
elsewhere.
The budget includes amounts for Community Capital Works grants, which are expended from operating accounts,
and Township Strategy funds, which has been expended elsewhere.
Assets associated with the new civic centre have been allocated to appropriate asset categories, as per
accounting standards. These items were not budgeted in these categories, as a result a variance between actual
and budget exists.
Asset renewal projects are under budget, the major variance being in road pavement renewals.
Cardinia Shire Council Notes to the Financial Report2014/2015 Financial Report For the Year Ended 30 June 2015
2015 2014
$'000 $'000
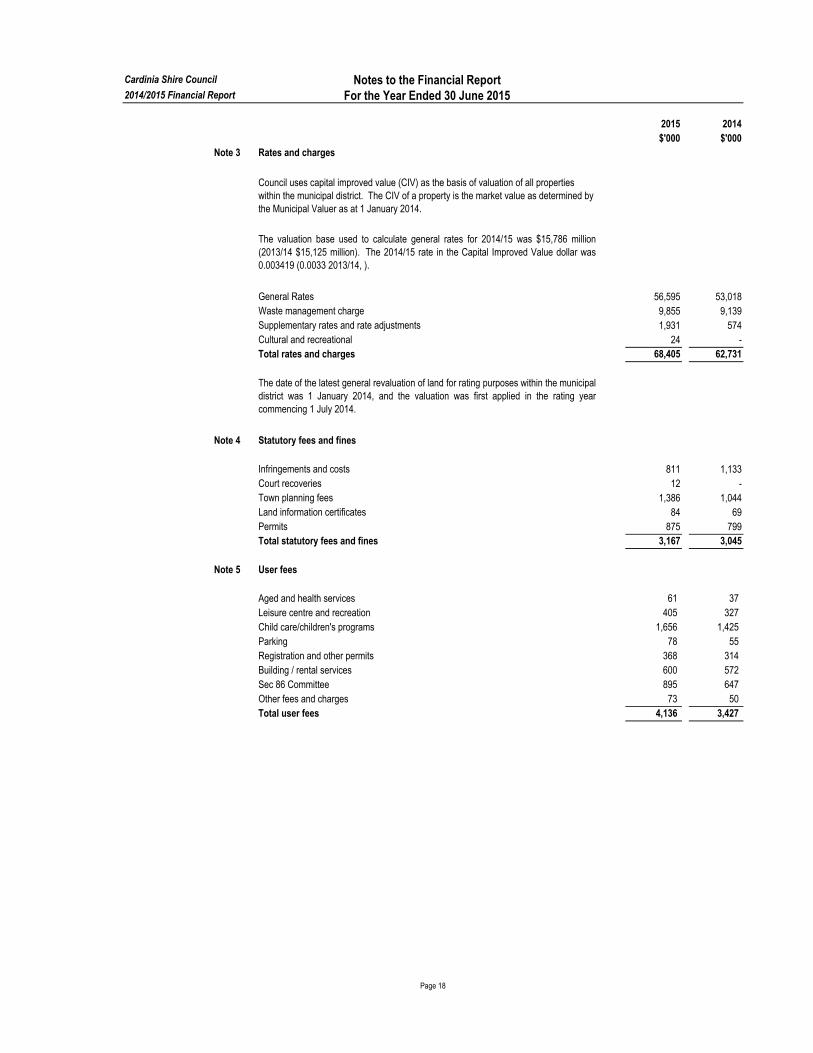
Note 3 Rates and charges
Council uses capital improved value (CIV) as the basis of valuation of all properties
within the municipal district. The CIV of a property is the market value as determined by
the Municipal Valuer as at 1 January 2014.
The valuation base used to calculate general rates for 2014/15 was $15,786 million
(2013/14 $15,125 million). The 2014/15 rate in the Capital Improved Value dollar was
0.003419 (0.0033 2013/14, ).
General Rates 56,595 53,018
Waste management charge 9,855 9,139
Supplementary rates and rate adjustments 1,931 574
Cultural and recreational 24 -
Total rates and charges 68,405 62,731
The date of the latest general revaluation of land for rating purposes within the municipal
district was 1 January 2014, and the valuation was first applied in the rating year
commencing 1 July 2014.
Note 4 Statutory fees and fines
Infringements and costs 811 1,133
Court recoveries 12 -
Town planning fees 1,386 1,044
Land information certificates 84 69
Permits 875 799
Total statutory fees and fines 3,167 3,045
Note 5 User fees
Aged and health services 61 37
Leisure centre and recreation 405 327
Child care/children's programs 1,656 1,425
Parking 78 55
Registration and other permits 368 314
Building / rental services 600 572
Sec 86 Committee 895 647
Other fees and charges 73 50
Total user fees 4,136 3,427
Page 18
Cardinia Shire Council Notes to the Financial Report2014/2015 Financial Report For the Year Ended 30 June 2015
2015 2014
$'000 $'000
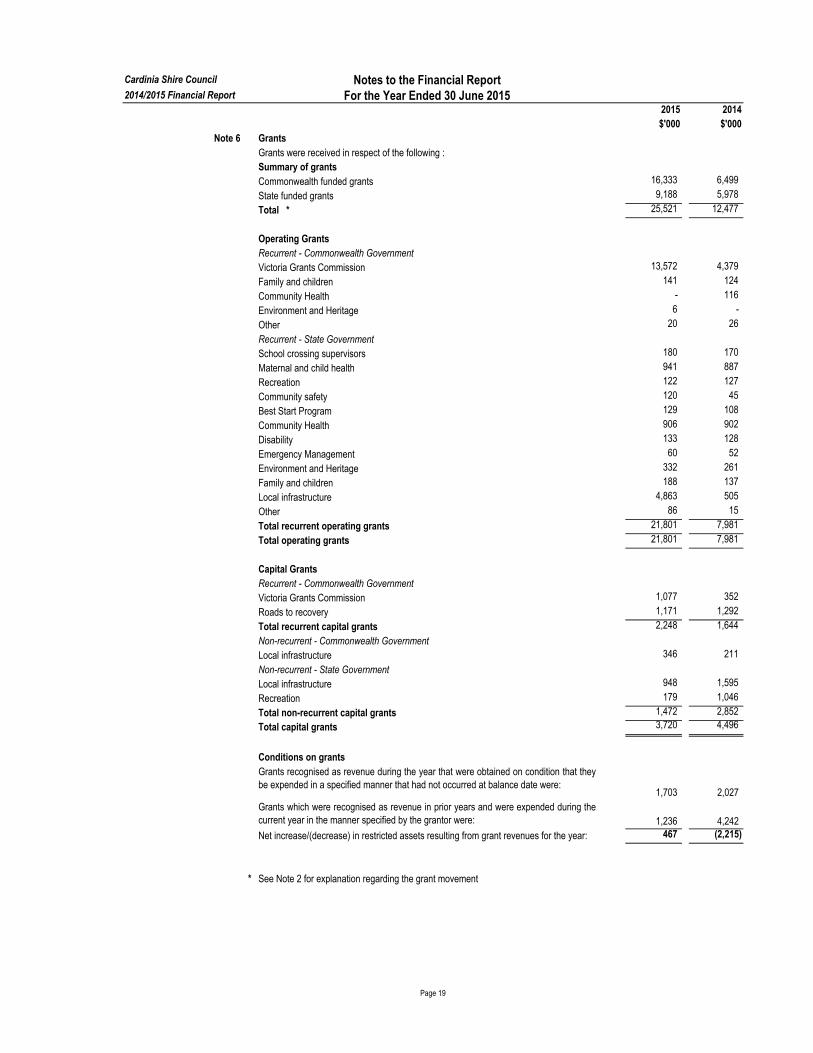
Note 6 Grants
Grants were received in respect of the following :
Summary of grants
Commonwealth funded grants 16,333 6,499
State funded grants 9,188 5,978
Total * 25,521 12,477
Operating Grants
Recurrent - Commonwealth Government
Victoria Grants Commission 13,572 4,379
Family and children 141 124
Community Health - 116
Environment and Heritage 6 -
Other 20 26
Recurrent - State Government
School crossing supervisors 180 170
Maternal and child health 941 887
Recreation 122 127
Community safety 120 45
Best Start Program 129 108
Community Health 906 902
Disability 133 128
Emergency Management 60 52
Environment and Heritage 332 261
Family and children 188 137
Local infrastructure 4,863 505
Other 86 15
Total recurrent operating grants 21,801 7,981
Total operating grants 21,801 7,981
Capital Grants
Recurrent - Commonwealth Government
Victoria Grants Commission 1,077 352
Roads to recovery 1,171 1,292
Total recurrent capital grants 2,248 1,644
Non-recurrent - Commonwealth Government
Local infrastructure 346 211
Non-recurrent - State Government
Local infrastructure 948 1,595
Recreation 179 1,046
Total non-recurrent capital grants 1,472 2,852
Total capital grants 3,720 4,496
Conditions on grants
Grants recognised as revenue during the year that were obtained on condition that they
be expended in a specified manner that had not occurred at balance date were:1,703 2,027
Grants which were recognised as revenue in prior years and were expended during the
current year in the manner specified by the grantor were: 1,236 4,242
Net increase/(decrease) in restricted assets resulting from grant revenues for the year: 467 (2,215)
* See Note 2 for explanation regarding the grant movement
Page 19
Cardinia Shire Council Notes to the Financial Report2014/2015 Financial Report For the Year Ended 30 June 2015
2015 2014
$'000 $'000
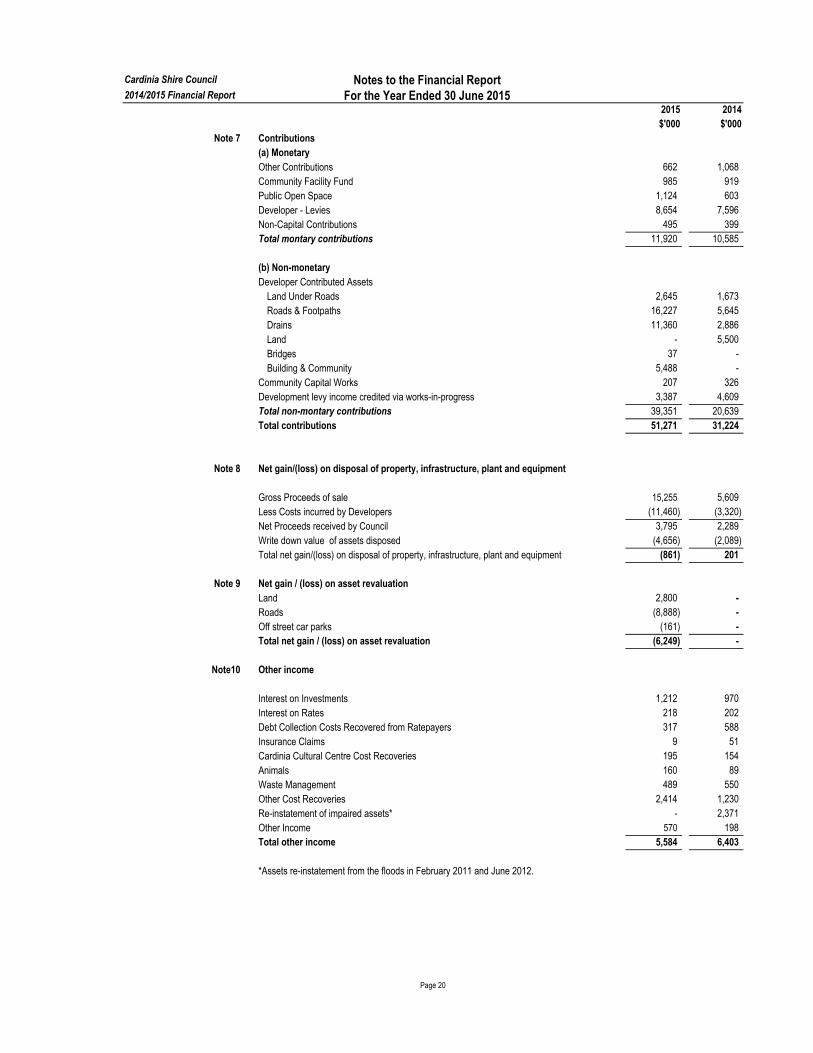
Note 7 Contributions
(a) Monetary
Other Contributions 662 1,068
Community Facility Fund 985 919
Public Open Space 1,124 603
Developer - Levies 8,654 7,596
Non-Capital Contributions 495 399
Total montary contributions 11,920 10,585
(b) Non-monetary
Developer Contributed Assets
Land Under Roads 2,645 1,673
Roads & Footpaths 16,227 5,645
Drains 11,360 2,886
Land - 5,500
Bridges 37 -
Building & Community 5,488 -
Community Capital Works 207 326
Development levy income credited via works-in-progress 3,387 4,609
Total non-montary contributions 39,351 20,639
Total contributions 51,271 31,224
Note 8 Net gain/(loss) on disposal of property, infrastructure, plant and equipment
Gross Proceeds of sale 15,255 5,609
Less Costs incurred by Developers (11,460) (3,320)
Net Proceeds received by Council 3,795 2,289
Write down value of assets disposed (4,656) (2,089)
Total net gain/(loss) on disposal of property, infrastructure, plant and equipment (861) 201
Note 9 Net gain / (loss) on asset revaluation
Land 2,800 -
Roads (8,888) -
Off street car parks (161) -
Total net gain / (loss) on asset revaluation (6,249) -
Note10 Other income
Interest on Investments 1,212 970
Interest on Rates 218 202
Debt Collection Costs Recovered from Ratepayers 317 588
Insurance Claims 9 51
Cardinia Cultural Centre Cost Recoveries 195 154
Animals 160 89
Waste Management 489 550
Other Cost Recoveries 2,414 1,230
Re-instatement of impaired assets* - 2,371
Other Income 570 198
Total other income 5,584 6,403
*Assets re-instatement from the floods in February 2011 and June 2012.
Page 20

Cardinia Shire Council Notes to the Financial Report2014/2015 Financial Report For the Year Ended 30 June 2015
2015 2014
Note 11 (a) Employee costs $'000 $'000
Wages and salaries 25,975 23,893
WorkCover 511 618
Casual Staff 383 344
Superannuation 2,422 2,246
Long service leave 785 1,478
Annual leave 189 481
Sick leave 720 774
Fringe benefits tax 342 253
Other 25 24
Total employee costs 31,352 30,111
Note 11 (b) Superannuation
Council made contributions to the following funds:
Defined benefit fund
Employer contributions to Local Authorities Superannuation Fund (Vision Super) 169 191
169 191
Accumulation funds
Employer contributions to Local Authorities Superannuation Fund (Vision Super) 2,253 2,021
Employer contributions - other funds - 34
2,253 2,055 Employer contributions payable at reporting date. 18 45
Page 21
Cardinia Shire Council makes all of its employer superannuation contributions in respect of its employees to
the Local Authorities Superannuation Fund (The Fund). This Fund has two categories of membership,
accumulation and defined benefit, each of which is funded differently. Obligations for contributions to the Fund
are recognised as an expense in Comprehensive Income statement when they are made due
Accumulation
The Fund’s accumulation categories, Vision MySuper/Vision Super Saver, receives both employer and
employee contributions on a progressive basis. Employer contributions are normally based on a fixed
percentage of employee earnings (for the year ended 30 June 2015, this was 9.5% required under
Superannuation Guarantee legislation (for 2013/14, this was 9.25%)).
Defined Benefit
Cardinia Shire Council does not use defined benefit accounting for its defined benefit obligations under the
Fund’s Defined Benefit category. This is because the Fund’s Defined Benefit category is a pooled multi-
employer sponsored plan.
There is no potential split of the defined benefit liabilities, assets or costs between the participating employers
as the defined benefit obligation is a floating obligation between the participating employers and the only time
that the aggregate obligation is allocated to specific employers is when a call is made. As a result, the level of
participation of Cardinia Shire Council in the Fund cannot be measured as a percentage compared with the
other participating employers. Therefore, the Actuary is unable to allocate benefit liabilities, assets and costs
between employers for the purposes of AASB 119.
Cardinia Shire Council Notes to the Financial Report2014/2015 Financial Report For the Year Ended 30 June 2015
2015 2014
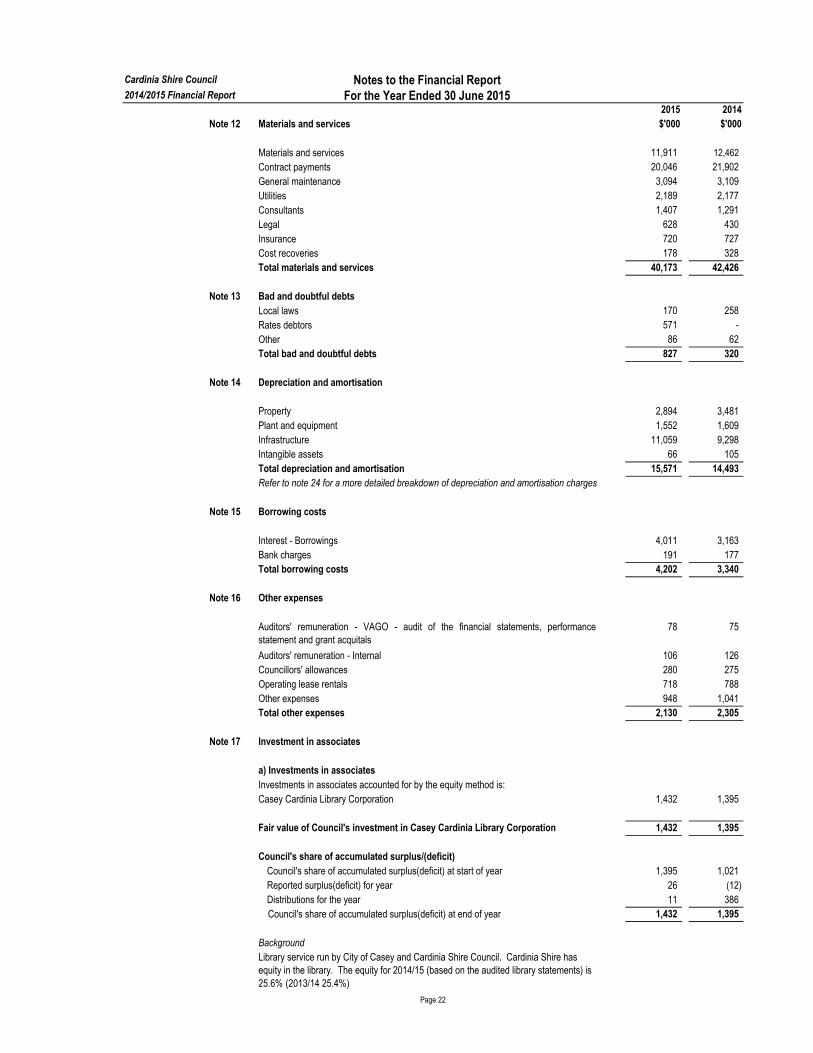
Note 12 Materials and services $'000 $'000
Materials and services 11,911 12,462
Contract payments 20,046 21,902
General maintenance 3,094 3,109
Utilities 2,189 2,177
Consultants 1,407 1,291
Legal 628 430
Insurance 720 727
Cost recoveries 178 328
Total materials and services 40,173 42,426
Note 13 Bad and doubtful debts
Local laws 170 258
Rates debtors 571 -
Other 86 62
Total bad and doubtful debts 827 320
Note 14 Depreciation and amortisation
Property 2,894 3,481
Plant and equipment 1,552 1,609
Infrastructure 11,059 9,298
Intangible assets 66 105
Total depreciation and amortisation 15,571 14,493
Refer to note 24 for a more detailed breakdown of depreciation and amortisation charges
Note 15 Borrowing costs
Interest - Borrowings 4,011 3,163
Bank charges 191 177
Total borrowing costs 4,202 3,340
Note 16 Other expenses
Auditors' remuneration - VAGO - audit of the financial statements, performance
statement and grant acquitals
78 75
Auditors' remuneration - Internal 106 126
Councillors' allowances 280 275
Operating lease rentals 718 788
Other expenses 948 1,041
Total other expenses 2,130 2,305
Note 17 Investment in associates
a) Investments in associates
Investments in associates accounted for by the equity method is:
Casey Cardinia Library Corporation 1,432 1,395
Fair value of Council's investment in Casey Cardinia Library Corporation 1,432 1,395
Council's share of accumulated surplus/(deficit)
Council's share of accumulated surplus(deficit) at start of year 1,395 1,021
Reported surplus(deficit) for year 26 (12)
Distributions for the year 11 386
Council's share of accumulated surplus(deficit) at end of year 1,432 1,395
Background
Library service run by City of Casey and Cardinia Shire Council. Cardinia Shire has
equity in the library. The equity for 2014/15 (based on the audited library statements) is
25.6% (2013/14 25.4%)
Page 22
Cardinia Shire Council
2014/2015 Financial Report
2015 2014
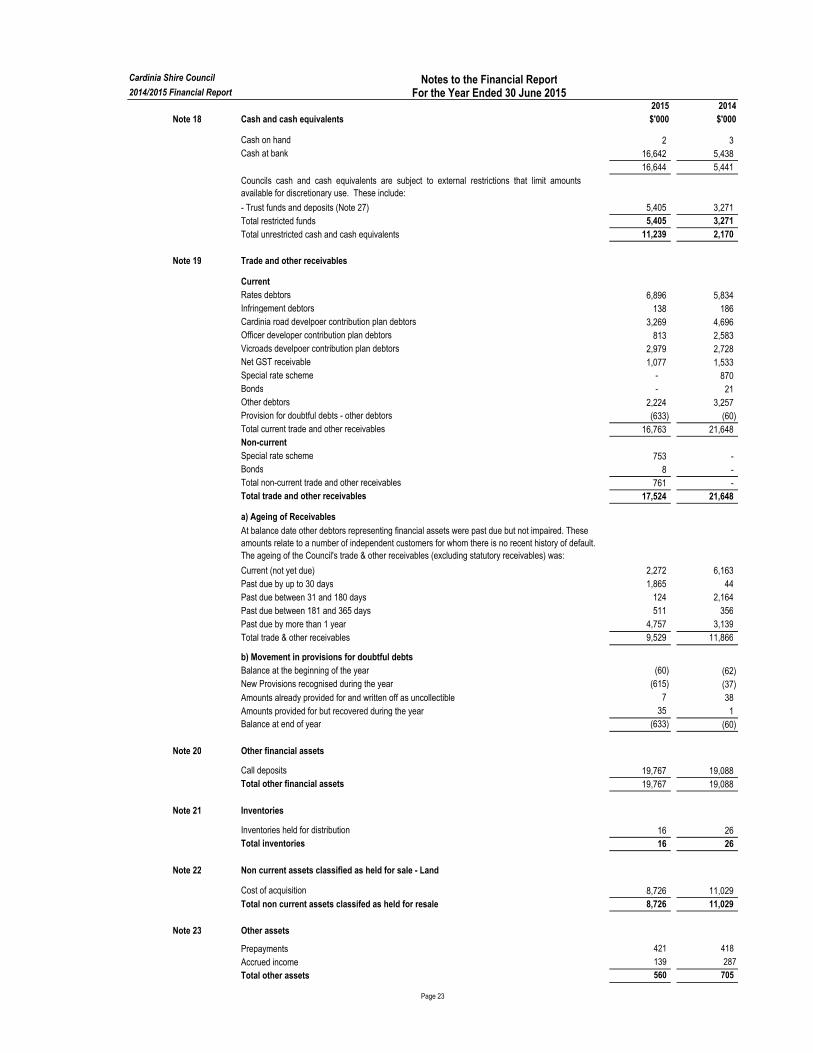
Note 18 Cash and cash equivalents $'000 $'000
Cash on hand 2 3
Cash at bank 16,642 5,438
16,644 5,441
Councils cash and cash equivalents are subject to external restrictions that limit amounts
available for discretionary use. These include:
- Trust funds and deposits (Note 27) 5,405 3,271
Total restricted funds 5,405 3,271
Total unrestricted cash and cash equivalents 11,239 2,170
Note 19 Trade and other receivables
Current
Rates debtors 6,896 5,834
Infringement debtors 138 186
Cardinia road develpoer contribution plan debtors 3,269 4,696
Officer developer contribution plan debtors 813 2,583
Vicroads develpoer contribution plan debtors 2,979 2,728
Net GST receivable 1,077 1,533
Special rate scheme - 870
Bonds - 21
Other debtors 2,224 3,257
Provision for doubtful debts - other debtors (633) (60)
Total current trade and other receivables 16,763 21,648
Non-current
Special rate scheme 753 -
Bonds 8 -
Total non-current trade and other receivables 761 -
Total trade and other receivables 17,524 21,648
a) Ageing of Receivables
Current (not yet due) 2,272 6,163
Past due by up to 30 days 1,865 44
Past due between 31 and 180 days 124 2,164
Past due between 181 and 365 days 511 356
Past due by more than 1 year 4,757 3,139
Total trade & other receivables 9,529 11,866
b) Movement in provisions for doubtful debts
Balance at the beginning of the year (60) (62)
New Provisions recognised during the year (615) (37)
Amounts already provided for and written off as uncollectible 7 38
Amounts provided for but recovered during the year 35 1
Balance at end of year (633) (60)
Note 20 Other financial assets
Call deposits 19,767 19,088
Total other financial assets 19,767 19,088
Note 21 Inventories
Inventories held for distribution 16 26
Total inventories 16 26
Note 22 Non current assets classified as held for sale - Land
Cost of acquisition 8,726 11,029
Total non current assets classifed as held for resale 8,726 11,029
Note 23 Other assets
Prepayments 421 418
Accrued income 139 287
Total other assets 560 705
Notes to the Financial ReportFor the Year Ended 30 June 2015
Page 23
At balance date other debtors representing financial assets were past due but not impaired. These
amounts relate to a number of independent customers for whom there is no recent history of default.
The ageing of the Council's trade & other receivables (excluding statutory receivables) was:
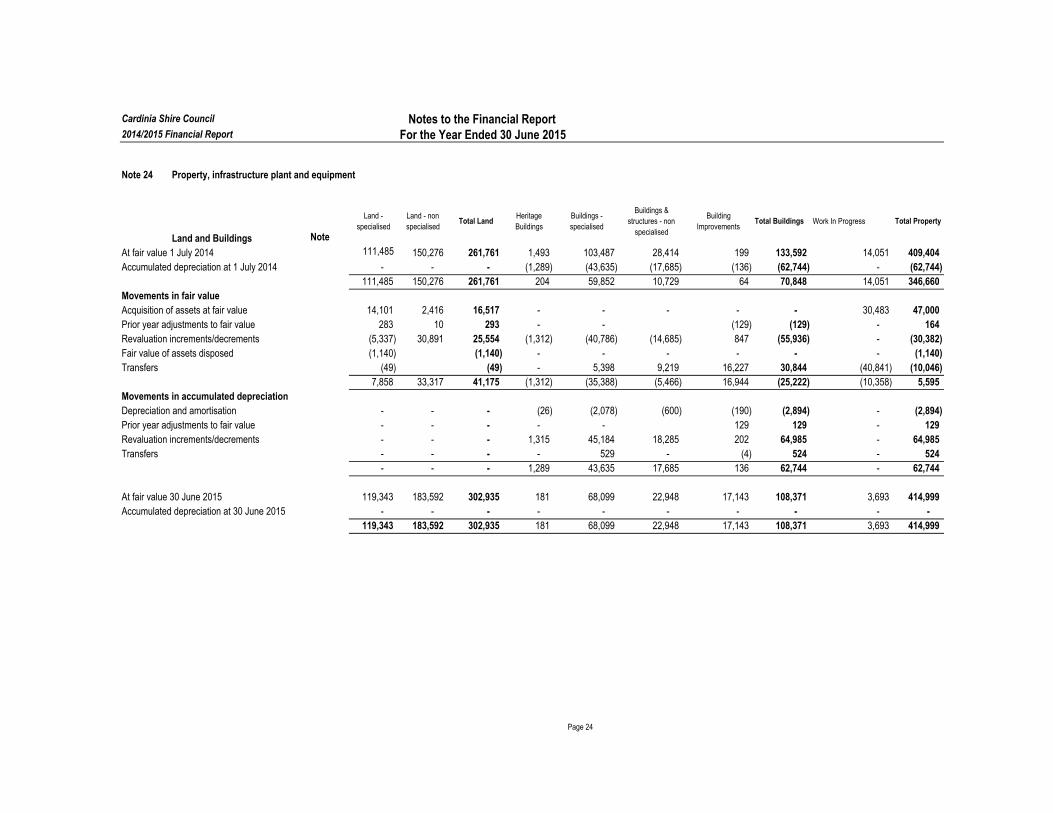
Note 24 Property, infrastructure plant and equipment
Land and Buildings Note
Land -
specialised
Land - non
specialisedTotal Land
Heritage
Buildings
Buildings -
specialised
Buildings &
structures - non
specialised
Building
ImprovementsTotal Buildings Work In Progress Total Property
At fair value 1 July 2014 111,485 150,276 261,761 1,493 103,487 28,414 199 133,592 14,051 409,404
Accumulated depreciation at 1 July 2014 - - - (1,289) (43,635) (17,685) (136) (62,744) - (62,744)
111,485 150,276 261,761 204 59,852 10,729 64 70,848 14,051 346,660
Movements in fair value
Acquisition of assets at fair value 14,101 2,416 16,517 - - - - - 30,483 47,000
Prior year adjustments to fair value 283 10 293 - - (129) (129) - 164
Revaluation increments/decrements (5,337) 30,891 25,554 (1,312) (40,786) (14,685) 847 (55,936) - (30,382)
Fair value of assets disposed (1,140) (1,140) - - - - - - (1,140)
Transfers (49) (49) - 5,398 9,219 16,227 30,844 (40,841) (10,046)
7,858 33,317 41,175 (1,312) (35,388) (5,466) 16,944 (25,222) (10,358) 5,595
Movements in accumulated depreciation
Depreciation and amortisation - - - (26) (2,078) (600) (190) (2,894) - (2,894)
Prior year adjustments to fair value - - - - - 129 129 - 129
Revaluation increments/decrements - - - 1,315 45,184 18,285 202 64,985 - 64,985
Transfers - - - - 529 - (4) 524 - 524
- - - 1,289 43,635 17,685 136 62,744 - 62,744
At fair value 30 June 2015 119,343 183,592 302,935 181 68,099 22,948 17,143 108,371 3,693 414,999
Accumulated depreciation at 30 June 2015 - - - - - - - - - -
119,343 183,592 302,935 181 68,099 22,948 17,143 108,371 3,693 414,999
Cardinia Shire Council Notes to the Financial Report2014/2015 Financial Report For the Year Ended 30 June 2015
Page 24
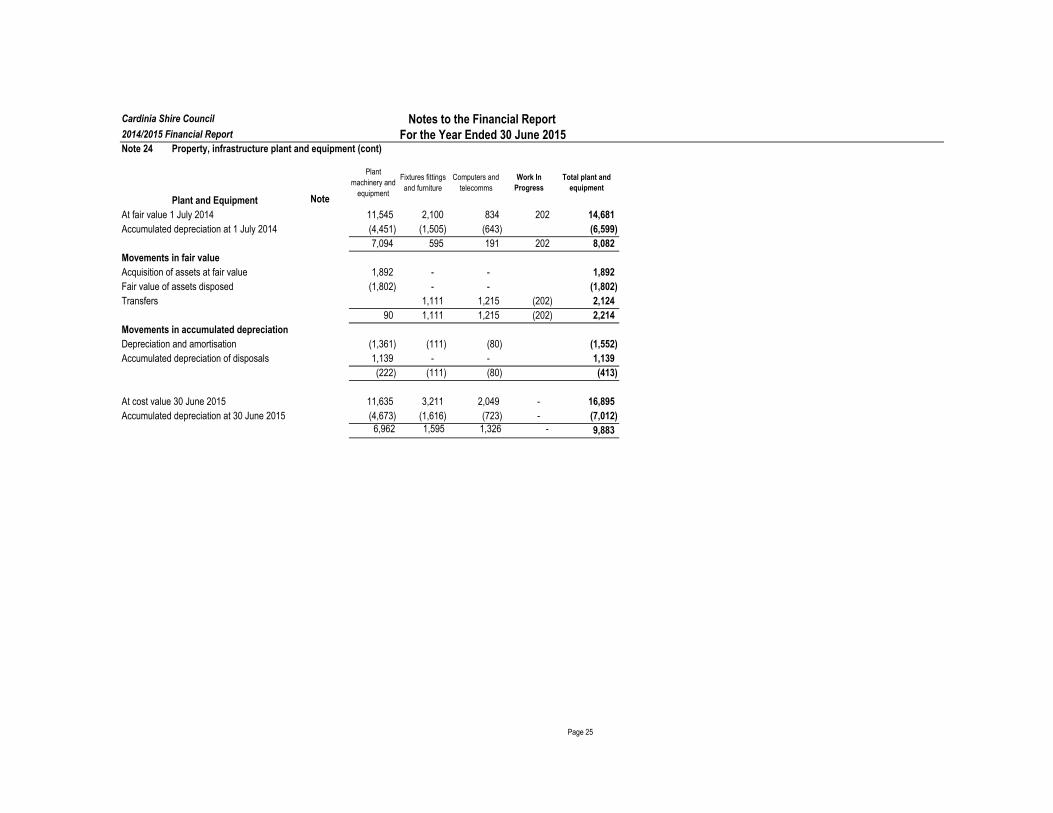
Cardinia Shire Council Notes to the Financial Report2014/2015 Financial Report For the Year Ended 30 June 2015Note 24 Property, infrastructure plant and equipment (cont)
Plant and Equipment Note
Plant
machinery and
equipment
Fixtures fittings
and furniture
Computers and
telecomms
Work In
Progress
Total plant and
equipment
At fair value 1 July 2014 11,545 2,100 834 202 14,681
Accumulated depreciation at 1 July 2014 (4,451) (1,505) (643) (6,599)
7,094 595 191 202 8,082
Movements in fair value
Acquisition of assets at fair value 1,892 - - 1,892
Fair value of assets disposed (1,802) - - (1,802)
Transfers 1,111 1,215 (202) 2,124
90 1,111 1,215 (202) 2,214
Movements in accumulated depreciation
Depreciation and amortisation (1,361) (111) (80) (1,552)
Accumulated depreciation of disposals 1,139 - - 1,139
(222) (111) (80) (413)
At cost value 30 June 2015 11,635 3,211 2,049 - 16,895
Accumulated depreciation at 30 June 2015 (4,673) (1,616) (723) - (7,012) 6,962 1,595 1,326 - 9,883
Page 25
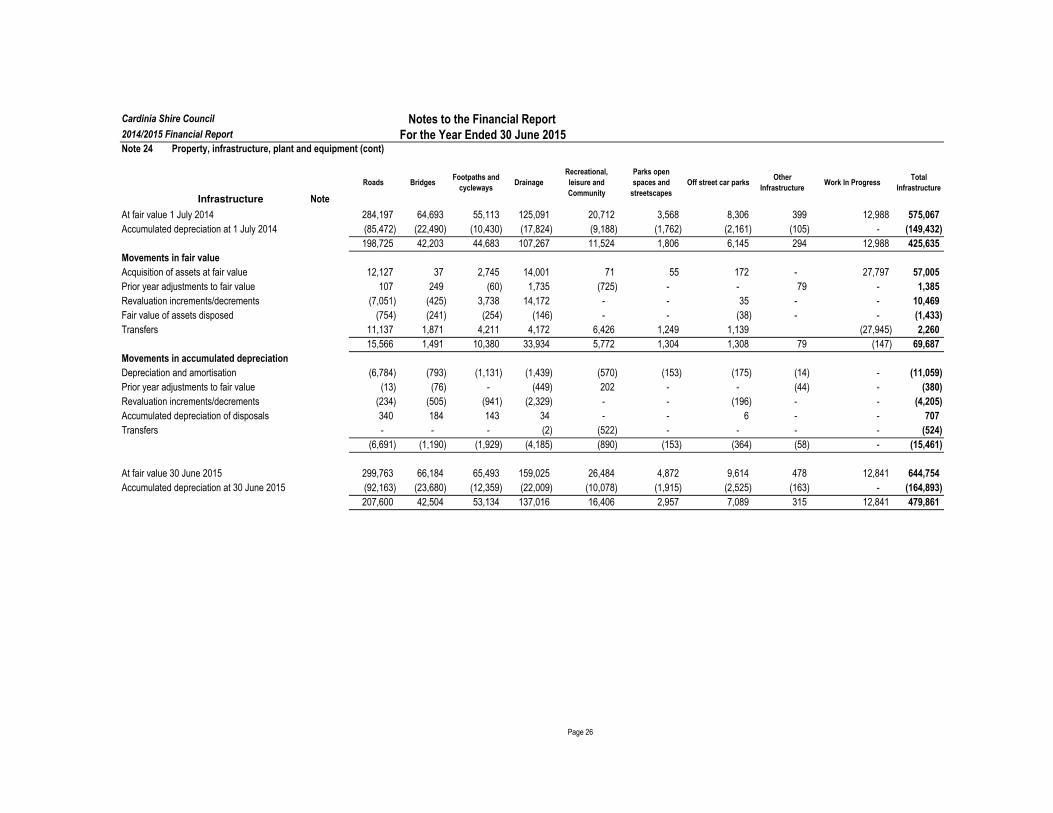
Cardinia Shire Council Notes to the Financial Report2014/2015 Financial Report For the Year Ended 30 June 2015Note 24 Property, infrastructure, plant and equipment (cont)
Infrastructure Note
Roads BridgesFootpaths and
cyclewaysDrainage
Recreational,
leisure and
Community
Parks open
spaces and
streetscapes
Off street car parksOther
InfrastructureWork In Progress
Total
Infrastructure
At fair value 1 July 2014 284,197 64,693 55,113 125,091 20,712 3,568 8,306 399 12,988 575,067
Accumulated depreciation at 1 July 2014 (85,472) (22,490) (10,430) (17,824) (9,188) (1,762) (2,161) (105) - (149,432)
198,725 42,203 44,683 107,267 11,524 1,806 6,145 294 12,988 425,635
Movements in fair value
Acquisition of assets at fair value 12,127 37 2,745 14,001 71 55 172 - 27,797 57,005
Prior year adjustments to fair value 107 249 (60) 1,735 (725) - - 79 - 1,385
Revaluation increments/decrements (7,051) (425) 3,738 14,172 - - 35 - - 10,469
Fair value of assets disposed (754) (241) (254) (146) - - (38) - - (1,433)
Transfers 11,137 1,871 4,211 4,172 6,426 1,249 1,139 (27,945) 2,260
15,566 1,491 10,380 33,934 5,772 1,304 1,308 79 (147) 69,687
Movements in accumulated depreciation
Depreciation and amortisation (6,784) (793) (1,131) (1,439) (570) (153) (175) (14) - (11,059)
Prior year adjustments to fair value (13) (76) - (449) 202 - - (44) - (380)
Revaluation increments/decrements (234) (505) (941) (2,329) - - (196) - - (4,205)
Accumulated depreciation of disposals 340 184 143 34 - - 6 - - 707
Transfers - - - (2) (522) - - - - (524)
(6,691) (1,190) (1,929) (4,185) (890) (153) (364) (58) - (15,461)
At fair value 30 June 2015 299,763 66,184 65,493 159,025 26,484 4,872 9,614 478 12,841 644,754
Accumulated depreciation at 30 June 2015 (92,163) (23,680) (12,359) (22,009) (10,078) (1,915) (2,525) (163) - (164,893)
207,600 42,504 53,134 137,016 16,406 2,957 7,089 315 12,841 479,861
Page 26
Cardinia Shire Council
2014/2015 Financial Report
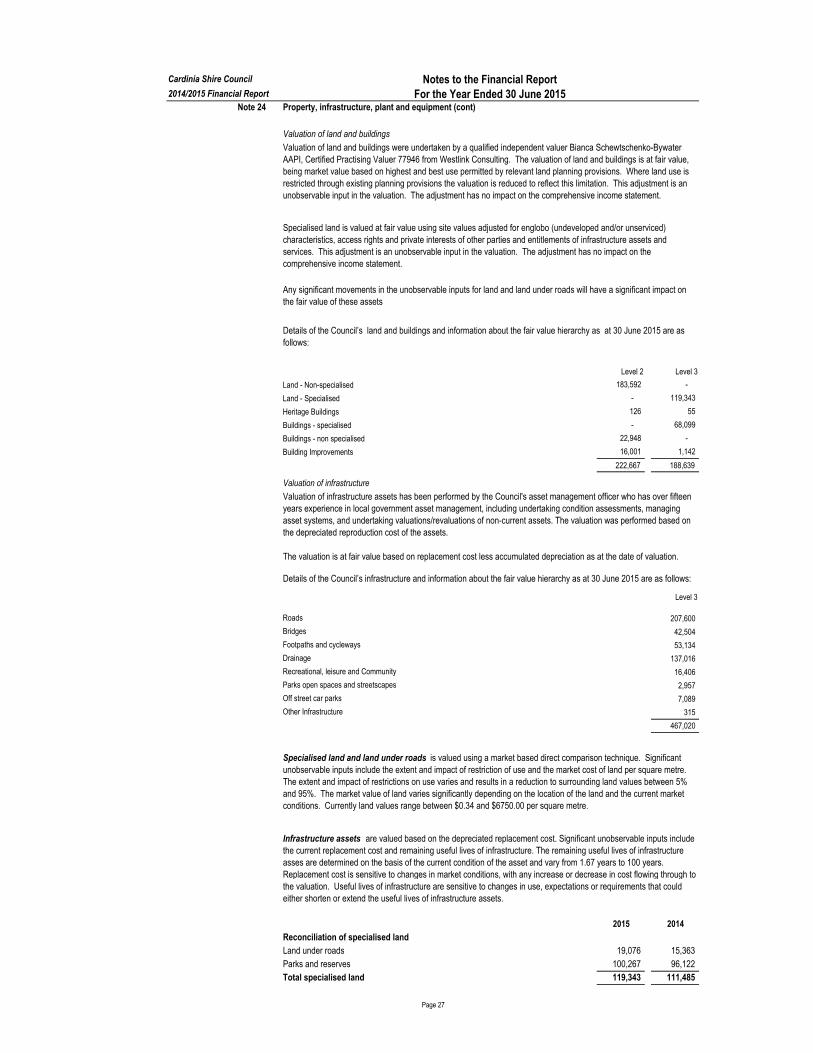
Note 24 Property, infrastructure, plant and equipment (cont)
Valuation of land and buildings
Level 2 Level 3
Land - Non-specialised 183,592 -
Land - Specialised - 119,343
Heritage Buildings 126 55
Buildings - specialised - 68,099
Buildings - non specialised 22,948 -
Building Improvements 16,001 1,142
222,667 188,639
Valuation of infrastructure
Level 3
Roads 207,600
Bridges 42,504
Footpaths and cycleways 53,134
Drainage 137,016
Recreational, leisure and Community 16,406
Parks open spaces and streetscapes 2,957
Off street car parks 7,089
Other Infrastructure 315
467,020
2015 2014
Reconciliation of specialised land
Land under roads 19,076 15,363
Parks and reserves 100,267 96,122
Total specialised land 119,343 111,485
Page 27
Notes to the Financial Report
For the Year Ended 30 June 2015
Valuation of land and buildings were undertaken by a qualified independent valuer Bianca Schewtschenko-Bywater
AAPI, Certified Practising Valuer 77946 from Westlink Consulting. The valuation of land and buildings is at fair value,
being market value based on highest and best use permitted by relevant land planning provisions. Where land use is
restricted through existing planning provisions the valuation is reduced to reflect this limitation. This adjustment is an
unobservable input in the valuation. The adjustment has no impact on the comprehensive income statement.
Specialised land is valued at fair value using site values adjusted for englobo (undeveloped and/or unserviced)
characteristics, access rights and private interests of other parties and entitlements of infrastructure assets and
services. This adjustment is an unobservable input in the valuation. The adjustment has no impact on the
comprehensive income statement.
Any significant movements in the unobservable inputs for land and land under roads will have a significant impact on
the fair value of these assets
Infrastructure assets are valued based on the depreciated replacement cost. Significant unobservable inputs include
the current replacement cost and remaining useful lives of infrastructure. The remaining useful lives of infrastructure
asses are determined on the basis of the current condition of the asset and vary from 1.67 years to 100 years.
Replacement cost is sensitive to changes in market conditions, with any increase or decrease in cost flowing through to
the valuation. Useful lives of infrastructure are sensitive to changes in use, expectations or requirements that could
either shorten or extend the useful lives of infrastructure assets.
Details of the Council’s land and buildings and information about the fair value hierarchy as at 30 June 2015 are as
follows:
Valuation of infrastructure assets has been performed by the Council's asset management officer who has over fifteen
years experience in local government asset management, including undertaking condition assessments, managing
asset systems, and undertaking valuations/revaluations of non-current assets. The valuation was performed based on
the depreciated reproduction cost of the assets.
The valuation is at fair value based on replacement cost less accumulated depreciation as at the date of valuation.
Details of the Council’s infrastructure and information about the fair value hierarchy as at 30 June 2015 are as follows:
Specialised land and land under roads is valued using a market based direct comparison technique. Significant
unobservable inputs include the extent and impact of restriction of use and the market cost of land per square metre.
The extent and impact of restrictions on use varies and results in a reduction to surrounding land values between 5%
and 95%. The market value of land varies significantly depending on the location of the land and the current market
conditions. Currently land values range between $0.34 and $6750.00 per square metre.
Cardinia Shire Council
2014/2015 Financial Report
2015 2014
$'000 $'000
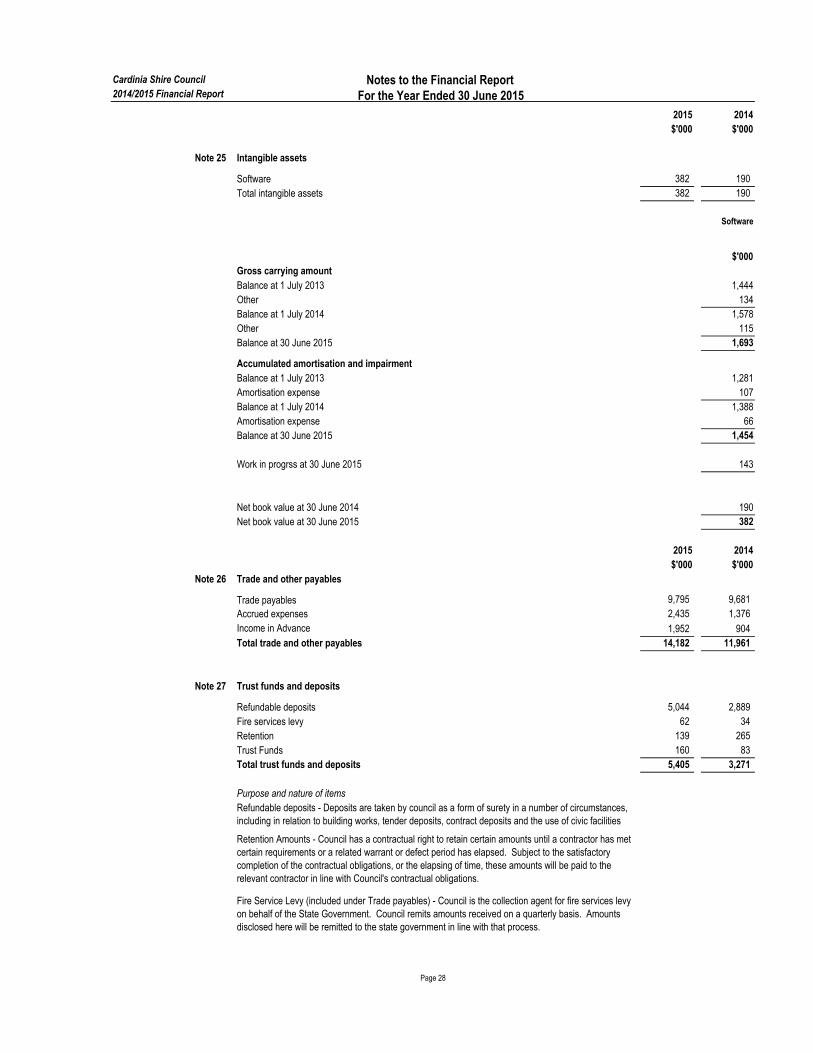
Note 25 Intangible assets
Software 382 190
Total intangible assets 382 190
Software
$'000
Gross carrying amount
Balance at 1 July 2013 1,444
Other 134
Balance at 1 July 2014 1,578
Other 115
Balance at 30 June 2015 1,693
Accumulated amortisation and impairment
Balance at 1 July 2013 1,281
Amortisation expense 107
Balance at 1 July 2014 1,388
Amortisation expense 66
Balance at 30 June 2015 1,454
Work in progrss at 30 June 2015 143
Net book value at 30 June 2014 190
Net book value at 30 June 2015 382
2015 2014
$'000 $'000
Note 26 Trade and other payables
Trade payables 9,795 9,681
Accrued expenses 2,435 1,376
Income in Advance 1,952 904
Total trade and other payables 14,182 11,961
Note 27 Trust funds and deposits
Refundable deposits 5,044 2,889
Fire services levy 62 34
Retention 139 265
Trust Funds 160 83
Total trust funds and deposits 5,405 3,271
Notes to the Financial ReportFor the Year Ended 30 June 2015
Page 28
Purpose and nature of items
Refundable deposits - Deposits are taken by council as a form of surety in a number of circumstances,
including in relation to building works, tender deposits, contract deposits and the use of civic facilities
Fire Service Levy (included under Trade payables) - Council is the collection agent for fire services levy
on behalf of the State Government. Council remits amounts received on a quarterly basis. Amounts
disclosed here will be remitted to the state government in line with that process.
Retention Amounts - Council has a contractual right to retain certain amounts until a contractor has met
certain requirements or a related warrant or defect period has elapsed. Subject to the satisfactory
completion of the contractual obligations, or the elapsing of time, these amounts will be paid to the
relevant contractor in line with Council's contractual obligations.
Cardinia Shire Council
2014/2015 Financial Report
2015 2014
$'000 $'000
Notes to the Financial ReportFor the Year Ended 30 June 2015
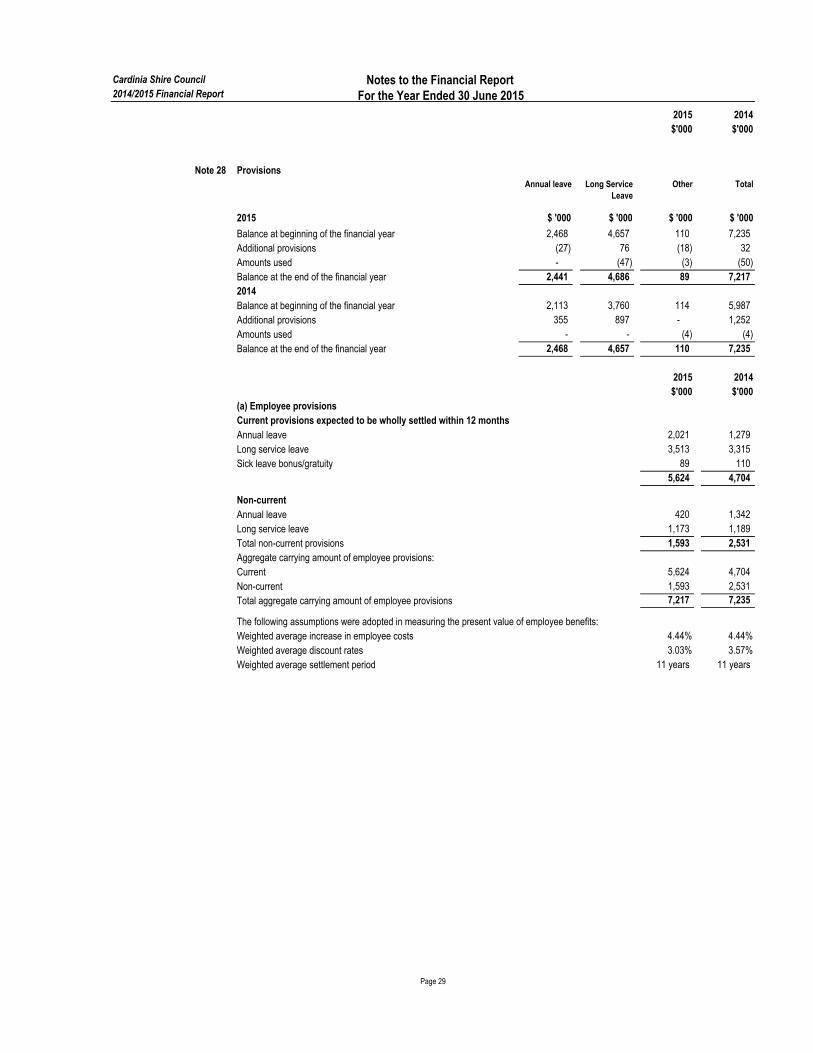
Note 28 Provisions
Annual leave Long Service
Leave
Other Total
2015 $ '000 $ '000 $ '000 $ '000
Balance at beginning of the financial year 2,468 4,657 110 7,235
Additional provisions (27) 76 (18) 32
Amounts used - (47) (3) (50)
Balance at the end of the financial year 2,441 4,686 89 7,217
2014
Balance at beginning of the financial year 2,113 3,760 114 5,987
Additional provisions 355 897 - 1,252
Amounts used - - (4) (4)
Balance at the end of the financial year 2,468 4,657 110 7,235
2015 2014
$'000 $'000
(a) Employee provisions
Annual leave 2,021 1,279
Long service leave 3,513 3,315
Sick leave bonus/gratuity 89 110
5,624 4,704
Non-current
Annual leave 420 1,342
Long service leave 1,173 1,189
Total non-current provisions 1,593 2,531
Current 5,624 4,704
Non-current 1,593 2,531
7,217 7,235
The following assumptions were adopted in measuring the present value of employee benefits:
Weighted average increase in employee costs 4.44% 4.44%
Weighted average discount rates 3.03% 3.57%
Weighted average settlement period 11 years 11 years
Page 29
Current provisions expected to be wholly settled within 12 months
Total aggregate carrying amount of employee provisions
Aggregate carrying amount of employee provisions:
Cardinia Shire Council
2014/2015 Financial Report
2015 2014
$'000 $'000
Notes to the Financial ReportFor the Year Ended 30 June 2015
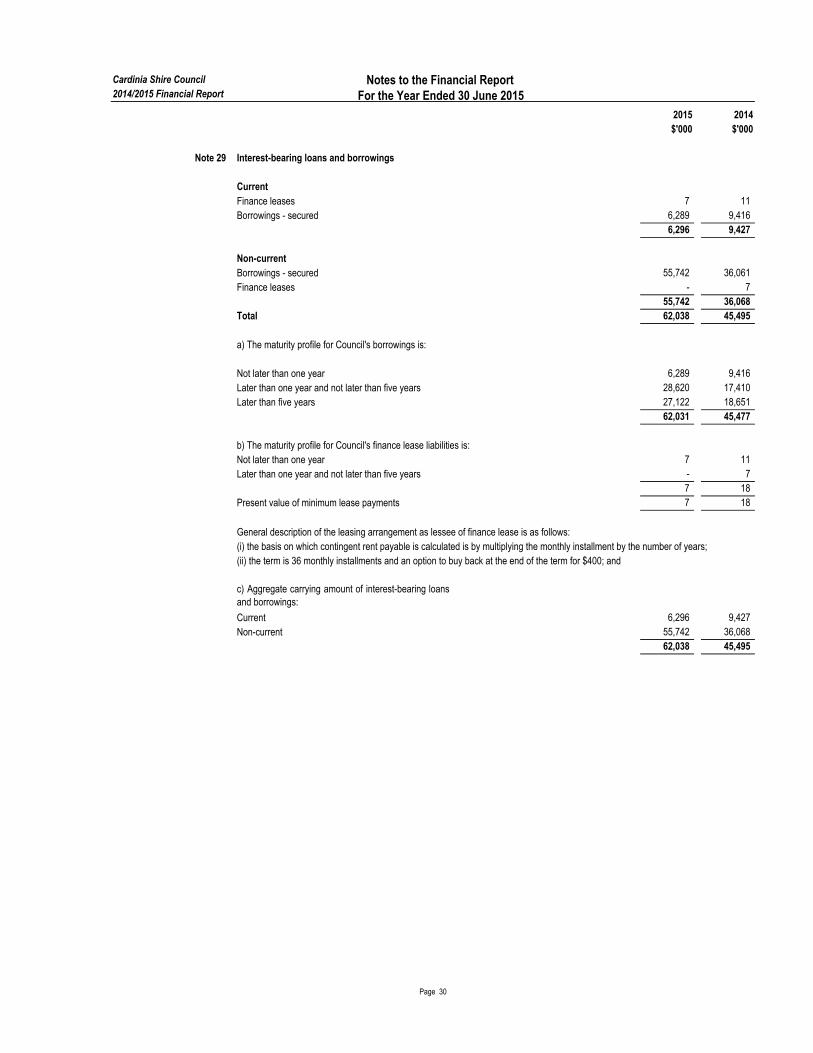
Note 29 Interest-bearing loans and borrowings
Current
Finance leases 7 11
Borrowings - secured 6,289 9,416
6,296 9,427
Non-current
Borrowings - secured 55,742 36,061
Finance leases - 7
55,742 36,068
Total 62,038 45,495
a) The maturity profile for Council's borrowings is:
Not later than one year 6,289 9,416
Later than one year and not later than five years 28,620 17,410
Later than five years 27,122 18,651
62,031 45,477
Not later than one year 7 11
Later than one year and not later than five years - 7
7 18
Present value of minimum lease payments 7 18
General description of the leasing arrangement as lessee of finance lease is as follows:
(i) the basis on which contingent rent payable is calculated is by multiplying the monthly installment by the number of years;
(ii) the term is 36 monthly installments and an option to buy back at the end of the term for $400; and
c) Aggregate carrying amount of interest-bearing loans
and borrowings:
Current 6,296 9,427
Non-current 55,742 36,068
62,038 45,495
Page 30
b) The maturity profile for Council's finance lease liabilities is:
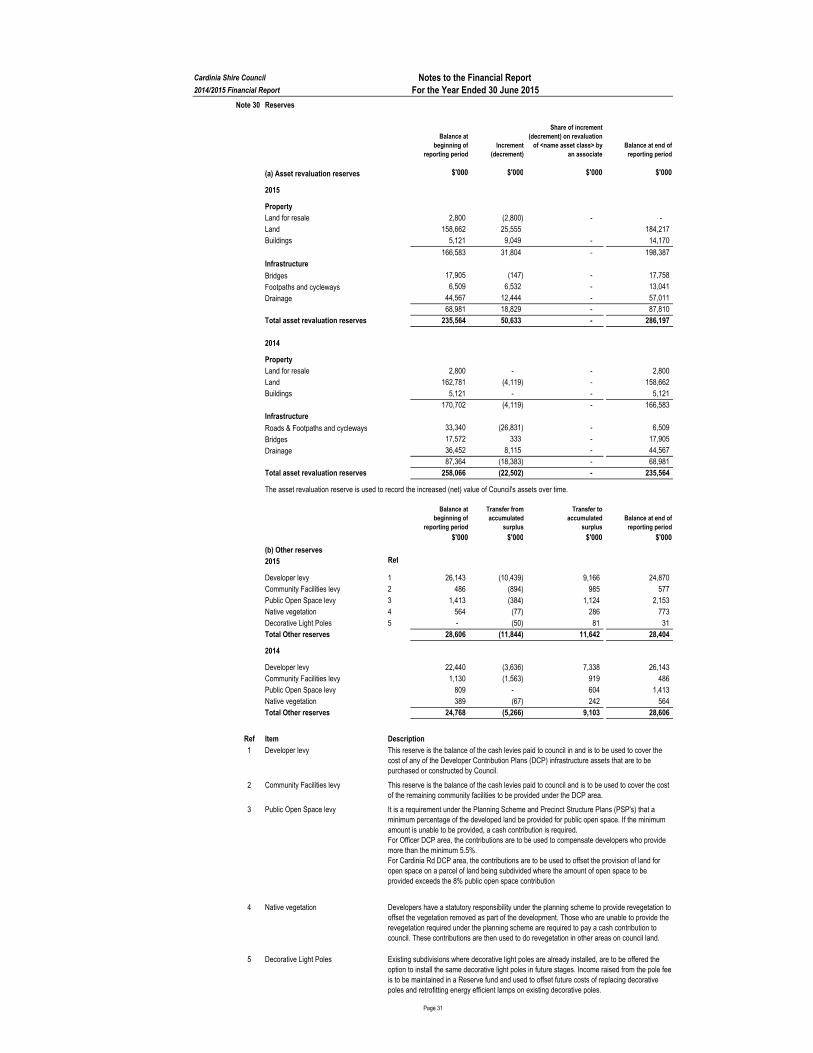
Note 30
Balance at
beginning of
reporting period
Increment
(decrement)
Share of increment
(decrement) on revaluation
of <name asset class> by
an associate
Balance at end of
reporting period
(a) Asset revaluation reserves $'000 $'000 $'000 $'000
2015
Property
Land for resale 2,800 (2,800) - -
Land 158,662 25,555 184,217
Buildings 5,121 9,049 - 14,170
166,583 31,804 - 198,387
Infrastructure
Bridges 17,905 (147) - 17,758
Footpaths and cycleways 6,509 6,532 - 13,041
Drainage 44,567 12,444 - 57,011
68,981 18,829 - 87,810
Total asset revaluation reserves 235,564 50,633 - 286,197
2014
Property
Land for resale 2,800 - - 2,800
Land 162,781 (4,119) - 158,662
Buildings 5,121 - - 5,121
170,702 (4,119) - 166,583
Infrastructure
Roads & Footpaths and cycleways 33,340 (26,831) - 6,509
Bridges 17,572 333 - 17,905
Drainage 36,452 8,115 - 44,567
87,364 (18,383) - 68,981
Total asset revaluation reserves 258,066 (22,502) - 235,564
Balance at
beginning of
reporting period
Transfer from
accumulated
surplus
Transfer to
accumulated
surplus
Balance at end of
reporting period
$'000 $'000 $'000 $'000
(b) Other reserves
2015 Ref
Developer levy 1 26,143 (10,439) 9,166 24,870
Community Facilities levy 2 486 (894) 985 577
Public Open Space levy 3 1,413 (384) 1,124 2,153
Native vegetation 4 564 (77) 286 773
Decorative Light Poles 5 - (50) 81 31
Total Other reserves 28,606 (11,844) 11,642 28,404
2014
Developer levy 22,440 (3,636) 7,338 26,143
Community Facilities levy 1,130 (1,563) 919 486
Public Open Space levy 809 - 604 1,413
Native vegetation 389 (67) 242 564
Total Other reserves 24,768 (5,266) 9,103 28,606
Ref Item Description
1 Developer levy
2 Community Facilities levy
3 Public Open Space levy
4 Native vegetation
5 Decorative Light Poles
Developers have a statutory responsibility under the planning scheme to provide revegetation to
offset the vegetation removed as part of the development. Those who are unable to provide the
revegetation required under the planning scheme are required to pay a cash contribution to
council. These contributions are then used to do revegetation in other areas on council land.
Existing subdivisions where decorative light poles are already installed, are to be offered the
option to install the same decorative light poles in future stages. Income raised from the pole fee
is to be maintained in a Reserve fund and used to offset future costs of replacing decorative
poles and retrofitting energy efficient lamps on existing decorative poles.
Page 31
Cardinia Shire Council Notes to the Financial Report2014/2015 Financial Report For the Year Ended 30 June 2015
Reserves
The asset revaluation reserve is used to record the increased (net) value of Council's assets over time.
This reserve is the balance of the cash levies paid to council in and is to be used to cover the
cost of any of the Developer Contribution Plans (DCP) infrastructure assets that are to be
purchased or constructed by Council.
This reserve is the balance of the cash levies paid to council and is to be used to cover the cost
of the remaining community facilities to be provided under the DCP area.
It is a requirement under the Planning Scheme and Precinct Structure Plans (PSP's) that a
minimum percentage of the developed land be provided for public open space. If the minimum
amount is unable to be provided, a cash contribution is required.
For Officer DCP area, the contributions are to be used to compensate developers who provide
more than the minimum 5.5%.
For Cardinia Rd DCP area, the contributions are to be used to offset the provision of land for
open space on a parcel of land being subdivided where the amount of open space to be
provided exceeds the 8% public open space contribution
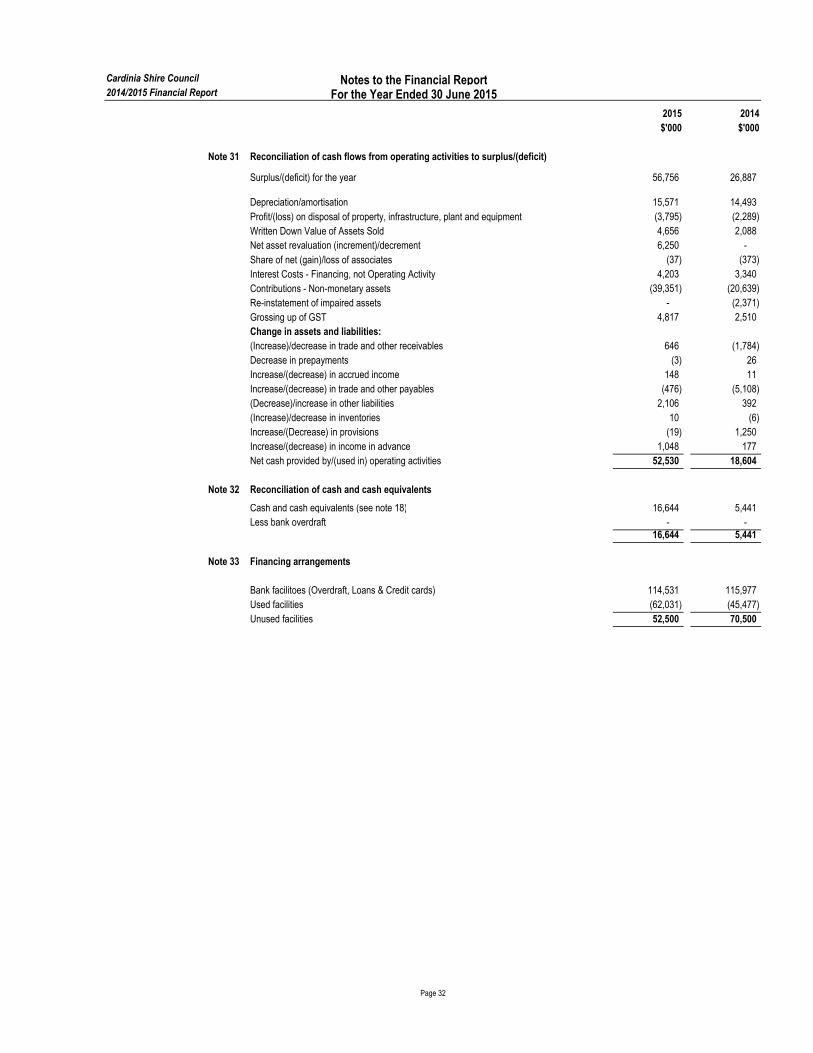
Cardinia Shire Council Notes to the Financial Report2014/2015 Financial Report For the Year Ended 30 June 2015
2015 2014
$'000 $'000
Note 31
Surplus/(deficit) for the year 56,756 26,887
Depreciation/amortisation 15,571 14,493
Profit/(loss) on disposal of property, infrastructure, plant and equipment (3,795) (2,289)
Written Down Value of Assets Sold 4,656 2,088
Net asset revaluation (increment)/decrement 6,250 -
Share of net (gain)/loss of associates (37) (373)
Interest Costs - Financing, not Operating Activity 4,203 3,340
Contributions - Non-monetary assets (39,351) (20,639)
Re-instatement of impaired assets - (2,371)
Grossing up of GST 4,817 2,510
Change in assets and liabilities:
(Increase)/decrease in trade and other receivables 646 (1,784)
Decrease in prepayments (3) 26
Increase/(decrease) in accrued income 148 11
Increase/(decrease) in trade and other payables (476) (5,108)
(Decrease)/increase in other liabilities 2,106 392
(Increase)/decrease in inventories 10 (6)
Increase/(Decrease) in provisions (19) 1,250
Increase/(decrease) in income in advance 1,048 177
Net cash provided by/(used in) operating activities 52,530 18,604
Note 32 Reconciliation of cash and cash equivalents
Cash and cash equivalents (see note 18) 16,644 5,441
Less bank overdraft - - 16,644 5,441
Note 33 Financing arrangements
Bank facilitoes (Overdraft, Loans & Credit cards) 114,531 115,977
Used facilities (62,031) (45,477)
Unused facilities 52,500 70,500
Reconciliation of cash flows from operating activities to surplus/(deficit)
Page 32
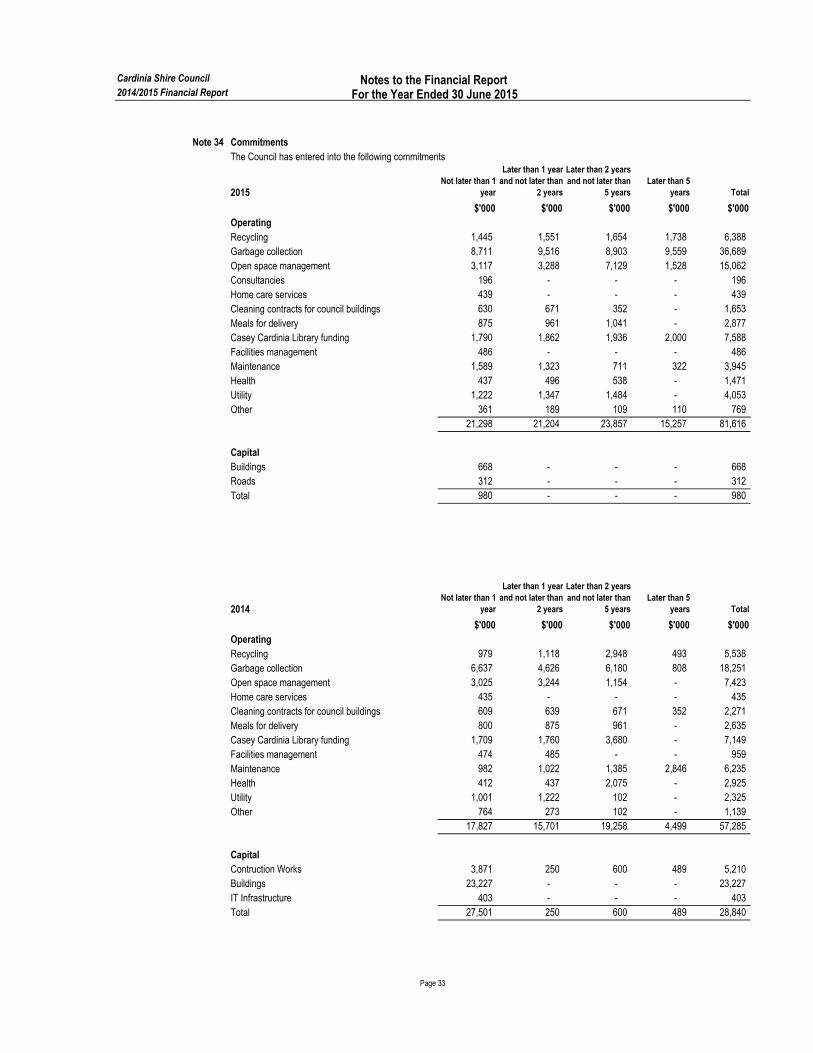
Cardinia Shire Council
2014/2015 Financial Report
Note 34 Commitments
2015Not later than 1
year
Later than 1 year
and not later than
2 years
Later than 2 years
and not later than
5 years
Later than 5
years Total
$'000 $'000 $'000 $'000 $'000
Operating
Recycling 1,445 1,551 1,654 1,738 6,388
Garbage collection 8,711 9,516 8,903 9,559 36,689
Open space management 3,117 3,288 7,129 1,528 15,062
Consultancies 196 - - - 196
Home care services 439 - - - 439
Cleaning contracts for council buildings 630 671 352 - 1,653
Meals for delivery 875 961 1,041 - 2,877
Casey Cardinia Library funding 1,790 1,862 1,936 2,000 7,588
Facilities management 486 - - - 486
Maintenance 1,589 1,323 711 322 3,945
Health 437 496 538 - 1,471
Utility 1,222 1,347 1,484 - 4,053
Other 361 189 109 110 769
21,298 21,204 23,857 15,257 81,616
Capital
Buildings 668 - - - 668
Roads 312 - - - 312
Total 980 - - - 980
2014Not later than 1
year
Later than 1 year
and not later than
2 years
Later than 2 years
and not later than
5 years
Later than 5
years Total
$'000 $'000 $'000 $'000 $'000
Operating
Recycling 979 1,118 2,948 493 5,538
Garbage collection 6,637 4,626 6,180 808 18,251
Open space management 3,025 3,244 1,154 - 7,423
Home care services 435 - - - 435
Cleaning contracts for council buildings 609 639 671 352 2,271
Meals for delivery 800 875 961 - 2,635
Casey Cardinia Library funding 1,709 1,760 3,680 - 7,149
Facilities management 474 485 - - 959
Maintenance 982 1,022 1,385 2,846 6,235
Health 412 437 2,075 - 2,925
Utility 1,001 1,222 102 - 2,325
Other 764 273 102 - 1,139
17,827 15,701 19,258 4,499 57,285
Capital
Contruction Works 3,871 250 600 489 5,210
Buildings 23,227 - - - 23,227
IT Infrastructure 403 - - - 403
Total 27,501 250 600 489 28,840
Notes to the Financial ReportFor the Year Ended 30 June 2015
The Council has entered into the following commitments
Page 33

Cardinia Shire Council Notes to the Financial Report2014/2015 Financial Report For the Year Ended 30 June 2015
2015 2014
$'000 $'000
Note 35 Operating leases
(a) Operating lease commitments
At the reporting date, the Council had the following obligations under
non-cancellable operating leases for the lease of equipment and land
and buildings for use within Council's activities (these obligations are
not recognised as liabilities):
Not later than one year 387 427
Later than one year and not later than five years 49 330
436 757
(b) Operating lease receivables
The Council has entered into commercial property leases on its
investment property, consisting of surplus freehold office complexes.
These properties held under operating leases have remaining non-
cancellable lease terms of between 1 and 10 years. All leases
include a CPI based revision of the rental charge annually.
Future minimum rentals receivable under non-cancellable operating
leases are as follows:
Not later than one year 323 254
Later than one year and not later than five years 615 478
Later than five years 151 82
1,089 814
Note 36 Contingent liabilities
(a)
Net Investment returns
Salary information
Price inflation (CPI)
Council has obligations under a defined benefit superannuation scheme that may result in the need to make additional contributions to the
scheme to ensure that the liabilities of the fund are covered by the assets of the fund. As a result of the volatility in financial markets the
likelihood of making such contributions in future periods exists. At this point in time it is not known if additional contributions will be
required, their timing or potential amount
7.5% pa.
4.25% pa.
3.75% pa
Vision super has advised that the VBI at 30 June 2015 was 105.8%
Funding arrangements
Cardinia Shire Council makes employer contributions to the defined benefit category of the Fund at rates determined by the Trustees on the
advice of the Fund’s Actuary.
The Fund’s latest actuarial investigation was held as at 30 June 2014 and it was determined that the vested benefit index (VBI) of the
defined benefit category of which Cardinia Shire Council is a contributing employer was 103.4%. To determine the VBI,. The Fund Actuary
used the following long-term assumptions:
The VBI is to be used as the primary funding indicator. Because the VBI was above 100%, the actuarial investigation determined the
defined benefit category was in a satisfactory financial position and that no changes was necessary to the defined benefit category’s
funding arrangements from prior years.
Employer Contributions
Regular contributions
On the basis of the results of the most recent full actuarial investigation conducted by the Fund’s Actuary as at 30 June 2014, Cardinia
Shire Council makes employer contributions to the Fund’s Defined Benefit category at the rates determined by the Fund’s Trustee. For the
year ended 30 June 2015, this rate was 9.5% of member’s salaries. This rate will increase in line with any increase to the Superannuation
Guarantee (SG) contribution rate.
In addition, Cardinia Shire Council reimburses the Fund to cover the excess of the benefits paid as a consequence of retrenchment above
the funded resignation or retirement benefit.
Page 34
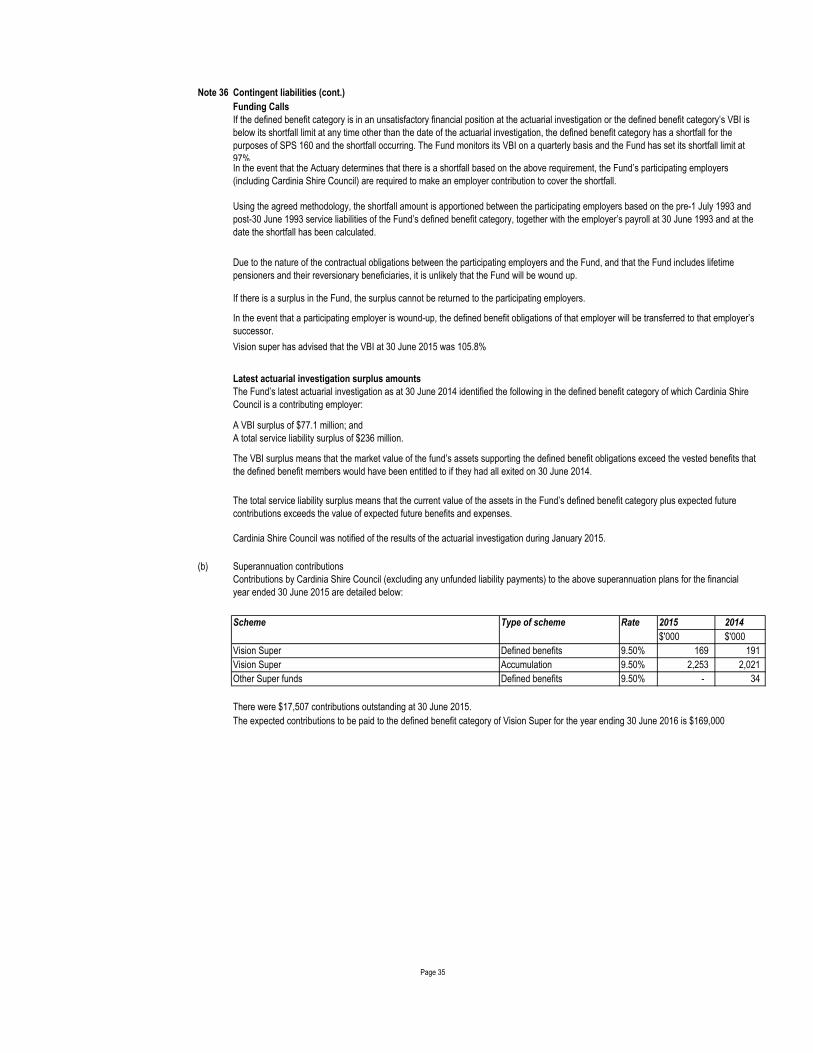
Note 36 Contingent liabilities (cont.)
A VBI surplus of $77.1 million; and
A total service liability surplus of $236 million.
(b)
Scheme Type of scheme Rate 2015 2014
$'000 $'000
Vision Super Defined benefits 9.50% 169 191
Vision Super Accumulation 9.50% 2,253 2,021
Other Super funds Defined benefits 9.50% - 34
Vision super has advised that the VBI at 30 June 2015 was 105.8%
Page 35
Funding Calls
If the defined benefit category is in an unsatisfactory financial position at the actuarial investigation or the defined benefit category’s VBI is
below its shortfall limit at any time other than the date of the actuarial investigation, the defined benefit category has a shortfall for the
purposes of SPS 160 and the shortfall occurring. The Fund monitors its VBI on a quarterly basis and the Fund has set its shortfall limit at
97% In the event that the Actuary determines that there is a shortfall based on the above requirement, the Fund’s participating employers
(including Cardinia Shire Council) are required to make an employer contribution to cover the shortfall.
Using the agreed methodology, the shortfall amount is apportioned between the participating employers based on the pre-1 July 1993 and
post-30 June 1993 service liabilities of the Fund’s defined benefit category, together with the employer’s payroll at 30 June 1993 and at the
date the shortfall has been calculated.
Due to the nature of the contractual obligations between the participating employers and the Fund, and that the Fund includes lifetime
pensioners and their reversionary beneficiaries, it is unlikely that the Fund will be wound up.
If there is a surplus in the Fund, the surplus cannot be returned to the participating employers.
In the event that a participating employer is wound-up, the defined benefit obligations of that employer will be transferred to that employer’s
successor.
The expected contributions to be paid to the defined benefit category of Vision Super for the year ending 30 June 2016 is $169,000
There were $17,507 contributions outstanding at 30 June 2015.
Latest actuarial investigation surplus amounts
The Fund’s latest actuarial investigation as at 30 June 2014 identified the following in the defined benefit category of which Cardinia Shire
Council is a contributing employer:
The VBI surplus means that the market value of the fund’s assets supporting the defined benefit obligations exceed the vested benefits that
the defined benefit members would have been entitled to if they had all exited on 30 June 2014.
The total service liability surplus means that the current value of the assets in the Fund’s defined benefit category plus expected future
contributions exceeds the value of expected future benefits and expenses.
Cardinia Shire Council was notified of the results of the actuarial investigation during January 2015.
Superannuation contributions
Contributions by Cardinia Shire Council (excluding any unfunded liability payments) to the above superannuation plans for the financial
year ended 30 June 2015 are detailed below:
Cardinia Shire Council
2014/2015 Financial Report
Note 37
(b) Market risk
Interest rate risk
- diversification of investment product,
- monitoring of return on investment,
- benchmarking of returns and comparison with budget.
Interest rate movements have not been sufficiently significant during the year to have an impact on the Council's year end result.
(c) Credit risk
- we may require collateral where appropriate; and
- we only invest surplus funds with financial institutions which have a recognised credit rating specified in our investment policy.
There are no material financial assets which are individually determined to be impaired.
(d) Liquidity risk
To help reduce these risks Council:
- have readily accessible standby facilities and other funding arrangements in place;
- have a liquidity portfolio structure that requires surplus funds to be invested within various bands of liquid instruments;
- monitor budget to actual performance on a regular basis; and
Unless otherwise stated, the carrying amounts of financial instruments reflect their fair value
Page 36
The Council's maximum exposure to liquidity risk is the carrying amounts of financial liabilities as disclosed in the face of the balance
sheet, and is deemed insignificant based on prior periods' data and current assessment of risk.
Market risk is the risk that the fair value or future cash flows of our financial instruments will fluctuate because of changes in market prices.
The Council's exposures to market risk is primarily through interest rate risk with only insignificant exposure to other price risks and no
exposure to foreign currency risk.
Credit risk is the risk that a contracting entity will not complete its obligations under a financial instrument and cause us to make a financial
loss. We have exposure to credit risk on some financial assets included in our balance sheet. To help manage this risk:
Receivables consist of a large number of customers, spread across the ratepayer, business and government sectors. Credit risk
associated with the Council's financial assets is minimal because the main debtor is secured by a charge over the rateable property.
Interest rate risk refers to the risk that the value of a financial instrument or cash flows associated with the instrument will fluctuate due to
changes in market interest rates. Our interest rate liability risk arises primarily from long term loans and borrowings at fixed rates which
exposes us to fair value interest rate risk. Cash flow interest rate risk is the risk that the future cash flows of a financial instrument will
fluctuate because of changes in market interest rates. Council has minimal exposure to cash flow interest rate risk through its cash and
deposits that are at floating rate.
Investment of surplus funds is made with approved financial institutions under the Local Government Act 1989 . We manage interest rate
risk by adopting an investment policy that ensures:
There has been no significant change in the Council's exposure, or its objectives, policies and processes for managing interest rate risk or
the methods used to measure this risk from the previous reporting period.
The maximum exposure to credit risk at the reporting date to recognised financial assets is the carrying amount, net of any provisions for
impairment of those assets, as disclosed in the balance sheet and notes to the financial statements. Council does not hold any collateral.
Liquidity risk includes the risk that, as a result of our operational liquidity requirements or we will not have sufficient funds to settle a
transaction when required, we will be forced to sell a financial asset at below value or may be unable to settle or recover a financial asset.
There has been no significant change in Council's exposure, or its objectives, policies and processes for managing liquidity risk or the
methods used to measure this risk from the previous reporting period.
With the exception of borrowings, all financial liabilities are expected to be settled within normal terms of trade. Details of the maturity
profile for borrowings are disclosed at Note 29.
Notes to the Financial Report
The Council's principal financial instruments comprise cash assets, term deposits, receivables (excluding statutory receivables), payables
(excluding statutory payables) and bank borrowings. 'Details of the significant accounting policies and methods adopted, including the
criteria for recognition, the basis of measurement and the basis on which income and expenses are recognised, in respect of each class of
financial asset, financial liability and equity instrument is disclosed in Note 1 of the financial statements. 'Risk management is carried out
by senior management under policies approved by the Council. These policies include identification and analysis of the risk exposure to
Council and appropriate procedures, controls and risk minimisation.
Financial Instruments
(a) Objectives and policies
For the Year Ended 30 June 2015
Cardinia Shire Council
2014/2015 Financial ReportNotes to the Financial Report
For the Year Ended 30 June 2015
Note 37
e) Fair value
(f) Sensitivity disclosure analysis
- A parallel shift of + 1% and -2% in market interest rates (AUD) from year-end rates of 2.3% - 3.51%.
Page 37
Taking into account past performance, future expectations, economic forecasts, and management's knowledge and experience of the
financial markets, Council believes the following movements are 'reasonably possible' over the next 12 months:
These movements will not have a material impact on the valuation of Council's fianancial assests and liabilities, nor will they have a
material impact on the results of Council's operations.
Council's financial assets and liabilities are not valued in accordance with the fair value hierarchy , Council's financial assets and liabilities
are measured at amortised cost.
Unless otherwise stated, the carrying amount of financial instruments reflect their fair value
Fair value hierarchy
Financial Instruments (Continued)
Cardinia Shire Council
2014/2015 Financial Report
Note 38 Related party transactions
(i) Responsible Persons
Councillors Mayor Leticia Wilmot
Deputy Mayor Graeme Moore
Councillorr Brett Owen
Councillor George Blenkhorn
Councillor Collin Ross
Councillor Tania Baxter
Councillor Kate Lempriere
Councillor Jodie Owen
Councillor David Young
Chief Executive Officer Garry McQuillan
(ii) Remuneration of Responsible Persons
2015 2014No. No.
2 3
5 4
- -
1 2
1 -
$340,000 - $349,999 1 1
10 10
$'000 $'000
681 681
(iii)
The number of Senior Officers other than the Responsible Persons, are shown below in their relevant income bands:
2015 2014
No. No.
2 1
5 4
9 8
2 6
2 2
- 1
- -
- -
- -
- -
1 3
1 -
1 1
- -
- -
1 * -
24 26
3,793 3,937
* Includes payout of employee entitlements
$250,000 - $259,999
$270,000 - $279,999
$230,000 - $239,999
$240,000 - $249,999
A Senior Officer other than a Responsible Person, is an officer of Council who:
a) has management responsibilities and reports directly to the Chief Executive; or
$200,000 - $209,999
$210,000 - $219,999
$220,000 - $229,999
b) whose total annual remuneration exceeds $136,000
$160,000 - $169,999
$170,000 - $179,999
$180,000 - $189,999
$190,000 - $199,999
< $136,000
Income Range:
$136,000 - $139,999
$140,000 - $149,999
$150,000 - $159,999
Page 38
$260,000 - $269,999
Total Remuneration for the reporting year for Senior Officers included above, amounted to
Notes to the Financial ReportFor the Year Ended 30 June 2015
Names of persons holding the position of a Responsible Person at the Council at any time
during the year are:
The numbers of Responsible Persons whose total remuneration from Council and any
related entities, excluding retirement benefits, fall within the following bands:
Senior Officers Remuneration
$20,000 - $29,999
$30,000 - $39,999
$40,000 - $49,999
$60,000 - $69,999
Total Remuneration for the reporting year for Responsible Persons included above
amounted to:
$50,000 - $59,999

Note 39 Events occurring after balance date
No matters have occurred after balance date that require disclosure in the financial report.
Page 39

Cardinia Shire Council
2014/2015 Financial Report
Date : 21st September 2015
Councillor
Date : 21st September 2015
20 Siding Avenue, Officer
Councillor
Date : 21st September 2015
20 Siding Avenue, Officer
Chief Executive Officer
Date : 21st September 2015
20 Siding Avenue, Officer
Page 40
Certification of the Financial Statements
In my opinion the accompanying financial statements have been prepared in accordance with the Local Government Act 1989 , the Local Government
(Planning and Reporting) Regulations 2014 , Australian Accounting Standards and other mandatory professional reporting requirements.
Jo Harris - CPA
Chief Finance Officer
20 Siding Avenue, Officer
In our opinion the accompanying financial statements present fairly the financial transactions of Cardinia Shire Council for the year ended 30 June
2015 and the financial position of the Council as at that date.
As at the date of signing, we are not aware of any circumstances which would render any particulars in the financial statements to be misleading or
inaccurate.
We have been authorised by the Council and by the Local Government (Planning and Reporting) Regulations 2014 to certify the financial statements
in their final form.
George Blenkhorn
Kate Lempriere
Garry McQuillan