Embed Size (px)
Citation preview
Cardiac OutputBy
Dr. Sumaira Iqbal

Learning Objectives
By the end of lecture, student should be able to
Define cardiac output
Define cardiac index
Enumerate factors affecting cardiac output
Explain the regulation of cardiac output
Comment on hypoeffective and hypereffective heart
Outline te causes of low and high cardiac output states
State the methods of measurement of cardiac output
Explain the oxygen fick’s method.

Definition
Cardiac output is the quantity of blood
pumped into the aorta each minute by the
heart. This is also the quantity of blood that
flows through the circulation.
Also known as minute volume
CO = SV x HR

Cardiac Index
Cardiac output per square meter of body surface area.
Average cardiac index for adults is about 3 L/min/m2 of body surface area.
Effect of Age on Cardiac Output

Cardiac Index

Stroke Volume
Amount of blood pumped out of each
ventricle per beat; also called ‘Systolic
discharge’.
S.V = E.D.V - E.S.V
= 140 ml - 60 ml
S.V = 80 ml/beat in resting man.

Factors Determining Cardiac Output
PRELOAD = Initial stretching of the cardiac myocytes prior to contraction (related to sarcomere length)
AFTERLOAD = “load” that the heart must eject blood against (related to aortic pressure)
CONTRACTILITY (INOTROPY) = Inherent ability of myocardial cells to develop force at given muscle lengths (related to Calcium)
HEART RATE autonomic nervous system


Physiological variations of cardiac output
Age: Cardiac output is more in adults than in children
because blood volume is more.
Gender: cardiac output is more in male than females.
Altitude: cardiac output increases at high altitude
places.
Pregnancy: cardiac output increases during pregnancy
Exercise: cardiac output increases during exercise
Emotions: cardiac output increases during emotional
expressions.

Cardiac Output
REGULATION OF STROKE VOLUME-- Regulated by three variables:
a. End diastolic volume (EDV): volume of blood in the ventricles at
the end of diastole.
Sometimes called preload
Stroke volume increases with increased EDV.
b. Total peripheral resistance: Frictional resistance in the arteries.
Inversely related to stroke volume
Called after load
c. Contractility: strength of ventricular contraction

Cardiac Output
1. Stroke volume increases with contractility.
Ejection fraction (EF) – percentage of the EDV
that is ejected per cardiac cycle.
Stroke volume = EDV – ESV
EF% = (SV / EDV) x 100
Normal ejection fraction is about 50-65%.
RELATIONSHIP WITH BLOOD PRESSURE
As Cardiac output is made up of heart rate and stroke
volume - at rest these are relatively constant.
With exercise the heart beats faster – more blood is pumped out with each beat contributing to a rise in
BP.
Changes in the volume of blood within the
cardiovascular system will also affect blood pressure

BP= CO X TPR
BP= SV X HR X TPR
Regulation
Cardiac output is regulated by:
1. Frank Starling Mechanism
2.Stretch on SA node
3.Bainbridge Reflex
MECHANISM OF REGULATION
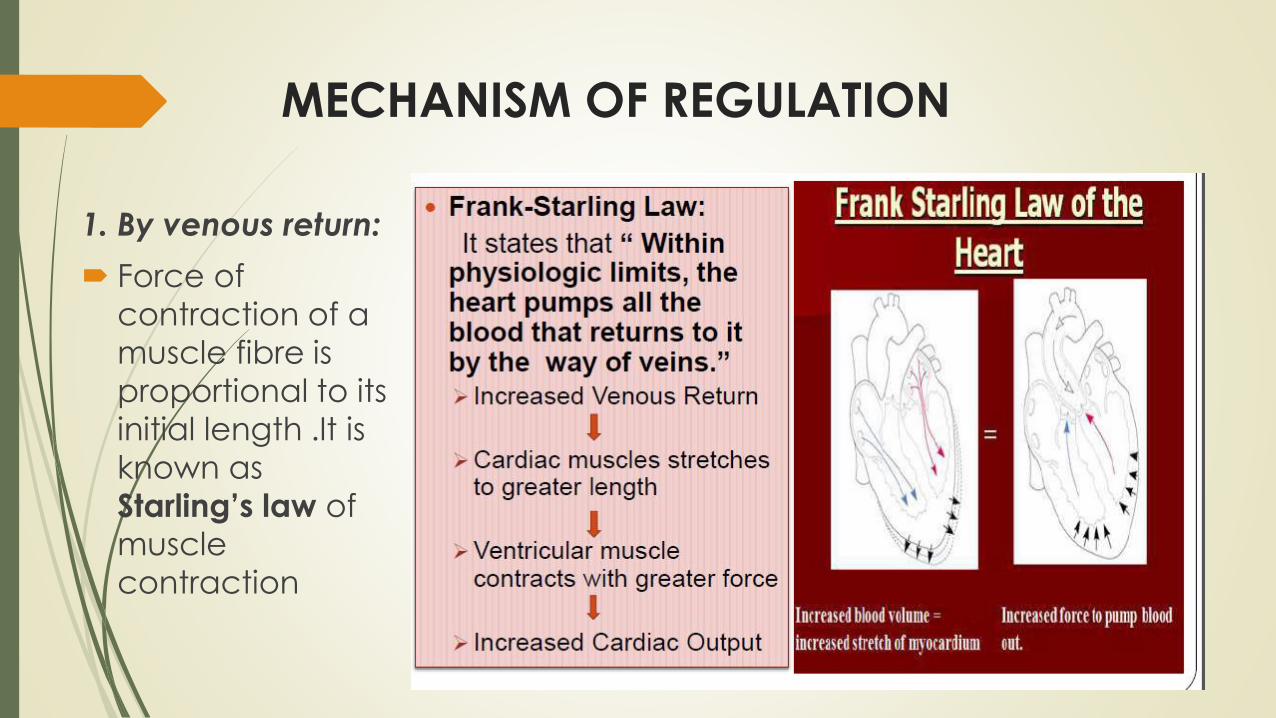
1. By venous return:
Force of
contraction of a
muscle fibre is
proportional to its
initial length .It is
known as
Starling’s law of
muscle
contraction

MECHANISM OF REGULATION
2. By nervous system:
Autonomic nervous system takes a major role in the regulation of
cardiac output.
Whenever sympathetic nervous activity increases e.g. ; during
emotions, exercise etc, it will stimulate both SA node as well as
ventricular myocardium.
This will increase both heart rate as well as force of contraction of
muscles or stroke volume .This will inturn increase cardiac output.
If parasympathetic activity increases as during sleep, it will inhibit
SA node, it will decrease heart rate, this will inturn decrease
cardiac output.

MECHANISM OF REGULATION
3. Hormonal regulation of cardiac output:
Whenever adrenaline level in the blood
increases it will stimulate SA node and
ventricular myocardium. This will increase both
heart rate and stroke volume.
This will inturn increase cardiac output

VENOUS RETURN
End diastolic volume is controlled by factors that affect venous
return:
a. Total blood volume
b. Venous pressure (driving force for blood return)
Veins have high compliance – stretch more at a given pressure
than arteries (veins have thinner walls).
Veins are capacitance vessels – 2/3 of the total blood volume is
in veins.
They hold more blood than arteries but maintain lower pressure.

Controlling Factors
Primary controller
Peripheral factors
Venous return
TPR
If the returning blood does become more than the heart can pump, then the heart becomes the limiting factor that determines the cardiac output

Considering Ohms Law
Flow=Pressure/Resistance
Cardiac Output=Arterial Pressure/Total
Peripheral Resistance

High Cardiac Output: Always caused
by decreased T.P.R.
1.Beri Beri— Vitamin B1 deficiency
2.A-V fistula/shunt
3.Hyperthyroidism (increased Metabolism,
increased Vasodilator substances– decreased
T.P.R)
4.Anemia. (increased Blood Viscosity & Hypoxia
Leads to decreased T.P.R)

Low Cardiac Output
1. Reduced Pumping effectiveness of heart:
Severe myocardial infarction
Severe valvular heart disease
Myocarditis
Cardiac temponade.
2. Decreased Venous Return (decreased EDV):
Decreased blood Volume
Acute venous dilatation (Sudden inactivity of
sympathetic system)
Obstruction to large veins (Rare)

• Limits to the pumping ability of the heart ( plateau)
– CO increases---plateau at 13L/min (2.5 times normal)
max limit under normal conditions

Hypereffective heart
Nervous stimulation
Sympathetic stimulation
Parasympathetic inhibition
Increase the heart rate
Increase the strength of force of contraction
Hypertrophy of the heart muscle
Marathon runners
Nervous stimulation + hypertrophy
Plateau at 30- 40 L/min ( 2½ times normal)

Hypoeffective heart
Factors that decreases the heart's ability to pump blood
Coronary artery blockage, causing a "heart attack"
Inhibition of nervous excitation of the heart
Pathological factors that cause abnormal heart rhythm or rate of heartbeat
Valvular heart disease
Increased arterial pressure against which the heart must pump, such as in hypertension
Congenital heart disease
Myocarditis
Cardiac hypoxia
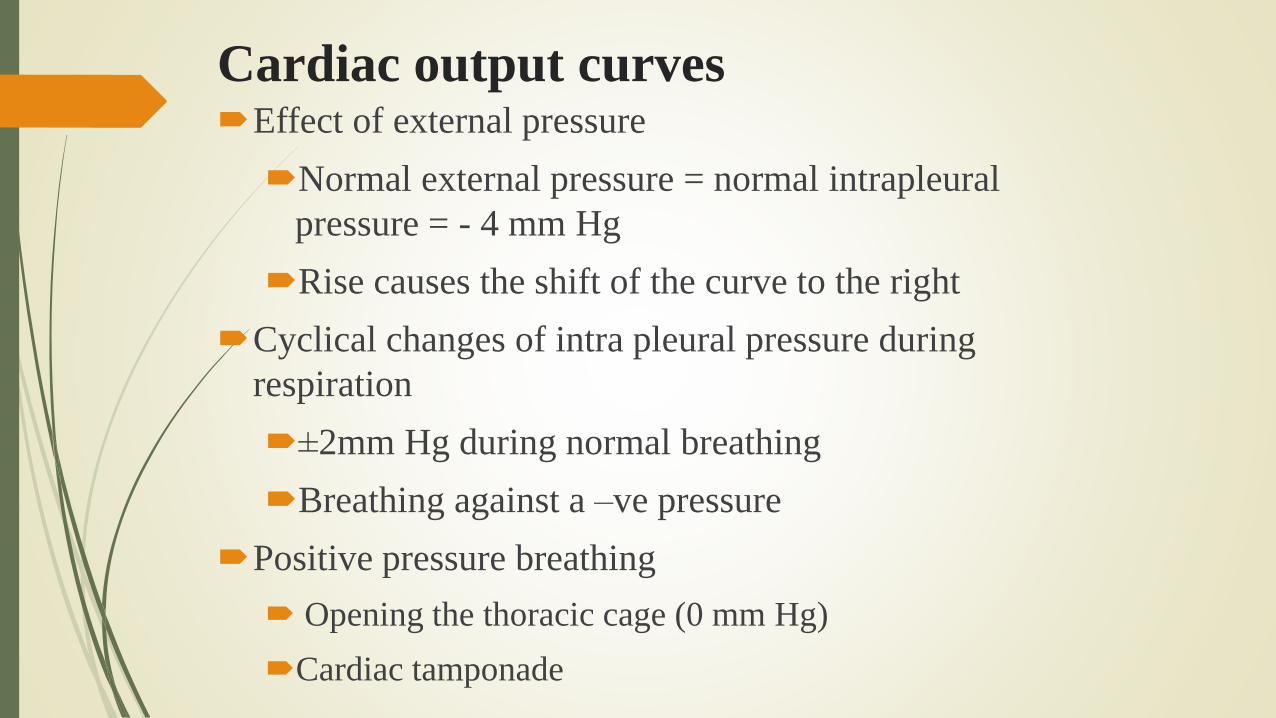
Cardiac output curvesEffect of external pressure
Normal external pressure = normal intrapleural
pressure = - 4 mm Hg
Rise causes the shift of the curve to the right
Cyclical changes of intra pleural pressure during
respiration
±2mm Hg during normal breathing
Breathing against a –ve pressure
Positive pressure breathing
Opening the thoracic cage (0 mm Hg)
Cardiac tamponade


Cardiac output
Equilibrium point
Venous return = cardiac output

Electromagnetic flow meter
Oxygen Fick Method
CO = (O2 consumption / (A-V O2 difference)
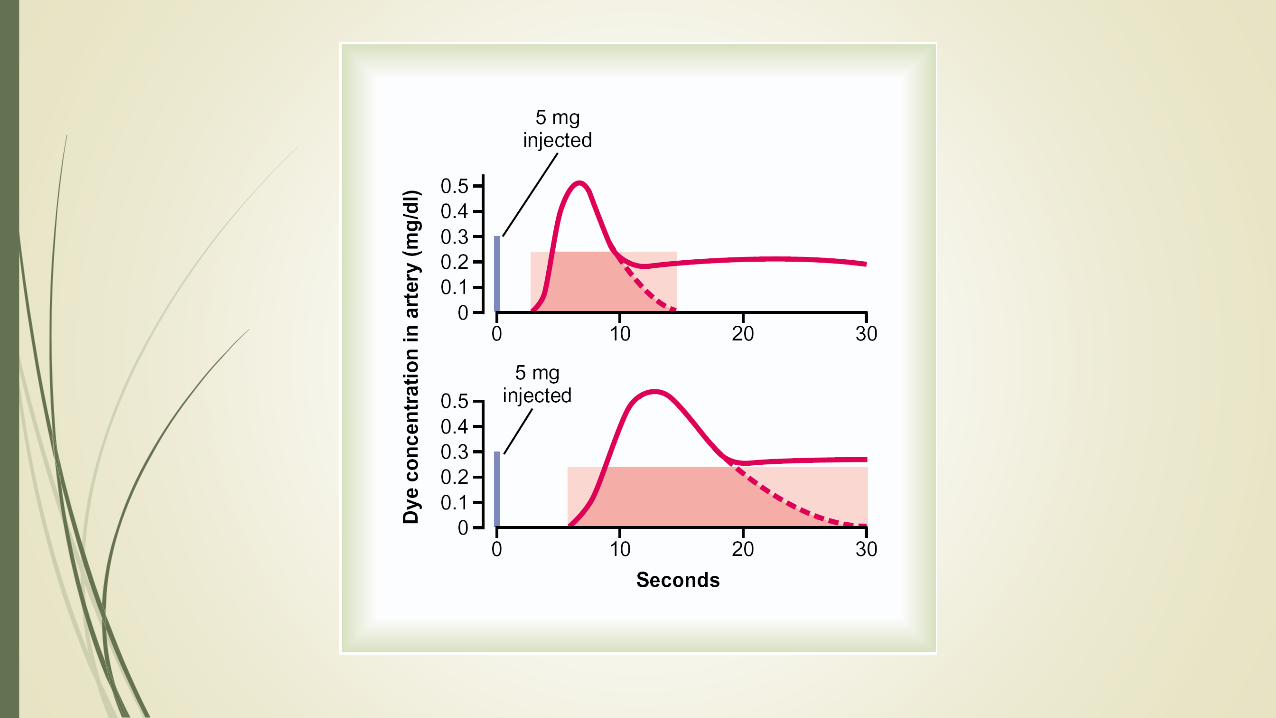
Indicator dilution (dye such as cardiogreen)
Thermal dilution
Measurement of Cardiac Output


Measurement of Cardiac Output
Oxygen Fick Principle

Measurement of Cardiac Output
Indicator dilution method

Thank you