Embed Size (px)
Citation preview

CARD FRAUD MANAGEMENT SYSTEMS
Technology Analysis Abstract*
November 2012
CEB TOWERGROUP
RETAIL BANKING & CARDS PRACTICE
Vendor Assessment & Quantitative Teams
* For full copies please contact Peter Johnson at CEB TowerGroup
Brian Riley Senior Research Director, Retail Banking & Cards Practice
1

2 © 2012 The Corporate Executive Board Company. All Rights Reserved.
Retail Banking and Cards Practice
Executive Director
Aaron Kissel
Managing Director
Joanne Pollitt
Senior Research Director
Brian Riley
Quantitative Insight Team
Project Manager
Carolina Valencia
Research Analyst
Ben Fieselmann
Vendor Assessment Team
Project Manager
Magda Rolfes
Research Analyst
Helen McCann
COPIES AND COPYRIGHT
As always, members are welcome to an unlimited number of
copies of the materials contained within this handout.
Furthermore, members may copy any graphic herein for their own
internal purpose. The Corporate Executive Board Company
requests only that members retain the copyright mark on all pages
produced. Please contact your Member Support Center at
+1-866-913-6450 for any help we may provide.
The pages herein are the property of The Corporate Executive
Board Company. Beyond the membership, no copyrighted
materials of The Corporate Executive Board may be reproduced
without prior approval.
LEGAL CAVEAT
CEB TowerGroup has worked to ensure the accuracy of the
information it provides to its members. This report relies upon data
obtained from many sources, however, and CEB TowerGroup cannot
guarantee the accuracy of the information or its analysis in all cases.
Furthermore, CEB TowerGroup is not engaged in rendering legal,
accounting, or other professional services. Its reports should not be
construed as professional advice on any particular set of facts or
circumstances. Members requiring such services are advised to
consult an appropriate professional. Neither The Corporate Executive
Board Company nor its programs are responsible for any claims or
losses that may arise from a) any errors or omissions in their reports,
whether caused by CEB TowerGroup or its sources, or b) reliance
upon any recommendation made by CEB TowerGroup.

3 © 2012 The Corporate Executive Board Company. All Rights Reserved.
ANALYSIS SCOPE & METHODOLOGY
In response to feedback from our membership, CEB TowerGroup and Corporate Executive Board developed this technology analysis product
to identify key components of a technology investment decision and effectively compare vendor technology products. Our methodology comes
from the knowledge that investment decisions center around the benefit to the individual and enterprise of a technology rather than the
feature set alone.
This analysis is tailored to reflect the needs of the end user, in this case the card fraud management system user, to diagnose the technology
attributes particular to a firm, and to effectively identify vendor products that align with the firm’s needs. To that end, CEB TowerGroup
conducted a series of interviews and surveys with financial services executives, industry experts, and vendors regarding card fraud
management technology. The results of this research formed the basis of our anatomy and informed the proprietary five point rating system
on which we scored individual products.
CURRENT MARKET & FUTURE INVESTMENT
Rising consumer confidence swells payments volumes and increases demand on fraud management systems. US Consumer Sentiment
rose to 68.7 in 2012, the highest it’s been since 2008. As customers’ confidence in economic spending conditions has increased, payment
volumes in the top four credit and charge card companies have also increased by up to 16% from 2009 to 2011. This growth is putting new
strains on card fraud management systems, forcing executives to reconsider their fraud management strategies.
New innovations in card usage are accompanied by new risks. The number of card not present transactions, stimulated by the increase in
mobile and internet banking transactions, will have increased tenfold between 2009 and 2013. Thirty-four percent of fraud-related losses are
already attributed to card not present, making this the leading type of global fraud loss. As this type of fraud increases, issuers will continue
to invest in fraud mitigation tools to shield against new risks.
Investment in fraud management expected to increase most in developing markets. IT Spend for card products in established markets will
remain relatively flat through 2016, but spending is expected to increase by a CAGR of more than 7% in Asia and Latin America. Meanwhile,
emerging technologies in the realms of product improvement, performance optimization and operational enhancement are expected to effect
a major shift in the industry’s methods of fraud management.
EXECUTIVE SUMMARY

4 © 2012 The Corporate Executive Board Company. All Rights Reserved.
VENDOR LANDSCAPE & PRODUCT RANKINGS
CEB TowerGroup identified vendors for this analysis based on expert opinion, product maturity, size of installations and technological innovation.
This technology analysis includes ACI Worldwide, Alaric, BPC Technologies, FICO, NICE Actimize, Retail Decisions, SAS, and Tieto Corporation.
Please note that this analysis compares software platforms only. CEB TowerGroup included profiles of selected Service Models to illustrate how
operational enhancements can add depth to platform offerings and recognize that not all FSIs are inclined to manage their software requirements.
By combining our qualitative and quantitative data from interviews and surveys of industry experts, financial institutions, and vendors, CEB
TowerGroup identified 22 attributes that define a “best-in-class” card fraud management technology. These attributes are grouped into four
categories that highlight a firm’s user, customer, and enterprise needs. Product rankings are based on our proprietary five point rating scale for
each of the 22 “best-in-class” attributes. The top vendors were designated as best-in-class performers based on their composite scores in each of
the technology categories below.
BEST-IN-CLASS TECHNOLOGY CATEGORIES
Financial services executives investing in Card Fraud Management technology should use the Card Fraud Management Systems Diagnostic Anatomy on
page 21 to select the vendor that best aligns with their firm’s needs and business objectives.
• FRAUD ANALYTIC TOOLS includes those attributes that provide metrics to card issuers that enable fraud detection, offer insight into risk, and help
shield against loss to the FSI.
Leaders are ACI Worldwide, FICO, and SAS (in alphabetical order)
• ENTERPRISE OPERATIONS includes those attributes that affect the comprehensive handling of an account and overall customer exposure across
other retail banking products.
Leaders are ACI Worldwide, FICO, and NICE Actimize (in alphabetical order)
• WORKFLOW MANAGEMENT includes those attributes that help card issuers effectively process work by streamlining account and transaction
flows, deploying operational strategies, and bringing accounts to a final disposition.
Leaders are ACI Worldwide, FICO, and NICE Actimize (in alphabetical order)
• ENTERPRISE SUPPORT includes those attributes that influence the enterprise’s tactical fit and strategic alignment with the vendor.
Leaders are ACI Worldwide, FICO, and SAS (in alphabetical order)
EXECUTIVE SUMMARY

Source: CEB TowerGroup Research
Mission Statement: CEB
TowerGroup technology
analysis process provides a
customer-driven,
transparent, and unbiased
review designed to drive
informed business decisions.
Current Market: Provides a view
of industry and customer changes,
and best practices for technology
investment and implementation.
Future Investment: Forecasts IT
spending and identifies emerging
technologies and innovations.
Vendor Landscape: Provides an
overview of key vendors, product
features, and market position.
Product Rankings: Highlights
best-in-class attributes and shows
a comparative perspective of
leading products.
Technology Analysis Presentation Roadmap
Current Market
Future Investment
Vendor Landscape
Product Ranking
Market Drivers:
Assess changes in the
industry and customer
behavior
Spending Forecasts:
Benchmark global Card
Fraud Management IT
spending in key
technology areas
List of Players: Identify
key technology firms
and their products
“Best-in-Class” Products:
See the top products
based on our anatomy
categories
Case Study:
Learn how a leading
bank implemented a
new Card Fraud
Management system to
transfer to a single
platform
Emerging Technology
Landscape:
Pinpoint emerging
technologies and
innovations
Diagnostic Anatomy:
Choose your investment
priorities with our
proprietary framework
Ranking Methodology:
Review the key
components of an
investment decision
Feature Audit:
Compare the relative
feature offerings by
vendors
Vendor Profiles:
Understand the key
differentiators between
products
TECHNOLOGY ANALYSIS OVERVIEW
5 © 2012 The Corporate Executive Board Company. All Rights Reserved.

6 © 2012 The Corporate Executive Board Company. All Rights Reserved.
Current Market Future
Investment
Vendor
Landscape Product Rankings

EVEN IN A RECESSION, THE CARD BUSINESS STILL GROWS
Although consumer
confidence hit a low point in
2011, customers are growing
more confident, so US
payment volumes are
increasing.
Customer sentiment was at its
all-time low at the end of 2011
with 40.9 US Customer
Sentiment, but customers
bounced back in 2012 raising
the US Consumer Sentiment to
68.7, the highest it’s been since
2008.
As customers’ confidence in
economic spending conditions
has increased, payment volumes
in the top four credit and
charge card companies also
increased by up to 16% (Visa)
from 2009 to 2011.
7 © 2012 The Corporate Executive Board Company. All Rights Reserved.
Source: US Consumer Sentiment Index Conference
Board, Payments Source
US Consumer Sentiment Index
Indexed at Year 1985=100, 2000 – 2012
95.2
40.9
68.7
20
40
60
80
100
120
140
Q1 2
000
Q1 2
001
Q1 2
002
Q1 2
003
Q1 2
004
Q1 2
005
Q1 2
006
Q1 2
007
Q1 2
008
Q1 2
009
Q1 2
010
Q1 2
011
Q1 2
012
$1,934 $1,752 $1,860
$2,039
2008 2009 2010 2011
Discover* American Express
MasterCard Visa
US Annual Credit and Charge Card Payment Volumes
In US$ Billions, 2008-2011

1.2
3
5.6
9.4
14
2009 2010 2011 2012P 2013P
8 © 2012 The Corporate Executive Board Company. All Rights Reserved.
NEW ENTRY POINTS BRING ADDITIONAL RISKS
As issuers empower users
with innovative ways to use
their cards, new risks emerge
in the card fraud industry.
In 2011, fraud rates hit .87%
when a card was not present,
and were only .05% when the
card was present. As card not
present fraud increases, issuers
will continue to invest in fraud
mitigation tools to shield against
new risks.
As more people use the internet
for online banking, online
transactions are expected to
increase by a multiple of 1.5 by
2013.
Similarly, the number of mobile
banking transactions in 2013
will skyrocket to over 10 times
the number of mobile
transactions in 2009.
23.3
26.8 30
33.3 35
2009 2010 2011 2012P 2013P
US Online Banking Channel Growth
Billions of Transactions, 2009-2013P
US Mobile Banking Channel Growth
Billions of Transactions, 2009-2013P
1.5X 10.7X
Source: CEB TowerGroup
Card Present vs. Card Not Present Fraud Rates
Percentage of Transactions, 2006-2011
1.10%
1.30%
1.10%
0.90% 0.88% 0.87%
0.09% 0.08% 0.08% 0.06% 0.05% 0.05%
2006 2007 2008 2009 2010 2011
Card Not Present Card Present
=0.82%

22%
Lost &
Stolen
9 © 2012 The Corporate Executive Board Company. All Rights Reserved.
CARD FRAUD EVOLVES THROUGH MULTIPLE CHANNELS
Financial institutions
experienced multiple types
of fraud within the past year,
and card not present causes
fraud rates to skyrocket.
Thirty-four percent of losses are
now attributed to card not
present due to the increase in
mobile and internet banking
transactions. This has made card
not present the leading type of
global fraud loss.
As mobile payments continue to
develop, almost 92% of
financial institutions anticipate a
change in their fraud strategies.
Q: As mobile payments start to develop, do you
anticipate a change in your fraud strategies?
Percentage of Respondents, 2012
Source: CEB TowerGroup, CEB TowerGroup
Fraud User Survey 2012
31%
Counterfeit
Global Fraud Losses by Type
Percentage of Respondents, 2011
13%
Other
34%
Card Not
Present
91.7%
Yes
8.3%
No

10 © 2012 The Corporate Executive Board Company. All Rights Reserved.
INVESTMENT IN FRAUD SYSTEMS DECREASES LOSSES
As the majority of firms only
have somewhat effective
fraud controls, firms are
looking to enhance their
fraud systems.
Sixty-six percent of firms say
that their anti- fraud security
controls are somewhat effective,
only 10% say they are
effective, and 18% think they
have ineffective fraud controls.
When asked to define the
changes made at their firm that
contributed to a decrease in
losses, 82% of executives said
they enhanced their fraud
monitoring system.
Source: 2012 Faces of Fraud Survey (ISMG), 2012 Payments Fraud Survey Bank of Dallas
82%
73%
64%
46%
46%
Enhanced FraudMonitoring System
Staff Training& Education
Enhanced InternalProcedures
Adopted or IncreasedUse of a Financial
Service
EnhancedAuthentication
Methods
Changes Made Contributing to Decrease in Losses
Percentage of Respondents, 2012
66%
Somewhat
Effective
12%
Not Effective
10%
Very Effective/
Effective
6%
Unsure
Current Effectiveness of Card Fraud
Percentage of Respondents, 2012

Challenges Technology Enhancement Operational Impact
• Disjointed homegrown debit
card fraud management
technology inhibits full view of
customer transactions across the
enterprise.
• New debit card fraud
management technology easily
integrates with other platforms,
allowing fraud managers to
view all customer transactions
across the enterprise.
Greater customer visibility equips
fraud managers with the necessary
perspective to better anticipate and
identify fraud.
• Three discrete fraud
management systems exist for
credit card, debit card, and
nonmonetary transactions,
preventing cross-system
improvement
• Consolidated fraud management
systems enable systems to learn
from each other, facilitating
mutual cross-system
improvement.
Integrated fraud management
capabilities eliminate redundancies
and increase sophistication of fraud
identification processes.
• IT intervention is required for all
rule additions and modifications,
slowing bank’s response to the
ever-changing landscape of
fraud.
• New fraud management system
pushes operational controls to
fraud managers, eliminating
delays and permitting real-time
new rule implementation.
Improved agility enables fraud
management system to adapt to
changing trends and quickly stifle new
methods of fraud.
11 © 2012 The Corporate Executive Board Company. All Rights Reserved.
Source: CEB TowerGroup, Standard Bank, FICO.
CASE STUDY: TECHNOLOGY EMPOWERS THE FRAUD MANAGER
Standard Bank uses
improved technology and
enhanced training to
transform the role of the
fraud manager.
Standard Bank invests in a new
card fraud management
technology solution to increase
fraud managers’ visibility,
decrease the required degree
of low-skill manual intervention,
and improve the fraud
manager’s ability to react and
adapt to changing patterns in
fraud.
Standard bank is a publicly traded company headquartered in Johannesburg, South Africa. It operates in 18
countries on the African continent and is the largest African bank by assets and earnings. Its three main
pillars of business are Personal & Business Banking, Corporate & Investment Banking, and Wealth & Liberty.
2011 Earnings: $1.9 billion 2011Assets: $185 billion Employees: 52,000

12 © 2012 The Corporate Executive Board Company. All Rights Reserved.
A comprehensive and
standardized training
curriculum equips the fraud
manager to fully optimize
the new technology,
generating quantifiable
operational results.
Improved Fraud
Detection
Source: CEB TowerGroup, Standard Bank, FICO.
Effective implementation
that supports best practice
techniques coupled with
continuous knowledge
transfer from world class
fraud experts enables
Standard Bank to achieve
impressive results.
DEMONSTRATED RESULTS
CASE STUDY: TRAINING ENRICHES OPERATIONAL SKILLS
10%
65%
Old System
New System
Key Results
48% Reduction of Net Fraud
Losses by start of Phase 2
67% reduction in Net Fraud
over 18 months
Reduced fraud transactions per
case by 68%
86% increase in operational
productivity
Training Curriculum
• Core banking system functionality
• Volume sensitivity
• Customer engagement techniques
• Effective Metrics
• Targets and expectations
• Key deliverables of the
environment
Standard Bank collaborates
with a technology vendor to
produce a comprehensive
training curriculum.
Standard Bank and
vendor implemented
a one year skills
transfer session
Rise of highly skilled fraud
managers leads to operational
results.

Current Market Future
Investment
Vendor
Landscape Product Rankings
13

REGIONAL FORECAST OF CARD FRAUD MANAGEMENT SPENDING
IT Spend for card products in
established markets will
remain relatively flat
through 2016.
Regional Spend
(In millions of USD) 2011 E 2012 P 2013 P 2014 P 2015 P 2016 P CAGR
North America $794 $794 $799 $800 $806 $816 0.5%
Europe $444 $453 $460 $463 $465 $466 1.0%
Asia Pacific $379 $416 $455 $491 $528 $564 8.3%
Latin America and the
Caribbean $98 $106 $114 $122 $130 $137 7.0%
Middle East and Africa $31 $33 $34 $35 $36 $36 3.2%
Source: CEB TowerGroup research. Note: E indicates estimated values; P indicates predicted values; CAGR: compound annual growth rate.
Region Definitions
North America USA and Canada
Europe Includes Western,
Central and
Eastern Europe
Asia Pacific Includes Australia
and New Zealand
Latin America
and
Caribbean
Includes Mexico
Middle East
and Africa
Includes Turkey
and all African
and Middle Eastern
countries
$0
$100
$200
$300
$400
$500
$600
$700
$800
$900
2011 E 2012 P 2013 P 2014 P 2015 P 2016 P
North America EuropeAsia Pacific
$0
$20
$40
$60
$80
$100
$120
$140
$160
2011 E 2012 P 2013 P 2014 P 2015 P 2016 P
Latin America and the Caribbean Middle East and Africa
Developing regions are
expected to require larger
investments in Card Fraud Risk
Management IT spend,
particularly in Latin America
and the Asia Pacific, as those
markets grow.
14 © 2012 The Corporate Executive Board Company. All Rights Reserved.
Regional Forecast of Card Fraud Management Technology Spending
In Millions USD, 2011(E) – 2015(P)

15 © 2012 The Corporate Executive Board Company. All Rights Reserved.
EMERGING TECHNOLOGY LANDSCAPE IN CARD FRAUD
CEB TowerGroup expects
new capabilities and
functionalities to reflect a
major shift in the industry’s
fraud management.
Technology
State
ROI
Potential
Market-Ready In Pilot
Low
High
Product Improvement
technologies include:
• Customer Alerts
• Real Time Transaction
Control
Performance Optimization
technologies include:
• Channel Specific Coverage
• Integration of External Data
• Biometrics
• Voice Printing
• Device Tracking
Operational Enhancement
technologies include:
• Enterprise Fraud
Management
• Mobile Payment Controls
Enterprise Fraud
Management
Customer Alerts
Real Time Transaction
Control
Integration of
External Data
Channel Specific
Coverage Biometrics
Voice Printing
Device
Tracking
Mobile
Payment
Controls
Definitions
• ROI Potential: Measures the
relative returns an institution can
expect to receive from an
investment in the technology
• Technology State: Measures
the technology’s level of
development
• User Impact: Measures the
level of benefit the technology
will have on the portfolio
management user
Minimal
Moderate
Medium
High
User Impact

16 © 2012 The Corporate Executive Board Company. All Rights Reserved.
LEVERAGING PRODUCT IMPROVEMENT
CEB TowerGroup suggests
that card issuers reconsider
their channel strategies in
order to address the
challenges of authorization,
transaction fraud and
merchant malfeasance. ROI
Potential
Market-Ready In Development
Low
High
Minimal
Moderate
Medium
High
User Impact Product Improvement Matrix
Technology
State
Customer Alerts
Real Time Transaction Control
Key Takeaways from Product Improvement
Definitions
• ROI Potential: Measures the
relative returns an institution can
expect to receive from an
investment in the technology
• Technology State: Measures
the technology’s level of
development
• User Impact: Measures the
level of benefit the technology
will have on the portfolio
management user
• Improvements outside of the US, such as EMV smart chip cards, will have little-to-no impact to the United
States, which has operated with 100% transaction authorizations for the last 30 years.
• Customer alerts, such as real time or near real time SMS messaging and emailing to confirm transactions
provides a low cost risk enhancement.
• Real time transaction controls provide issuers with the ability to react quickly to fraud challenges in
both the physical and virtual world.
17 © 2012 The Corporate Executive Board Company. All Rights Reserved.
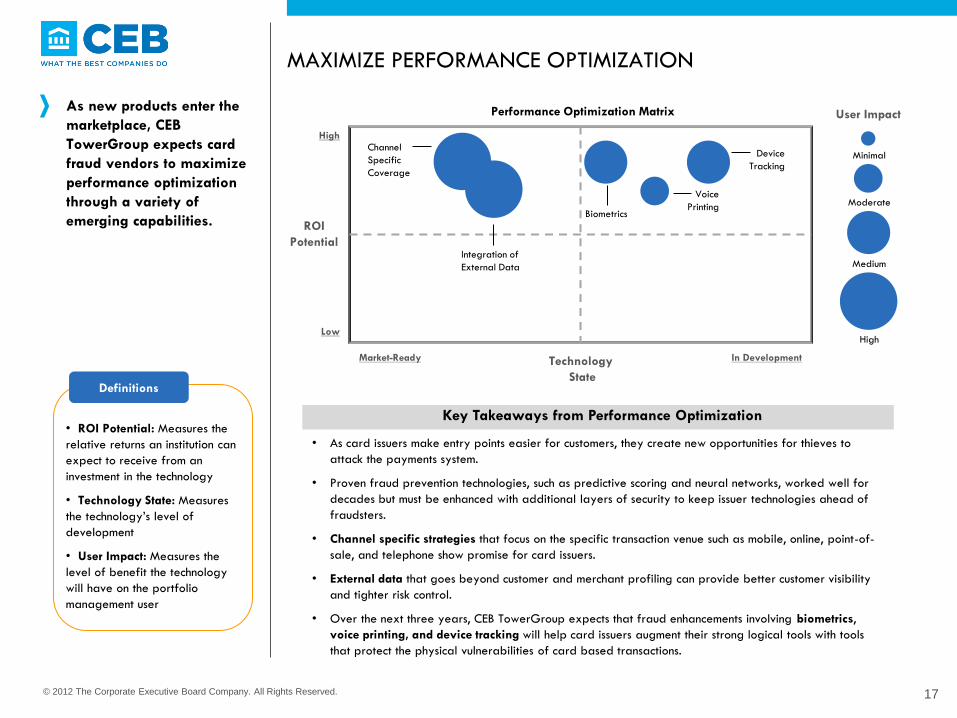
MAXIMIZE PERFORMANCE OPTIMIZATION
As new products enter the
marketplace, CEB
TowerGroup expects card
fraud vendors to maximize
performance optimization
through a variety of
emerging capabilities. ROI
Potential
Market-Ready In Development
Low
High
Minimal
Moderate
Medium
High
User Impact Performance Optimization Matrix
Technology
State
Channel
Specific
Coverage
Integration of
External Data
Key Takeaways from Performance Optimization
Biometrics
Device
Tracking
Voice
Printing
Definitions
• ROI Potential: Measures the
relative returns an institution can
expect to receive from an
investment in the technology
• Technology State: Measures
the technology’s level of
development
• User Impact: Measures the
level of benefit the technology
will have on the portfolio
management user
• As card issuers make entry points easier for customers, they create new opportunities for thieves to
attack the payments system.
• Proven fraud prevention technologies, such as predictive scoring and neural networks, worked well for
decades but must be enhanced with additional layers of security to keep issuer technologies ahead of
fraudsters.
• Channel specific strategies that focus on the specific transaction venue such as mobile, online, point-of-
sale, and telephone show promise for card issuers.
• External data that goes beyond customer and merchant profiling can provide better customer visibility
and tighter risk control.
• Over the next three years, CEB TowerGroup expects that fraud enhancements involving biometrics,
voice printing, and device tracking will help card issuers augment their strong logical tools with tools
that protect the physical vulnerabilities of card based transactions.

18 © 2012 The Corporate Executive Board Company. All Rights Reserved.
FOCUSING ON OPERATIONAL ENHANCEMENT
Card issuers should
anticipate no improvement
from newly mandated EMV
smart cards. Logical controls
remain the strongest
protection layer but they
must be augmented with
stronger physical controls. ROI
Potential
Market-Ready In Development
Low
High
Minimal
Moderate
Medium
High
User Impact Operational Enhancement Matrix
Technology
State
Enterprise Fraud
Management
Key Takeaways from Operational Enhancement
Mobile Payment
Controls
Definitions
• ROI Potential: Measures the
relative returns an institution can
expect to receive from an
investment in the technology
• Technology State: Measures
the technology’s level of
development
• User Impact: Measures the
level of benefit the technology
will have on the portfolio
management user
• Card issuers must continually develop their fraud staff to ensure that high powered software solutions
can address the full features of their capabilities.
• As the card industry deals with saturated markets in high volume countries, cross-selling other financial
service products becomes an essential strategy to protect revenue.
• Cross-selling provides opportunity to maximize customer revenue but brings a higher level of exposure
to issuers, particularly for first party fraud.
• Mobile payments will be adopted slowly in the US, but issuers must prepare for high volume/low value
transactions once they begin to gain traction.
• Card issuers need to consider how the world of payments is evolving, particularly as it affects non-
regulated companies who facilitate transactions and do not typically operate with business disciplines
such as audits, balancing, and financial reserves.

Current
Market
Future
Investment
Vendor
Landscape
Product
Rankings
19

20 © 2012 The Corporate Executive Board Company. All Rights Reserved.
MAPPING THE VENDOR LANDSCAPE
CEB TowerGroup identified vendors for this analysis based on expert opinion, product maturity, size of installations, and vendor stability.
We included 8 large platform
vendors and profiled 3 large
service models. The service
models are not ranked in this
technology analysis because
they enhance platform software
with additional capabilities such
as analytics. Platform Software
ACI Worldwide Proactive Risk
Manager
Alaric Fractals
BPC Technologies
SmartGuard
FICO Falcon Fraud Manager 6
NICE Actimize Actimize Card
Fraud
Retail Decisions ReD PRISM
SAS SAS Fraud
Management
Tieto Corporation
Card Suite Fraud
Management
Service Model
First Data First Data
Fraud Management
FIS FIS Card Fraud Management
TSYS TSYS Fraud
Management
Vendor: Product:
Vendor: Product:
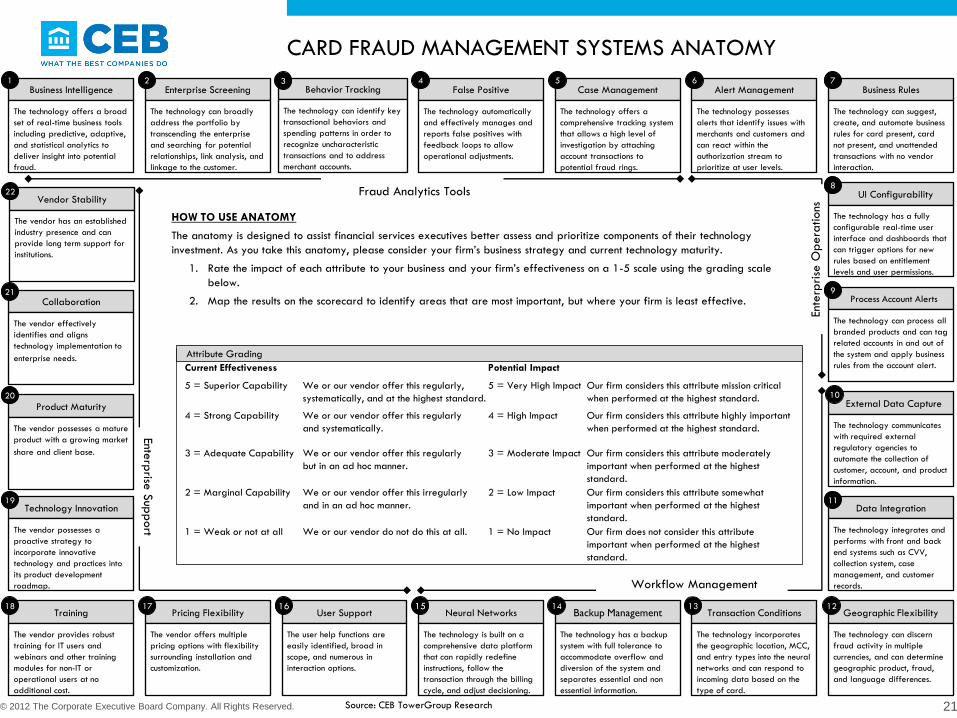
CARD FRAUD MANAGEMENT SYSTEMS ANATOMY
21 © 2012 The Corporate Executive Board Company. All Rights Reserved.
Business Intelligence
The technology offers a broad
set of real-time business tools
including predictive, adaptive,
and statistical analytics to
deliver insight into potential
fraud.
Enterprise Screening
The technology can broadly
address the portfolio by
transcending the enterprise
and searching for potential
relationships, link analysis, and
linkage to the customer.
Behavior Tracking
The technology can identify key
transactional behaviors and
spending patterns in order to
recognize uncharacteristic
transactions and to address
merchant accounts.
False Positive
The technology automatically
and effectively manages and
reports false positives with
feedback loops to allow
operational adjustments.
Case Management
The technology offers a
comprehensive tracking system
that allows a high level of
investigation by attaching
account transactions to
potential fraud rings.
Alert Management
The technology possesses
alerts that identify issues with
merchants and customers and
can react within the
authorization stream to
prioritize at user levels.
Business Rules
The technology can suggest,
create, and automate business
rules for card present, card
not present, and unattended
transactions with no vendor
interaction.
6 5 4 3 2 1
UI Configurability
The technology has a fully
configurable real-time user
interface and dashboards that
can trigger options for new
rules based on entitlement
levels and user permissions.
Process Account Alerts
The technology can process all
branded products and can tag
related accounts in and out of
the system and apply business
rules from the account alert.
External Data Capture
The technology communicates
with required external
regulatory agencies to
automate the collection of
customer, account, and product
information.
Geographic Flexibility
The technology can discern
fraud activity in multiple
currencies, and can determine
geographic product, fraud,
and language differences.
9
10
7
8
Transaction Conditions
The technology incorporates
the geographic location, MCC,
and entry types into the neural
networks and can respond to
incoming data based on the
type of card.
Neural Networks
The technology is built on a
comprehensive data platform
that can rapidly redefine
instructions, follow the
transaction through the billing
cycle, and adjust decisioning.
User Support
The user help functions are
easily identified, broad in
scope, and numerous in
interaction options.
Pricing Flexibility
The vendor offers multiple
pricing options with flexibility
surrounding installation and
customization.
Training
The vendor provides robust
training for IT users and
webinars and other training
modules for non-IT or
operational users at no
additional cost.
13 15 16 17 18 12
Technology Innovation
The vendor possesses a
proactive strategy to
incorporate innovative
technology and practices into
its product development
roadmap.
Product Maturity
The vendor possesses a mature
product with a growing market
share and client base.
Collaboration
The vendor effectively
identifies and aligns
technology implementation to
enterprise needs.
20
19
21
Fraud Analytics Tools
Enterp
rise S
upp
ort
Source: CEB TowerGroup Research
Workflow Management
Ente
rpri
se O
pera
tions
Current Effectiveness Potential Impact
5 = Superior Capability We or our vendor offer this regularly,
systematically, and at the highest standard.
5 = Very High Impact Our firm considers this attribute mission critical
when performed at the highest standard.
4 = Strong Capability We or our vendor offer this regularly
and systematically.
4 = High Impact Our firm considers this attribute highly important
when performed at the highest standard.
3 = Adequate Capability We or our vendor offer this regularly
but in an ad hoc manner.
3 = Moderate Impact Our firm considers this attribute moderately
important when performed at the highest
standard.
2 = Marginal Capability We or our vendor offer this irregularly
and in an ad hoc manner.
2 = Low Impact Our firm considers this attribute somewhat
important when performed at the highest
standard.
1 = Weak or not at all We or our vendor do not do this at all. 1 = No Impact Our firm does not consider this attribute
important when performed at the highest
standard.
Attribute Grading
HOW TO USE ANATOMY
The anatomy is designed to assist financial services executives better assess and prioritize components of their technology
investment. As you take this anatomy, please consider your firm’s business strategy and current technology maturity.
1. Rate the impact of each attribute to your business and your firm’s effectiveness on a 1-5 scale using the grading scale
below.
2. Map the results on the scorecard to identify areas that are most important, but where your firm is least effective.
Data Integration
The technology integrates and
performs with front and back
end systems such as CVV,
collection system, case
management, and customer
records.
11
Vendor Stability
The vendor has an established
industry presence and can
provide long term support for
institutions.
22
Backup Management
The technology has a backup
system with full tolerance to
accommodate overflow and
diversion of the system and
separates essential and non
essential information.
14

DIAGNOSTIC ANATOMY SCORECARD
Score Your Technology
Needs With the Anatomy
Scorecard.
Financial services executives
should complete the scorecard
using the card fraud
management anatomy
diagnostic tool.
Attribute Categories Alignment Attributes Potential Impact Importance of Improvement
1. Business Intelligence
2. Enterprise Screening
Fraud Analytics 3. Behavior Tracking
Tools 4. False Positive
5. Case Management
6. Alert Management
Enterprise 7. Business Rules
Operations 8. UI Configurability
9. Process Account Alerts
10. External Data Capture
11. Data Integration
Workflow 12. Geographic Flexibility
Management 13. Transaction Conditions
14. Backup Management
15. Neural Networks
16. User Support
17. Pricing Flexibility
Enterprise 18. Training
Support 19. Technology Innovation
20. Product Maturity
21. Collaboration
22. Vendor Stability
22 © 2012 The Corporate Executive Board Company. All Rights Reserved.
Source: CEB TowerGroup Research

DIAGNOSTIC ANATOMY SCORECARD
Map Your Technology
Needs:
Financial services executives
should map their attribute scores
from rating their impact and
effectiveness on the Anatomy
Scorecard.
Po
ten
tial Im
pact
5 =Very High
4 =High
3 = Moderate
2 =Low
1 =No Impact
1 =
Weak
2 =
Margin
al
3 =
Adequate
4 =
Strong
5 =
Superio
r
Current Effectiveness
23 © 2012 The Corporate Executive Board Company. All Rights Reserved.
Source: CEB TowerGroup Research

Feature Definition
Account Verification Value The system can integrate Account Verifications Value (AVV) into the authorization process.
Batch Review Capability The system operates in real time but can provide batch functions for offline processing.
Fraud Early Warning The system has a proactive process to mitigate fraud and to reach out to customers.
Input Channels The system can accept input from POS, ATM, branch systems phone, and online channels.
Internal Fraud Control The system has controls in place to mitigate internal fraud.
MasterCard SecureCode Integration The system can integrate with MasterCard SecureCode cards.
Multichannel Protection The system can add layers of protection based on a transaction source.
PCI Compliant The system conforms to all functions in the Payment Card Industry Data Security Standards and is capable of identifying data breeches.
Track I Name Matching The system can match “name on card” for Card Not Present (CNP) transactions.
Transaction Blocking The system can block potential high risk fraud categories.
Transaction Clearing File The system has day-end review of transaction file to ferret fraud trends.
Traveling Customer Accommodation The system can discern traveling customers for out of region activity.
Verified by Visa Integration The system can integrate with Verified by Visa cards.
Visualization Tools The system can create a summary of key business metrics customized to an organization.
Feature Type Definition
Standard Native Feature The feature is standard to the system and is offered as an out-of-box functionality of the base product.
Premium Native Feature The feature is part of an optional module to the solution developed by the vendor, and is offered for an additional fee on top of the base price.
Emerging Feature The feature is emerging and will be offered in the next 12 months.
Developing Feature The feature is in the development stage and will be offered in the next 12-24 months.
FEATURE AUDIT DEFINITIONS
Source: CEB TowerGroup Research
© 2012 The Corporate Executive Board Company. All Rights Reserved.
Platform Software Only
Feature Definition
Coding The system has a proprietary code that only licensees can customize.
m
m
24

FEATURE AUDIT
Features FICO FALCON
FRAUD MANAGER 6
% of Vendors Offering as
Standard Feature
Inte
gra
tion
– P
latf
orm
Soft
ware
Account Verification
Value l 100%
MasterCard SecureCode
Integration l 100%
Input Channels l 100%
Verified by Visa
Integration l 100%
Fra
ud P
rote
ctio
n– P
latf
orm
Soft
ware
Internal Fraud Control l 100%
Multichannel
Protection l 100%
PCI Compliant l 100%
Transaction Blocking l 100%
Fraud Early Warning l 100%
Anci
llary
Capabilitie
s– P
latf
orm
Soft
ware
Batch Review
Capability l 100%
Track I Name
Matching l 100%
Transaction Clearing
File l 88%
Traveling Customer
Accommodation l 88%
Visualization Tools l 75%
Coding l 100%
Feature Type Definition
Standard Native
Feature
The feature is standard to the system and is
offered as an out-of-box functionality of
the base product.
Premium Native
Feature
The feature is part of an optional module
to the solution developed by the vendor,
and is offered for an additional fee on top
of the base price.
Emerging Feature The feature is emerging and will be
offered in the next 12 months.
Developing Feature The feature is in the development stage
and will be offered in the next 12-24
months.
m
m
25

FALCON FRAUD MANAGER 6 FICO
© 2012 The Corporate Executive Board Company.
All Rights Reserved.
Source: CEB TowerGroup Research, FICO
26
Company Overview:
Founded in 1956, the Fair Isaac Corporation (FICO) is a pioneer in the development and application of decision
management solutions, most notably the FICO Score. FICO’s businesses are organized into 4 primary segments: ubiquitous
scoring services, applications for decision management, tools for decision management, and professional services. Seeking
to expand its service offerings, in 2012 FICO launched the FICO Merchant Monitor Solution, which limits merchant-related
risk to banks and acquirers. It also acquired Entiera, a provider of SaaS-based marketing platforms, and Adeptra, a firm
specializing in mobile customer engagement and risk intervention.
Product Overview:
A pioneer among modern fraud solutions, Falcon Fraud Manager was launched in 1992 with proprietary neural network
models for card payments. Today, Falcon Fraud Manager is an end-to-end enterprise fraud detection and case
management solution capable of supporting any electronic payment or account access channel. The current release, Falcon
6, introduced significant analytic innovations that automate the refinement of detection models through machine learning
and feedback mechanisms.
Product Demonstration Highlights:
• Data Consortium: FICO manages a data consortium of 2.5 billion active payment card accounts. The data consortium
enables customers both small and large to benefit from the experiences of their peers and enables FICO to build
effective detection models with a highly controlled false positive rate. The predictive analytic models based on the
consortium data offer the industry’s largest test bed of card production data.
• Implementation Options: Falcon Fraud Manager operates in more than 20 countries for more than 9,000 clients. FICO
offers its platform directly to medium and large card issuers and supports a wide range of service models through
leading card management programs offered by companies such as First Data, FIS, Fiserv, SINSYS and TSYS. When
implementing Falcon Fraud Manager, a company may access FICO’s broad training and consulting resources.
• Data Integration: CEB TowerGroup estimates that FICO platform and service model versions of FICO Falcon help
protect more than 2.5 billion cards around the world, representing 66% of outstanding cards. Integration is standard
with most card systems.
CEB TowerGroup View:
FICO’s long standing and pervasive exposure to card analytic functions makes Falcon well worthy of consideration, though
CEB TowerGroup suggests that both platform and service models benchmark results for champion and challenger
transaction files. As the market leading solution in fraud, FICO constantly enhances its Falcon system through upgrades, like
its innovative adaptive analytics and global profiling techniques. Specifically, Version 6 enhancements include Falcon’s
profiling techniques that utilize global profiles targeting high-risk ATMs, merchants, risky geographic regions, and other
criteria. FICO’s consulting services, coupled with its extensive training options and user support, ensure a smooth transition
to Falcon.
Key Statistics
Company Type: Public
HQ: Minneapolis, MN
Founded: 1956
Employees: 2,079
Revenue: $619.6 million
Client Base: not disclosed
Global
Ov
er
$1
5 B
illio
n
96%
Betw
een
$5
-15
Billio
n
2%
Un
der
$5
Billio
n
2%
Client Siz
e (
by A
ssets
)
Target
Target Market
Platform

Current Market Future
Investment
Vendor
Landscape Product Rankings
27

CREATING OUR “BEST-IN-CLASS” PRODUCT RANKINGS
28 © 2012 The Corporate Executive Board Company. All Rights Reserved.
Categories:
Fraud Analytic Tools
Those attributes that
provide metrics to card
issuers that enable fraud
detection, offer insight
into risk, and help shield
against loss to the FSI.
Enterprise Operations
Those attributes that
affect the comprehensive
handling of an account
and overall customer
exposure across other
retail banking products.
Workflow Management
Those attributes that help
card issuers effectively
process work by
streamlining account and
transaction flows,
deploying operational
strategies, and bringing
accounts to a final
disposition.
Enterprise Support
Those attributes that
influence the enterprise’s
tactical fit and strategic
alignment with the
vendor.
Phase 2
Recognizing that all
attributes are not
equally important, CEB
TowerGroup divides
them into tiers to reflect
their level of
importance as mission
critical, strong priority
or differentiators.
Phase 1
Utilizing qualitative and
quantitative data, CEB
TowerGroup identified
22 attributes that define
a “Best-in-Class” Card
Fraud Management
System, which are
grouped into four
categories.
Phase 3
Certain products are
recognized as “Best-in-
Class” after scoring
each product based on
its performance at an
attribute level.
“Best-in-Class”
Fraud Analytic
Tools
“Best-in-Class”
Enterprise Support
“Best-in-Class”
Workflow
Management
“Best-in-Class”
Enterprise
Operations
Mission
Critical
Enterprise Screening
Behavior Tracking
Business Rules
Process Account Alerts
External Data
Capture
Data Integration
Neural Networks
User Support
Training Requirements
Technology Innovation
Vendor Stability
Strong
Priority
Business Intelligence
False Positive Alert Management
Geographic
Flexibility
Transaction Conditions
Product Maturity
Vendor Collaboration
Product
Differentiator Case Management
User Interface
Configurability Backup Management Pricing Flexibility
Attributes

29 © 2012 The Corporate Executive Board Company. All Rights Reserved.
PRODUCT RANKING MATRIX
Overall, high performing vendors exhibited excellence in multiple categories. Product Leaders are the top scoring products in a given category and are chosen based on the differentiation in scoring a particular category.
Fraud Analytic Tools includes
those attributes that provide
metrics to card issuers that
enable fraud detection, offer
insight into risk and help shield
against loss to the FSI.
Enterprise Operations includes
those attributes that affect the
comprehensive handling of an
account and overall customer
exposure across other retail
banking products.
Workflow Management
includes those attributes that
help card issuers effectively
process work by streamlining
account and transaction flows,
deploying operational
strategies, and bringing
accounts to a final disposition.
Enterprise Support includes
those attributes that influence
the enterprise’s tactical fit and
strategic alignment with the
vendor.
Fraud
Analytic
Tools
Enterprise
Operations
Workflow
Management
Enterprise
Support
Vendor A Product A 4.81 4.82 4.81 4.84
Vendor B Product B 4.24 4.29 4.46 3.84
Vendor C Product C 4.43 4.35 4.42 4.26
FICO
Falcon
Fraud
Manager
4.86 5 4.85 4.84
Vendor D Product D 4.67 4.76 4.81 4.39
Vendor E Product E 4.38 4.29 4.27 4.10
Vendor F Product F 4.86 4.41 4.65 4.68
Vendor G Product G 4.10 3.76 4.08 4.13
Ranking Methodology
Vendor rankings are
based on our
proprietary 5-point
rating system for each
of the 22 attributes in
our card fraud
management systems
anatomy (see page 21).
= Best-in-Class in
Anatomy
Category

30
Vendor B
Vendor A
Vendor A Vendor A
Vendor F
Vendor D
Vendor D
Vendor D
Vendor E Vendor D
FICO FICO FICO FICO
Vendor C
Vendor B
Vendor B
Vendor C
Vendor E
Vendor E
Vendor F
Vendor A
Vendor C Vendor C
Vendor B
Vendor E
0.25
0.50
0.75
1.00
FRAUD
ANALYTIC
TOOLS
ENTERPRISE
OPERATIONS
© 2012 The Corporate Executive Board Company. All Rights Reserved.
Source: CEB TowerGroup Research
WORKFLOW
MANAGEMENT
ENTERPRISE
SUPPORT
“Best-in-
Class”
Products
MAPPING THE VENDOR LANDSCAPE
“Best-in-Class” Product Rankings
Normalized Scores, 0.0-1.0 Scale

CATEGORY SCORING ANALYSIS
Fraud Analytic Tools
Business Intelligence: Runs on flexible rules engine with 3+ consortium data and a fraud
predictor that provides merchant profiling and adaptive analytics with 56 fraud patents.
Behavior Tracking: Includes multiple levels of user-defined profiles which enable clients to
build their own profiles to track behavior at the customer, account, or service level.
False Positive: Integral rules engine can override false positives and learn retrospectively
using tools that analyze false positives and return to refine algorithms.
Enterprise Operations
Alert Management: Automatically sends SMSs and sets up rules so fraud manager can
focus on high risk accounts and can categorize rules into different modes such as manual,
priority, and round robin.
Business Rules: Flexible rules engine holds unlimited data and provides a set of
performance statistics to enable users to develop business strategies.
User Interface Configurability: Customizable user interface provides extensive options for
queues, user and group options, page options, filters, and a variety of others.
Workflow Management
External Data Capture: Automatically communicates with external reporting and regulatory
agencies; includes the ability to call client systems for a customer and to produce account
updates.
Data Integration: Integrates seamlessly with front and back-end systems including over 100
CVV systems, 20 collection systems and over 100 customer records.
Neural Networks: Provides accessibility to FICO fraud consortium data with over 2.4 billion
payment card accounts and the ability to adjust decisioning based on previous outcomes.
Enterprise Support
Training: Includes multiple training options at FICO university including case management
training, expert business rules training, consulting for operational and system integration
training.
Product Maturity: Industry-leading product initiated scoring in the card sector and owns
roughly 60% of the marketplace.
Vendor Collaboration: Offers several customer collaboration outlets to enhance FICO’s
product including customer forums, FICO world, fraud alert networks, business reviews, and
surveys.
31 © 2012 The Corporate Executive Board Company. All Rights Reserved.
“BEST-IN-CLASS” ACHIEVEMENTS FOR FICO
FICO Falcon Fraud Manager 6 received “Best-in-Class” in Fraud Analytic Tools, Enterprise Operations, Workflow Management, and Enterprise Support.
Fraud Analytic Tools include
those attributes that provide
metrics to card issuers that
enable fraud detection, offer
insight into risk, and help shield
against loss to the FSI.
Enterprise Operations include
those attributes that affect the
comprehensive handling of an
account and overall customer
exposure across other retail
banking products.
Workflow Management includes
those attributes that help card
issuers effectively process work
by streamlining account and
transaction flows, deploying
operational strategies, and
bringing accounts to a final
disposition.
Enterprise Support includes
those attributes that influence
the enterprise’s tactical fit and
strategic alignment with the
vendor.

32
Business Intelligence
The technology offers a broad
set of real-time business tools
including predictive, adaptive,
and statistical analytics to
deliver insight into potential
fraud.
© 2012 The Corporate Executive Board Company. All Rights Reserved.
Enterprise Screening
The technology can broadly
address the portfolio by
transcending the enterprise
and searching for potential
relationships, link analysis, and
linkage to the customer.
Behavior Tracking
The technology can identify key
transactional behaviors and
spending patterns in order to
recognize uncharacteristic
transactions and to address
merchant accounts.
False Positive
The technology automatically
and effectively manages and
reports false positives with
feedback loops to allow
operational adjustments.
Case Management
The technology offers a
comprehensive tracking system
that allows a high level of
investigation by attaching
account transactions to
potential fraud rings.
Alert Management
The technology possesses
alerts that identify issues with
merchants and customers and
can react within the
authorization stream to
prioritize at user levels.
Business Rules
The technology can suggest,
create, and automate business
rules for card present, card
not present, and unattended
transactions with no vendor
interaction.
6 5 4 3 2 1
UI Configurability
The technology has a fully
configurable real-time user
interface and dashboards that
can trigger options for new
rules based on entitlement
levels and user permissions.
Process Account Alerts
The technology can process all
branded products and can tag
related accounts in and out of
the system and apply business
rules from the account alert.
External Data Capture
The technology communicates
with required external
regulatory agencies to
automate the collection of
customer, account, and product
information.
The technology can discern
fraud activity in multiple
currencies, and can determine
geographic product, fraud,
and language differences.
Geographic Flexibility
9
10
7
8
Transaction Conditions
The technology incorporates
the geographic location, MCC,
and entry types into the neural
networks and can respond to
incoming data based on the
type of card.
Neural Networks
The technology is built on a
comprehensive data platform
that can rapidly redefine
instructions, follow the
transaction through the billing
cycle, and adjust decisioning.
User Support
The user help functions are
easily identified, broad in
scope, and numerous in
interaction options.
Pricing Flexibility
The vendor offers multiple
pricing options with flexibility
surrounding installation and
customization.
Training
The vendor provides robust
training for IT users and
webinars and other training
modules for non-IT or
operational users at no
additional cost.
13 15 16 17 18 12
Technology Innovation
The vendor possesses a
proactive strategy to
incorporate innovative
technology and practices into
its product development
roadmap.
Product Maturity
The vendor possesses a mature
product with a growing market
share and client base.
Collaboration
The vendor effectively
identifies and aligns
technology implementation to
enterprise needs.
20
19
21
Fraud Analytics Tools
Enterp
rise S
upp
ort
Source: CEB TowerGroup Research
Workflow Management
Ente
rpri
se O
pera
tions
Data Integration
The technology integrates and
performs with front and back
end systems such as CVV,
collection system, case
management, and customer
records.
11
Vendor Stability
The vendor has an established
industry presence and can
provide long term support for
institutions.
22
Backup Management
The technology has a backup
system with full tolerance to
accommodate overflow and
diversion of the system and
separates essential and non
essential information.
14
CARD FRAUD MANAGEMENT SYSTEMS SCORING METHODOLOGY
Scoring Methodology
To arrive at a vendor ranking, CEB TowerGroup developed a proprietary scoring metric outlined by the
attributes within this anatomy that highlights the major elements of an enterprise investment decision. This
metric assumes that every element is not equally important, and therefore assigns a higher level of
importance to those attributes critical to a card fraud management system. The remaining attributes are
then divided further into two tiers to reflect their level of importance, highlighted below.
Tier 1 Attributes – “Mission
Critical” Tier 2 Attributes – “Strong
Priority” Tier 3 Attributes – “Product
Differentiators”
Enterprise Screening
Behavior Tracking
Business Rules
Process Account Alerts
External Data Capture
Data Integration
Neural Networks
User Support
Training
Technology Innovation
Vendor Stability
Business Intelligence
False Positive
Alert Management
Geographic Flexibility
Transaction Conditions
Product Maturity
Collaboration
Case Management
User Interface Configurability
Backup Management
Pricing Flexibility

UNDERSTANDING OUR SCORING METHODOLOGY
CEB TowerGroup developed
a unique and proprietary
scoring methodology that
highlights the key priorities
for an executive’s
investment decision.
Every vendor product featured
in this report is scored against
each of the 22 attributes
outlined in the Card Fraud
Management System Diagnostic
Anatomy on a standardized 1-5
scale.
We calculate the weighted
average of a product’s attribute
scores in each of the four
categories of the anatomy to
arrive at an overall category
score.
Anato
my
Category Fraud Analytic Tools Workflow Management
Attribute Title Enterprise Screening Neural Networks
Attribute
Definition
The technology can broadly address the
portfolio by transcending the enterprise and
searching for potential relationships, link
analysis, and linkage to the customer.
The technology is built on a comprehensive
data platform that can rapidly redefine
instructions, follow the transaction through the
billing cycle, and adjust decisioning.
Sco
ring M
etr
ic
5
The technology can broadly address the portfolio by
transcending the enterprise and searching for potential
relationships, link analysis, and linkage to the customer.
The technology is built on a comprehensive data
platform and can rapidly redefine instructions, follow
the transaction through the billing cycle, and adjust
easily decisioning based on previous outcomes.
4
The technology can transcend the enterprise and can
search for potential relationships but has limited ability
to link to the customer and perform link analysis.
The technology can refine the instructions, follow the
transaction through the billing cycle, but has limited
capabilities in adjusting decisioning based on previous
outcomes.
3 The technology can transcend the enterprise but has
limited searching ability for potential relationships and
cannot link to the customer.
The technology can refine the instructions, follow the
transaction through the billing cycle, but cannot adjust
decisioning based on previous outcomes.
2 The technology can transcend the enterprise but cannot
search for potential relationships.
The technology can refine the instructions, but cannot
follow the transaction through the billing cycle.
1 The technology cannot transcend the enterprise and
cannot link potential relationships to the customer.
The technology does not support a neural network.
Attribute Score: 5.0 3.0
SCORE
Sample Technology Analysis Internal Anatomy Scoring Guide
Illustrative
33 © 2012 The Corporate Executive Board Company. All Rights Reserved.
Source: CEB TowerGroup Research

34