Embed Size (px)
Citation preview
CarboOcean-2006
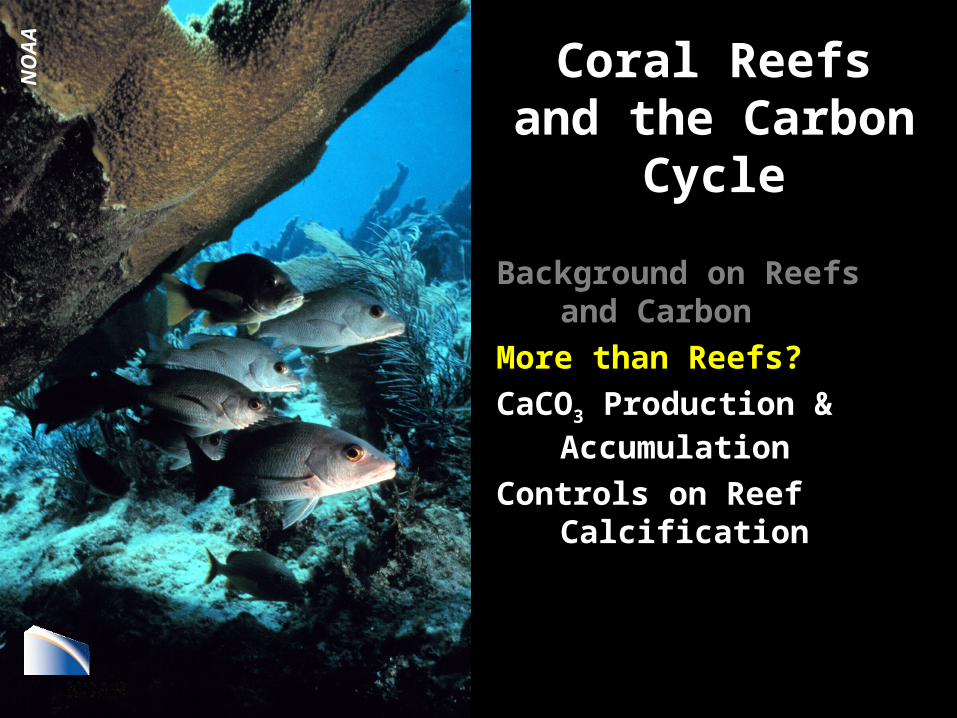
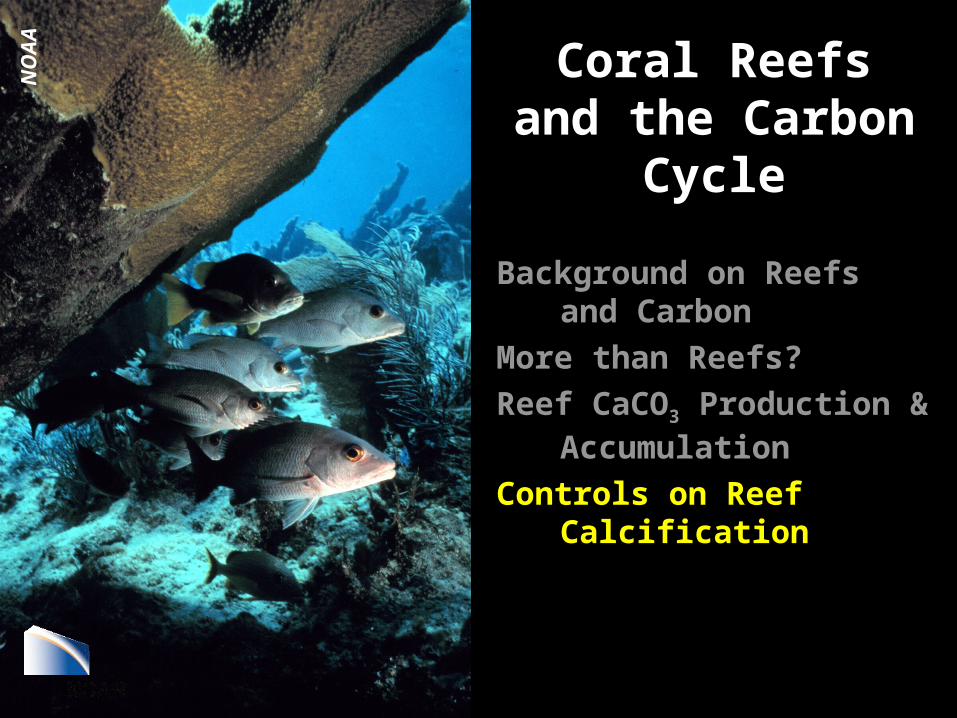
Coral Reefsand the Carbon Cycle
Joanie Kleypas National Center for Atmospheric Research
NO
AA
Background on Reefs and Carbon
More than Reefs?
Reef CaCO3 Production & Accumulation
Controls on Reef Calcification
CarboOcean-2006
Coral Reefsand the Carbon Cycle
NO
AA
Background on Reefs and Carbon
More than Reefs?
Reef CaCO3 Production & Accumulation
Controls on Reef Calcification
CarboOcean-2006
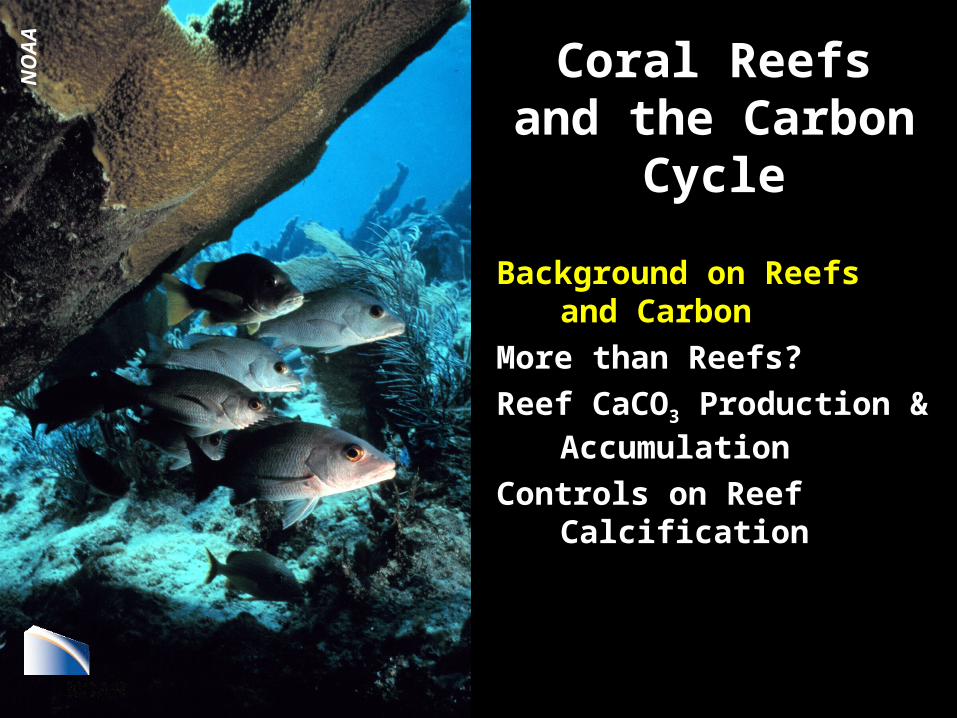
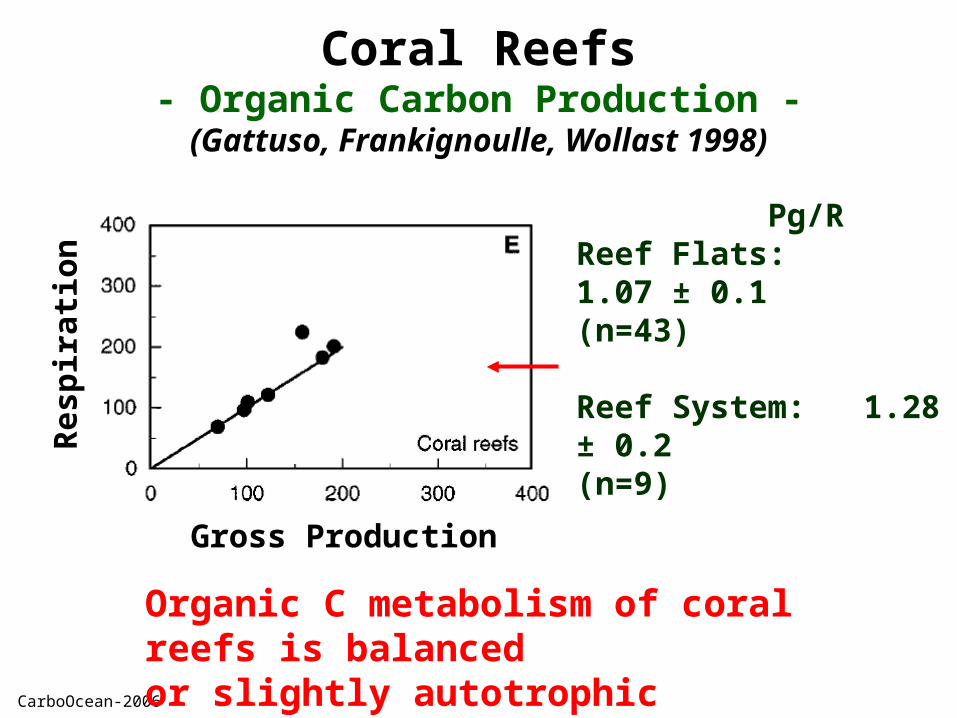
Coral Reefs- Organic Carbon Production -
Organic Carbon Production in Low Nutrient Waters
1. High organic production (79–584 g C m–2 y–1)
2. Topographically induced upwelling, internal tidal bores; ‘endo-upwelling’
3. Efficient production of organic carbon (Nitrogen fixation)
C : N : P Coral reefs: 550:30:1 Open ocean: 106:16:1
Smith, 1988
CarboOcean-2006
Gross Production
Res
pir
atio
n
Pg/RReef Flats: 1.07 ± 0.1(n=43)
Reef System: 1.28 ± 0.2(n=9)
Organic C metabolism of coral reefs is balancedor slightly autotrophic
Coral Reefs- Organic Carbon Production -
(Gattuso, Frankignoulle, Wollast 1998)
CarboOcean-2006
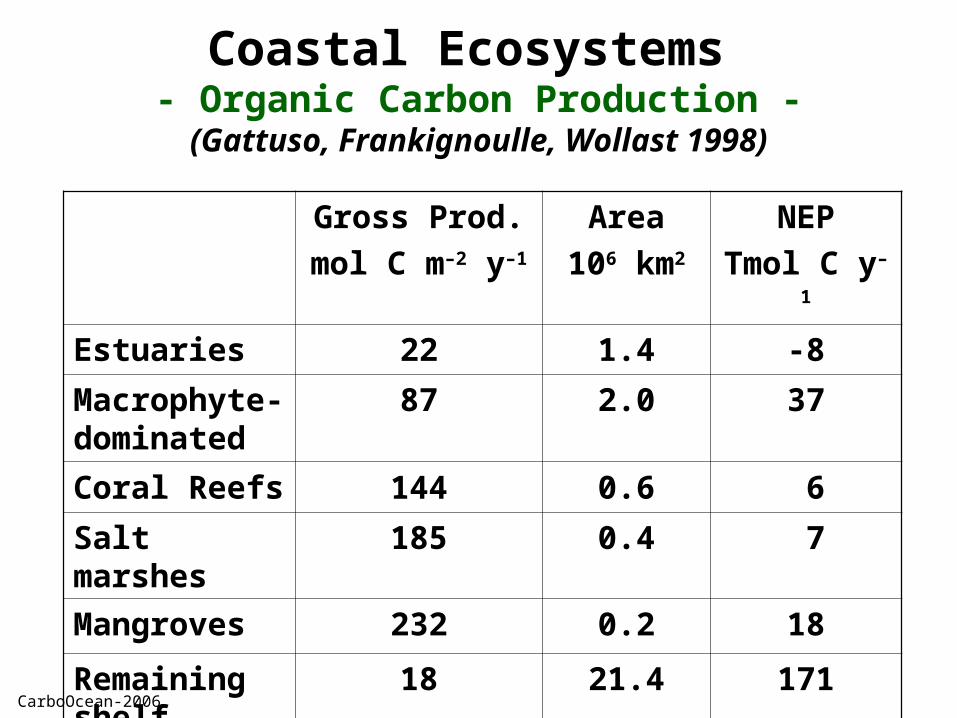
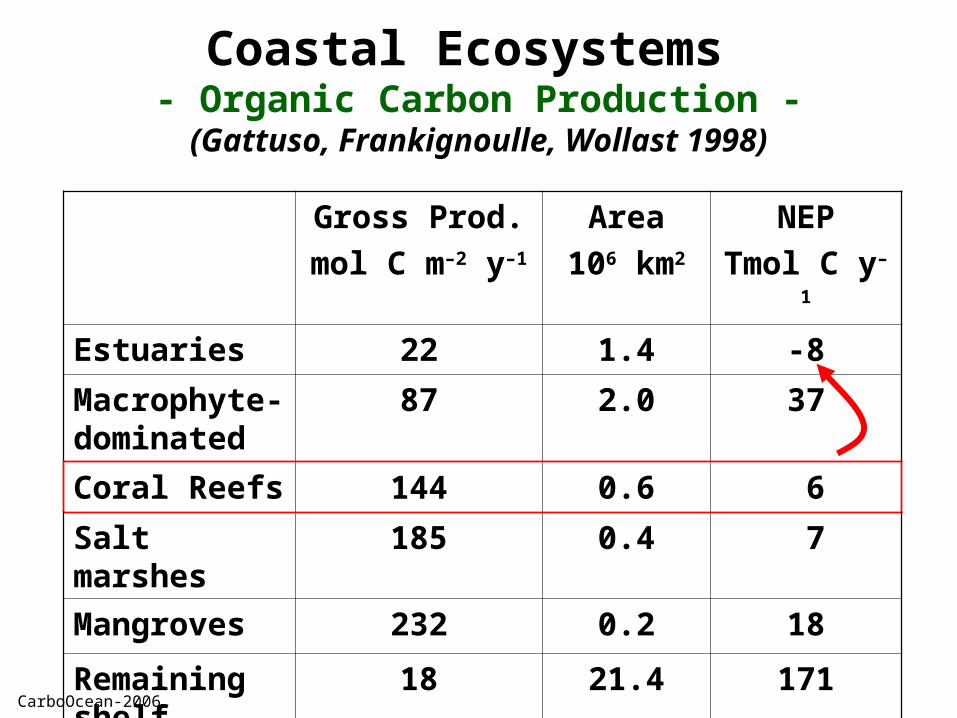
Coastal Ecosystems - Organic Carbon Production -
(Gattuso, Frankignoulle, Wollast 1998)
Gross Prod.
mol C m–2 y–1
Area
106 km2
NEP
Tmol C y–1
Estuaries 22 1.4 -8
Macrophyte-dominated
87 2.0 37
Coral Reefs 144 0.6 6
Salt marshes 185 0.4 7
Mangroves 232 0.2 18
Remaining shelf
18 21.4 171
CarboOcean-2006
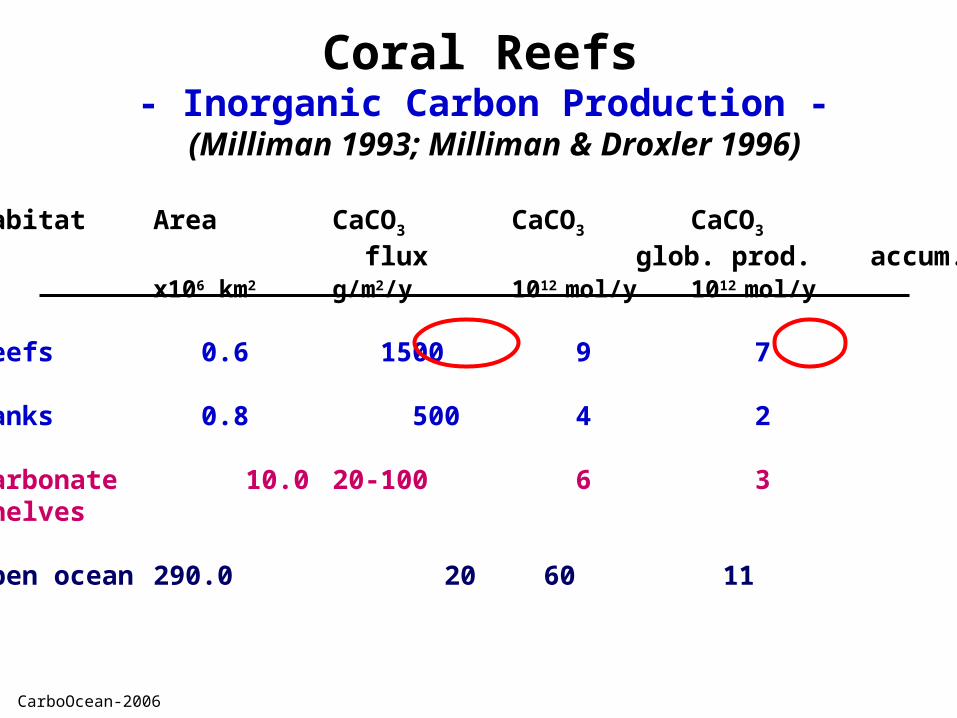
Habitat Area CaCO3 CaCO3 CaCO3
flux glob. prod. accum.x106 km2 g/m2/y 1012 mol/y 1012 mol/y
reefs 0.6 1500 9 7
banks 0.8 500 4 2 carbonate 10.0 20-100 6 3shelves
open ocean 290.0 20 60 11
Coral Reefs - Inorganic Carbon Production -
(Milliman 1993; Milliman & Droxler 1996)
CarboOcean-2006
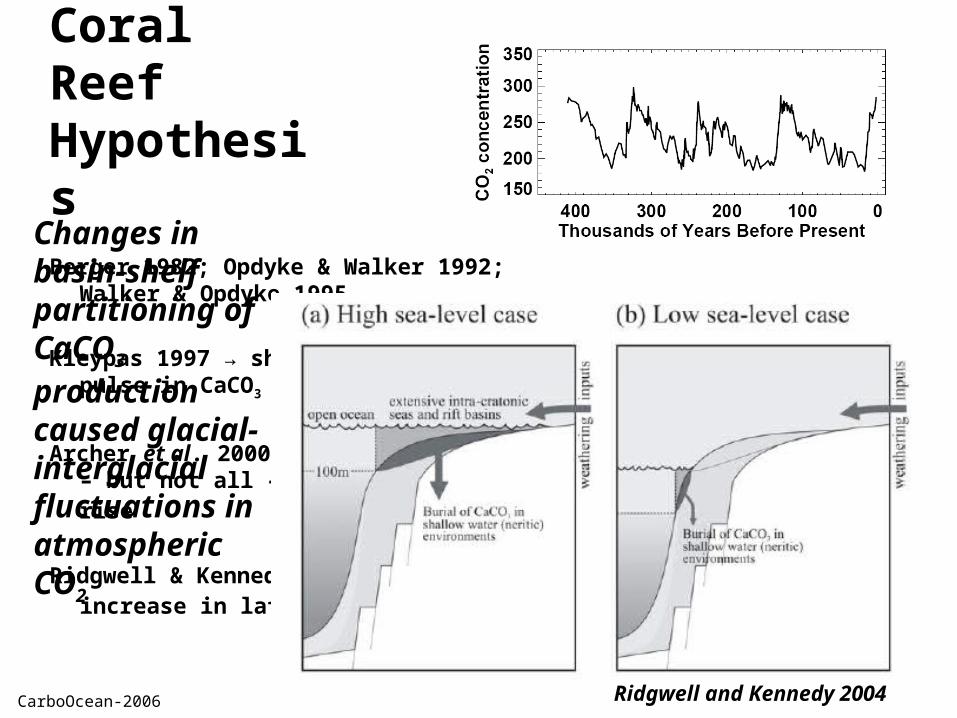
Coral ReefHypothesis
Berger 1982; Opdyke & Walker 1992; Walker & Opdyke 1995
Kleypas 1997 → shelf flooding initiated pulse in CaCO3 but not until 8000 yBP
Archer et al. 2000 → can explain portion – but not all – of post-glacial CO2 rise
Ridgwell & Kennedy 2004 → 20 ppm CO2 increase in late Holocene
Ridgwell and Kennedy 2004
Changes in basin-shelf partitioning of CaCO3 production caused glacial-interglacial fluctuations in atmospheric CO2
CarboOcean-2006
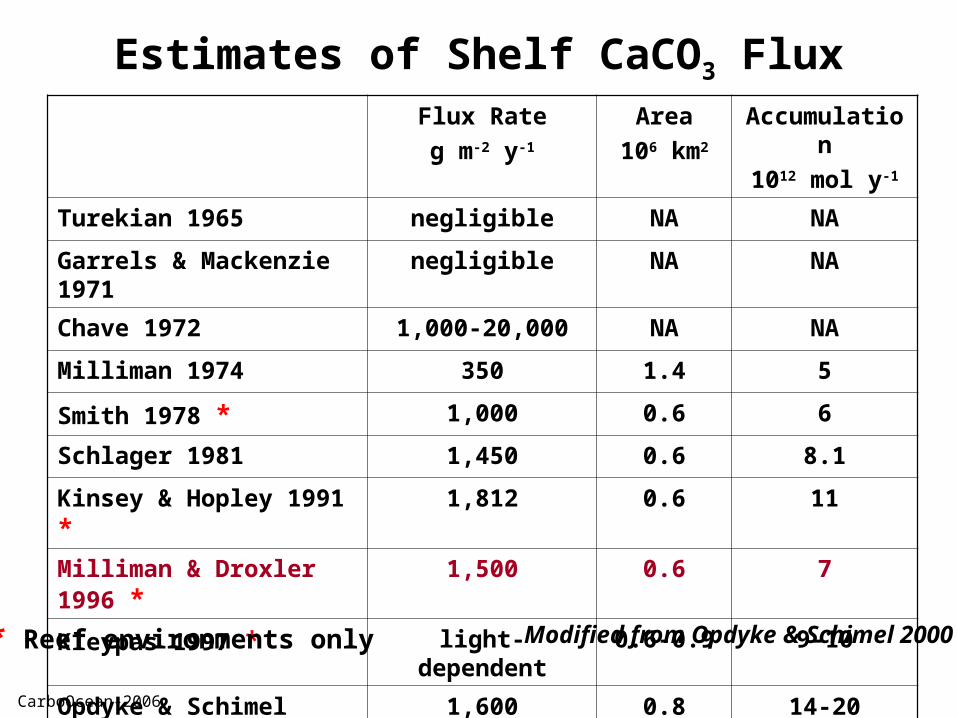
Estimates of Shelf CaCO3 FluxFlux Rate
g m-2 y-1
Area
106 km2
Accumulation
1012 mol y-1
Turekian 1965 negligible NA NA
Garrels & Mackenzie 1971 negligible NA NA
Chave 1972 1,000-20,000 NA NA
Milliman 1974 350 1.4 5
Smith 1978 * 1,000 0.6 6
Schlager 1981 1,450 0.6 8.1
Kinsey & Hopley 1991 * 1,812 0.6 11
Milliman & Droxler 1996 * 1,500 0.6 7
Kleypas 1997 * light-dependent 0.6-0.9 9-10
Opdyke & Schimel 2000 * 1,600 0.8 14-20
* Reef environments only Modified from Opdyke & Schimel 2000
CarboOcean-2006
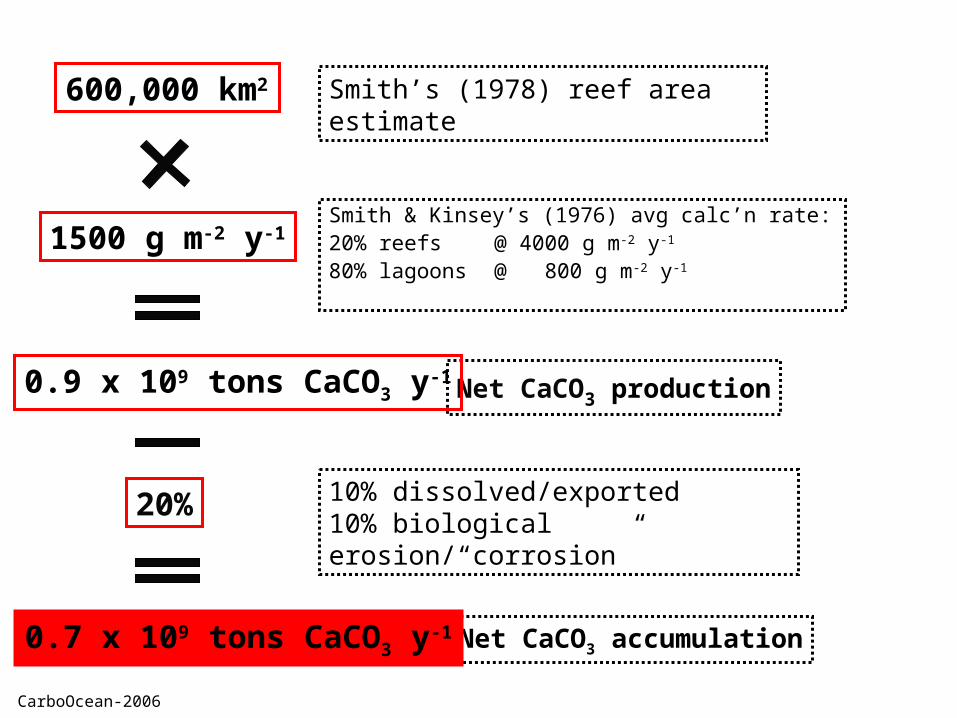
Smith & Kinsey’s (1976) avg calc’n rate:20% reefs @ 4000 g m-2 y-1 80% lagoons @ 800 g m-2 y-1
1500 g m-2 y-1
Net CaCO3 production
600,000 km2
10% dissolved/exported10% biological erosion/“corrosion”
Net CaCO3 accumulation
0.9 x 10⁹ tons CaCO3 y-1
20%
0.7 x 10⁹ tons CaCO3 y-1
Smith’s (1978) reef area estimate
CarboOcean-2006
Coral Reefsand the Carbon Cycle
NO
AA
Background on Reefs and Carbon
More than Reefs?
CaCO3 Production & Accumulation
Controls on Reef Calcification
CarboOcean-2006
“… cold water corals may cover as large an area as … warm-water corals that form shallow reefs” (Williams et al., Eos 21 Nov 2006)
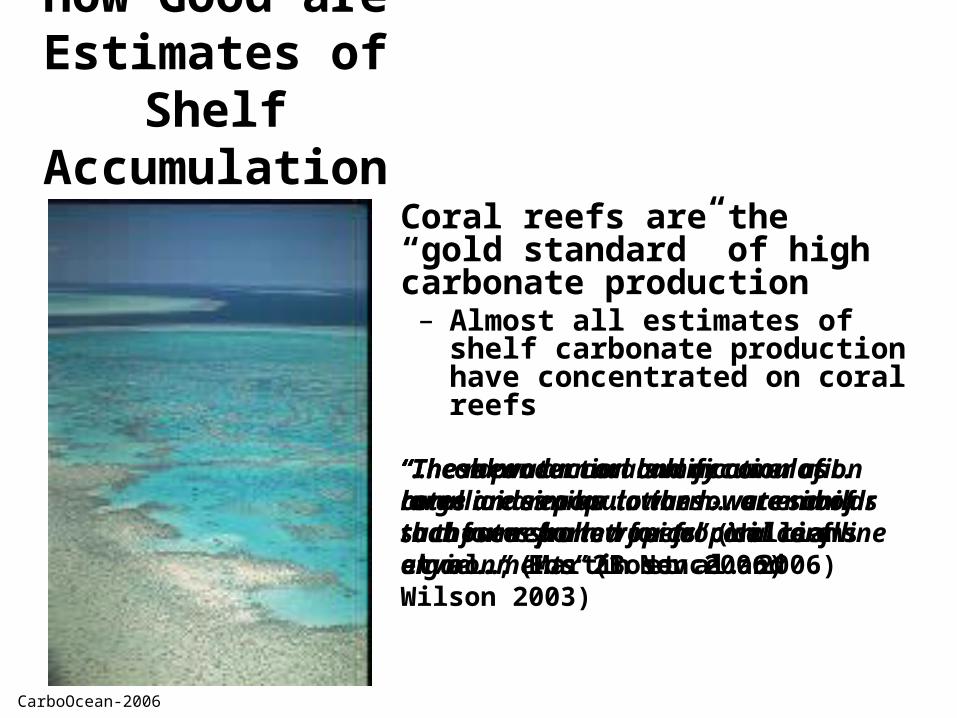
How Good are Estimates of Shelf
Accumulation?Coral reefs are the “gold standard” of high carbonate production
– Almost all estimates of shelf carbonate production have concentrated on coral reefs
“The mean annual calcification of L. corallioides populations … are similar to those reported for tropical coralline algae …” (Martin et al. 2006)
“These production and accumulation rates are similar to the lower end of such rates from tropical coral reef environments” (Bosence and Wilson 2003)
CarboOcean-2006
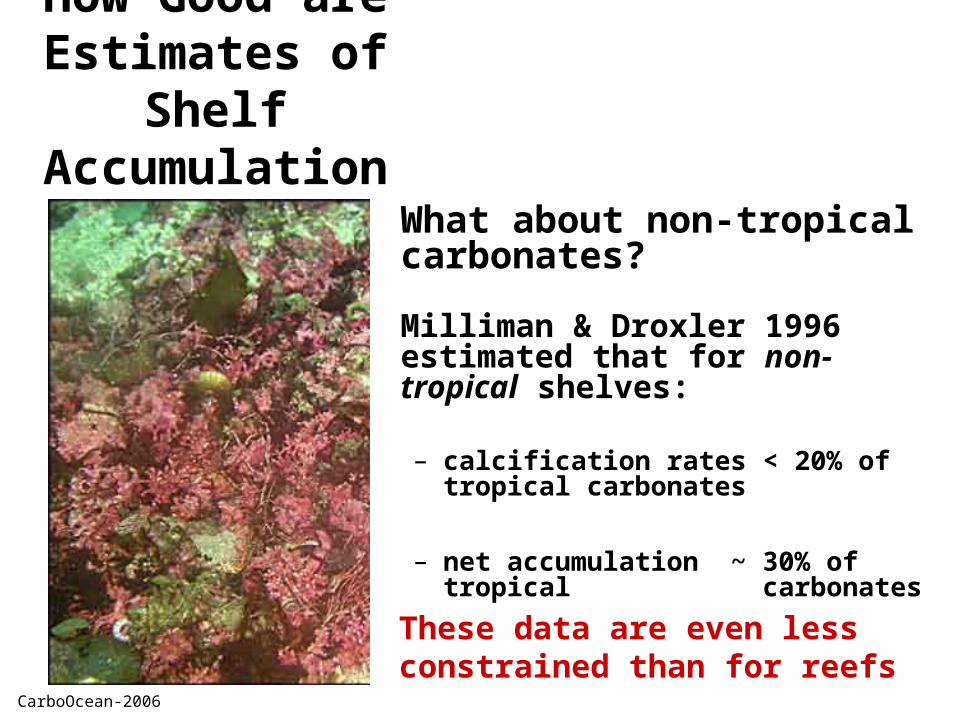
What about non-tropical carbonates?
Milliman & Droxler 1996 estimated that for non-tropical shelves: – calcification rates < 20% of tropical
carbonates
– net accumulation ~ 30% of tropical carbonates
How Good are Estimates of Shelf
Accumulation?
These data are even lessconstrained than for reefs
CarboOcean-2006
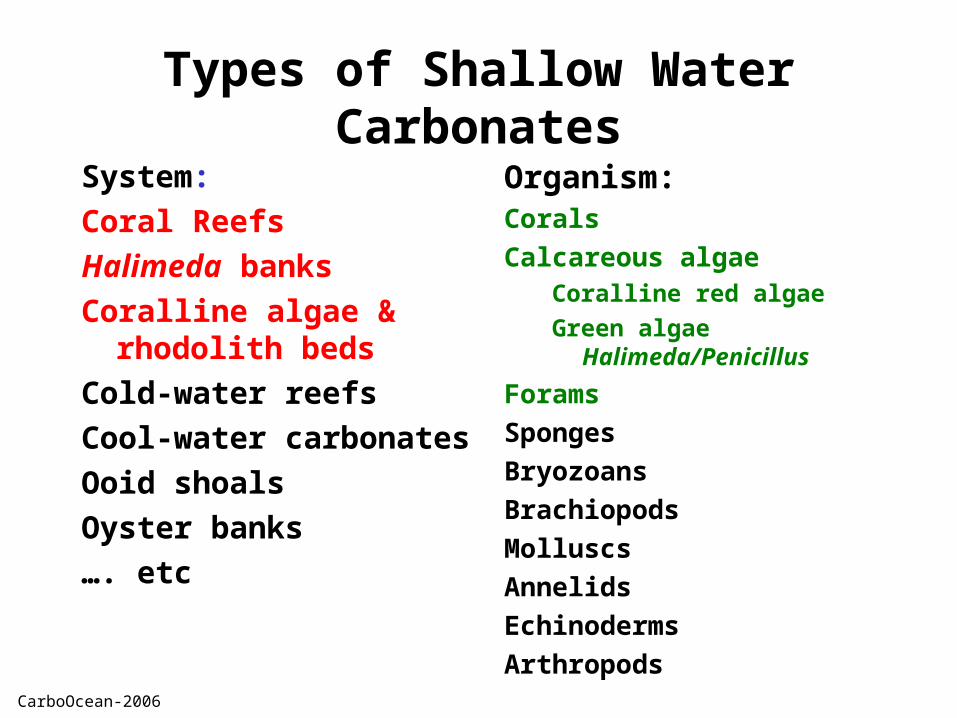
Types of Shallow Water Carbonates
System:
Coral Reefs
Halimeda banks
Coralline algae & rhodolith beds
Cold-water reefs
Cool-water carbonates
Ooid shoals
Oyster banks
…. etc
Organism:Corals
Calcareous algaeCoralline red algae
Green algae Halimeda/Penicillus
Forams
Sponges
Bryozoans
Brachiopods
Molluscs
Annelids
Echinoderms
Arthropods
CarboOcean-2006
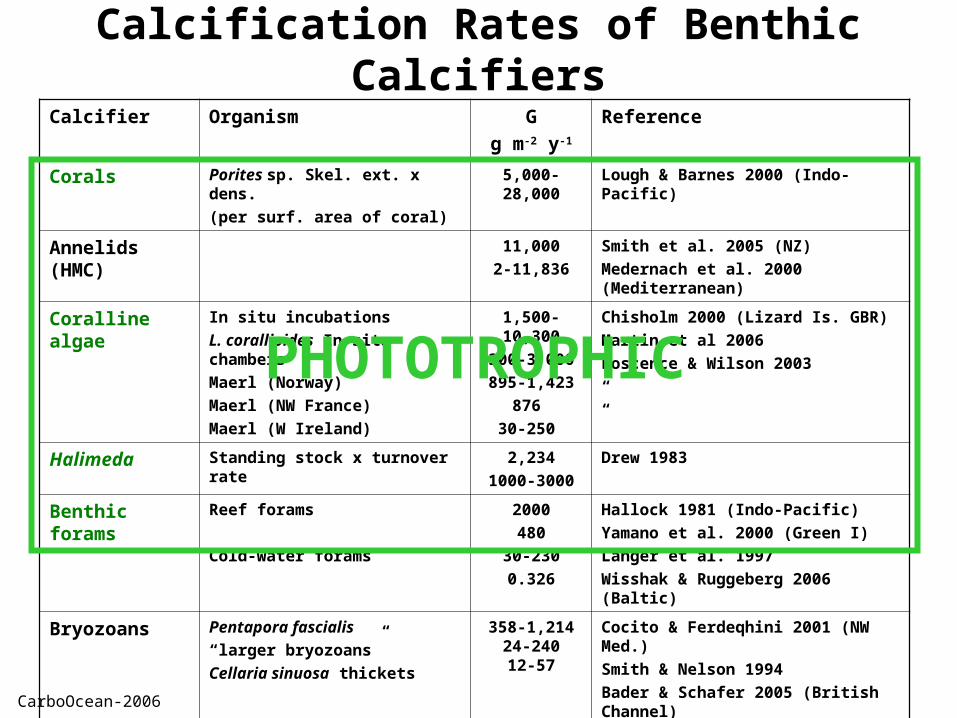
Calcification Rates of Benthic CalcifiersCalcifier Organism G
g m-2 y-1
Reference
Corals Porites sp. Skel. ext. x dens.
(per surf. area of coral)
5,000-28,000 Lough & Barnes 2000 (Indo-Pacific)
Annelids (HMC) 11,000
2-11,836
Smith et al. 2005 (NZ)
Medernach et al. 2000 (Mediterranean)
Coralline algae In situ incubations
L. corallioides In situ chambers
Maerl (Norway)
Maerl (NW France)
Maerl (W Ireland)
1,500-10,300
300-3,000
895-1,423
876
30-250
Chisholm 2000 (Lizard Is. GBR)
Martin et al 2006
Boscence & Wilson 2003
“
“
Halimeda Standing stock x turnover rate 2,234
1000-3000
Drew 1983
Benthic forams Reef forams
Cold-water forams
2000
480
30-230
0.326
Hallock 1981 (Indo-Pacific)
Yamano et al. 2000 (Green I)
Langer et al. 1997
Wisshak & Ruggeberg 2006 (Baltic)
Bryozoans Pentapora fascialis
“larger bryozoans”
Cellaria sinuosa thickets
358-1,21424-24012-57
Cocito & Ferdeqhini 2001 (NW Med.)
Smith & Nelson 1994
Bader & Schafer 2005 (British Channel)
Echinoderms Ophiothrix fragilis 682 Migne et al. 1998 (Dover Strait)
Molluscs Potamocorbula amurensis (clam)
221 (+/-184) Chauvaud et al. 2003 (San Francisco)
PHOTOTROPHIC
CarboOcean-2006
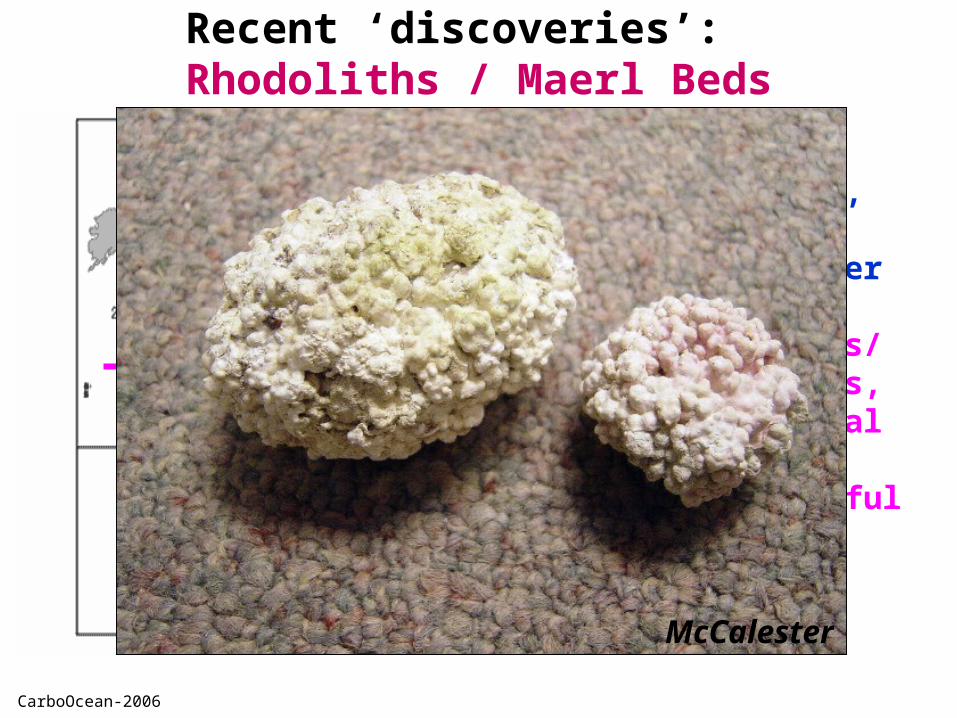
Recent ‘discoveries’: Rhodoliths / Maerl Beds
Foster 2001
In high latitudes, usually clear water In tropics/ subtropics, where coral reefs are unsuccessful
McCalester
CarboOcean-2006
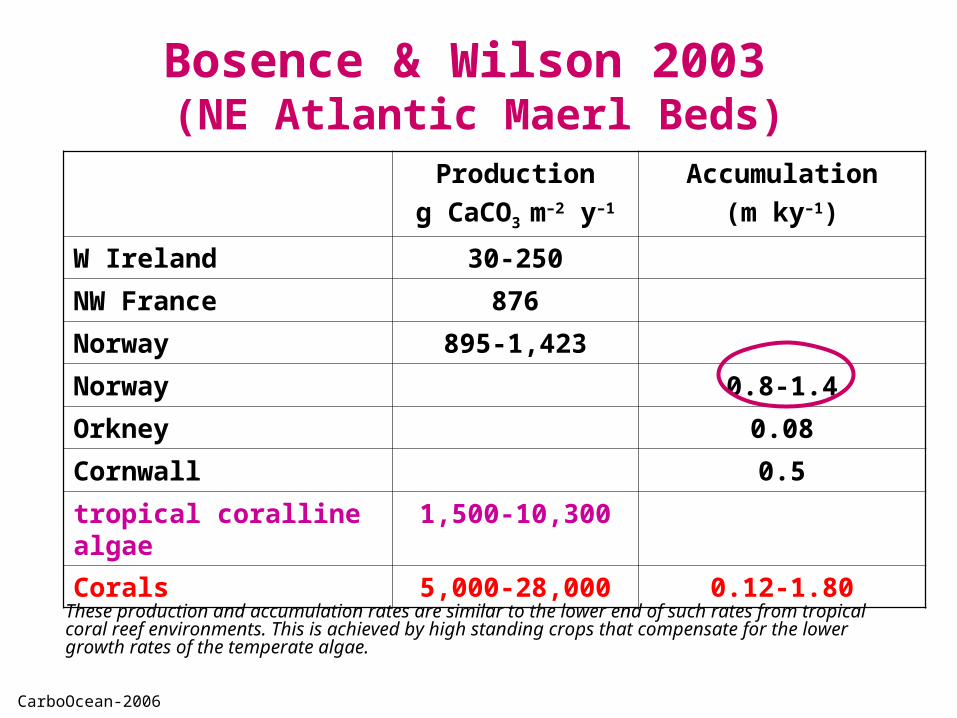
Bosence & Wilson 2003 (NE Atlantic Maerl Beds)
These production and accumulation rates are similar to the lower end of such rates from tropical coral reef environments. This is achieved by high standing crops that compensate for the lower growth rates of the temperate algae.
Production
g CaCO3 m–2 y–1
Accumulation
(m ky–1)
W Ireland 30-250
NW France 876
Norway 895-1,423
Norway 0.8-1.4
Orkney 0.08
Cornwall 0.5
tropical coralline algae 1,500-10,300
Corals 5,000-28,000 0.12-1.80
CarboOcean-2006
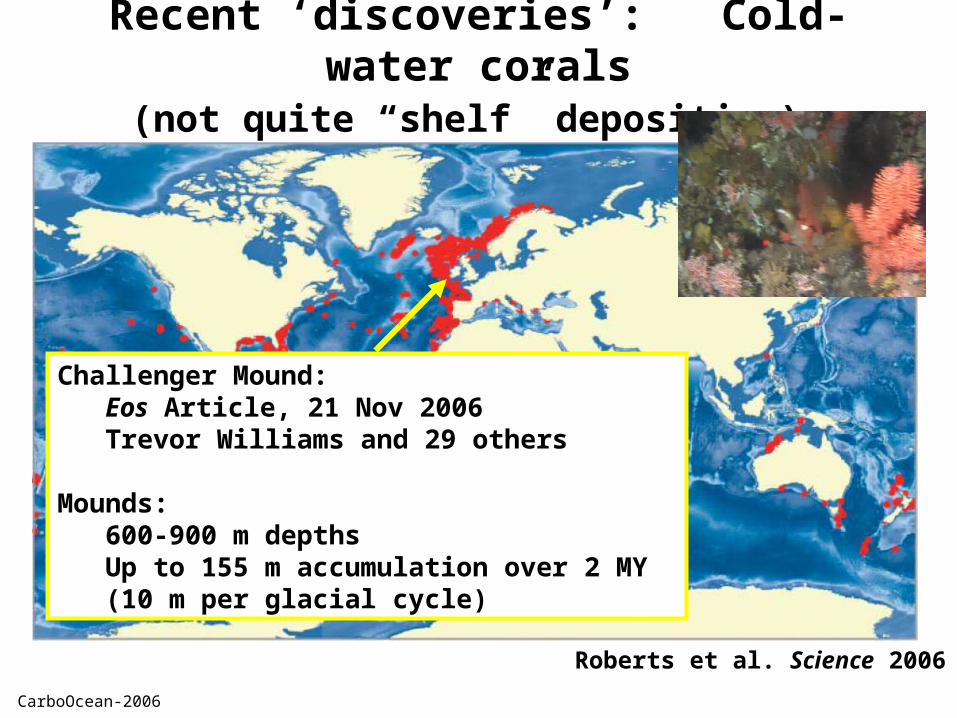
Roberts et al. Science 2006
Recent ‘discoveries’: Cold-water corals(not quite “shelf” deposition)
Challenger Mound:Eos Article, 21 Nov 2006Trevor Williams and 29 others
Mounds:600-900 m depthsUp to 155 m accumulation over 2 MY(10 m per glacial cycle)
CarboOcean-2006
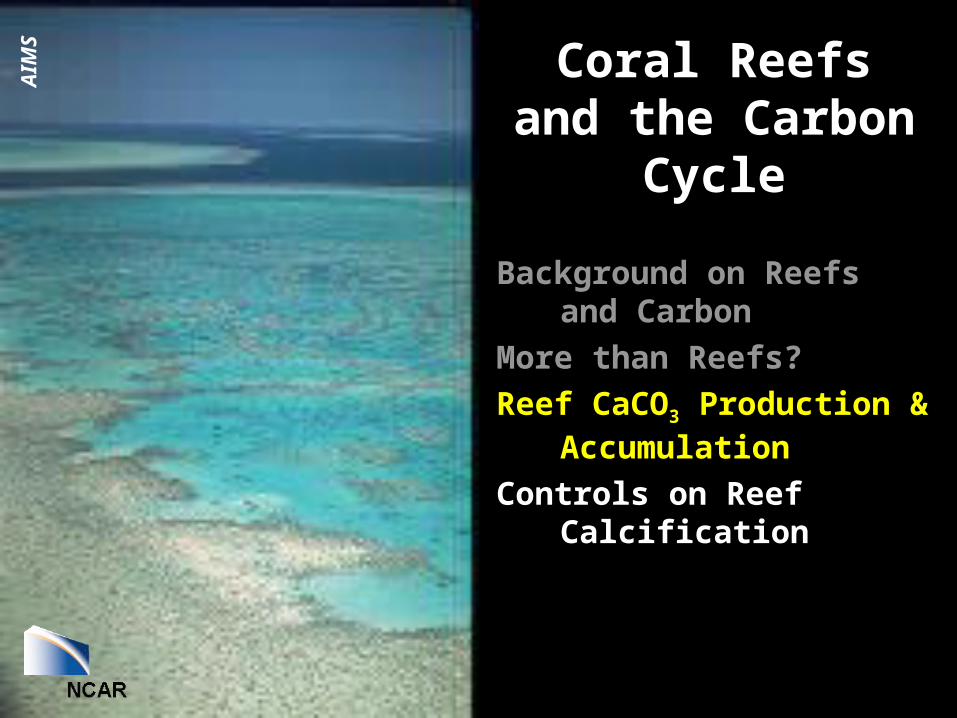
Coral Reefsand the Carbon Cycle
AIM
S
Background on Reefs and Carbon
More than Reefs?
Reef CaCO3 Production & Accumulation
Controls on Reef Calcification
CarboOcean-2006
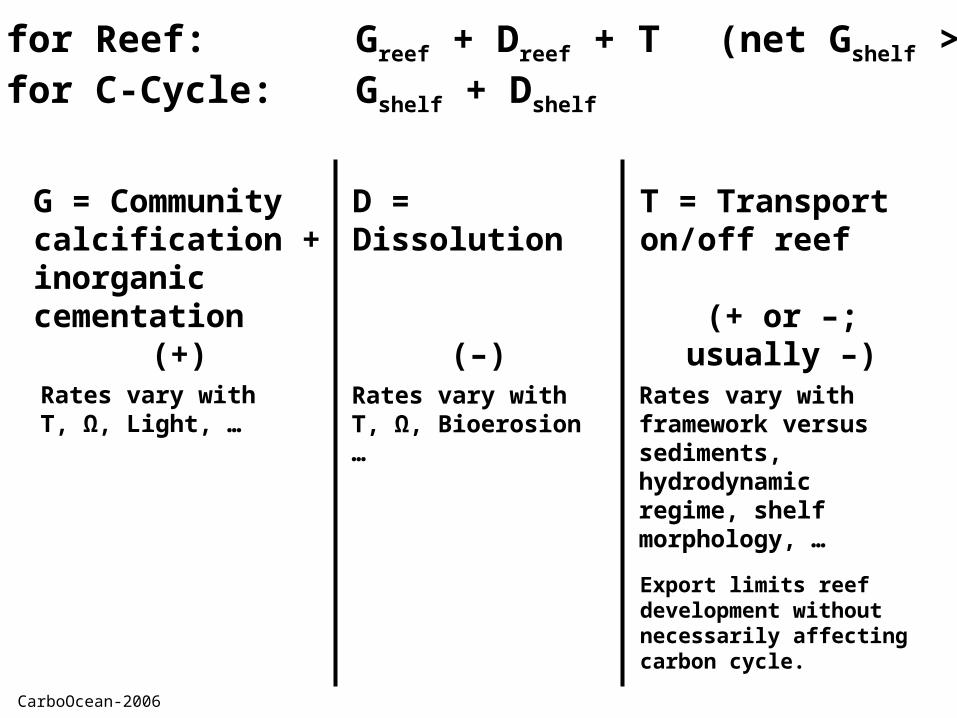
Budget for Reef: Greef + Dreef + T (net Gshelf > Greef)Budget for C-Cycle: Gshelf + Dshelf
G = Community calcification + inorganic cementation
(+)
D = Dissolution
(–)
T = Transport on/off reef
(+ or –; usually –)
Rates vary with T, Ω, Light, …
Export limits reef development without necessarily affecting carbon cycle.
Rates vary with T, Ω, Bioerosion …
Rates vary with framework versus sediments, hydrodynamic regime, shelf morphology, …
CarboOcean-2006
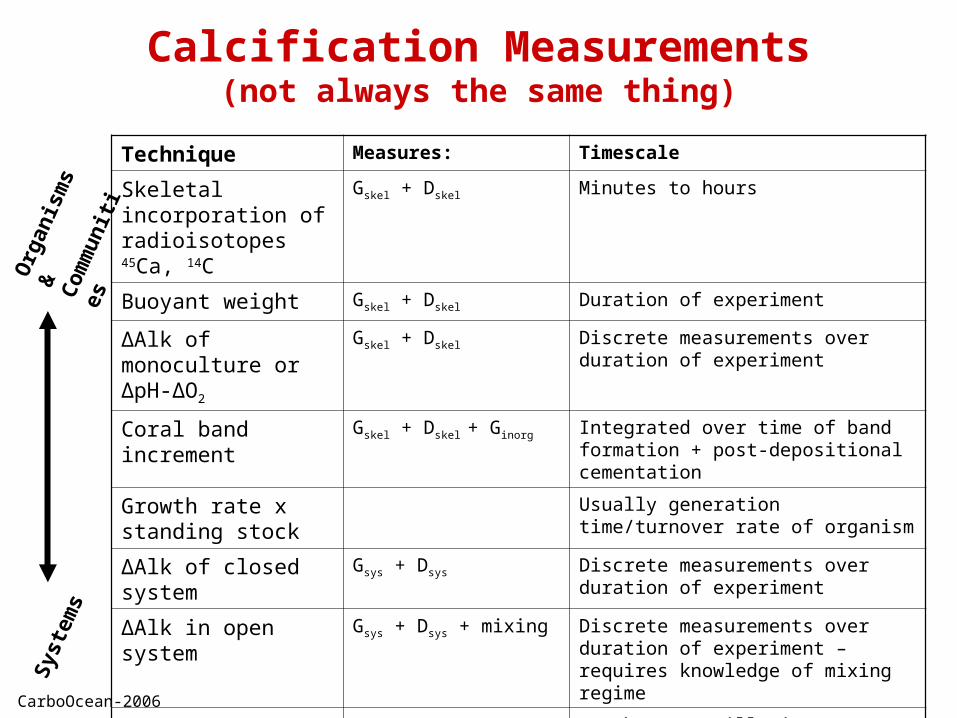
Technique Measures: Timescale
Skeletal incorporation of radioisotopes 45Ca, 14C
Gskel + Dskel Minutes to hours
Buoyant weight Gskel + Dskel Duration of experiment
ΔAlk of monoculture or ΔpH-ΔO2
Gskel + Dskel Discrete measurements over duration of experiment
Coral band increment Gskel + Dskel + Ginorg Integrated over time of band formation + post-depositional cementation
Growth rate x standing stock
Usually generation time/turnover rate of organism
ΔAlk of closed system Gsys + Dsys Discrete measurements over duration of experiment
ΔAlk in open system Gsys + Dsys + mixing Discrete measurements over duration of experiment – requires knowledge of mixing regime
Sedimentological(thickness x density) /time
Gsys + Dsys + transport Months to > millenia
Calcification Measurements(not always the same thing)
Org
anis
ms
& Co
mm
uniti
es
Syst
ems
CarboOcean-2006
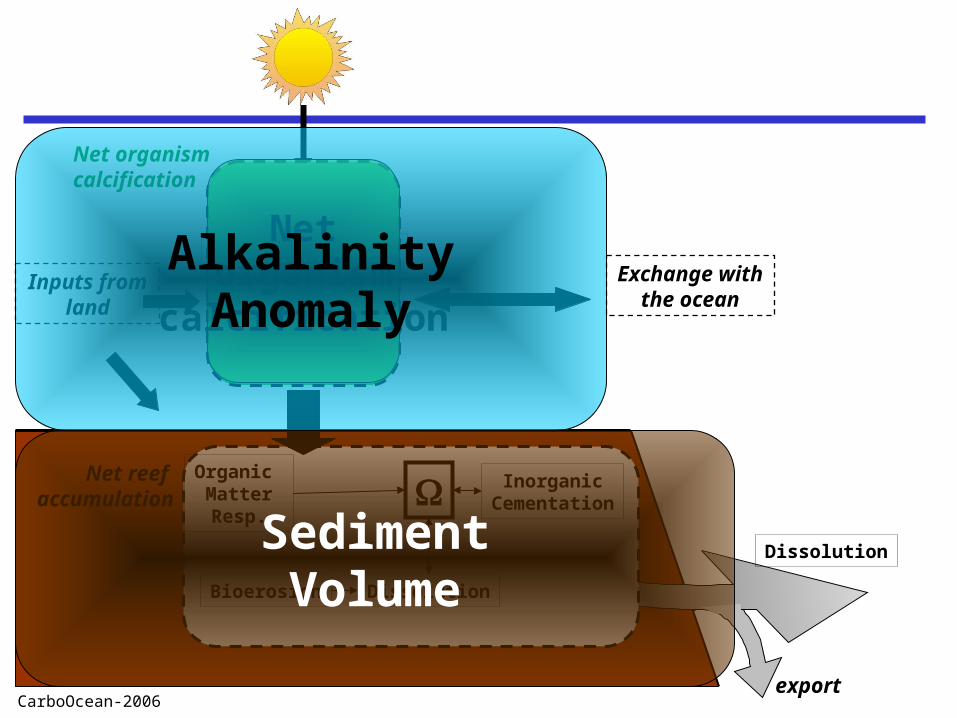
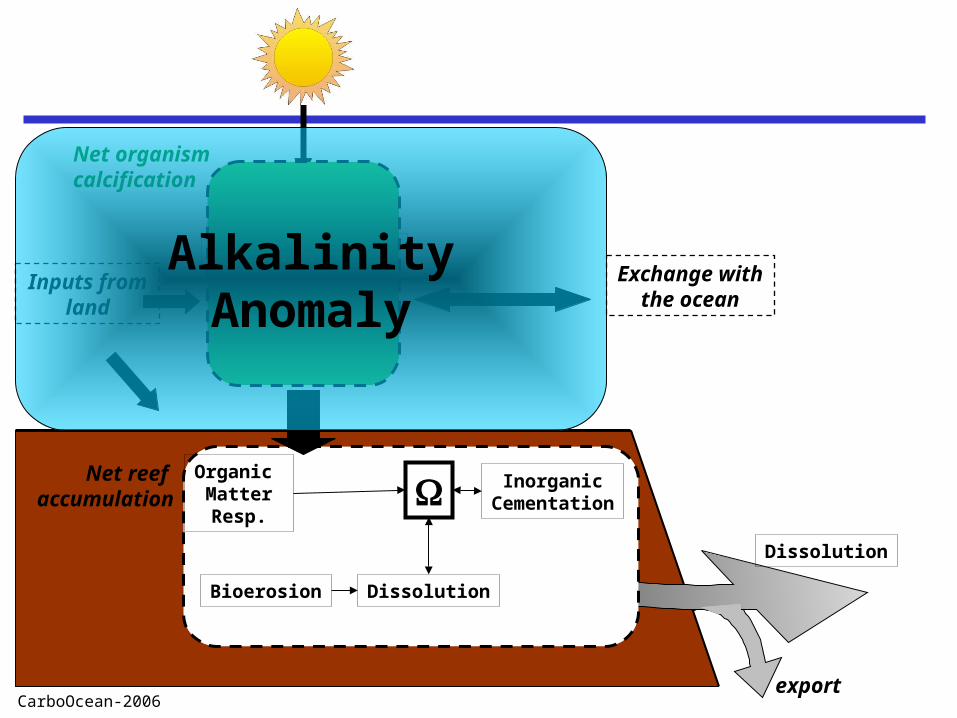
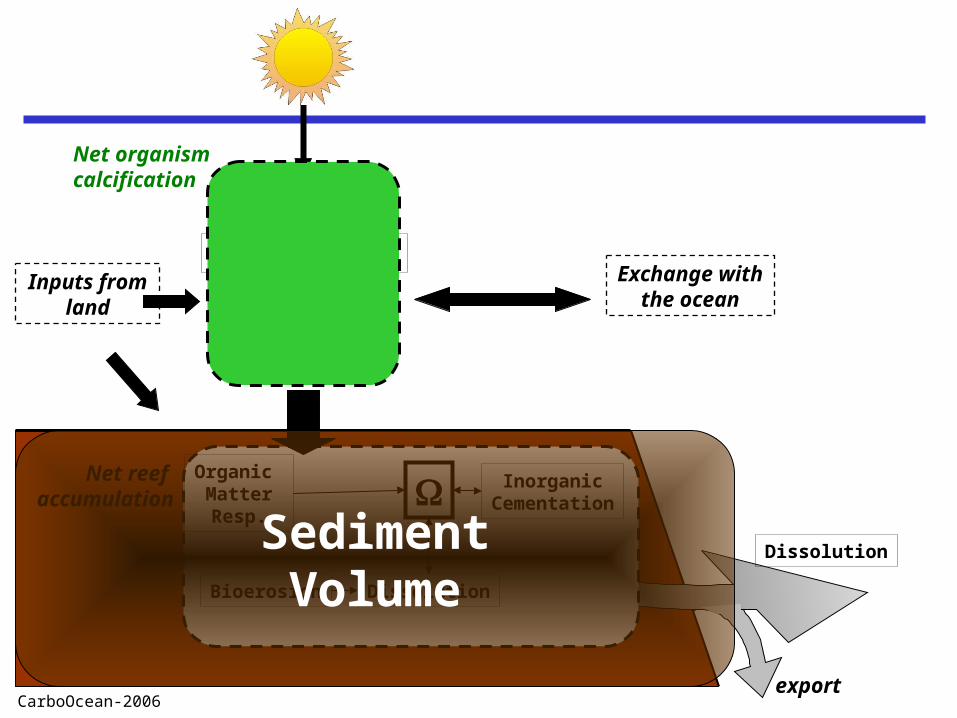
Dissolution
Photo/Resp.
InorganicCementation
Net organism calcification
Dissolution
Organic MatterResp.
InorganicCementation
Bioerosion
Dissolution
Net reef accumulation
CalcificationInputs from
land
export
Exchange with the ocean
Netorganism
calcification
AlkalinityAnomaly
SedimentVolume
CarboOcean-2006
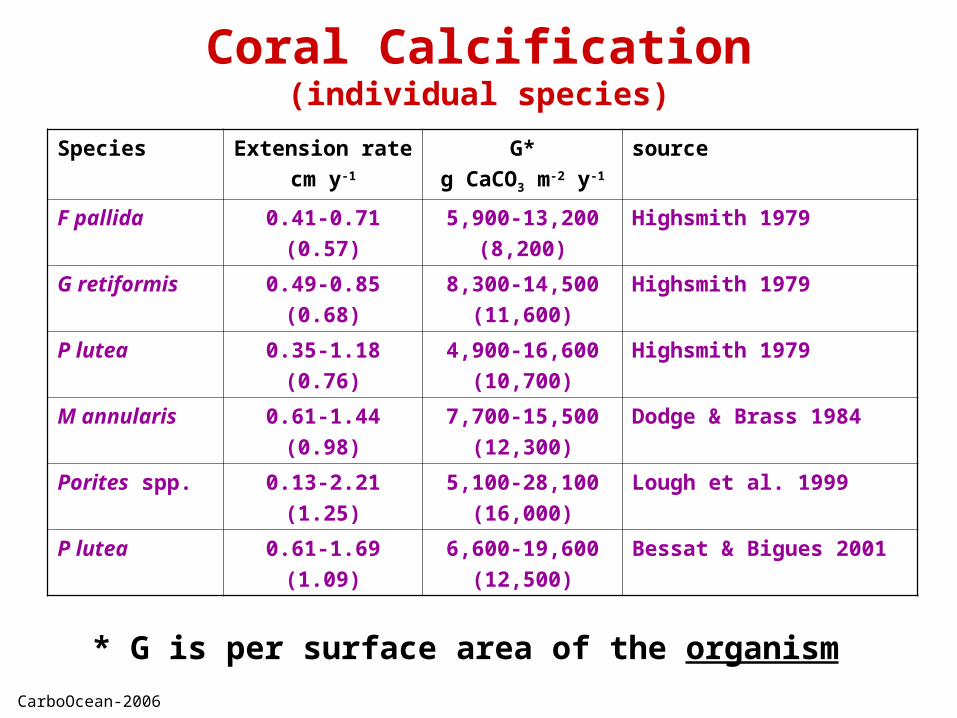
Species Extension ratecm y-1
G*g CaCO3 m-2 y-1
source
F pallida 0.41-0.71(0.57)
5,900-13,200(8,200)
Highsmith 1979
G retiformis 0.49-0.85(0.68)
8,300-14,500(11,600)
Highsmith 1979
P lutea 0.35-1.18(0.76)
4,900-16,600(10,700)
Highsmith 1979
M annularis 0.61-1.44(0.98)
7,700-15,500(12,300)
Dodge & Brass 1984
Porites spp. 0.13-2.21(1.25)
5,100-28,100(16,000)
Lough et al. 1999
P lutea 0.61-1.69(1.09)
6,600-19,600(12,500)
Bessat & Bigues 2001
* G is per surface area of the organism
Coral Calcification(individual species)
CarboOcean-2006
Dissolution
Photo/Resp.
InorganicCementation
Net organism calcification
Dissolution
Organic MatterResp.
InorganicCementation
Bioerosion
Dissolution
Net reef accumulation
CalcificationInputs from
land
export
Exchange with the ocean
AlkalinityAnomaly
CarboOcean-2006
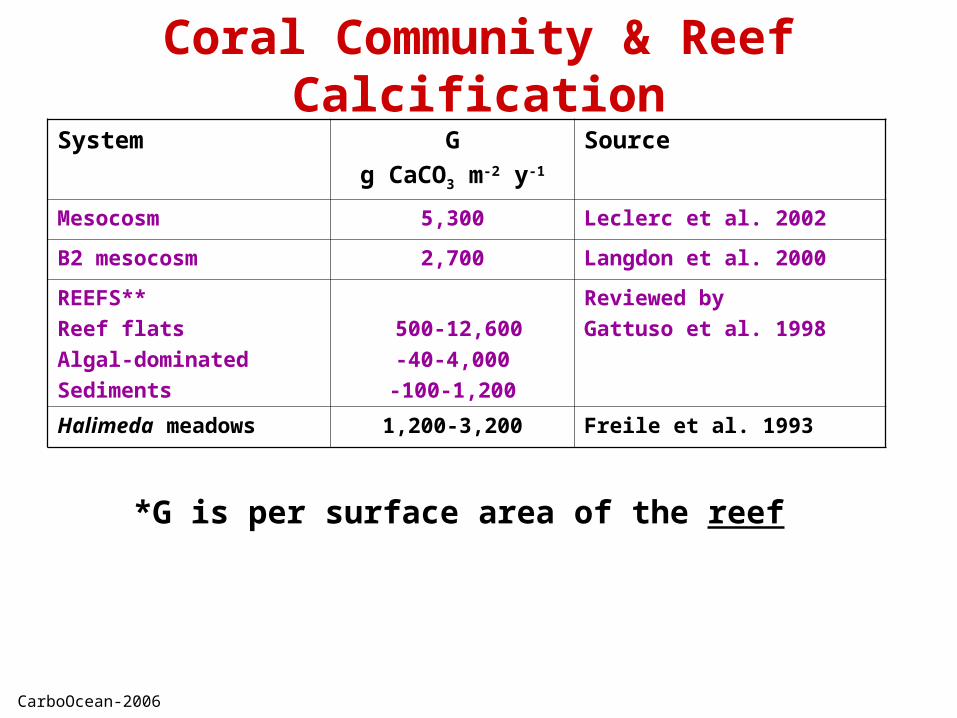
System Gg CaCO3 m-2 y-1
Source
Mesocosm 5,300 Leclerc et al. 2002
B2 mesocosm 2,700 Langdon et al. 2000
REEFS**Reef flatsAlgal-dominatedSediments
500-12,600-40-4,000
-100-1,200
Reviewed by Gattuso et al. 1998
Halimeda meadows 1,200-3,200 Freile et al. 1993
*G is per surface area of the reef
Coral Community & Reef Calcification
CarboOcean-2006
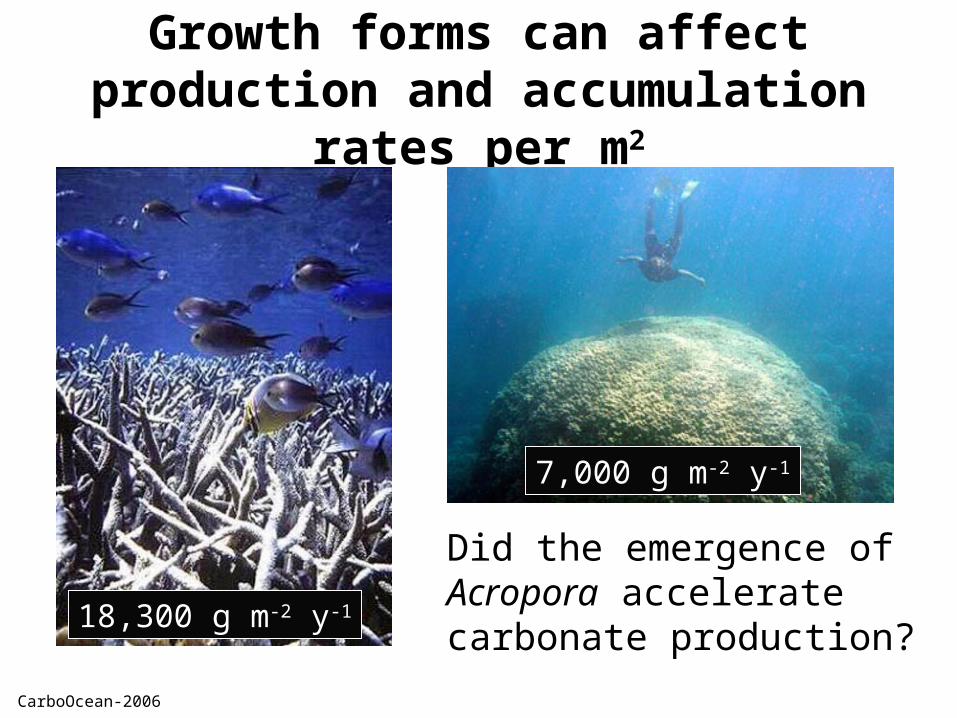
Growth forms can affect production and accumulation rates per m2
Did the emergence of Acropora accelerate carbonate production?
18,300 g m-2 y-1
7,000 g m-2 y-1
CarboOcean-2006
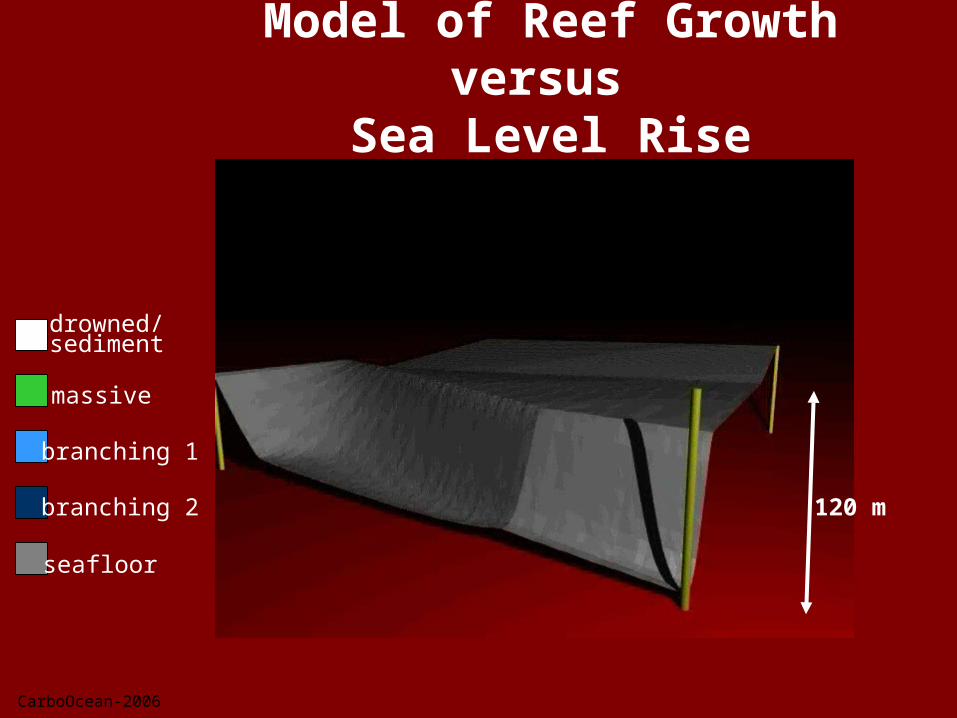
Model of Reef Growth versus Sea Level Rise
drowned/sediment
massive
branching 1
branching 2
seafloor
120 m
CarboOcean-2006
Dissolution
Photo/Resp.
InorganicCementation
Net organism calcification
Dissolution
Organic MatterResp.
InorganicCementation
Bioerosion
Dissolution
Net reef accumulation
CalcificationInputs from
land
export
Exchange with the ocean
SedimentVolume
CarboOcean-2006
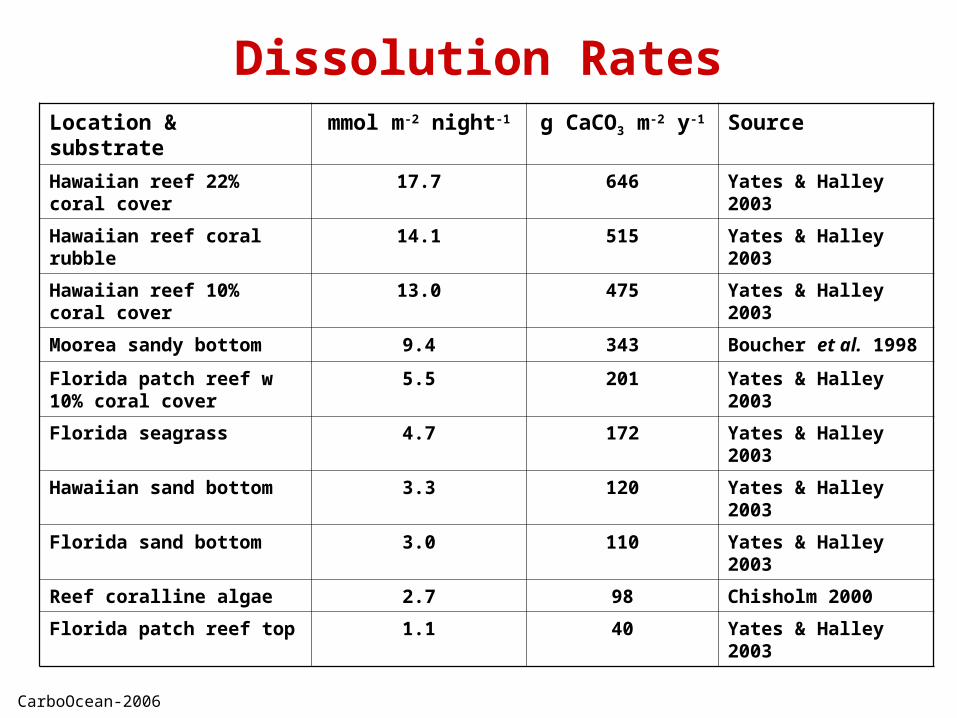
Location & substrate mmol m-2 night-1 g CaCO3 m-2 y-
1
Source
Hawaiian reef 22% coral cover
17.7 646 Yates & Halley 2003
Hawaiian reef coral rubble
14.1 515 Yates & Halley 2003
Hawaiian reef 10% coral cover
13.0 475 Yates & Halley 2003
Moorea sandy bottom 9.4 343 Boucher et al. 1998
Florida patch reef w 10% coral cover
5.5 201 Yates & Halley 2003
Florida seagrass 4.7 172 Yates & Halley 2003
Hawaiian sand bottom 3.3 120 Yates & Halley 2003
Florida sand bottom 3.0 110 Yates & Halley 2003
Reef coralline algae 2.7 98 Chisholm 2000
Florida patch reef top 1.1 40 Yates & Halley 2003
Dissolution Rates
CarboOcean-2006
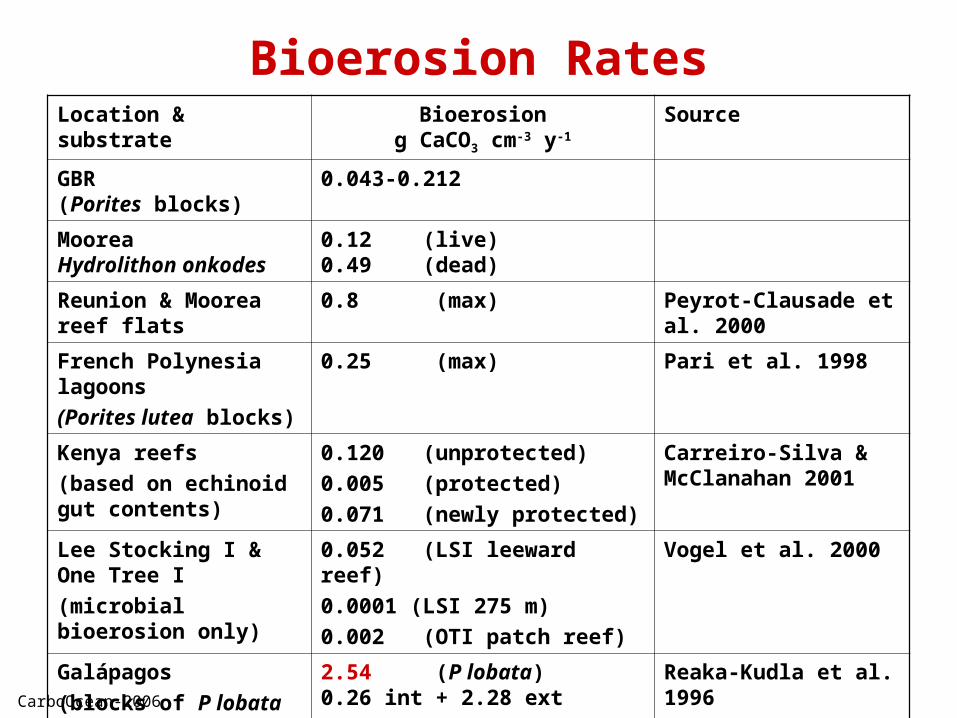
Location & substrate Bioerosiong CaCO3 cm-3 y-1
Source
GBR(Porites blocks)
0.043-0.212
MooreaHydrolithon onkodes
0.12 (live)0.49 (dead)
Reunion & Moorea reef flats 0.8 (max) Peyrot-Clausade et al. 2000
French Polynesia lagoons
(Porites lutea blocks)
0.25 (max) Pari et al. 1998
Kenya reefs
(based on echinoid gut contents)
0.120 (unprotected)
0.005 (protected)
0.071 (newly protected)
Carreiro-Silva & McClanahan 2001
Lee Stocking I & One Tree I
(microbial bioerosion only)
0.052 (LSI leeward reef)
0.0001 (LSI 275 m)
0.002 (OTI patch reef)
Vogel et al. 2000
Galápagos
(blocks of P lobata and cathedral limestone)
2.54 (P lobata) 0.26 int + 2.28 ext
0.41 (cathedral ls) 0.06 int + 0.35 ext
Reaka-Kudla et al. 1996
Bioerosion Rates
CarboOcean-2006
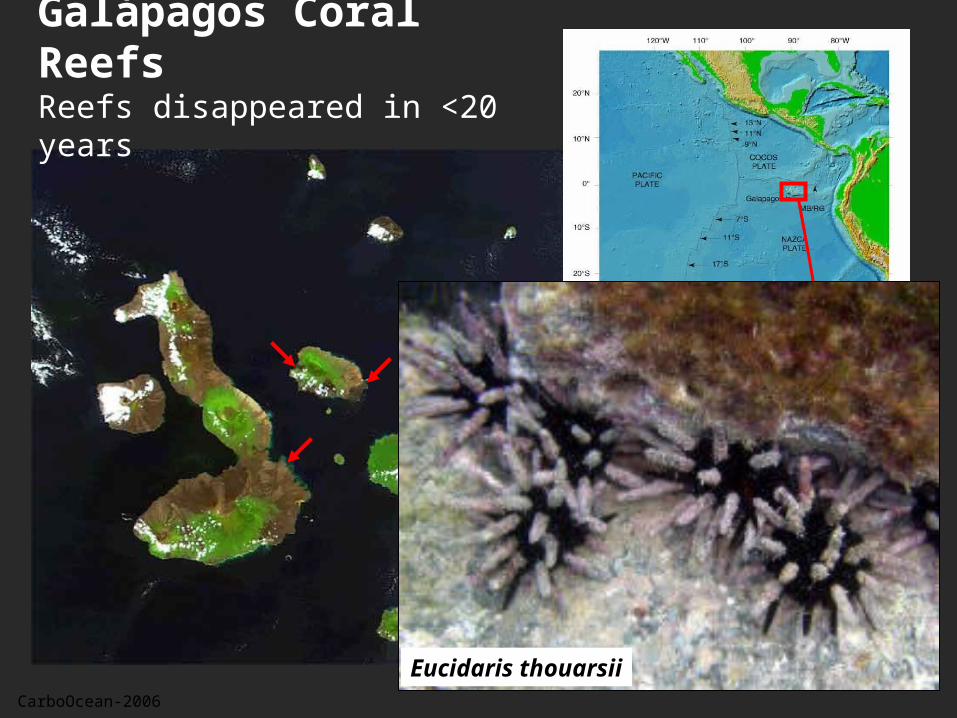
Galapagos example
Eucidaris thouarsii
Galápagos Coral ReefsReefs disappeared in <20 years
CarboOcean-2006
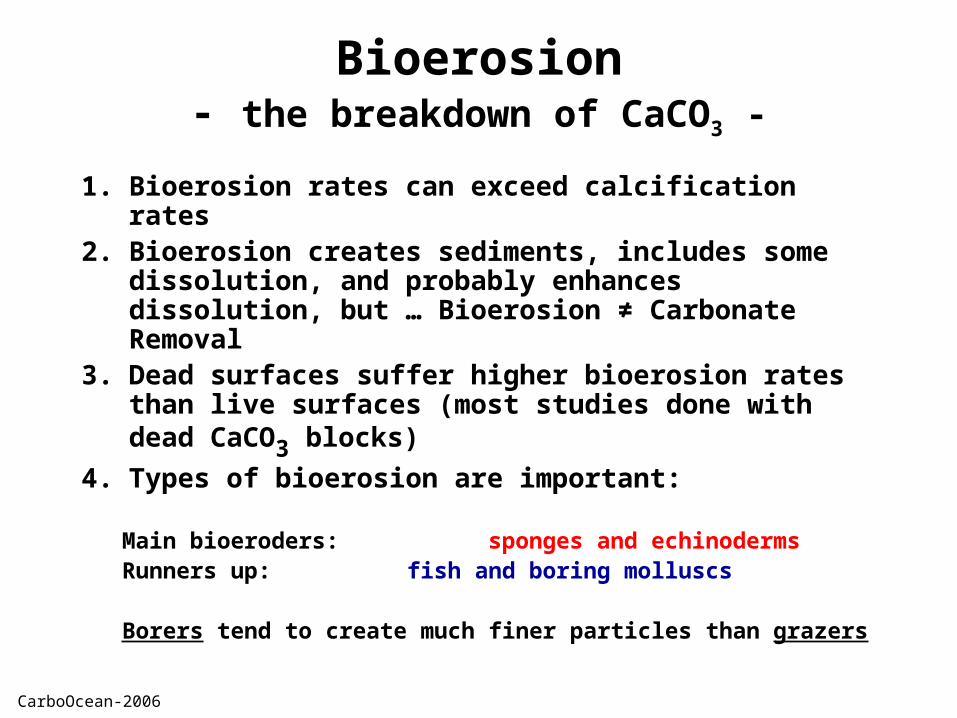
Bioerosion- the breakdown of CaCO3 -
1. Bioerosion rates can exceed calcification rates2. Bioerosion creates sediments, includes some
dissolution, and probably enhances dissolution, but … Bioerosion ≠ Carbonate Removal
3. Dead surfaces suffer higher bioerosion rates than live surfaces (most studies done with dead CaCO3 blocks)
4. Types of bioerosion are important:
Main bioeroders: sponges and echinodermsRunners up: fish and boring molluscs
Borers tend to create much finer particles than grazers
CarboOcean-2006
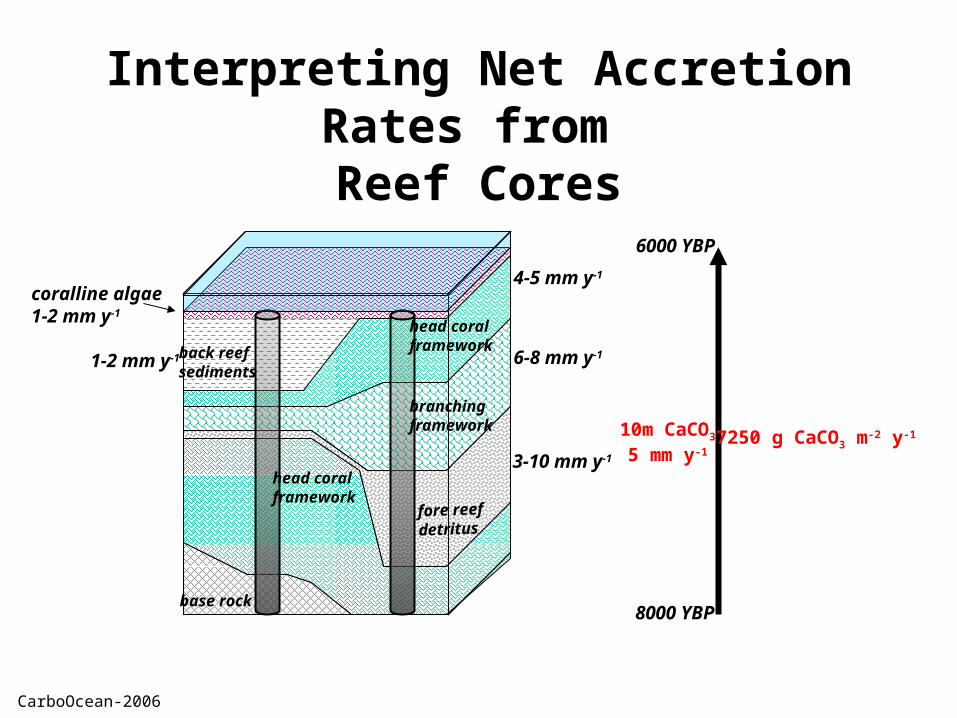
Interpreting Net Accretion Rates from Reef Cores
branchingframework
head coralframework
fore reefdetritus
head coralframeworkback reef
sediments1-2 mm y-1
4-5 mm y-1
6-8 mm y-1
3-10 mm y-1
base rock
coralline algae1-2 mm y-1
8000 YBP
6000 YBP
10m CaCO3
5 mm y-17250 g CaCO3 m-2 y-1
CarboOcean-2006
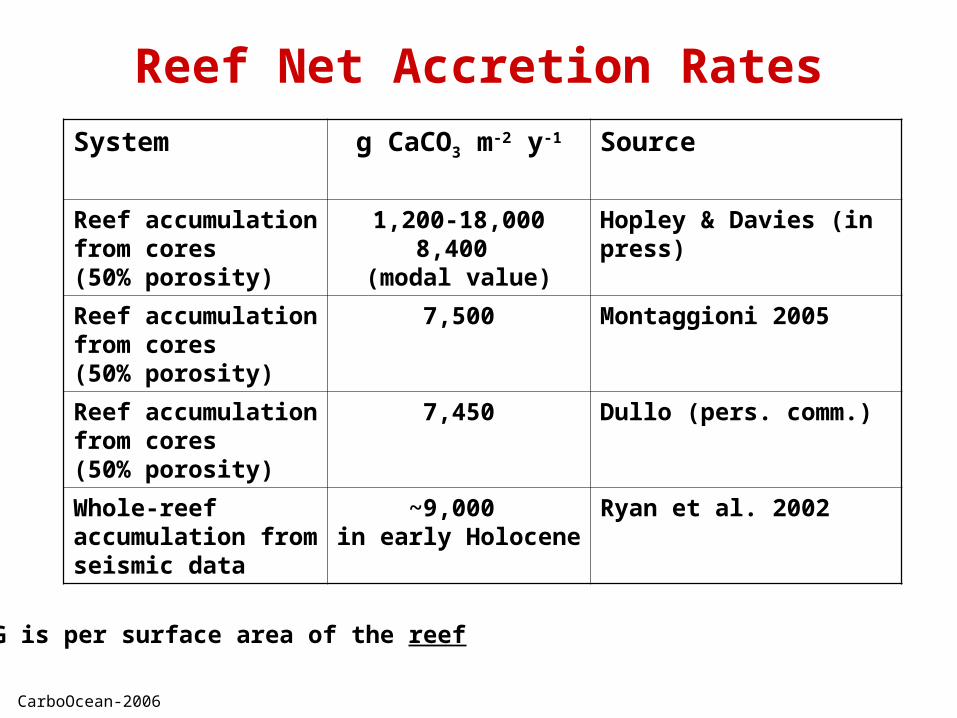
System g CaCO3 m-2 y-1 Source
Reef accumulation from cores (50% porosity)
1,200-18,0008,400
(modal value)
Hopley & Davies (in press)
Reef accumulation from cores (50% porosity)
7,500 Montaggioni 2005
Reef accumulation from cores (50% porosity)
7,450 Dullo (pers. comm.)
Whole-reef accumulation from seismic data
~9,000 in early Holocene
Ryan et al. 2002
*G is per surface area of the reef
Reef Net Accretion Rates
CarboOcean-2006
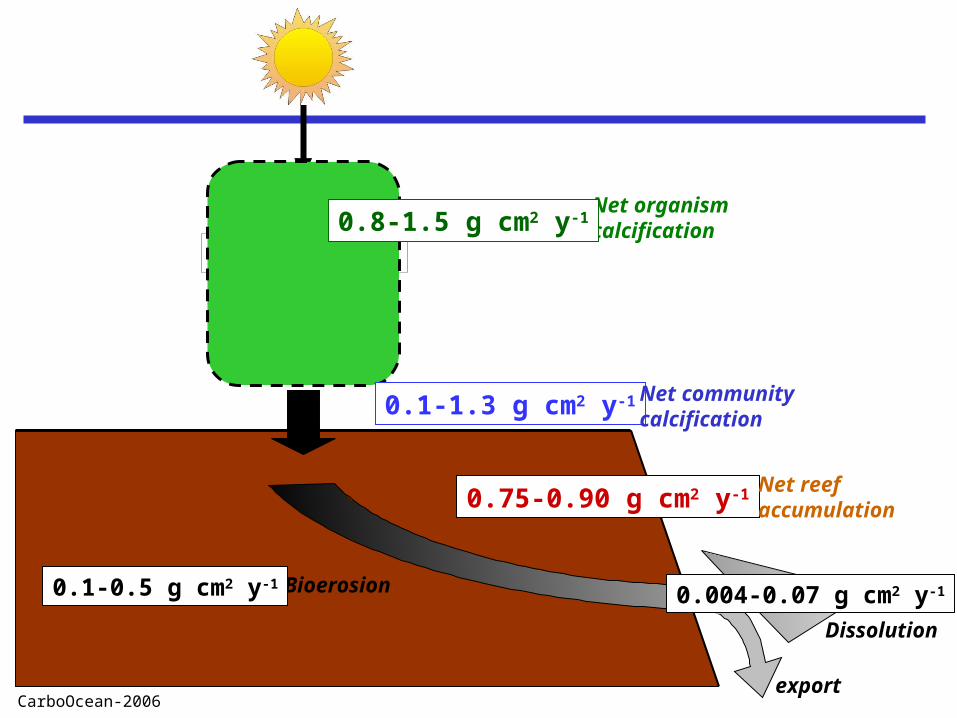
Dissolution
Photo/Resp.
InorganicCementation
Net organism calcification
Bioerosion
Dissolution
Calcification
export
0.8-1.5 g cm2 y-1
0.1-1.3 g cm2 y-1
0.75-0.90 g cm2 y-1
0.004-0.07 g cm2 y-10.1-0.5 g cm2 y-1
Net communitycalcification
Net reefaccumulation
CarboOcean-2006
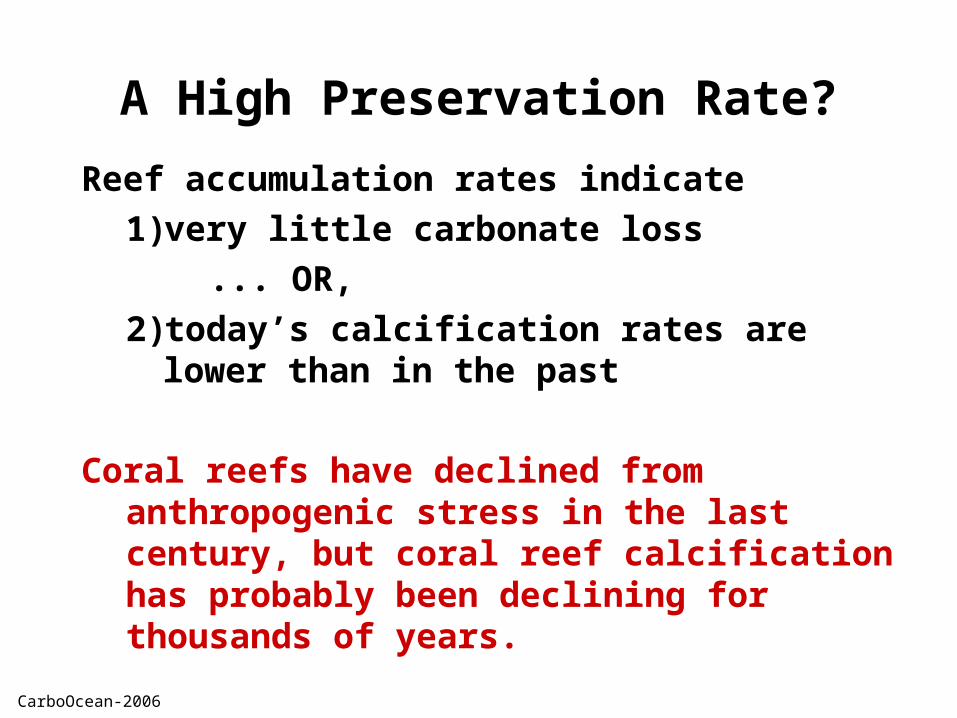
A High Preservation Rate?
Reef accumulation rates indicate
1) very little carbonate loss
... OR,
2) today’s calcification rates are lower than in the past
Coral reefs have declined from anthropogenic stress in the last century, but coral reef calcification has probably been declining for thousands of years.
CarboOcean-2006
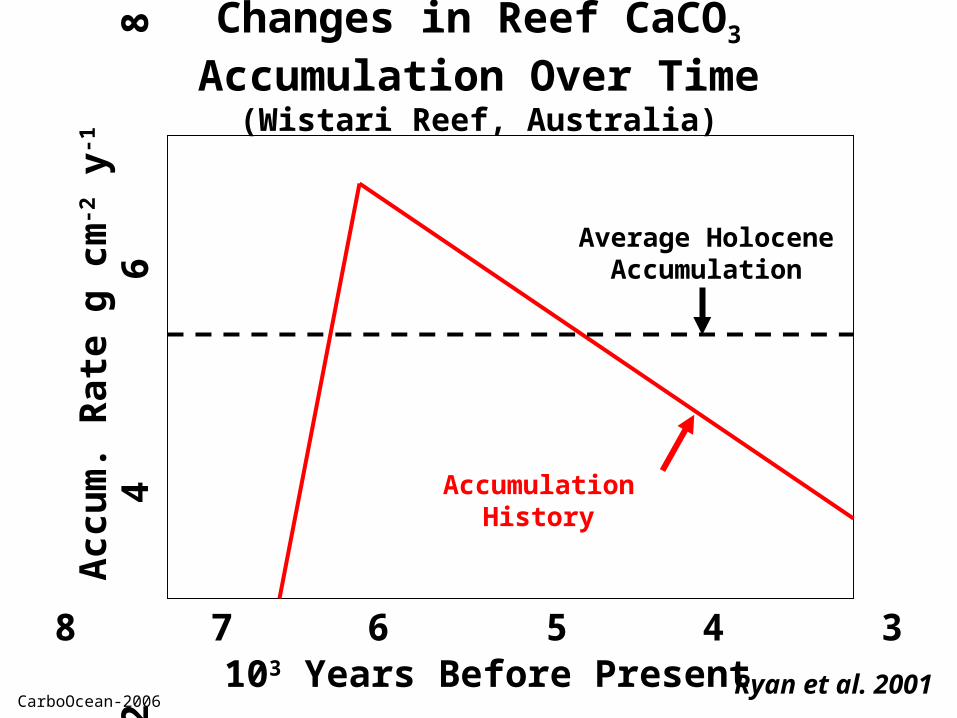
Changes in Reef CaCO3 Accumulation Over Time(Wistari Reef, Australia)
2
4
6
8
10
10 9 8 7 6 5 4 3 2 1 0
Acc
um. R
ate
g cm
-2 y
-1
103 Years Before Present Ryan et al. 2001
Average Holocene Accumulation
Accumulation History
CarboOcean-2006
Coral Reefsand the Carbon Cycle
NO
AA
Background on Reefs and Carbon
More than Reefs?
Reef CaCO3 Production & Accumulation
Controls on Reef Calcification
CarboOcean-2006
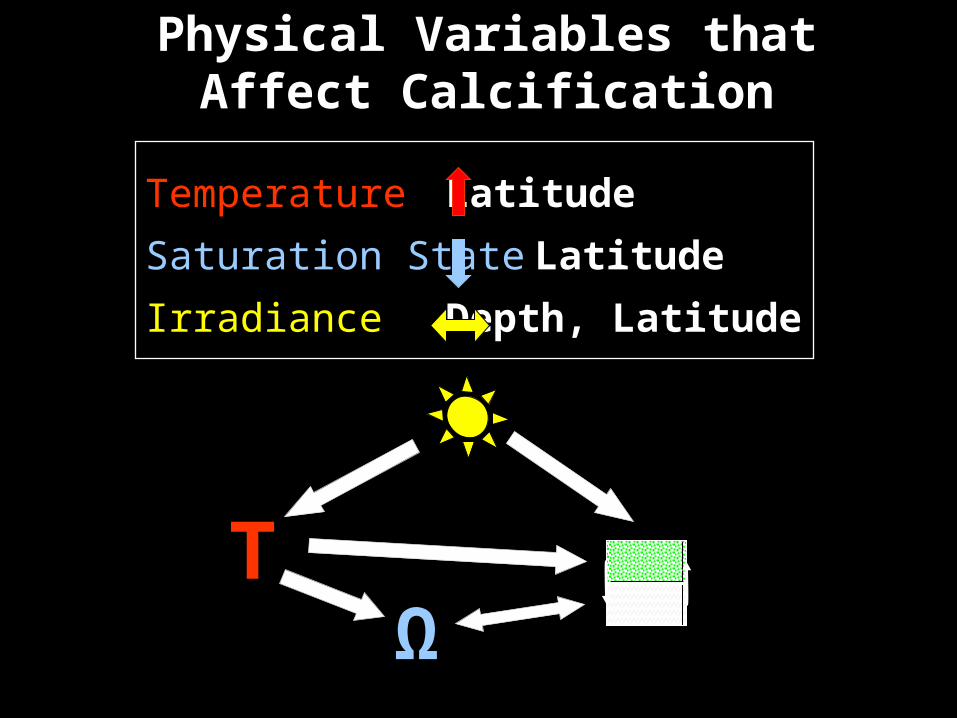
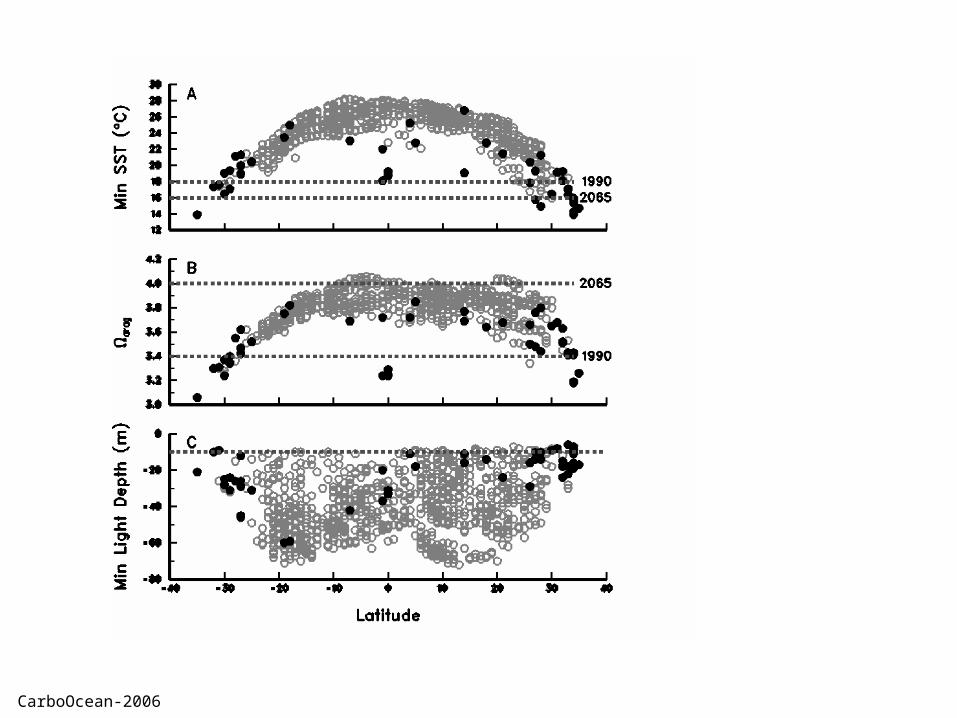
Physical Variables that Affect Calcification
TemperatureTemperature Latitude
Saturation StateSaturation State Latitude
IrradianceIrradiance Depth, Latitude
ΩΩTT
CarboOcean-2006
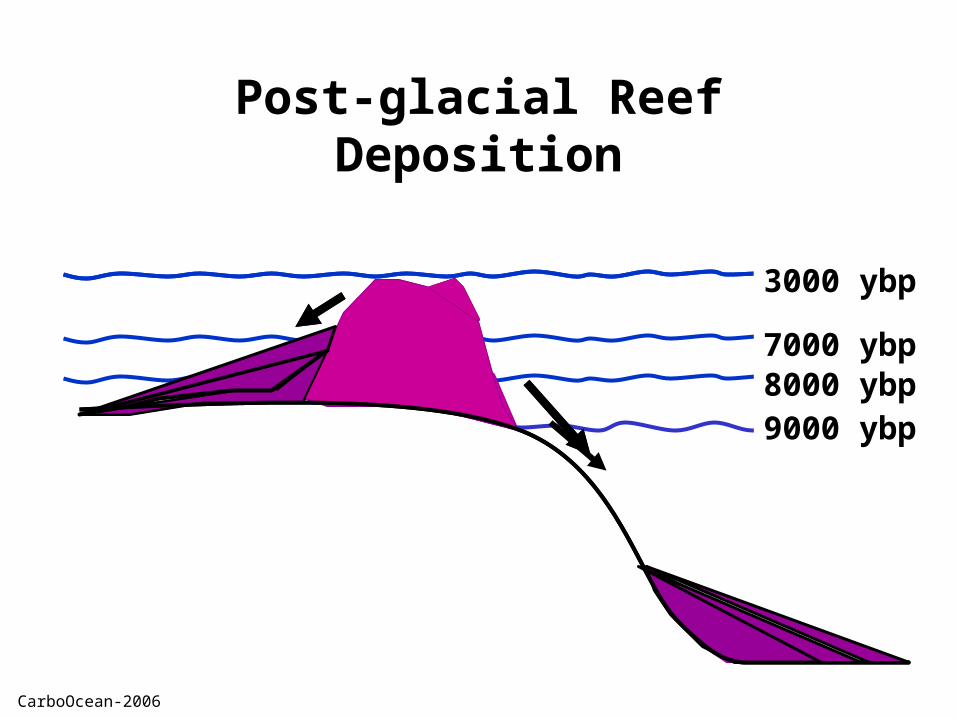
Post-glacial Reef Deposition
9000 ybp8000 ybp7000 ybp
5000 ybp5000 ybp3000 ybp
CarboOcean-2006
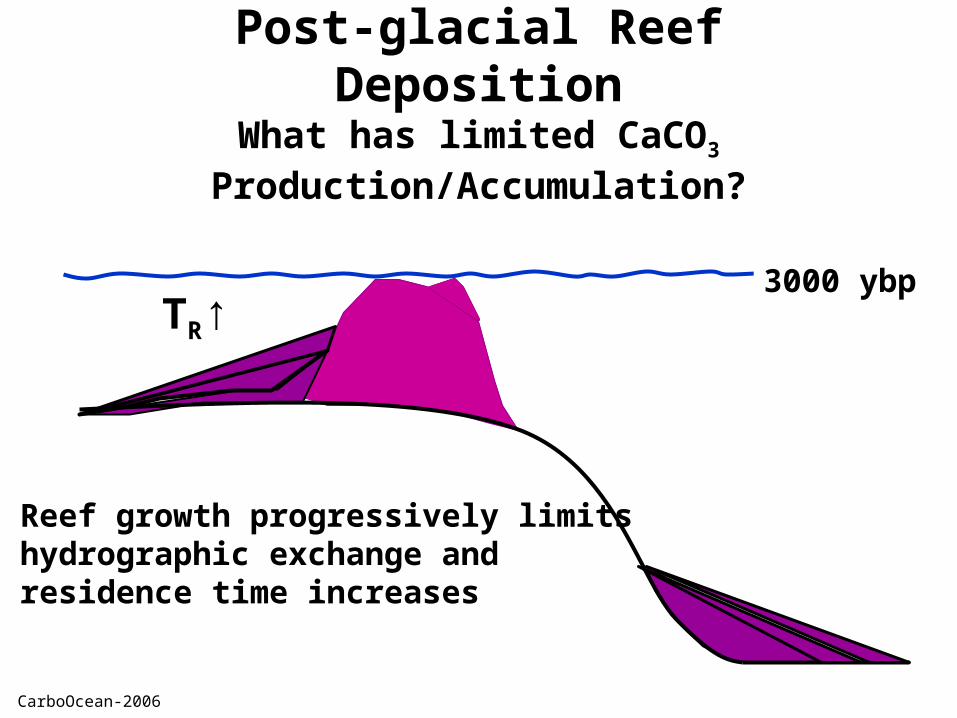
Post-glacial Reef DepositionWhat has limited CaCO3 Production/Accumulation?
5000 ybp3000 ybpTR↑
Reef growth progressively limitshydrographic exchange andresidence time increases
CarboOcean-2006
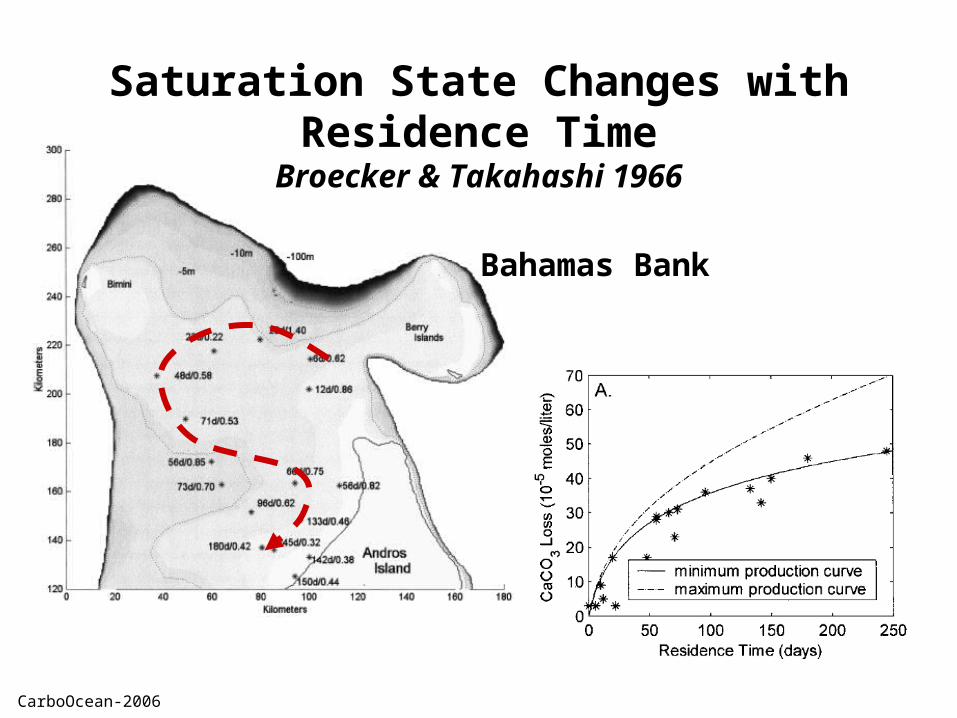
Saturation State Changes with Residence TimeBroecker & Takahashi 1966
Bahamas Bank
CarboOcean-2006
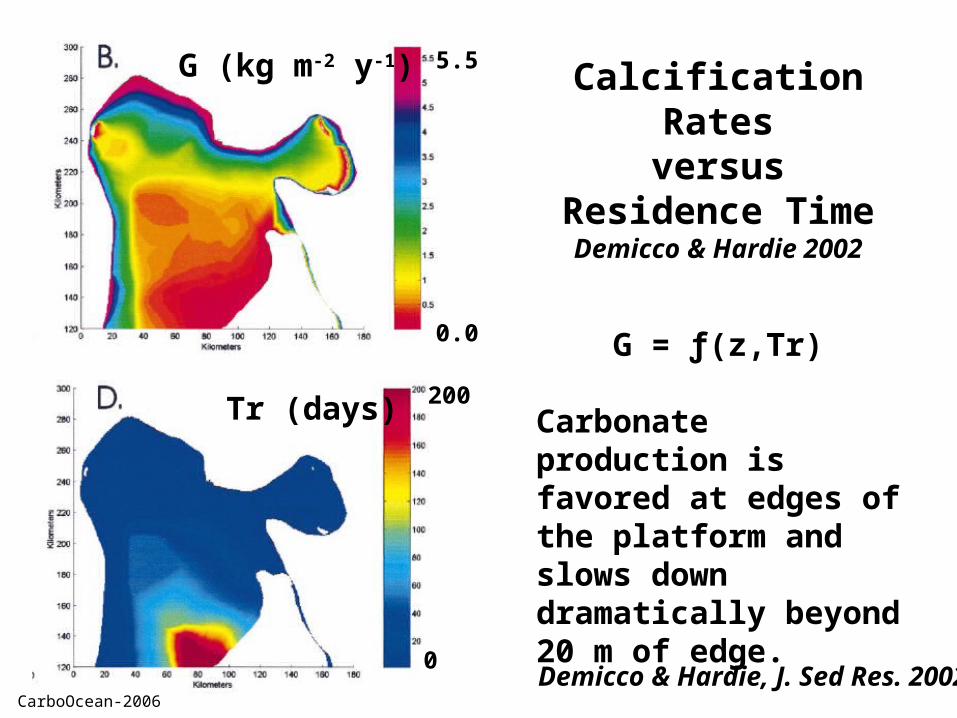
G = ƒ(z,Tr)
Carbonate production is favored at edges of the platform and slows down dramatically beyond 20 m of edge.
Demicco & Hardie, J. Sed Res. 2002
G (kg m-2 y-1)
Tr (days)
0.0
5.5
200
0
Calcification Ratesversus
Residence TimeDemicco & Hardie 2002
CarboOcean-2006
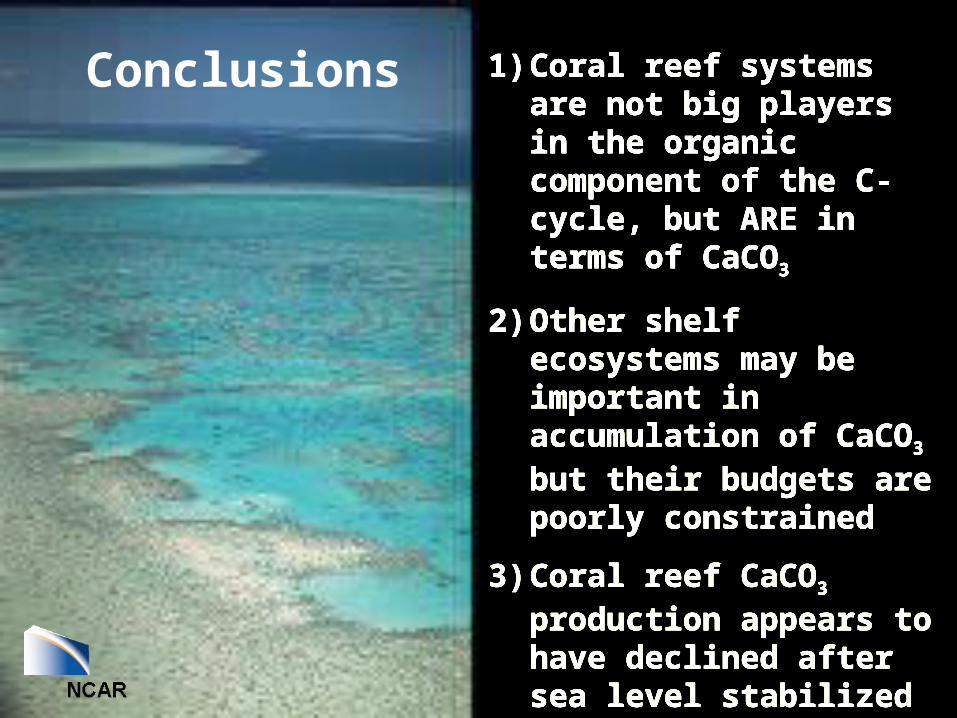
Conclusions 1) Coral reef systems are not big players in the organic component of the C-cycle, but ARE in terms of CaCO3
2) Other shelf ecosystems may be important in accumulation of CaCO3 but their budgets are poorly constrained
3) Coral reef CaCO3 production appears to have declined after sea level stabilized
4) This may be a natural process related to evolution of longer seawater residence times on continental shelves.
1) Coral reef systems are not big players in the organic component of the C-cycle, but ARE in terms of CaCO3
2) Other shelf ecosystems may be important in accumulation of CaCO3 but their budgets are poorly constrained
3) Coral reef CaCO3 production appears to have declined after sea level stabilized
4) This may be a natural process related to evolution of longer seawater residence times on continental shelves.
CarboOcean-2006
END
CarboOcean-2006
CarboOcean-2006
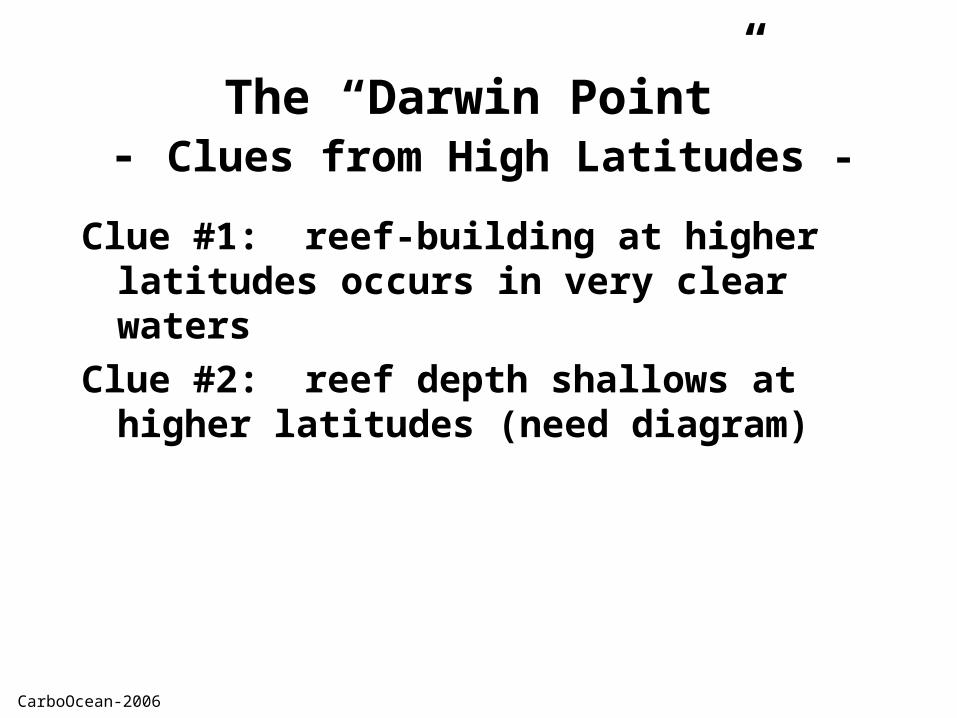
The “Darwin Point”- Clues from High Latitudes -
Clue #1: reef-building at higher latitudes occurs in very clear waters
Clue #2: reef depth shallows at higher latitudes (need diagram)
CarboOcean-2006
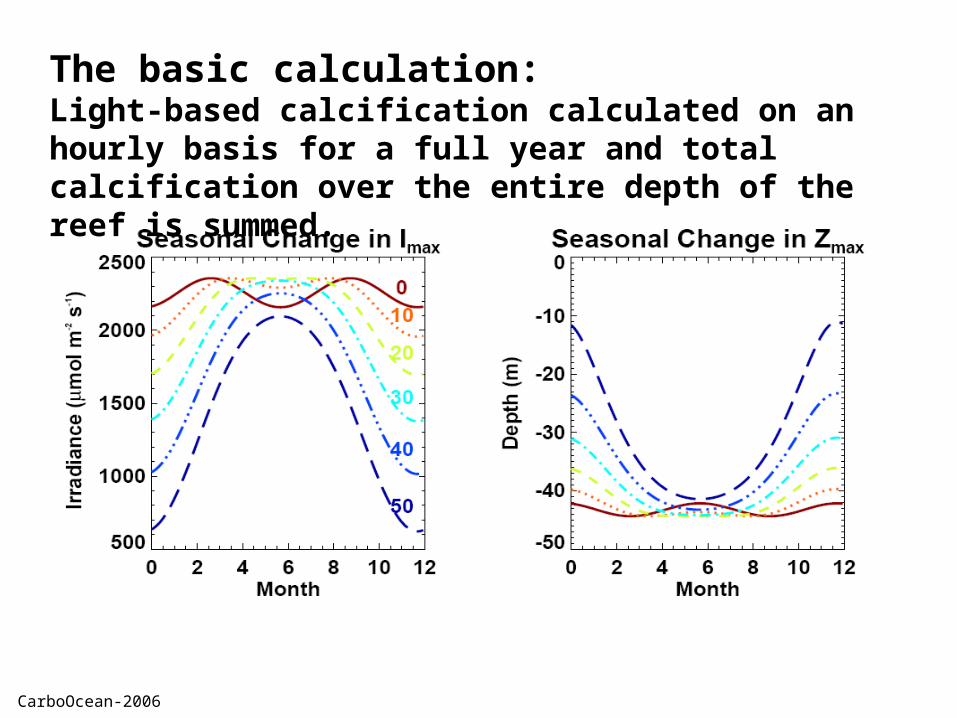
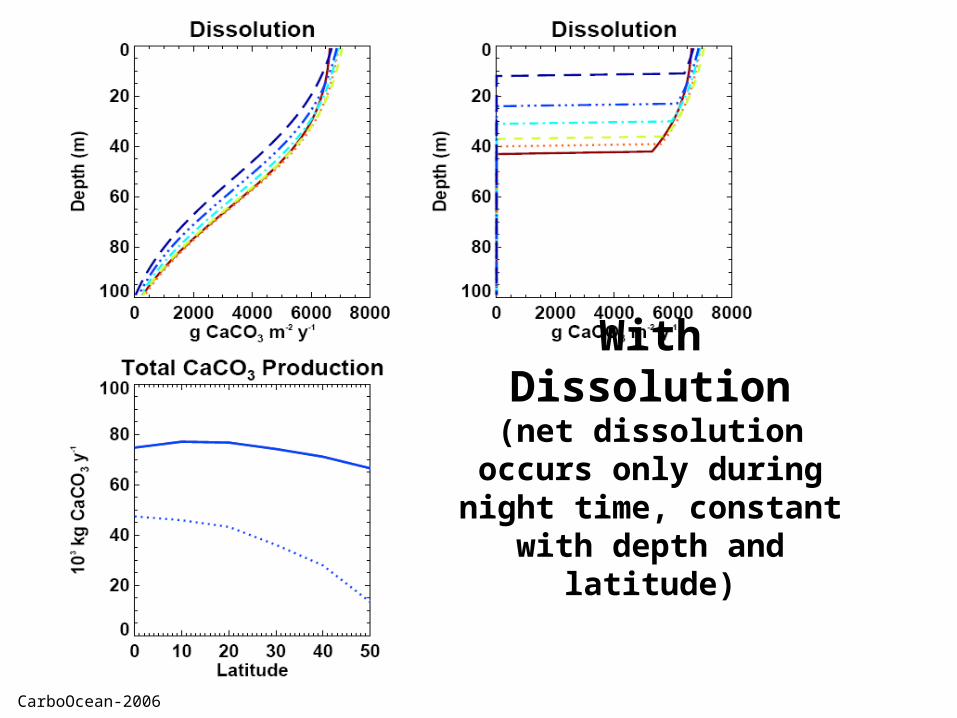
The basic calculation:Light-based calcification calculated on an hourly basis for a full year and total calcification over the entire depth of the reef is summed.
CarboOcean-2006
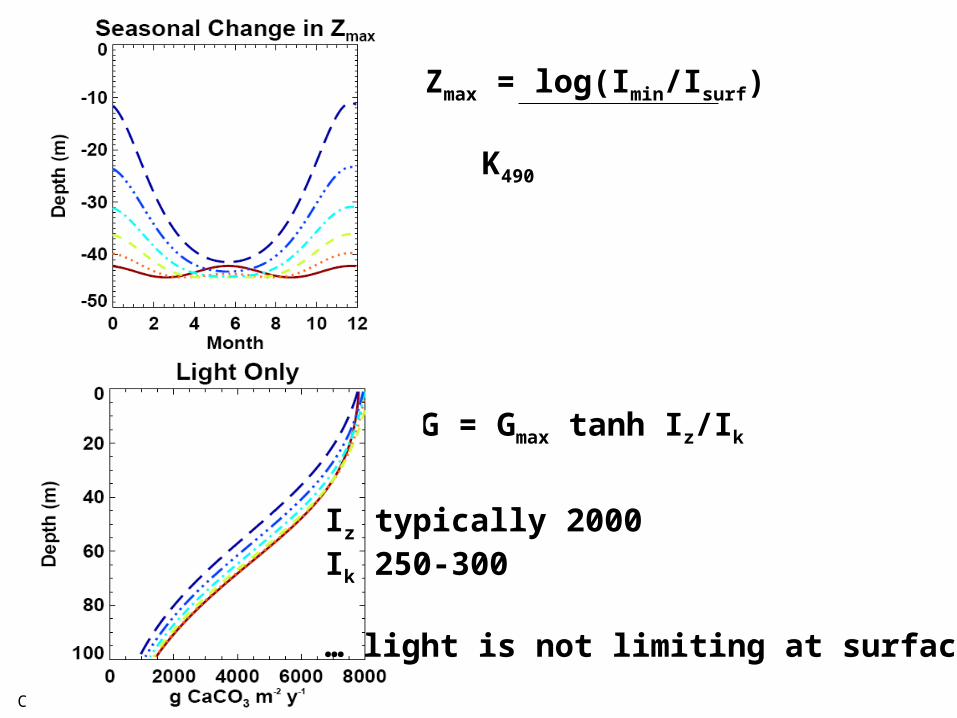
G = Gmax tanh Iz/Ik
Zmax = log(Imin/Isurf) K490
Iz typically 2000Ik 250-300
… light is not limiting at surface
CarboOcean-2006
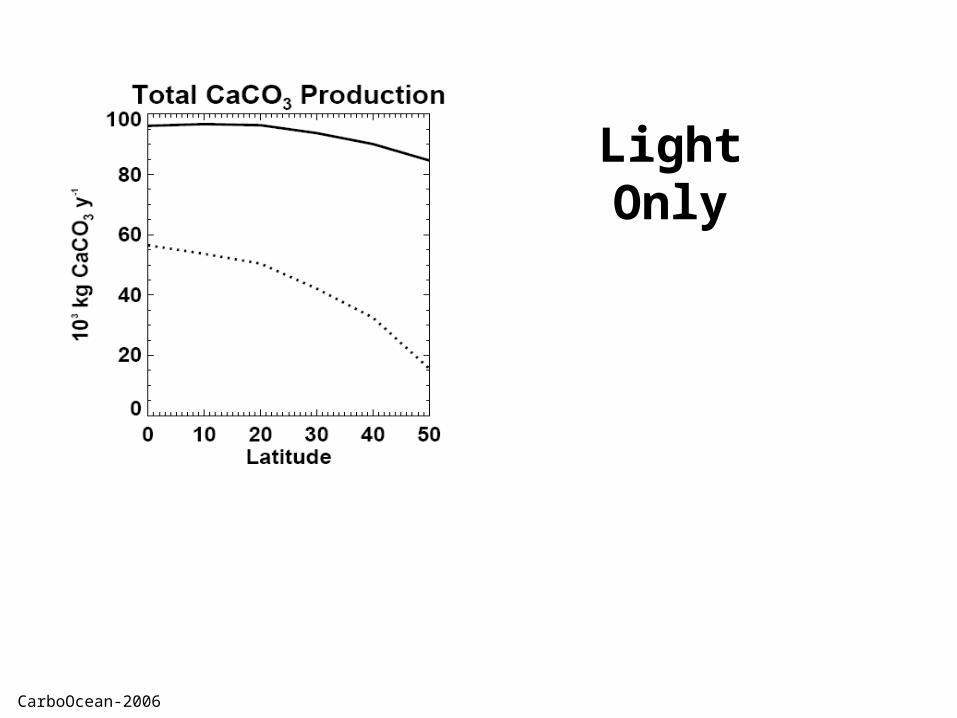
LightOnly
CarboOcean-2006
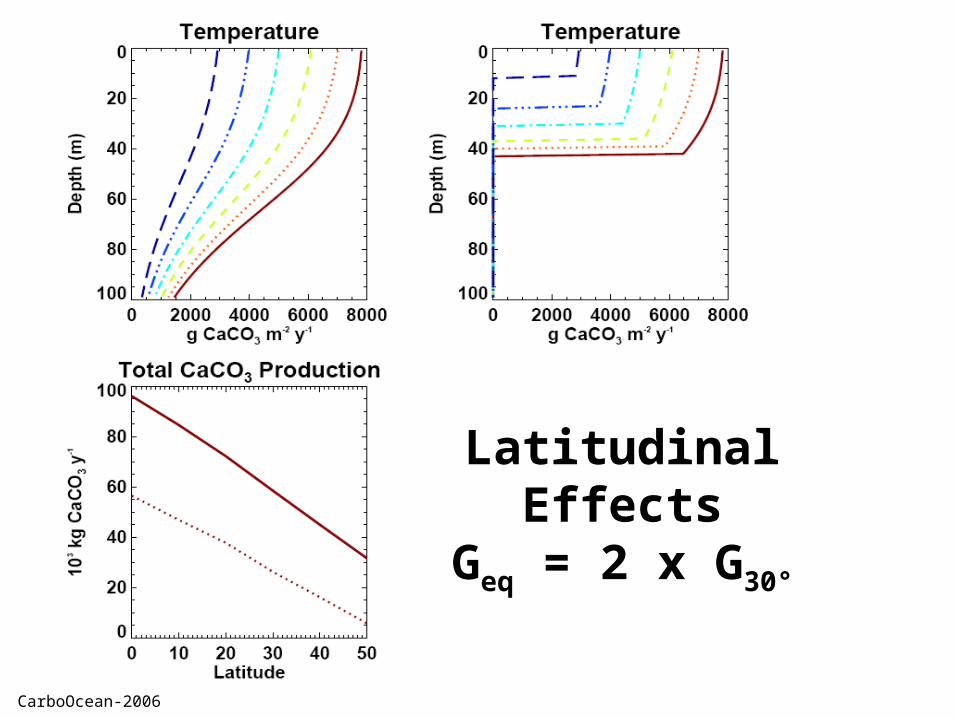
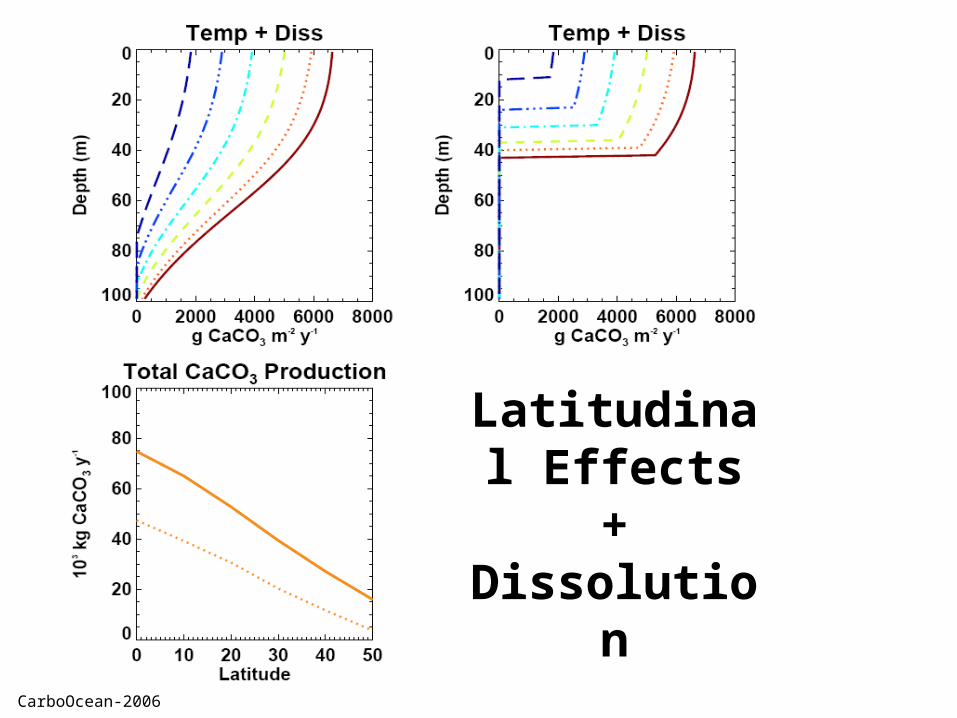
LatitudinalEffects
Geq = 2 x G30°
CarboOcean-2006
With Dissolution(net dissolution occurs only
during night time, constant with depth and latitude)
CarboOcean-2006
Latitudinal Effects
+Dissolution
CarboOcean-2006
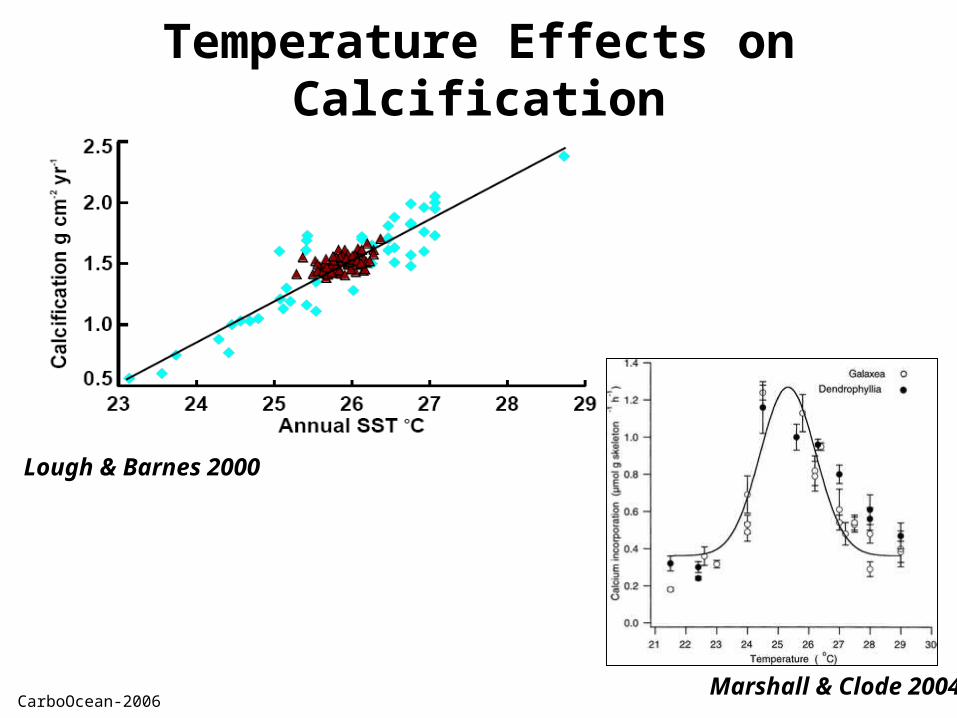
Temperature Effects on Calcification
Marshall & Clode 2004
Lough & Barnes 2000
CarboOcean-2006
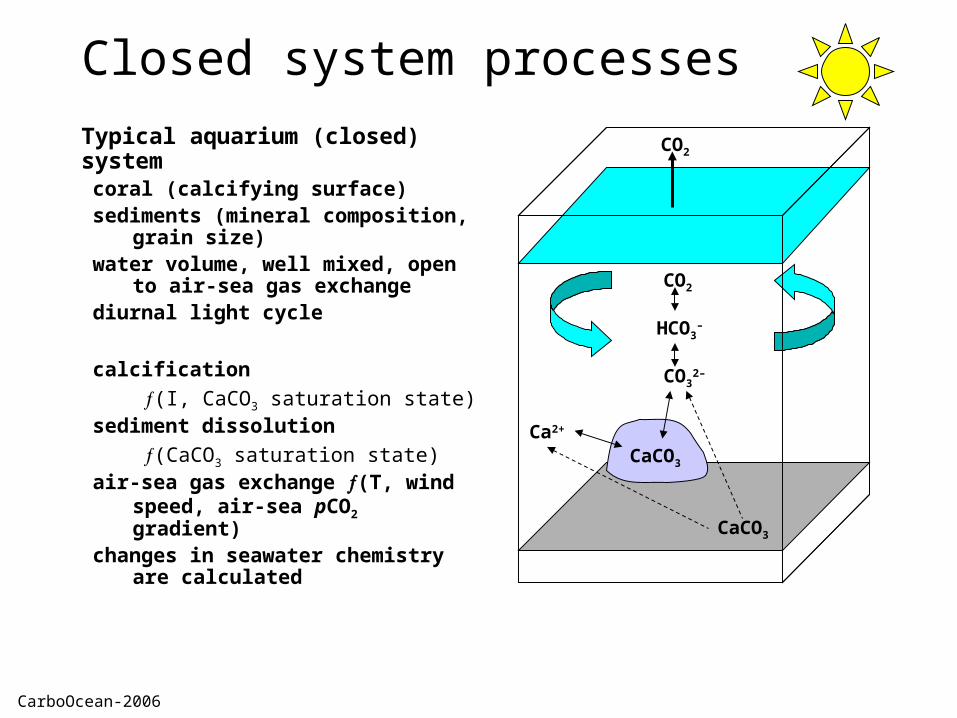
Closed system processes
Typical aquarium (closed) systemcoral (calcifying surface)sediments (mineral composition,
grain size)water volume, well mixed, open to air-
sea gas exchangediurnal light cycle
calcification
(I, CaCO3 saturation state) sediment dissolution
(CaCO3 saturation state) air-sea gas exchange (T, wind
speed, air-sea pCO2 gradient) changes in seawater chemistry are
calculated
CO32–
HCO3–
CaCO3
Ca2+
CO2
CaCO3
CO2
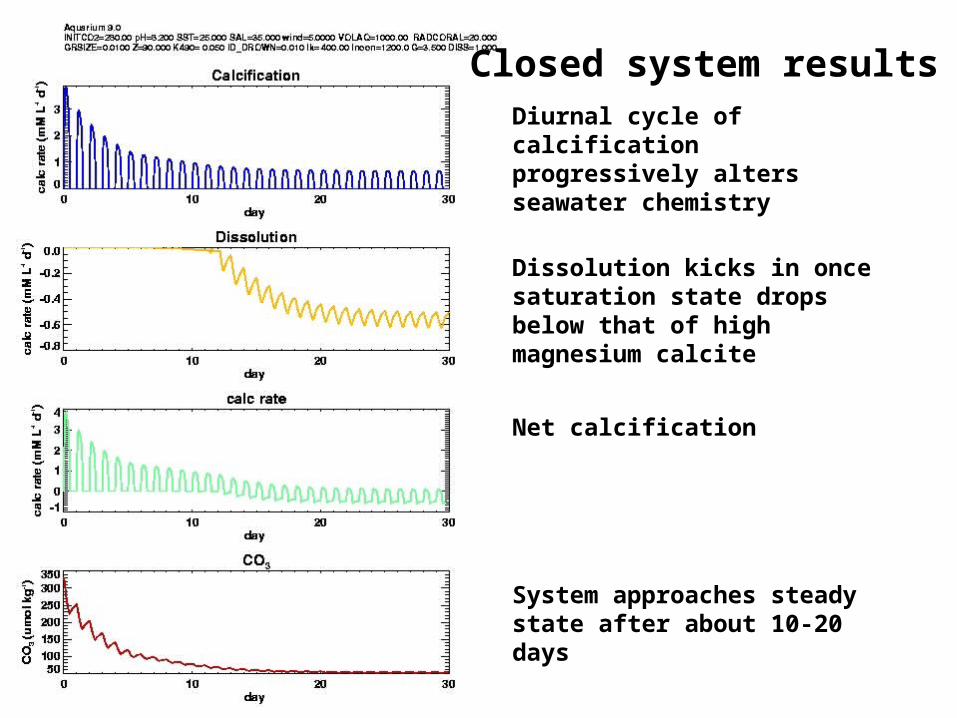
CarboOcean-2006
Closed system results Diurnal cycle of calcification progressively alters seawater chemistry
Dissolution kicks in once saturation state drops below that of high magnesium calcite
Net calcification
System approaches steady state after about 10-20 days
CarboOcean-2006
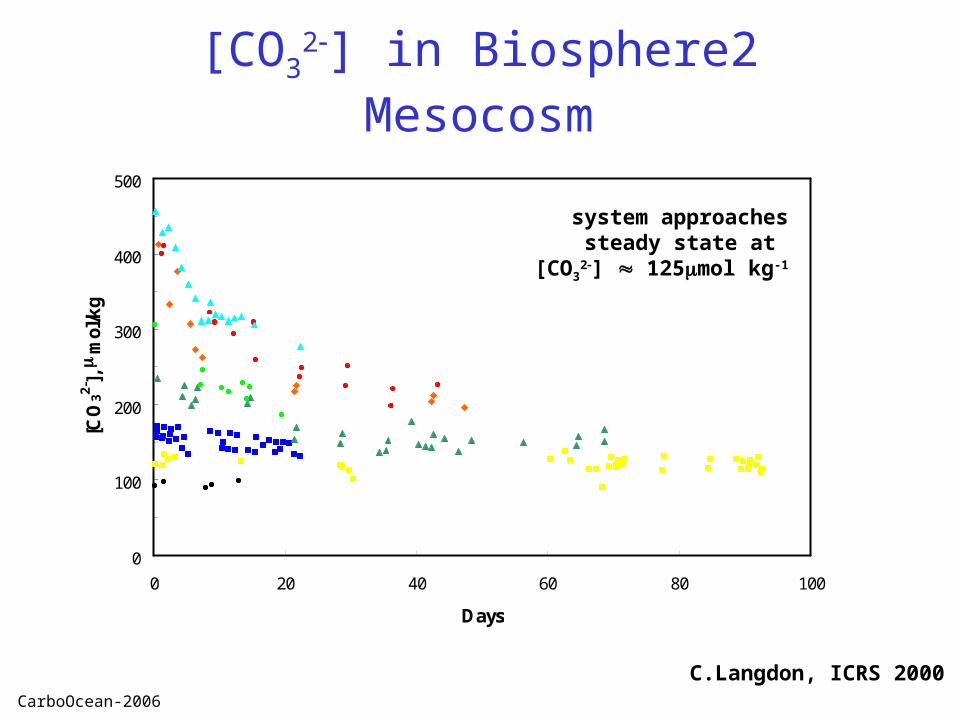
[CO32] in Biosphere2 Mesocosm
0
100
200
300
400
500
0 20 40 60 80 100
Days
[CO
32-],
m
ol/k
g
system approaches steady state at [CO3
2] 125mol kg-1
C.Langdon, ICRS 2000
CarboOcean-2006
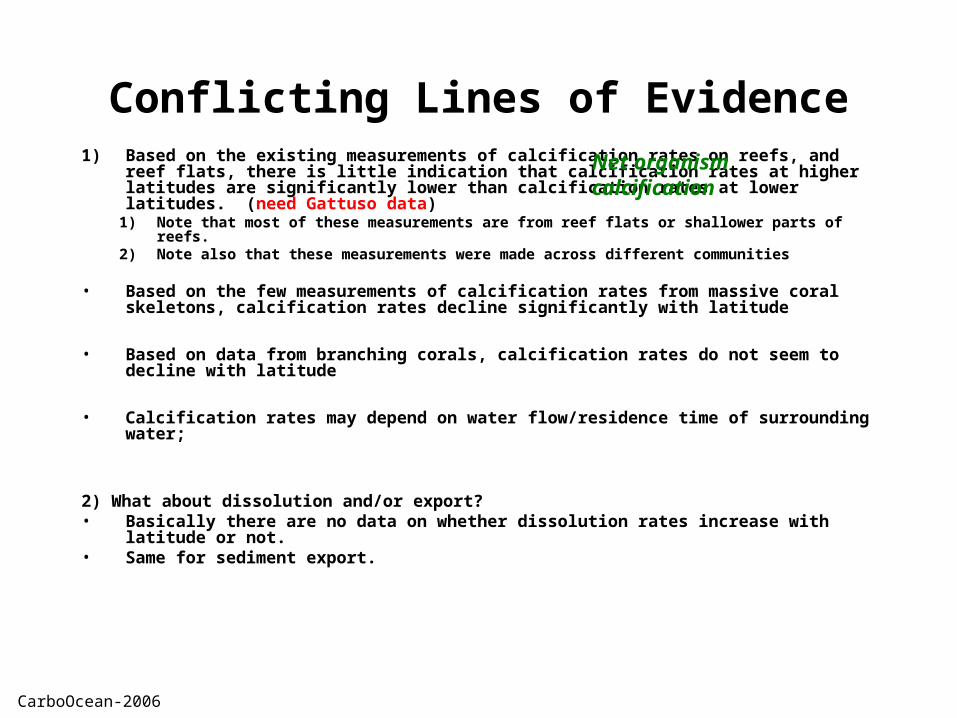
Conflicting Lines of Evidence1) Based on the existing measurements of calcification rates on reefs, and reef
flats, there is little indication that calcification rates at higher latitudes are significantly lower than calcification rates at lower latitudes. (need Gattuso data)
1) Note that most of these measurements are from reef flats or shallower parts of reefs.2) Note also that these measurements were made across different communities
• Based on the few measurements of calcification rates from massive coral skeletons, calcification rates decline significantly with latitude
• Based on data from branching corals, calcification rates do not seem to decline with latitude
• Calcification rates may depend on water flow/residence time of surrounding water;
2) What about dissolution and/or export?• Basically there are no data on whether dissolution rates increase with latitude or
not.• Same for sediment export.
Net organism calcification