Embed Size (px)
Citation preview
Copyright © Preliminary Ahead of Print version 2019 by The American Association of Petroleum Geologists
Carbonate rocks: Matrix permeability estimation Alejandro Cardona and J. Carlos Santamarina AAPG Bulletin published online 27 June 2019 doi: 10.1306/05021917345 Disclaimer: The AAPG Bulletin Ahead of Print program provides readers with the earliest possible access to articles that have been peer-reviewed and accepted for publication. These articles have not been copyedited and are posted “as is,” and do not reflect AAPG editorial changes. Once the accepted manuscript appears in the Ahead of Print area, it will be prepared for print and online publication, which includes copyediting, typesetting, proofreading, and author review. This process will likely lead to differences between the accepted manuscript and the final, printed version. Manuscripts will remain in the Ahead of Print area until the final, typeset articles are printed. Supplemental material intended, and accepted, for publication is not posted until publication of the final, typeset article. Cite as: Cardona, A., and J. C. Santamarina, Carbonate rocks: Matrix permeability estimation, (in press; preliminary version published online Ahead of Print 27 June 2019): AAPG Bulletin, doi: 10.1306/05021917345.
Prelim
inary
Version

Carbonate rocks: Matrix permeability estimation
Authors: Alejandro Cardona1 ([email protected])
J. Carlos Santamarina1 ([email protected])
Affiliation: 1 Energy Resources and Petroleum Engineering,
King Abdullah University of Science and Technology KAUST
Thuwal 23955-6900, Saudi Arabia
Acknowledgments: Support for this research was provided by the KAUST Endowment at King
Abdullah University of Science and Technology. G. E. Abelskamp edited the manuscript. Prelim
inary
Version
Abstract:
Carbonate rocks store half of the world’s proven oil reserves. Genesis and post-depositional
diagenetic processes define the porous network topology and the matrix permeability. This study
compiles a database of porosity, specific surface, mercury porosimetry and permeability values
extracted from published sources, and complements the database through a focused experimental
study. Specific surface and porosity combine to estimate the pore size Dsur. Permeability vs. Dsur
data cluster along a single trend with a slope of 2 in a log-log scale in agreement with the
Kozeny-Carman model. Discordant data points correspond to samples with dual porosity or
broad pore size distributions with long tails, where flow channels along larger interconnected
pores. Indeed, the detailed analysis of all the porosimetry data in the database shows that
permeability correlates best with the pore size D80, i.e. the 80th percentile in pore size
distributions. Once again, the best fit is a power function in terms of (D80)2, analogous to
Kozeny-Carman. The prediction uncertainty using D80 is one order of magnitude, and has the
same degree of uncertainty as more complex models and analyses. This observation suggests an
irreducible uncertainty of one order of magnitude in permeability estimation from index
properties such as porosity, mercury porosimetry and specific surface, probably due to specimen
preparation effects, inherent physical differences in permeation vs. invasion, and difficulties in
data interpretation. These estimates of permeability are most valuable when specimens are
limited to small sizes, such as cuttings.
Prelim
inary
Version
INTRODUCTION
The world energy demand has steadily increased during the last century, with an
additional 30% increase in demand predicted by the year 2040 (BP, 2018). Fossil fuels satisfy
81% of the current global energy consumption (IEA, 2018). While its share of the total
consumption will decrease to 75% by mid-century, the actual consumption of non-renewable
sources will continue to increase. Hydrocarbons comprise half of the global energy mix (IEA,
2015).
The rock porosity and permeability determine the quality of hydrocarbon reservoirs:
porosity implies storage capacity while permeability is needed for flow and recovery (Dullien,
1992; Tiab and Donaldson, 2012). Natural and induced fractures control the overall flow in
carbonate reservoirs (Golf-Racht, 1996; Gale et al., 2004; Ortega et al., 2010), however, the rate
at which stored hydrocarbons exit the matrix into fractures depends on the matrix permeability.
Permeability relates the average flow velocity to the driving total energy gradient. The
flow velocity for Newtonian fluids in laminar flow through cylindrical tubes is proportional to
the square of the tube diameter (Hagen-Poiseuille equation). The Kozeny-Carman model
considers the porous medium as a set of parallel cylindrical tubes and uses the Hagen-Poiseuille
equation to compute the effective flow velocity (Kozeny, 1927; Carman, 1937). Then, the
resulting permeability k [m2] is proportional to the square of the pore diameter D [m] and the
porosity of the porous medium ϕ [m3/m3]
𝑘 =𝜙
32𝜏' 𝐷' (1)
Prelim
inary
Version

where τ [m/m] is the tortuosity. However, pore size is not constant, and the largest
interconnected pores are responsible for most of the flow. This is confirmed by network model
studies of flow behavior at the pore scale which show the coupling between pore size, spatial
variability, and connectivity on flow patterns (Jang et al., 2011). Semi-empirical factors added to
the Kozeny-Carman equation attempt to take these processes into consideration, often through a
generic tortuosity factor (Equation 1).
Carbonate rocks store half of the world’s proven oil reserves (EIA, 2015). Genesis and
post-depositional diagenetic processes define the pore structure in carbonate rocks (Moore and
Wade, 2013). The intraparticle porosity, high friability, and chemical reactivity of carbonate
sediments affect their evolution during burial (Croizet et al., 2013; Moore and Wade, 2013), and
leads to features such as dual and occluded porosity (Figure 1 - see also Poursoltani and Gibling,
2011; Saner and Sahin, 1999). Experimental data show that the pore size in carbonates varies by
more than 6 orders of magnitude (Nelson, 2009) while the permeability varies by ~10 orders of
magnitude (Nelson, 1994), in overall agreement with the power-2 dependency anticipated by
Equation 1.
The purpose of this study is to enhance the understanding of carbonate permeability using
a physics-inspired yet data-driven approach. The following section describes the database
compiled for this study.
DATABASE - CHARACTERIZATION AND POTENTIAL PITFALLS
This study compiles a database of permeability values extracted from published sources
for carbonate rocks in the United States, Russia, the Middle East and Europe (Data sources:
Prelim
inary
Version

Brooks and Purcell, 1952; Chilingarian et al., 1990; Lucia, 1995; Mortensen et al., 1998; Lindsay
et al., 2006; Fabricius et al., 2007; Clerke, 2009; Alam et al., 2011; and Vincent et al., 2011). The
286 entries include mostly binary data in terms of permeability, rock formation, porosity,
specific surface, and/or pore size distribution (See dataset as AAPG Datashare). Permeability and
specific surface data span several orders of magnitude. While data sources use similar
measurement methods (gas adsorption for specific surface and helium expansion for porosity),
differences in test protocols, devices and data analyses add variability to the dataset.
Only thirteen entries have all three, porosity, pore size distribution and specific surface
(Paris Basin - Vincent et al., 2011). This research conducts a focused experimental study
designed to extend this dataset using eleven commercially available carbonates cores (Kocurek
Industries), some with multi-modal pore size distributions (refer to Table 1). Test details and
potential pitfalls follow.
Porosity. Weight change upon liquid saturation provides the accessible porosity (API, 1998). The
saturation procedure involved five steps: (1) vacuum, (2) CO2 injection cycles to replace the
residual air inside the specimen, (3) vacuum, (4) injection of deaired-deionized water into the
vessel, and (5) several vacuum-pressure cycles. The specimen dry weight Wdry [g] and saturated
weight Wsat [g] combine to determine the porosity ϕ using the mineral specific gravity Gs
𝜙 =(𝑊+,- −𝑊/01)𝐺+
𝑊/01 + (𝑊+,- −𝑊/01)𝐺+ (2)
Measured porosities vary between ϕ=0.11 to ϕ=0.53 (Table 1).
Prelim
inary
Version
Specific Surface. Several liquid and gas-based methods were tested to determine specific surface.
Whereas liquid adsorption measurements rely on gravimetric changes after lengthy equilibration
times (Cerato and Lutenegger, 2002), gas adsorption with krypton emerged as the most adequate
characterization procedure given the relatively low specific surface area of carbonates
(Micromeritics ASAP 2420 - Beebe et al., 1945). The measured specific surface areas range
from Ss=0.5 to 1.3 m2/g. This coincides with reported values for carbonate rocks (Chilingarian et
al., 1990; Vincent et al., 2011).
Tests were conducted with carbonates crushed to two different sizes. Results summarized
in Table 1 show that the measured specific surface depends on crushed particle size, even though
the external surface area is negligible in all cases (e.g., the external surface is 0.03 m2/g for 70
µm grains). This suggests that sample crushing gives access to occluded porosity and creates
new gas pathways (Note: calibration tests showed equipment variability of less than 4%).
Pore Size Distribution. Mercury intrusion porosimetry MIP measures the volume of mercury that
invades the specimen as a function of pressure (Giesche, 2006). Mercury invades along
percolating paths, and occluded porosity remains untested. The Young-Laplace equation relates
the measured pressure to pore throat size (León y León, 1998) while injected volumes
correspond to pore bodies. Consequently, large pores may be assigned to small pore throats, i.e.,
the ink-bottle effect (Diamond, 2000; Moro and Böhni, 2002).
Pore size distributions obtained from mercury injection porosimetry tests are usually
presented in terms of pressure P [Pa] and the logarithm of the differential intrusion g(D) for a
given saturation S [m3/m3]
Prelim
inary
Version

𝑔(𝐷) =𝑑𝑆
𝑑(𝑙𝑛𝑃) = 𝑃𝑑𝑆𝑑𝑃 (3)
This definition emphasizes dual porosity systems and amplifies the contribution of large pores.
However, the “physical” pore size density function f(D) relates pressure to capillarity in terms of
the surface tension γ [N/m] and the contact angle θ [rad] (Lenormand, 2003).
𝑓(𝐷) =𝑃'
2𝛾𝑐𝑜𝑠𝜃𝑑𝑆𝑑𝑃 =
𝑃2𝛾𝑐𝑜𝑠𝜃 𝑔
(𝐷) =2𝐷 𝑔
(𝐷) (4)
Therefore, the commonly used distribution g(D) has a pore size-dependent amplification of the
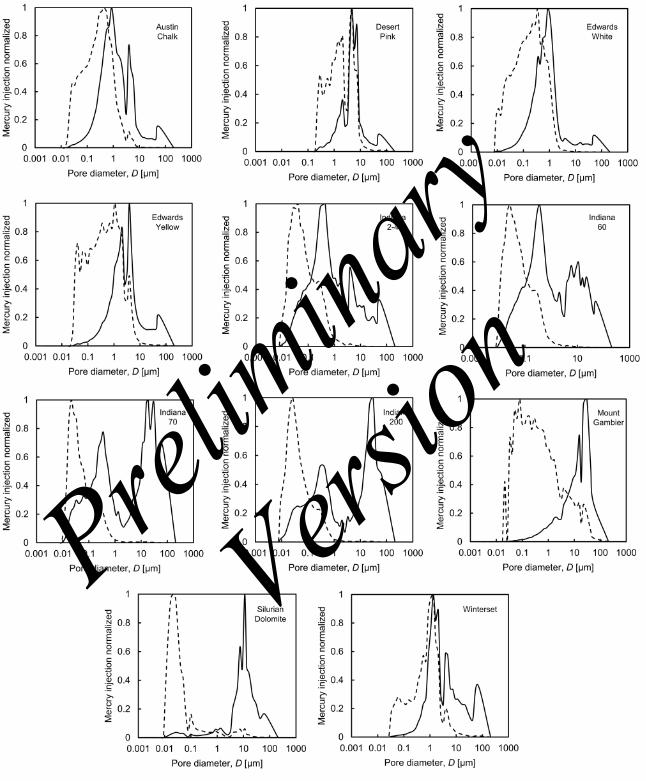
true pore size distribution g(D)= D× f(D)/2. Figure 2 shows the pore size distributions g(D) and
f(D) obtained for the eleven specimens tested in this study. The estimated mean pore sizes
computed from g(D) are significantly smaller than the mean pore sizes obtained from f(D). These
results highlight profound differences in the potential interpretation of these data.
Permeability. The permeability of all eleven specimens was measured using a gas permeameter
(MetaRock SSK-300). Ends remained unpolished to avoid fines clogging near the inlet face of
the cylindrical specimens (diameter: 25 mm [1 in]; length: 50mm [2 in]), and limited pressure
gradients prevented non-linear effects. Values of N2-permeability measured at different mean
pressures were used to correct for Klinkenberg’s effect. Table 1 includes the measured
permeability values.
Prelim
inary
Version
DATA ANALYSES
Porosity and Carbonate Classification. Empirical models for carbonate permeability focus on
porosity as a predictive parameter (Jennings and Lucia, 2003; Babadagli and Al-Salmi, 2004;
Lucia, 2007). The inherent limitation in empirical models that are based exclusively on porosity
is highlighted by the contrast between the very narrow range in porosity (say, 0.1<ϕ<0.6) versus
the 10 orders of magnitude in the permeability range (Nelson, 1994).
Additional information can be included, such as carbonate classification in terms of
textural features and particle size, as these features provide information about genesis and
ensuing pore topology (Pemberton and Gingras, 2005; Boggs, 2009; Uddin et al., 2017).
Dunham’s classification distinguishes (Dunham, 1962): (a) coarse-grained dominant
carbonates (grainstones: dolograinstones and large crystalline grainstones) (b) carbonates with a
coarse-grained structure but with fines in pores (packstones), and (c) fines-dominant carbonates
(wackestone, mudstone and fine crystalline limestones and dolostones). Then, the empirical
permeability-porosity power-model (Lucia, 1995),
𝑘 = 𝑎𝜙C (5)
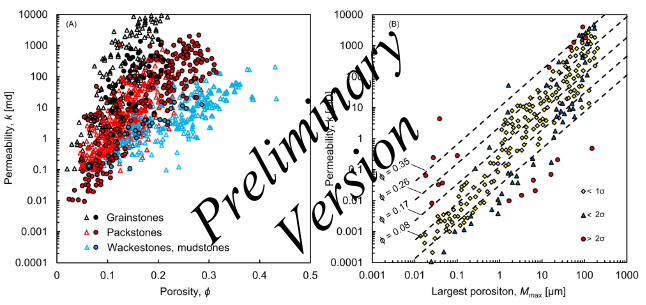
relates the a-factor and b-exponent to carbonate rock type. Figure 3A superimposes two datasets
for non-vuggy carbonate reservoirs in the United States and in the Middle East (Lucia, 1995;
Lindsay et al., 2006). Lucia’s model highlights the importance of rock type and the role of fines
or “mud” on pore networks and permeability, yet predictions have more than one order of
magnitude in uncertainty, in part due to potential differences in pore structure (see thin section
based analyses in Weber et al., 2009).
Prelim
inary
Version
Porosity, Pore Size Distribution and Pore Structure. Other models relate permeability to pore size
distributions inferred from mercury porosimetry (Swanson, 1981; Katz and Thompson, 1986;
Glover et al., 2006; Rezaee et al., 2006; Zhiye and Qinhong, 2013). Data analyses reveal that the
largest modal element or “porositon” Mmax [µm] determines the matrix permeability [md] in
carbonates with multimodal pore size distributions (Figure 3B – Clerke et al., 2008; Clerke,
2009)
𝑙𝑜𝑔(𝑘) = −1.54 + 1.2 𝑙𝑜𝑔(𝑀I,J) + 7.3𝜙 (6)
More detailed analyses assume an internal pore structure such as fractal, consider critical
path analysis, and/or apply percolation theory (Charlaix et al., 1987; Friedman and Seaton, 1998;
Hunt and Gee, 2002; Buiting and Clerke, 2013; Daigle, 2016). For example, Buiting and Clerke
(2013) match mercury porosimetry data with one or more Thomeer hyperbolas and extract three
parameters: the maximum invaded volume f*, pressure at first invasion Pd [kPa], and pore
geometry factor G. Through mathematical analysis, these three parameters combine to predict
the rock permeability (Assumes tortuosity ~2 and fractal dimension ~1.56 – See resemblance
with the earlier empirical models by Swanson [1981] and Thomeer [1983]):
𝑘 = 24050∅∗
(𝑃/)'𝑒PQ.QR√T (7)
where permeability is in Darcy. The application of models based on pore size distribution
derived from MIP is not straightforward (starting from the interpretation of pore size distribution
data discussed above – Equation 4). While authors tend to highlight model predictability, results
obtained as part of this study using these models against the dataset show at least one order of
magnitude in uncertainty.
Prelim
inary
Version
Porosity and Specific Surface. Permeability is a measure of the drag that a viscous fluid
experiences as it traverses a porous medium. Therefore, the data compilation and the
experimental dataset include specific surface and porosity. Data reported in terms of the
volumetric specific surface Svol [m2/cm3] are converted to the gravimetric specific surface Ss
[m2/g] as:
𝑆+ =1
(1 − 𝜙)𝜌𝑆VWX (8)
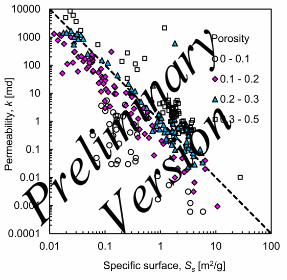
where ρ [g/cm3] is the mass density of solids. Figure 4 illustrates permeability versus specific
surface on a log-log scale. Data subsets of equal porosity cluster along lines with a slope of -2 in
the log-log plot.
The Kozeny-Carman equation highlights the importance of pore size on permeability
(Equation 1). The specific surface Ss, porosity f and mineral mass density ρ combine to estimate
the pore size Dsur [m] that corresponds to the measured surface area:
𝐷+Y0 = 𝛼 [𝜙
(1 − 𝜙)1𝑆+𝜌
\ (9)
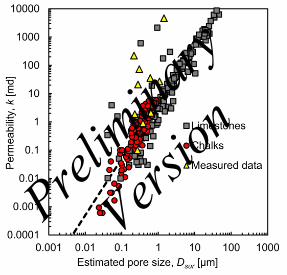
where the α-factor is a function of the fabric and pore topology, as shown in Figure 5. Figure 6
plots permeability values in the database as a function of the pore size estimated with Equation 9
for α=4 (i.e., parallel cylindrical tubes – Figure 5). All data points cluster along a single trend
with a slope of 2 in a log-log scale in agreement with the Kozeny-Carman model in Equation 1
(see analogous conclusions for a wide range of sediments in Ren and Santamarina, 2018) . Most
values fall within one order of magnitude of the main trend. The best fit line is
Prelim
inary
Version
𝑘 = 5(𝐷+Y0)' (10)
where Dsur is in micrometers [µm] and permeability is in milidarcy [md]. This equation allow us
to predict permeability from Ss and f values determined from small samples such as cuttings
when pores are significantly smaller than the cutting size. In carbonates, the size of cuttings
ranges from 1-to-10 mm long depending on drilling conditions (Archie, 1952; Dogruoz et al.,
2016), therefore cuttings are ~3 orders of magnitude larger than pores. However, cuttings impose
an inherent bias as they break preferentially along more porous and weaker planes, therefore,
predicted permeabilities are lower-bound estimates of the formation permeability.
DISCUSSION
Representative pore size. Out-of-trend data points in Figure 6 suggest that the pore size Dsur
estimated from porosity and specific surface may not be an accurate predictor of the pore size
that controls permeability in all cases. Discordant data points either have clear dual porosity (see
the g(D) representation for Indiana-60, Indiana-70 and Indiana-200 in Figure 2), or they exhibit
very broad pore size distributions with long tails (Mount Gambier, Silurian Dolomite and
Winterset specimens – Figure 2).
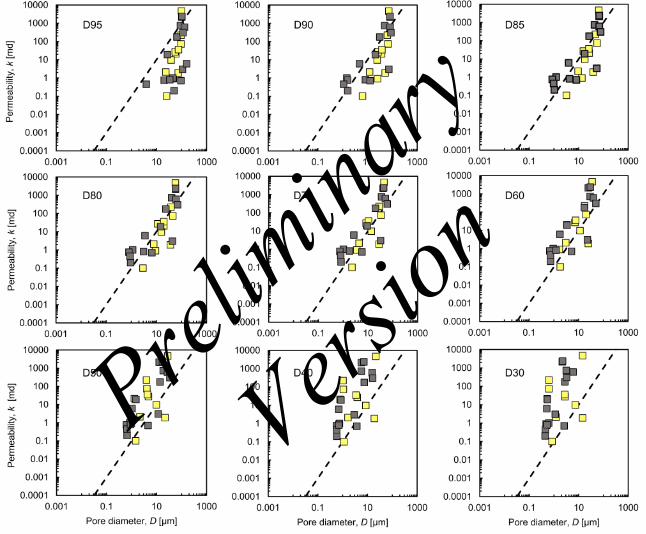
The representative pore size that is most predictive of permeability is explored in Figure
7 where the measured permeability values are plotted against selected pore diameter percentiles
from f(D) signatures (Equation 4 - Note: the representative pore size for permeability is
equivalent to the concept of critical pore size in other studies - Arns et al., 2005; Nishima and
Yokoyama, 2017). The dataset used for this analysis includes the eleven samples tested in this
study plus thirteen carbonate samples from the literature (Vincent et al., 2011). The computed
Prelim
inary
Version
square error and visual inspection confirm that the pore size between D70 and D85 (i.e., the 70th
and 85th percentiles in porosimetry data) provides the most predictive permeability vs. pore size
regression [µm] for all specimens (data range: 0.1md <k<10,000md)
𝑘 = 0.2(𝐷]^)_.`a ≈ 0.1(𝐷]^)' (11)
While the first equation is the best fit, the second expression has a very similar residual error and
it is quadratic on the particle diameter in agreement with the Kozeny-Carman Equation 1. The
pore size estimate Dsur is less relevant to permeability in the discordant data points as flow
channels along the larger interconnected pores (i.e., D80 percentile). Further analyses show that
permeability estimates using the D80 pore size have the same degree of uncertainty, one order of
magnitude, as more complex models that assume fractal pore structures, critical path analysis,
and percolation theory (Methods by Charlaix et al., 1987; Buiting and Clerke, 2013; Daigle,
2016).
Equations 10 and 11 indicate that the representative pore size D80 along the most
conductive percolating paths is D80 /Dsur»50 larger than the pore size inferred from specific
surface Dsur. The dataset confirms the inverse relationship between specific surface and pore
size, however the pore size Dsur computed from specific surface correlates best with the 20-
percentile D20 of the pore size distribution f(D) measured with mercury intrusion.
Anisotropy. Porosity, pore size distribution, and specific surface do not provide information
about anisotropy. Therefore, all models based on these parameters considered permeability to be
isotropic, i.e., a scalar. However, permeability is direction-dependent, i.e., a tensor. Permeability
Prelim
inary
Version
anisotropy in carbonates originates from inherent sedimentation layering and preferentially
aligned features (Dürrast and Siegesmund, 1999; Tipping et al., 2006), biogenic burrows
(Pemberton and Gingras, 2005), stress anisotropy (Barton and Quadros, 2014) and ensuing
stress-dependent diagenetic processes (Sibson, 1994; Rashid et al., 2015; Toussaint et al., 2018).
Upscaling. MIP-based predictions depend on the measurement and interpretation of pressure-
volume data obtained on small specimens. The assumption of a fractal pore structure provides a
convenient framework for upscaling laboratory measurements, but only within the validity of the
fractal system in the rock matrix (Katz and Thompson, 1985; Pape et al., 1999; Costa, 2006).
Stratigraphic features and fractures limit the upscaling size.
Alternatives? Analyses suggest that inherent limitations in the prediction of carbonate
permeability from index properties lead to an uncertainty of at least one order of magnitude.
Furthermore, porosity, specific surface and porosimetry are costly measurements. They are most
valuable when specimens are limited to small sizes, such as cuttings (Swanson, 1981; Santarelli
et al., 1998). However, when cores are available, quick liquid-based measurements of
permeability can be less costly; these measurements avoid complex data analysis (as in gas-
based measurements) (Wu et al., 1998; Tanikawa and Shimamoto, 2009; Sander et al., 2017),
provide the true value of permeability rather than a correlated estimate, and test series can readily
assess anisotropy and heterogeneity.
Prelim
inary
Version

CONCLUSIONS
Matrix flow is important even in fractured systems as hydrocarbons stored in the matrix
need to migrate to fractures. Carbonate type and formation history define the matrix
permeability.
Permeability data plotted against the pore size estimated using porosity and specific
surface cluster along a single trend with a slope of 2 (in log-log scale). This result highlights the
underlying physics of permeability as captured in the Kozeny-Carman model.
Out-of-trend data points correspond to carbonates with either multi-modal or broad pore
size distributions with long tails. In both cases, flow channels along the larger interconnected
pores. Permeability correlates best with the pore size D80 that corresponds to the 80th percentile
in the porosimetry data. This conclusion applies to all carbonates in the database, and it leads to a
simple and robust permeability estimator.
More detailed analyses assume an internal pore structure and concepts such as critical
path analysis. Their implementation is not straightforward; estimates of permeability using these
models result in permeability values with a typical one order of magnitude in uncertainty. This
variability is similar to that obtained with other simpler estimators.
All analyses suggest an irreducible uncertainty of one order of magnitude in permeability
estimation from index properties such as porosity, porosimetry and specific surface. This may
reflect specimen preparation effects (e.g., crushing size for specific surface measurements or
inadequate saturation in porosity determinations), inherent physical differences (permeation of
single-phase fluid vs. invasion of an immiscible fluid in MIP), and difficulties in data
interpretation (e.g., porosimetry, gas related corrections in k-measurements).
Prelim
inary
Version
The estimation of permeability based on specific surface and porosity is most valuable
when only cuttings are available. When cores are available, simple and quick liquid-based
permeability measurements should be sought: they can be less costly than specific surface,
porosity, and mercury porosimetry measurements, avoid the inherent uncertainty in correlation-
based estimates, and allow the assessment of anisotropy.
References Cited
Alam, M. M., I. L. Fabricius, and M. Prasad, 2011, Permeability prediction in chalks: AAPG Bulletin, v.
95, no. 11, p. 1991-2014, doi:10.1306/03011110172.
American Petroleum Institute API, 1998, Recommended Practices for Core Analysis 2nd ed.: Washington
D.C., API Publishing Services, 233 p.
Archie, G. E., 1952, Classification of Carbonate Reservoir Rocks and Petrophysical Considerations:
AAPG Bulletin, v. 36, no. 2, p. 278-298.
Arns, C. H., M. A. Knackstedt, and N. S. Martys, 2005, Cross-property correlations and permeability
estimation in sandstone: Physical Review E, v. 72, p. 046304, doi:10.1103/PhysRevE.72.046304.
Babadagli, T., and S. Al-Salmi, 2004, A Review of Permeability-Prediction Methods for Carbonate
Reservoirs Using Well-Log Data: SPE Reservoir Evaluation and Engineering, v. 7, no. 2, p. 75-
88, doi:10.2118/87824-PA.
Barton, N., and E. Quadros, 2014, Anisotropy is Everywhere, to See, to Measure, and to Model: Rock
Mechanics and Rock Engineering, v. 48, no. 4, p. 1323-1339, doi:10.1007/s00603-014-0632-7.
Beebe, R. A., J. B. Beckwith, and J. M. Honig, 1945, The determination of small surface areas by krypton
adsorption at low temperatures: Journal of the American Chemical Society, v. 67, p. 1554-1558,
doi:10.1021/ja01225a048.
Boggs, Jr. S., 2009, Petrology of Sedimentary Rocks 2nd ed.: Cambridge, Cambridge University Press,
600 p., doi:10.1017/CBO9780511626487
BP, 2018, BP Energy Outlook 2018 ed., 125 p., accessed February 10, 2019,
https://www.bp.com/content/dam/bp/business-sites/en/global/corporate/pdfs/energy-
economics/energy-outlook/bp-energy-outlook-2018.pdf
Prelim
inary
Version
Brooks, C. S., and W. R. Purcell, 1952, Surface area measurements on sedimentary rocks: Fall Meeting of
the Petroleum Branch, American Institute of Mining and Metallurgical Engineers, Houston, TX.
Buiting, J. J. M., and E. A. Clerke, 2013, Permeability from porosimetry measurements: Derivation for a
tortuous and fractal tubular bundle: Journal of Petroleum Science and Engineering, v. 108, p. 267-
278, doi:10.1016/j.petrol.2013.04.016.
Carman, P. C., 1937, Fluid flow through granular beds: Trans. Inst. Chem.Eng., v. 15, p. 150-167, doi:
10.1016/S0263-8762(97)80003-2.
Cerato, A. B., and A. J. Lutenegger, 2002, Determination of Surface Area of Fine-Grained Soils by the
Ethylene Glycol Monoethyl Ether (EGME) Method: Geotechnical Testing Journal, v. 25, no. 3, p.
1-7, doi: 10.1520/GTJ11087J.
Charlaix, E., E. Guyon, and S. Roux, 1987, Permeability of a Random Array of Fractures of Widely
Varying Apertures: Transport in Porous Media, v. 2, p. 31-43, doi:10.1007/BF00208535.
Chilingarian, G. V., J. Chang, and K. I. Bagrintseva, 1990, Empirical expression of permeability in terms
of porosity, specific surface area, and residual water saturation of carbonate rocks: Journal of
Petroleum Science and Engineering, v. 4, p. 317-322, doi:10.1016/0920-4105(90)90029-3.
Churcher, P. L., P. R. French, J. C. Shaw, and L. L. Schramm, 1991, Rock properties of Berea Sandstone,
Baker Dolomite, and Indiana Limestone: SPE International Symposium on Oilfield Chemistry,
Society of Petroleum Engineers, Anaheim, California.
Clerke, E. A., 2009, Permeability, Relative Permeability, Microscopic Displacement Efficiency and Pore
Geometry of M_1 Bimodal Pore Systems in Arab-D Limestone: SPE Journal, v. September, p.
524-531, doi:10.2118/105259-PA.
Clerke, E. A., H. W. I. Mueller, E. C. Phillips, R. Y. Eyvazzadeh, D. H. Jones, R. Ramamoorthy, and A.
Srivastava, 2008, Application of Thomeer Hyperbolas to decode the pore systems, facies and
reservoir properties of the Upper Jurassic Arab D Limestone, Ghawar field, Saudi Arabia: A
"Rosetta Stone" approach: Geoarabia, v. 13, no. 4, p. 113-160.
Corbett, K., M. Friedman, and J. Spang, 1987, Fracture development and mechanical stratigraphy of
Austin Chalk, Texas: AAPG Bulletin, v. 71, no. 1, p. 17-28.
Costa, A., 2006, Permeability-porosity relationship: a reexamination of the Kozeny-Carman equation
based on a fractal pore-space geometry assumption: Geophysical Research Letters, v. 33, p.
L02318, doi:10.1029/2005GL025134.
Prelim
inary
Version
Croizet, D., F. Renard, and J.-P. Gratier, 2013, Compaction and porosity reduction in carbonates: A
review of observations, theory and experiments: Advances in Geophysics, v. 54, p. 181-238,
doi:10.1016/B978-0-12-380940-7.00003-2
Daigle, H., 2016, Application of critical path analysis for permeability prediction in natural porous media:
Advances in Water Resources, v. 96, p. 43-54, doi:10.1016/j.advwatres.2016.06.016.
Diamond, S., 2000, Mercury porosimetry: An inappropriate method for the measurement of pore size
distributions in cement-based materials: Cement and Concrete Research, v. 30, no. 10, p. 1517-
1525, doi:10.1016/S0008-8846(00)00370-7.
Dogruoz, C., N. Bolukbasi, J. Rostami, and C. Acar, 2016, An Experimental Study of Cutting
Performances of Worn Picks: Rock Mechanics and Rock Engineering, v. 49, p. 213-224,
doi:10.1007/s00603-015-0734-x.
Dullien, F. A. L., 1992, Porous Media 2nd ed.: San Diego, Academic Press, 574 p.
Dunham, R. J., 1962, Classification of Carbonate Rocks According to Depositional Textures, in W. E.
Ham, eds., Classification of Carbonate Rocks - A Symposium: AAPG Memoir, p. 108-121.
Dürrast, H., and S. Siegesmund, 1999, Correlation between rock fabrics and physical properties of
carbonate reservoir rocks: International Journal of Earth Sciences, v. 88, no. 3, p. 392-408,
doi:10.1007/s005310050274.
EIA, 2015, International Energy Statistics-Crude Oil Proven Reserves, accessed July 6, 2017,
https://www.eia.gov/beta/international/data/browser
Fabricius, I. L., G. Baechle, G. P. Eberli, and R. Weger, 2007, Estimating permeability of carbonate rocks
from porosity and vp/vs: Geophysics, v. 75, no. 5, p. 185-191, doi:10.1190/1.2756081.
Fisher, W. L., and P. U. Rodda, 1969, Edwards Formation (Lower Cretaceous), Texas: Dolomitization in
a Carbonate Platform System: AAPG Bulletin, v. 53, no. 1, p. 55-72.
Friedman, S. P., and N. A. Seaton, 1998, Critical path analysis of the relationship between permeability
and electrical conductivity of three-dimensional pore networks: Water Resources Research, v. 34,
no. 7, p. 1703-1710, doi:10.1029/98WR00939.
Gale, J. F. W., S. E. Laubach, R. A. Marrett, J. E. Olson, J. Holder, and R. M. Reed, 2004, Predicting and
characterizing fractures in dolostone reservoirs: using the link between diagenesis and fracturing,
in C. J. R. Braithwaite, G. Rizzi, and G. Darke, eds., The Geometry and Petrogenesis of Dolomite
Hydrocarbon Reservoirs: Geological Society of London Special Publications, v. 235, p. 177-192,
doi:10.1144/GSL.SP.2004.235.01.08.
Prelim
inary
Version
Giesche, H., 2006, Mercury Porosimetry: A General (Practical) Overview: Particle and Particle Systems
Characterization, v. 23, no. 1, p. 9-19, doi:10.1002/ppsc.200601009.
Glover, P. W. J., I. I. Zadjali, and K. A. Frew, 2006, Permeability prediction from MICP and NMR data
using an electrokinetic approach: Geophysics, v. 71, no. 4, p. F49-F60, doi:10.1190/1.2216930.
Golf-Racht, V. T. D., 1996, Naturally-fractured carbonate reservoirs, in G. V. Chilingarian, S. J.
Mazzullo, and H. H. Rieke, eds., Carbonate Reservoir Characterization: A Geologic-Engineering
Analysis: Elsevier, Developments in Petroleum Science, p. 683-771.
Hunt, A. G., and G. W. Gee, 2002, Application of critical path analysis to fractal porous media:
comparison with examples from the Hanford site: Advances in Water Resources, v. 25, p. 129-
146, doi:10.1016/S0309-1708(01)00057-4.
IEA, 2015, World Energy Outlook 2015: Executive Summary, accessed July 6, 2017,
https://webstore.iea.org/download/summary/224?fileName=English-WEO-2015-ES.pdf
IEA, 2018, World Energy Outlook 2018: Executive Summary, accessed February 10, 2019,
https://webstore.iea.org/download/summary/190?fileName=English-WEO-2018-ES.pdf
Jang, J., G. A. Narsilio, and J. C. Santamarina, 2011, Hydraulic conductivity in spatially varying media—
a pore-scale investigation: Geophysical Journal International, v. 184, no. 3, p. 1167-1179,
doi:10.1111/j.1365-246X.2010.04893.x.
Jennings, J. W., and F. J. Lucia, 2003, Predicting Permeability From Well Logs in Carbonates With a
Link to Geology for Interwell Permeability Mapping: SPE Reservoir Evaluation and Engineering,
v. 6, no. 4, p. 215-226, doi:10.2118/84942-PA.
Katz, A. J., and A. H. Thompson, 1985, Fractal Sandstone Pores: Implications for Conductivity and Pore
Formation: Physical Review Letters, v. 54, no. 12, p. 1325-1328,
doi:10.1103/PhysRevLett.54.1325.
Katz, A. J., and A. H. Thompson, 1986, Quantitative prediction of permeability in porous rock: Physical
Review B, v. 34, no. 11, p. 8179-8181, doi:10.1103/PhysRevB.34.8179.
Kozeny, J., 1927, Uber kapillare Leitung der Wasser in Boden. Sitzungs-ber. Akad. Wiss., Wien, v.
136,p. 271-306.
Kyser, T. K., N. P. James, and Y. Bone, 1998, Alteration of Cenozoic cool-water carbonates to low-Mg
calcite in marine waters, Gambier Embayment, South Australia: Journal of Sedimentary
Research, v. 68, no. 5, p. 947-955, doi:10.2110/jsr.68.947.
Prelim
inary
Version
Lenormand, R., 2003, Interpretation of mercury injection curves to derive pore size distribution:
International Symposium of the Society of Core Analysts, The Society of Core Analysts, Pau,
France.
León y León, C. A., 1998, New perspectives in mercury porosimetry: Advances in Colloid and Interface
Science, v. 76–77, p. 341-372, doi:10.1016/S0001-8686(98)00052-9.
Lindsay, R. F., D. L. Cantrell, G. W. Hughes, Keith, T H, H. W. Mueller III, and S. D. Russel, 2006,
Ghawar Arab-D Reservoir: Widespread Porosity in Shoaling-upward Carbonate Cycles, Saudi
Arabia, in P. M. Harris, and L. J. Weber, eds., Giant hydrocarbon reservoirs of the world: From
rocks to reservoir characterization and modeling: AAPG Memoir 88/SEPM Special Publication,
p. 97-137.
Lucia, F. J., 1995, Rock-fabric/petrophysical classification of carbonate pore space for reservoir
characterization: AAPG Bulletin, v. 79, no. 9, p. 1275-1300, doi:10.1306/7834D4A4-1721-11D7-
8645000102C1865D.
Lucia, F. J., 2007, Carbonate Reservoir Characterization: An Integrated Approach 2nd ed.: Berlin,
Springer-Verlag Berlin Heidelberg, 336 p.
Moore, C. H., and W. J. Wade, 2013, The Nature and Classification of Carbonate Porosity, in C. H.
Moore, W. J. Wade, eds., Carbonate Reservoirs: Porosity and Diagenesis in a Sequence
Stratigraphic Framework 2nd ed.: Elsevier, Developments in Sedimentology, p. 51-65.
Moro, F., and H. Böhni, 2002, Ink-Bottle Effect in Mercury Intrusion Porosimetry of Cement-Based
Materials: Journal of Colloid and Interface Science, v. 246, no. 1, p. 135-149,
doi:10.1006/jcis.2001.7962.
Mortensen, J., F. Engstrøm, and I. Lind, 1998, The relation among porosity, permeability and specific
surface of Chalk from the Gorm Field, Danish North Sea: SPE Reservoir Evaluation and
Engineering, v. June, p. 245-251, doi:10.2118/31062-PA.
Nelson, P. H., 1994, Permeability-porosity relationships in sedimentary rocks: Log Analyst, v. 35, no. 3,
p. 38-62.
Nelson, P. H., 2009, Pore-throat sizes in sandstones, tight sandstones, and shales: AAPG Bulletin, v. 93,
no. 3, p. 329-340, doi:10.1306/10240808059.
Nishiyama, N., and T. Yokoyama, 2017, Permeability of porous media: Role of the critical pore size:
Journal of Geophysical Research: Solid Earth, v. 122, p. 6955-6971, doi:10.1002/2016JB013793.
Prelim
inary
Version
Ortega, O. J., J. F. W. Gale, and R. Marrett, 2010, Quantifying diagenetic and stratigraphic controls on
fracture intensity in platform carbonates: An example from the Sierra Madre Oriental, northeast
Mexico: Journal of Structural Geology, v. 32, no. 12, p. 1943-1959,
doi:10.1016/j.jsg.2010.07.004.
Pape, H., C. C, and J. Iffland, 1999, Permeability prediction based on fractal pore-space geometry:
Geophysics, v. 64, no. 5, p. 1447-1460, doi:10.1190/1.1444649.
Pemberton, S. G., and M. K. Gingras, 2005, Classification and characterizations of biogenically enhanced
permeability: AAPG Bulletin, v. 89, no. 11, p. 1493-1517, doi:10.1306/07050504121.
Poursoltani, M. R., and M. R. Gibling, 2011, Composition, porosity, and reservoir potential of the Middle
Jurassic Kashafrud Formation, northeast Iran: Marine and Petroleum Geology, v. 28, no. 5, p.
1094-1110, doi:10.1016/j.marpetgeo.2010.11.004.
Railsback, L. B., 1993, Contrasting styles of chemical compaction in the Upper Pennsylvanian Dennis
Limestone in the Midcontinent region, U.S.A.: Journal of Sedimentary Petrology, v. 63, no. 1, p.
61-72, doi:10.1306/D4267A8C-2B26-11D7-8648000102C1865D.
Rashid, F., P. W. J. Glover, P. Lorinczi, R. Collier, and J. Lawrence, 2015, Porosity and permeability of
tight carbonate reservoir rocks in the north of Iraq: Journal of Petroleum Science and
Engineering, v. 133, p. 147-161, doi:10.1016/j.petrol.2015.05.009.
Ren, X., and J. C. Santamarina, 2018, The hydraulic conductivity of sediments: A pore size perspective:
Engineering Geology, v. 233, p. 48-54. doi:10.1016/j.enggeo.2017.11.022.
Rezaee, M. R., A. Jafari, and E. Kazemzadeh, 2006, Relationships between permeability, porosity and
pore throat size in carbonate rocks using regression analysis and neural networks: Journal of
Geophysics and Engineering, v. 3, no. 4, p. 370-376, doi:10.1088/1742-2132/3/4/008.
Saner, S., and A. Sahin, 1999, Lithological and zonal porosity-permeability distributions in the Arab-D
Reservoir, Uthmaniyah Field, Saudi Arabia: AAPG Bulletin, v. 83, no. 2, p. 230-243.
Sander, R., Z. Pan, and L. D. Connell 2017, Laboratory measurement of low permeability unconventional
gas reservoir rocks: A review of experimental methods: Journal of Natural Gas Science and
Engineering, v. 37, p. 248-279, doi:10.1016/j.jngse.2016.11.041
Santarelli, F. J., A. F. Marsala, M. Brignoli, E. Rossi, and N. Bona, 1998, Formation Evaluation From
Logging on Cuttings: SPE Reservoir Evaluation and Engineering, SPE-36515-PA, v. June, p.
238-244.
Prelim
inary
Version
Sibson, R. H., 1994, Crustal stress, faulting and fluid flow: Geological Society of London Special
Publications, v. 78, no. 1, p. 69-84, doi:10.1144/gsl.sp.1994.078.01.07.
Swanson, B. F., 1981, A Simple Correlation Between Permeabilities and Mercury Capillary Pressures:
Journal Petroleum Technology, v. December, p. 2498-2504, doi:10.2118/8234-PA.
Tanikawa, W., and T. Shimamoto, 2009, Comparison of Klinkenberg-corrected gas permeability and
water permeability in sedimentary rocks: International Journal of Rock Mechanics and Mining
Sciences, v. 46, p. 229-238, doi:10.1016/j.ijrmms.2008.03.004
Thomeer, J. H. M., 1983, Air permeability as a function of three pore-network parameters: Journal of
Petroleum Technology, SPE-10073-PA, v. 35, no. 4, p. 809-814, doi:10.2118/10922-PA.
Tiab, D., and E. C. Donaldson, 2012, Petrophysics: Theory and Practice of Measuring Reservoir Rock
and Fluid Transport Properties 3nd ed.: Boston, Gulf Professional Publishing, 976 p.
Tipping, R. G., A. C. Runkel, E. C. Alexander, S. C. Alexander, and J. A. Green, 2006, Evidence for
hydraulic heterogeneity and anisotropy in the mostly carbonate Prairie du Chien Group,
southeastern Minnesota, USA: Sedimentary Geology, v. 184, no. 3-4, p. 305-330,
doi:10.1016/j.sedgeo.2005.11.007.
Toussaint, R., E. Aharonov, D. Koehn, J.-P. Gratier, M. Ebner, P. Baud, A. Rolland, and F. Renard, 2018,
Stylolites: A review: Journal of Structural Geology, v. 114, p. 163-195.
Uddin, Y. N., E. A. Clerke, B. Bammel, S. Koronfol, and A. Grader, 2017, Quantitative Study of
Formation Vertical Permeability in Middle East Thalassinoides Burrowed Carbonate Mudstone:
SPE Reservoir Characterisation and Simulation Conference and Exhibition Abu Dhabi.
Vincent, B., M. Fleury, Y. Santerre, and B. Brigaud, 2011, NMR relaxation of neritic carbonates: An
integrated petrophysical and petrographical approach: Journal of Applied Geophysics, v. 74, no.
1, p. 38-58. doi:10.1016/j.jappgeo.2011.03.002.
Weger, R. J., G. P. Eberli, G. T. Baechle, J. L. Massaferro, and YF. Sun, 2009, Quantification of pore
structure and its effect on sonic velocity and permeability in carbonates: AAPG Bulletin, v. 93,
no. 10, p. 1297-1317.
Weiner, W. F., and V. G. A. F. Koster, 1976, Petrographic and geochemical study of the formation of
chert around the Thornton reef complex, Illinois: Geological Society of America Bulletin, v. 87,
p. 310-318, doi:10.1130/0016-7606(1976)87<310:PAGSOT>2.0.CO;2.
Wu, YS., K. Pruess, P. Persoff, 1998, Gas Flow in Porous Media with Klinkenberg Effects, Transport in
Porous Media, v. 32, p. 117-137, doi:10.1023/A:1006535211684
Prelim
inary
Version

Zhiye, G., and H. Qinhong, 2013, Estimating permeability using median pore-throat radius obtained from
mercury intrusion porosimetry: Journal of Geophysics and Engineering, v. 10, no. 2, p. 1-7,
doi:10.1088/1742-2132/10/2/025014.
Prelim
inary
Version
Vita
J. Carlos Santamarina
J. Carlos Santamarina (PhD: Purdue University; MSc: University of Maryland; CE: UNC
Argentina) explores the foundations of subsurface processes using particle- and pore-scale
testing methods combined with high resolution geophysical process monitoring systems and
inversion techniques. The combined experimental-numerical framework supports developments
in the field of energy geotechnology, with contributions to resource recovery as well as energy
and waste geostorage.
Alejandro Cardona
Alejandro Cardona (MSc: KAUST; BS: UNAL Colombia) is currently pursuing his doctoral
studies in Energy Resources and Petroleum Engineering in King Abdullah University of Science
and Technology KAUST. His research focuses on the understanding of flow-related phenomena
in porous media with an emphasis on fractured carbonate rocks.
Prelim
inary
Version
Figure Captions
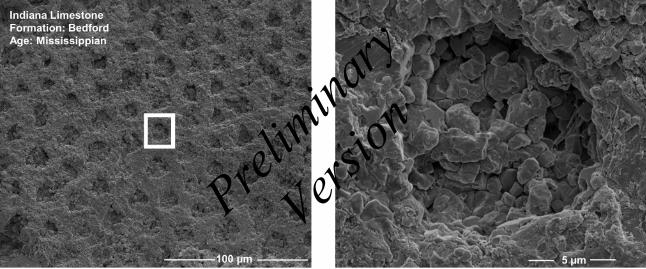
Figure 1. Scanning electron microscope image of an Indiana carbonate sample. The image
confirms the presence of ~15 µm pores in agreement with mercury intrusion data. The zoomed-
in picture on the right (corresponds to the white square on the left image) illustrates the sub-
micron pore topology.
Figure 2. Normalized pore size distributions obtained from mercury porosimetry. The black
solid lines show the logarithmic differential intrusion g(D), and the black dashed lines
correspond to the probability density function f(D).
Figure 3. Empirical models for carbonate permeability: (A) Permeability as a function of
porosity ϕ and carbonate type (Data from Lucia, 1995, and Lindsay et al., 2006; for comparison,
the original classification used by Lindsay et al. is mapped onto Lucia’s classification). Color
coding identifies rock type; triangles correspond to Lucia’s data and filled circles are Lindsay et
al. data. (B) Permeability as a function of the largest porositon size Mmax measured using
mercury porosimetry (after Clerke, 2009); dashed lines correspond to isoporosity values in the
model (refer to Equation 6). Data points are colored to reflect the distance between model
predictions and measured values in terms of standard deviation σ.
Figure 4. Permeability k versus specific surface Ss for different porosity ranges. The dashed line
has a -2 slope in agreement with the Kozeny-Carman equation. The color coding distinguishes
Prelim
inary
Version
data points according to porosity. Dataset: 286 datapoints. Data sources: Alam et al., 2011;
Brooks and Purcell, 1952; Chilingarian et al., 1990; Fabricius et al., 2007; Mortensen et al.,
1998; and Vincent et al., 2011.
Figure 5. Models to estimate the surface-related pore size Dsur for different pore geometries,
where Ss [m2/g] is specific surface and ϕ is porosity.
Figure 6. Measured permeability k versus estimated pore size Dsur using a model of parallel
cylindrical tubes (Equation 9). Most of the data collapse onto a narrow trend. The dashed line has
a 2-slope in agreement with the Kozeny-Carman equation. Data sources: Alam et al., 2011;
Brooks and Purcell, 1952; Chilingarian et al., 1990; Fabricius et al., 2007; Mortensen et al.,
1998; and Vincent et al., 2011. New experimental data gathered in this study are shown as
yellow points.
Figure 7. Permeability k versus different pore diameter percentiles. The dashed line has a slope
value of 2. Percentiles D70-D85 provide the best regression with lowest square error with respect
to the dashed line. Yellow points: this study. Gray points: published data (Vincent et al., 2011)
Prel
imina
ry
Version
Prelim
inary
Version
Prelim
inary
Version
Prelim
inary
Version
Prelim
inary
Version

Prelim
inary
Version
Prelim
inary
Version
Prelim
inary
Version