Embed Size (px)
Citation preview
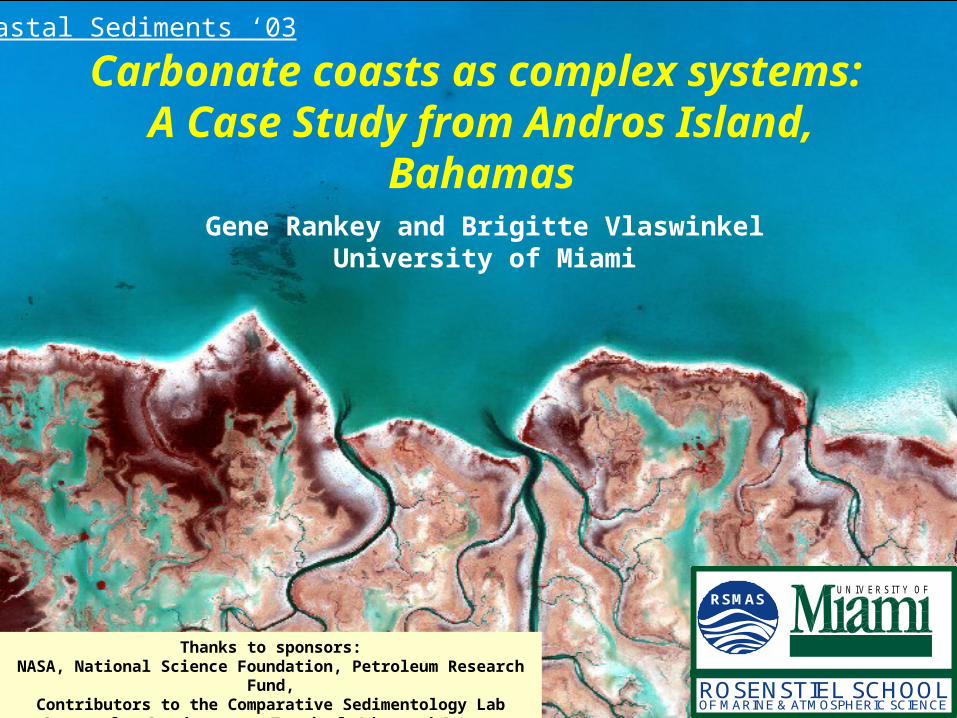
Carbonate coasts as complex systems: A Case Study from Andros Island, Bahamas
Gene Rankey and Brigitte VlaswinkelUniversity of Miami
Thanks to sponsors:NASA, National Science Foundation, Petroleum Research Fund,
Contributors to the Comparative Sedimentology LabCenter for Southeastern Tropical Advanced Remote Sensing (CSTARS)
ROSENSTIEL SCHOOL
RSMAS
OF MARINE & ATMOSPHERIC SCIENCE
U N IV E R S IT Y O F
Coastal Sediments ‘03
Purposes• Quantify and describe spatial patterns on a
modern carbonate tidal flat
• Explore for the presence of chaos
• Highlight potential implications for interpretation of modern and ancient Earth surface systems
Focus of talk: Using quantitative morphometricsto provide insights on sedimentary system
Outline
• Background
• Geomorphology of the tidal flat
• Systemic facies patterns • Network structure
• Implications
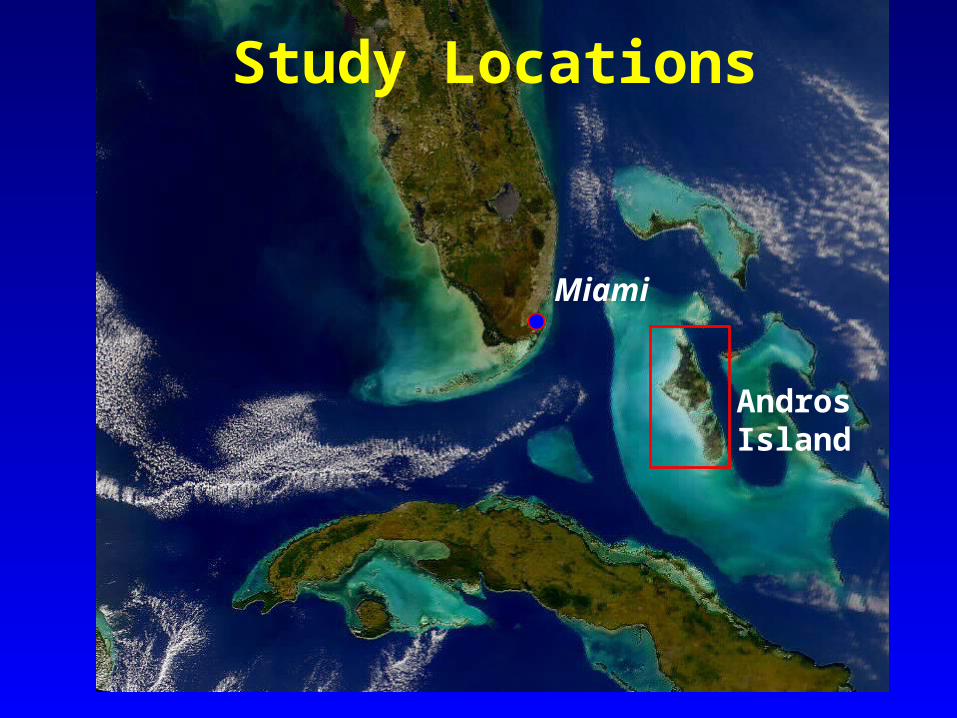
Study Locations
Miami
AndrosIsland
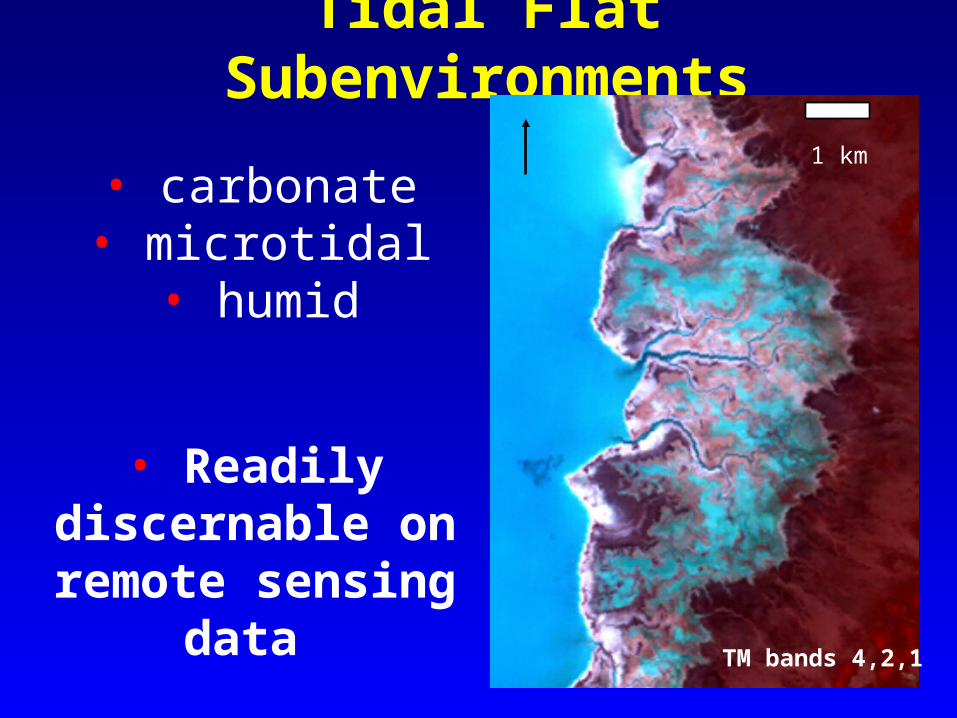
Tidal Flat Subenvironments
• carbonate• microtidal
• humid
• Readily discernable on remote sensing
data
1 km
TM bands 4,2,1
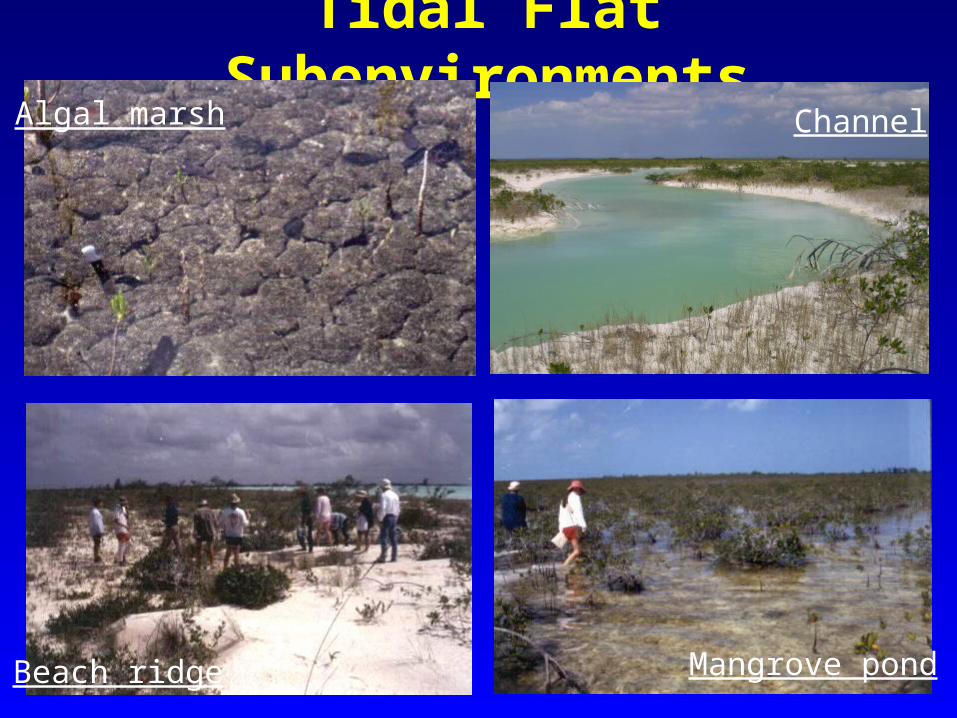
Tidal Flat SubenvironmentsAlgal marsh
Mangrove pondBeach ridge
Channel
Outline
• Background
• Geomorphology of the tidal flat
• Systemic facies patterns Subfacies size
• Network structure
• Implications
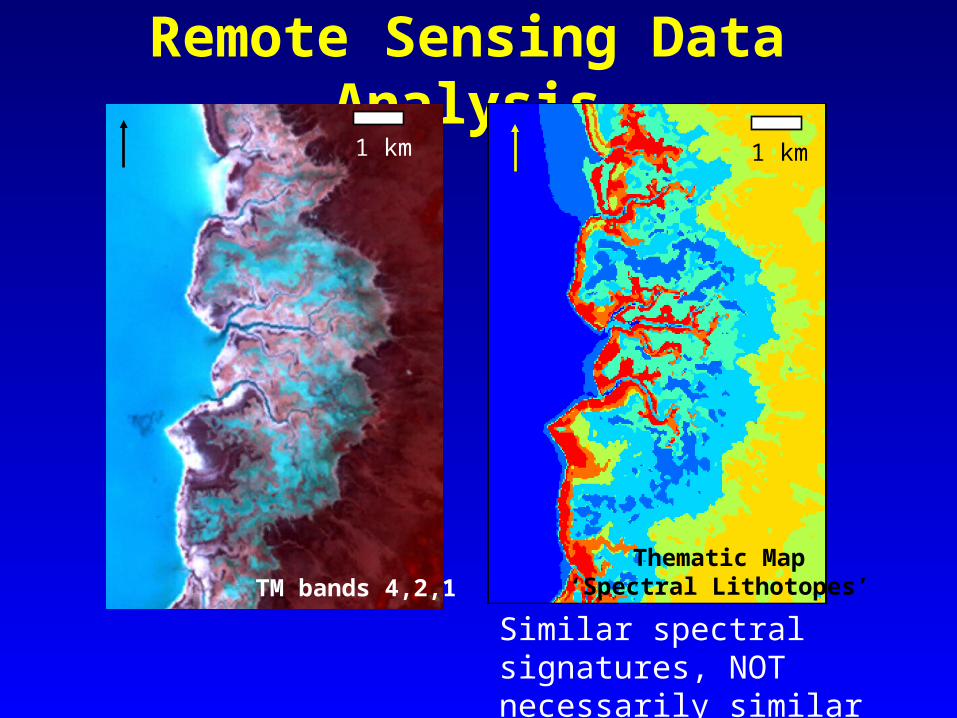
Remote Sensing Data Analysis1 km
TM bands 4,2,1
1 km
Thematic Map‘Spectral Lithotopes’
Similar spectral signatures, NOT necessarily similar facies
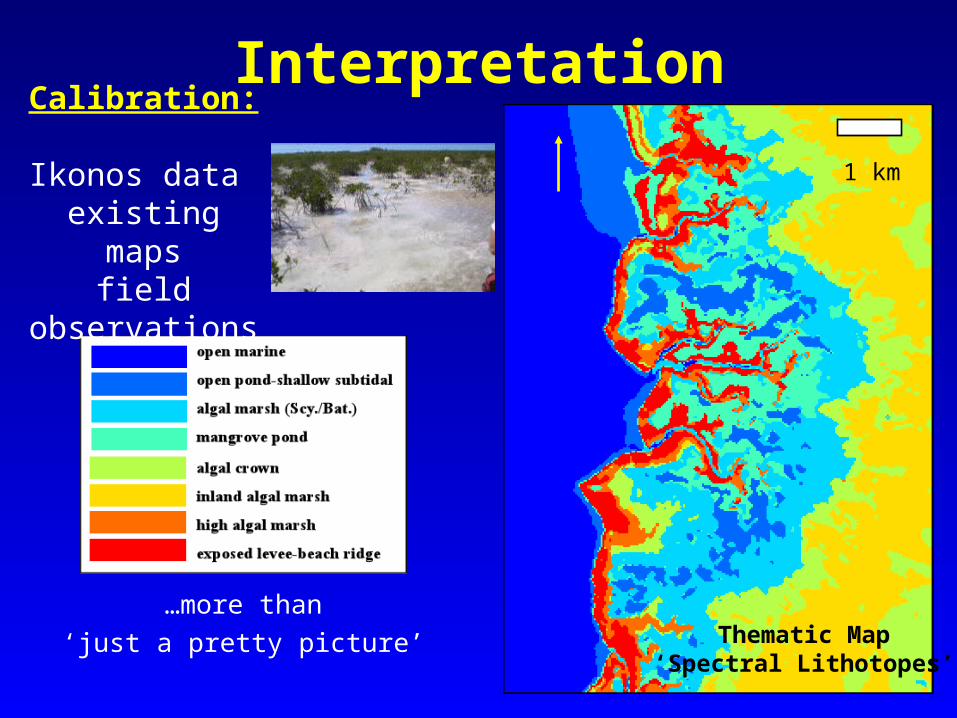
Interpretation
1 km
Thematic Map‘Spectral Lithotopes’
…more than
‘just a pretty picture’
Calibration: Ikonos data
existing mapsfield observations
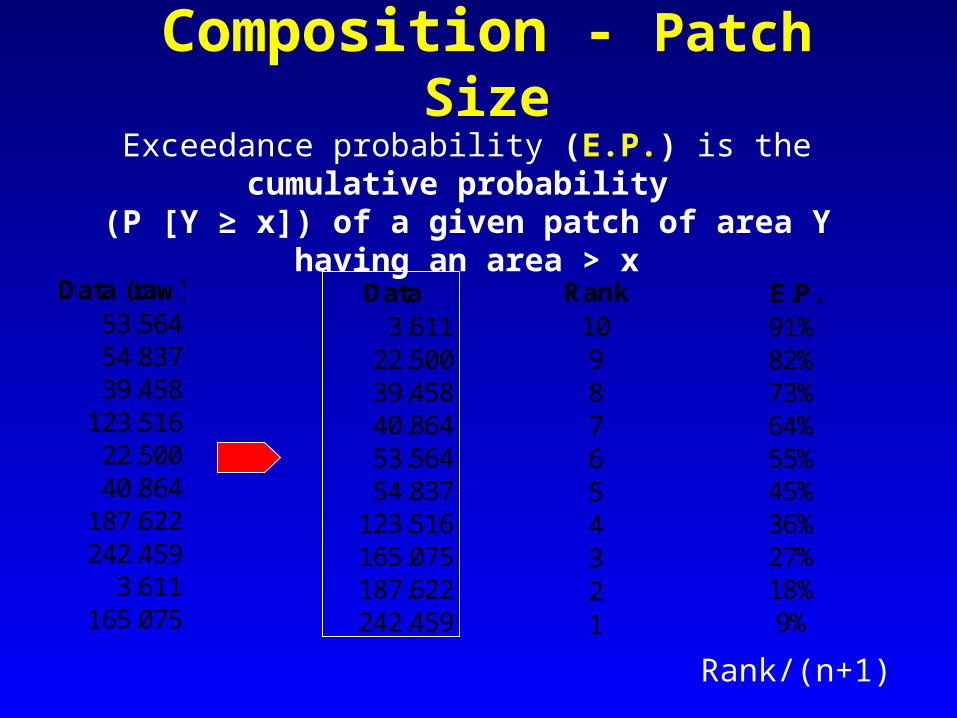
Composition - Patch SizeExceedance probability (E.P.) is the cumulative probability (P [Y ≥ x]) of a given patch of area Y having an area > x
Data3.61122.50039.45840.86453.56454.837123.516165.075187.622242.459
Data (raw)53.56454.83739.458123.51622.50040.864187.622242.4593.611
165.075
E.P.91%82%73%64%55%45%36%27%18%9%
Rank10987654321
Rank/(n+1)
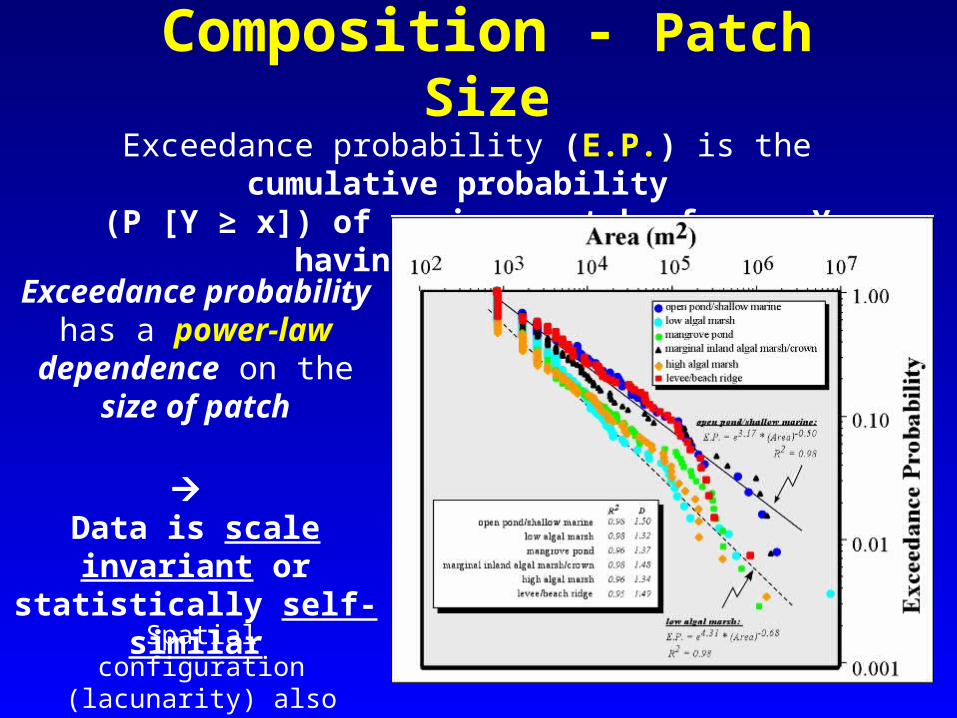
Composition - Patch SizeExceedance probability (E.P.) is the cumulative probability (P [Y ≥ x]) of a given patch of area Y having an area > x
Exceedance probability has a power-law dependence on
the size of patch
Data is scale invariant or statistically self-similar
Spatial configuration (lacunarity) also scales
w/power-law
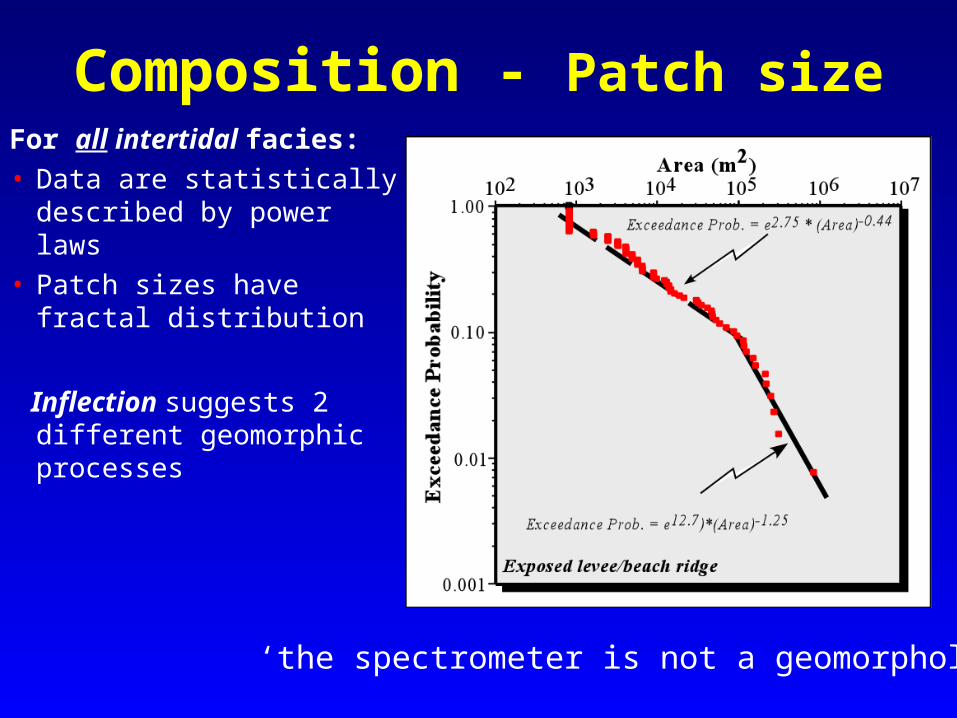
Composition - Patch sizeFor all intertidal facies:
• Data are statistically described by power laws
• Patch sizes have fractal distribution
Inflection suggests 2 different geomorphic processes
‘the spectrometer is not a geomorphologist’
Outline
• Background
• Geomorphology of Bahamian tidal flat
• Facies patterns
• Creek network structure Creek & network morphometrics Temporal character/evolution
• Implications
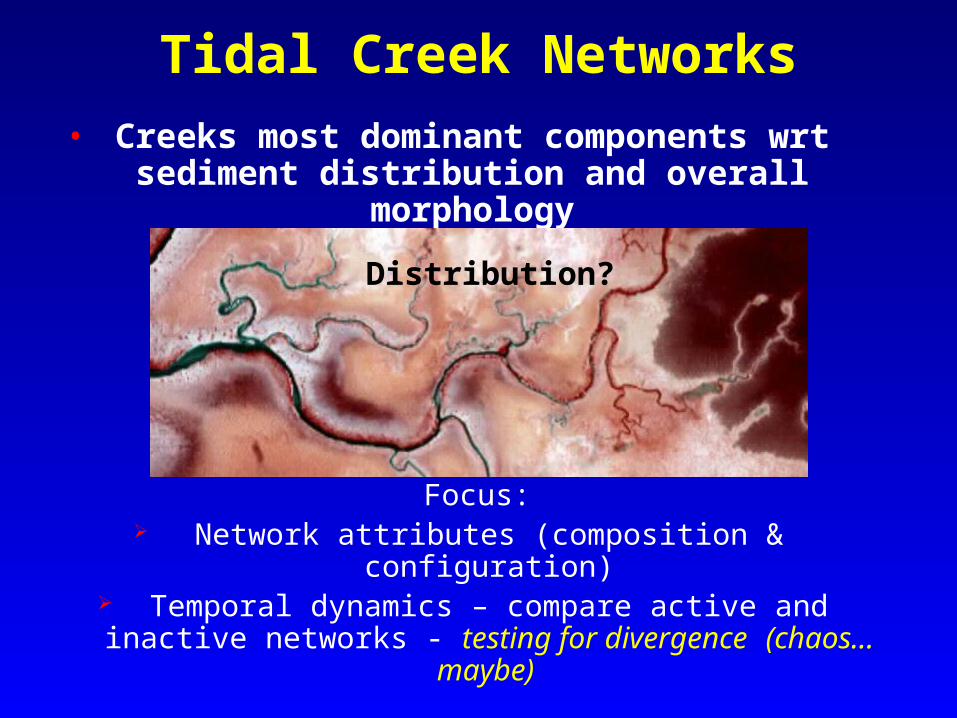
Tidal Creek Networks
• Creeks most dominant components wrt sediment distribution and overall morphology
Focus: Network attributes (composition & configuration) Temporal dynamics – compare active and inactive
networks - testing for divergence (chaos…maybe)
Distribution?
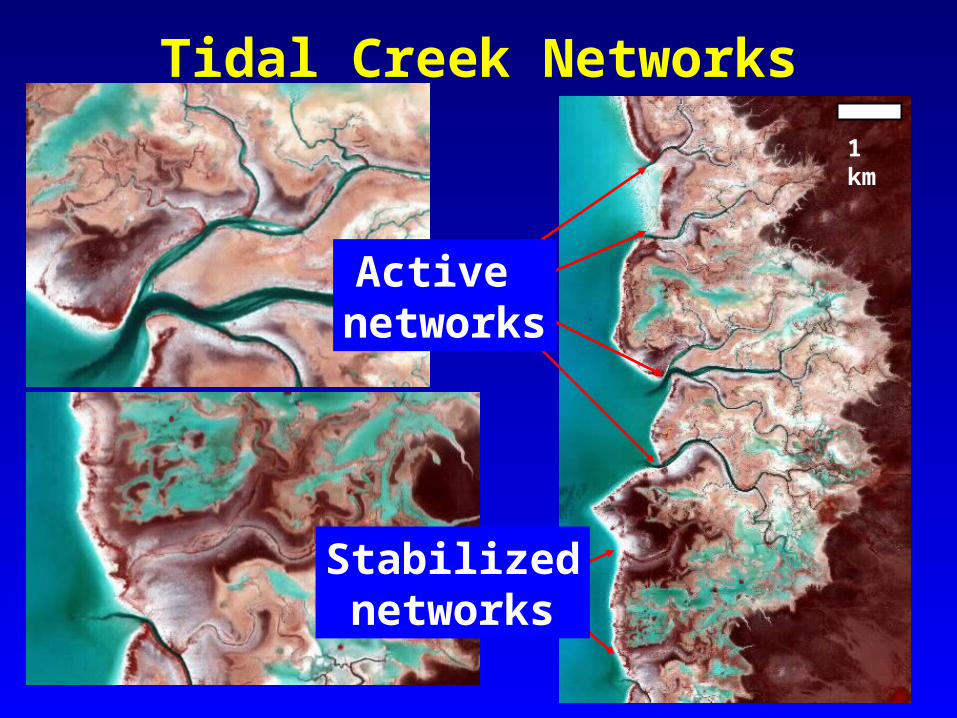
Tidal Creek Networks
Active networks
1 km
Stabilizednetworks
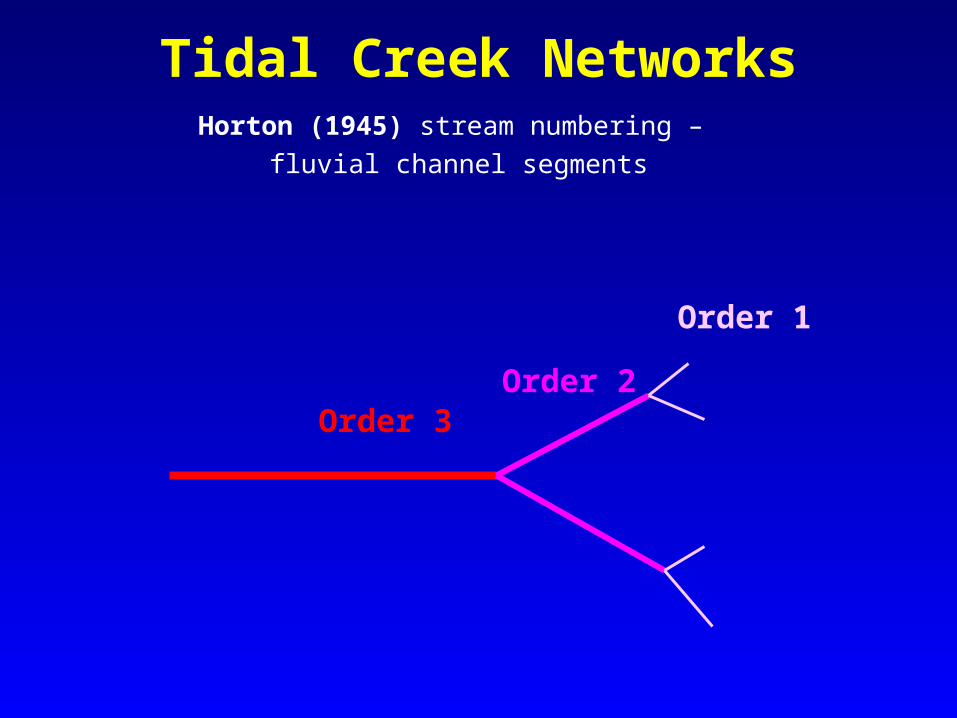
Horton (1945) stream numbering –
fluvial channel segments
Tidal Creek Networks
Order 3Order 2
Order 1
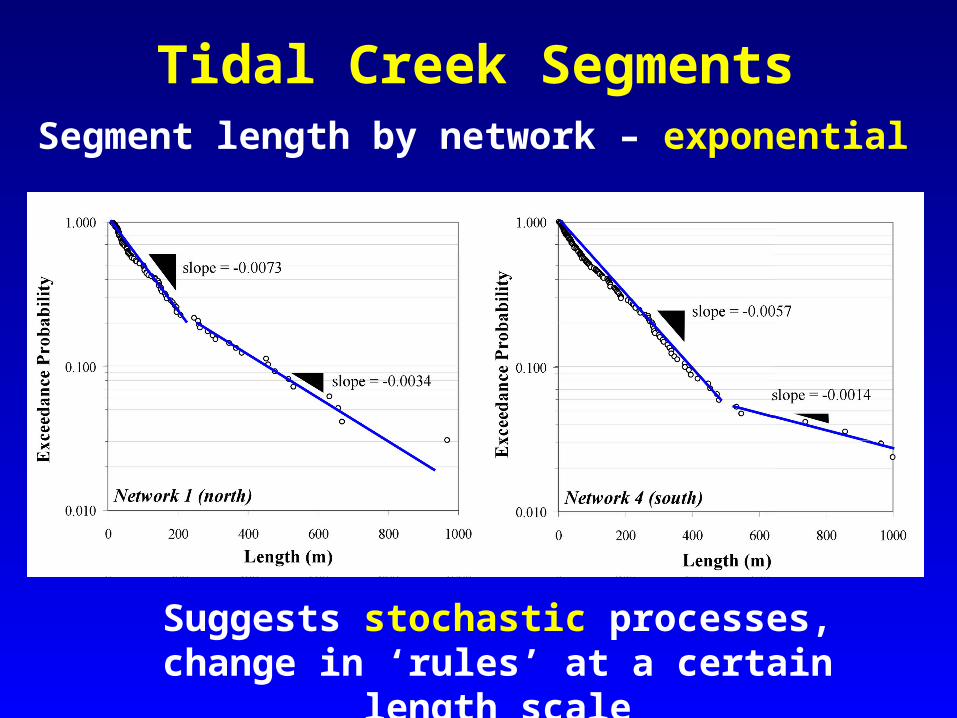
Tidal Creek SegmentsSegment length by network – exponential
Suggests stochastic processes, change in ‘rules’ at a certain length scale
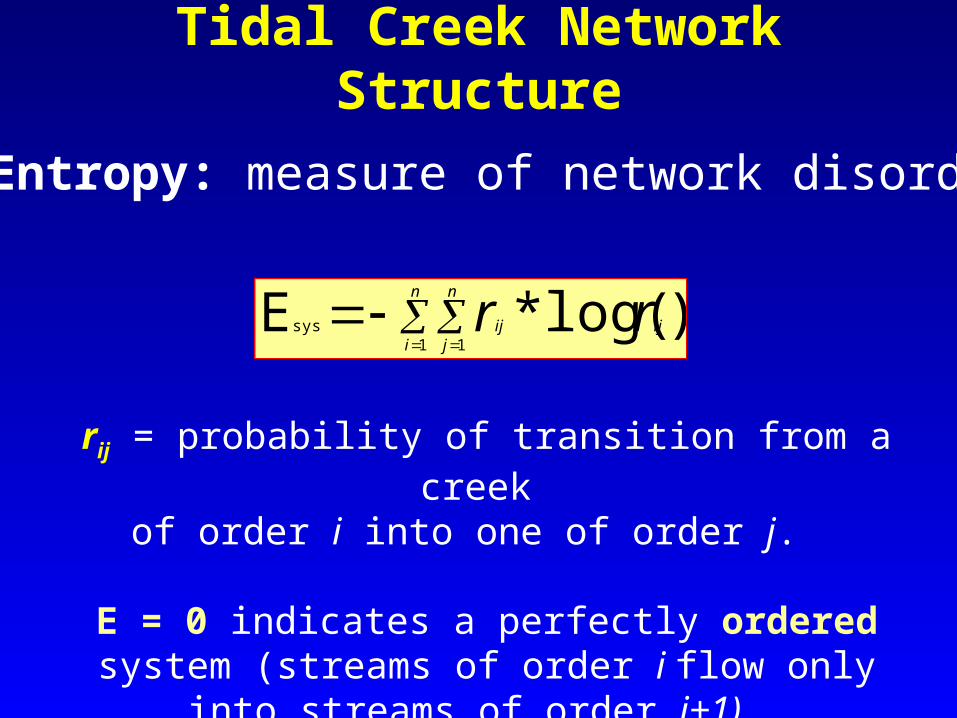
Tidal Creek Network Structure
n
i
n
jijij rr
1 1sys )log(*E
Entropy: measure of network disorder
rij = probability of transition from a creek of order i into one of order j.
E = 0 indicates a perfectly ordered system (streams of order i flow only into streams of order i+1).
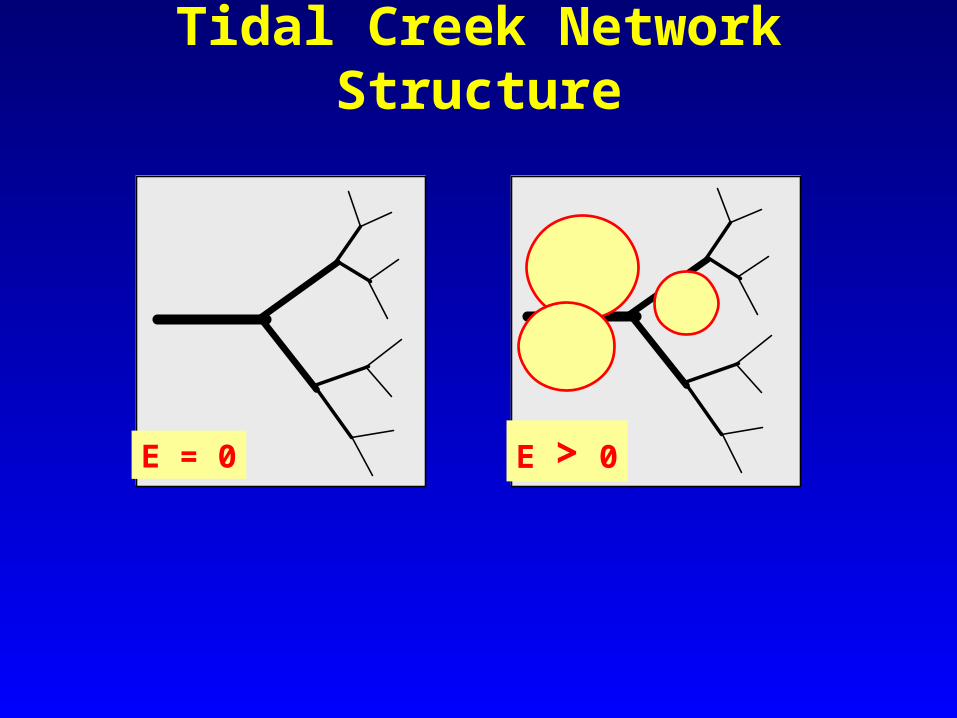
Tidal Creek Network Structure
E = 0 E > 0
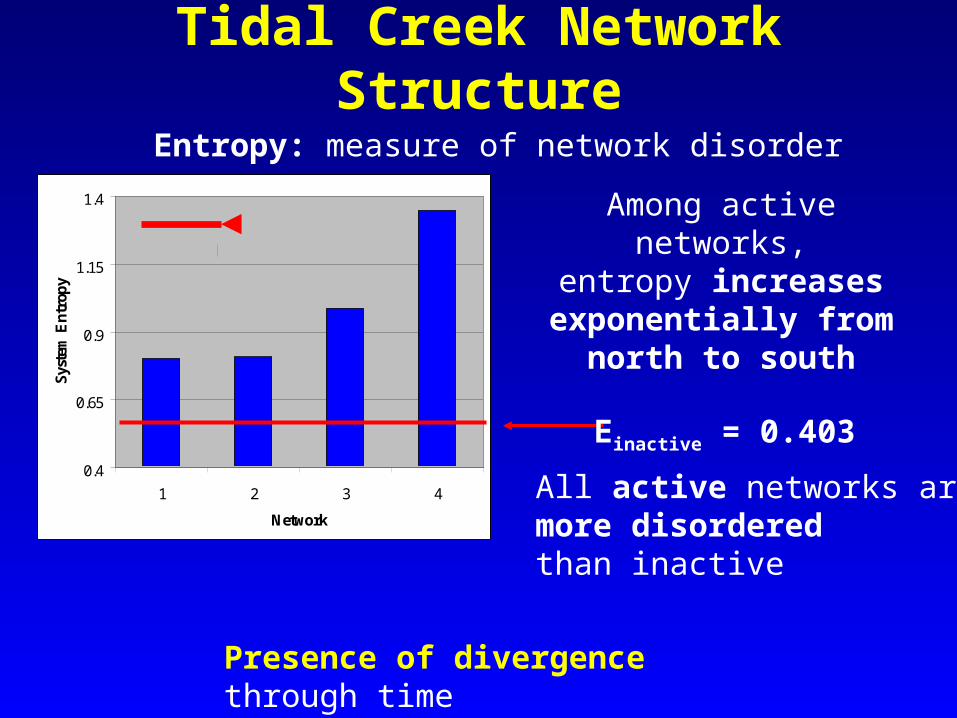
Tidal Creek Network Structure
Entropy: measure of network disorder
Among active networks,entropy increases
exponentially from north to south
0.4
0.65
0.9
1.15
1.4
1 2 3 4
Network
Sys
tem
En
trop
y
southward
Einactive = 0.403
All active networks are more disordered than inactive
Presence of divergence through time…chaos (?)…
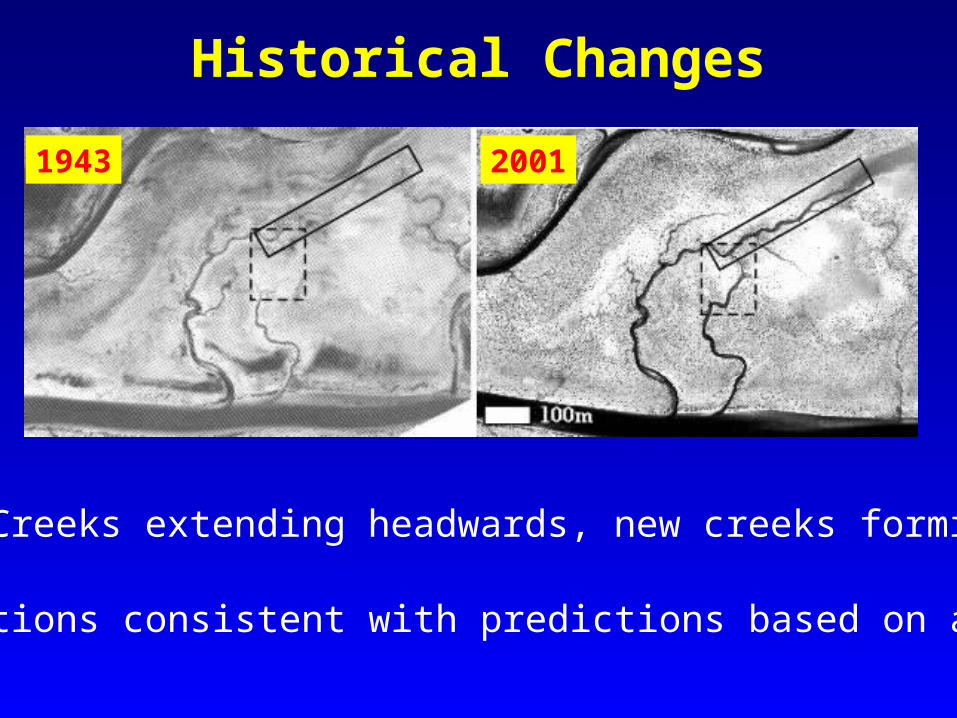
Historical Changes
1943 2001
• Creeks extending headwards, new creeks forming
…Observations consistent with predictions based on analysis
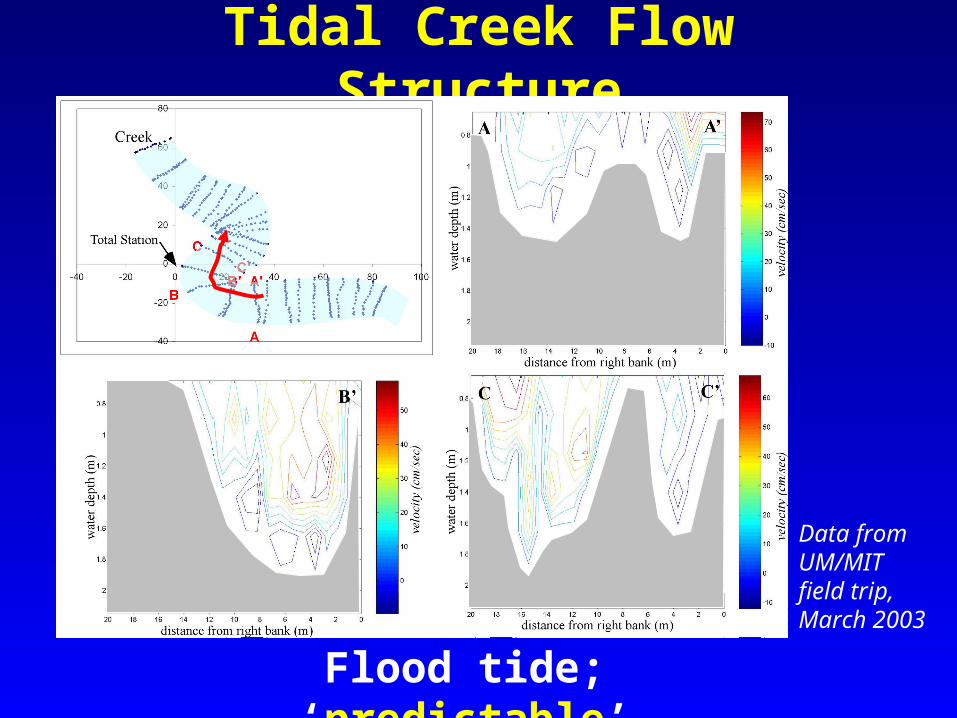
Tidal Creek Flow Structure
Data from UM/MIT field trip, March 2003
Flood tide; ‘predictable’
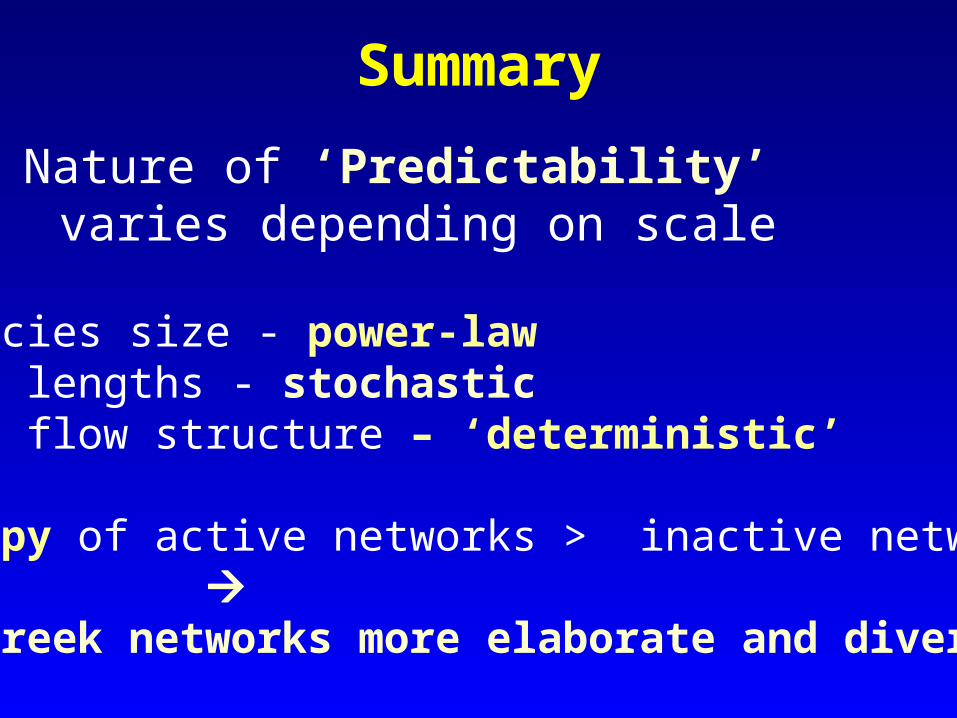
Summary
Nature of ‘Predictability’ varies depending on scale
• Subfacies size - power-law• Creek lengths - stochastic• Creek flow structure – ‘deterministic’ • Entropy of active networks > inactive networks: tidal creek networks more elaborate and diverge
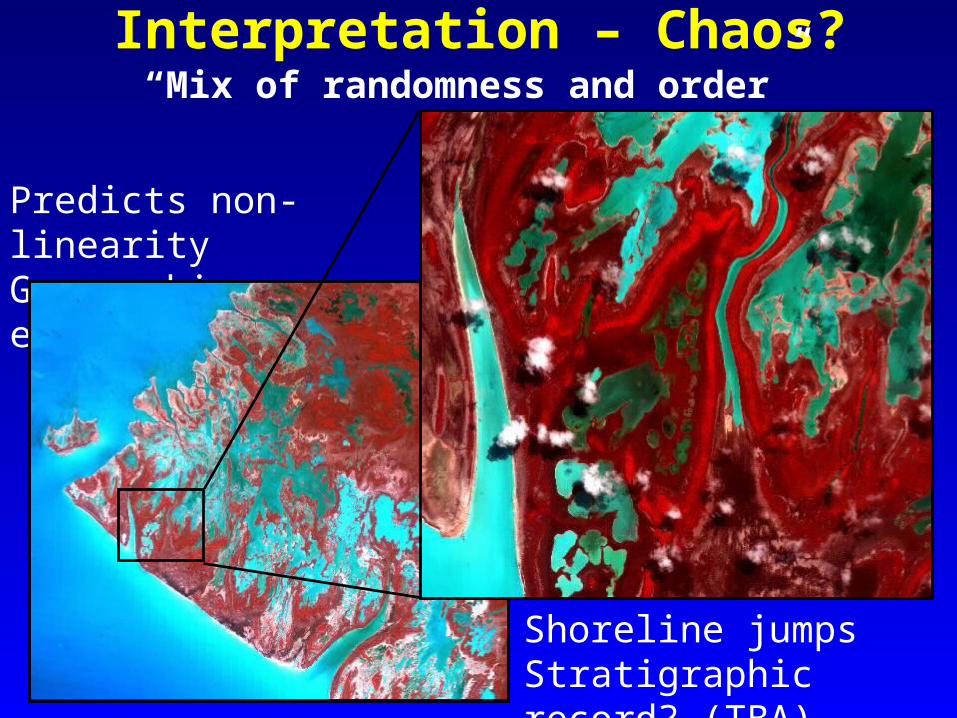
Interpretation – Chaos?
Predicts non-linearityGeomorphic evidence?
Shoreline jumpsStratigraphic record? (TBA)
“Mix of randomness and order”
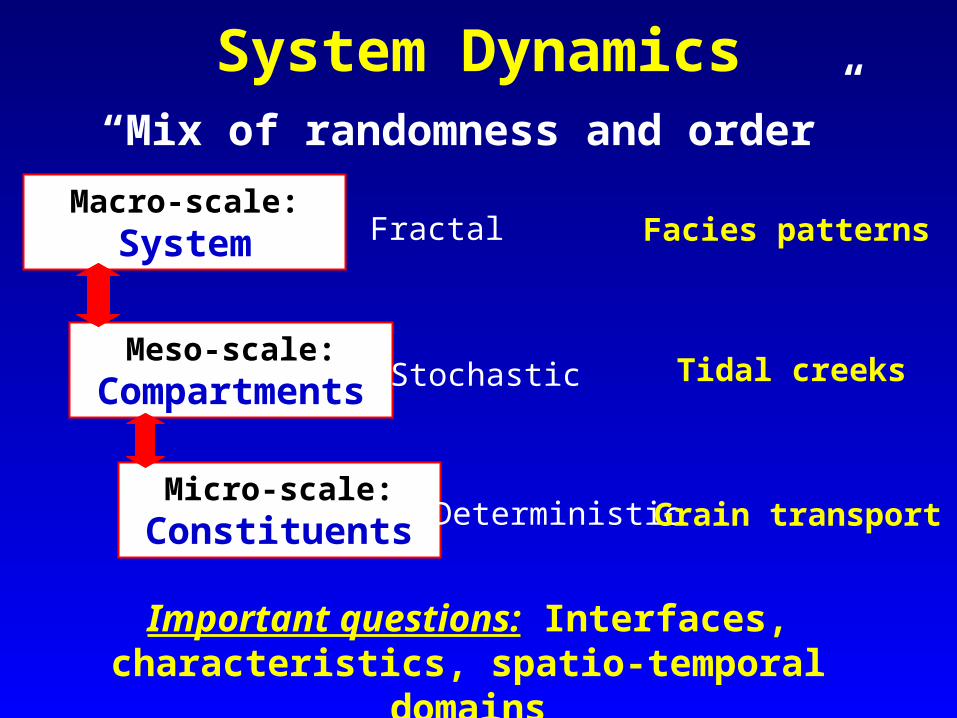
System Dynamics
Macro-scale:System
Meso-scale:Compartments
Micro-scale:Constituents
Fractal
Stochastic
Deterministic
Facies patterns
Tidal creeks
Grain transport
Important questions: Interfaces, characteristics, spatio-temporal domains
“Mix of randomness and order”
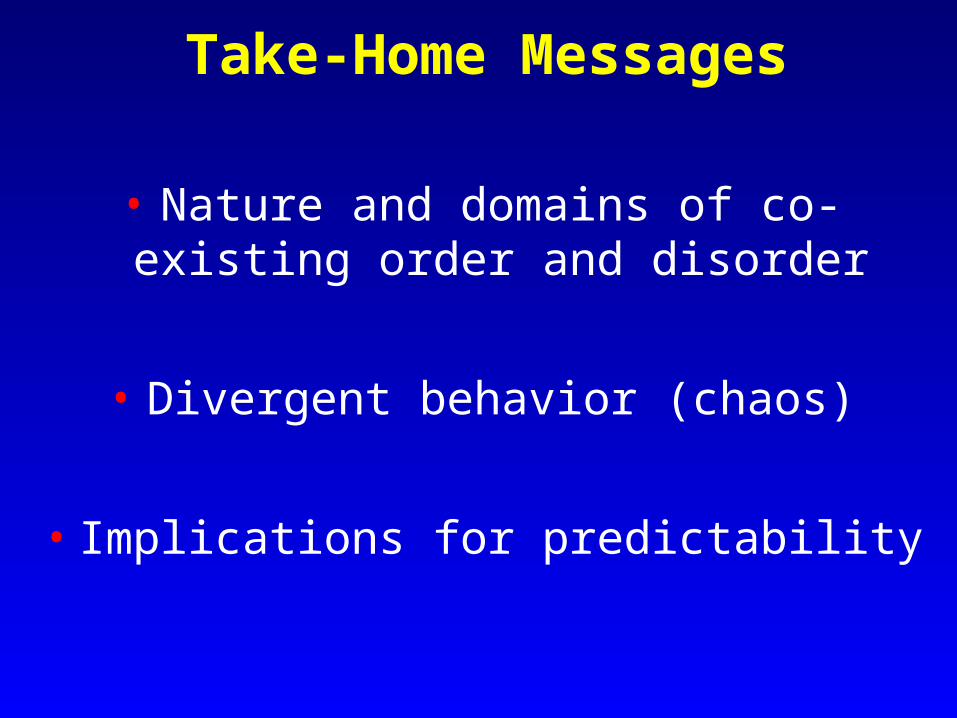
Take-Home Messages
• Nature and domains of co-existing order and disorder
• Divergent behavior (chaos)
• Implications for predictability