Embed Size (px)
Citation preview
Available online at www.sciencedirect.com
www.elsevier.com/locate/gca
Geochimica et Cosmochimica Acta 89 (2012) 116–133
Carbon sequestration via reaction with basaltic rocks:Geochemical modeling and experimental results
Robert J. Rosenbauer a,⇑, Burt Thomas a, James L. Bischoff a, James Palandri b
a U.S. Geological Survey, 345 Middlefield Road, Menlo Park, CA 94025, United Statesb University of Oregon, Eugene, OR 97403, United States
Received 7 January 2011; accepted in revised form 20 April 2012
Abstract
Basaltic rocks are potential repositories for sequestering carbon dioxide (CO2) because of their capacity for trapping CO2
in carbonate minerals. We carried out a series of thermodynamic equilibrium models and high pressure experiments, reactingbasalt with CO2-charged fluids over a range of conditions from 50 to 200 �C at 300 bar. Results indicate basalt has a highreactivity to CO2 acidified brine. Carbon dioxide is taken up from solution at all temperatures from 50 to 200 �C, 300 bar,but the maximum extent and rate of reaction occurs at 100 �C, 300 bar. Reaction path simulations utilizing the geochemicalmodeling program CHILLER predicted an equilibrium carbonate alteration assemblage of calcite, magnesite, and siderite,but the only secondary carbonate identified in the experiments was a ferroan magnesite. The amount of uptake at 100 �C,300 bar ranged from 8% by weight for a typical tholeite to 26% for a picrite. The actual amount of CO2 uptake and extentof rock alteration coincides directly with the magnesium content of the rock suggesting that overall reaction extent is con-trolled by bulk basalt Mg content. In terms of sequestering CO2, an average basaltic MgO content of 8% is equivalent to2.6 � 108 metric ton CO2/km3 basalt.Published by Elsevier Ltd.
1. INTRODUCTION
There is broad scientific consensus that global warmingand the resulting climate changes are caused by anthropo-genic emissions of CO2 (IPCC, 2007). Carbon dioxide cap-ture and storage (CCS) is a major component of a portfolioof advanced energy technologies required to mediate therise in concentration of atmospheric CO2. In particular,sequestration of CO2 as geochemically stable solid carbon-ates of Ca, Mg, and Fe through reaction with basaltic rockshas been tendered as a possible permanent sink for CO2
(Seifritz, 1990; McGrail et al., 2006; Alfredsson et al.,2008; Oelkers et al., 2008; Gislason et al., 2009; Goldberget al., 2009; Shikazono et al., 2009; Schaef et al., 2010). Im-mense basalt provinces exist worldwide in: Iceland, Hawaii,
0016-7037/$ - see front matter Published by Elsevier Ltd.
http://dx.doi.org/10.1016/j.gca.2012.04.042
⇑ Corresponding author.E-mail address: [email protected] (R.J. Rosenbauer).
the Columbia River Plateau and India’s Deccan VolcanicProvince (McGrail et al., 2006; Prasad et al., 2009). More-over, most basaltic flow complexes comprise multiple layersof flow tops that are macroporous and fracture-permeableand therefore contain significant pore capacity for storageof CO2 fluid or carbonate reaction products (McGrailet al., 2006; Goldberg et al., 2008). Importantly, in regionslacking traditional sedimentary reservoirs, CO2 injectioninto basalts may provide one of the only alternatives forgeologic sequestration of CO2.
Understanding the fundamental reactions of CO2 withbasalt is ever more important as the investment increasesin pilot-scale sequestration projects. Similar reactions arealso important in the evolution of geothermal projects inbasalt that propose the use CO2 as the working fluid(Pruess, 2006). Recent injection studies have been conductedin Iceland basalts and in the Palisades diabase of New Yorkin which carbonated waters are injected into basalticaquifers at depth (Matter et al., 2007; Alfredsson et al.,2008; Gislason et al., 2009). Under these conditions, and
R.J. Rosenbauer et al. / Geochimica et Cosmochimica Acta 89 (2012) 116–133 117
as predicted by reaction-path modeling and experiments(Gysi and Stefansson, 2008, 2009), demonstrable mineralcarbonation is expected.
2. PREVIOUS WORK
The literature related to carbon sequestration via min-eral carbonation is dominated by aqueous phase studiesof pure mineral reactions analogous to natural mineralweathering processes. Giammar et al. (2005) carried outbatch experiments in stainless-steel acid-digestion bombssimultaneously reacting forsterite with water and with aseparate supercritical CO2 phase at pressures up to 104 barsand up to 95 �C. After 26 days forsterite dissolution did notresult in magnesite precipitation even though conditions ofmineral supersaturation were achieved. Bearat et al. (2006)reacted olivine with aqueous solutions and supercriticalCO2 under a variety of conditions and found optimum for-mation of secondary magnesite within an aqueous solutionat 185 �C and 135 bar pCO2. Gerdemann et al. (2007) re-acted olivine under similar conditions using a continuouslystirred autoclave. They found 85% conversion of olivine tomagnesite within 6 h. Jones et al. (2010) reacted olivine atslightly higher temperature (200 �C) and found Fe2+ wasincorporated into carbonates more rapidly than Fe2+ oxi-dation (and concomitant H2 formation) leading to dimin-ished yields of magnetite, H2, and H2-dependent CH4
production. McGrail et al. (2006) reacted basalt with waterand supercritical CO2 at 90 �C and 100 bar pCO2 and ob-served secondary calcite surface coatings. In similar exper-iments at 50 �C and 103 bars pCO2, McGrail et al. (2009)suspended hand samples of basaltic rock within the super-critical, but water-saturated CO2 phase above the water le-vel. They observed secondary carbonate formation on thebasalt after 95 days. However, the solubility of water inthe supercritical CO2 phase can be substantial; for instance,at 100 �C and 300 bars water solubility is approximately2 mol% (Sabirzyanov et al., 2003; Schaef and Mcgrail,2009; Spycher et al., 2003). Schaef et al. (2010) reacted bas-alts from various provinces at 100 �C, 103 bars in staticautoclaves. They observed a large variation in weatheringfrom “minor” to “severe” after up to one-year duration.Interestingly, they found no convincing correlation betweenreactivity and bulk composition.
Here, we report the use of geochemical model simula-tions and high-pressure experimental reactions amongbasalt, brine, and aqueous CO2 over a range of tempera-tures, designed to probe the controls on the extent andrates of reaction between CO2 and basaltic rock. Thiswork aids in the identification of the important parame-ters controlling reaction extent and the determination ofoptimal geochemical conditions for the carbonation of ba-salt and mineral sequestration of CO2. Model simulationswere used to identify likely conditions of interest and asuite of subsequent experiments were designed to testimportant variables in reactions including the fluid satura-tions state with respect to CO2, reaction temperature, andthe bulk characteristics of the rocks that control reactionextent.
3. METHODS
3.1. Modeling methods
Thermodynamic equilibrium simulations were per-formed using CHILLER (Reed, 1982), which calculatesthe distribution of chemical components among minerals,gases, and species in the aqueous phase. The sources ofmost of the thermodynamic data, the methods of comput-ing activity and fugacity coefficients, and an overview ofthe limitations of the method are discussed in Palandriand Reed (2004) and are not repeated here. The thermody-namic data for minerals and H2O and CO2 gases, includingsupercritical CO2, are derived from the data of Holland andPowell (1998). In these simulations the fluid was first equil-ibrated with basalt at the stated conditions, then CO2 addedincrementally and equilibrium recalculated at each step, toobtain the results discussed below.
Equilibrium constants for individual reactions of inter-est were calculated also utilizing SUPCRT (Johnsonet al., 1992). Distributions of aqueous species and mineralsaturation indices for the experimental data were computedusing SOLMINEQ (Kharaka et al., 1988).
4. EXPERIMENTAL METHODS
4.1. Apparatus and experimental procedures
Experimental and analytical procedures generally fol-lowed the scheme described in Rosenbauer et al. (1983)with some modification for the injection, sampling andanalysis of CO2 (Rosenbauer et al., 2005). Liquid CO2
was injected into the reaction vessel via syringe pumps(ISCO Corp./Teledyne Inc., Model D100) charged from acommercial CO2 cylinder (Matheson Gas Inc.) equippedwith a full-length eductor tube for liquid withdrawal.Briefly, most experiments were carried out in flexible Au–Ti reaction cells with �200–350 cm3 total volume, equippedwith a small bore (2.3 mm) 1=4 in. OD, Ti capillary exit tubeand sampling valve. Serial sampling is therefore possiblewhile maintaining constant pressure conditions in the reac-tor. The cell was contained within a chrome-vanadiumautoclave that was secured within a cyclic rotating(180�) furnace (Rosenbauer et al., 1993). Before use, aque-ous fluids were sparged for 2 h with N2 to remove dissolvedO2. After the reactants were sealed inside the cell, the auto-clave was pressurized to �100 bar by adding water to theannulus surrounding the reaction cell inside the autoclave.The CO2 was injected with a syringe pump and the assem-bly was heated to experimental temperature. Pressure wasre-adjusted to target conditions and held constant whileheating. Temperature was maintained by a proportionalcontroller (Omega, Lovee Controls, Model 49) and mea-sured with a type K thermocouple calibrated to a platinumresistance temperature detector (RTD). Pressure was mea-sured with dead-weight calibrated analog gauges and digitaltransducers (Heise Corp.). In experiments where the solu-tion is CO2 saturated a small excess supercritical CO2 phaseis present. Constant agitation of these experiments ensures
118 R.J. Rosenbauer et al. / Geochimica et Cosmochimica Acta 89 (2012) 116–133
that the fine-grained basalt was likely dominantly sus-pended in the aqueous phase.
At the conclusion of an experiment during cooling anddepressurization, CO2 was bled off from the reaction cellin concert with the withdrawal of water from the autoclaveto preserve the integrity of the reaction cell. The autoclaveand reaction cell were disassembled, and the reacted solidswere filtered under a vacuum through 2.5 l paper filtersthen dried overnight at 80 �C. The quench, reactor disas-sembly, and filtration were conducted within a period ofless than one hour. The total quench volume and mass ofreacted solids were determined.
4.2. Experimental design
Experiments were carried out at 50, 100, and 200 �C andfrom 100 to 300 bars, and at partial pressures of CO2 sim-ulating both CO2-undersaturated and CO2-saturated aque-ous solutions (Table 1). Initial water/rock ratios were 10:1–2:1, representing approximately 200 g fluid and 20 or 100 grock, varying in actual amount depending in cell volume.Initial water/liquid CO2 volume ratios were �2:1 to 20:1in CO2 saturated experiments. Fluid withdrawal duringsampling had a negligible effect on water:rock ratios bythe end of experiments (approximate 10% decrease in totalfluid volume). After reaching steady-state based on aqueouschemistry, select experiments were conducted by instanta-neously changing PT conditions or by re-injecting CO2.In experiment designated 04-04, CO2 was re-injected intothe gold reaction cell to achieve a dissolved concentrationof 1.0 M after the initial amount of CO2 (1.0 M) had de-creased to steady-state of less than 1.0 mM). In experimentdesignated 04-05, the initial temperature of 200 �C was low-ered to 50 �C after steady-state to observe changes in fluidcomposition along a temperature gradient. We also con-ducted two long-term experiments in the gold cells heldconstant at 50 and 100 �C wherein the focus was on boththe early changes in the aqueous chemistry and final equi-librium composition under supercritical CO2 conditions(Duan and Sun, 2003). These experiments were sampledfrequently in the beginning of each experiment then againafter 4000 h.
A third set of three long-term batch experiments (09-01,09-02, 10-08) with basalts of different composition were car-ried out in fixed-volume (200 ml), titanium-lined steel reac-tion vessels for the purpose of investigating onlymineralogical changes and the net amount of CO2 uptake
Table 1Experimental conditions.
Experiment number Rock type Temperature (�C) Pressure (bar)
04-04 JDF 100 30004-05 JDF 200/50 30008-11 JDF 100 30008-12 JDF 50 30009-01 Picrite 100 30009-02 MTL 100 30010-08 MTL 100 300
SC, supercritical; JDF, Juan De Fuca; MTL, Mt. Lassen.
by basalt. After the rock powder and fluids were loadedinto the vessel, enough CO2 was injected via a titanium cap-illary to achieve target pressure at temperature and to attaina final prescribed rock:fluid ratio. The vessel was then se-cured to a rotating furnace and heated to conditions. Alltitanium surfaces were passivated at 450 �C for 24 h beforeuse. These experiments were carried out at 100 �C, 300 barwith initial (water or scCO2): rock ratios of 10:1 and withan approximate water:liquid CO2 ratio of 1:1 (Table 1).Fluid chemistry was not obtained for these experiments.The reacted solids were treated as above. CO2 consumptionduring the experiments is expected to affect the total pres-sure only negligibly due to the large excess of CO2.
4.3. Initial reactants and alteration products
Two different tholeitic basalts were utilized in experi-ments; A mid-ocean ridge basalt (MORB) from dredge haulL11-81-WF-17-40 on the Juan de Fuca Ridge (Dixon et al.,1986) designated JDF and a tholeite from Mt. Lassen (sam-ple LC84-569) (Mertzman, 1977; Bacon et al., 1997; Groveet al., 2002; Clynne et al., 2008; Clynne and Muffler, 2010)designated MTL. In addition, a picrite (olivine basalt) wasutilized in one long-term fixed volume experiment. The pi-crite is an olivine-rich tholeite from Houalalai Volcano.The groundmass is fine clinopyroxene, plagioclase, andFe–Ti oxides, but about 50% of the rock is large olivinephenocrysts (Moore and Clague, 1992. These samples rep-resent likely repository basalts for expected future injectionin locations. Basalt reactants were crushed, sieved between100 and 200 mesh, washed in distilled water and air-dried.The JDF tholeite used in the gold vessel experiments wascoated in a glassy rind. This glassy rind was avoided whensampling the crystalline interior prior to crushing. The sur-face area of the powered JDF tholeite was determined bythe BET method for both reactants and alteration productsfollowing experiments. The mineralogy of the tholeitic bas-alts comprises dominant calcic plagioclase, feldspar, andpyroxene with significant olivine (Table 3) as estimated bycalculated idealized normative mineralogy. The picrite con-tained 50% olivine and significant plagioclase (Table 3). Be-fore alteration major oxides were analyzed by atomicemission spectroscopy and FeO by dissolution and titration(Table 4) and after alteration CO2 was determined by eithercoulometry (UIC Coulometricse) and combustion/IR(SGS Mineral Services (Xral), Toronto, Canada). Solutionsof sodium chloride (0.5 and 1.0 M) were prepared from
Water/rock CO2 (molal) NaCl (molal) Reaction vessel
2:1 1.0 1.0 Gold2:1 1.0 1.0 Gold10:1 SC 0.5 Gold10:1 SC 0.5 Gold10:1 SC 0.5 Titanium10:1 SC 0.5 Titanium10:1 SC 0.5 Titanium
R.J. Rosenbauer et al. / Geochimica et Cosmochimica Acta 89 (2012) 116–133 119
reagent grade NaCl and deionized-distilled water and ana-lyzed for major impurities. The use of these two differentNaCl concentrations for subsequent experiments is unfor-tunate but is not expected or intended to be an importantvariable for the interpretation of results.
5. ANALYTICAL METHODS
Periodically, except for the long-term fixed-volume Tivessel experiments, aqueous samples were withdrawn fromeach experiment and analyzed for total dissolved inorganiccarbon as above and dissolved cations by inductively cou-pled plasma using both atomic emission and mass spectros-copy (ICP-AES, ICP-MS), and dissolved anions exceptchloride by ion-chromatography, chloride ion was deter-mined by potentiometric titration via a chloridometer (Lab-conco, Model 4425000). Serial samples were at intervals ofa few hours or daily near the beginning of each experiment,then at increasingly longer intervals depending on perceivedreaction rates and an estimate of nearness to steady-stateconcentrations for major cations. Total dissolved carbon(Ct) and pH were analyzed immediately after sampling onseparate 0.5 ml samples. Reported pH values are maximabecause the fluid samples began degassing CO2 during sam-pling. The in situ carbonate species distribution and pHwere calculated from Ct and pH measured at 22 �C usingthe computer code SOLMINEQ (Kharaka et al., 1988).Refractive index was determined by a hand-held refractom-eter (Vista Vision) on a drop of fluid during each samplingevent to measure total dissolved solids and to monitor theintegrity of the reaction cell. Aliquots for major elementswere syringe filtered (0.2 lm), diluted, and preserved forbatch analyses. Quench fluids were analyzed immediatelyfor pH and aliquots preserved for major element analyses.Dried-homogenized sub-samples of the reacted solids wereanalyzed for CO2 by coulometry.
For the fixed volume Ti vessel batch experiments both theoriginal and residual solids were analyzed by XRD to identifyprimary minerals, and by scanning electron microscopy(SEM) with energy dispersive spectroscopy (SEM/EDS) toobtain backscatter images and semi-quantitative mineralchemical compositions. Subsamples of solids for SEM/EDSanalyses were mounted on�1.2 cm diameter sample holders,affixed with double-sided carbon impregnated tape, and thencoated with gold. Less than 5% of the solids were analyzed bySEM/EDS. The composition of the solids was determined bytotal dissolution and ICP-AES analysis (Xral Corporation).
6. RESULTS
6.1. Model results
Model simulations utilizing the computer programCHILLER were carried out at each of the experimentalconditions but we highlight here the results in detail forthe experiments carried out at 100 �C and 300 bar due tothe maximum basalt reactivity at these conditions. In par-ticular we compare the modeled results to the results ofexperiment 04-04, under-saturated with CO2 wherein CO2
was re-injected. In the simulations, NaCl (1.0 m) is first
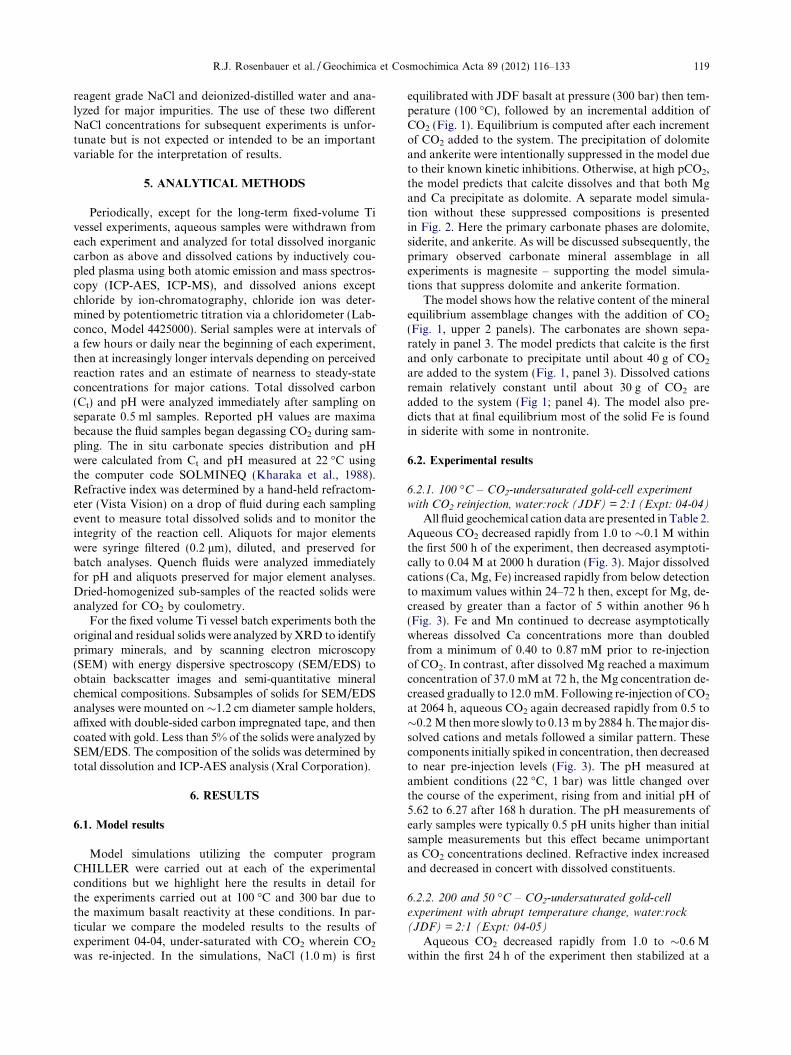
equilibrated with JDF basalt at pressure (300 bar) then tem-perature (100 �C), followed by an incremental addition ofCO2 (Fig. 1). Equilibrium is computed after each incrementof CO2 added to the system. The precipitation of dolomiteand ankerite were intentionally suppressed in the model dueto their known kinetic inhibitions. Otherwise, at high pCO2,the model predicts that calcite dissolves and that both Mgand Ca precipitate as dolomite. A separate model simula-tion without these suppressed compositions is presentedin Fig. 2. Here the primary carbonate phases are dolomite,siderite, and ankerite. As will be discussed subsequently, theprimary observed carbonate mineral assemblage in allexperiments is magnesite – supporting the model simula-tions that suppress dolomite and ankerite formation.
The model shows how the relative content of the mineralequilibrium assemblage changes with the addition of CO2
(Fig. 1, upper 2 panels). The carbonates are shown sepa-rately in panel 3. The model predicts that calcite is the firstand only carbonate to precipitate until about 40 g of CO2
are added to the system (Fig. 1, panel 3). Dissolved cationsremain relatively constant until about 30 g of CO2 areadded to the system (Fig 1; panel 4). The model also pre-dicts that at final equilibrium most of the solid Fe is foundin siderite with some in nontronite.
6.2. Experimental results
6.2.1. 100 �C – CO2-undersaturated gold-cell experiment
with CO2 reinjection, water:rock (JDF) = 2:1 (Expt: 04-04)
All fluid geochemical cation data are presented in Table 2.Aqueous CO2 decreased rapidly from 1.0 to �0.1 M withinthe first 500 h of the experiment, then decreased asymptoti-cally to 0.04 M at 2000 h duration (Fig. 3). Major dissolvedcations (Ca, Mg, Fe) increased rapidly from below detectionto maximum values within 24–72 h then, except for Mg, de-creased by greater than a factor of 5 within another 96 h(Fig. 3). Fe and Mn continued to decrease asymptoticallywhereas dissolved Ca concentrations more than doubledfrom a minimum of 0.40 to 0.87 mM prior to re-injectionof CO2. In contrast, after dissolved Mg reached a maximumconcentration of 37.0 mM at 72 h, the Mg concentration de-creased gradually to 12.0 mM. Following re-injection of CO2
at 2064 h, aqueous CO2 again decreased rapidly from 0.5 to�0.2 M then more slowly to 0.13 m by 2884 h. The major dis-solved cations and metals followed a similar pattern. Thesecomponents initially spiked in concentration, then decreasedto near pre-injection levels (Fig. 3). The pH measured atambient conditions (22 �C, 1 bar) was little changed overthe course of the experiment, rising from and initial pH of5.62 to 6.27 after 168 h duration. The pH measurements ofearly samples were typically 0.5 pH units higher than initialsample measurements but this effect became unimportantas CO2 concentrations declined. Refractive index increasedand decreased in concert with dissolved constituents.
6.2.2. 200 and 50 �C – CO2-undersaturated gold-cell
experiment with abrupt temperature change, water:rock
(JDF) = 2:1 (Expt: 04-05)
Aqueous CO2 decreased rapidly from 1.0 to �0.6 Mwithin the first 24 h of the experiment then stabilized at a
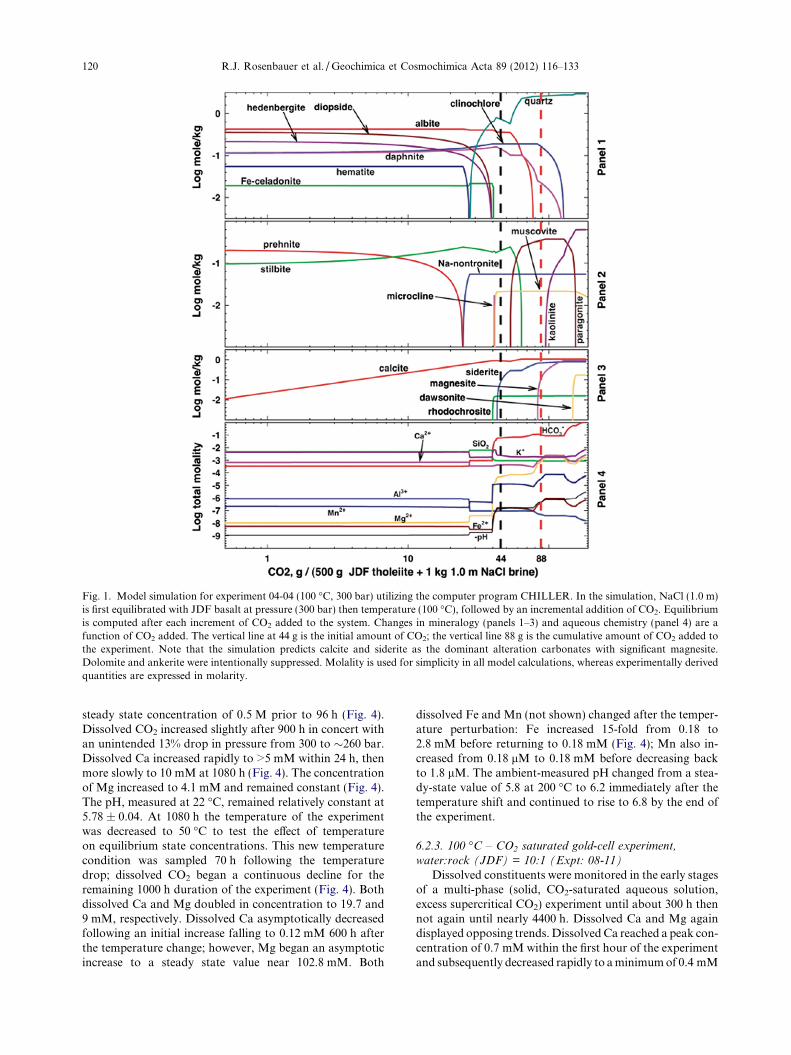
Fig. 1. Model simulation for experiment 04-04 (100 �C, 300 bar) utilizing the computer program CHILLER. In the simulation, NaCl (1.0 m)is first equilibrated with JDF basalt at pressure (300 bar) then temperature (100 �C), followed by an incremental addition of CO2. Equilibriumis computed after each increment of CO2 added to the system. Changes in mineralogy (panels 1–3) and aqueous chemistry (panel 4) are afunction of CO2 added. The vertical line at 44 g is the initial amount of CO2; the vertical line 88 g is the cumulative amount of CO2 added tothe experiment. Note that the simulation predicts calcite and siderite as the dominant alteration carbonates with significant magnesite.Dolomite and ankerite were intentionally suppressed. Molality is used for simplicity in all model calculations, whereas experimentally derivedquantities are expressed in molarity.
120 R.J. Rosenbauer et al. / Geochimica et Cosmochimica Acta 89 (2012) 116–133
steady state concentration of 0.5 M prior to 96 h (Fig. 4).Dissolved CO2 increased slightly after 900 h in concert withan unintended 13% drop in pressure from 300 to �260 bar.Dissolved Ca increased rapidly to >5 mM within 24 h, thenmore slowly to 10 mM at 1080 h (Fig. 4). The concentrationof Mg increased to 4.1 mM and remained constant (Fig. 4).The pH, measured at 22 �C, remained relatively constant at5.78 ± 0.04. At 1080 h the temperature of the experimentwas decreased to 50 �C to test the effect of temperatureon equilibrium state concentrations. This new temperaturecondition was sampled 70 h following the temperaturedrop; dissolved CO2 began a continuous decline for theremaining 1000 h duration of the experiment (Fig. 4). Bothdissolved Ca and Mg doubled in concentration to 19.7 and9 mM, respectively. Dissolved Ca asymptotically decreasedfollowing an initial increase falling to 0.12 mM 600 h afterthe temperature change; however, Mg began an asymptoticincrease to a steady state value near 102.8 mM. Both
dissolved Fe and Mn (not shown) changed after the temper-ature perturbation: Fe increased 15-fold from 0.18 to2.8 mM before returning to 0.18 mM (Fig. 4); Mn also in-creased from 0.18 lM to 0.18 mM before decreasing backto 1.8 lM. The ambient-measured pH changed from a stea-dy-state value of 5.8 at 200 �C to 6.2 immediately after thetemperature shift and continued to rise to 6.8 by the end ofthe experiment.
6.2.3. 100 �C – CO2 saturated gold-cell experiment,
water:rock (JDF) = 10:1 (Expt: 08-11)
Dissolved constituents were monitored in the early stagesof a multi-phase (solid, CO2-saturated aqueous solution,excess supercritical CO2) experiment until about 300 h thennot again until nearly 4400 h. Dissolved Ca and Mg againdisplayed opposing trends. Dissolved Ca reached a peak con-centration of 0.7 mM within the first hour of the experimentand subsequently decreased rapidly to a minimum of 0.4 mM
Fig. 2. Model simulation for experiment 04-04 without suppression of ankerite and dolomite.
R.J. Rosenbauer et al. / Geochimica et Cosmochimica Acta 89 (2012) 116–133 121
at 100 h, then increased to a maximum final concentration of0.9 mM at 4400 h (Fig. 5a). Dissolved Mg increased to amaximum of 38 mM within 83 h, then decreased slowly toa final concentration of 18 mM at 4400 h (Fig. 5b) absent alater increase as seen in Ca concentration. Dissolved CT
remained constant at �1.15 M. The ambient-measured pHincreased from an initial value of 5.6 to a final value of 6.2.
6.2.4. 50 �C – CO2 saturated gold-cell experiment,
water:rock (JDF) = 10:1 (Expt: 08-12)
Experiment 08-12, conducted at 50 �C, is directly compa-rable to experiment 08-11 with a similar sampling approachand the presence of a separate excess supercritical CO2
phase. Following an initial release of Ca and Mg from therock to solution, both species decreased to minimum valueswithin an hour after which both gradually increased in con-centration over the next 300 h (Fig. 6a and b). Dissolved Mgcontinued to increase to a maximum of 59 mM whereas Careached a maximum concentration of 0.8 mM thendecreased to near its minimum value after 4300 h. After aninitial rapid increase, dissolved Fe and Mn continued to in-crease gradually to maximum values around 300 h before
ultimately decreasing to minimum values after 4100 h(Fig. 6c and d). Dissolved CT remained constant at 1.3 m.The ambient-measured pH increased from an initial valueof 5.7 to a final value of 6.5.
6.2.5. 100 �C, 300 bar – Ti fixed volume vessel CO2 saturated
batch experiment, water:rock (MTL/picrite) = 10:1,
water:CO2 = 1:1
The MTL tholeite reacted with 0.5 M NaCl and super-critical CO2 in two duplicate experiments at 100 �C and300 bar for two months, took up 7.5 and 7.6 wt.% CO2,respectively (Table 5). In contrast, olivine basalt (picrite),reacted under the same conditions and duration took up26% CO2 (Table 5).
The altered basalt from all fixed volume experiments wasfriable, to the eye appeared little changed from the original,and was easily poured from the vessel as slurry. Chemicalanalyses (Table 5) indicated that the altered basalt containedvariable amounts of CO2, representing fixed carbonate.XRD analysis indicated major ferroan magnesite ((Mg,Fe)CO3) with moderate amounts of plagioclase, pyroxene,and quartz. The limit of detection by XRD is �5%. SEM
Table 2Experimental data.
Experiment Duration (h) CO2 (mM) Ca (mM) Mg (mM) Fe (mM)
04-04 0 673 2.3 3.0 0.1724 723 5.3 8.7 0.4872 593 1.7 36.8 0.52
168 364 0.5 36.2 0.17216 270 0.4 32.5 0.14336 164 0.5 22.0 0.09408 141 0.5 19.4 0.08648 116 0.5 17.9 0.08720 91 0.5 17.6 0.07840 70 0.5 16.6 0.07
1080 59 0.6 15.4 0.061200 55 0.7 14.3 0.051536 48 0.7 12.7 0.051896 42 0.9 12.9 0.052064 42 0.9 12.1 0.05
CO2 injection 2065 468 0.6 29.0 0.332089 411 0.4 28.1 0.132161 334 0.4 27.9 0.132233 261 0.5 24.9 0.132353 226 0.7 23.3 0.122569 188 1.0 22.2 0.112689 184 1.2 21.1 0.112881 161 1.5 19.7 0.11
04-05 0 673 3.0 0.0 0.0124 627 5.6 1.3 0.8696 504 8.5 4.4 0.22
216 502 8.4 4.8 0.30552 504 9.0 4.0 0.17912 575 9.4 4.2 0.18
1080 568 9.9 4.3 0.18
T = 50 �C 1368 559 19.7 9.0 2.781392 579 18.9 15.3 4.631416 564 19.2 24.6 4.411440 575 18.1 39.0 2.541584 470 3.5 89.5 0.301704 423 0.5 99.7 0.171896 370 0.1 99.9 0.182112 3232376 277
Experiment Duration (h) Ca (mM) Mg (mM) Fe (mM) Mn (mM)
08-11 0 0.68 2.19 5.16 0.881 0.64 3.63 6.70 1.17
12 0.71 6.45 4.81 0.7014 0.69 6.84 4.43 0.4424 0.65 2.97 0.2238 0.60 33.6 0.48 0.0647 0.55 35.3 0.34 0.0483 0.42 38.4 0.25 0.04
115 0.39 37.0 0.20 0.04258 0.41 32.9 0.18 0.03
4362 0.91 17.7 0.09 0.002
08-12 0.2 0.71 18.69 1.12 0.011.3 0.46 0.37 3.59 0.04
14 0.57 0.44 3.65 0.0559 0.68 0.61 3.90 0.0592 0.75 0.69 4.03 0.06
235 0.78 2.87 5.33 0.084339 0.52 59.15 0.85 0.01
122 R.J. Rosenbauer et al. / Geochimica et Cosmochimica Acta 89 (2012) 116–133
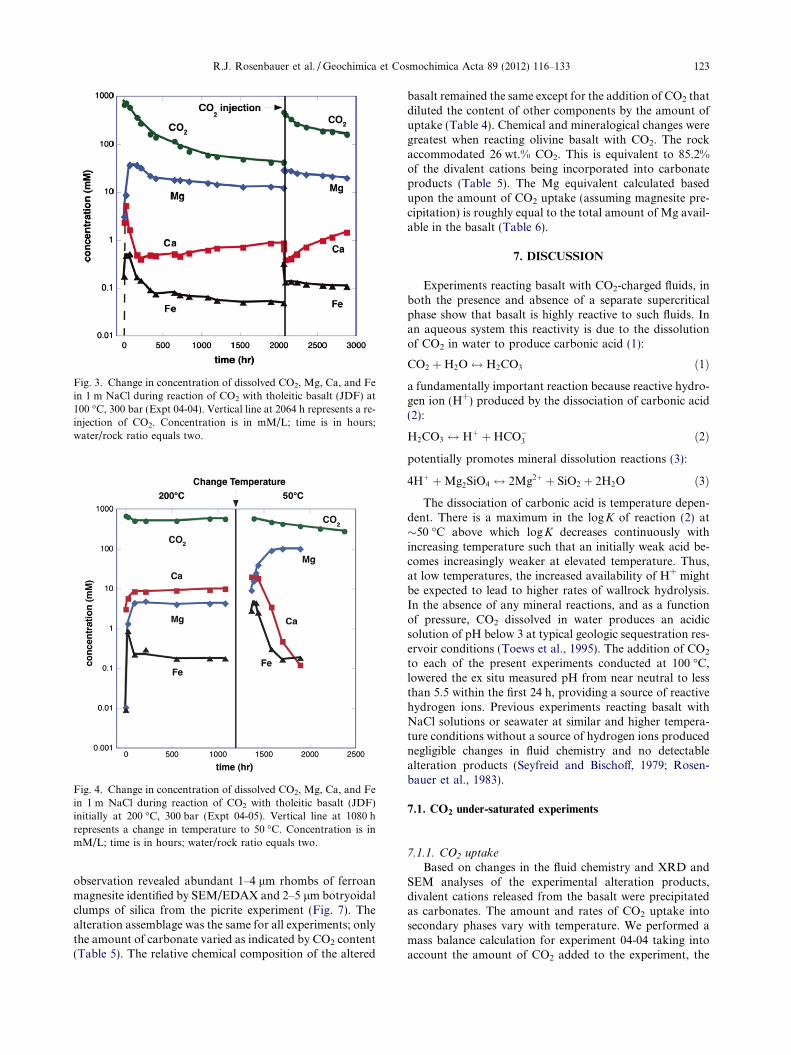
Fig. 3. Change in concentration of dissolved CO2, Mg, Ca, and Fein 1 m NaCl during reaction of CO2 with tholeitic basalt (JDF) at100 �C, 300 bar (Expt 04-04). Vertical line at 2064 h represents a re-injection of CO2. Concentration is in mM/L; time is in hours;water/rock ratio equals two.
Fig. 4. Change in concentration of dissolved CO2, Mg, Ca, and Fein 1 m NaCl during reaction of CO2 with tholeitic basalt (JDF)initially at 200 �C, 300 bar (Expt 04-05). Vertical line at 1080 hrepresents a change in temperature to 50 �C. Concentration is inmM/L; time is in hours; water/rock ratio equals two.
R.J. Rosenbauer et al. / Geochimica et Cosmochimica Acta 89 (2012) 116–133 123
observation revealed abundant 1–4 lm rhombs of ferroanmagnesite identified by SEM/EDAX and 2–5 lm botryoidalclumps of silica from the picrite experiment (Fig. 7). Thealteration assemblage was the same for all experiments; onlythe amount of carbonate varied as indicated by CO2 content(Table 5). The relative chemical composition of the altered
basalt remained the same except for the addition of CO2 thatdiluted the content of other components by the amount ofuptake (Table 4). Chemical and mineralogical changes weregreatest when reacting olivine basalt with CO2. The rockaccommodated 26 wt.% CO2. This is equivalent to 85.2%of the divalent cations being incorporated into carbonateproducts (Table 5). The Mg equivalent calculated basedupon the amount of CO2 uptake (assuming magnesite pre-cipitation) is roughly equal to the total amount of Mg avail-able in the basalt (Table 6).
7. DISCUSSION
Experiments reacting basalt with CO2-charged fluids, inboth the presence and absence of a separate supercriticalphase show that basalt is highly reactive to such fluids. Inan aqueous system this reactivity is due to the dissolutionof CO2 in water to produce carbonic acid (1):
CO2 þH2O$ H2CO3 ð1Þ
a fundamentally important reaction because reactive hydro-gen ion (H+) produced by the dissociation of carbonic acid(2):
H2CO3 $ Hþ þHCO�3 ð2Þ
potentially promotes mineral dissolution reactions (3):
4Hþ þMg2SiO4 $ 2Mg2þ þ SiO2 þ 2H2O ð3Þ
The dissociation of carbonic acid is temperature depen-dent. There is a maximum in the logK of reaction (2) at�50 �C above which logK decreases continuously withincreasing temperature such that an initially weak acid be-comes increasingly weaker at elevated temperature. Thus,at low temperatures, the increased availability of H+ mightbe expected to lead to higher rates of wallrock hydrolysis.In the absence of any mineral reactions, and as a functionof pressure, CO2 dissolved in water produces an acidicsolution of pH below 3 at typical geologic sequestration res-ervoir conditions (Toews et al., 1995). The addition of CO2
to each of the present experiments conducted at 100 �C,lowered the ex situ measured pH from near neutral to lessthan 5.5 within the first 24 h, providing a source of reactivehydrogen ions. Previous experiments reacting basalt withNaCl solutions or seawater at similar and higher tempera-ture conditions without a source of hydrogen ions producednegligible changes in fluid chemistry and no detectablealteration products (Seyfreid and Bischoff, 1979; Rosen-bauer et al., 1983).
7.1. CO2 under-saturated experiments
7.1.1. CO2 uptake
Based on changes in the fluid chemistry and XRD andSEM analyses of the experimental alteration products,divalent cations released from the basalt were precipitatedas carbonates. The amount and rates of CO2 uptake intosecondary phases vary with temperature. We performed amass balance calculation for experiment 04-04 taking intoaccount the amount of CO2 added to the experiment, the
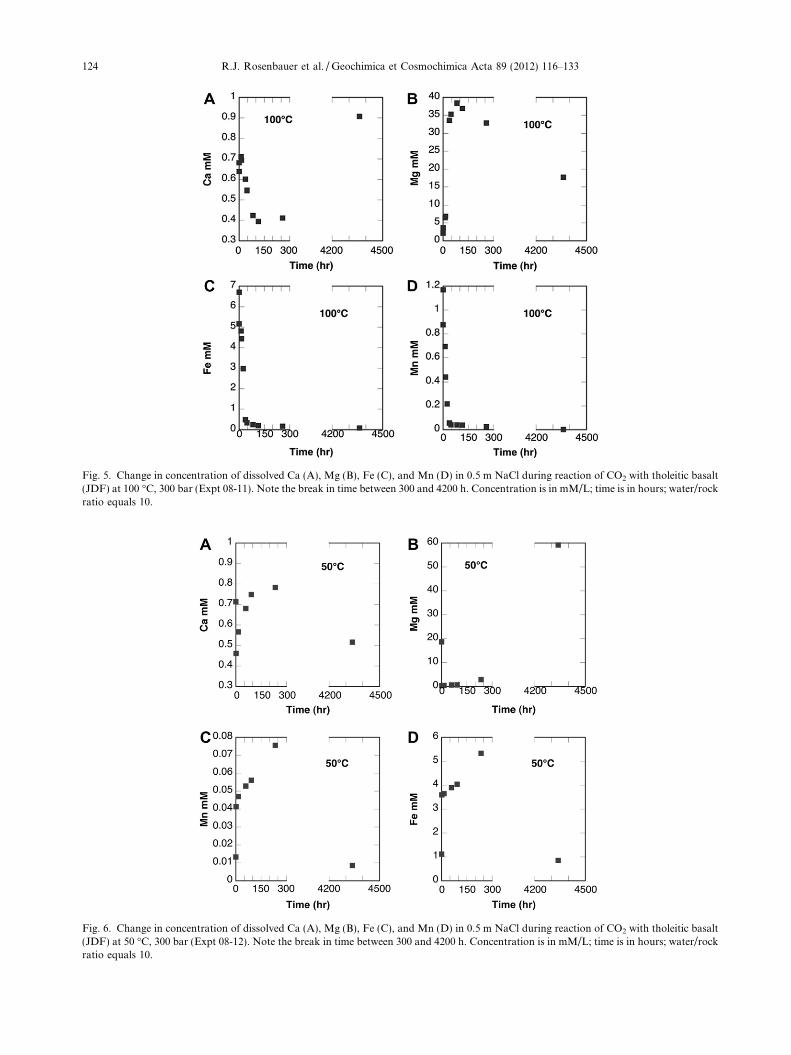
Fig. 5. Change in concentration of dissolved Ca (A), Mg (B), Fe (C), and Mn (D) in 0.5 m NaCl during reaction of CO2 with tholeitic basalt(JDF) at 100 �C, 300 bar (Expt 08-11). Note the break in time between 300 and 4200 h. Concentration is in mM/L; time is in hours; water/rockratio equals 10.
Fig. 6. Change in concentration of dissolved Ca (A), Mg (B), Fe (C), and Mn (D) in 0.5 m NaCl during reaction of CO2 with tholeitic basalt(JDF) at 50 �C, 300 bar (Expt 08-12). Note the break in time between 300 and 4200 h. Concentration is in mM/L; time is in hours; water/rockratio equals 10.
124 R.J. Rosenbauer et al. / Geochimica et Cosmochimica Acta 89 (2012) 116–133
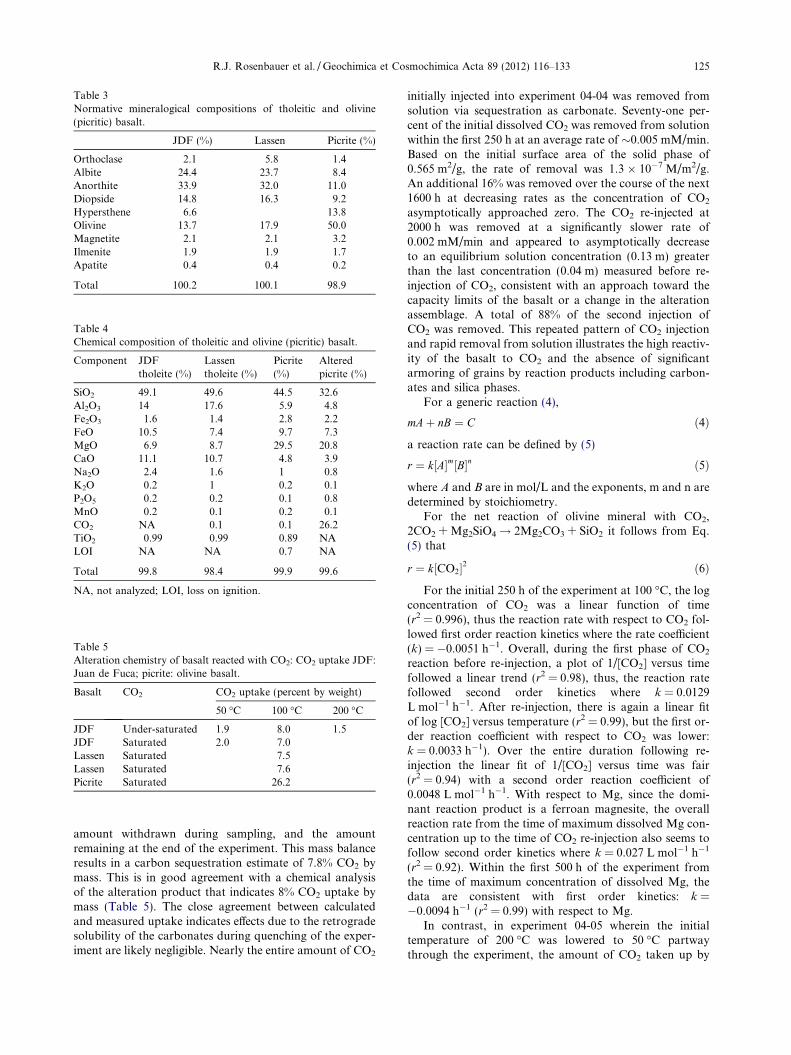
Table 3Normative mineralogical compositions of tholeitic and olivine(picritic) basalt.
JDF (%) Lassen Picrite (%)
Orthoclase 2.1 5.8 1.4Albite 24.4 23.7 8.4Anorthite 33.9 32.0 11.0Diopside 14.8 16.3 9.2Hypersthene 6.6 13.8Olivine 13.7 17.9 50.0Magnetite 2.1 2.1 3.2Ilmenite 1.9 1.9 1.7Apatite 0.4 0.4 0.2
Total 100.2 100.1 98.9
Table 4Chemical composition of tholeitic and olivine (picritic) basalt.
Component JDFtholeite (%)
Lassentholeite (%)
Picrite(%)
Alteredpicrite (%)
SiO2 49.1 49.6 44.5 32.6Al2O3 14 17.6 5.9 4.8Fe2O3 1.6 1.4 2.8 2.2FeO 10.5 7.4 9.7 7.3MgO 6.9 8.7 29.5 20.8CaO 11.1 10.7 4.8 3.9Na2O 2.4 1.6 1 0.8K2O 0.2 1 0.2 0.1P2O5 0.2 0.2 0.1 0.8MnO 0.2 0.1 0.2 0.1CO2 NA 0.1 0.1 26.2TiO2 0.99 0.99 0.89 NALOI NA NA 0.7 NA
Total 99.8 98.4 99.9 99.6
NA, not analyzed; LOI, loss on ignition.
Table 5Alteration chemistry of basalt reacted with CO2: CO2 uptake JDF:Juan de Fuca; picrite: olivine basalt.
Basalt CO2 CO2 uptake (percent by weight)
50 �C 100 �C 200 �C
JDF Under-saturated 1.9 8.0 1.5JDF Saturated 2.0 7.0Lassen Saturated 7.5Lassen Saturated 7.6Picrite Saturated 26.2
R.J. Rosenbauer et al. / Geochimica et Cosmochimica Acta 89 (2012) 116–133 125
amount withdrawn during sampling, and the amountremaining at the end of the experiment. This mass balanceresults in a carbon sequestration estimate of 7.8% CO2 bymass. This is in good agreement with a chemical analysisof the alteration product that indicates 8% CO2 uptake bymass (Table 5). The close agreement between calculatedand measured uptake indicates effects due to the retrogradesolubility of the carbonates during quenching of the exper-iment are likely negligible. Nearly the entire amount of CO2
initially injected into experiment 04-04 was removed fromsolution via sequestration as carbonate. Seventy-one per-cent of the initial dissolved CO2 was removed from solutionwithin the first 250 h at an average rate of �0.005 mM/min.Based on the initial surface area of the solid phase of0.565 m2/g, the rate of removal was 1.3 � 10�7 M/m2/g.An additional 16% was removed over the course of the next1600 h at decreasing rates as the concentration of CO2
asymptotically approached zero. The CO2 re-injected at2000 h was removed at a significantly slower rate of0.002 mM/min and appeared to asymptotically decreaseto an equilibrium solution concentration (0.13 m) greaterthan the last concentration (0.04 m) measured before re-injection of CO2, consistent with an approach toward thecapacity limits of the basalt or a change in the alterationassemblage. A total of 88% of the second injection ofCO2 was removed. This repeated pattern of CO2 injectionand rapid removal from solution illustrates the high reactiv-ity of the basalt to CO2 and the absence of significantarmoring of grains by reaction products including carbon-ates and silica phases.
For a generic reaction (4),
mAþ nB ¼ C ð4Þ
a reaction rate can be defined by (5)
r ¼ k½A�m½B�n ð5Þ
where A and B are in mol/L and the exponents, m and n aredetermined by stoichiometry.
For the net reaction of olivine mineral with CO2,2CO2 + Mg2SiO4! 2Mg2CO3 + SiO2 it follows from Eq.(5) that
r ¼ k½CO2�2 ð6Þ
For the initial 250 h of the experiment at 100 �C, the logconcentration of CO2 was a linear function of time(r2 = 0.996), thus the reaction rate with respect to CO2 fol-lowed first order reaction kinetics where the rate coefficient(k) = �0.0051 h�1. Overall, during the first phase of CO2
reaction before re-injection, a plot of 1/[CO2] versus timefollowed a linear trend (r2 = 0.98), thus, the reaction ratefollowed second order kinetics where k = 0.0129L mol�1 h�1. After re-injection, there is again a linear fitof log [CO2] versus temperature (r2 = 0.99), but the first or-der reaction coefficient with respect to CO2 was lower:k = 0.0033 h�1). Over the entire duration following re-injection the linear fit of 1/[CO2] versus time was fair(r2 = 0.94) with a second order reaction coefficient of0.0048 L mol�1 h�1. With respect to Mg, since the domi-nant reaction product is a ferroan magnesite, the overallreaction rate from the time of maximum dissolved Mg con-centration up to the time of CO2 re-injection also seems tofollow second order kinetics where k = 0.027 L mol�1 h�1
(r2 = 0.92). Within the first 500 h of the experiment fromthe time of maximum concentration of dissolved Mg, thedata are consistent with first order kinetics: k =�0.0094 h�1 (r2 = 0.99) with respect to Mg.
In contrast, in experiment 04-05 wherein the initialtemperature of 200 �C was lowered to 50 �C partwaythrough the experiment, the amount of CO2 taken up by
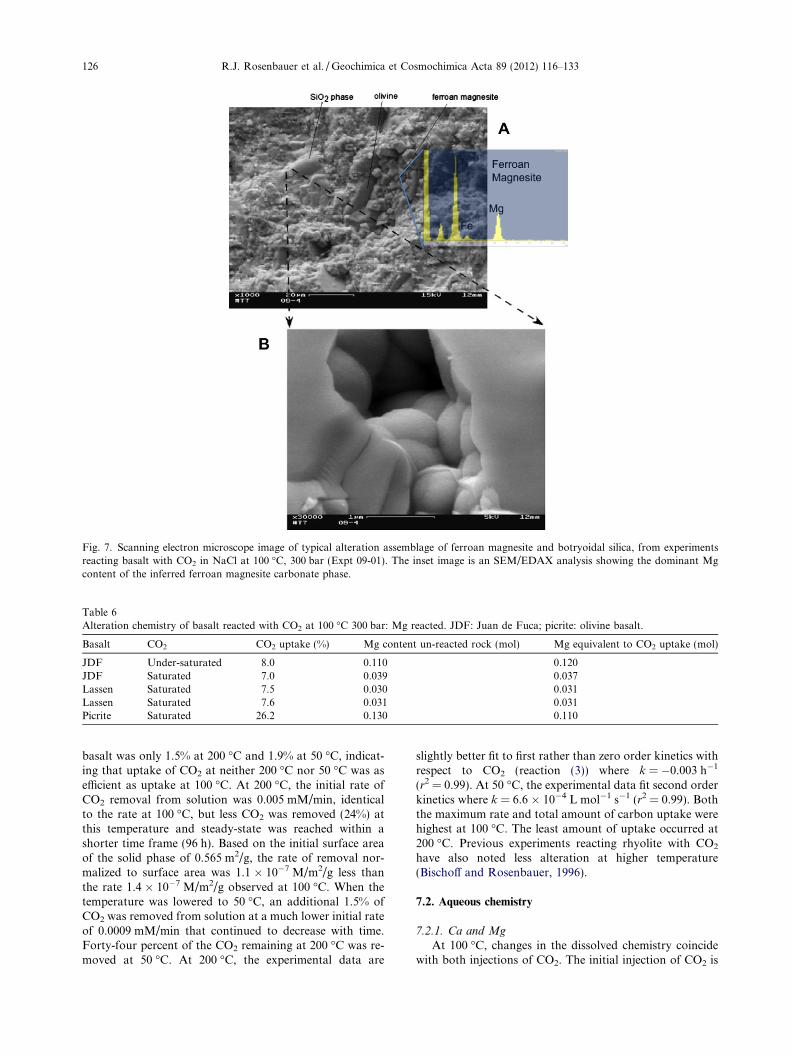
Fig. 7. Scanning electron microscope image of typical alteration assemblage of ferroan magnesite and botryoidal silica, from experimentsreacting basalt with CO2 in NaCl at 100 �C, 300 bar (Expt 09-01). The inset image is an SEM/EDAX analysis showing the dominant Mgcontent of the inferred ferroan magnesite carbonate phase.
Table 6Alteration chemistry of basalt reacted with CO2 at 100 �C 300 bar: Mg reacted. JDF: Juan de Fuca; picrite: olivine basalt.
Basalt CO2 CO2 uptake (%) Mg content un-reacted rock (mol) Mg equivalent to CO2 uptake (mol)
JDF Under-saturated 8.0 0.110 0.120JDF Saturated 7.0 0.039 0.037Lassen Saturated 7.5 0.030 0.031Lassen Saturated 7.6 0.031 0.031Picrite Saturated 26.2 0.130 0.110
126 R.J. Rosenbauer et al. / Geochimica et Cosmochimica Acta 89 (2012) 116–133
basalt was only 1.5% at 200 �C and 1.9% at 50 �C, indicat-ing that uptake of CO2 at neither 200 �C nor 50 �C was asefficient as uptake at 100 �C. At 200 �C, the initial rate ofCO2 removal from solution was 0.005 mM/min, identicalto the rate at 100 �C, but less CO2 was removed (24%) atthis temperature and steady-state was reached within ashorter time frame (96 h). Based on the initial surface areaof the solid phase of 0.565 m2/g, the rate of removal nor-malized to surface area was 1.1 � 10�7 M/m2/g less thanthe rate 1.4 � 10�7 M/m2/g observed at 100 �C. When thetemperature was lowered to 50 �C, an additional 1.5% ofCO2 was removed from solution at a much lower initial rateof 0.0009 mM/min that continued to decrease with time.Forty-four percent of the CO2 remaining at 200 �C was re-moved at 50 �C. At 200 �C, the experimental data are
slightly better fit to first rather than zero order kinetics withrespect to CO2 (reaction (3)) where k = �0.003 h�1
(r2 = 0.99). At 50 �C, the experimental data fit second orderkinetics where k = 6.6 � 10�4 L mol�1 s�1 (r2 = 0.99). Boththe maximum rate and total amount of carbon uptake werehighest at 100 �C. The least amount of uptake occurred at200 �C. Previous experiments reacting rhyolite with CO2
have also noted less alteration at higher temperature(Bischoff and Rosenbauer, 1996).
7.2. Aqueous chemistry
7.2.1. Ca and Mg
At 100 �C, changes in the dissolved chemistry coincidewith both injections of CO2. The initial injection of CO2 is
R.J. Rosenbauer et al. / Geochimica et Cosmochimica Acta 89 (2012) 116–133 127
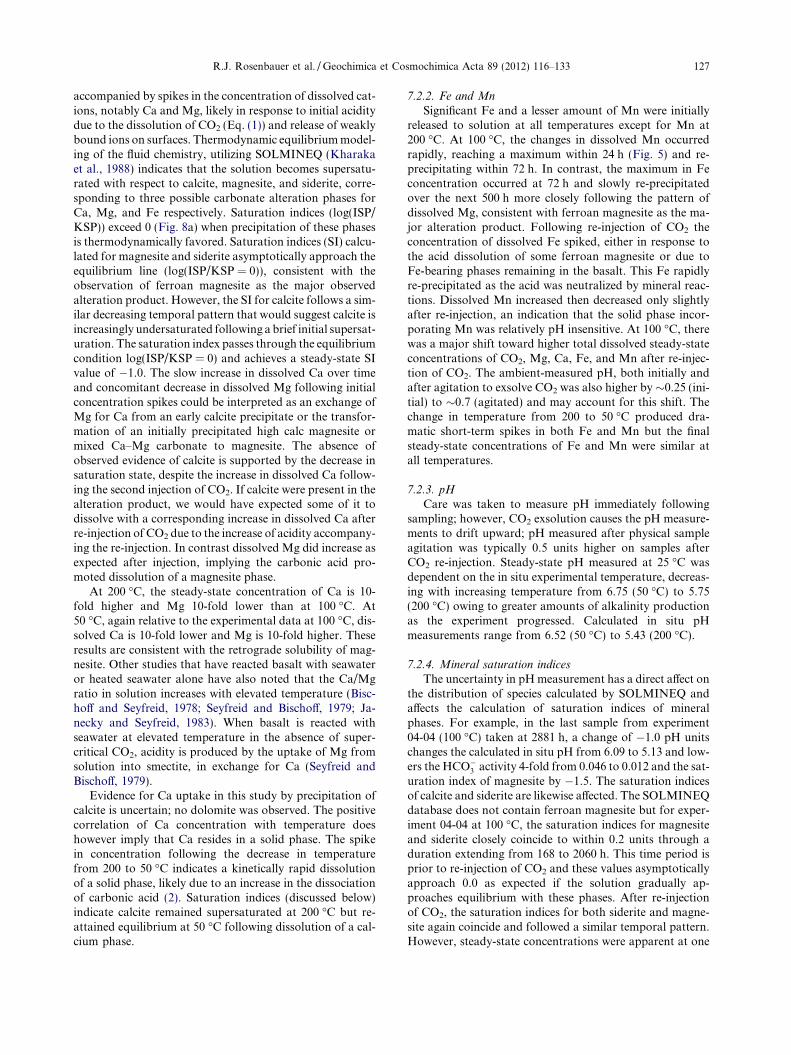
accompanied by spikes in the concentration of dissolved cat-ions, notably Ca and Mg, likely in response to initial aciditydue to the dissolution of CO2 (Eq. (1)) and release of weaklybound ions on surfaces. Thermodynamic equilibrium model-ing of the fluid chemistry, utilizing SOLMINEQ (Kharakaet al., 1988) indicates that the solution becomes supersatu-rated with respect to calcite, magnesite, and siderite, corre-sponding to three possible carbonate alteration phases forCa, Mg, and Fe respectively. Saturation indices (log(ISP/KSP)) exceed 0 (Fig. 8a) when precipitation of these phasesis thermodynamically favored. Saturation indices (SI) calcu-lated for magnesite and siderite asymptotically approach theequilibrium line (log(ISP/KSP = 0)), consistent with theobservation of ferroan magnesite as the major observedalteration product. However, the SI for calcite follows a sim-ilar decreasing temporal pattern that would suggest calcite isincreasingly undersaturated following a brief initial supersat-uration. The saturation index passes through the equilibriumcondition log(ISP/KSP = 0) and achieves a steady-state SIvalue of �1.0. The slow increase in dissolved Ca over timeand concomitant decrease in dissolved Mg following initialconcentration spikes could be interpreted as an exchange ofMg for Ca from an early calcite precipitate or the transfor-mation of an initially precipitated high calc magnesite ormixed Ca–Mg carbonate to magnesite. The absence ofobserved evidence of calcite is supported by the decrease insaturation state, despite the increase in dissolved Ca follow-ing the second injection of CO2. If calcite were present in thealteration product, we would have expected some of it todissolve with a corresponding increase in dissolved Ca afterre-injection of CO2 due to the increase of acidity accompany-ing the re-injection. In contrast dissolved Mg did increase asexpected after injection, implying the carbonic acid pro-moted dissolution of a magnesite phase.
At 200 �C, the steady-state concentration of Ca is 10-fold higher and Mg 10-fold lower than at 100 �C. At50 �C, again relative to the experimental data at 100 �C, dis-solved Ca is 10-fold lower and Mg is 10-fold higher. Theseresults are consistent with the retrograde solubility of mag-nesite. Other studies that have reacted basalt with seawateror heated seawater alone have also noted that the Ca/Mgratio in solution increases with elevated temperature (Bisc-hoff and Seyfreid, 1978; Seyfreid and Bischoff, 1979; Ja-necky and Seyfreid, 1983). When basalt is reacted withseawater at elevated temperature in the absence of super-critical CO2, acidity is produced by the uptake of Mg fromsolution into smectite, in exchange for Ca (Seyfreid andBischoff, 1979).
Evidence for Ca uptake in this study by precipitation ofcalcite is uncertain; no dolomite was observed. The positivecorrelation of Ca concentration with temperature doeshowever imply that Ca resides in a solid phase. The spikein concentration following the decrease in temperaturefrom 200 to 50 �C indicates a kinetically rapid dissolutionof a solid phase, likely due to an increase in the dissociationof carbonic acid (2). Saturation indices (discussed below)indicate calcite remained supersaturated at 200 �C but re-attained equilibrium at 50 �C following dissolution of a cal-cium phase.
7.2.2. Fe and Mn
Significant Fe and a lesser amount of Mn were initiallyreleased to solution at all temperatures except for Mn at200 �C. At 100 �C, the changes in dissolved Mn occurredrapidly, reaching a maximum within 24 h (Fig. 5) and re-precipitating within 72 h. In contrast, the maximum in Feconcentration occurred at 72 h and slowly re-precipitatedover the next 500 h more closely following the pattern ofdissolved Mg, consistent with ferroan magnesite as the ma-jor alteration product. Following re-injection of CO2 theconcentration of dissolved Fe spiked, either in response tothe acid dissolution of some ferroan magnesite or due toFe-bearing phases remaining in the basalt. This Fe rapidlyre-precipitated as the acid was neutralized by mineral reac-tions. Dissolved Mn increased then decreased only slightlyafter re-injection, an indication that the solid phase incor-porating Mn was relatively pH insensitive. At 100 �C, therewas a major shift toward higher total dissolved steady-stateconcentrations of CO2, Mg, Ca, Fe, and Mn after re-injec-tion of CO2. The ambient-measured pH, both initially andafter agitation to exsolve CO2 was also higher by �0.25 (ini-tial) to �0.7 (agitated) and may account for this shift. Thechange in temperature from 200 to 50 �C produced dra-matic short-term spikes in both Fe and Mn but the finalsteady-state concentrations of Fe and Mn were similar atall temperatures.
7.2.3. pH
Care was taken to measure pH immediately followingsampling; however, CO2 exsolution causes the pH measure-ments to drift upward; pH measured after physical sampleagitation was typically 0.5 units higher on samples afterCO2 re-injection. Steady-state pH measured at 25 �C wasdependent on the in situ experimental temperature, decreas-ing with increasing temperature from 6.75 (50 �C) to 5.75(200 �C) owing to greater amounts of alkalinity productionas the experiment progressed. Calculated in situ pHmeasurements range from 6.52 (50 �C) to 5.43 (200 �C).
7.2.4. Mineral saturation indices
The uncertainty in pH measurement has a direct affect onthe distribution of species calculated by SOLMINEQ andaffects the calculation of saturation indices of mineralphases. For example, in the last sample from experiment04-04 (100 �C) taken at 2881 h, a change of �1.0 pH unitschanges the calculated in situ pH from 6.09 to 5.13 and low-ers the HCO�3 activity 4-fold from 0.046 to 0.012 and the sat-uration index of magnesite by �1.5. The saturation indicesof calcite and siderite are likewise affected. The SOLMINEQdatabase does not contain ferroan magnesite but for exper-iment 04-04 at 100 �C, the saturation indices for magnesiteand siderite closely coincide to within 0.2 units through aduration extending from 168 to 2060 h. This time period isprior to re-injection of CO2 and these values asymptoticallyapproach 0.0 as expected if the solution gradually ap-proaches equilibrium with these phases. After re-injectionof CO2, the saturation indices for both siderite and magne-site again coincide and followed a similar temporal pattern.However, steady-state concentrations were apparent at one
128 R.J. Rosenbauer et al. / Geochimica et Cosmochimica Acta 89 (2012) 116–133
order of magnitude super-saturated (SI = 1). In contrast,following re-injection the solution appeared to be at equilib-rium with respect to calcite. Interestingly, no calcite hasbeen observed in the alteration products. Since calculatedsaturation indices are dependent on the measured pH fromdecompressed fluid, these saturation index discrepanciescould be a result of pH measurements that are biased towardhigher values. Perhaps not coincidently, the lower pH valuesfor samples after re-injection of CO2 improves from 3% to<1% the difference in the calculated electro-neutrality ofthe solution due to a re-speciation of dissolved carbonate.
At 200 �C, based on its SI, magnesite is the precipitatingphase (Fig. 8b); both calcite and siderite remained super-saturated. Following the temperature drop to 50 �C, thesolution approaches equilibrium with calcite and becomessuper-saturated with respect to both siderite and magnesiteby 2 orders of magnitude. The only secondary phase detect-able by SEM and XRD was ferroan magnesite, similar tothe reaction product produced at 100 �C.
Fig. 8. (A) Change in saturation indices for siderite, magnesite, and calcitreaction of CO2 in 1 m NaCl with tholeitic basalt at 100 �C, 300 bar. Thindicate the mineral is supersaturated, favoring precipitation; negative valinjection of CO2 into the experiment occurred at 2064 h (vertical line).siderite, magnesite, and calcite calculated using SOLMINEQ92 and the sobasalt initially at 200 �C, 300 bar. Temperature was changed to 50 �C at
7.3. CO2 saturated experiments
7.3.1. CO2 uptake
Because of an excess of CO2 in a separate supercriticalphase, the concentration of total dissolved CO2 is depen-dent on its solubility and thus remained constant at 1.2 mat 100 �C and 1.3 m at 50 �C and did not yield informationon CO2 uptake. Examination of the solids after these exper-iments showed that the basalt had taken up 7% and 2%CO2 at 100 and 50 �C after 6 months duration. Althoughcarried out at different water/rock ratios and saturationstates of CO2, the amounts of CO2 taken up by basalt inthe presence of a separate supercritical phase were very sim-ilar to the amounts taken up in the under-saturated CO2
experiments at 100 �C (�8%), 200 �C (�2%), and 50 �C(�2%). These results imply that the amount of basalt inthe experiment at 100 �C had neared its capacity to seques-ter CO2 after the second injection of CO2 and may explainthe elevated steady-state concentration of CO2 post injec-
e calculated using SOLMINEQ92 and the solution chemistry duringe equilibrium line is defined by log (IAP/KSP) = 0. Positive valuesues indicate the mineral is undersaturated, favoring dissolution. Re-Water:rock ratio equals two. (B) Change in saturation indices forlution chemistry during reaction of CO2 in 1 m NaCl with tholeitic1080 h (vertical line).
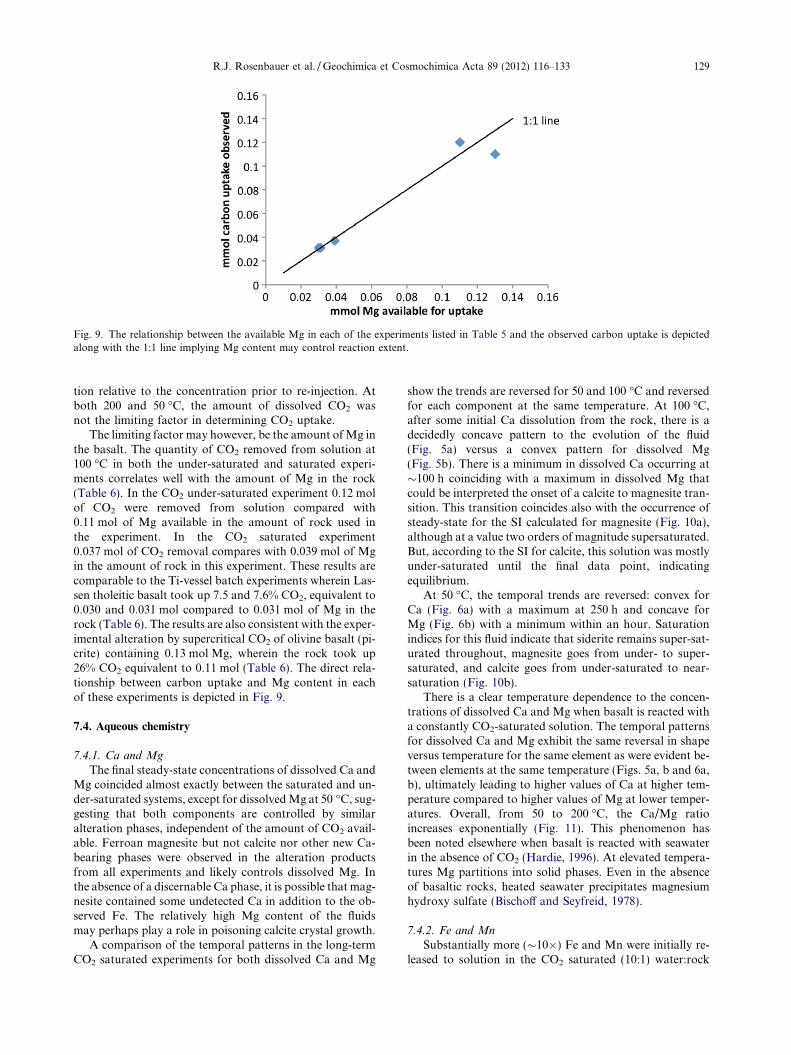
Fig. 9. The relationship between the available Mg in each of the experiments listed in Table 5 and the observed carbon uptake is depictedalong with the 1:1 line implying Mg content may control reaction extent.
R.J. Rosenbauer et al. / Geochimica et Cosmochimica Acta 89 (2012) 116–133 129
tion relative to the concentration prior to re-injection. Atboth 200 and 50 �C, the amount of dissolved CO2 wasnot the limiting factor in determining CO2 uptake.
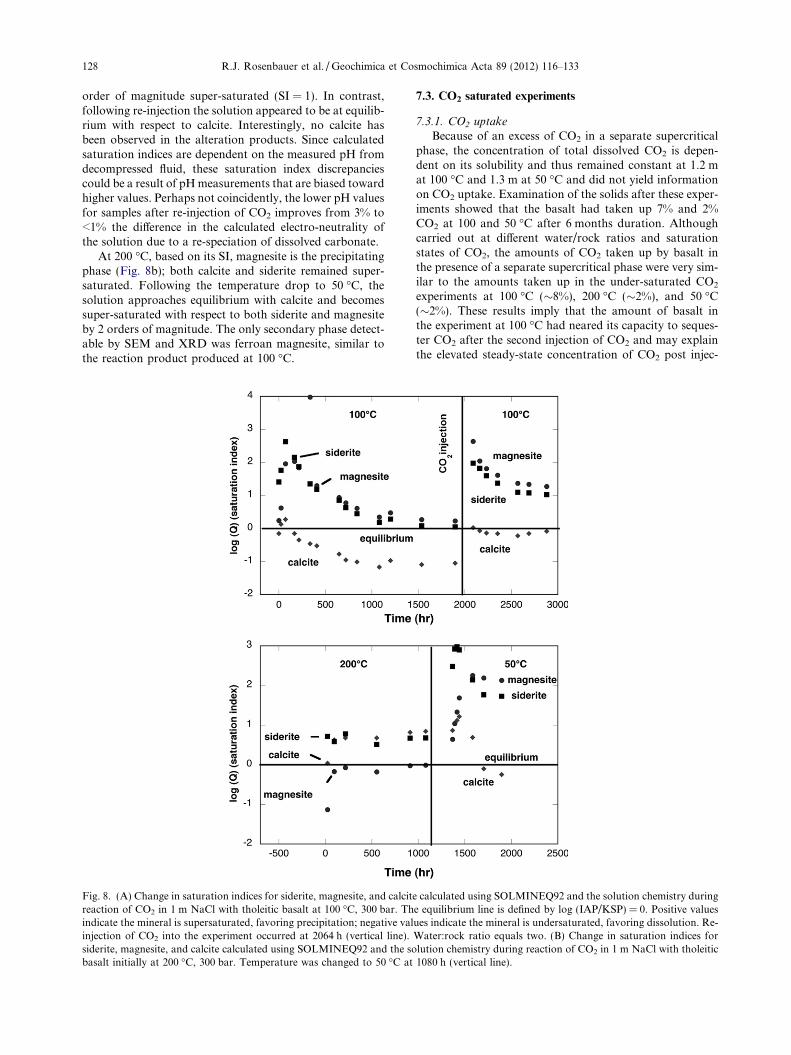
The limiting factor may however, be the amount of Mg inthe basalt. The quantity of CO2 removed from solution at100 �C in both the under-saturated and saturated experi-ments correlates well with the amount of Mg in the rock(Table 6). In the CO2 under-saturated experiment 0.12 molof CO2 were removed from solution compared with0.11 mol of Mg available in the amount of rock used inthe experiment. In the CO2 saturated experiment0.037 mol of CO2 removal compares with 0.039 mol of Mgin the amount of rock in this experiment. These results arecomparable to the Ti-vessel batch experiments wherein Las-sen tholeitic basalt took up 7.5 and 7.6% CO2, equivalent to0.030 and 0.031 mol compared to 0.031 mol of Mg in therock (Table 6). The results are also consistent with the exper-imental alteration by supercritical CO2 of olivine basalt (pi-crite) containing 0.13 mol Mg, wherein the rock took up26% CO2 equivalent to 0.11 mol (Table 6). The direct rela-tionship between carbon uptake and Mg content in eachof these experiments is depicted in Fig. 9.
7.4. Aqueous chemistry
7.4.1. Ca and Mg
The final steady-state concentrations of dissolved Ca andMg coincided almost exactly between the saturated and un-der-saturated systems, except for dissolved Mg at 50 �C, sug-gesting that both components are controlled by similaralteration phases, independent of the amount of CO2 avail-able. Ferroan magnesite but not calcite nor other new Ca-bearing phases were observed in the alteration productsfrom all experiments and likely controls dissolved Mg. Inthe absence of a discernable Ca phase, it is possible that mag-nesite contained some undetected Ca in addition to the ob-served Fe. The relatively high Mg content of the fluidsmay perhaps play a role in poisoning calcite crystal growth.
A comparison of the temporal patterns in the long-termCO2 saturated experiments for both dissolved Ca and Mg
show the trends are reversed for 50 and 100 �C and reversedfor each component at the same temperature. At 100 �C,after some initial Ca dissolution from the rock, there is adecidedly concave pattern to the evolution of the fluid(Fig. 5a) versus a convex pattern for dissolved Mg(Fig. 5b). There is a minimum in dissolved Ca occurring at�100 h coinciding with a maximum in dissolved Mg thatcould be interpreted the onset of a calcite to magnesite tran-sition. This transition coincides also with the occurrence ofsteady-state for the SI calculated for magnesite (Fig. 10a),although at a value two orders of magnitude supersaturated.But, according to the SI for calcite, this solution was mostlyunder-saturated until the final data point, indicatingequilibrium.
At 50 �C, the temporal trends are reversed: convex forCa (Fig. 6a) with a maximum at 250 h and concave forMg (Fig. 6b) with a minimum within an hour. Saturationindices for this fluid indicate that siderite remains super-sat-urated throughout, magnesite goes from under- to super-saturated, and calcite goes from under-saturated to near-saturation (Fig. 10b).
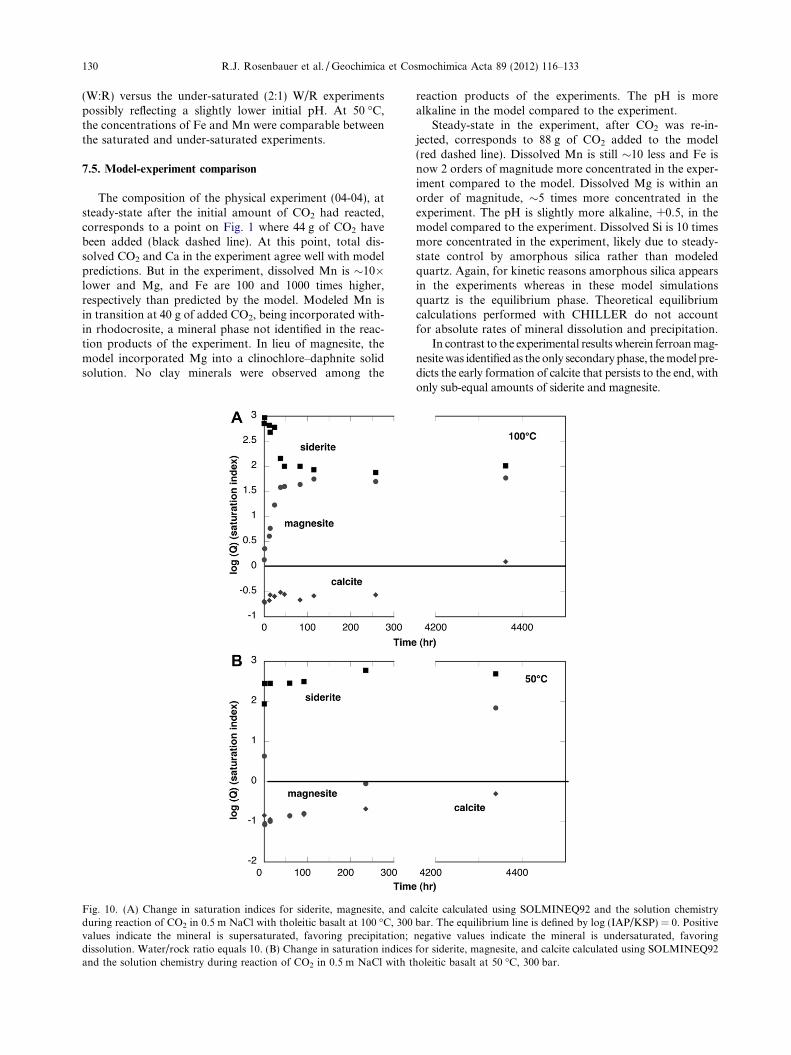
There is a clear temperature dependence to the concen-trations of dissolved Ca and Mg when basalt is reacted witha constantly CO2-saturated solution. The temporal patternsfor dissolved Ca and Mg exhibit the same reversal in shapeversus temperature for the same element as were evident be-tween elements at the same temperature (Figs. 5a, b and 6a,b), ultimately leading to higher values of Ca at higher tem-perature compared to higher values of Mg at lower temper-atures. Overall, from 50 to 200 �C, the Ca/Mg ratioincreases exponentially (Fig. 11). This phenomenon hasbeen noted elsewhere when basalt is reacted with seawaterin the absence of CO2 (Hardie, 1996). At elevated tempera-tures Mg partitions into solid phases. Even in the absenceof basaltic rocks, heated seawater precipitates magnesiumhydroxy sulfate (Bischoff and Seyfreid, 1978).
7.4.2. Fe and Mn
Substantially more (�10�) Fe and Mn were initially re-leased to solution in the CO2 saturated (10:1) water:rock
130 R.J. Rosenbauer et al. / Geochimica et Cosmochimica Acta 89 (2012) 116–133
(W:R) versus the under-saturated (2:1) W/R experimentspossibly reflecting a slightly lower initial pH. At 50 �C,the concentrations of Fe and Mn were comparable betweenthe saturated and under-saturated experiments.
7.5. Model-experiment comparison
The composition of the physical experiment (04-04), atsteady-state after the initial amount of CO2 had reacted,corresponds to a point on Fig. 1 where 44 g of CO2 havebeen added (black dashed line). At this point, total dis-solved CO2 and Ca in the experiment agree well with modelpredictions. But in the experiment, dissolved Mn is �10�lower and Mg, and Fe are 100 and 1000 times higher,respectively than predicted by the model. Modeled Mn isin transition at 40 g of added CO2, being incorporated with-in rhodocrosite, a mineral phase not identified in the reac-tion products of the experiment. In lieu of magnesite, themodel incorporated Mg into a clinochlore–daphnite solidsolution. No clay minerals were observed among the
Fig. 10. (A) Change in saturation indices for siderite, magnesite, and cduring reaction of CO2 in 0.5 m NaCl with tholeitic basalt at 100 �C, 300values indicate the mineral is supersaturated, favoring precipitation;dissolution. Water/rock ratio equals 10. (B) Change in saturation indicesand the solution chemistry during reaction of CO2 in 0.5 m NaCl with t
reaction products of the experiments. The pH is morealkaline in the model compared to the experiment.
Steady-state in the experiment, after CO2 was re-in-jected, corresponds to 88 g of CO2 added to the model(red dashed line). Dissolved Mn is still �10 less and Fe isnow 2 orders of magnitude more concentrated in the exper-iment compared to the model. Dissolved Mg is within anorder of magnitude, �5 times more concentrated in theexperiment. The pH is slightly more alkaline, +0.5, in themodel compared to the experiment. Dissolved Si is 10 timesmore concentrated in the experiment, likely due to steady-state control by amorphous silica rather than modeledquartz. Again, for kinetic reasons amorphous silica appearsin the experiments whereas in these model simulationsquartz is the equilibrium phase. Theoretical equilibriumcalculations performed with CHILLER do not accountfor absolute rates of mineral dissolution and precipitation.
In contrast to the experimental results wherein ferroan mag-nesite was identified as the only secondary phase, the model pre-dicts the early formation of calcite that persists to the end, withonly sub-equal amounts of siderite and magnesite.
alcite calculated using SOLMINEQ92 and the solution chemistrybar. The equilibrium line is defined by log (IAP/KSP) = 0. Positivenegative values indicate the mineral is undersaturated, favoringfor siderite, magnesite, and calcite calculated using SOLMINEQ92
holeitic basalt at 50 �C, 300 bar.
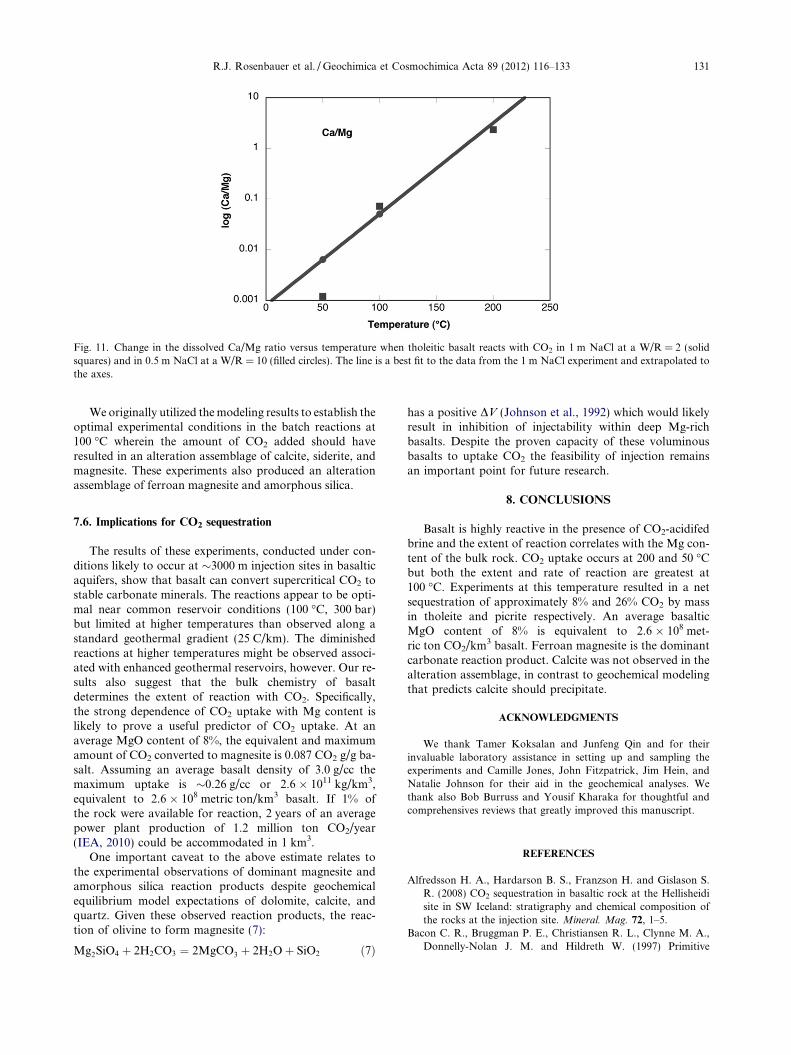
Fig. 11. Change in the dissolved Ca/Mg ratio versus temperature when tholeitic basalt reacts with CO2 in 1 m NaCl at a W/R = 2 (solidsquares) and in 0.5 m NaCl at a W/R = 10 (filled circles). The line is a best fit to the data from the 1 m NaCl experiment and extrapolated tothe axes.
R.J. Rosenbauer et al. / Geochimica et Cosmochimica Acta 89 (2012) 116–133 131
We originally utilized the modeling results to establish theoptimal experimental conditions in the batch reactions at100 �C wherein the amount of CO2 added should haveresulted in an alteration assemblage of calcite, siderite, andmagnesite. These experiments also produced an alterationassemblage of ferroan magnesite and amorphous silica.
7.6. Implications for CO2 sequestration
The results of these experiments, conducted under con-ditions likely to occur at �3000 m injection sites in basalticaquifers, show that basalt can convert supercritical CO2 tostable carbonate minerals. The reactions appear to be opti-mal near common reservoir conditions (100 �C, 300 bar)but limited at higher temperatures than observed along astandard geothermal gradient (25 C/km). The diminishedreactions at higher temperatures might be observed associ-ated with enhanced geothermal reservoirs, however. Our re-sults also suggest that the bulk chemistry of basaltdetermines the extent of reaction with CO2. Specifically,the strong dependence of CO2 uptake with Mg content islikely to prove a useful predictor of CO2 uptake. At anaverage MgO content of 8%, the equivalent and maximumamount of CO2 converted to magnesite is 0.087 CO2 g/g ba-salt. Assuming an average basalt density of 3.0 g/cc themaximum uptake is �0.26 g/cc or 2.6 � 1011 kg/km3,equivalent to 2.6 � 108 metric ton/km3 basalt. If 1% ofthe rock were available for reaction, 2 years of an averagepower plant production of 1.2 million ton CO2/year(IEA, 2010) could be accommodated in 1 km3.
One important caveat to the above estimate relates tothe experimental observations of dominant magnesite andamorphous silica reaction products despite geochemicalequilibrium model expectations of dolomite, calcite, andquartz. Given these observed reaction products, the reac-tion of olivine to form magnesite (7):
Mg2SiO4 þ 2H2CO3 ¼ 2MgCO3 þ 2H2Oþ SiO2 ð7Þ
has a positive DV (Johnson et al., 1992) which would likelyresult in inhibition of injectability within deep Mg-richbasalts. Despite the proven capacity of these voluminousbasalts to uptake CO2 the feasibility of injection remainsan important point for future research.
8. CONCLUSIONS
Basalt is highly reactive in the presence of CO2-acidifedbrine and the extent of reaction correlates with the Mg con-tent of the bulk rock. CO2 uptake occurs at 200 and 50 �Cbut both the extent and rate of reaction are greatest at100 �C. Experiments at this temperature resulted in a netsequestration of approximately 8% and 26% CO2 by massin tholeite and picrite respectively. An average basalticMgO content of 8% is equivalent to 2.6 � 108 met-ric ton CO2/km3 basalt. Ferroan magnesite is the dominantcarbonate reaction product. Calcite was not observed in thealteration assemblage, in contrast to geochemical modelingthat predicts calcite should precipitate.
ACKNOWLEDGMENTS
We thank Tamer Koksalan and Junfeng Qin and for theirinvaluable laboratory assistance in setting up and sampling theexperiments and Camille Jones, John Fitzpatrick, Jim Hein, andNatalie Johnson for their aid in the geochemical analyses. Wethank also Bob Burruss and Yousif Kharaka for thoughtful andcomprehensives reviews that greatly improved this manuscript.
REFERENCES
Alfredsson H. A., Hardarson B. S., Franzson H. and Gislason S.R. (2008) CO2 sequestration in basaltic rock at the Hellisheidisite in SW Iceland: stratigraphy and chemical composition ofthe rocks at the injection site. Mineral. Mag. 72, 1–5.
Bacon C. R., Bruggman P. E., Christiansen R. L., Clynne M. A.,Donnelly-Nolan J. M. and Hildreth W. (1997) Primitive
132 R.J. Rosenbauer et al. / Geochimica et Cosmochimica Acta 89 (2012) 116–133
magmas at five cascade volcanic fields: melts from hot,heterogeneous sub-arc mantle. Can. Mineral. 35, 397–423.
Bearat H., McKelvy M. J., Chizmeshya A. V. G., Gormley D.,Nunez R., Carpenter R. W., Squires K. and Wolf G. H. (2006)Carbon sequestration via aqueous olivine mineral carbonation:role of passivating layer formation. Environ. Sci. Technol. 40,
4802–4808.
Bischoff J. L. and Seyfreid W. E. (1978) Hydrothermal chemistry ofseawater from 25 �C to 350 �C. Am. J. Sci. 278, 838–860.
Bischoff J. L. and Rosenbauer R. J. (1996) The alteration ofrhyolite in CO2 charged water at 200 and 350 degrees C: theunreactivity of CO2 at higher temperature. Geochim. Cosmo-
chim. Acta 60, 3859–3867.
Clynne M. A. and Muffler L. J. P. (2010) Geologic map of Lassen
Volcanic National Park and vicinity, California. U.S. GeologicalSurvey Scientific Investigations Map I-2899, Scale 1:50,000.
Clynne M. A., Muffler L. J. P., Siems D. F., Taggart, Jr. J. E. andBruggman P. (2008). Major and EDXRF trace element chemical
analyses of volcanic rocks from Lassen Volcanic National Park
and vicinity, California. USGS Open-File, Report 2008-1091.Dixon J. E., Clague D. A. and Eissen J. P. (1986) Gabbroic
xenoliths and host ferrobasalt from the Southern Juan de Fucaridge. J. Geophys. Res. Solid Earth Planets 91, 3795–3820.
Duan Z. and Sun R. (2003) An improved model calculating CO2
solubility in pure water and aqueous NaCl solutions from 273to 533 K and from 0 to 2000 bar. Chem. Geol. 193, 257–271.
Gerdemann S. J., O’Connor W. K., Dahlin D. C., Penner L. R. andRush H. (2007) Ex situ aqueous mineral carbonation. Environ.
Sci. Technol. 41, 2587–2593.
Giammar D. E., Bruant R. G. and Peters C. A. (2005) Forsteritedissolution and magnesite precipitation at conditions relevantfor deep saline aquifer storage and sequestration for carbondioxide. Chem. Geol. 217, 257–276.
Gislason S. R., Broecker W. S., Oelkers E. H., Gunnlaugsson E.,Sigurdardottir H., Stefansson A., Wolff-Boenisch D., Matter J.,Stute M. and Axelsson G. (2009) The carbfix project: mineralCO2 sequestration into basalt. Geochim. Cosmochim. Acta 73,
A440.
Goldberg D. S., Takahashi T. and Slagle A. L. (2008) Carbondioxide sequestration in deep-sea basalt. Proc. Natl. Acad. Sci.
USA 105, 9920–9925.
Goldberg D. S., Kent D. V. and Olson P. E. (2009) Potential on-shore and off-shore reservoirs for CO2 sequestration in centralAtlantic magmatic province basalts. Proc. Natl. Acad. Sci. USA
107(4), 1327–1332.
Grove T. L., Parman S. W., Bowring S. A., Price R. C. and BakerM. B. (2002) The role of an H2O-rich fluid component in thegeneration of primitive basaltic andesites and andesites fromthe Mt. Shasta region, N California. Contrib. Miner. Petrol.
142, 375–396.
Gysi A. P. and Stefansson A. (2008) Numerical modeling of CO2–water–basalt interaction. Mineral. Mag. 72, 55–59.
Gysi A. P. and Stefansson A. (2009) CO2–water–basalt interaction:geochemical modeling and experiments. Geochim. Cosmochim.
Acta 73, A483.
Hardie L. A. (1996) Secular variation in seawater chemistry: anexplanation for the coupled secular variation in the mineralo-gies of marine limestones and potash evaporites over the past600 my. Geology 24, 279–283.
Holland T. J. B. and Powell R. (1998) An internally consistentthermodynamic data set for phases of petrological interest. J.
Metamorph. Geol. 16, 309–343.
IEA (2010) CO2 emissions from fuel combustion. IEA Publication,ISBN: 978-92-64-08027-8.
IPCC (2007) Climate Change 2007, the Fourth Assessment Report
(AR4). UN Environment Program, Geneva.
Janecky D. R. and Seyfreid W. E. (1983) Solubility of magnesiumhydroxysulfate hydrate at elevated temperature and pressure.Am. J. Sci. 283, 831–880.
Johnson J. W., Oelkers E. H. and Helgeson H. C. (1992) Supcrt92 –a software package for calculating the standard molal thermo-dynamic properties of minerals, gases, aqueous species, andreactions from 1-bar to 5000-bar and 0-degrees-C to 1000-degrees-C. Comput. Geosci. 18, 899–947.
Jones L. C., Rosenbauer R., Goldsmith J. I. and Oze C. (2010)Carbonate control of H2 and CH4 production in serpentiniza-tion systems at elevated P–Ts. Geophys. Res. Lett. 37(37),
L14306. http://dx.doi.org/10.1029/2010GL043769.
Kharaka Y. K., Gunter W. D., Aggarwal P. K., Perkins E. H. andDeBraal J. D. (1988) Solmineq.88 a computer program for
geochemical modeling of water–rock interactions. U.S. Geolog-ical Survey water resources investigations report 88-4227.
Matter J., Takahashi T. and Goldberg D. (2007) Experimentalevaluation of in situ CO2–water–rock reactions during CO2
injection in basaltic rocks: implications for geological CO2
sequestration. Geochem. Geophys. Geosyst. 8. http://dx.doi.org/
10.1029/2006GC001427.
McGrail B. P., Schaef H. T., Ho A. M., Chien Y. J., Dooley J. J.and Davidson C. L. (2006) Potential for carbon dioxidesequestration in flood basalts. J. Geophys. Res. Solid Earth
111, 1–13 (B12): Art. No. B12201, 1–13.
McGrail B. P., Schaef H. T., Glezakou V. A., Dang L. X. andOwen A. T. (2009) Water reactivity in the liquid and supercrit-ical CO2 phase: has half the story been neglected? Energy
Procedia 1, 3415–3419.
Mertzman S. A. (1977) The petrology and geochemistry of themedicine lake volcano. Contrib. Miner. Petrol. 62(3), 221–247.
Moore J. G. and Clague D. A. (1992) Volcano growth andevolution of the island of Hawaii. GSA Bull. 104, 1471–1484.
Oelkers E., Gislason S. R. and Matter J. (2008) Mineral carbon-ation of CO2. Elements 4, 333–337.
Palandri J. L. and Reed M. H. (2004) Geochemical models ofmetasomatism in ultramafic systems: serpentinization, roding-itization, and sea floor carbonate chimney precipitation. Geo-
chim. Cosmochim. Acta 68, 1115–1133.
Prasad P. S. R., Sarma D. S., Sudhakar L., Basavaraju U., SinghR. S., Begum Z., Archana K. B., Chavan C. D. and Charan S.N. (2009) Geological sequestration of carbon dioxide in Deccanbasalts: preliminary laboratory study. Curr. Sci. 96, 288–291.
Pruess K. (2006) Enhanced geothermal systems (egs) using CO2 asworking fluid – a novel approach for generating renewableenergy with simultaneous sequestration of carbon. Geothermics
35, 351–367.
Reed M. H. (1982) Calculation of multicomponent chemicalequilibria and reaction processes in systems involving minerals,gases and an aqueous phase. Geochim. Cosmochim. Acta 46(4),
513–528.
Rosenbauer R. J., Bischoff J. L. and Radtake A. S. (1983)Hydrothermal alteration of graywacke and basalt by 4 molalNaCl. Econ. Geol. 78, 1701–1710.
Rosenbauer R. J., Bischoff J. L. and Potter J. M. (1993) A flexibleAu–Ir cell with quick assembly for hydrothermal experiments.Am. Mineral. 78, 1286–1289.
Rosenbauer R. J., Koksalan T. and Palandri J. L. (2005)Experimental investigation of CO2–brine–rock interactions atelevated temperature and pressure: implications for CO2
sequestration in deep-saline aquifers. Fuel Process. Technol.
86, 1581–1597.
Sabirzyanov A. N., Shagiakhmetov R. A., Gabitov F. R.,Tarzimanov A. A. and Gumerov F. M. (2003) Water solubilityof carbon dioxide under supercritical and subcritical conditions.Theor. Found. Chem. Eng. 37, 51–53.
R.J. Rosenbauer et al. / Geochimica et Cosmochimica Acta 89 (2012) 116–133 133
Schaef H. T. and Mcgrail B. P. (2009) Dissolution of ColumbiaRiver basalt under mildly acidic conditions as a function oftemperature: experimental results relevant to the geologicalsequestration of carbon dioxide. Appl. Geochem. 24, 980–987.
Schaef H. T., Mcgrail B. P. and Owen A. T. (2010) Carbonatemineralization of volcanic province basalts. Int. J. Greenhouse
Gas Control 4, 249–261.
Seifritz W. (1990) CO2 disposal by means of silicates. Nature 345,
486.
Seyfreid W. E. and Bischoff J. L. (1979) Low temperature basaltalteration by seawater: an experimental study at 70 �C adn150c. Geochim. Cosmochim. Acta 43, 1937–1947.
Shikazono N., Harada H., Ikeda N. and Kashiwagi H. (2009)Dissolution of basaltic rocks and its application to under-
ground sequestration of CO2 – estimate of mineral trapping bydissolution–precipitation simulation. Jpn. Mag. Mineral. Pet-
rol. Sci. 38, 149–160.
Spycher N., Pruess K. and Ennis-King J. (2003) CO2–H2Omixtures in the geological sequestration of CO2. I. Assessmentand calculation of mutual solubilities from 12 to 100 degrees Cand up to 600 bar. Geochim. Cosmochim. Acta 67, 3015–3031.
Toews K. L. and Shroll R. M., et al. (1995) pH-definingequilibrium between water and supercritical CO2. Influenceon SFE of organics and metal chelates. Anal. Chem. 67, 4040–
4043.
Associate editor: Jeffrey C. Alt