Embed Size (px)
Citation preview

Carbon sequestration in China’s ecosystems, 1981-2000
Jingyun FangDepartment of Ecology
Peking University
Feb. 14, 2008

IPCC (2007) : Most of the observed increase in global temperatures since the mid-20th century is very likely due to the observed increase in anthropogenic greenhouse gas concentrations.
CO2 is one of the most important greenhouse gases. Terrestrial ecosystems can provide significant sinks for the atmospheric CO2 through removal of CO2 by plant production.
“Carbon sink” or “Carbon sequestration” refers to a net carbon gain of an ecosystem.
Since the 1960s, both CO2 and temp. increased significantly at a similar.
Relationship between air CO2 concentration and temperature increase

Industrial emissions in China and its contribution to global total emissions
ratio
emission
In 2005, ca. 17% of global emissions from China

Objectives of this study:
-- to examine how much carbon can be sequestrated by China’s terrestrial ecosystems between 1981-2000, using three independent approaches, e.g. inventory data/statistics, process modeling, and atmospheric inversion.

(1) Inventory-based estimation forest, grassland, shrubs, crops, and soils(2) Carbon process models ● HyLand model (Levy et al., 2004) ● LPJ model (Sitch et al. 2003) ● ORCHIDEE model (Krinner et al. 2005) ● Sheffield model (Woodward & Lomas, 2004) ● TRIFFID model, Cox, 2001)
(3) Atmospheric inversionsSpatial and temporal gradients in atmospheric CO2
measured on the global network can be inverted into regional carbon fluxes, using transport models.
1. Methods

2. Data sets
(1) Forest inventories (1977-2003)
(2) Grassland biomass inventory data
(3) Statistic census of crops
(4) Soil survey and soil samplings
(5) NDVI datasets (1982-2003 NOAA/AVHRR)
(6) Climate data
(7) Other geo-information (maps, DEM…)

China’s forest biomass C stocks in the past 20 yrs
Fang et al. 2007
3. Major results
● Forest
(1) Inventory-based estimation

Distribution of C sink/source
(b)
0.3 1.5
12.6
42.1
22.3
12.8
5.62.0 0.5 0.20.1
0
10
20
30
40
50
<-1
5
-15
--1
0
-10
--5
-5-0
0-5
5-1
0
10
-15
15
-20
20
-25
25
-30
30
-40
Difference in C density (g C/m2 )
Per
cen
tag
e in
are
a (%
)
Piao et al. 2007
● grassland
C sink:0.08 Pg C

Carbon sink per area for shrubs:
0.134 tC/ha.yr
Relationship between NPP and C sinks for major vegetation types in China
243.0)(0026.0)(100.4 26 NPPNPPy
Fang et al. 2007
● shrubs

C density change trend
● cropland
Neutral crop carbon sink: We supposed that the crop biomass carbon sink was neutral, because most of it would return to atmosphere through decomposition and combustion in a short time. So, the data estimated in this study have not been used for the accounting of China’s carbon sinks.
trend of biomass C stocks
Changes in total crop biomass
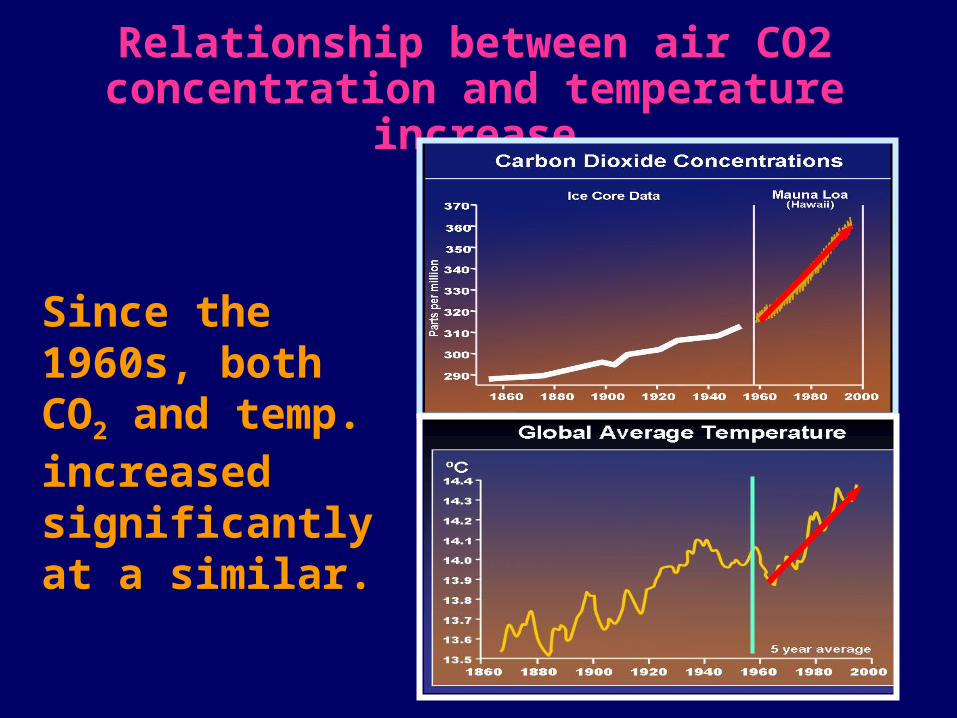
(2) Soil carbon change
Yang et al. Biogeochem. 2007
Change in soil C density in China

(3) model-based estimates
Overall mean
● HyLand model, ● LPJ model, ● ORCHIDEE model● Sheffield model, ● TRIFFID model
A range of C sink estimates among 5 models, but a well consistent overall average of 170-180 TgC/yr

Eecosystem C sinks in China, using different approaches
Different approaches generate a quite consistent estimate of 173-228 TgC/yr. Total ecosystem C sink over the 20 yrs: 3.5-4.6 Pg C
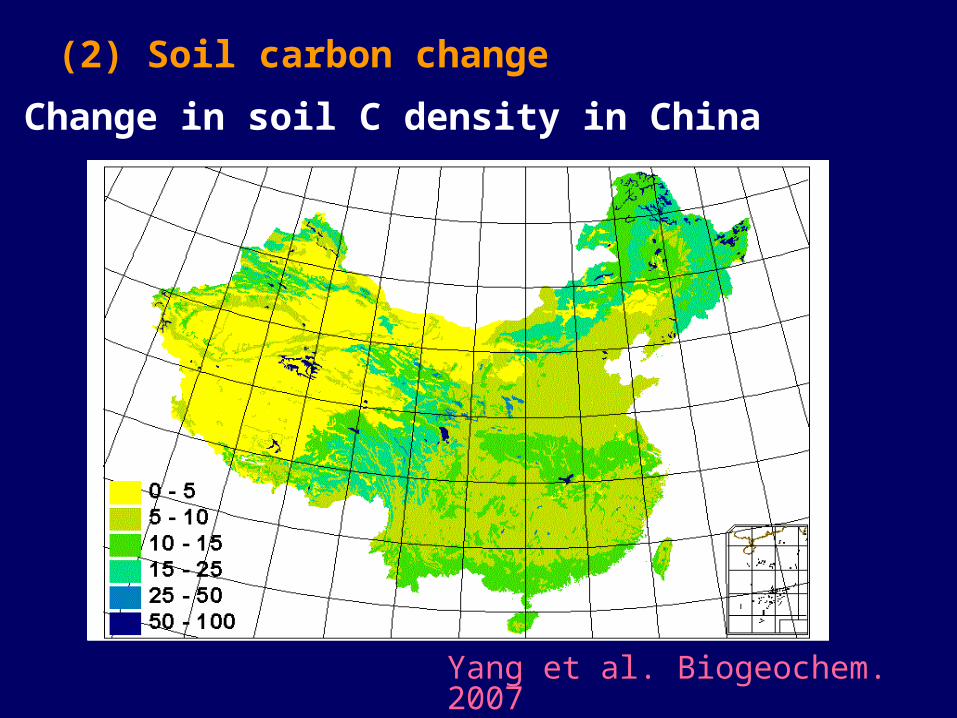
how many industrial emissions can be offset by ecosystems in China ? 26-34%
Over the year of 1981 - 2000:
● total C emitted from fossil fuel combustion: 13.2 Pg C● ecosystem absorption:
3.5-4.6 Pg C
or, 26-34 % of total industrial
emission Annual C by industrial emission, 1981 - 2003

● large-scale reforestation● changes of energy consumption structure and vegetation recovery● intensive agriculture practices● regional climate changes
(5) Why a large C sequestration?

(i) Reforestation and afforestation
% of total global plantation area
Countries with the largest proportion of the world’s forest plantations, 2000
▲
FAO (2001)
China is the largest country with planted forests, about 1/5 of total global plantations (FAO, 2001)
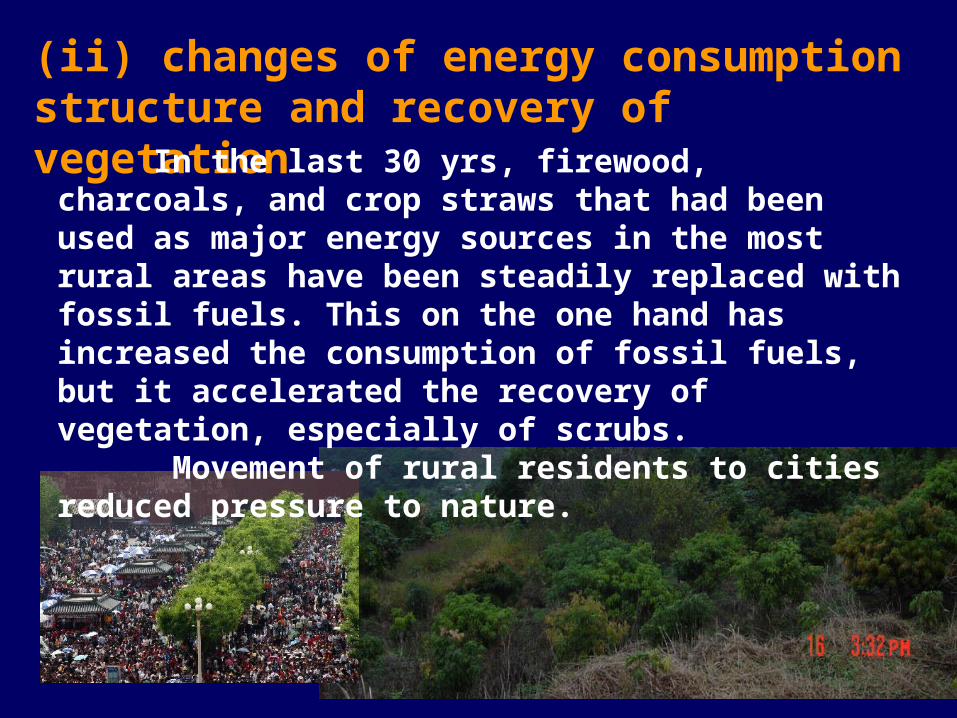
(ii) changes of energy consumption structure and recovery of vegetation
In the last 30 yrs, firewood, charcoals, and crop straws that had been used as major energy sources in the most rural areas have been steadily replaced with fossil fuels. This on the one hand has increased the consumption of fossil fuels, but it accelerated the recovery of vegetation, especially of scrubs. Movement of rural residents to cities reduced pressure to nature.

(iii) intensive agriculture practices
expansion of straw incorporation, shallow plowing, irrigation, and no-till farming have increased C sequestration in agricultural soils.

Inter-annual changes in seasonal precipitation
Summer
Autumn
Spring
(iv) regional climate changes
Despite no significant change in annual rainfall, summer precipitation in China has significantly increased by 2.5 mm each year
● Three independent approaches produce a consistent estimate of national net C sink of 0.17-23 Pg yr-1, which is about 26-34% of China’s cumulated fossil emissions over the study period.
● This large C sink is caused by afforestation, shrubland recovery, change in agricultural practices, and the effect of climate change.
4. Summary

AcknowledgementAcknowledgement
The studies have been supported by The studies have been supported by
NSFCNSFC ( (39425003, 40024101, 39830050, 39425003, 40024101, 39830050,
39970044, 49971002, 39970044, 49971002, and 30000024), and 30000024),
China Ministry of EducationChina Ministry of Education (# (# 9900199001), ),
China Ministry of Science & TechnologyChina Ministry of Science & Technology
((G2000046801, G2000046801, 85-913-01-0285-913-01-02), and ), and
Peking UniversityPeking University..

Thank you!