Embed Size (px)
Citation preview
Carbon Management Plan (2016 – 2025)
Reporting Committee: Sustainability Steering Group Produced and Monitored by: Estates and Campus Services Document Revision Control Rev Author Verification by Date Comment/Status A Chrispal Anand Sandra Lee 03/17 Final

2 | P a g e
Executive Summary This Carbon Management Plan demonstrates the University of Leicester’s continued commitment towards reducing carbon emissions impact against its 2004/05 baseline. By taking actions as set out in the Carbon Management Action Plan, the University continues in its aim to reduce emissions from its activities. The carbon target is specifically for Scope 1 and 2 carbon emissions. The University continues to develop its Scope 3 baseline and targets. The University’s Scope 1 & 2 carbon emission performance against 2004/05 is shown in Figure 1.
Figure 1 : Scope 1 and 2 Carbon Emissions Performance
The University’s carbon reduction strategy is based on the following strategic themes:
Figure 2: Carbon Reduction Strategy for the University of Leicester
13,102
8,071 6,904
21,171
25,401
19,828
0
5,000
10,000
15,000
20,000
25,000
30,000
2004/05 2012/13 2015/16
Tonn
es o
f CO
2
Scope1 - Gas, Oil and Vehicle Fuel Scope2 - Electricity, Steam and Hot Water
REDUCE
EFFICIENCY
DECARBONISE/BEFRIEND
NEUTRALISE

3 | P a g e
The University recognises that there is no one single solution to achieve carbon reduction based on the University’s business operations. Figure 3 identifies a mixture of opportunities for emissions reduction and utility cost savings. The Carbon Management Action Plan will identify the carbon saving projects and this plan will be reviewed and reported periodically in order to demonstrate continuous improvements on emissions reduction.
Figure 3: Carbon Reduction Opportunities at the University of Leicester
Electricity, gas, heat, steam, diesel, water, etc. at the University are generally consumed in electrical and mechanical plant rooms, research, teaching & support activities, student accommodation and leisure and recreation. Therefore, the responsibility of carbon emissions reduction at the University lies with all stakeholders. The Carbon Management Teams identified in Section 10 will work with the stakeholders to identify emissions reduction opportunities within unregulated energy controlled by building users such as scientific lab equipment, PC and peripherals. Estates & Campus Services will
Improve OperationEfficiency
Building Energy Management System & Improved Controls
Building Energy
Efficiency Retrofits
Monitoring Targeting Reporting
Low Carbon Procurement Water
Control Measures
De-carbonisatio
n of Electricity
Grid
Low Energy
consuming Design
Carbon-Space Management EfficiencyGreener Fleet
Upgrade of Building
Stock
Green ICT Behaviour Change
Low Zero Carbon
Technology Expansion
Biodiversity (trees) Carbon
Offsetting
Reduce to Landfill
Alternative Travel
Smarter Working

4 | P a g e
mainly focus on regulated energy i.e. that which is under Estates & Campus Services control through building operational and infrastructural, such as heating, ventilation, lighting, building façade and fabric, etc. The University has committed approximately £205K using Revolving Green Funds each year to re-invest in buildings energy efficiency projects. The Capital Plan will upgrade 15% of the building stock that contributes 7% of the current carbon footprint. Any other funds required will be based on a business case approach. The University will continue to explore local and national partnership working to implement large and medium scale low or zero carbon projects. Teams have been identified to help manage and implement the action plan. The Carbon Management Teams mainly sit within the Estates & Campus Services Division & the Division of External Relations and provide regular reports to the Sustainability Steering Group, which informs and advises the University Leadership Team and University Executive Board on Sustainability matters.
5 | P a g e
Table of Contents
Executive Summary 2 Acronyms and Abbreviations 7 1. Introduction 8 2. Carbon Management Reduction Context and drivers 8 3. Carbon Emissions Baseline and Projections 11
3.1 Classifying Carbon Emissions 11 3.2 Emission Baseline and Recent Trends 11
4. Carbon Management Targets 13
4.1 Scope 1 & 2 Targets 13 4.2 Scope 3 Targets 13
5. Carbon Management Vision and Strategy 14
5.1 Low Carbon Vision 14 5.2 Carbon Reduction Hierarchy 14 5.3 Carbon Reduction Strategy 15
REDUCE 15 EFFICIENCY 16 DECARBONISE 16 BEFRIEND 16 NEUTRALISE 17
6. Carbon Management Action Plan 17 7. Monitoring, Reporting and Assessment 17
7.1 Monitoring 17 7.2 Reporting 17 7.3 External Verification of Emissions Data and Estimates 18 7.4 Demonstrate Continuous Improvement 18
8. Carbon Management Plan financing 18
8.1 Internal Funding 18 8.2 External Funding 19
9. Stakeholder Management and Communication 19
9.1 Stakeholder management 19
10. Carbon Management Ownership and Management 20
10.1 Main roles and responsibilities 20 10.2 Project Team 20
Sustainability Steering Group 20 Positive Impact Network Coordinators 20 Carbon Management Team 21 Day-to-Day Carbon Management Team 21 Wider Supporting Team 22
10.3 Expected Constraints 22
Maintaining Support 22 Time Management 22 Possible Risk 22

6 | P a g e
10.4 Reporting and evaluation 22
Procedures for reviewing performance 22 Procedures for updating plans and targets 23 Procedures for reporting achievements 23
Appendix 25
Appendix 1 – University of Leicester Estate 25 Appendix 3 - Lessons Learnt from Previous Carbon Management Plan 28 Appendix 4 – Further Information on the University of Leicester’s Carbon Emissions 29 Appendix 5 – Further Information on Emission Baseline and Trends 32 Appendix 6 – Information on Scope 3 Data Collection 34 Appendix 7 – Regulated and Unregulated Energy Loads in Buildings 36 Appendix 8 – Carbon Management Supporting Policies and Procedures 36 Appendix 9 – Summary of the Carbon Emissions Reduction Plan 37
7 | P a g e
Acronyms and Abbreviations
AMR Automated Meter Reading ARD Annual Return Database AUDE Association of University Director of Estates BAU Business as Usual BEMS Building Energy Management System BMS Building Management System BREEAM Building Research Establishment Environmental Assessment Method CHP Combined Heat and Power CIF Capital Investment Fund CMP Carbon Management Plan CO2 Carbon dioxide CRCEES Carbon Reduction Commitment Energy Efficiency Scheme DEC Display Energy Certificate EMR Estates Management Reporting EISC Estates and Infrastructure Strategy Committee EPC Energy Performance Certificate ESS Environmental Sustainability Strategy FOI Freedom of Information GHG Greenhouse Gas GIA Gross Internal Area HECM Higher Education Carbon Management Programme HEFCE Higher Education Funding Council for England HEI Higher Education Institution HESA Higher Education Statistics Authority ICT Information and Communication Technology KgCO2 Kilogram of Carbon dioxide KgCO2e Kilogram of Carbon dioxide equivalent kWh Kilowatt-hour LZC PIN
Low or Zero Carbon Positive Impact Network
P&P People & Planet RGF Revolving Green Fund SEED Sustainable Environment Enterprise Development Suste IT Sustainable IT in Tertiary Education SSG SSWG
Sustainability Steering Group Sustainability Student Working Group
ULT University Leadership Team
8 | P a g e
1. Introduction The University of Leicester is a leading UK University committed to international excellence through the creation of world changing research and high quality, inspirational teaching. To support this, the University has an extensive estate within the City of Leicester, Oadby and Glenfield comprising of five main sites, 291 buildings occupying an area of 337,321 m2 and 95 hectares of grounds. The area is split between non-residential and residential; it is roughly a 2:1 ratio, with the Central Campus dominating the former and Oadby the latter. A full schematic of the estate is included in Appendix 1. The University employs 3,605 substantive staff and a further 4,659 ‘atypical’ staff (2016/17) with 20,150 (2016/17) registered students (30% online). In order to support the HE sector to reduce its carbon emissions, one of the objectives of the Higher Education Funding Council for England’s (HEFCE) Sustainable Development Strategy and Action Plan is “to facilitate a carbon reduction culture to significantly reduce carbon emissions across the sector”1. HEFCE has set sector carbon reduction targets for the sector of 34% by 2020 and 80% by 2050 against 1990 levels in order to comply with UK government targets.
Leicester developed its first Carbon Management Plan (CMP) through the Carbon Trust’s Higher Education Carbon Management Programme (HECM) in 2006/07. Appendix 2 depicts the carbon management status at Leicester before the existing CMP was written (2007) and the levels of performance since the CMP’s implementation. The success of the previous CMP is listed in Appendix 2. A graphical form of the carbon emissions trend of the University since 2004/05 (baseline year) is also shown in Appendix 2. There have been various developments nationally, locally and within the University over climate change that were not reflected in the first CMP. This Carbon Management Plan was shaped by reflecting on the implementation of the 2006/07 CMP and has incorporated lessons learnt from that process (see Appendix 3). To achieve the carbon targets, the University’s carbon reduction road map includes challenges as varied as behaviour change, energy efficiency in buildings, integration of large scale low or zero carbon (LZC) technologies, monitoring and measuring scope 3 emissions, etc.
2. Carbon Management Reduction Context and drivers There are a number of drivers for the Carbon Management Strategy and Plan: The 2020 Carbon Emissions Reduction Targets: The University of Leicester is endeavouring to achieve an absolute carbon emissions reduction (for Scope 1 and 2) by 2020 against its 2004/05 carbon footprint baseline. Recent DEFRA’s revised emission factors for electricity has instigated correction to all historic emissions for electricity. The University is a place of learning and has an innovative vision for its future and for this to happen it would need to expand its physical space. To provide top class research and teaching facilities, the Estate Strategy has identified a price tag of £400M up to 2022/23. A proportion of this investment will assist in improving the fabric and services of existing buildings, thereby reducing carbon emissions. However, the remaining proportion of this investment will contribute to an increase in the University’s carbon footprint.
1 Sustainable development in higher education: 2008 update to strategic statement and action plan – February 2009/03

9 | P a g e
Taking into account the University’s growth, implementation of the 10 year capital plan and current annual financial commitment for energy efficiency projects, the University’s absolute emissions targets is 25% by 2020 and against its 2004/05 base year. As the University activities are linked to use of buildings, income from research and teaching and number of staff & students, it is important to measure carbon emissions impact against Gross Internal Area (GIA), turn over and Full Time Equivalent (FTE) staff & student. The University’s relative emissions target for 2020 is 60% for TCO2/£ and 40% for TCO2/FTE and GIA against its 2004/05 base year. Further information on the absolute carbon emission target can be found in Appendix 3. University’s Commitment to Build Energy Efficient Buildings: Estates & Campus Services has adopted the principle of striving to achieve Energy Performance Certificate (EPC) ratings of ‘A’ for new builds and ‘B’ for building refurbishments, Building Research Establishment Environmental Assessment Method (BREEAM) ‘Very Good’ aspiring to ‘Excellent’ for new builds and ‘Good’ aspiring to ‘Very Good’ for refurbishments and incorporate Passivhaus designs wherever possible2. Energy User Loads: Energy loads in buildings is generally split between user loads and essential energy loads required to keep a building in operation. Estates and Campus Services do not have any influence over the energy user loads, as this is largely related to the academic, teaching and support activities. The user loads varies dependant on the type of activities taking place in buildings. Whilst Estates continue to improve on the essential energy, the building Users will also need to take responsibility towards minimising energy use in buildings. The bar chart below shows the user loads in sample buildings on the University’s estate and potential opportunity for improvement in user loads through behavioural change programmes and upgrade of technologies and procedures.
Figure 4: Regulated and Unregulated Loads in Buildings
Legislation: The University is required to produce Display Energy Certification (DEC) labelling with an energy rating of “A” to “G” for all buildings over 250sq. m. Other energy legislation has been introduced including Energy Performance Certificates (EPC) and Air-Conditioning Inspection Certificates. Two cap and trade carbon emissions schemes were introduced in 2005 and 2010.3 Due to the scale of the University’s emissions it is a full participant in the CRCEES scheme. More recent legislation which the University may be affected by in the future includes greenhouse gas reporting, Heat and Billing Regulation, ESOS and the EU Energy Efficiency Directive.
2 See University of Leicester M&E Design Guide and Sustainable Construction Principles 3 Carbon Reduction Commitment Energy Efficiency Scheme (CRCEES)
26%
41%
56%
67%
74%
59%
44%
33%
0% 10% 20% 30% 40% 50% 60% 70% 80% 90% 100%
Charles Wilson
Adrian
George Porter
Ken Edwards
Regulated Electricity Loads Unregulated (User) Electricity Loads

10 | P a g e
Fuel Prices: Since 2006/07, the University’s fuel cost has risen by 30 - 40% and this trend is expected to continue. However, by combining energy efficiency, low and zero carbon technologies and building/refurbished existing buildings, the University can mitigate some of the increase in energy prices and manage the budgetary impact of the volatile energy market. Reputation: Since 2007 People & Planet (P&P) - the UK’s largest student network to protect the environment - have been ranking UK universities based on their environmental performance in the ‘People & Planet Green League’. This league table is now printed in the Guardian newspaper annually and draws attention to the relative sustainability performance of HEIs; carbon management and reduction were worth 22% of the total score in 2016. Reducing carbon will improve the university’s reputation under this scheme. It should be noted the University achieved 1st in P&P during 2016 and now this needs to be maintained. AUDE has set up its own sustainability approach due to concerns regarding P&P criteria (such as type of VC’s car). UoL will make use of the AUDE Green Scorecard metric to monitor its sustainability performance against the sector benchmarks set by AUDE. Energy Cost: The University would see substantial financial savings by achieving carbon reduction targets. Figure 5 show energy costs since 2004/05 (the University’s carbon reduction baseline year).
Figure 5: Total Energy Cost for the University of Leicester
HEFCE Capital Funding and Carbon Reduction Performance: Within higher education, in January 2010, HEFCE published a good practice guide for the development of carbon management strategies and plans. This guide indicates that the University’s future HEFCE Capital Investment Fund (CIF) allocations will be linked to its carbon reduction performance4. Therefore, it is imperative for the University to revise the existing Carbon Management Plan to reflect its carbon emissions reduction target and how it intends to achieve it. Even under a significant reduction in capital allocations, HEFCE expects universities to continue their commitment to reduce carbon emissions and prove value for money is being achieved.
4 Carbon management strategies and plans: A guide to good practice – January 2010/02
£-
£1,000,000
£2,000,000
£3,000,000
£4,000,000
£5,000,000
£6,000,000
£7,000,000
£8,000,000
2004/05 2005/06 2006/07 2007/08 2008/09 2010/11 2011/12 2012/13 2013/14 2014/15 2015/16
Energy Cost Since 2004/05
Oil Gas Electricity Steam and Hot Water Biomass Total Energy Costs

11 | P a g e
3. Carbon Emissions Baseline and Projections 3.1 Classifying Carbon Emissions
This section provides an understanding of where the University’s carbon emissions come from and their possible effects over time. Emissions could stem from a number of University related activities such as energy used in buildings, maintenance, refurbishment, new building programmes, and infrastructure projects; energy procurement; specification and procurement of capital equipment; transport policy & planning and waste management.
The Greenhouse Gas (GHG) Protocol5 defines three ‘scopes’ of emissions:
I) Scope 1 - Direct GHG emissions are emissions from sources that are owned or controlled by the organisation. For example, emissions from combustion in owned or controlled boilers, furnaces and vehicles.
II) Scope 2 - This accounts for GHG emissions from the generation of purchased electricity by the company.
III) Scope 3 - Indirect emissions that organisations produce through their activities, but occur from sources not owned or controlled by the organisation. Examples of such activities include business travel, commuting, supply chain (procurement), waste and water.
Figure 6: The boundaries of different carbon footprint ‘scopes’
3.2 Emission Baseline and Recent Trends
In 2006/076, the University’s carbon emissions baseline was established based upon 2004/05 data. The total carbon identified was 34,2737 tonnes. The activities considered for calculation of these emissions were energy (gas, oil, owned vehicle fuel, electricity and steam & hot water – scope 1 and 2) and water
5 http://www.defra.gov.uk/publications/files/pb13309-ghg-guidance-0909011.pdf 6 The University took part in the Higher Education Carbon Management Programme ran by the Carbon Trust. 7 Figure based on re-baseline.
12 | P a g e
(scope 3) consumed in residential and non-residential buildings, (scope 1) transport and (scope 3) waste generated.
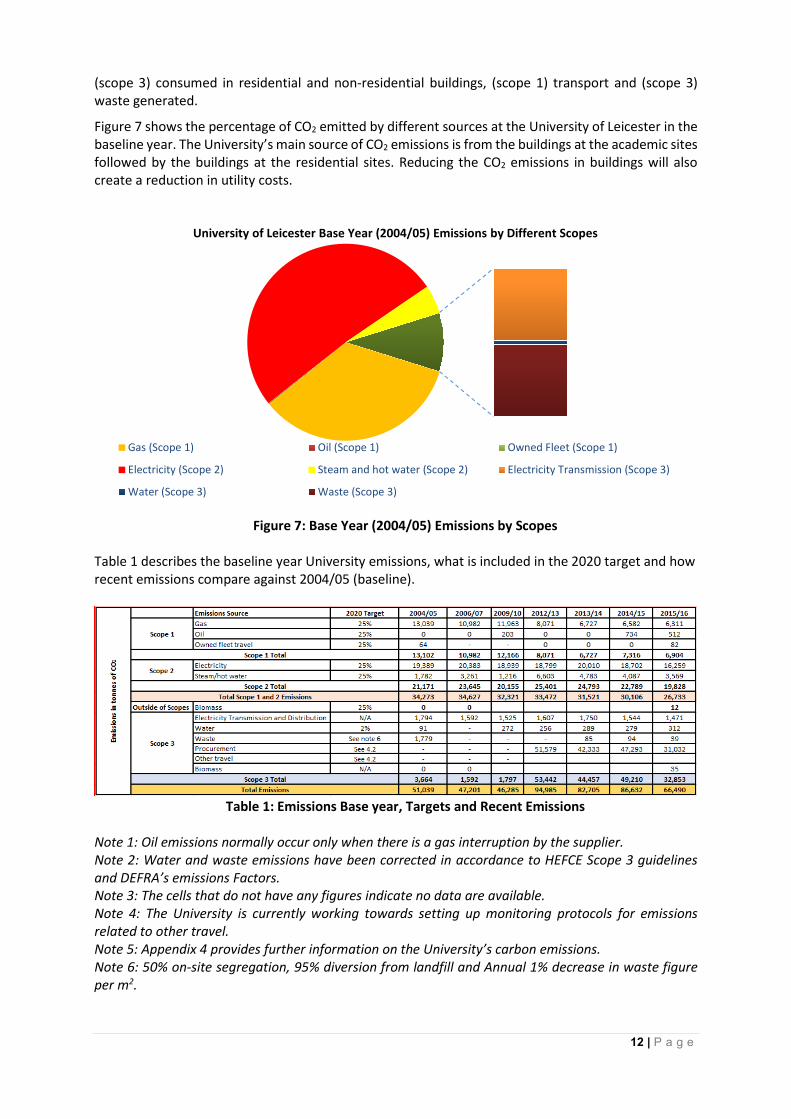
Figure 7 shows the percentage of CO2 emitted by different sources at the University of Leicester in the baseline year. The University’s main source of CO2 emissions is from the buildings at the academic sites followed by the buildings at the residential sites. Reducing the CO2 emissions in buildings will also create a reduction in utility costs.
Figure 7: Base Year (2004/05) Emissions by Scopes
Table 1 describes the baseline year University emissions, what is included in the 2020 target and how recent emissions compare against 2004/05 (baseline).
Table 1: Emissions Base year, Targets and Recent Emissions
Note 1: Oil emissions normally occur only when there is a gas interruption by the supplier. Note 2: Water and waste emissions have been corrected in accordance to HEFCE Scope 3 guidelines and DEFRA’s emissions Factors. Note 3: The cells that do not have any figures indicate no data are available. Note 4: The University is currently working towards setting up monitoring protocols for emissions related to other travel. Note 5: Appendix 4 provides further information on the University’s carbon emissions. Note 6: 50% on-site segregation, 95% diversion from landfill and Annual 1% decrease in waste figure per m2.
University of Leicester Base Year (2004/05) Emissions by Different Scopes
Gas (Scope 1) Oil (Scope 1) Owned Fleet (Scope 1)
Electricity (Scope 2) Steam and hot water (Scope 2) Electricity Transmission (Scope 3)
Water (Scope 3) Waste (Scope 3)

13 | P a g e
Figure 8: Carbon Emissions Scope 1 and 2 by Non-Residential and Residential Buildings
4. Carbon Management Targets The University has set targets to control its carbon emissions associated with the University’s core business activities. Targets associated with the different carbon management scopes are listed below.
4.1 Scope 1 & 2 Targets
� The University aims to reduce its Scope 1 and 2 carbon emissions by an absolute figure of 25% by 2020 against 2004/05 base line. The University also has a relative target of 60% by 2020 against turnover and 40% by 2020 against GIA and FTE (staff & students).
� These targets apply to emissions related to gas, heat and steam usage, fuel used in the University owned fleet and electricity purchased from the grid.
4.2 Scope 3 Targets
� The University has not set all of its Scope 3 targets to date. This is due to the complexity in collecting some of the Scope 3 data and actually being able to make any difference as the emissions cannot be controlled directly by the University. The HEFCE guidelines published in January 2012 will be used to collect this data. Data to be collected are summarised in Appendix 6. Where the scope 3 emissions have been calculated, suitable targets have been set.
o Water – 2% reduction annually to 2020 o Waste – Targets have been set to improve recycling and to divert waste from landfill:
� Achieve 50% on-site segregation of waste for recycling (by weight) by 2020 � Achieve 95% diversion from landfill (by weight) by 2020 � Annual 1% decrease in waste figure per m2
o Travel � Improving air quality and emissions associated with University-related travel. � Capture commuter and business travel data for carbon foot printing purposes.
o Procurement � Create a Social Value order of priorities � Achieve Flexible Framework level 4 � Include sustainable catering within the Sustainable Procurement
0
10,000
20,000
30,000
40,000
Baseline(2004/05)
2010/11 2011/12 2012/13 2013/14 2014/15 2015/16
Carbon Emissions in Tonnes of CO2
Non-residential scope 1 and 2 carbon emissions total
Residential scope 1 and 2 carbon emissions total
Total scope 1 and 2 carbon emissions

14 | P a g e
5. Carbon Management Vision and Strategy 5.1 Low Carbon Vision
The University of Leicester recognises that climate change is taking a toll on the environment and is committed to playing a leading role through minimising our negative environmental impact. The Sustainability Strategy has one main aim: to enhance our social, economic and physical environments by embedding sustainability into University core business. This involves two core streams:
i. Developing the environmental management of our estate to be as efficient and environmentally responsible as possible,
ii. Embedding the wider sustainability-related values through the University through our curriculum, research practice, community outreach and day to day behaviours.
This vision shall partly be achieved through carbon emissions reduction opportunities, through operation of the carbon reduction hierarchy (Reduce – Efficiency – Decarbonise – Befriend – Neutralise)8 and strategic themes.
5.2 Carbon Reduction Hierarchy
For a systematic and structured carbon management strategy, the carbon hierarchy9 is adopted. This hierarchy will help to manage and reduce emissions in a socially responsible and cost-effective way.
REDUCE energy/fuel demand
Avoid unnecessary use
MO
NITO
R
� Learn from
existing projects and practice �
Apply control measures
� Evaluate im
pacts
Passive features (for example insulation, daylight, solar gain/shading, thermal mass) Encourage energy-conscious behaviours
EFFICIENCY of equipment and energy/fuel sources
Use energy-efficient equipment Provide simple and effective controls Recover useful heat Use clean fossil fuel technology
DECARBONISE energy/fuel supplies
On-site or near-site renewable energy sources, including community schemes
BEFRIEND Seek partnerships to increase your capacity to do the above
NEUTRALISE energy/fuel supplies
Consider responsible carbon offsetting schemes Procure green electricity supplies
Table 2: Carbon Reduction Hierarchy
8 Carbon reduction target and strategy for higher education in England- January 2010/01 9 Carbon reduction target and strategy for higher education in England – January 2010/01
15 | P a g e
5.3 Carbon Reduction Strategy
To achieve the carbon emissions reduction targets, the University has adopted the following strategic themes:
REDUCE
Sustainable Design
� All major and minor building projects will follow sustainable design principles as instructed in the University’s Design Guide.
Behaviour change
� For an effective energy awareness programme, it is important to get the fundamentals right such as support and resources, an appreciation of the current situation, as well as understanding and targeting specific audiences, setting achievable goals and having the appropriate messages and communication strategies.
� Appendix 7 shows the regulated and unregulated energy loads for selected academic buildings. The consumption of unregulated load responsibility largely rests with the building users. A recent energy audit has revealed in some buildings the building users’ energy load is as high as 59%.
Carbon-space management efficiency
� Energy and cost savings can be achieved through efficient use of space in buildings. This could be through efficient timetabling, use of zoning in buildings, making use of the most energy efficient buildings out of hours and purchasing and renting highly efficient buildings.
� The University’s approach to the efficient use of space is embedded into the Space Allocation Principles Document10.
Monitoring, targeting, reporting, policy and procedures
� The University has over 1,000 meters monitoring building utility consumption. The half-hourly data is imported into two aM&T systems for utility analysis, reporting and bill validation. There are numerous minor, major and capital work programmes taking place each year to develop the University’s facilities. It is important that existing policies and procedures that are used for these works programmes have a low carbon focus embedded into them.
A model for a Virtual Devolved budget
� Utility budgets at the University of Leicester have been devolved to Residential and Commercial Services, Sport and Garden and to commercial businesses trading at the University but not to academic departments.
� Developing a model for a virtual devolved budget for Colleges/Departments would give more responsibility for energy use to the consumer.
� The main benefits of such a scheme for the University are: senior management buy in for energy savings, departmental discussions of energy use at budget setting, carbon/energy cost considerations when producing business cases and promoting energy efficiency within departments.
10 http://www2.le.ac.uk/offices/estates/services/property/space/docs/Space%20Principles.pdf

16 | P a g e
EFFICIENCY
Understand energy use and Building energy efficiency projects
� 99.7% of the University’s scope 1 and 2 emissions are from energy used in buildings. 39% of the emissions are related to heating and the remaining is related to power.
� Determining the regulated and unregulated loads in buildings to understand what proportion of energy the building users are responsible for and what is related to space heating and other core power requirements can influence energy savings. Regulated and unregulated loads for selected academic buildings are listed in Appendix 7.
� The existing building stock (approx. 291) requires in-depth energy audits of the following: efficiency of cooling, heating and ventilation systems, building fabric, lighting and small power (PC, office equipment, laboratory equipment, etc.). It is important that the University aims to bring all of its existing building stock up to acceptable energy performance levels.
Building management systems and controls
� The University has a well-established Building Management System (BMS). BMS is an excellent tool for remote and real-time maintenance. The BMS can also be used as a Building Energy Management System (BEMS).
� The University has BMS installed in 95% of the non-residential buildings and across 60% of the residential buildings.
� A BEMS action plan has been developed for all centrally timetabled spaces, departmental meeting rooms, department seminar rooms and common rooms. The action plan as part of the BMS strategy will need to be developed to include upgrading the controls to a building, by zones, etc.
Upgrade inefficient buildings
� Poor energy performing buildings increase operational running costs and produce excessive carbon emissions. It is important to strategically identify the worst performing buildings and target energy efficiency improvements as part of the Condition ‘C’ Plan.
Green ICT
� ICT is at the heart of the University’s business activity. Inefficient management of ICT consumes additional energy, which costs money and contributes to the University’s carbon footprint.
Owned travel fleet
� 0.3% of the University’s scope 1 and 2 emissions are related to fuel consumed by owned travel fleet. Although the emissions from travel fleet are very small in comparison to buildings emissions, it is important to green the University’s fleet and make cost savings.
DECARBONISE
BEFRIEND
Decarbonisation of electricity grid
� The UK government has legal 2020 and 2050 carbon emissions reduction targets. The University purchases a large volume (40% of total energy consumed) of electricity from the grid. The electricity from the grid is generated by a combination of fuel sources including fossil fuel and renewables.
� Decarbonisation of the electricity grid means increasing the energy generated using low carbon and renewable sources and reducing the dependence on carbon-intensive fossil fuels.

17 | P a g e
Leicester District Heating Partnership
� The University is in a Partnership with Leicester City Council and the third party energy provider. The scheme provides carbon emissions savings on the heat supplied to University buildings. The heat from this scheme was anticipated to account for 20% of the University’s energy portfolio. Therefore, the emissions factor reduction for this heat is dependent on the efficiency of the scheme and low carbon fuel sources.
Large scale low or zero carbon technology expansion
� To decarbonise the fuel supplies used on the University sites, it is important to incorporate large low or zero carbon technologies such as CHP, Biomass, Ground/Air Source Heat Pump, etc. into existing non-residential and residential buildings and also to be considered as part of any new major refurbishment and development. These low carbon technologies would provide the University with a certain level of energy security and carbon savings.
Onsite renewable generation
� To reduce annual energy costs and mitigate fossil fuel dependence, it is important to explore the incorporation, where appropriate, of photovoltaic (PV) panels, Ground/Air Source Heat Pump, solar thermal, etc. into existing and new buildings.
NEUTRALISE
Procurement of Energy
� The University will aim to purchase a proportion of available green energy on all future energy contracts.
6. Carbon Management Action Plan The Carbon Management Action Plan supports this Carbon Management Plan. The action plan will contain carbon reduction projects and will be reviewed periodically. Example of an action plan can be found in Appendix 9.
7. Monitoring, Reporting and Assessment 7.1 Monitoring
� The University monitors gas, electricity, steam, heat and water using the two automated meter reading systems on half-hourly intervals. The data shall be interrogated and analysed using the two software systems (Dynamat Plus for non-residential sites and eSight for residential sites).
� The University owned fleet data is collected through fuel card system. � The University shall monitor waste data using data provided from contractors and internal waste
audits. � The University shall monitor travel data using the Cooperative travel management system and the
travel expense claim system. � The University shall work towards putting in place monitoring and reporting protocols for all Scope
3 emissions.
7.2 Reporting
Monitoring and reporting is an important aspect of any successful management system. In order to review the University’s performance against its carbon targets and for compulsory energy legislation reporting, carbon and utility performance (electricity, gas and water) shall be provided to relevant internal and external stakeholders on an annual basis.
18 | P a g e
Under mandatory reporting, the University reports to the following schemes; CRCEES, DEC, EPC and Air Conditioning Inspection Certificate. Any Freedom of Information (FOI) request could also be classed as mandatory reporting such as the annual People & Planet Green League Table. The University also reports its emissions annually to its funding body HEFCE through the Estates Management Reporting.
7.3 External Verification of Emissions Data and Estimates
The University participates in CRCEES, which does not require mandatory external verification. However, the University has chosen to verify its emissions related to CRCEES using an external accredited body. The University has the majority of its Scope 1 & 2 emissions audited each year through CRCEES verification.
The University will periodically aim to report under voluntary carbon reporting such as the Carbon Saver Standard or similar to demonstrate its achievements on Carbon Management.
Due to the importance of emissions data, the University shall aspire to set-up emissions audits for all of its carbon emissions scopes by 2020.
7.4 Demonstrate Continuous Improvement
The University shall seek to maintain its Carbon Saver Standard or equivalent status. To embed energy and environmental continuous efficiency improvement across the University’s estates operations, an appropriate energy and/or environmental management standard shall be considered for implementation.
8. Carbon Management Plan financing Investment in carbon management projects is essential to achieving the carbon targets. The University of Leicester had no budget defined for energy management prior to joining the Higher Education Carbon Management Programme. Since then, the University was awarded an energy efficiency grant of £1.4 Million through the HEFCE-Salix RGF 1 and 2. The nature of the HEFCE-Salix RGF is to invest in energy efficiency measures in existing buildings. The savings from the invested projects are re-invested into other energy efficiency projects. Based on the savings, the amount of investment available each year is in the region of £200K.
8.1 Internal Funding
The types of projects include ‘quick win ’, ‘medium term’ and ‘long term’ projects. The quick win projects are of top priority to the University as they are quick energy & cost savers and contribute to the reduction of carbon emissions. Quick wins These are projects that require no or little investment with a quick payback. Examples of project include change of process and policies, timer controls for office equipment, awareness campaigns with an investment between £0 - 10k. Medium term
The medium term investment projects result in a 5- 10 year payback period. Funds invested in these type of energy projects save 1 tonne of carbon per £50-100 spent. The HEFCE-Salix RGF funds these types of projects. These projects require quantified business cases that need to be sanctioned by the Fund Manager (Carbon and Energy Manager).
Long term
The long term projects require higher investment. They result in a longer payback period and are often linked to capital projects, which are integral to the growth of the core business – research and teaching. These projects require quantified business cases and need to be sanctioned by University Leadership Team (ULT). An example of this type of project is the David Wilson Library, which achieved BREEAM “Excellent”, and the Centre for Medicine Building, which the largest Passivhaus Build in the UK.
19 | P a g e
The non-financial resources required to support this programme are the internal staff involved in implementing projects such as from Estates and Facilities Management Division, Media and Communication Office and Positive Impact Network (PIN) Coordinators.
8.2 External Funding
The University shall continue to consider external funding sources to finance energy efficiency programmes and low or zero carbon technologies that will support carbon management activities.
The University shall also continue to seek opportunities to work effectively in partnership with local businesses and other local public sector organisations to enable solutions that share learning and would not be possible by working alone.
9. Stakeholder Management and Communication 9.1 Stakeholder management
The behavioural culture and activities of staff and students at the University will influence how well carbon can be reduced. Universities have reported energy reductions from 11% (University of Cambridge, 201211) to 33% (University of Bradford, 2011) using behaviour change initiatives, thus stakeholder participation in CO2 reduction activities will determine the success of the plan. University stakeholders have been identified as: � Staff
a. Academic staff b. Administrative staff c. Non-academic and non-administrative staff
� Students a. Local students b. Students at Halls of Residence
� Visitors � Leicester general public and especially local residents
Recent research emphasises that, in terms of energy use, people are most influenced by what those around them are doing (social norms) and are more likely to be influenced by information which is novel, accessible and of relevance to the individual in question12. In order to achieve behaviour change, a comprehensive strategy needs to be implemented with a thorough understanding of each stakeholder and their potential and actual impact on the plan.
The University is developing a research programme to develop that understanding along with colleagues in the Departments of Management and Psychology that will inform a Positive Behaviours Strategy to complement this Carbon Management Strategy. The purpose of this research is to investigate the sustainable and unsustainable behaviours, motivations and values of our staff and students in order to inform future University policy and practice and also as part of some potential collaborative work with other Universities.
The Environment Team is developing a behaviour change and associated communications plan to complement Carbon Management Strategy and Plan. This will be based on communicating the issues of unregulated energy use and will largely focus on encouraging staff to come up with innovative energy reduction solutions. It will mainly be concerned with scope 1 and 2 reductions, but not exclusively. This will be available by November 2017.
11 http://www.buildingsustainability.net/blog/category/behaviour-change/ 12 Behaviour Change and Energy Use, Cabinet Office, 7 June 2011.

20 | P a g e
10. Carbon Management Ownership and Management 10.1 Main roles and responsibilities
In order for the Carbon Management programme to be successful and continuous, there is a need to demonstrate who takes responsibility for what and at what level of management from within the University. This section explains the roles and responsibilities of the teams that have been established to run the Carbon Management Programme.
10.2 Project Team
Project Sponsor - Pro-Vice-Chancellor
The Project Sponsor chairs the Sustainability Steering Group (SSG), which advises and informs ULT on all sustainability matters including carbon and energy.
Co-Sponsor - Director of Estates and Campus Services
The Co-Sponsor provides appropriate support to the Carbon and Energy Manager to implement the carbon management plan. The Co-Sponsor is also a member of the SSG and communicates to the ULT on carbon, energy and environmental matters.
The Project Sponsor and Co-Sponsor will steer the programme to achieve the aims and give approval to the steps taken by the Carbon and Energy Manager who is tasked with delivering the programme.
Project Manager - Carbon and Energy Manager
Project Funding Officers – Director of Finance, Director of Estates and Campus Services and the Head of Customer Services and Office Support (Estates)
The Project Funding Officers are the key individuals tasked with obtaining internal and external funding for implementing the projects along with the Project Manager.
Sustainability Steering Group
The SSG’s role is to formulate and review annually the Sustainability Strategy, which includes carbon reduction commitment; to review environmental practices to ensure consistency with the Environmental Sustainability Policy and Strategy; to consider and recommend changes to environmental and carbon policy and practice; to consider and promote environmental improvements to the University’s operations, including carbon & energy saving measures; and to set and monitor appropriate targets for carbon and environmental performance.
Positive Impact Network Coordinators
The role of the PIN Co-ordinators within the Carbon Management Programme is to assist the Project Manager and Project Support Officer to deliver identified projects at their respective building level.
Student Sustainability Steering Group
The student-led SSWG consists of representatives from a large number of student societies and focuses on sustainability-related issues. It also administers the Sustainable Environment Enterprise Development (SEED) Fund where students can bid for money to run sustainability (including energy-saving) projects.

21 | P a g e
Carbon Management Team
The Carbon Management Team assists in identifying and delivering the carbon saving projects identified at the University of Leicester. Their main role is to support the Project Manager by delivering projects that are identified under the criteria in an agreed timescale.
Area for CMP Support Carbon Management Team Members Building energy management Building Controls Engineers
Building Services Engineers Electrical and Mechanical Design Engineers
Estates maintenance and major refurbishment programmes
Director of Planning & Projects Head of PPM and Head of Operations
Estates strategy Director of Estates and Campus Services Director of Campus Services
Energy procurement Head of Customer Services and Office Support Head of Procurement
Procurement of new buildings and infrastructure
Director of Planning & Projects Head of Procurement
Procurement, use and recycling of water, paper and all other consumables Scope 3 – Procurement
Head of Customer Services and Office Support Head of Procurement Waste Manager Sustainability Manager
Specification and procurement of capital equipment, including IT and fit-out of laboratories, workshops etc.
Director of Estates and Campus Services Building Services and Control Engineers Head of Customer Services and Office Support Director of Planning & Projects Director of Campus Services Director of IT Services Head of Operations Head of Procurement
Transport policy and planning Scope 1 and 3 – Travel
Head of Operations Sustainability Manager
Waste management Scope 3 – Waste
Head of Operations Waste Manager
Table 3: Carbon Management Team and Areas of Expertise
Day-to-Day Carbon Management Team
The Energy and Environment Team tackles the day-to-day elements of the carbon management programme.
Specific Carbon Management Area Team Members Carbon and Energy Management
Carbon and Energy Manager Utilities Technician Finance and Utilities Assistant
Environmental Management Sustainability Manager Sustainable Procurement Head of Procurement Travel Management Sustainability Manager Waste Management Waste Manager Water Management Carbon and Energy Manager Behaviour Change Sustainability Manager
Sustainability Project Officer Sustainable Projects Intern
Table 4: Day-to-Day Carbon Management Team

22 | P a g e
Wider Supporting Team
Role in the Project Team Members Press releases, etc. Director of Press and Publications
Office Assistance with organising events, seminars, workshops, clerical support and assistance etc.
Estates Admin Team
Internal communication Environment Team – Marketing Office Table 5: Wider Supporting Team and their Roles
10.3 Expected Constraints
Maintaining Support
Whilst implementing projects, it is likely that there will be a certain number of successes that will motivate the teams and University stakeholders. It is very important to publicise these successes in order for continuous momentum of the programme and it will help build and maintain the support for the programme. Reporting to stakeholders at the University will be a key element in maintaining support for the programme.
Time Management
Project plans are one of the most important tools in completing projects and meeting targets set for carbon reduction. It is essential that annual scheduling should be used when implementing projects, which will assist delivering the projects in good time.
Possible Risk
In order for the successful implementation and continuity of the carbon management plan, risks need to be evaluated. Evaluation of risks for the programme will be undertaken annually along with the review of the programme. Outcomes will be addressed with the help of senior management.
The possible risks to the project are: I) Strategic decision-making that contributes carbon to the University’s footprint II) Lack of resources for the Project Manager and Project Support Officer affecting delivery of targets. III) Lack of continuous support towards the carbon management plan affecting delivery of future
milestones. IV) Lack of quality data affecting identifying energy saving opportunities. V) Lack of continuous support from the teams will affect the implementation of the plan. VI) Allocating and obtaining budgets may delay implementation of the identified opportunities.
10.4 Reporting and evaluation
Procedures for reviewing performance
This section covers the procedures for reviewing how well the carbon management programme is delivering its aims and targets. Figure 9 shows the committee reporting line for carbon management at Leicester.
23 | P a g e
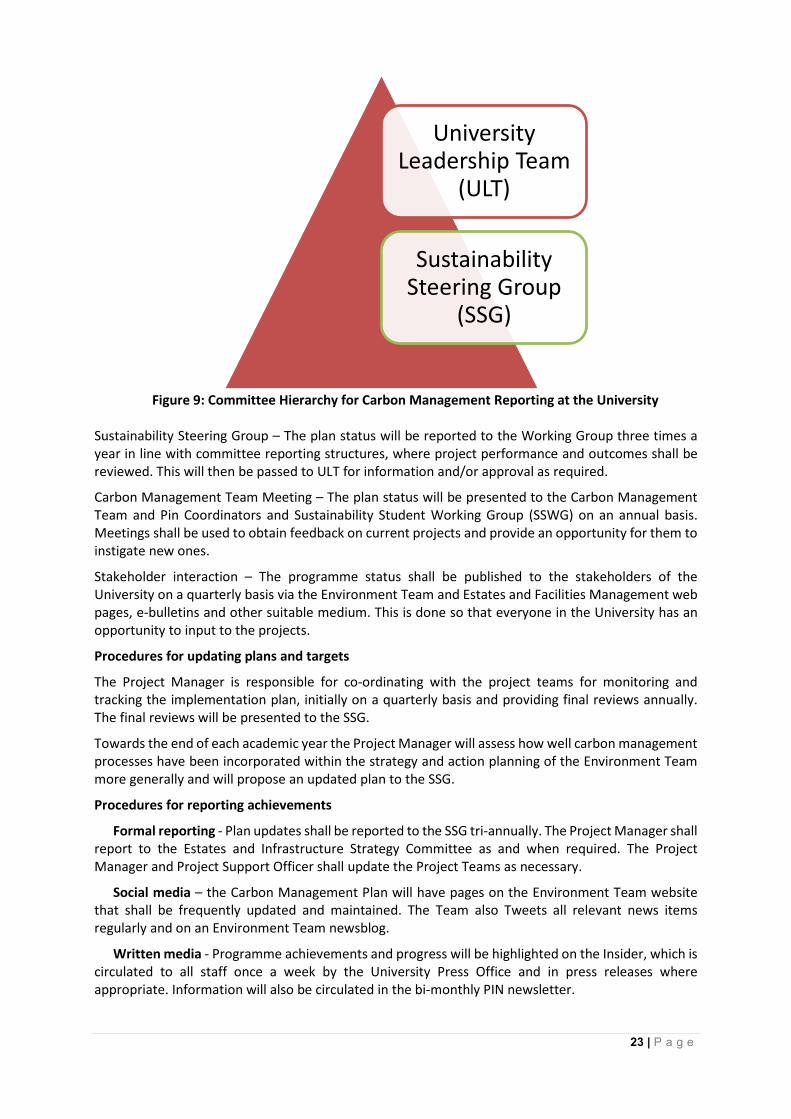
Figure 9: Committee Hierarchy for Carbon Management Reporting at the University
Sustainability Steering Group – The plan status will be reported to the Working Group three times a year in line with committee reporting structures, where project performance and outcomes shall be reviewed. This will then be passed to ULT for information and/or approval as required.
Carbon Management Team Meeting – The plan status will be presented to the Carbon Management Team and Pin Coordinators and Sustainability Student Working Group (SSWG) on an annual basis. Meetings shall be used to obtain feedback on current projects and provide an opportunity for them to instigate new ones.
Stakeholder interaction – The programme status shall be published to the stakeholders of the University on a quarterly basis via the Environment Team and Estates and Facilities Management web pages, e-bulletins and other suitable medium. This is done so that everyone in the University has an opportunity to input to the projects.
Procedures for updating plans and targets
The Project Manager is responsible for co-ordinating with the project teams for monitoring and tracking the implementation plan, initially on a quarterly basis and providing final reviews annually. The final reviews will be presented to the SSG.
Towards the end of each academic year the Project Manager will assess how well carbon management processes have been incorporated within the strategy and action planning of the Environment Team more generally and will propose an updated plan to the SSG.
Procedures for reporting achievements
Formal reporting - Plan updates shall be reported to the SSG tri-annually. The Project Manager shall report to the Estates and Infrastructure Strategy Committee as and when required. The Project Manager and Project Support Officer shall update the Project Teams as necessary.
Social media – the Carbon Management Plan will have pages on the Environment Team website that shall be frequently updated and maintained. The Team also Tweets all relevant news items regularly and on an Environment Team newsblog.
Written media - Programme achievements and progress will be highlighted on the Insider, which is circulated to all staff once a week by the University Press Office and in press releases where appropriate. Information will also be circulated in the bi-monthly PIN newsletter.
University Leadership Team
(ULT)
Sustainability Steering Group
(SSG)

24 | P a g e
Displays – the Carbon Management Plan information and achievements shall be publicised using exhibition stands during major University events, open days, staff inductions, within the University administration area, etc.
Awareness projects – to re-iterate the carbon management key messages to the University stakeholders, the Carbon Management Plan shall be looking to implement awareness-raising projects on an annual basis for which funding shall be allocated by the Estates and Facilities Management Division. These awareness-raising projects shall be used to draw attention to the achievements made by the Carbon Management Plan already and what it is aiming to do for future projects.
The Project Manager and Project Support Officer, together with the day-to-day Carbon Management Team, will be responsible for managing the above and all publications will be compiled according to the principles in the Environment Team Communication Strategy.

25 | P a g e
Appendix
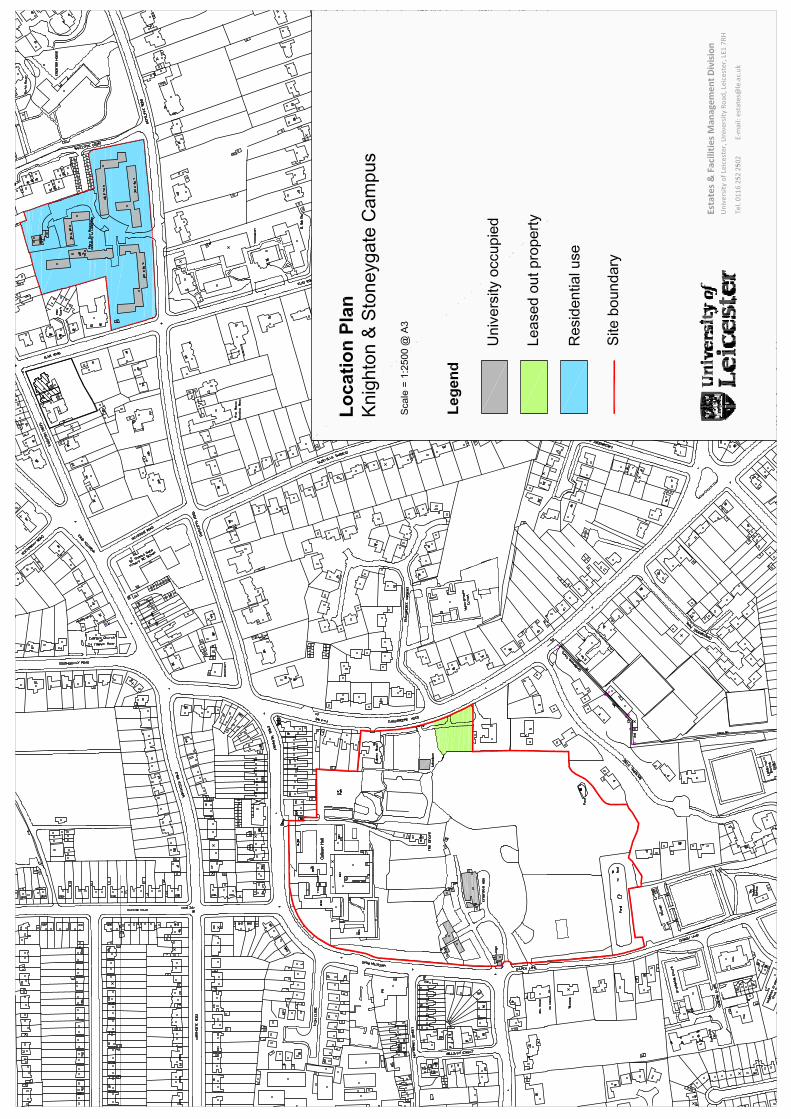
Appendix 1 – University of Leicester Estate
Figure A1.1 – Central, North and South Sites Figure A1.2 – Knighton and Stoneygat Sites Figure A1.3 – Oadby Sites


Appendix 2 - Successes from the Previous Carbon Management Plan
The list below highlights the success that the University has had during the first CMP.
Overall
� The Plan has assisted the University to understand carbon management concepts and impacts based on University activities.
� There have been four Switch Off campaigns conducted since September 2007. � Several building refurbishments have been completed between 2007/08 and 2010/11, which
included urinal controls to reduce water consumption. � Improvements have been made to the Building Management System as a result of appointing a
dedicated Building Controls Engineer. � A new waste management system has taken recycling levels from 3% in 2007 to over 80% in 2012. � As part of the capital project for new build and major refurbishments, the University has invested
in low and zero carbon technologies such as biomass boilers, solar thermal, air source heat pumps and small scale photovoltaic and has planning permission to build its first Passivhaus building.
2007/8
� The Attenborough Windows upgrade project was completed. � The University’s first Environmental Sustainability Policy was signed off by the Vice-Chancellor.
2008/9
� The University’s Environmental Sustainability Strategy was developed.
2009/10
� The University Travel Plan was completed. � Water saving measures were identified and implemented as part of a large scale water audit. � The installation of Automated Meter Reading System was completed in non-residential properties. � The University secured £1 Million HEFCE-Salix Revolving Green Fund (RGF) for small-scale energy
efficiency projects.
2010/11
� The University signed up to the Leicester City Council’s District Energy Scheme.
2011/12
� The installation of Automated Meter Reading System in residential properties was completed. � The University achieved the Carbon Trust Standard based on a 7.2% relative reduction in
emissions. � The University achieved Carbon Saver Gold Standard based on a 2% absolute footprint and 5.4%
relative reduction. � The University secured £492k HEFCE RGF2 funding for small scale energy efficiency projects.
2012/13 A full progress is detailed in the annual report. Below list provides a summary of highlights.
� 2% absolute carbon reduction. � Heating and Cooling Policy approved. � Leicester District Heating Scheme CHP was commissioned and in operation from 1st October 2012. � £207K was invested in boilers and LED lighting. � RGF 2 funds were spent before 31st Jan 2013 as per the funding requirement. � Completed installation of automated meter reading system at residential buildings. � Student projects were completed on calculation the University carbon footprint for IT and
procurement. � Go Green Week switch off campaign led by students saved 5% energy during the week at Percy
Gee Building.
27 | P a g e
� 91% recycling rate achieved. � 3% reduction in people driving to work alone and 60% increase in cycle parking on campus. � University partners with Sainsbury’s on the water saving offset scheme.
2013/14 A full progress is detailed in the annual report. Below list provides a summary of highlights.
� 367 tonnes of waste being recycled. � Emissions from procurement reported for the first time. � Absolute emissions decreased by 3%. � 2% of energy is from low or zero carbon source. � 13% reduction to total water consumption across the University. � 7 electric vehicles with 2 charging points launched to measure air quality around Leicester.
2014/15 A full progress is detailed in the annual report. Below list provides a summary of highlights.
� 37% of the University heat is produced by renewables or low carbon energy. � The University’s Centre for Medicine building commence construction. This building is built to
Passivhaus standard. � CRC emissions down by 7.6% compared to 2013/14, which is approx. 2,319 tonnes savings. � 750 tonnes of CO2e saved from re-use furniture scheme. � Single occupancy cars to the University sites have been reduced to just 37%. � 200 trees planted at Stoughton Road playing fields.
Carbon Emissions since the 2004/05 Baseline The figure below shows the carbon map of the University since its baseline year, 2004/05.

28 | P a g e
Appendix 3 - Lessons Learnt from Previous Carbon Management Plan
On reflection regarding the development and implementation of the previous CMP, the following items were taken into consideration while writing the new CMP. Carbon Reduction Road Map to Achieve Target: A clear breakdown of the carbon baseline for buildings and activities etc. needs to be established as part of the carbon strategy. In the previous CMP, projects were well defined but less detail was given on the carbon impacts. To overcome this, opportunities and carbon impacts need to be the focus and a continuous structured audit system will need to be put in place to identify projects that will reduce and maintain the carbon impact. The project plan in the previous CMP was defined in terms of numbers of projects and delivery dates but not in terms of financial commitments – greater detail is necessary in the new CMP. Previous 2020 Carbon Emissions Target: A 60% carbon emission reduction was set under the published 2010 Environmental Sustainability Strategy. This target was one of the most ambitious amongst UK Higher Education Institutions (HEIs) to assist the UK and HEFCE’s reduction target of 34% before 2020 in line with the Climate Change Act. The logic behind this ambitious target was, Leicester had access to its utilities data from 1990 and as such the 60% target is based on actual increases in carbon emissions as opposed to an extrapolation or guesswork. The University’s total scope 1 and 2 emissions in 1990 were approximately 21,754 tonnes of carbon dioxide (CO2). Since then the University has grown and as a result emissions have increased by 25.8% against 2004/05 (29,23313 tonnes of CO2). In order to meets HEFCE’s reduction target of 34% against 1990 levels by 2020, the University would need to reduce carbon emissions by 59.8% by 2020. The University has gained a better understanding of its carbon emissions based on its activities. It would be therefore sensible to ensure the 2020 and future targets are set realistically to the University of Leicester. Better Communication and Feedback Systems: Over the life of the previous CMP, there was not enough detailed information fed back to the project board and sponsor. The communication process to the board and other stakeholders needs to be improved. The ‘value at stake’ will need to be re-visited through continuously re-assessing the business case over the life of the project. Strategy and Ownership of the Plan: There was buy-in from the senior management team regarding the CMP. However, the CMP did not fit in with the Higher Education (HE) strategy as there was no strategy at the time. The old CMP identified stakeholders but responsibilities were not delegated to help achieve carbon reduction. There was also no direct ownership of the carbon reduction target. Financial and Personnel Resources: There was less achieved in the previous CMP than should have been but this was mainly due to lack of financial and personnel resources. Funding was not in place, which will need to be reviewed and addressed under the new CMP.
13 The University re-baselined emissions using DEFRA guidelines during 2016/17.

29 | P a g e
Appendix 4 – Further Information on the University of Leicester’s Carbon Emissions
University Emissions Overview Table A4.1 provides a description of carbon emissions:
Scope Description Data Source Inclusion in baseline and target
Scope 1: Direct emissions
Emissions from energy use: fossil fuel (gas, coal, oil) combustion
Estates Management Reporting (EMR), invoices, manual and automated meter reads.
Mandatory
Scope 2: Electricity indirect emissions
Emissions from electricity use
Mandatory
Scope 3: Indirect unregulated emissions
• Business travel • Commuting • Supply chain
(procurement) • Waste • Water
Estates Management Reporting (EMR), invoices, manual and automated meter readings. Cooperative Management data. Travel questionnaire. Purchasing Annual Returns Database (ARD) data.
Optional. Not included in 60% target. There are baselines set for water and waste.
Table A4.1: Scope 1 and 2 Carbon Emissions Note: Appendix 4 shows the CO2 conversion factors used to calculate CO2 for the different sources. It is important to note that carbon conversion factors change from year to year.
Scope 1 and 2 emissions
Figure 6 shows an increasing trend in CO2 emissions in non-residential and residential buildings. There are several reasons for this increasing trend such as the activity in each individual building varying from year to year, the addition of new buildings and increases in the number of staff and students, turnover, etc.
Figure A4.1: CO2 Emissions for Non-residential and Residential Buildings
0
5,000
10,000
15,000
20,000
25,000
30,000
2004/05 2005/06 2006/07 2007/08 2008/09 2009/10 2010/11
Tonn
es o
f CO
2
CO2 Emissions - Non-residential Vs Residential
Total energy emissions (non-residential) (Tonnes)Total energy emissions (Residential) (Tonnes)

30 | P a g e
Scope 3 Emissions
HEFCE has recently published guidelines on how to monitor and measure Scope 3 emissions for waste, water, travel and procurement. Measures are currently being put in place to calculate more accurate Scope 3 emissions for the University. Data to be collected are summarised in Appendix 6. This will be produced as an addendum to this Carbon Management Strategy.
Case Study Example – Water use
Data collected on waste and water use show the same trends of increasing emissions and associated costs:
Figure A4.3: Total CO2 Emissions from Water
0
100
200
300
2007-2008 2008-2009 2009-2010
Tonn
es o
f CO
2
Water CO2 Emissions
Water emission non-residential
Water emission residential
Total Water CO2 emissions
Case study example – University-owned vehicles
The same trend is observed for CO2 emissions from the University-owned vehicles due to the increased number of vehicles.
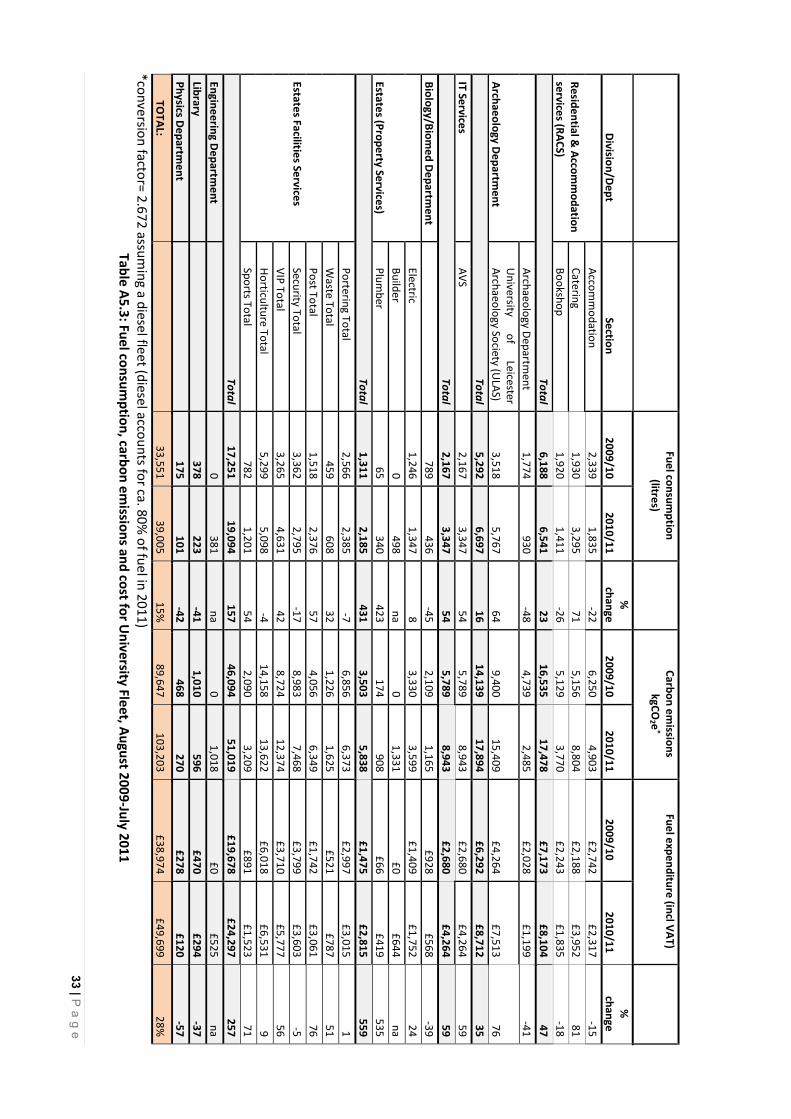
A detailed breakdown of the fleet and individual department fuel performance can be found in Appendix 5. The results show that between 2009 and 2011:
I) Fuel consumption from the fleet increased by 15% from 33,500 litres a year to 38,600 litres. II) Annual carbon emissions rose by 15% from 89,637 kgCO2e to 103,203 kgCO2e, amounting to an
additional 13,556 kgCO2e emitted into the atmosphere. III) Annual fuel expenditure rose by 28% from ca. £39,000 to ca. £49,700, amounting to an additional cost
of £10,700 a year. IV) Horticulture and VIP travel were the largest single consumers of fuel, accounting for 40% of total fuel
consumption. V) Six of the nine departments increased their fuel consumption, while three decreased.
Figure A4.2: Total CO2 Emissions from Transport
020406080
100120
Tonn
es o
f CO
2
Total Transport CO2 Emissions
Fleet

31 | P a g e
Emissions per Activity
The University’s day-to-day activities and its carbon emissions are inter-related. An understanding of activity-related emissions would help to monitor and manage the emissions and help the University to conserve energy and save on energy and carbon costs. Activities can be any number of things including: Information Communication Technology (ICT) (figure A4.4), Sports (figure A4.5), Gardens (figure A4.5), Library (figure A4.5) and Students’ Union (figure A4.5).
Case Study Example – ITC equipment
A recent student led project1 at the University identified the carbon impact associated with the University’s ICT equipment. Figure A4.4 shows the energy consumption and carbon emissions associated with different types of ICT equipment at the University.
Category Annual
Energy Use (kWh)
% Annual Energy Cost (£)
Carbon Emissions
(kgCO2) HPC 870,772 9.0% 104,493 456,824 Servers 4,326,836 44.7% 519,220 2,269,945 PCs 2,178,300 22.5% 261,396 1,142,780 Networks 2,008,572 20.7% 241,029 1,053,737 Telephony 65,788 0.7% 7,895 34,513 Imaging 182,872 1.9% 21,945 95,938 AV 49,576 0.5% 5,949 26,008 TOTAL 9,682,715 100% 1,161,926 5,079,746
Figure A4.4: Carbon Footprint of ICT Equipment (SusteIT tool by thorough method) It should be noted that the data used for this project were based on total cost of ownership (TCO)1 study carried out in 2008 for the University’s IT Services. Whilst it does not give current precise numbers, it gives a picture of emissions related to the University’s ICT equipment controlled by IT Services. It was found that the carbon footprint for the University’s ICT equipment is approximately 5,080 tonnes of CO2 per year when estimated using the thorough method of the SusteIT tool1. These emissions correspond to approximately 22.1% of the total non-residential carbon emissions (Scope 1 & 2) reported under Estates Management Reporting for 2010/11.
Figure A4.5: 2010/11 Carbon Emissions (Tonnes of CO2) Related to Activities
1 The University commissioned KPMG to carry out a study on the total amount of resource the University currently invests in its IT facilities and the support and delivery of its IT services. The study also looked at the costs of IT across all parts of the institution (Understanding the Total Cost of Information Technology at the University of Leicester - Briefing Note for Staff). 2 SusteIT Tool is a toolbox produced by SusteIT project, which has tools to assist energy/carbon calculations for IT related energy consumption.
3% 7% 1%
23023, 89%
Students UnionEmissions
Library Emissions
Sports and GardensEmissions
Total Non-ResidentialEmissions (2010/11)
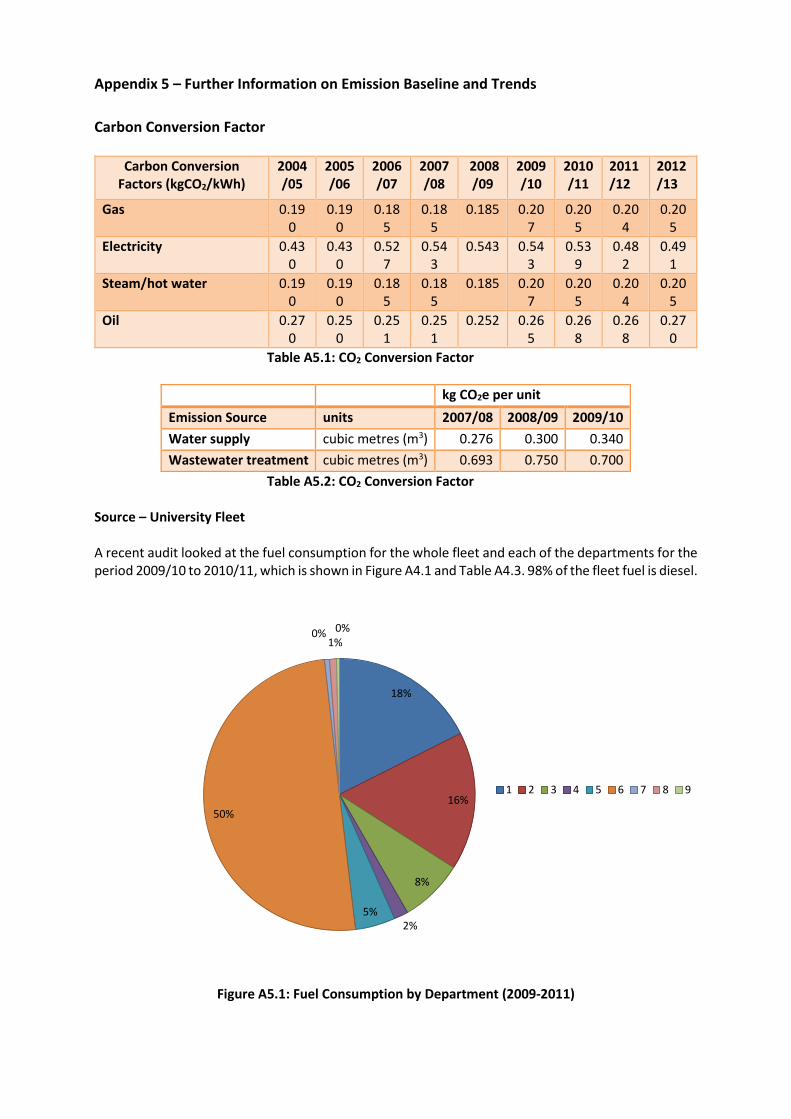
Appendix 5 – Further Information on Emission Baseline and Trends Carbon Conversion Factor
Carbon Conversion Factors (kgCO2/kWh)
2004/05
2005/06
2006/07
2007/08
2008/09
2009/10
2010/11
2011/12
2012/13
Gas 0.190
0.190
0.185
0.185
0.185 0.207
0.205
0.204
0.205
Electricity 0.430
0.430
0.527
0.543
0.543 0.543
0.539
0.482
0.491
Steam/hot water 0.190
0.190
0.185
0.185
0.185 0.207
0.205
0.204
0.205
Oil 0.270
0.250
0.251
0.251
0.252 0.265
0.268
0.268
0.270
Table A5.1: CO2 Conversion Factor
kg CO2e per unit Emission Source units 2007/08 2008/09 2009/10 Water supply cubic metres (m3) 0.276 0.300 0.340 Wastewater treatment cubic metres (m3) 0.693 0.750 0.700
Table A5.2: CO2 Conversion Factor Source – University Fleet A recent audit looked at the fuel consumption for the whole fleet and each of the departments for the period 2009/10 to 2010/11, which is shown in Figure A4.1 and Table A4.3. 98% of the fleet fuel is diesel.
Figure A5.1: Fuel Consumption by Department (2009-2011)
18%
16%
8%
2%5%
50%
0%1%
0%
1 2 3 4 5 6 7 8 9
33 | Pa
ge
Fuel consumption
(litres)
Carbon emissions
kgCO2 e
*
Fuel expenditure (incl VAT)
Division/Dept Section
2009/10 2010/11
%
change 2009/10
2010/11 2009/10
2010/11 %
change
Residential & Accom
modation
services (RACS)
Accomm
odation 2,339
1,835 -22
6,250 4,903
£2,742 £2,317
-15 Catering
1,930 3,295
71 5,156
8,804 £2,188
£3,952 81
Bookshop 1,920
1,411 -26
5,129 3,770
£2,243 £1,835
-18 Total
6,188 6,541
23 16,535
17,478 £7,173
£8,104 47
Archaeology Department
Archaeology Department
1,774 930
-48 4,739
2,485 £2,028
£1,199 -41
University
of Leicester
Archaeology Society (ULAS)
3,518 5,767
64 9,400
15,409 £4,264
£7,513 76
Total 5,292
6,697 16
14,139 17,894
£6,292 £8,712
35 IT Services
AVS 2,167
3,347 54
5,789 8,943
£2,680 £4,264
59 Total
2,167 3,347
54 5,789
8,943 £2,680
£4,264 59
Biology/Biomed Departm
ent
789 436
-45 2,109
1,165 £928
£568 -39
Estates (Property Services)
Electric 1,246
1,347 8
3,330 3,599
£1,409 £1,752
24 Builder
0 498
na 0
1,331 £0
£644 na
Plumber
65 340
423 174
908 £66
£419 535
Total 1,311
2,185 431
3,503 5,838
£1,475 £2,815
559
Estates Facilities Services
Portering Total 2,566
2,385 -7
6,856 6,373
£2,997 £3,015
1 W
aste Total 459
608 32
1,226 1,625
£521 £787
51 Post Total
1,518 2,376
57 4,056
6,349 £1,742
£3,061 76
Security Total 3,362
2,795 -17
8,983 7,468
£3,799 £3,603
-5 VIP Total
3,265 4,631
42 8,724
12,374 £3,710
£5,777 56
Horticulture Total 5,299
5,098 -4
14,158 13,622
£6,018 £6,531
9 Sports Total
782 1,201
54 2,090
3,209 £891
£1,523 71
Total 17,251
19,094 157
46,094 51,019
£19,678 £24,297
257 Engineering Departm
ent
0 381
na 0
1,018 £0
£525 na
Library
378 223
-41 1,010
596 £470
£294 -37
Physics Department
175
101 -42
468 270
£278 £120
-57
TOTAL:
33,551
39,005 15%
89,647
103,203 £38,974
£49,699 28%
*conversion factor= 2.672 assum
ing a diesel fleet (diesel accounts for ca. 80% of fuel in 2011)
Table A5.3: Fuel consumption, carbon em
issions and cost for University Fleet, August 2009-July 2011

34 | P a g e
Appendix 6 – Information on Scope 3 Data Collection
Travel Data Collection Business Travel Road vehicles
Information required Data sources *Fuel consumption Fuel card provider *Fuel type Fleet management software Or Expenditure and, Fuel type / price Lease, hire vehicle suppliers Or Distance and Vehicle specification Grey fleet: Vehicle specification details driving licence checking procedures
grey fleet business insurance checking procedures parking permit applications
* - preferred option Air Travel
Information required External data sources (likely to be able to provide the most accessible and accurate sources of data)
Flight distance Travel Management companies Type of flight (short or long haul) Self-booking tool Cabin class Global distribution system
Third party data analysts Expenses and subsistence systems Internal information systems Expenses claims Insurance records
Rail, taxi, bus and ferry travel
Information required Data sources Distance travelled Travel suppliers (see air travel) Type of train /taxi/ bus (e.g. national rail, Eurostar, black cab, London bus)
Expense claims (origin and destination)
Commuter Travel
Information required Data sources Home and term time residence postcodes
Travel surveys Car parking applications Student records Public transport operators
Modes of travel by percentage Vehicle details
Supply-chain Data Collection
Data Categories:
� Business services � Construction � Food and catering � Information and communication
technologies � Manufactured fuels, chemicals and glasses � Medical and precision instruments
� Other manufactured products � Other procurement � Paper products � Unclassified � Waste and water

35 | P a g e
Data required:
� Expenditure data, which can be in two formats: � ProcHE coded data from ARD supplier data � The United Nations Standard Products and Services Code (UNSPSC) datasets.
Waste Data Collection
It has been proposed that a tiered approach is used for calculating carbon emissions from waste: Basic approach: where waste data are very limited for both residential and non-residential properties. Medium approach: where waste data and recycling data are available for non-residential and/or residential buildings. Detailed approach: where good quality in-house waste data are available.
Information Required Data Sources Reporting
Tier Non-Residential
Residential Construction
Recycled waste mass Contractor Detailed 9 9 9 Food(biodegradable) waste mass (anaerobic digestion)
Contractor Detailed 9 9 9
Hazardous waste mass
Contractor Detailed 9 9 9
WEEE waste mass Contractor Detailed 9 9 9 Radioactive waste mass
UoL Safety Services (in-house data collection)
Detailed 9 9
Clinical waste mass Contractor Detailed 9 9 Recycled waste mass composition
UoL Environment Team (in-house audits) and construction contractor
Detailed
9 9 9
Water Data Collection
Automatic Meter Readings (AMR) provide more reliable data because they produce confirmed readings, rather than the estimates on which water utility company bills are often based. To improve the accuracy of water volume figures, manual meter readings should periodically be taken instead of only using estimates. It is not easy to calculate the sent for treatment unless it is monitored and metered. Utility companies often use estimates based on the volume of water supplied to calculate the volume of wastewater disposed of and treated. This varies, but is usually between 90 per cent and 95 per cent of the water use volume.
Information required Data sources Volume of water used Utility company bill Volume of wastewater produced *Automatic meter readings (AMR)
* - preferred option
36 | P a g e
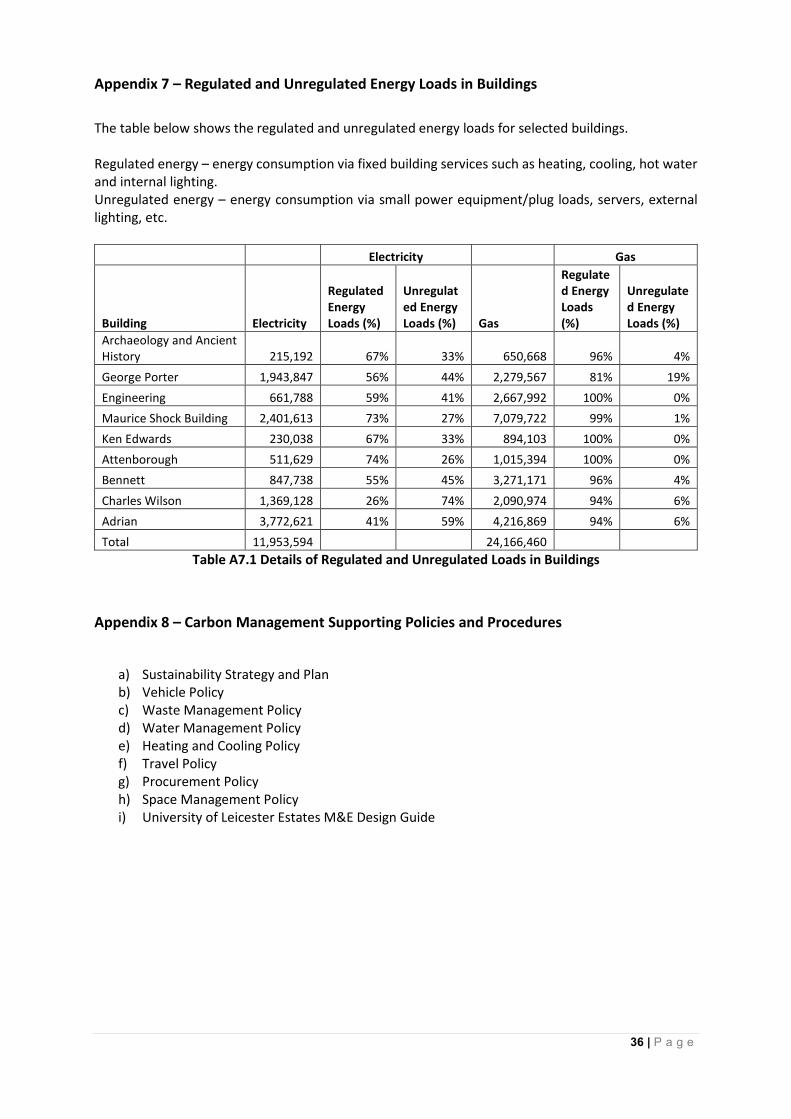
Appendix 7 – Regulated and Unregulated Energy Loads in Buildings
The table below shows the regulated and unregulated energy loads for selected buildings. Regulated energy – energy consumption via fixed building services such as heating, cooling, hot water and internal lighting. Unregulated energy – energy consumption via small power equipment/plug loads, servers, external lighting, etc.
Electricity Gas
Building Electricity
Regulated Energy Loads (%)
Unregulated Energy Loads (%) Gas
Regulated Energy Loads (%)
Unregulated Energy Loads (%)
Archaeology and Ancient History 215,192 67% 33% 650,668 96% 4% George Porter 1,943,847 56% 44% 2,279,567 81% 19% Engineering 661,788 59% 41% 2,667,992 100% 0% Maurice Shock Building 2,401,613 73% 27% 7,079,722 99% 1% Ken Edwards 230,038 67% 33% 894,103 100% 0% Attenborough 511,629 74% 26% 1,015,394 100% 0% Bennett 847,738 55% 45% 3,271,171 96% 4% Charles Wilson 1,369,128 26% 74% 2,090,974 94% 6% Adrian 3,772,621 41% 59% 4,216,869 94% 6% Total 11,953,594 24,166,460
Table A7.1 Details of Regulated and Unregulated Loads in Buildings
Appendix 8 – Carbon Management Supporting Policies and Procedures
a) Sustainability Strategy and Plan b) Vehicle Policy c) Waste Management Policy d) Water Management Policy e) Heating and Cooling Policy f) Travel Policy g) Procurement Policy h) Space Management Policy i) University of Leicester Estates M&E Design Guide

37 | P a g e
Appendix 9 – Summary of the Carbon Emissions Reduction Plan
This is a live separate document. There are currently over 70 projects identified.
Actions
Predicted Annual Energy Savings (kWh)
Predicted Annual Energy Cost Savings (£)
Predicted Annual CO2 Saving (tonnes)
Percentage of Predicted Carbon Savings against Identified
Capital Programme Refurb (MSB and CWB) (estimated savings 20%) 3,105,818 - 2,200 22.04%
Decarbonisation of electricity grid (Estimated 10%) - - 1,625 16.28%
Oadby - CHP/Biomass Scheme - £ 21,697.00 1,348 13.50%
Capital receipt of residential estate (based on 2015-16 carbon emissions) 2,990,829 663 6.64%
Building management systems and optimisation of controls (2.5%) 564 5.65%
David Wilson Library LED Upgrade 1,104,000 £ 112,000.00 496 4.97%
Behaviour change (Estimated 2.5%) 406 4.07%
Outsourcing of Catering 1,949,000 £ 78,978.00 397 3.98%
Revise Air Change Rates within all Areas in CRF based on agreed Scope of Works 97,243 £ 32,559.00 253 2.54%
Henry Wellcome – Fume cupboards set back and automatic sash closers 1,072,960 £ 40,343.00 232 2.32%
Henry Wellcome – LED lighting upgrade 385,840 £ 41,941.00 201 2.01%
Adrian -AS AN EXAMPLE: Isolate and Remove the Rooftop Greenhouses 581,298 152 1.52%
Henry Wellcome – Voltage Optimisation 287,467 £ 31,248.00 150 1.50%
Improve Loading on Steam Boiler and Install Stam to LPHW Plate Heat Exchanger - CRF 276,140 £ 7,010.00 137 1.37%
Adrian - Replace Windows 511,042 £ 26,789.00 94 0.94%
Residential Plant Room Insulation - 2017/18 478,001 £ 9,560.02 88 0.88%
Non-Residential Plant Room Insulation -2017 419,431 £ 13,270.73 70 0.70%
George Porter – Windows Upgrade 344,416 £ 18,000.00 63 0.63%
George Porter - Replace Existing Fume Cupboards with Variables Air Volume (VAV) System 292,664 £ 15,294.00 63 0.63%
Owned travel fleet 62 0.62%

38 | P a g e
Michael Atiyah Sub-station - Voltage Reduction £ 10,679.00 51 0.51%
Adrian - Replace Perimeter Heat Emitters 262,500 £ 13,333.00 48 0.48%
CRF - PV 92,400 £ 14,500.00 46 0.46%
Bennett - Replace Heat Emitters 221,729 £ 11,299.00 41 0.41%
George Porter – Control Fume Cupboard Air-flow 174,678 £ 9,375.00 39 0.39%
Beaumont Hall – TRVs 202,214 £ 11,020.00 37 0.37%
Nixon Court Block J&K Pipe Insulation 187,773 £ 4,994.76 35 0.35%
Ken Edwards - Insulate Exposed Radiator Pipework and Fit TRV's 179,250 33 0.33%
Calorifier and TRV Install - Fraser Noble Building 176,093 £ 3,802.64 32 0.32%
MSB - Install 500m2 of Solar Photovoltaic (PV) Panels 60,000 £ 9,722.00 27 0.27%
Adrian AS AN EXAMPLE: Reduce Temperature Set-point in Greenhouses 131,214 24 0.24%
Charles Wilson - Replace Perimeter Heat Emitters 130,054 £ 6,750.00 24 0.24%
Bennett - Replace Existing Lecture Theatre Supply and Extract Ventilation Plant 113,669 £ 5,725.00 21 0.21%
Rocklands – TRVs 109,328 £ 5,958.00 20 0.20%
George Porter - Provide Individual Local Control to Fume Cupboards 87,407 20 0.20%
Archaeology – Windows Upgrade 100,491 £ 5,250.00 19 0.19%
Bredon, Clivedon, Manor Croft, Hastings House and The Knoll - TRVs 98,253 £ 5,406.00 18 0.18%
Archaeology - Upgrade Wall Insulation and Replace Heat Emitters 91,504 £ 4,050.00 17 0.17%
Ken Edwards - Insulate Roof 85,000 16 0.16%
Attenborough - Fit TRV's to Finned-Tube Heaters 72,347 £ 3,643.00 13 0.13%
Adrian - Fit Inverters to LTHW Distribution Pumps 29,484 £ 1,641.00 13 0.13%
Attenborough Tower and Seminar Block - Fit TRV's to Finned-Tube Heaters 72,347 £ 3,643.00 13 0.13%

39 | P a g e
Ken Edwards - Install Secondary Glazing 68,000 £ 3,500.00 13 0.13%
Henry Wellcome - Lighting controls presence detection to corridors and lux level meters to stairs
22,502 £ 2,446.00 12 0.12%
Ken Edwards - Cavity Wall Insulation 59,500 £ 2,900.00 11 0.11%
9,983 Table A9.1: List of Energy Reduction Projects