Embed Size (px)
Citation preview
HAL Id: hal-01829884https://hal.archives-ouvertes.fr/hal-01829884
Submitted on 4 Jul 2018
HAL is a multi-disciplinary open accessarchive for the deposit and dissemination of sci-entific research documents, whether they are pub-lished or not. The documents may come fromteaching and research institutions in France orabroad, or from public or private research centers.
L’archive ouverte pluridisciplinaire HAL, estdestinée au dépôt et à la diffusion de documentsscientifiques de niveau recherche, publiés ou non,émanant des établissements d’enseignement et derecherche français ou étrangers, des laboratoirespublics ou privés.
Carbon inputs of the Rhône River to the MediterraneanSea: Biogeochemical implications
Richard Sempere, Bruno Charrìère, France van Wambeke, Gustave Cauwet
To cite this version:Richard Sempere, Bruno Charrìère, France van Wambeke, Gustave Cauwet. Carbon inputs of theRhône River to the Mediterranean Sea: Biogeochemical implications. Global Biogeochemical Cycles,American Geophysical Union, 2000, 14 (2), pp.669-681. �10.1029/1999GB900069�. �hal-01829884�
GLOBAL BIOGEOCHEMICAL CYCLES, VOL. 14, NO. 2, PAGES 669-681, JUNE 2000
Carbon inputs of the Rhne River to the Mediterranean Sea: Biogeochemical implications
Richard Semp6r6, • Bruno Charribre, • France Van Wambeke,' and Gustave Cauwet -•
Abstract. Since the damming of the Nile, the Rh6ne River is the main freshwater and sediment supplier to the Mediterranean Sea. We estimated for the period 1987-1996, the dissolved and particulate organic carbon (DOC and POC), dissolved inorganic carbon (DIC), and total suspended matter (TSM) fluxes of the Rh6ne River to the Mediterranean Sea to be 1.1 + 0.2, 1.6 + 0.5, 16.2 + 0.3 x 10 •ø moles C yr '•, and 9.9 + 6.4 x 10⁶ t yr-1, respectively. PIC flux was estimated to be 8.2 + 5.4 x 10⁹ moles C yr '•. On the basis of literature data, we estimated that nearshore bacterial respiration of Rh6ne derived labile-POC and-DOC (LPOC and LDOC) might produce in a few days -0.21 and 0.12 x 10 •ø moles CO2 yr '•, respectively. Extended to the whole Mediterranean, this study suggests that bacterial respiration of labile organic carbon derived from Mediterranean rivers might rapidly (days) produce 2.6-11 x 10 •ø moles CO2 yr -•. On the continental shelf, up to 4.7 x 10 •ø moles of organic carbon introduced by primary production and Rh6ne export would escape each year to sedimentation and bacterial mineralization and would be exported off the shelf. Moreover, as total carbon fixed by phytoplankton exceeds (+ 5.2 x 10 •ø moles C yr '•) the CO2 produced by bacterial respiration (on average), the biological system on the shelf, could be considered as an autotrophic system and then a sink for atmospheric CO2. However, these numbers need further examination because of the large uncertainties associated currently to the bacterial growth efficiency values (ñ 100%).
1. Introduction
Among fluxes, river inputs of carbon to the ocean are of interest because atmospheric/soil CO2 is consumed both by primary producers and chemical rock weathering before being transferred as inorganic [Berner et al., 1983; Berner, 1990; Meybeck, 1987; Probst et al., 1994; Ludwig et al., 1996a] and organic carbon to the oceans [Meybeck, 1982; Ittekot, 1988; Ludwig et al., 1996b]. In addition, riverinc inputs are unidirectional fluxes and are affected by numerous natural factors such as precipitations, morphology, and mean temperature [Miller and Russel, 1992; Ludwig et al., 1996b; Clair and Ehrman, 1996; Justic et al., 1996] as well as by anthropogenic factors such as land uses [Kao and Liu, 1996; 1997]. Moreover, river inputs play a significant role on water quality and fisheries production of the coastal zone which accounts for 10% of global oceanic primary production [Smith and Hollibaugh, 1993]. However, the material carried by the rivers undergoes reactions and modifications during transport such as aggregation [Sholkovitz, 1976] and transformations due to bacterial metabolism [Richey et al., 1980;
•Laboratoire de Microbiologic Marine, CNRS/1NSU EP 2032, Campus de Luminy, Universit6 de la M6diterran6e, Marseille, France.
2Centre de Formation et de Recherche sur l'Environnement Marin, CNRS/1NSU ERS 1745, Perpignan, France.
3Laboratoire d'Oc6anographie Biologique, UMR 7621, Laboratoire Arago, Banyuls sur mer, France.
Copyright 2000 by the American Geophysical Union.
Paper number 1999GB900069 0886-6236/00/19999GB900069512.00
Ittekot, 1988; Amon and Benner, 1996] which make carbon fluxes difficult to estimate accurately for regions where no measurements exist.
Freshwater inputs play a major role in the Mediterranean Sea since they enhance significantly the primary productivity [Cruzado and Velasquez, 1990] and play a major role in the balance of water inputs through the Strait of Gibraltar [Bryden and Kinder, 1988; Copin-Montdgut, 1993; Bray et al., 1995]. The net inflow through the Strait ranges from 1400 to 2400 km 3 yr-1 [Bryden and Kinder, 1988], whereas those fromm the Black Sea through the Bosphorus and Dardanelles is 300 km 3 yr-1 [Onliiata et al., 1990]. The discharge of rivers into the Mediterranean Sea averages 505 km3 yr-1 [Margat, 1992]. An accurate determination of the sources and sinks of carbon is still necessary to assess more accurately the carbon cycle in the Mediterranean Sea [Copin-Montdgut, 1993]. Since the damming of the Nile, the Rh6ne River is the major source of fresh water and terrigenous particles to the Mediterranean basin [Margat, 1992]. However, only few reports address the DOC input [Cauwet et al., 1990; Kempe et al., 1993; Sempdrd and Cauwet, 1993], and there are no published data of measured Rh6ne total organic carbon (TOC) including POC and DOC as well as DIC fluxes to the Mediterranean Sea that encompass a complete hydrological year.
Here we report results from a one-year time series (June 1994 to May 1995) which assesses, for the first time, temporal patterns in the DOC, POC, TSM, and DIC loads of the Rh6ne River. Using these data, we estimated carbon fluxes by the Rh6ne River into the Mediterranean Sea during this period. After linear regressions, these fluxes were extended to 10-year average annual fluxes, we finally propose an estimate of the average input of these variables to the Mediterranean Sea.
669
670 SEMP•R• ET AL.: CARBON INPUTS OF THE RHONE RIVER
30'
30'
30' 3 ø 30' 4 ø 30' 5 ø 30' 6 ø
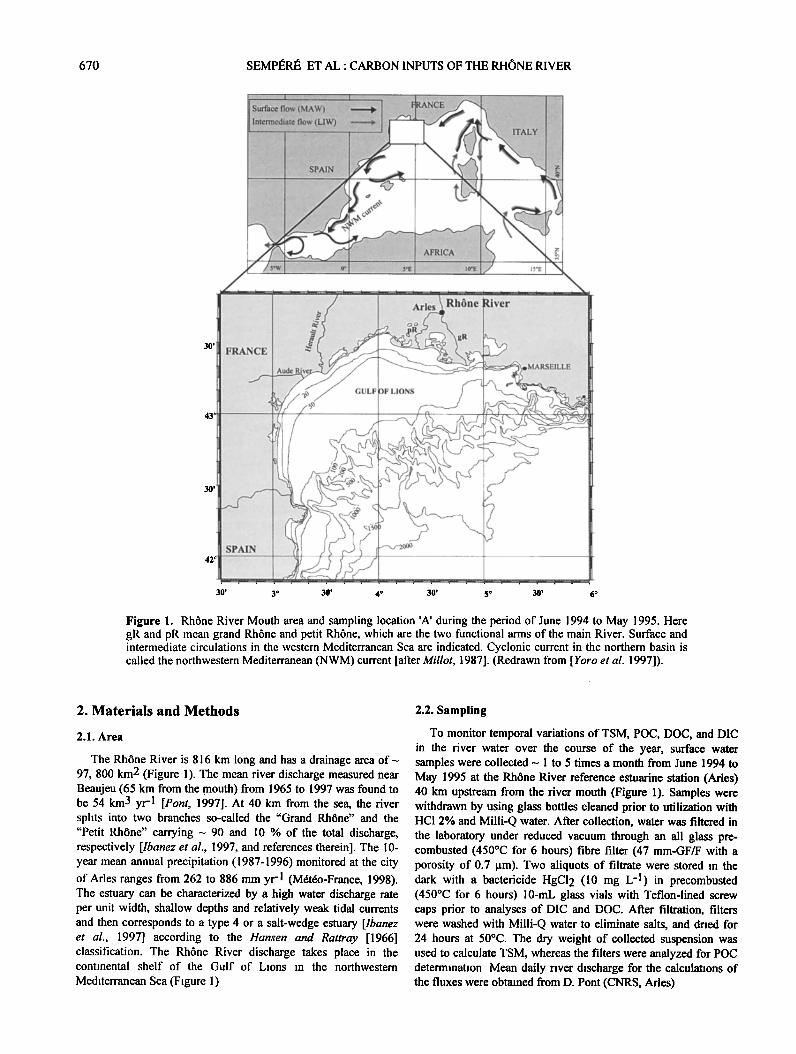
Figure 1. Rh6ne River Mouth area and sampling location 'A' during the period of June 1994 to May 1995. Here gR and pR mean grand Rh6ne and petit Rh6ne, which are the two functional arms of the main River. Surface and intermediate circulations in the western Mediterranean Sea are indicated. Cyclonic current in the northern basin is called the northwestern Mediterranean (NWM) current [after Millot, 1987]. (Redrawn from [Yoro et al. 1997]).
2. Materials and Methods
2.1. Area
The Rh6ne River is 816 km long and has a drainage area of • 97, 800 km 2 (Figure 1). The mean river discharge measured near Beaujeu (65 km from the mouth) from 1965 to 1997 was found to be 54 km 3 yr -1 [Pont, 1997]. At 40 km from the sea, the river splits into two branches so-called the "Grand Rh6ne" and the "Petit Rh6ne" carrying • 90 and 10 % of the total discharge, respectively [Ibanez et al., 1997, and references therein]. The 10- year mean annual precipitation (1987-1996) monitored at the city of Aries ranges from 262 to 886 mm yr-1 (M6t6o-France, 1998). The estuary can be characterized by a high water discharge rate per unit width, shallow depths and relatively weak tidal currents and then corresponds to a type 4 or a salt-wedge estuary [Ibanez et al., 1997] according to the Hansen and Rattray [1966] classification. The Rh6ne River discharge takes place in the continental shelf of the Gulf of Lions in the northwestern
Mediterranean Sea (Figure 1).
2.2. Sampling
To monitor temporal variations of TSM, POC, DOC, and DIC in the river water over the course of the year, surface water samples were collected -• I to 5 times a month from June 1994 to May 1995 at the Rh6ne River reference estuarine station (Aries) 40 km upstream from the river mouth (Figure 1). Samples were withdrawn by using glass bottles cleaned prior to utilization with HCI 2% and Milli-Q water. After collection, water was filtered in the laboratory under reduced vacuum through an all glass pre- combusted (450øC for 6 hours) fibre filter (47 mm-GF/F with a porosity of 0.7 lam). Two aliquots of flitrate were stored in the dark with a bactericide HgCI2 (10 mg L -l) in precombusted (450øC for 6 hours) 10-mL glass vials with Teflon-lined screw caps prior to analyses of DIC and DOC. After filtration, filters were washed with Milli-Q water to eliminate salts, and dried for 24 hours at 50øC. The dry weight of collected suspension was used to calculate TSM, whereas the filters were analyzed for POC determination. Mean daily river discharge for the calculations of the fluxes were obtained from D. Pont (CNRS, Aries).
SEMPI•RI• ET AL.' CARBON INPUTS OF THE RH(SNE RIVER 671
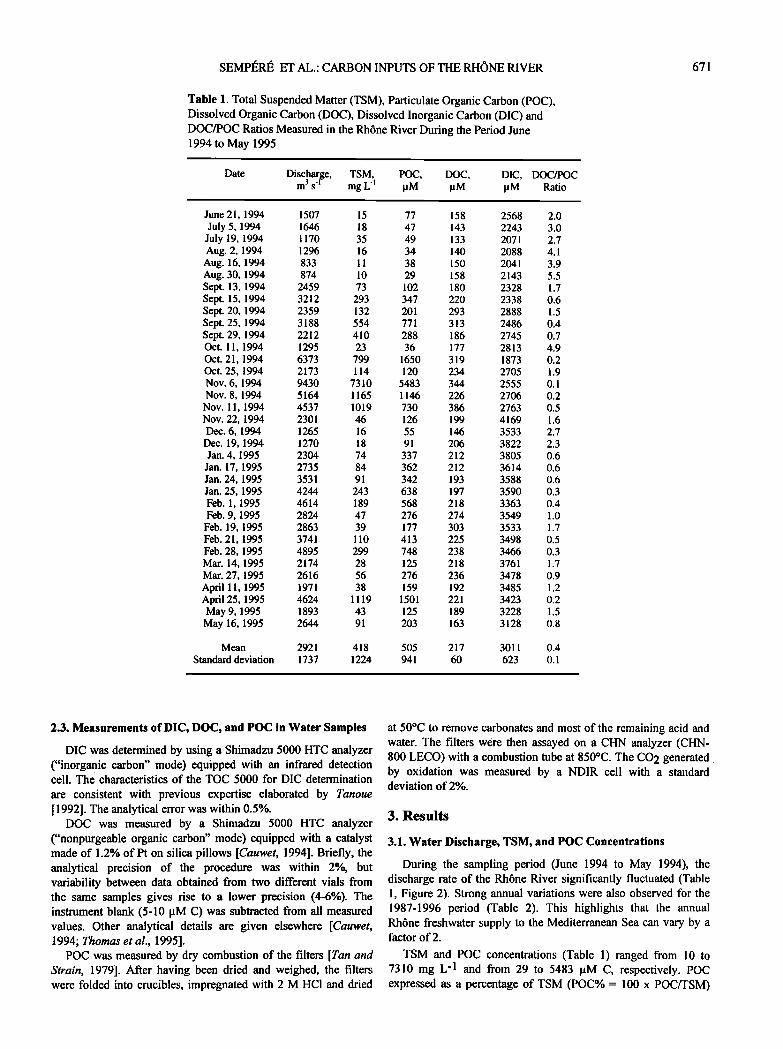
Table 1. Total Suspended Matter (TSM), Particulate Organic Carbon (POC), Dissolved Organic Carbon (DOC), Dissolved Inorganic Carbon (DIC) and DOC/POC Ratios Measured in the Rh6ne River During the Period June 1994 to May 1995
Date Discharge, TSM, POC, DOC, DIC, DOC/POC m 3 s 'r mg L '• •M •M •M Ratio
June 21,1994 1507 15 77 158 2568 2.0 July 5,1994 1646 18 47 143 2243 3.0 July 19,1994 1170 35 49 133 2071 2.7 Aug. 2,1994 1296 16 34 140 2088 4.1 Aug. 16,1994 833 11 38 150 2041 3.9 Aug. 30,1994 874 10 29 158 2143 5.5 Sept. 13,1994 2459 73 102 180 2328 1.7 Sept. 15,1994 3212 293 347 220 2338 0.6 Sept. 20,1994 2359 132 201 293 2888 1.5 Sept. 25,1994 3188 554 771 313 2486 0.4 Sept. 29,1994 2212 410 288 186 2745 0.7 Oct. 11,1994 1295 23 36 177 2813 4.9 Oct. 21,1994 6373 799 1650 319 1873 0.2 Oct. 25,1994 2173 114 120 234 2705 1.9 Nov. 6,1994 9430 7310 5483 344 2555 0.1 Nov. 8,1994 5164 1165 1146 226 2706 0.2
Nov. 11,1994 4537 1019 730 386 2763 0.5 Nov. 22,1994 2301 46 126 199 4169 1.6 Dec. 6,1994 1265 16 55 146 3533 2.7
Dec. 19,1994 1270 18 91 206 3822 2.3 Jan. 4,1995 2304 74 337 212 3805 0.6
Jan. 17,1995 2735 84 362 212 3614 0.6 Jan. 24,1995 3531 91 342 193 3588 0.6 Jan. 25,1995 4244 243 638 197 3590 0.3 Feb. l, 1995 4614 189 568 218 3363 0.4 Feb. 9,1995 2824 47 276 274 3549 1.0
Feb. 19,1995 2863 39 177 303 3533 1.7 Feb. 21,1995 3741 110 413 225 3498 0.5 Feb. 28,1995 4895 299 748 238 3466 0.3 Mar. 14,1995 2174 28 125 218 3761 1.7 Mar. 27,1995 2616 56 276 236 3478 0.9 Apfilll, 1995 1971 38 159 192 3485 1.2 April25,1995 4624 1119 1501 221 3423 0.2 May 9, 1995 1893 43 125 189 3228 1.5 May 16, 1995 2644 91 203 163 3128 0.8
Mean 2921 418 505 217 3011 0.4
Standard deviation 1737 1224 941 60 623 0.1
2.3. Measurements of DIC, DOC, and POC in Water Samples
DIC was determined by using a Shimadzu 5000 HTC analyzer ("inorganic carbon" mode) equipped with an infrared detection cell. The characteristics of the TOC 5000 for DIC determination
are consistent with previous expertise elaborated by Tanoue [ 1992]. The analytical error was within 0.5%.
DOC was measured by a Shimadzu 5000 HTC analyzer ("nonpurgeable organic carbon" mode) equipped with a catalyst made of 1.2% of Pt on silica pillows [Cauwet, 1994]. Briefly, the analytical precision of the procedure was within 2%, but variability between data obtained from two different vials from the same samples gives rise to a lower precision (4-6%). The instrument blank (5-10 [tM C) was subtracted from all measured values. Other analytical details are given elsewhere [Cauwet, 1994; Thomas et al., 1995].
POC was measured by dry combustion of the filters [Tan and Strain, 1979]. After having been dried and weighed, the filters were folded into crucibles, impregnated with 2 M HCI and dried
at 50øC to remove carbonates and most of the remaining acid and water. The filters were then assayed on a CHN analyzer (CHN- 800 LECO) with a combustion tube at 850øC. The CO 2 generated by oxidation was measured by a NDIR cell with a standard deviation of 2%.
3. Results
3.1. Water Discharge, TSM, and POC Concentrations
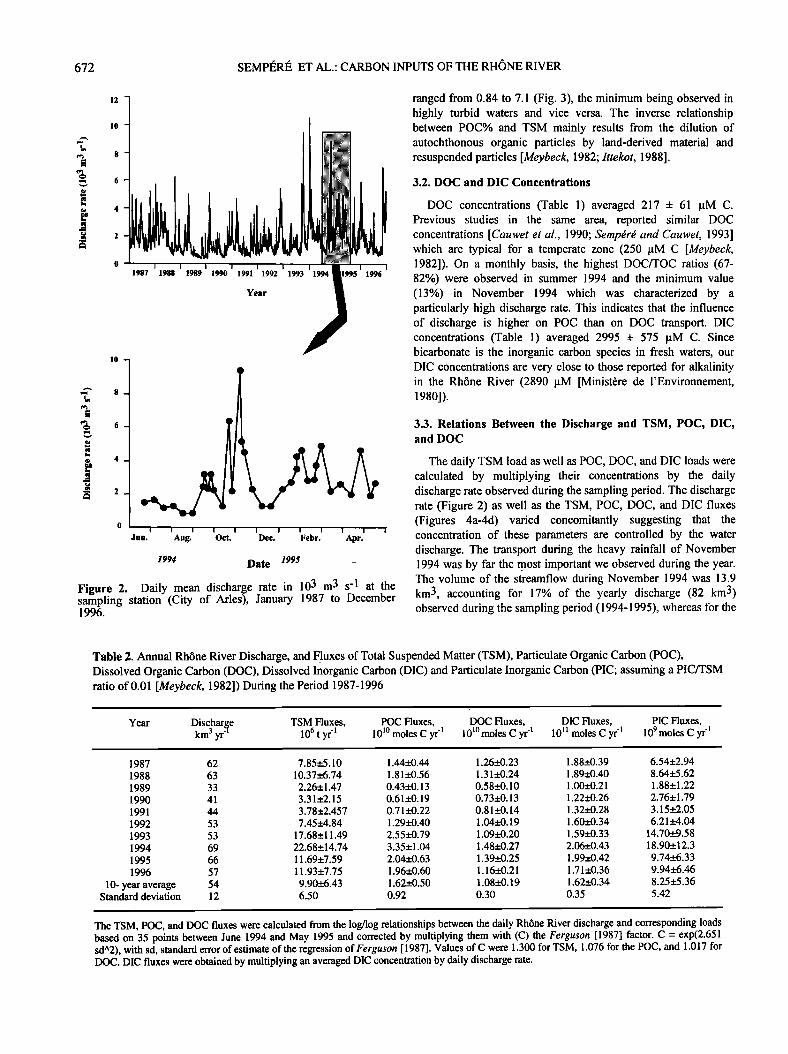
During the sampling period (June 1994 to May 1994), the discharge rate of the Rh6ne River significantly fluctuated (Table 1, Figure 2). Strong annual variations were also observed for the 1987-1996 period (Table 2). This highlights that the annual Rh6ne freshwater supply to the Mediterranean Sea can vary by a factor of 2.
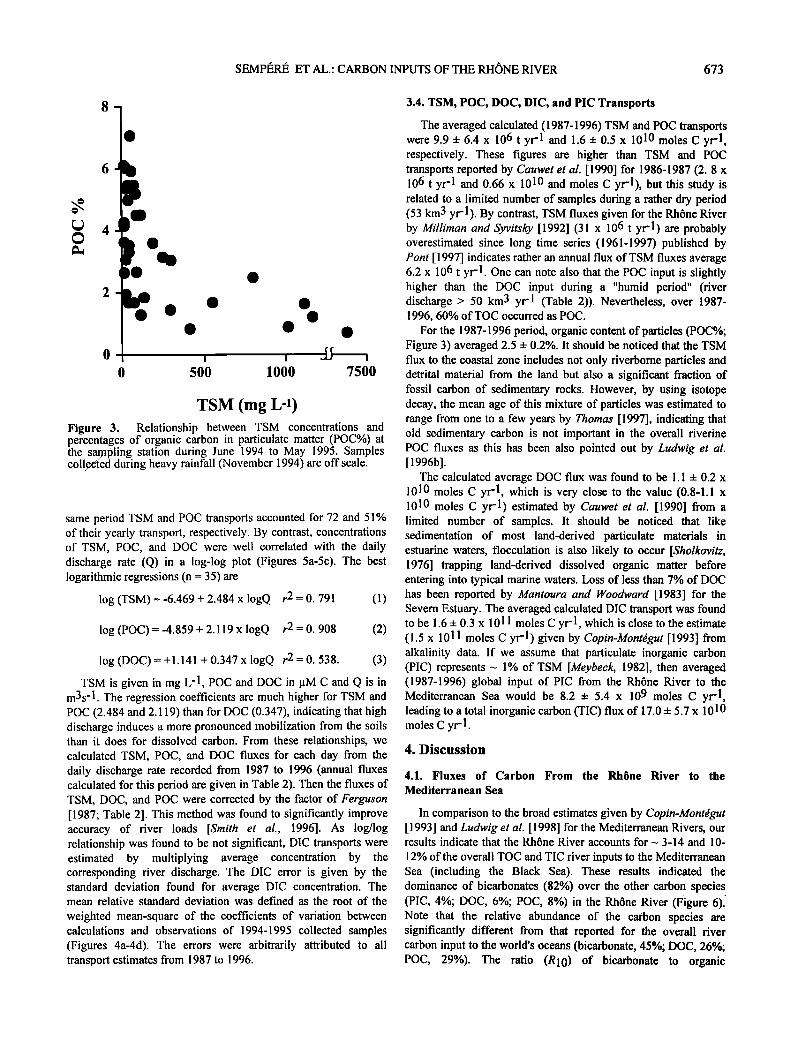
TSM and POC concentrations (Table 1) ranged from 10 to 7310 mg L -1 and from 29 to 5483 pM C, respectively. POC expressed as a percentage of TSM (POC%- 100 x POC/TSM)
672 SEMPI•R• ET AL.: CARBON INPUTS OF THE RHONE RIVER
I I I
1987 1988 1989 1990 1991 1992 1993 1994 1995 1996
Year
10-
"' 8
i
I I I I I
Jun. Aug. Oct.
1994
I I I I I I I
Dec. Febr. Apr.
Date 1995
Figure 2. Daily mean discharge rate in 103 m 3 s -l at the sampling station (City of Aries), January 1987 to December 1996.
ranged from 0.84 to 7.1 (Fig. 3), the minimum being observed in highly turbid waters and vice versa. The inverse relationship between POC% and TSM mainly results from the dilution of autochthonous organic particles by land-derived material and resuspended particles [Meybeck, 1982; Ittekot, 1988].
3.2. DOC and DIC Concentrations
DOC concentrations (Table 1) averaged 217 ñ 61 [tM C. Previous studies in the same area, reported similar DOC concentrations [Cauwet et al., 1990; Sempdrd and Cauwet, 1993] which are typical for a temperate zone (250 laM C [Meybeck, 1982]). On a monthly basis, the highest DOC/TOC ratios (67- 82%) were observed in summer 1994 and the minimum value (13%) in November 1994 which was characterized by a particularly high discharge rate. This indicates that the influence of discharge is higher on POC than on DOC transport. DIC concentrations (Table 1) averaged 2995 ñ 575 laM C. Since bicarbonate is the inorganic carbon species in fresh waters, our DIC concentrations are very close to those reported for alkalinity in the Rhbne River (2890 laM [Minisif:re de l'Environnement, 1980]).
3.3. Relations Between the Discharge and TSM, POC, DIC, and DOC
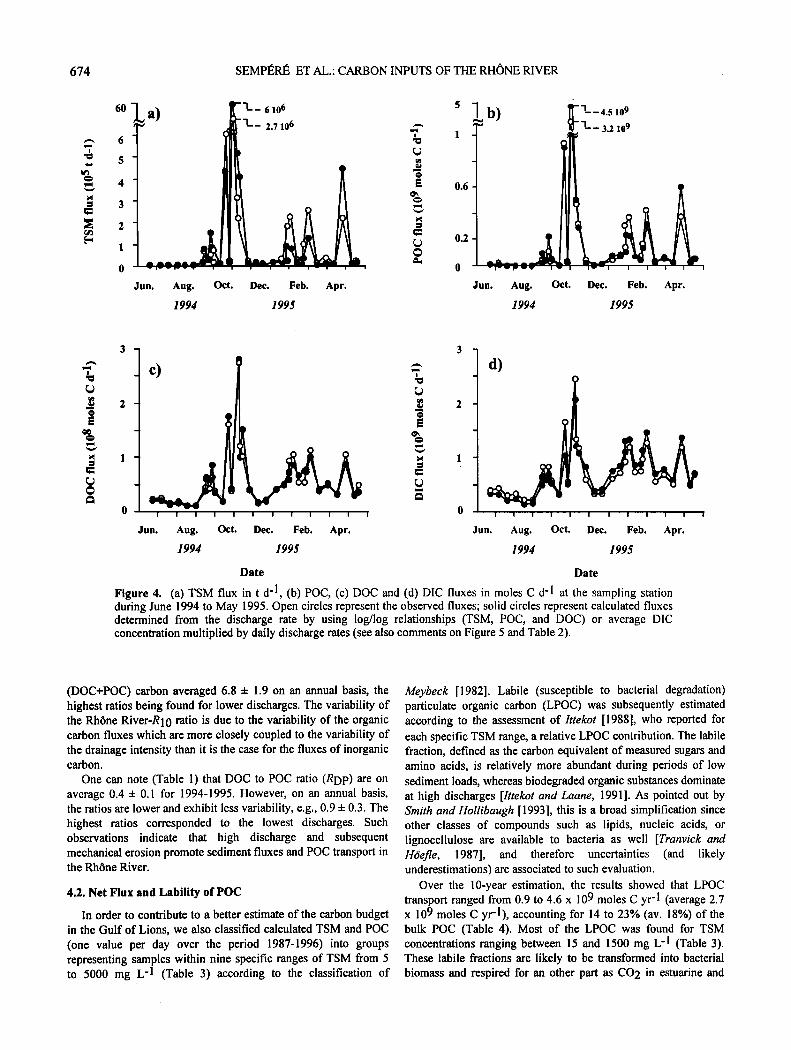
The daily TSM load as well as POC, DOC, and DIC loads were calculated by multiplying their concentrations by the daily discharge rate observed during the sampling period. The discharge rate (Figure 2) as well as the TSM, POC, DOC, and DIC fluxes (Figures 4a-4d) varied concomitantly suggesting that the concentration of these parameters are controlled by the water discharge. The transport during the heavy rainfall of November 1994 was by far the most important we observed during the year. The volume of the streamflow during November 1994 was 13.9 km3, accounting for 17% of the yearly discharge (82 km3) observed during the sampling period (1994-1995), whereas for the
Table 2. Annual Rh6ne River Discharge, and Fluxes of Total Suspended Matter (TSM), Particulate Organic Carbon (POC), Dissolved Organic Carbon (DOC), Dissolved Inorganic Carbon (DIC) and Particulate Inorganic Carbon (PIC; assuming a PIC/TSM ratio of 0.01 [Meybeck, 1982]) During the Period 1987-1996
Year Discharge TSM Huxes, POC Huxes, DOC Huxes, DIC Huxes, PIC Huxes, km 3 yr 4 106 t yr -1 10 •ø moles C yr 'l 10 •ø moles C yr 'l 10 •l moles C yr -• 10 9 moles C yr 'l
1987 62 7.85-+5.10 1.44-+0.44 1.26-+0.23 1.88-+0.39 6.54-+2.94 1988 63 10.37 -+6.74 1.81 -+0.56 1.31 -+0.24 1.89+_0.40 8.64-+5.62 1989 33 2.26-+ 1.47 0.43-+0.13 0.58-+0.10 1.00-+0.21 1.88-+ 1.22 1990 41 3.31-+2.15 0.61_+0.19 0.73-+0.13 1.22-+0.26 2.76-+ 1.79 1991 44 3.78-+2.457 0.71-+0.22 0.81_+0.14 1.32-+0.28 3.15-+2.05 1992 53 7.45-+4.84 1.29-+0.40 1.04_+0.19 1.60-+0.34 6.21-+4.04 1993 53 17.68-+ 11.49 2.55_+0.79 1.09-+0.20 1.59_+0.33 14.70-+9.58 1994 69 22.68-+14.74 3.35-+ 1.04 1.48-+0.27 2.06-+0.43 18.90-+ 12.3 1995 66 11.69-+7.59 2.04-+0.63 1.39-+0.25 1.99-+0.42 9.74_+6.33 1996 57 11.93_+7.75 1.96_+0.60 1.16-+0.21 1.71_+0.36 9.94_+6.46
10- year average 54 9.90-+6.43 1.62-+0.50 1.08+0.19 1.62-+0.34 8.25+5.36 Standard deviation 12 6.50 0.92 0.30 0.35 5.42
The TSM, POC, and DOC fluxes were calculated from the log/log relationships between the daily Rh6ne River discharge and corresponding loads based on 35 points between June 1994 and May 1995 and corrected by multiplying them with (C) the Ferguson [1987] factor. C = exp(2.651 sd^2), with sd, standard error of estimate of the regression of Ferguson [1987]. Values of C were 1.300 for TSM, 1.076 for the POC, and 1.017 for DOC. DIC fluxes were obtained by multiplying an averaged DIC concentration by daily discharge rate.
SEMPI•RI• ET AL.' CARBON INPUTS OF THE RH•)NE RIVER 673
8
6
0 I 0 500 1000 7500
TSM (mg L-l) Figure 3. Relationship between TSM concentrations and percentages of organic carbon in particulate matter (POC%) at the sampling station during June 1994 to May 1995. Samples collceted during heavy rainfall (November 1994) are off scale.
same period TSM and POC transports accounted for 72 and 51% of their yearly transport, respectively. By contrast, concentrations of TSM, POC, and DOC were well correlated with the daily discharge rate (Q) in a log-log plot (Figures 5a-5c). The best logarithmic regressions (n = 35) are
log (TSM) = -6.469 + 2.484 x 1ogQ r 2 = 0. 791 (1)
log (POC) = -4.859 + 2.119 x 1ogQ r 2 = 0. 908 (2)
log(DOC)=+l.141 +0.347xlogQ r2=0. 538. (3)
TSM is given in mg L -1, POC and DOC in [tM C and Q is in m3s -1. The regression coefficients are much higher for TSM and POC (2.484 and 2.119) than for DOC (0.347), indicating that high discharge induces a more pronounced mobilization from the soils than it does for dissolved carbon. From these relationships, we calculated TSM, POC, and DOC fluxes for each day from the daily discharge rate recorded from 1987 to 1996 (annual fluxes calculated for this period are given in Table 2). Then the fluxes of TSM, DOC, and POC were corrected by the factor of Ferguson [1987; Table 2]. This method was found to significantly improve accuracy of river loads [Smith et al., 1996]. As log/log relationship was found to be not significant, DIC transports were estimated by multiplying average concentration by the corresponding river discharge. The DIC error is given by the standard deviation found for average DIC concentration. The mean relative standard deviation was defined as the root of the
weighted mean-square of the coefficients of variation between calculations and observations of 1994-1995 collected samples (Figures 4a-4d). The errors were arbitrarily attributed to all transport estimates from 1987 to 1996.
3.4. TSM, POC, DOC, DIC, and PIC Transports
The averaged calculated (1987-1996) TSM and POC transports were 9.9 + 6.4 x 10⁶ t yr -1 and 1.6 + 0.5 x 10¹⁰ moles C yr -1, respectively. These figures are higher than TSM and POC transports reported by Cauwet et al. [1990] for 1986-1987 (2. 8 x 10⁶ t yr-I and 0.66 x 10¹⁰ and moles C yr-l), but this study is related to a limited number of samples during a rather dry period (53 km3 yr-l). By contrast, TSM fluxes given for the Rh6ne River by Milliman and Syvitsky [1992] (31 x 106 t yr-1) are probably overestimated since long time series (1961-1997) published by Pont [1997] indicates rather an annual flux of TSM fluxes average 6.2 x 10⁶ t yr-1. One can note also that the POC input is slightly higher than the DOC input during a "humid period" (river discharge > 50 km3 yr-I (Table 2)). Nevertheless, over 1987- 1996, 60% of TOC occurred as POC.
For the 1987-1996 period, organic content of particles (POC%; Figure 3) averaged 2.5 + 0.2%. It should be noticed that the TSM flux to the coastal zone includes not only riverbome particles and detrital material from the land but also a significant fraction of fossil carbon of sedimentary rocks. However, by using isotope decay, the mean age of this mixture of particles was estimated to range from one to a few years by Thomas [1997], indicating that old sedimentary carbon is not important in the overall riverine POC fluxes as this has been also pointed out by Ludwig et al. [1996b].
The calculated average DOC flux was found to be 1.1 + 0.2 x 10¹⁰ moles C yr-l, which is very close to the value (0.8-1.1 x 10¹⁰ moles C yr-l) estimated by Cauwet et al. [1990] from a limited number of samples. It should be noticed that like sedimentation of most land-derived particulate materials in estuarine waters, flocculation is also likely to occur [Sholkovitz, 1976] trapping land-derived dissolved organic matter before entering into typical marine waters. Loss of less than 7% of DOC has been reported by Mantoura and Woodward [1983] for the Severn Estuary. The averaged calculated DIC transport was found to be 1.6 + 0.3 x 10¹¹ moles C yr '1, which is close to the estimate (1.5 x 10¹¹ moles C yr- 1) given by Copin-Montdgut [ 1993 ] from alkalinity data. If we assume that particulate inorganic carbon (PIC) represents - 1% of TSM [Meybeck, 1982], then averaged (1987-1996) global input of PIC from the Rh6ne River to the Mediterranean Sea would be 8.2 q- 5.4 x 10⁹ moles C yr -1, leading to a total inorganic carbon (TIC) flux of 17.0 q- 5.7 x 10¹⁰ moles C yr-1.
4. Discussion
4.1. Fluxes of Carbon From the RhSne River to the
Mediterranean Sea
In comparison to the broad estimates given by Copin-Montdgut [1993] and Ludwig et al. [ 1998] for the Mediterranean Rivers, our results indicate that the Rh6ne River accounts for- 3-14 and 10-
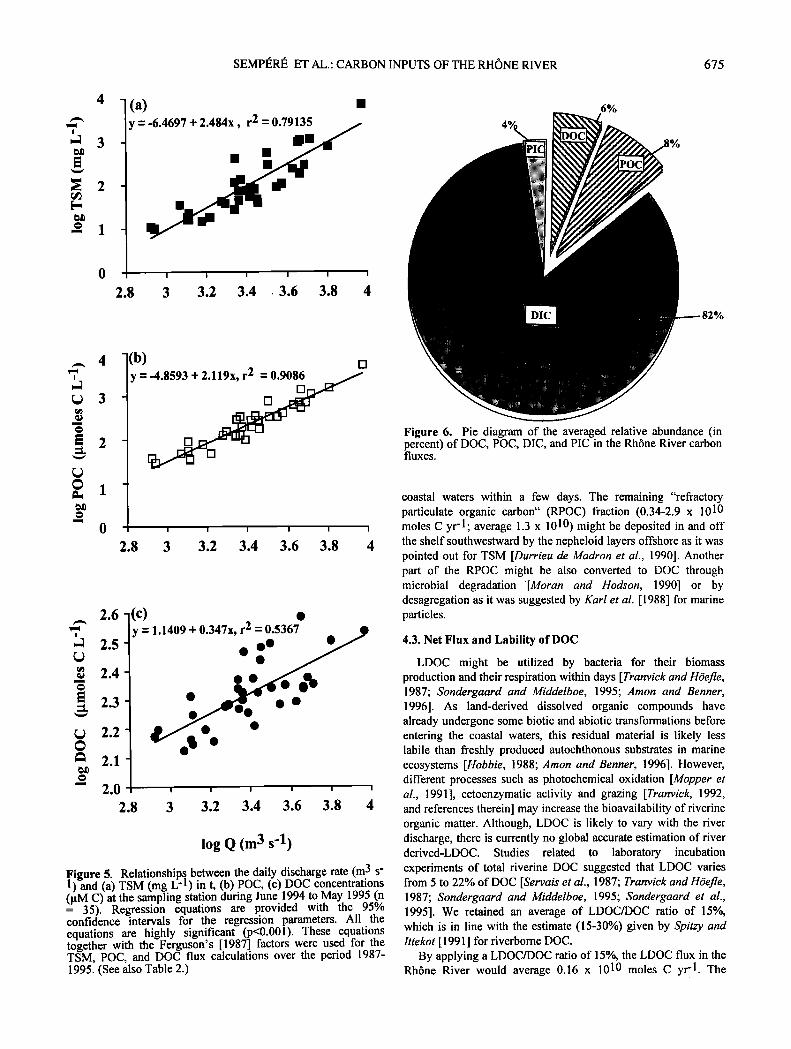
12% of the overall TOC and TIC river inputs to the Mediterranean Sea (including the Black Sea). These results indicated the dominance of bicarbonates (82%) over the other carbon species (PIC, 4%; DOC, 6%; POC, 8%) in the Rh6ne River (Figure 6). Note that the relative abundance of the carbon species are significantly different from that reported for the overall river carbon input to the world's oceans (bicarbonate, 45%; DOC, 26%; POC, 29%). The ratio (RI0) of bicarbonate to organic
674 SEMPI•R]• ET AL.: CARBON INPUTS OF THE RHONE RIVER
60 .,a)
5 -
4 -
Jun. Aug. Oct.
3__ 6106
•--- 2.7106
, -- , ,
Dec. Feb. Apr.
5 • •-- 4.5109 •--- 3.2 109 1
0.6
0.2
0 - -?-©• - -- ,
1994 1995
Jun. Aug. Oct. Dec. Feb. Apr.
1994 1995
3 -
2 -
1 -
c)
I I I I I I I I I I I
Jun. Aug. Oct. Dec. Feb. Apr.
1994 1995
3 -
2 -
1 -
d)
0 I I I I I I I I I I I
Jun. Aug. Oct. Dec. Feb. Apr.
1994 1995
Date Date
Figure 4. (a) TSM flux in t d -l, (b) POC, (c) DOC and (d) DIC fluxes in moles C d -1 at the sampling station during June 1994 to May 1995. Open circles represent the observed fluxes; solid circles represent calculated fluxes determined from the discharge rate by using log/log relationships (TSM, POC, and DOC) or average DIC concentration multiplied by daily discharge rates (see also comments on Figure 5 and Table 2).
(DOC+POC) carbon averaged 6.8 + 1.9 on an annual basis, the highest ratios being found for lower discharges. The variability of the Rh6ne River-Rl 0 ratio is due to the variability of the organic carbon fluxes which are more closely coupled to the variability of the drainage intensity than it is the case for the fluxes of inorganic carbon.
One can note (Table l) that DOC to POC ratio (RDp) are on average 0.4 + 0.1 for 1994-1995. However, on an annual basis, the ratios are lower and exhibit less variability, e.g., 0.9 + 0.3. The highest ratios corresponded to the lowest discharges. Such observations indicate that high discharge and subsequent mechanical erosion promote sediment fluxes and POC transport in the Rh6ne River.
4.2. Net Flux and Lability of POC
In order to contribute to a better estimate of the carbon budget in the Gulf of Lions, we also classified calculated TSM and POC (one value per day over the period 1987-1996) into groups representing samples within nine specific ranges of TSM from 5 to 5000 mg L -1 (Table 3) according to the classification of
Meybeck [1982]. Labile (susceptible to bacterial degradation) particulate organic carbon (LPOC) was subsequently estimated according to the assessment of Ittekot [1988], who reported for each specific TSM range, a relative LPOC contribution. The labile fraction, defined as the carbon equivalent of measured sugars and amino acids, is relatively more abundant during periods of low sediment loads, whereas biodegraded organic substances dominate at high discharges [Ittekot and Laane, 1991]. As pointed out by Smith and Hollibaugh [1993], this is a broad simplification since other classes of compounds such as lipids, nucleic acids, or lignocellulose are available to bacteria as well [Tranvick and HOefie, 1987], and therefore uncertainties (and likely underestimations) are associated to such evaluation.
Over the 10-year estimation, the results showed that LPOC transport ranged from 0.9 to 4.6 x 10⁹ moles C yr -1 (average 2.7 x 10⁹ moles C yr- 1), accounting for 14 to 23% (av. 18%) of the bulk POC (Table 4). Most of the LPOC was found for TSM concentrations ranging between 15 and 1500 mg L -1 (Table 3). These labile fractions are likely to be transformed into bacterial biomass and respired for an other part as CO2 in estuarine and
SEMPI•R• ET AL.' CARBON INPUTS OF THE RH(SNE RIVER 675
_ (a) y = -6.4697 + 2.484x, r 2 = 0.79135
I I I I I I
2.8 3 3.2 3.4 3.6 3.8 4
6%
82%
(b)
y = -4.8593 + 2.119x, r 2 = 0.9086
I I I I I
2.8 3 3.2 3.4 3.6 3.8 4
2.6 -(c)
2.5-
2.4
2.3
2.2 2.1'
2.0 2.8
y = 1.1409 + 0.347x, r 2 = 0.5367
"• el ß
I I I I I I
3 3.2 3.4 3.6 3.8 4
log Q (m 3 s 'l)
Figure 5. Relationships. between the daily discharge rate (m 3 s- 1) and (a) TSM (mg L -•) in t, (b) POC, (c) DOC concentrations ([tM C) at the sampling station during June 1994 to May 1995 (n = 35). Regression equations are provided with the 95% confidence intervals for the regression parameters. All the equations are highly significant (p<0.001). These equations together with the Ferguson's [1987] factors were used for the TSM, POC, and DOC flux calculations over the period 1987- 1995. (See also Table 2.)
Figure 6. Pie diagram of the averaged relative abundance (in percent) of DOC, POC, DIC, and PIC in the Rh6ne River carbon fluxes.
coastal waters within a few days. The remaining "refractory particulate organic carbon" (RPOC) fraction (0.34-2.9 x 10¹⁰ moles C yr-1; average 1.3 x 10¹⁰) might be deposited in and off the shelf southwestward by the nepheloid layers offshore as it was pointed out for TSM [Durrieu de Madton et al., 1990]. Another part of the RPOC might be also converted to DOC through microbial degradation '[Moran and Hodson, 1990] or by desagregation as it was suggested by Karl et al. [1988] for marine particles.
4.3. Net Flux and Lability of DOC
LDOC might be utilized by bacteria for their biomass production and their respiration within days [Tranvick and HOefie, 1987; Sondergaard and Middelboe, 1995; Arnon and Bennet, 1996]. As land-derived dissolved organic compounds have already undergone some biotic and abiotic transformations before entering the coastal waters, this residual material is likely less labile than freshly produced autochthonous substrates in marine ecosystems [Hobbie, 1988; Arnon and Bennet, 1996]. However, different processes such as photochemical oxidation [Moppet et al., 1991 ], ectoenzymatic activity and grazing [Tranvick, 1992, and references therein] may increase the bioavailability of riverine organic matter. Although, LDOC is likely to vary with the river discharge, there is currently no global accurate estimation of river derived-LDOC. Studies related to laboratory incubation experiments of total riverine DOC suggested that LDOC varies from 5 to 22% of DOC [Servais et al., 1987; Tranvick and HOefie, 1987; Sondergaard and Middelboe, 1995; Sondergaard et al., 1995]. We retained an average of LDOC/DOC ratio of 15%, which is in line with the estimate (15-30%) given by Spitzy and Ittekot [ 1991 ] for riverborne DOC.
By applying a LDOC/DOC ratio of 15%, the LDOC flux in the Rh6ne River would average 0.16 x 10¹⁰ moles C yr-I The
676 SEMPI•RI• ET AL.' CARBON INPUTS OF THE RHONE RIVER
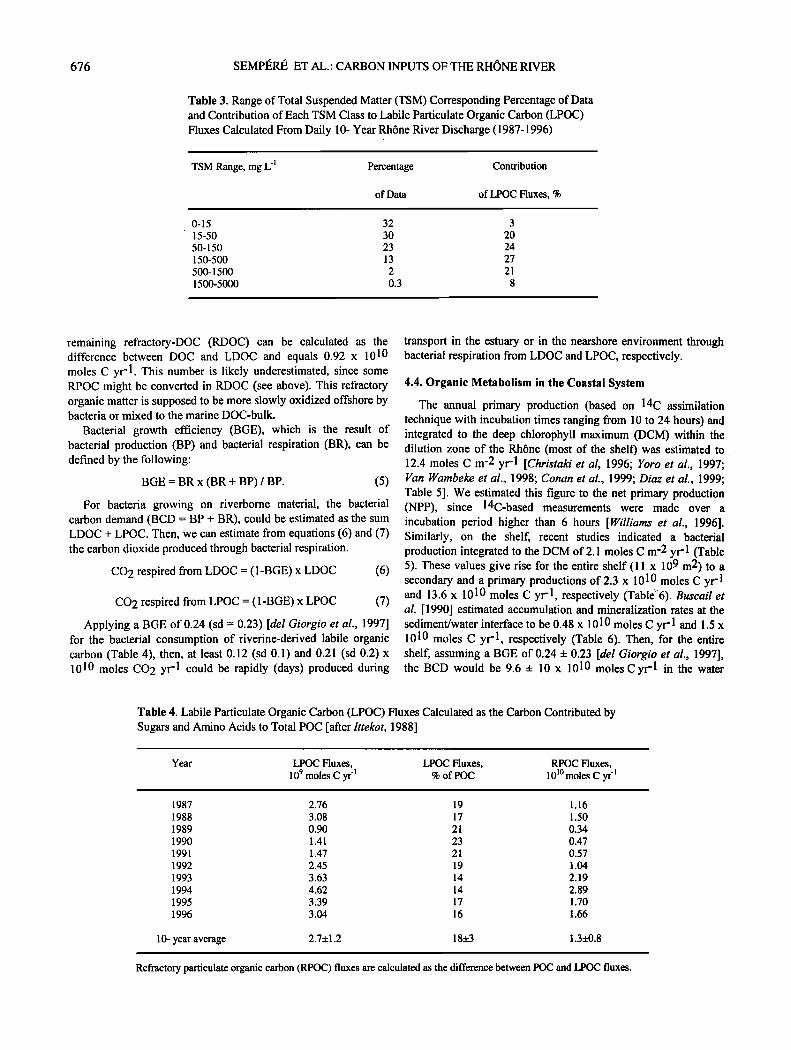
Table 3. Range of Total Suspended Matter (TSM) Corresponding Percentage of Data and Contribution of Each TSM Class to Labile Particulate Organic Carbon (LPOC) Fluxes Calculated From Daily 10- Year Rh6ne River Discharge (1987-1996)
TSM Range, mg L '• Percentage Contribution
of Data of LPOC Fluxes, %
0-15 32 3 15-50 30 20 50-150 23 24 150-500 13 27 500-1500 2 21 1500-5000 0.3 8
remaining refractory-DOC (RDOC) can be calculated as the difference between DOC and LDOC and equals 0.92 x 10¹⁰ moles C yr-1. This number is likely underestimated, since some RPOC might be converted in RDOC (see above). This refractory organic matter is supposed to be more slowly oxidized offshore by bacteria or mixed to the marine DOC-bulk.
Bacterial growth efficiency (BGE), which is the result of bacterial production (BP) and bacterial respiration (BR), can be defined by the following:
BGE = BR x (BR + BP) / BP. (5)
For bacteria growing on riverborne material, the bacterial carbon demand (BCD = BP + BR), could be estimated as the sum LDOC + LPOC. Then, we can estimate from equations (6) and (7) the carbon dioxide produced through bacterial respiration.
CO2 respired from LDOC = (1-BGE) x LDOC (6)
CO2 respired from LPOC = (1-BGE) x LPOC (7)
Applying a BGE of 0.24 (sd = 0.23) [del Giorgio et al., 1997] for the bacterial consumption of riverine-derived labile organic carbon (Table 4), then, at least 0.12 (sd 0.1) and 0.21 (sd 0.2) x 1010 moles CO2 yr -1 could be rapidly (days) produced during
transport in the estuary or in the nearshore environment through bacterial respiration from LDOC and LPOC, respectively.
4.4. Organic Metabolism in the Coastal System
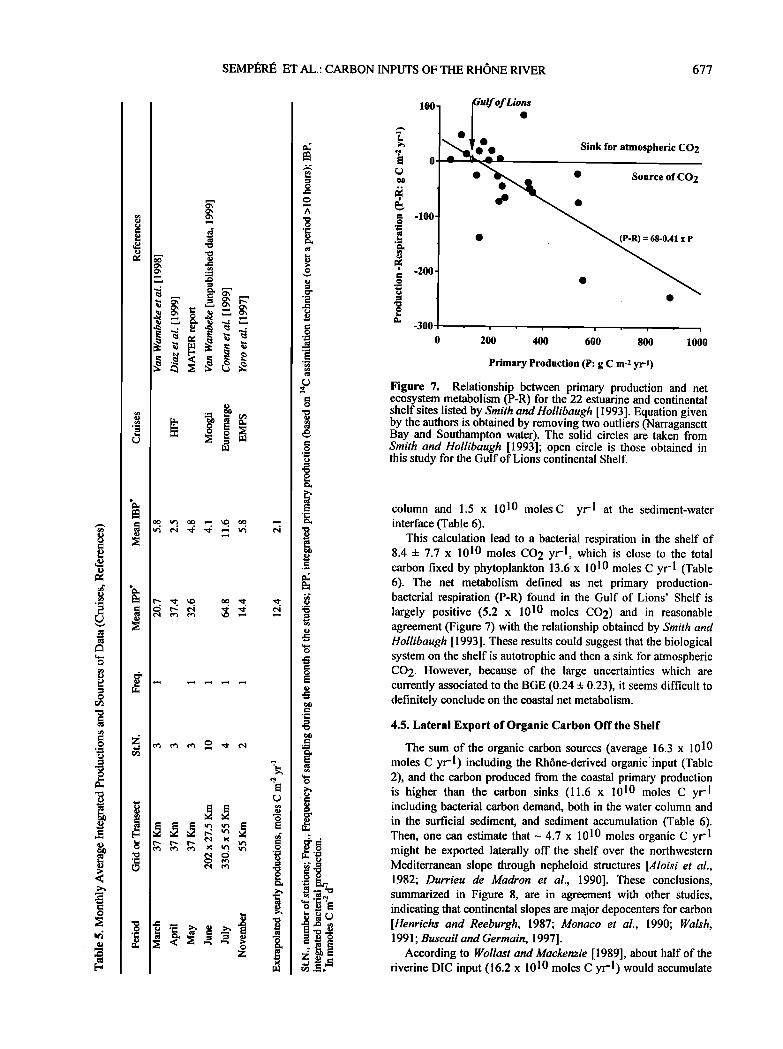
The annual primary production (based on 14C assimilation technique with incubation times ranging from 10 to 24 hours) and integrated to the deep chlorophyll maximum (DCM) within the dilution zone of the Rh6ne (most of the shelf) was estimated to 12.4 moles C m -2 yr-1 [Christaki et al, 1996; Yoro et al., 1997; Van Wambeke et al., 1998; Conan et al., 1999; Diaz et al., 1999; Table 5]. We estimated this figure to the net primary production (NPP), since 14C-based measurements were made over a incubation period higher than 6 hours [Williams et al., 1996]. Similarly, on the shelf, recent studies indicated a bacterial production integrated to the DCM of 2.1 moles C m -2 yr -1 (Table 5). These values give rise for the entire shelf (11 x 109 m2) to a secondary and a primary productions of 2.3 x 10¹⁰ moles C yr -1 and 13.6 x 10¹⁰ moles C yr-l, respectively (Table' 6). Buscad et al. [1990] estimated accumulation and mineralization rates at the sediment/water interface to be 0.48 x 10¹⁰ moles C yr -1 and 1.5 x 10¹⁰ moles C yr -1, respectively (Table 6). Then, for the entire shelf, assuming a BGE of 0.24 + 0.23 [del Giorgio et al., 1997], the BCD would be 9.6 + 10 x 1010 moles C yr -1 in the water
Table 4. Labile Particulate Organic Carbon (LPOC) Fluxes Calculated as the Carbon Contributed by Sugars and Amino Acids to Total POC [after Ittekot, 1988]
Year LPOC Huxes, LPOC Huxes, RPOC Huxes, 10 9 moles C yr '• % of POC 10 •ø moles C yr '•
1987 2.76 19 1.16
1988 3.08 17 1.50
1989 0.90 21 0.34
1990 1.41 23 0.47
1991 1.47 21 0.57
1992 2.45 19 1.04
1993 3.63 14 2.19
1994 4.62 14 2.89 1995 3.39 17 1.70
1996 3.04 16 1.66
10- year average 2.7_+1.2 18_+3 1.3_+0.8
Refractory particulate organic carbon (RPOC) fluxes are calculated as the difference between POC and LPOC fluxes.
SEMPI•R• ET AL.: CARBON INPUTS OF THE RH•NE RIVER 677
-100-
-zoo.
-300
0
Gulf of Lio;s ß ß
ß
ß © ß
Sink for atmospheric CO2
Source of CO 2
(P-R) = 68-0.41 x P
ß i ß i ß ! ß i ß !
200 400 600 800 1000
Primary Production (P: g C m-2 yr-1)
Figure 7. Relationship between primary production and net ecosystem metabolism (P-R) for the 22 estuarine and continental shelf sites listed by Smith and Hollibaugh [ 1993]. Equation given by the authors is obtained by removing two outliers (Narragansett Bay and Southampton water). The solid circles are taken from Smith and Hollibaugh [1993]; open circle is those obtained in this study for the Gulf of Lions continental Shelf.
column and 1.5 x 10¹⁰ moles C yr -l at the sediment-water interface (Table 6).
This calculation lead to a bacterial respiration in the shelf of 8.4 + 7.7 x 10¹⁰ moles CO 2 yr-1, which is close to the total carbon fixed by phytoplankton 13.6 x 10¹⁰ moles C yr-1 (Table 6). The net metabolism defined as net primary production- bacterial respiration (P-R) found in the Gulf of Lions' Shelf is largely positive (5.2 x 10¹⁰ moles CO2) and in reasonable agreement (Figure 7) with the relationship obtained by Smith and Hollibaugh [1993]. These results could suggest that the biological system on the shelf is autotrophic and then a sink for atmospheric CO 2. However, because of the large uncertainties which are currently associated to the BGE (0.24 + 0.23), it seems difficult to definitely conclude on the coastal net metabolism.
4.5. Lateral Export of Organic Carbon Off the Shelf
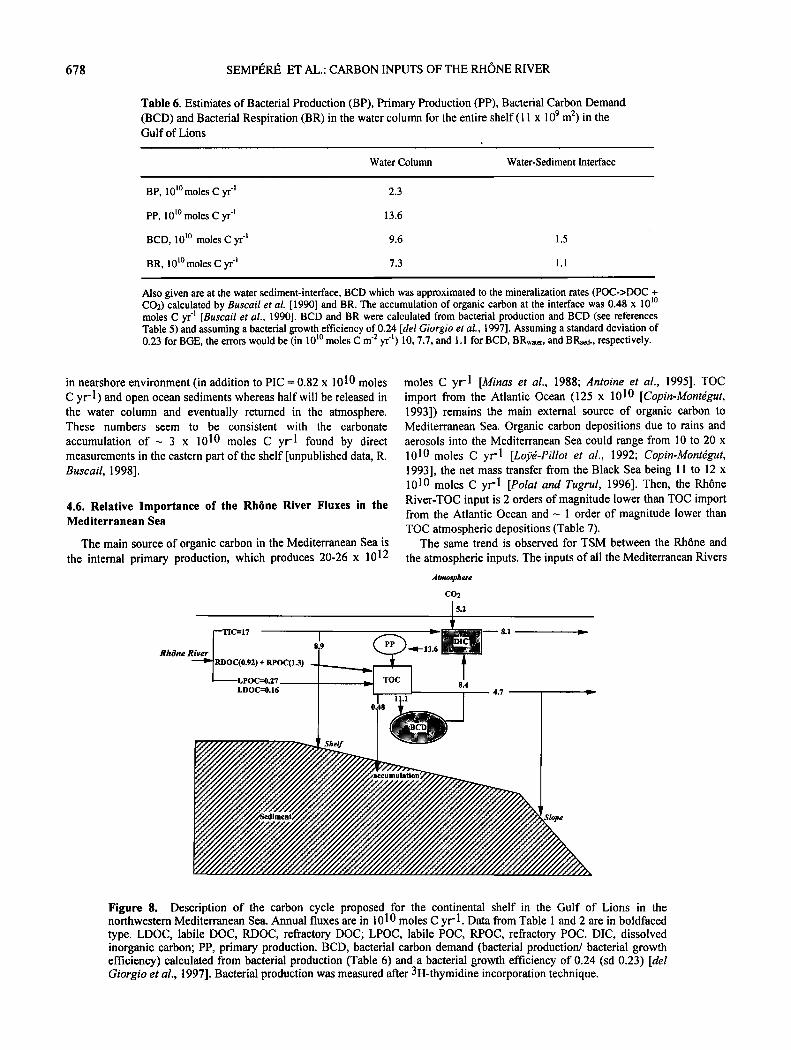
The sum of the organic carbon sources (average 16.3 x 10¹⁰ moles C yr-1) including the Rh6ne-derived organic'input (Table 2), and the carbon produced from the coastal primary production is higher than the carbon sinks (11.6 x 10¹⁰ moles C yr -1 including bacterial carbon demand, both in the water column and in the surficial sediment, and sediment accumulation (Table 6). Then, one can estimate that--- 4.7 x 10 l0 moles organic C yr -1 might be exported laterally off the shelf over the northwestern Mediterranean slope through nepheloid structures [,4loisi et al., 1982; Durrieu de Madton et al., 1990]. These conclusions, summarized in Figure 8, are in agreement with other studies, indicating that continental slopes are major depocenters for carbon [Henrichs and Reeburgh, 1987; Monaco et al., 1990; Walsh, 1991; Buscad and Germain, 1997].
According to Wollast and Mackenzie [ 1989], about half of the riverine DIC input (16.2 x 10¹⁰ moles C yr- 1) would accumulate
678 SEMPl•Rl• ET AL.: CARBON INPUTS OF THE RHONE RIVER
Table 6. Estimates of Bacterial Production (BP), Primary Production (PP), Bacterial Carbon Demand (BCD) and Bacterial Respiration (BR) in the water column for the entire shelf (11 x 10 9 m 2) in the Gulf of Lions
ß
Water Column Water-Sediment Interface
BP, 10 •ø moles C yr '• 2.3
PP, 10 •ø moles C yr '• 13.6
BCD, 10 •ø moles C yr '• 9.6
BR, 10 •ø moles C yr -• 7.3
1.5
1.1
Also given are at the water sediment-interface, BCD which was approximated to the mineralization rates (POC->DOC + CO2) calculated by Buscad et al. [1990] and BR. The accumulation of organic carbon at the interface was 0.48 x 10 m moles C yr '• [Buscad et al., 1990]. BCD and BR were calculated from bacterial production and BCD (see references Table 5) and assuming a bacterial growth efficiency of 0.24 [del Giorgio et al., 1997]. Assuming a standard deviation of 0.23 for BGE, the errors would be (in l0 w moles C m -2 yr '•) 10, 7.7, and 1.1 for BCD, BRwater, and BRse•., respectively.
in nearshore environment (in addition to PIC = 0.82 x 10¹⁰ moles C yr-1) and open ocean sediments whereas half will be released in the water column and eventually returned in the atmosphere. These numbers seem to be consistent with the carbonate
accumulation of- 3 x 10¹⁰ moles C yr '1 found by direct measurements in the eastern part of the shelf [unpublished data, R. Buscad, 1998].
4.6. Relative Importance of the Rhbne River Fluxes in the Mediterranean Sea
The main source of organic carbon in the Mediterranean Sea is the internal primary production, which produces 20.26 x 10¹²
moles C yr -1 [Minas et al., 1988; Antoine et al., 1995]. TOC import from the Atlantic Ocean (125 x 1010 [Copin-Montdgut, 1993]) remains the main external source of organic carbon to Mediterranean Sea. Organic carbon depositions due to rains and aerosols into the Mediterranean Sea could range from 10 to 20 x 1010 moles C yr-1 [Loj•d-Pillot et al., 1992; Copin-Montdgut, 1993], the net mass transfer from the Black Sea being 11 to 12 x 1010 moles C yr '1 [Polat and Tugrul, 1996]. Then, the Rh6ne River-TOC input is 2 orders of magnitude lower than TOC import from the Atlantic Ocean and- 1 order of magnitude lower than TOC atmospheric depositions (Table 7).
The same trend is observed for TSM between the Rh6ne and
the atmospheric inputs. The inputs of all the Mediterranean Rivers Atmosphere
CO2
s.Z
•TIC=17 8.9 (•• •-13.• --8.1 RhOne Rive•r I
'•RDOC(0.92) + RPOC(1.3) .._ • • • •PDOoCc--=•..2176 •l TOC l 8.4 4.7
[Shelf
a ecumulatio•
Figure 8. Description of the carbon cycle proposed for the continental shelf in the Gulf of Lions in the northwestern Mediterranean Sea. Annual fluxes are in 1010 moles C yr-1. Data from Table 1 and 2 are in boldfaced type. LDOC, labile DOC, RDOC, refractory DOC; LPOC, labile POC, RPOC, refractory POC. DIC, dissolved inorganic carbon; PP, primary production. BCD, bacterial carbon demand (bacterial production/bacterial growth efficiency) calculated from bacterial production (Table 6) and a bacterial growth efficiency of 0.24 (sd 0.23) [del Giorgio et al., 1997]. Bacterial prodaction was measured after 3H-thymidine incorporation technique.
SEMPI•RI• ET AL.' CARBON INPUTS OF THE RH•NE RIVER 679
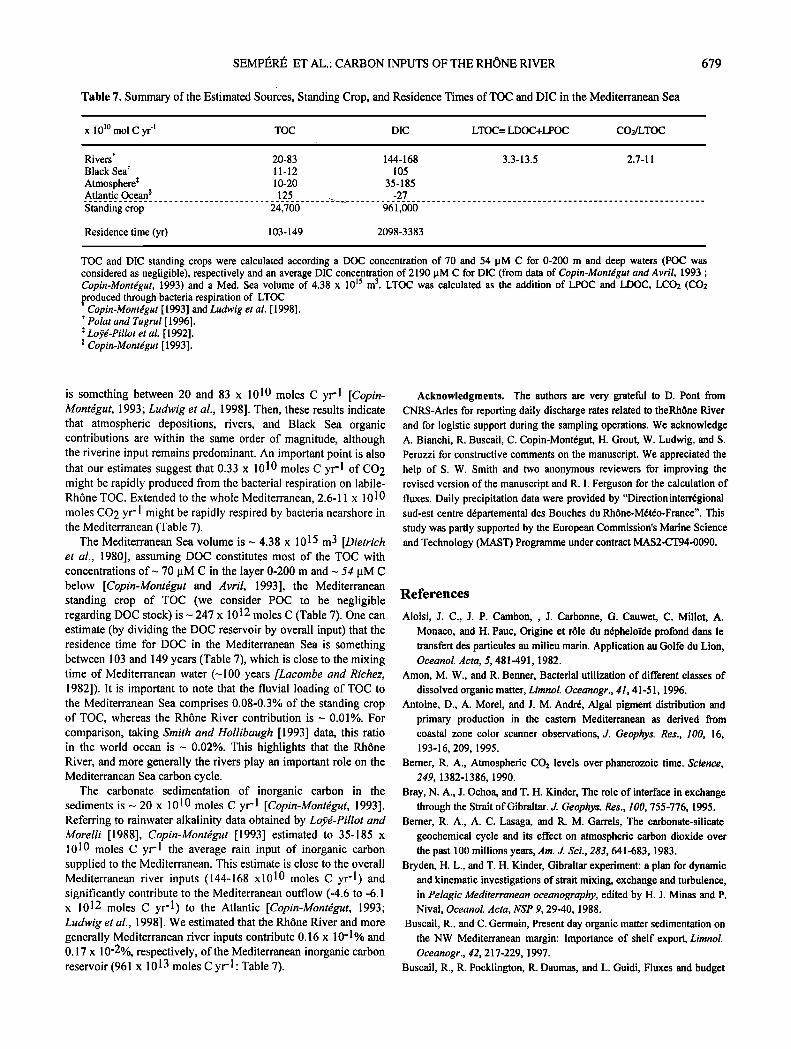
Table 7. Summary of the Estimated Sources, Standing Crop, and Residence Times of TOC and DIC in the Mediterranean Sea
x 10 lø mol C yr 'l TOC DIC LTOC= LDOC+LPOC CO2/LTOC
Rivers* 20-83 144-168 3.3-13.5 2.7-11 Black Sea* 11-12 105 Atmosphere* 10-20 35-185 Atlantic Ocean õ 125 -27 ................................................ _• _ ______ ......................................................................
Standing crop 24,700 961,000
Residence time (yr) 103-149 2098-3383
TOC and DIC standing crops were calculated according a DOC concentration of 70 and 54 pM C for 0-200 m and deep waters (POC was considered as negligible), respectively and an average DIC concentration of 2190 pM C for DIC (from data of Copin-Montdgut and Avril, 1993 ß Copin-Montdgut, 1993) and a Med. Sea volume of 4.38 x 10 •5 m 3. LTOC was calculated as the addition of LPOC and LDOC, LCO2 (CO2 roduced through bacteria respiration of LTOC [• Copin-Montdgut [1993] and Ludwig et al. [1998]. ß Polat and Tugrul [1996]. ß Loyd-Pillot et al. [1992]. õ Copin-Montdgut [ 1993].
is something between 20 and 83 x 1010 moles C yr -1 [Copin- Montdgut, 1993; Ludwig et al., 1998]. Then, these results indicate that atmospheric depositions, rivers, and Black Sea organic contributions are within the same order of magnitude, although the riverine input remains predominant. An important point is also that our estimates suggest that 0.33 x 10¹⁰ moles C yr -1 of CO 2 might be rapidly produced from the bacterial respiration on labile- Rh6ne TOC. Extended to the whole Mediterranean, 2.6-11 x 1010 moles CO 2 yr-1 might be rapidly respired by bacteria nearshore in the Mediterranean (Table 7).
The Mediterranean Sea volume is - 4.38 x 10¹⁵ m3 [Dietrich et al., 1980], assuming DOC constitutes most of the TOC with concentrations of- 70 [tM C in the layer 0-200 m and - 54 •tM C below [Copin-Montdgut and Avril, 1993], the Mediterranean standing crop of TOC (we consider POC to be negligible regarding DOC stock) is- 247 x 1012 moles C (Table 7). One can estimate (by dividing the DOC reservoir by overall input) that the residence time for DOC in the Mediterranean Sea is something between 103 and 149 years (Table 7), which is close to the mixing time of Mediterranean water (-100 years [Lacornbe and Richez, 1982]). It is important to note that the fluvial loading of TOC to the Mediterranean Sea comprises 0.08-0.3% of the standing crop of TOC, whereas the Rh6ne River contribution is - 0.01%. For comparison, taking Smith and Hollibaugh [1993] data, this ratio in the world ocean is - 0.02%. This highlights that the Rh6ne River, and more generally the rivers play an important role on the Mediterranean Sea carbon cycle.
The carbonate sedimentation of inorganic carbon in the sediments is • 20 x 1010 moles C yr- 1 [Copin-Montdgut, 1993]. Referring to rainwater alkalinity data obtained by Loyd-Pillot and Morelli [1988], Copin-Montdgut [1993] estimated to 35-185 x 1010 moles C yr -1 the average rain input of inorganic carbon supplied to the Mediterranean. This estimate is close to the overall Mediterranean river inputs (144.-168 x1010 moles C yr-l) and significantly contribute to the Mediterranean outflow (-4.6 to -6.1 x 10¹² moles C yr -1) to the Atlantic [Copin-Montdgut, 1993; Ludwig et al., 1998]. We estimated that the Rh6ne River and more generally Mediterranean river inputs contribute 0.16 x 10⁻¹% and 0.17 x 10⁻²%, respectively, of the Mediterranean inorganic carbon reservoir (961 x 1013 moles C yr- 1: Table 7).
Acknowledgments. The authors are very grateful to D. Pont from CNRS-Arles for reporting daily discharge rates related to theRh6ne River and for logistic support during the sampling operations. We acknowledge A. Bianchi, R. Buscall, C. Copin-Mont6gut, H. Grout, W. Ludwig, and S. Peruzzi for constructive comments on the manuscript. We appreciated the help of S. W. Smith and two anonymous reviewers for improving the revised version of the manuscript and R. I. Ferguson for the calculation of fluxes. Daily precipitation data were provided by "Directioninterr6gional sud-est centre d6partemental des Bouches du Rh6ne-M6t6o-France". This study was partly supported by the European Commission's Marine Science and Technology (MAST) Programme under contract MAS2-CT94-0090.
References
Aloisi, J. C., J.P. Cambon, , J. Carbonne, G. Cauwet, C. Millot, A. Monaco, and H. Pauc, Origine et r61e du n6pheloi'de profond dans le transfert des particules au milieu marin. Application au Golfe du Lion, Oceanol. Acta, 5, 481-491, 1982.
Amon, M. W., and R. Benner, Bacterial utilization of different classes of
dissolved organic matter, Limnol. Oceanogr., 41, 41-51, 1996. Antoine, D., A. Morel, and J. M. Andr6, Algal pigment distribution and
primary production in the eastern Mediterranean as derived from coastal zone color scanner observations, d. Geophys. Res., 100, 16, 193-16, 209, 1995.
Berner, R. A., Atmospheric CO2 levels over phanerozoic time. Science, 249, 1382-1386, 1990.
Bray, N. A., J. Ochoa, and T. H. Kinder, The role of interface in exchange through the Strait of Gibraltar. d. Geophys. Res., 100, 755-776, 1995.
Berner, R. A., A. C. Lasaga, and R. M. Garrels, The carbonate-silicate geochemical cycle and its effect on atmospheric carbon dioxide over the past 100 millions years, Am. d. Sci., 283, 641-683, 1983.
Bryden, H. L., and T. H. Kinder, Gibraltar experiment: a plan for dynamic and kinematic investigations of strait mixing, exchange and turbulence, in Pelagic Mediterranean oceanography, edited by H. J. Minas and P. Nival, Oceanol. Acta, NSP 9, 29-40, 1988.
Buscall, R., and C. Germain, Present day organic matter sedimentation on the NW Mediterranean margin: Importance of shelf export, Limnol. Oceanogr., 42, 217-229, 1997.
Buscail, R., R. Pocklington, R. Daumas, and L. Guidi, Fluxes and budget
680 SEMPI•RI• ET AL.' CARBON INPUTS OF THE RHONE RIVER
of organic matter in the benthic boundary layer over the northwestern Mediterranean margin, Cont. Shelf. Res., 10, 1089-1122, 1990.
Cauwet, G., HTCO method for dissolved organic carbon analysis in seawater: influence of catalyst on blank estimation, Mar. Chem., 47, 55-64, 1994.
Cauwet, G., F. Gadel, M. M. de Souza Sierra, O. Donard, and M. Ewald,. Contribution of the Rh6ne River to organic carbon input to the northwestern Mediterranean Sea, Cont. ShelfRes. 10, 1025-1037, 1990.
Christaki, U., F. Van Wambeke, E. D. Christou, P. Conan, and R. Gaudy, Food web structure variability in the surface layer, at a fixed station influenced by the northwestern Mediterranean Current, Hydrobiologia, 321, 145-153, 1996.
Clair, T. A., and J. M. Ehrman, Variations in discharge and dissolved organic carbon and nitrogen export from terrestrial basins with changes in climate: A neutral network approach, Limnol. Oceanogr., 41, 921- 927, 1996.
Conan, P., C. Turley, E. Stutt, M. Pujo-Pay, and F. Van Wambeke, Relationship between phytoplankton efficiency and the proportion of bacterial production to primary production in the Mediterranean Sea, Aquat. Micro& Ecol., 17, 131-144, 1999.
Copin-Mont6gut, C., Alkalinity and carbon budgets in the Mediterranean, Global Biogeochem. Cycles, 7, 915-925, 1993.
Copin-Mont6gut, G., and B. Avril, Vertical ,distribution and temporal variation of dissolved organic carbon in the North-Western Mediterranean Sea, Deep Sea Res., 40, 1963-1972, 1993.
Cruzado, A., and Z. R. Velasquez, Nutrients and phytoplankton in the Gulf of Lions, Cont. Shelf. Res., 10, 931-942, 1990.
del Giorgio, P.A., J. A. Cole, and A. Cimbleris, Respiration rates in
Kao, S. J., and K. K. Liu, Particulate organic carbon export from a subtropical mountainous river (Lanyang Hsi) in Taiwan, Limnol. Oceanogr., 41, 1749-1757, 1996.
Kao, S. J., and K. K. Liu, Fluxes of dissolved and nonfossil particulate organic carbon from an oceania small river (Lanyang Hsi) in Taiwan, Biogeochemistry, 39, 255-269, 1997.
Karl, D. M., G. A. Knauer, and M. H. John, Downward flux of particulate organic matter in the ocean: A particle decomposition paradox,Nature, 332, 438-440, 1988.
Kempe, S., M. Pettine, and G. Cauwet, Biogeochemistry of European rivers, in Biogeochemistry of Major World Rivers, SCOPE Rep. 42, edited by E. T. Degens, S. Kempe, and J. E. Richey, pp. 169-211, John Wiley, New York, 1993.
Lacombe H., and C.-Richez, The regime of the Strait of Gibraltar, in Hydrodynamics of Semi-Enclosed Seas, edited by J. C. J. Nihoul, pp 13-14, Elsevier Sci., New York, 1982.
Loy6-Pillot, M.D., and J. Morelli, Fluctuations of ionic composition of precipitations collected in Corsica related to changes in the origins of incoming aerosols, d. Aerosol Sci., 19, 577-585, 1988.
Lo276-Pillot, M.D., G. Cauwet, A. Spitzy, and J. M. Martin, Preliminary results on atmospheric wet deposition of organic carbon and nitrogen in Corsica, in Water Pollution Research Report 28, EROS 2000, Third Workshop, edited by J. M. Martin and H. Barth, pp. 519-532, Comm. of the Eur. Comm., Brussels, 1992.
Ludwig, W., P. Amiotte-Suchet, and J. L. Probst. River discharges of carbon to the world's oceans: Determining local inputs of alkalinity and of dissolved and particulate organic carbon. C.R. Acad. Sci. Paris, $er. II, 323, 1007-1014, 1996a.
bacteria exceed phytoplankton production in unproductive aquatic Ludwig, W., J. L. Probst, and S. Kempe, Predicting the oceanic input of systems, Nature, 385, 148-151, 1997. organic carbon by continental erosion, Global Biogeochem. Cycles, 10,
Diaz, F., P. Raimbault, and P. Conan, Carbon and nitrogenutilization by 23-41, 1996b.
phytoplankton during spring in a Mediterranean coastal zone (Gulf of Ludwig, W., P. Amiotte-Suchet, and J-L. Probst, Atmospheric CO2 Lions): evidence of small-scale variability, Cont. Shelf Res., in press, 1999.
Dietrich, G., K. Kalle, W. Krauss, and G. Siedler, General Oceanography,
2nd ed., John Wiley, New York, 1980.
Durrieu de Madton, X., F. Nyffeler, and C. H. Godet, Hydrographic structure and nepheloid spatial distribution in the Gulf of Lions continental margin, Cont. Shelf. Res., ! O, 915-929, 1990
consumption by continental erosion: Present day controls and implications for the last glacial maximum, Global Planet. Change, 16- 17, 107-120, 1998.
Mantoura, R. F.C., and E. M. S. Woodward, Conservation behaviour of
riverine dissolved organic carbon in the Severn Estuary: Chemical and geochemical implications, Geochim. Cosmochim. Acta, 47, 1293-1309, 1983.
Ferguson, R. I., Accuracy and precision of methods for estimating river Margat, J. (Ed.), L'eau dans le bassin m6diterran6en, situation et loads, EarthSurf. Processes Landforms, 12, 95-104, 1987. prospective, in Les Fascicules du Plan Bleu, vol. 6, 196 pp.,
Hansen, D. V., and M. Rattray, New dimensions in estuary classification, Economica, Paris, 1992. Limnol. Oceanogr., 11,319-326, 1966. Meybeck, M., Carbon, nitrogen and phosphorus transport by world rivers,
Heinrichs, S., and W. S. Reeburgh, Anaerobic mineralization of marine Am. d. Sci., 282, 401-450, 1982. sediment organic matter: Rates and the role of anaerobic processes in Meybeck, M., Global chemical weathering of surficial rocks estimated the oceanic carbon economy, Geomicrobiol. d., 5, 191-237, 1987.
Hobbie, J. E., A comparison of the ecology ofplanktonic bacteria in fresh and salt water, Limnol. Oceanogr., 33, 750-764, 1988.
Ibanez, C., D. Pont, and N. Prat, Characterization of the Ebre and Rh6ne
estuaries: A basis for defining and classifying salt-wedge estuaries, Limnol. Oceanogr., 42, 89-101, 1997.
from river dissolved loads, Am. d. $ci., 287, 401-428, 1987.
Miller, J. R., and G. L. Russel, The impact of global warming on river runoff, d. Geophys. Res., 97, 2757-2764, 1992.
Milliman, J. D., and J.P. M. Syvitsky, Geomorphic/tectonic control of sediment discharge to the ocean: The importance of small mountains rivers, d. Geol., 100, 525-544, 1992.
lttekot, V., Global trends in the nature of organic matter in river Millot, C., Circulation in the western Mediterranean Sea, Oceanol. Acta, suspensions, Nature, 332, 436-438, 1988.
Ittekot, V., and R. W. P.M. Laane, Fate of riverinc particulate organic matter, Biogeochemistry of European rivers, in Biogeochemistry of Major Worm Rivers, SCOPE Rep. 42, edited by E. T. Degens, S. Kempe, and J. E. Richey, pp. 233-243, John Wiley, New York, 1991.
Justic, D., N. N. Rabalais, and R. E. Turner, Effects of climate change on hypoxia in coastal waters: A doubled CO2 scenario for the northern Gulf of Mexico, Limnol. Oceanogr., 41,992-1003, 1996.
10, 143-149, 1987.
Minas, H. J., M. Minas, B. Coste, J. Gostan, P. Nival, and M. C. Bonin, Production de base et de recyclage; une revue de la prob16matique en M6diterran6e Nord occidentale, Oceanol. Acta, 9, 155-162, 1988.
Minist•re de l'Environnement, Annuaire de la qualit6 desEaux, Rivi•res et Canaux 1980, BassinRh6ne-M6diterran6e-Corse, vol. 6, 432 pp., Paris, 1980.
Monaco, A., P. Biscaye, J. Soyer, R. Pocklington, and S. Heussner,
SEMPI•R• ET AL.: CARBON INPUTS OF THE RHONE RIVER 681
Particle fluxes and ecosystem response on a continental margin: The 1985-1988 Mediterranean ECOMARGE experiment, Cont. Shelf. Res., 10, 809-839, 1990.
Mopper, K., X. Zhou, D. J. Kieber, and R. J. Sikorski, Photochemical degradation of dissolved organic carbon and its impact on the oceanic carbon cycle, Nature, 353, 60-62, 1991.
Moran, M. A., and R. E. Hodson, Contributions of degrading Spartina alterniflora lignocellulose to the dissolved organic carbon pool of a salt marsh, Mar. Ecol. Prog. $er., 62, 161-168, 1990.
Polat, C., and S. Tugrul, Chemical exchange between the Mediterranean and the black Sea via the Turkish straits, Bulletin de 17nstitut
Ocdanographique, vol. 17, pp. 167-186, CIESM Sciences Series, Monaco, 1996.
Pont, D., Les dObits solides du RhOne fi proximit6 de son embouchure: DonnOes r•centes (1994-1995), Rev. Geogr. Lyon, 72, 23-33, 1997.
Probst, J. L., P. Amiotte-Suchet, and Y. Tardy, Carbon river fluxes and
weathering CO2 consumption in the Congo and Amazon river basins, Appl. Geochem., 9, 1-13, 1994.
Richey, J. E., J. Brock, R. J. Naiman, R. C. Wissmar, and R. F. Stallard, Organic carbon: Oxidation and transport in the Amazon River,Science, 207, 1348-1351, 1980.
SempOr•, R., and G. Cauwet, Dissolved and colloidal organic carbon in the RhOne Estuary: Comparison of the UV-Persulfate and HTCO methods, C. R. Acad. $ci., 317, 57-63, 1993.
Servais, P., G. Billen, and M. C. Hascoet, Determination of the
biodegradable fraction of dissolved organic matter in waters, Water Res., 21,445-450, 1987.
Sholkovitz, E. R., Flocculation of dissolved organic and inorganic matter during the mixing of river water and seawater, Geochim. Cosmochim. Acta, 40, 831-845, 1976.
Smith, S. V., and J. T. Hollibaugh, Coastal metabolism and the oceanic organic carbon balance, Rev. Geophys., 31, 75-89, 1993.
Smith, S. V., R. M. Chambers, and J.T. Hollibaugh, Dissolved and particulate nutrient transport though a coastal watershed-estuary system, J. of HydroL, 176, 181-203, 1996.
Sondergaard, M., and M. Middelboe, A cross-system analysis of labile dissolved organic carbon, Mar. Ecol. Prog. Ser., 118, 283-294, 1995.
Sondergaard, M., B. Hansen, and S. Markager, Dynamics of dissolved organic carbon lability in a eutrophic lake, Limnol. Oceanogr., 40, 46- 54, 1995.
•Spitzy, A., and V. lttekot, Dissolved organic carbon in rivers, in Ocean Margin Processes in Global Change, edited by R. F. C.Mantoura, J. M. Martin, and R. Wollast, pp. 5-17, Wiley Interscience, New York, 1991.
Tan, F. C., and P.M. Strain, Carbon isotope ratios of particulate organic matter in the Gulf of St. Lawrence, J. Fish. Res. Board. Can., 36, 678-
682, 1979.
Tanoue, E., Vertical distribution of dissolved organic carbon in the North Pacific as determined by the high-temperature catalytic oxidation method, Earth Planet. Sci. Lett., 111, 201-216, 1992.
Thomas, A. J., Input of artificial radionuclides to the Gulf of Lions and
tracing the RhOne influence in marine surface sediments, Deep Sea Res., 44, 577-595, 1997.
Thomas, C., G. Cauwet, and J. F. Minster, Dissolved organic carbon in the equatorial Atlantic Ocean, Mar. Chem., 49, 155-169, 1995.
Tranvick, L. J., and M. H0efie, Bacterial growth in mixed cultures on dissolved organic carbon from humic and clear waters, Appl. Environ. Microbiol., 53, 482-488, 1987.
Tranvick, L. J., A!lochtonous dissolved organic matter as an energy source for pelagic bacteria and the concept of the microbial loop, Hydrobiologia, 229, 107-114, 1992.
Onltiata, O, T. Oguz, M. A. Latif, and E. Ozsoy, On the physical oceanography of the Turkish Straits, NATO/ASI Series, in The
Physical Oceanography of the straits, edited by J. L. Pratt, pp. 25-60, Kluwer Acad. Norwell, Mass., 1990.
Van Wambeke, F., F. Diaz, R. SempOrO, E. Dafner, P. Conan, M. Bianchi, and P. Raimbault, Variability of heterotrophic bacterial processes in NW Mediterranean Sea during spring (High Frequency Flux Experiment), paper presented at the 3rd MTP-II Mater Workshop "Variability of the Mediterranean Sea, Comm. of the Euro. Commun.," Rhodos, Greece Oct. 15-17, 1998.
Walsh, J. J., Importance of continental margins in the marine biogeochemical cycling of carbon and nitrogen, Nature, 350, 53-55, 1991.
Williams, P. J. Leb, C. Robinson, M. Sondergaard, A.M. Jespersen, T. L. Bentley, D. Lef•vre, K. Richardson, and B. Reeman, Algal 14C on total metabolisms, 2, Experimental observations with the diatoms skeletonema costatum, J. Plankton, Res, 18, 1961-1974, 1996.
Wo!last, R., and F. T. Mackenzie, Global biogeochemical cycles and climate, in Climate and Geo-Science, edited by A. Berger et al., pp. 453-473, Kluwer Acad. Norwell, Mass.,, 1989.
Yoro, S.C., R. SempOrO, C. Turley, M. A. Unanue, X. Durrieu de Madron, and M. Bianchi, Cross-slope variations of organic carbon and bacteria in the Gulf of Lions in relation to water dynamics (northwestern Mediterranean), Mar. Ecol. Prog. $er., 161,255-264, 1997.
G. Cauwet, Laboratoire d'OcOanographie Biologique, UMR 7621, Laboratoire Arago, BP 44, 66 651 Banyuls sur mer Cedex, France. cauwet•arago.obs-banyuls.fr
B. Charri•re, Centre de Formation et de Recherche sur
!'Environnement Marin, CNRS/INSU UMR 5110, 52 Avenue de
Villeneuve, F 66 860 Perpignan Cedex, France. (charrier•univ-perp.fr) R. SempOr6 and F. Van Wambeke, Laboratoire de Microbiologie
Marine, CNRS/INSU EP 2032, Case 907, Campus deLuminy, Route LOon Lachamps, Universit6 de la MOditerranOe, F-13 288 Marseille Cedex 9, France. (sempere•luminy.univ-mrs.fr)
(Received January 19, 1999; revised August 9, 1999; accepted August 24, 1999.)