Embed Size (px)
Citation preview

© 2016 by Plasan 1
Carbon Fiber Parts
Performance In Crash
SITUATIONS -
CAN WE PREDICT IT?
Commercial Division of Plasan Sasa

© 2016 by Plasan 2 © 2016 by Plasan
ABOUT THE AUTHORS
D.Sc - Technion - Israel Institute of technology
Head of the simulation and survivability team, Plasan
Specialities:
High strain rate dynamic simulation- Crash, Blast, Penetration
FE Analysis, Discrete Element simulation, Multi body Simulations
Soil Dynamics
Mechanics of materials
Dr Zvika Asaf
PhD – Ben Gurion University of the Negev
Senior R&D engineer, Plasan
Dr Vadim Favorksy

© 2016 by Plasan 3 © 2016 by Plasan
World’s leading designer and supplier of lightweight composite/ metal-composite vehicle bodies
ABOUT PLASAN

© 2016 by Plasan 4 © 2016 by Plasan
ABOUT PLASAN
International company with R&D and manufacturing facilities in Israel, US, and France plus broader partner network

© 2016 by Plasan 5 Plasan Proprietary Information
THE PROBLEM
But what happens After failure? Crash – High rate dynamic phenomena – 10-100 milliseconds
Design with composite in elastic regime is well known and understood

© 2016 by Plasan 6 Plasan Proprietary Information
PLASAN EXPERIENCE WITH HIGH RATE DYNAMIC – BLAST STRUCTURE INTERACTION
THE MODEL BLAST TEST
• A mine blast is essentially the same as a crash impact, just from underneath
• Hybrid III dummies • Simulation calibrated by physical testing

© 2016 by Plasan 7 Plasan Proprietary Information
COMPOSITE MATERIALS IN MINE BLAST CONVERTING STEEL CAB TO COMPOSITE CAB
SIMULATION RESULTS WITH STEEL DEFLECTOR
E-glass Cab 260 kg Steel Cab 586 kg E-glass with Aluminium frame Cab 280 kg
© 2016 by Plasan 8 Plasan Proprietary Information
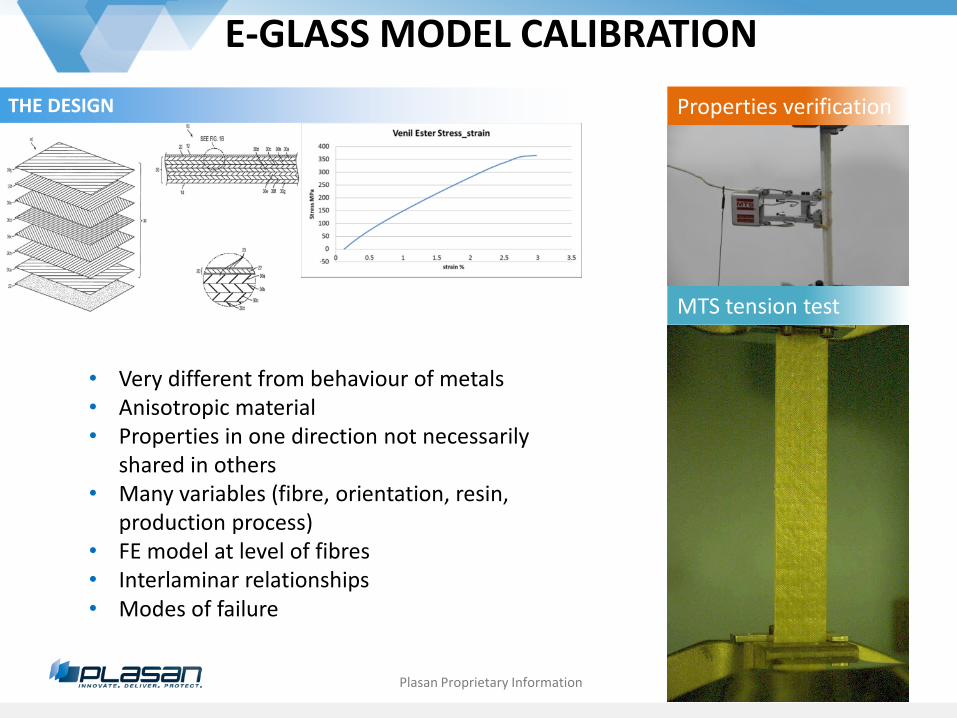
E-GLASS MODEL CALIBRATION
Properties verification
MTS tension test
THE DESIGN
• Very different from behaviour of metals • Anisotropic material • Properties in one direction not necessarily
shared in others • Many variables (fibre, orientation, resin,
production process) • FE model at level of fibres • Interlaminar relationships • Modes of failure

© 2016 by Plasan 9 Plasan Proprietary Information
LAMINATED COMPOSITE - FAILURE IN BENDING
The delamination process

© 2016 by Plasan 10 Plasan Proprietary Information
E-GLASS BALSA-WOOD STRUCTURE
3-POINT BENDING, 100 MM/SEC
SIMULATION
CONTACT FORCE – COMPARISON
TEST

© 2016 by Plasan 11 Plasan Proprietary Information
BLAST TEST RESULTS –COMPOSITE CABIN E-GLASS WITH ALUMINIUM FRAME CAB
POST BLAST

© 2016 by Plasan 12 Plasan Proprietary Information
E-GLASS WITH BALSA CAB
POST BLAST
BLAST TEST RESULTS –COMPOSITE CABIN

© 2016 by Plasan 13 Plasan Proprietary Information
MODELING LAMINATED COMPOSITE AGAINST BALLISTIC THREAT
TEST
PROJECTILE
SIMULATION
First shot Second shot
FRONT VIEW

© 2016 by Plasan 14 Plasan Proprietary Information
CARBON COMPOSITES CRASH MODELING
Force
[kN]
Displacement [1E-3m]
Velocity [m/s]
Steady state forces -20000 N
Braking Forces -120000 N

© 2016 by Plasan 15 Plasan Proprietary Information
THREE POINT BENDING DROP TEST
Force
[kN]
Middle Crack

© 2016 by Plasan 16 Plasan Proprietary Information
Optimisation Parameters Tuning
Angles Optimisation
(Static, OptiStruct®)
Validation of the results
(Dynamic, LS-DYNA®)
DESIGN OPTIMISATION FLOWCHART
Problem
Definition
(Materials,
Manufacturing
Constraints
etc.)
Thickness
Optimisation
(Static, OptiStruct®)
Validation of the results
(Dynamic, LS-DYNA®)
No
Yes
Satisfying
results No
Fine Tuning
(Dynamic, LS-DYNA®)
Satisfying
results Parameters
Tuning
No
Yes End
Yes
Topological
Optimisation
(Static, OptiStruct®)
Satisfying
results
Optimisation
Parameters
Tuning

© 2016 by Plasan 17 Plasan Proprietary Information
TOPOLOGICAL OPTIMISATION – THE MODEL
The Optimisation was performed with OptiStruct®

© 2016 by Plasan 18 Plasan Proprietary Information
TOPOLOGICAL OPTIMISATION – LOAD CASES
Load Y
Fixed Boundary
Distributed Force
Load Y

© 2016 by Plasan 19 Plasan Proprietary Information
TOPOLOGICAL OPTIMISATION – RESULTS

© 2016 by Plasan 20 Plasan Proprietary Information
LAYUP AND ANGLE OPTIMISATION
The beam was divided into 13 regions (see the figure). Each region was built from 4 sub-plies having [0/45/90/-
45] lay-up – First Path
The optimisation variables in this stage were the thicknesses of the sub-plies (13*4 variables)
Visualisation of the Walls’
Thicknesses
30 26
11
2
3
6
4
5
12
10
7
9 27

© 2016 by Plasan 21 Plasan Proprietary Information
OPTIMISATION FOR MANUFACTURING AND COST CONSTRAINTS
The beam was divided into 2 regions (see the figure). Each region was built from 4 sub-plies
Visualisation of the Walls’
Thicknesses
2
1

© 2016 by Plasan 22 Plasan Proprietary Information
PLASAN MODEL AFTER OPTIMISATION – RESULTS
Material: UD Carbon
Mass: 8.0 kg (34% reduction)
Fmax ≈ 75 kN;
Ref. Fmax ≈ 47 kN;
Material: Aluminium
Mass: 11.2

© 2016 by Plasan 23 Plasan Proprietary Information
COMPARISON BETWEEN DESIGNS
0
10
20
30
40
50
60
70
80
0 50 100 150 200
Reference Aluminum DesignCarbon Plasan
Ap
plie
d F
orc
e, kN
Displacement, mm
Energy Absorbed: Reference Aluminium (12.2kg): 6.3kJ Plasan Carbon (8.0kg): 10.2 kJ

© 2016 by Plasan 24 Plasan Proprietary Information © 2016 by Plasan
FULL COMPOSITE FRAME
© 2016 by Plasan 24
SCHEMATIC VIEW FOR ILLUSTRATIVE PURPOSES ONLY

© 2016 by Plasan 25 Plasan Proprietary Information
OVERVIEW OF THE NUMERICAL MODEL
COMPOSITE BEAMS
ALUMINIUM CONNECTIONS
COMPOSITE SKINS
© 2016 by Plasan 26 Plasan Proprietary Information
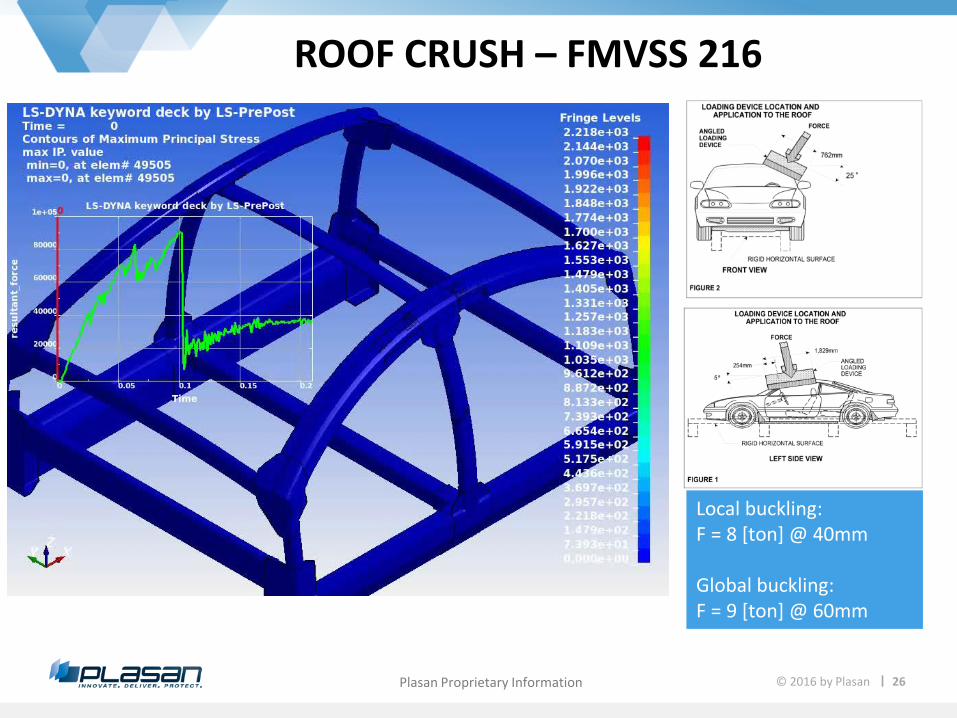
ROOF CRUSH – FMVSS 216
Local buckling: F = 8 [ton] @ 40mm Global buckling: F = 9 [ton] @ 60mm

© 2016 by Plasan 27 Plasan Proprietary Information
SIDE POLE IMPACT - FMVSS 214
Side pole crash test is detailed in FMVSS 214. The car is moving at 20 MPH on a line passing through the driver head COG, at 75° from the longitudinal centreline. The crash is between the car and a rigid pole of Ø10”

© 2016 by Plasan 28 Plasan Proprietary Information
RESULTS OF THE ANALYSIS
The frame absorbed the crash energy without penetration into the occupants volume
© 2016 by Plasan 29 Plasan Proprietary Information
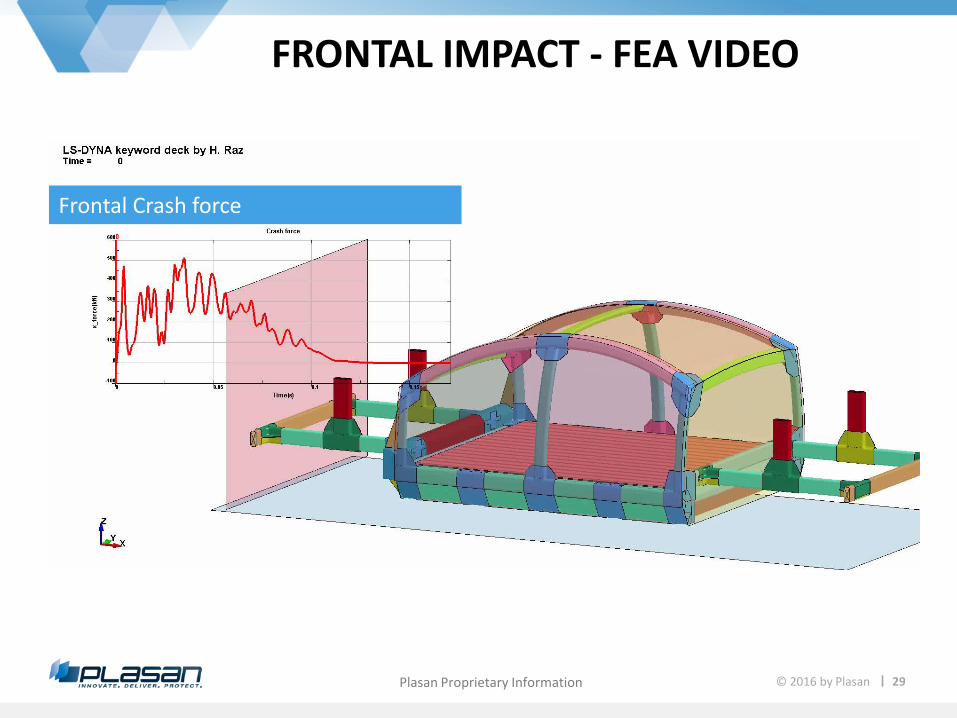
FRONTAL IMPACT - FEA VIDEO
Frontal Crash force

© 2016 by Plasan 30 Plasan Proprietary Information
CONCLUSIONS
Potential 30% weight saving to aluminium
Basic design concepts must
be changed
FEA is part of design for cost
process
Composite crash is
predictable

© 2016 by Plasan 31 Plasan Proprietary Information
THANK YOU
© 2016 by Plasan