Embed Size (px)
Citation preview

Carbon Capture & StorageThanks to:
Prof. Tom McKinnon
Mark Lockhart, formerly URS Corporation

•2

Topics
•History of international action
•U.S. Government Mandates
•GHG Emissions Control
Cap‐and‐Trade Program?
• Carbon Capture & Storage
•3
Topics
•History of international action
•U.S. Government Mandates
•GHG Emissions Control
Cap‐and‐Trade Program?
• Carbon Capture & Storage
•4
Montreal Protocol
• 1930s. CFCs produced commercially by DuPont.
Excellent phase properties for refrigerants.
Non‐toxic.
Non‐flammable.
• 1974. Molina & Rowland discovered that CFC breakdown by UV light can lead to ozone destruction.
• 1985. Antarctic ozone hole discovered.
• 1988. UN treaty in Montreal led to orderly phase‐out of CFCs.
• Inspired confidence that international action could be marshaled for GHG control
•5

Intergovernmental Panel on Climate Change (IPCC)
• Formed by the World Meteorological Organization (WMO) and the UN Environmental Programme (UNEP)
• One of the biggest science‐related endeavors in history
Doesn’t conduct science on its own
Evaluates scientific results to assist policy makers
Several hundred international scientists
• First report issued in 1990 with others following every 5 – 6 years
• Shared the 2007 Nobel Peace Prize with Al Gore
•6
UN Framework Convention on Climate Change (UN FCCC)
• Signed in 1992 at Rio Earth Summit
155 countries, including the US
• Industrialized countries (“Annex I”) agreed to voluntary targets
Reduce Year 2000 emissions to 1990 levels
• 200 projects with a value of $500M started
• Became apparent rapidly that voluntary measures were not working
•7

Kyoto Protocol
• Adopted in 1997, Kyoto, Japan• Binding emissions targets
Reduce emissions by an average of 5.2% below 1990 levels by 2012 Each country held to different standards
• Covers six GHG: CO2, CH4, N2O, HFCs, PFCs, SF6• Established market mechanisms
i.e. carbon trading• Applies only to OECD nations plus former East Bloc
China and India not bound• Entered into force on Feb 16, 2005 when Russia signed
•8

Global Kyoto Commitments
•9
Commitments respond to a reduction of 30‐40% below BAU forecasts by 2012.
US and Kyoto
• March 2001, President Bush indicated the U.S. would not sign the Kyoto Protocol
Argument against.
• China and India not bound by the treaty so US would not hurt the economy
Argument for
• On a per‐capita basis, emissions from China and India are a small fraction of US emissions
• As the largest GHG emitter, the US has the duty to lead
•10

Kyoto Flexibility Mechanisms
• International Emissions Trading. Countries below their cap can sell excess emissions allowances to another country.
• Joint Implementation. Project occurring between “Annex I” countries (all regulated countries). Transference of emissions allowances.
• Clean Development Mechanism. Industrialized countries can develop GHG mitigation projects in developing
countries and receive Certified Emissions Reductions.
•11

Kyoto and EU ETS
• The Kyoto treaty led to an emissions trading scheme (ETS) in the European Union.
Cap‐and‐trade system.
• Emissions permits given out for free to large emitters (e.g. power plants).
Poor data available on which to base the allocation of permits.
Lots of incentive to over‐report emissions levels.
• Emitters w/ excess permits can sell them. Emitters exceeding their allowances must buy permits.
• Several collapses in the carbon market.
• Model for US cap and trade plans.
•12
Copenhagen Summit
• United Nations Climate Change Conference held in Copenhagen, Denmark, December 2009
• Copenhagen Accord was “taken note of” but not “adopted”
Drafted by the US, China, India, Brazil & South Africa
Not passed unanimously
Many countries & non‐governmental organizations opposed to this agreement
• Document recognized that climate change is one of the greatest challenges of the present day and that actions should be taken to keep any temperature increases to below 2°C
• Document is not legally binding & does not contain any legally binding commitments for reducing CO2 emissions
•13
Topics
•History of international action
•U.S. Government Mandates
•GHG Emissions Control
Cap‐and‐Trade Program?
• Carbon Capture & Storage
•14

Waxman‐Markey American Clean Energy & Security Act (2009)
• Emission cuts Cap GHG emissions Require high‐emitting industries to reduce output to specific targets between now & middle of the century
• Covers 85% of overall economy• Includes suppliers – electricity producers, oil refineries, natural gas suppliers• Includes energy‐intensive users – iron, steel, cement, & paper manufacturers
Emission cuts would start in 2012 The cap‐and‐trade program would be completely phased in by 2016
• Emission permits Regulated industries would need to acquire permits for their emissions
• Offsets Allowed to purchase carbon offsets to meet portion of required emission reductions
• Can fund clean‐energy projects elsewhere instead of cutting their own emissions • Renewable electricity standard• Investments in energy technology• Coal‐fired power plants• Energy‐efficiency standards• Worker transition• Smarter cars and smarter grids
•15
Ref: http://www.grist.org/article/2009‐06‐03‐waxman‐markey‐bill‐breakdown/
Bill as drafted has little likelihood for passage
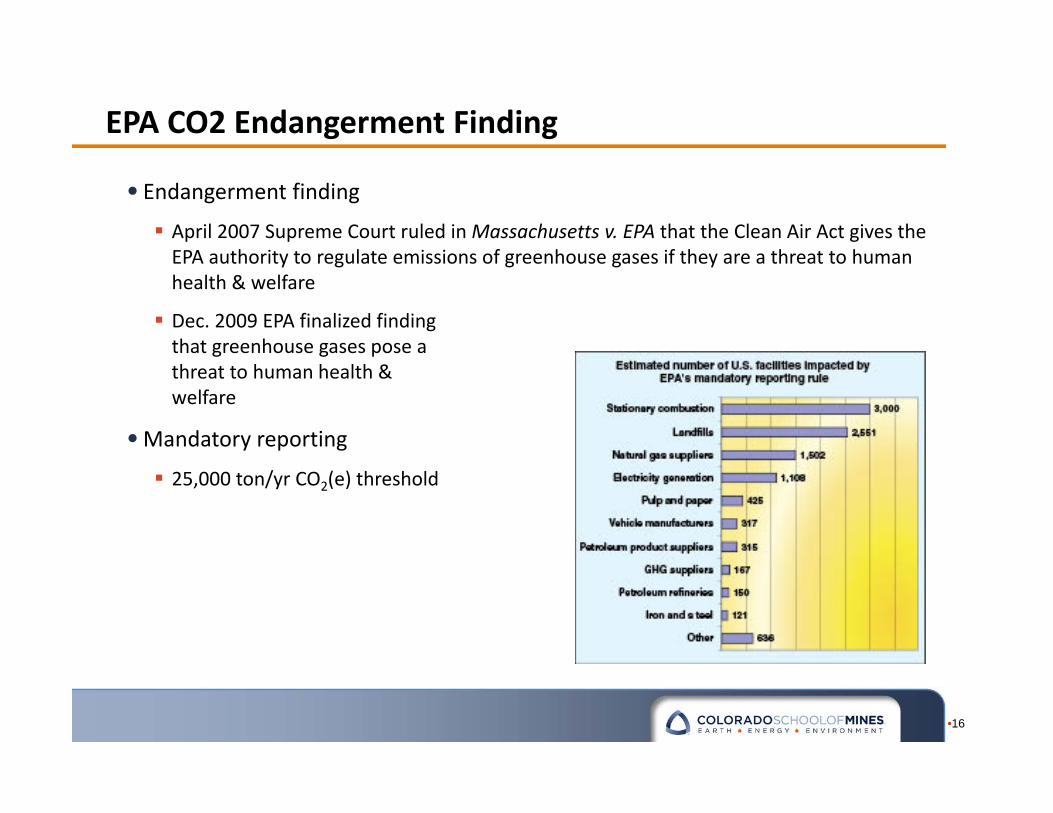
EPA CO2 Endangerment Finding
• Endangerment finding
April 2007 Supreme Court ruled in Massachusetts v. EPA that the Clean Air Act gives the EPA authority to regulate emissions of greenhouse gases if they are a threat to human health & welfare
Dec. 2009 EPA finalized finding that greenhouse gases pose a threat to human health & welfare
•Mandatory reporting
25,000 ton/yr CO2(e) threshold
•16
Cap‐and‐Trade
•Administrative approach to provide economic incentives to reduce emissions of pollutants Government issues limit on total amount of pollutants an industry can emit Companies issued permits to allow emissions to a certain limit
• Buy credits if emitting more than allowed• Can sell credits if emitting less than allowed• Offsets & credits
o Carbon Offset Credits – production & use of clean forms of energy: wind, solar, hydro, & biofuels.
o Carbon Reduction Credits – collection & storage of carbon through reforestation, forestation, ocean & soil collection, & storage efforts
• Similar systems already in place European Union Emission Trading Scheme since 2005 United States’ Acid Rain Program NOx Budget Trading Program in U.S. Northeast
•17
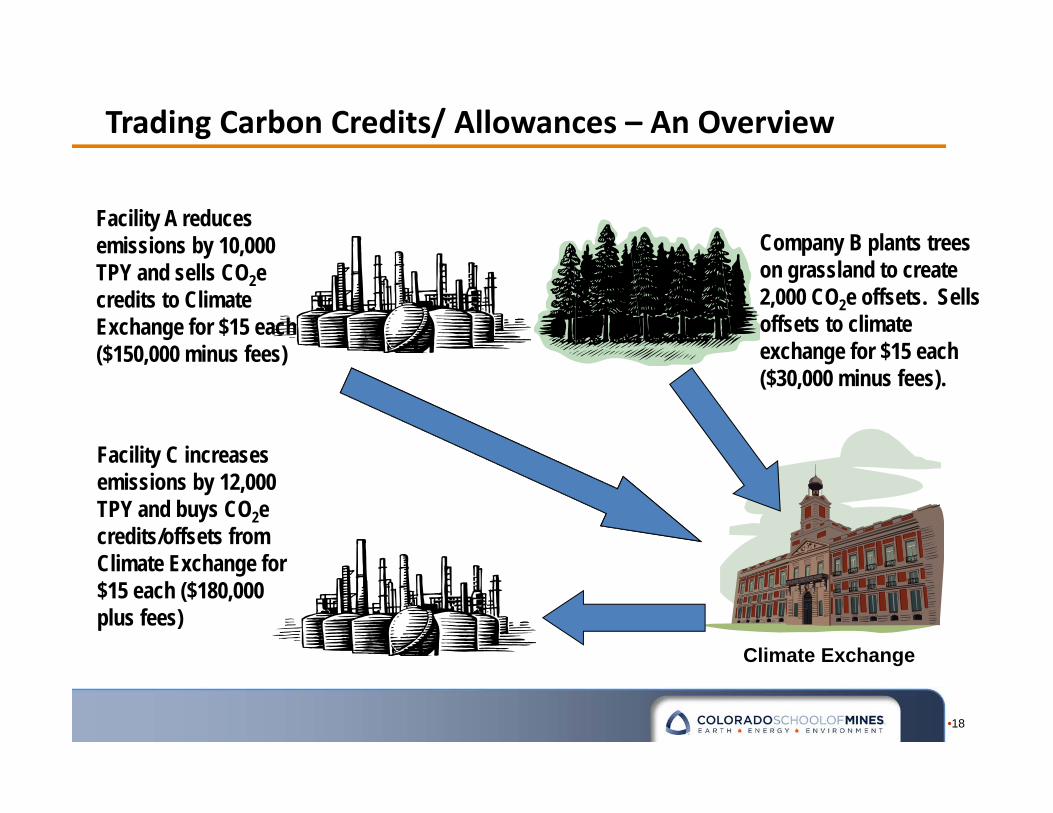
Trading Carbon Credits/ Allowances – An Overview
•18
Facility A reduces emissions by 10,000 TPY and sells CO2e credits to Climate Exchange for $15 each ($150,000 minus fees)
Facility C increases emissions by 12,000 TPY and buys CO2e credits/offsets from Climate Exchange for $15 each ($180,000 plus fees)
Company B plants trees on grassland to create 2,000 CO2e offsets. Sells offsets to climate exchange for $15 each ($30,000 minus fees).
Climate Exchange
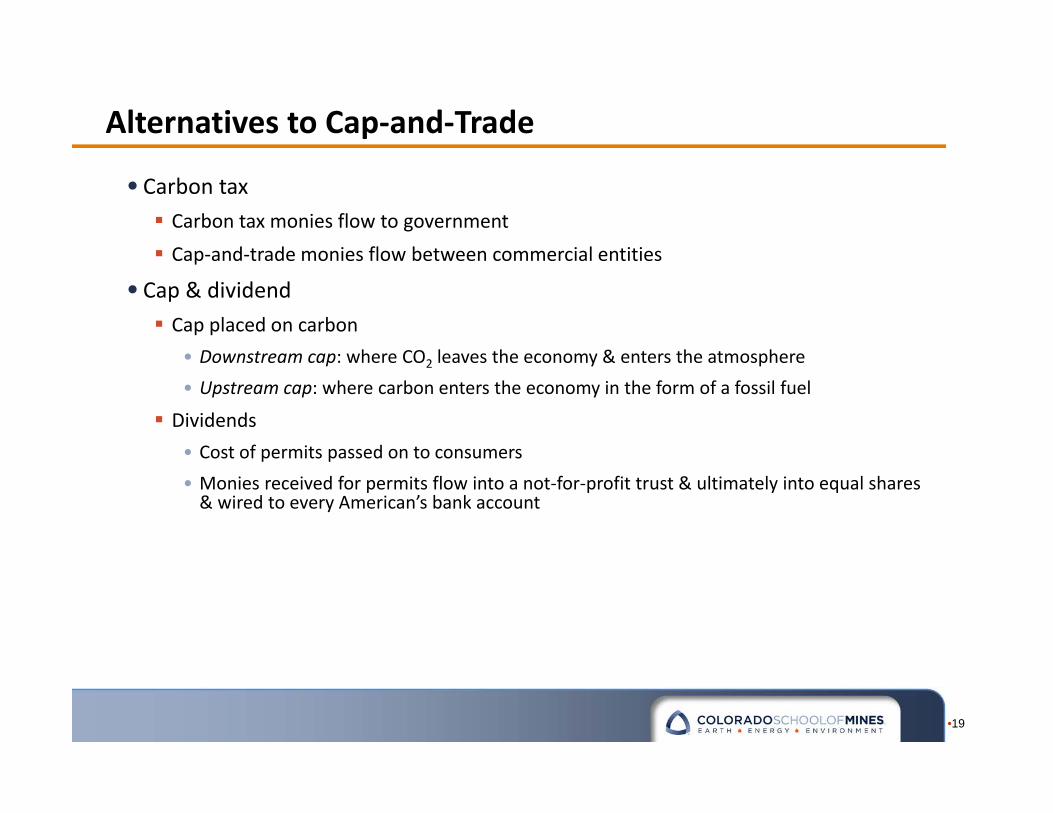
Alternatives to Cap‐and‐Trade
• Carbon tax Carbon tax monies flow to government Cap‐and‐trade monies flow between commercial entities
• Cap & dividend Cap placed on carbon
• Downstream cap: where CO2 leaves the economy & enters the atmosphere• Upstream cap: where carbon enters the economy in the form of a fossil fuel
Dividends• Cost of permits passed on to consumers• Monies received for permits flow into a not‐for‐profit trust & ultimately into equal shares & wired to every American’s bank account
•19
Topics
•History of international action
•U.S. Government Mandates
•GHG Emissions Control
Cap‐and‐Trade Program
Alternatives
• Carbon Capture & Storage
•20

Global Warming Potential
•21
GWPCarbon Dioxide CO2 1Methane CH4 21Nitrous oxide N2O 310Hydrofluorocarbons (HFCs) HFC-23 11,700
HFC-32 650HFC-125 2,800HFC-134a 1,300HFC-143a 3,800HFC-152a 140HFC-227ea 2,900HFC-236fa 6,300
HFC-4310mee 1,300Perfluorocarbons (PFCs) CF4 6,500
C2F6 9,200C4F10 7,000C6F14 7,400
Sulfur Hexafluoride SF6 23,900
Water Vapor H2O ???
Gas
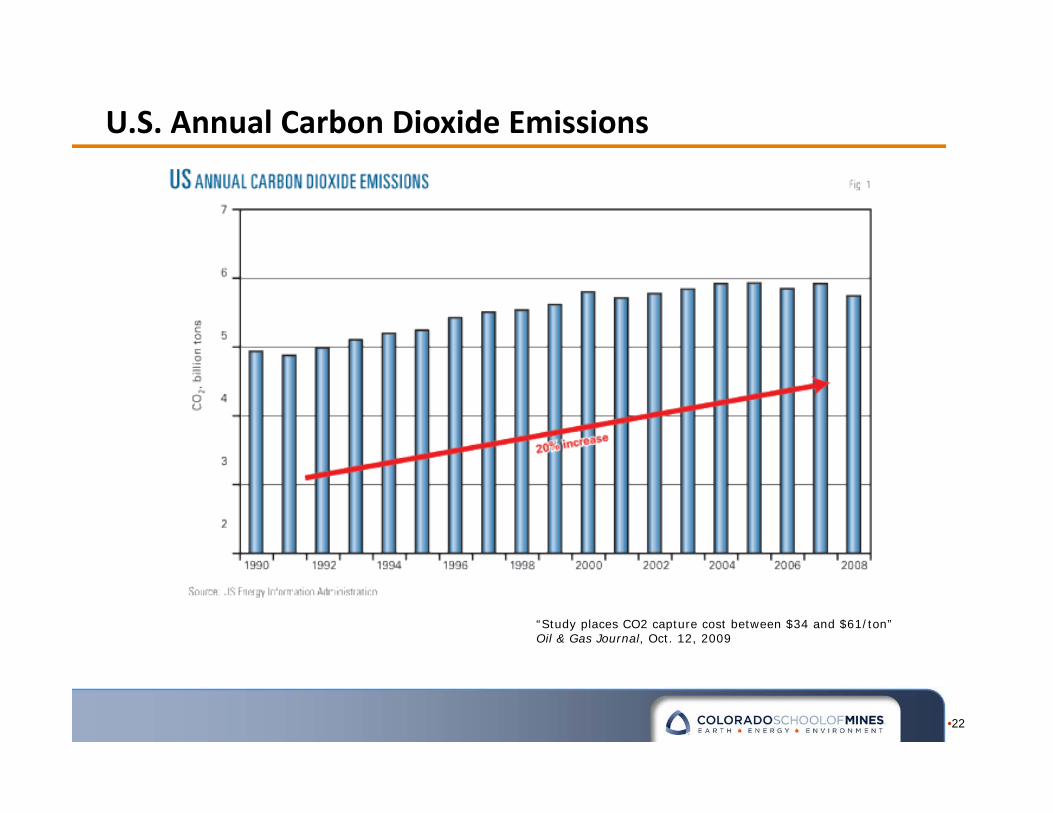
U.S. Annual Carbon Dioxide Emissions
•22
“Study places CO2 capture cost between $34 and $61/ton”Oil & Gas Journal, Oct. 12, 2009
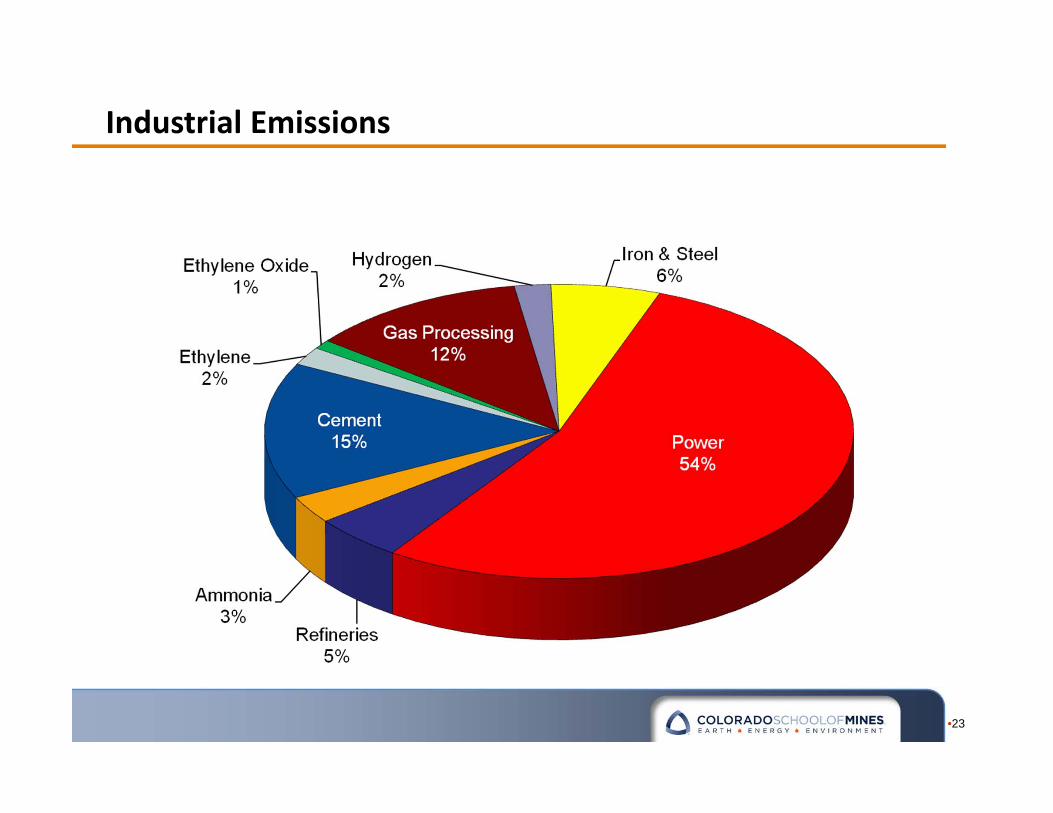
Industrial Emissions
•23
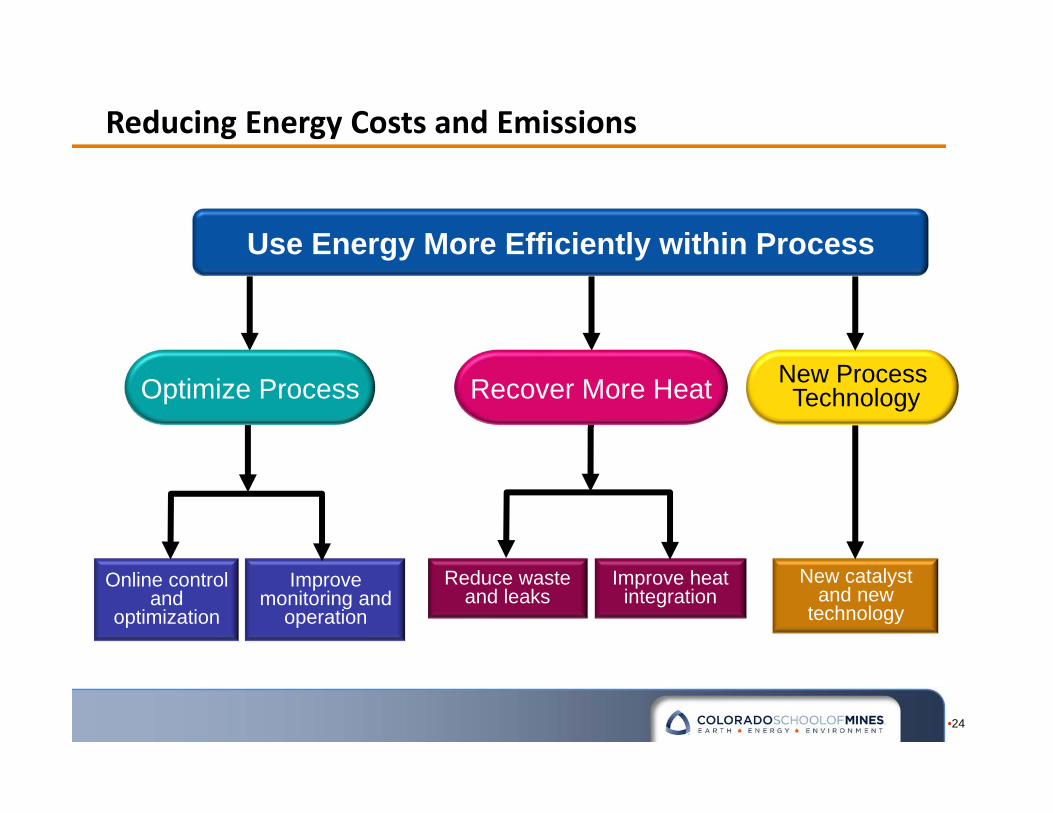
Use Energy More Efficiently within Process
New ProcessTechnology
Improve monitoring and
operation
Online control and
optimization
Improve heat integration
Reduce waste and leaks
New catalyst and new
technology
Recover More HeatOptimize Process
Reducing Energy Costs and Emissions
•24

Topics
•History of international action
•U.S. Government Mandates
•GHG Emissions Control
Cap‐and‐Trade Program
Alternatives
• Carbon Capture & Storage
•25

Carbon Capture & Storage (CCS)
• CO2 Capture Technologies Post‐Combustion
Pre‐Combustion
Oxy‐Combustion
• Transport
• Storage / Sequestration
• Issues
•26
CO2 Capture Routes
• Post‐Combustion
Capture CO2 from flue gas after combustion device
• Pre‐Combustion
Gasify / convert fuel to CO2 and hydrogen (H2)
Capture CO2 prior to combustion device
Use H2 for fuel
•Oxy‐Combustion
Air Separation Unit (ASU) to produce oxygen (O2)
Use O2 & fuel for combustion
Condense water (H2O) from flue gas
Resulting flue gas is a CO2 stream
•27
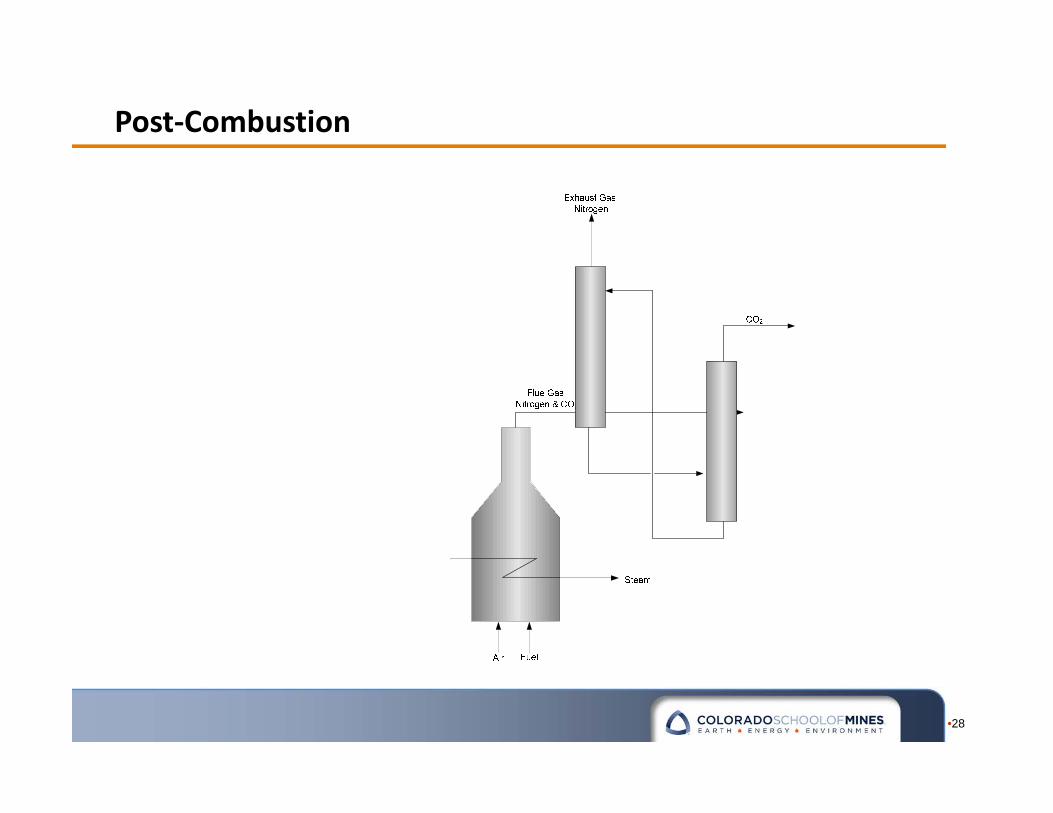
Post‐Combustion
•28
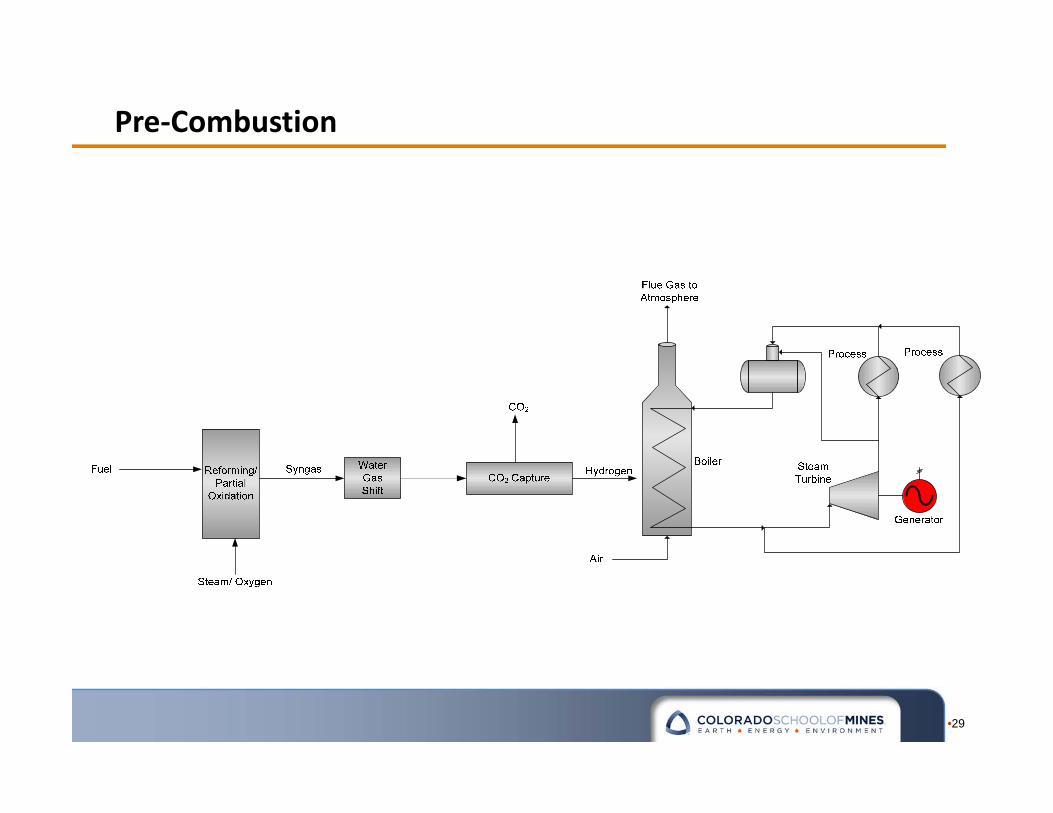
Pre‐Combustion
•29
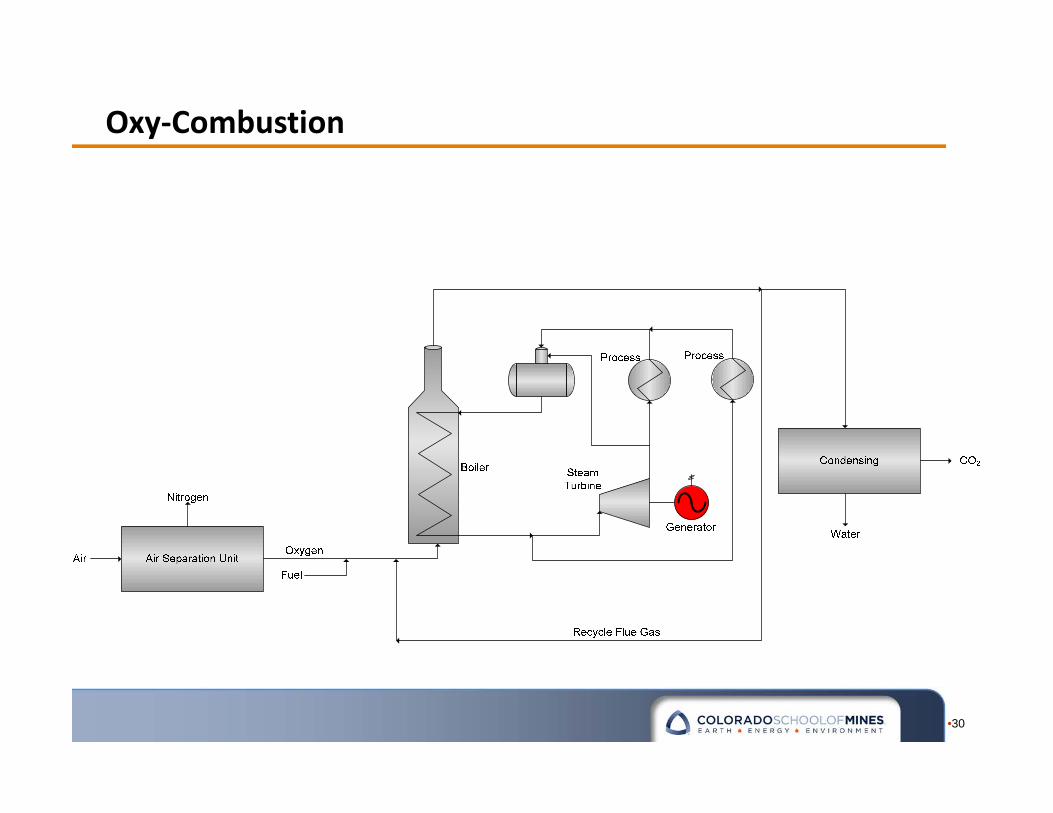
Oxy‐Combustion
•30

Merits of CO2 Capture Approaches
•31
Advantages Barriers to Implementation
Post‐combustion • Applicable to the majority of existing coal‐fired power plants
• Retrofit technology option
Flue gas is . . .
•Dilute in CO2
•At ambient pressure
. . . Resulting in . . .
•Low CO2 partial pressure
– Significantly higher performance or circulation volume required for high capture levels
– CO2 produced at low pressure compared to sequestration requirements
Pre‐combustion Synthesis gas is . . .
• Concentrated in CO2
• High pressure
. . . Resulting in . . .
• High CO2 partial pressure
– Increased driving force for separation
– More technologies available for separation
• Potential for reduction in compression costs/loads
• Applicable mainly to new plants, as few gasification plants are currently in operation
• Barriers to commercial application of gasification are common to pre‐combustion capture
• Availability
• Cost of equipment
• Extensive supporting systems requirements
Oxy‐combustion • Very high CO2 concentration in flue gas
• Retrofit and repowering technology option
• Large cryogenic O2 production requirement may be cost prohibitive
• Cooled CO2 recycle required to maintain temperatures within limits of combustor materials
• Decreased process efficiency
• Added auxiliary load

Gas Separation
PolydimethylsiloxanePolyphenyleneoxide
Gas Absorption
Polypropelene
Adsorber Beds
AluminaZeoliteActivated C
RegenerationMethod
Pressure SwingTemperature SwingWashing
Absorption Adsorption Cryogenics Membranes Microbial/ Algae Systems
CO2 Removal
Chemical
MEACausticOther
Physical
SelexolRectisolOther
Ceramic BasedSystems
CO2 Removal Technologies
•32

PermanentStorage
Solid Storage(Insulated)
Forests &Terrestrial Sys
Marine Algae
Deep OceanInjection
UnconfinedRelease
Dense PlumeFormation
Dry IceInjection
GeologicSequestration
OceanSequestration
BiologicalSequestration Other Methods
CO2 Sequestration/Storage
Salt Domes
Depleted Oil& Gas Wells
AbandonedCoal Seams
CO2 Sequestration and Storage
•33
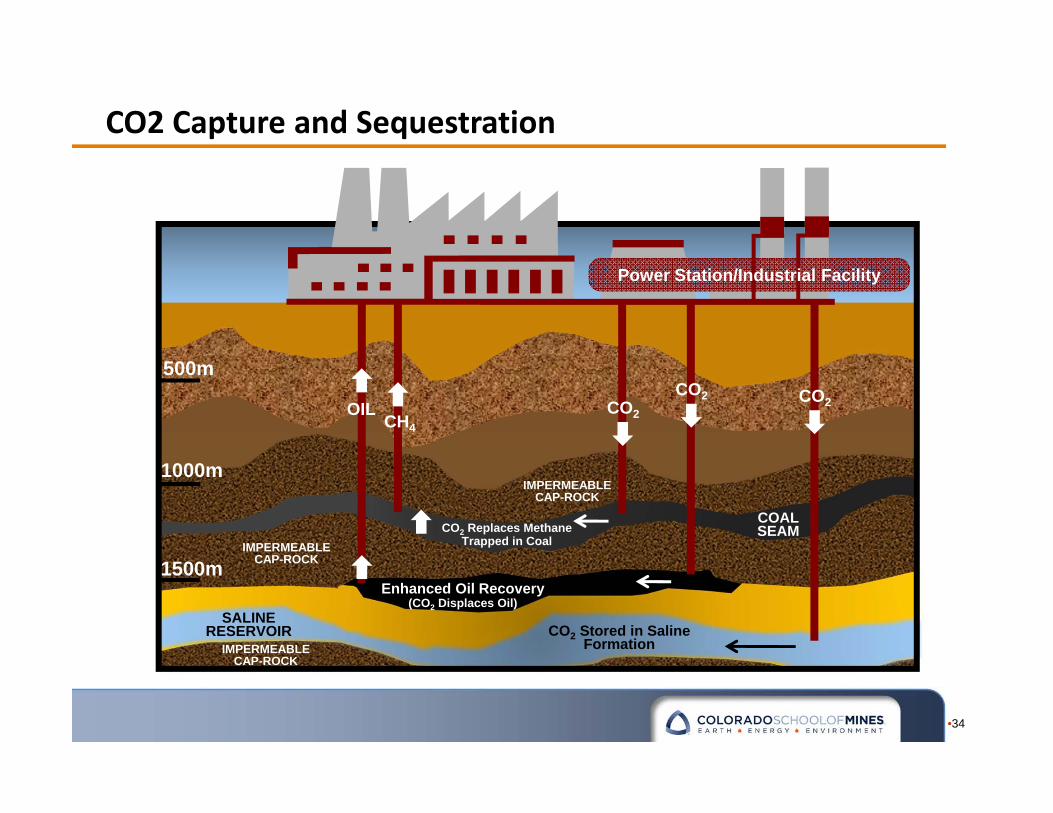
Power Station/Industrial Facility
CO2CO2
CO2
COAL SEAM
CH4OIL
500m
1000m
1500m
SALINE RESERVOIR
Enhanced Oil Recovery(CO2 Displaces Oil)
CO2 Stored in Saline Formation
CO2 Replaces Methane Trapped in CoalIMPERMEABLE
CAP-ROCK
IMPERMEABLE CAP-ROCK
IMPERMEABLE CAP-ROCK
CO2 Capture and Sequestration
•34
CO2 Capture & Storage (CCS) Issues
• Capture 75 ‐90% of the CCS cost
High capital cost & energy penalties
• Transport Infrastructure
• Pipeline
• Right of ways
Limited by economics of transport distance
• Storage Long‐term storage & liability
Land & mineral access rights for geologic storage
• Research Focus Cost & energy penalty reductions
Providing scientific and operational basis for safe & effective injection & long‐term storage
•35

CO2 Sources
•36
“Study places CO2 capture cost between $34 and $61/ton”Oil & Gas Journal, Oct. 12, 2009

CO2 Sources & Disposition Options
•37“Study places CO2 capture cost between $34 and $61/ton”Oil & Gas Journal, Oct. 12, 2009
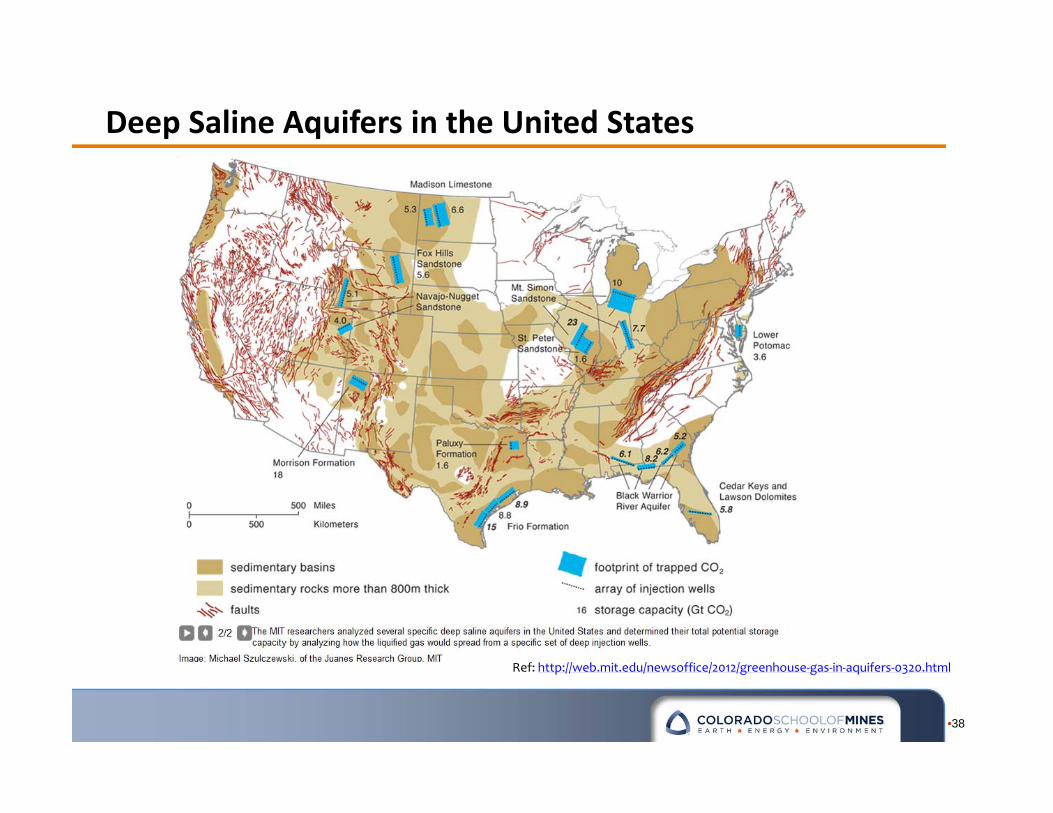
Deep Saline Aquifers in the United States
•38
Ref: http://web.mit.edu/newsoffice/2012/greenhouse‐gas‐in‐aquifers‐0320.html
Topics
•History of international action
•U.S. Government Mandates
•GHG Emissions Control
Cap‐and‐Trade Program
Alternatives
• Carbon Capture & Storage
•39


![KYOTO-OSAKA KYOTO KYOTO-OSAKA SIGHTSEEING PASS … · KYOTO-OSAKA SIGHTSEEING PASS < 1day > KYOTO-OSAKA SIGHTSEEING PASS [for Hirakata Park] KYOTO SIGHTSEEING PASS KYOTO-OSAKA](https://img.pdfslide.us/doc/110x75/5ed0f3d62a742537f26ea1f1/kyoto-osaka-kyoto-kyoto-osaka-sightseeing-pass-kyoto-osaka-sightseeing-pass-.jpg)