Embed Size (px)
Citation preview
Carbon Capture and Storage An Assessment
A V600 Capstone Course
Spring 2010
Submitted May 4, 2010
Revised May 26, 2010
Authors and Contributors
Graduate Student Authors:
Anthony, Lauren
Baatz, Brendon
Behnken, Nicholas
Beverage, Mckenzie
Cui, Jie
Galer, Rose
Hartman, Devin
Highlands, Colin
Kang, Howon
Keating, Jacob
Keefer, Meghan
Kim, Kyungwoo
Klingman, Ashleigh
Lee, Keun Hoo
Mauldin, Katie
Palmer, Richy
Paradise, Laura
Sayik, Arif
Uyan, Burak
Wedell, Kelly
Yildirin, Hasan
Yigit, Ibrahim
Zou, Yonghua
Sponsor:
The Indiana University Center for Research in Energy
and the Environment (CREE), administered by the
School of Public and Environmental Affairs and a
member of the Indiana Consortium for Research in
Energy Systems and Policy, sponsored this capstone
course.
CREE assembles top scholars from multiple disciplines
to conduct innovative, timely and relevant research in
the broad area of energy, focusing specifically on:
• Advanced fossil fuels and nuclear power;
• Alternative or renewable energy resources;
• Local and regional carbon cycle dynamics;
• Environmental and economic consequences of
energy production and distribution.
Faculty Advisors:
Clinton V. Oster, Jr.
Professor of Public and Environmental Affairs
Indiana University School of Public and Environmental
Affairs
J. C. Randolph
Professor of Environmental Science
Indiana University School of Public and Environmental
Affairs
We would like to acknowledge the following
individuals for their contributions to this report:
Jared Ciferno – Technology Manager, Existing Plants
Manager
National Energy Technology Laboratory
Kenneth R. Richards – Associate Professor
Indiana University School of Public and Environmental
Affairs
John A. Rupp – Senior Research Scientist
Indiana Geological Survey
Table of Contents
Executive Summary i
Key Acronym List and Definitions iii
Chapter I: Introduction and Background 1
Chapter II: Carbon Capture 4
Carbon Capture Technologies 5
Retrofitting Existing Coal-fired Plants 12
Capture Risks 14
Capture Cost Analysis 17
Chapter III: Carbon Transport 19
Carbon Transport Technologies 20
Transport Risks 21
Transport Cost Analysis 22
Chapter IV: Carbon Storage 26
Carbon Storage Technologies 27
Storage Risks 34
Storage Cost Analysis 38
Monitoring, Mitigation and Verification 40
Chapter V: Legal and Regulatory Aspects 42
Apportionment of Liability 43
Temporal Issues of Liability 44
Current Legal Framework 49
Legal Constraints of Subsurface Property Rights 53
Chapter VI: Public Perception and Acceptance 57
Role and Influence of the Public 58
Current Public Perception 60
Recommendations for Engaging the Public 63
Chapter VII: Policy Instruments with Costs Comparisons 64
Domestic Policy Instruments 65
Cost Comparisons 67
Chapter VIII: International Policies, Regulations, and Public Acceptance 75
Global CO2 Emissions Projections 76
International Capture and Storage Potential 80
International CCS Policy 83
Mechanisms and Challenges to CCS Inclusion 84
Emerging Regional and Bi-lateral Agreements 85
International Public Perception 89
Chapter IX: Conclusions 91
References Cited 94
List of Tables 115
List of Figures 116
Appendices 117
i
Executive Summary
This report examines the role of carbon capture and storage (CCS) technologies as part of a
portfolio of carbon management strategies in the United States over the next 50 years. Based on
the findings from the Spring 2009 V600 Capstone on The Future of Electricity, worldwide
electricity consumption is projected to increase 350% from its current level over the next 50
years (Adamec et al., 2009). Alternative energy sources are projected to represent a greater
percentage of electricity generation in the future. However, fossil fuels such as coal and natural
gas are abundant resources that are expected to be extensively used in the next 50 years. Carbon
management strategies must consider mitigation methods to combat emissions CO2 from these
fossil fuels.
This report finds that CCS technologies raise the levelized cost of electricity in coal and natural
gas generating facilities by 1.3¢ to 2.2¢ per kWh (between 30% and 60%) depending on the
capture technology used and the type of generating facility. Coal fired and natural gas facilities
with carbon capture and storage were found to be more costly than nuclear power but were
cheaper than renewable electricity sources such as wind, solar thermal, and photovoltaic.
If reducing atmospheric carbon dioxide emissions from the electric power sector becomes a
national priority, we recommend policies that expedite CCS deployment. Federal funding for
research, development and deployment will be crucial to implement CCS on a commercial scale.
Our cost analysis demonstrates that fossil fuel technologies with CCS are cost effective
approaches to reduce CO2 emissions in the near- and medium-term future. We also find that
legal considerations and public perception will require attention if CCS is to be successfully
deployed. However, health and environmental effects, while necessary to acknowledge, were
not found to pose a significant barrier to CCS deployment.
Key Findings
IGCC technology has the highest cost of electricity (COE) without carbon capture, but has the
lowest incremental cost for adding capture. The COE for oxyfuel capture units becomes more
cost-competitive with the addition of capture to fossil fuel units. With capture technology,
natural gas combined cycles (NGCC) facilities and oxyfuel ultracritical process facilities emerge
as the least-cost fossil fuel technologies.
This report recommends government cost-sharing of a portfolio of pilot projects to develop
nascent carbon capture technologies. Capture technologies will benefit from learning-by-doing
with improved performance and lower costs. Initial commercial-scale testing of CCS will
improve the understanding of associated risks and costs necessary to develop long-term CCS
policy.
Additionally, this report finds that IGCC and oxy-fuel plants have yet to achieve commercial-
scale application. Our analysis indicates they are more cost-effective applications for CCS than
conventional coal. Therefore the promotion of such advanced coal technologies at commercial-
scale is advisable. Current domestic projects capture a fraction of the carbon necessary and thus
need to be scaled-up to 80-90% capture rates.

Storage risks need to be investigated through pilot projects implementing actual geologic
injection. The risks associated with increasing subsurface pressure from injecting massive
amounts of CO2 underground, including induced seismic activity and groundwater displacement,
are not adequately understood by simulation and need further testing in the field.
The selection criteria and financing of the recently chosen Department of Energy (DOE) projects
is an appropriate first step. However, the magnitude of expenditure and number of projects
funded would need to increase modestly to be consistent with suggestions made by energy
experts (NRC, 2008; Kuuskraa, 2007).
Course Information
A V600 capstone course at the Indiana University School of Public and Environmental Affairs
(SPEA) is an opportunity for master‟s students to apply knowledge acquired from the specialized
program concentrations in one comprehensive report. Capstone assignments require students to
analyze technological, environmental, legal, social, and economic implications of the topic and
recommend policies that incorporate them. Thus, capstone courses are designed to challenge
students to comprehensively research a topic that they may have little knowledge or experience
with, as well as make sound recommendations based on their analysis. The purpose of this 2010
V600 Capstone course is to analyze the role of carbon capture and storage technology as part of
a carbon management portfolio over the next 50 years.
ii
Key Acronym List and Definitions
BkWh-Billion Kilowatt Hour
Btu-British Thermal Units
CCS-Carbon Capture and Storage
CER-Certified Emission Reduction
CO2-Carbon Dioxide
DOE-Department of Energy
EIA- Energy Information Administration
ECBM-Enhanced Coal-Bed Methane
EOR – Enhanced Oil Recovery
EPA-US Environmental Protection Agency
EPACT-Energy Policy ACT
EUA-European Union Allowance
EUETS-European Union Emissions Trading
Scheme
GDP-Gross Domestic Product
GHG-Green House Gas
GW-Gigawatts
Gt – Gigatons
HVAC- Heating, Ventilating and Air-
Conditioning
HVDC-High Voltage Direct Current
IDM- Industrial Demand Module
IEA-International Energy Agency
IGCC-Integrated Gasification Combined
Cycle
IPCC-Intergovernmental Panel on Climate
Change
ITC-Investment Tax Credits
Km-Kilometers
KW-Kilowatts
kWe-Kilowatt Electricity
kWh- Kilowatt Hours
MIT-Massachusetts Institute of Technology
MMBtu-Million British Thermal Units
MMV-mitigation, monitoring and
verification
MPa – MegaPascals, Pressure
MW-Megawatts
NAICS- North American Industry
Classification System
NEMS- National Energy Modeling System
NETL-National Energy Technology
Laboratory
NGCC-Natural Gas with Combined-Cycle
NIMBY- Not In My Backyard
NOx-Nitrogen Oxides
OECD- Organization for Economic Co-
operation and Development
PC-Pulverized Coal
PM-Particulate Matter
PPM- Parts per million
PPP-Purchasing Power Parity
PTC-Production Tax Credits
PV-Photovoltaic
R and D-Research and Development
RCRA- Resource Conservation and
Recovery Act
RCSP-Regional Carbon Sequestration
Partnerships
RGGI-Regional Greenhouse Gas Initiative
UNEP-United Nations Environment
Programme
SDWA-Safe Drinking Water Act
SECARB-Southeast Regional Carbon
Sequestration Partnership
SO2-Sulfur dioxide
TPC- Total Plant Cost
UIC- Underground Injection Control
Program
UNFCCC- United Nations Framework
Convention on Climate Change
USDW- Underground Sources of Drinking
Water
iii

1
Chapter I: Introduction and Background
2
Introduction
According to the U.S. Environmental Protection Agency (EPA), the United States emitted
5.9 billion metric tons of CO2 into the atmosphere in 2008. Of that total, 2.3 billion metric
tons can be attributed to burning fossil fuels for electricity generation, representing
approximately 40% of the total U.S. carbon dioxide emissions in that year (EPA, 2010).
Given projections on the increasing use of coal to generate electricity in the future, ways
must be found to reduce atmospheric emissions of carbon dioxide while retaining the ability
to harness the massive coal resources available in the United States and elsewhere in the
world. The use of carbon capture and storage (CCS) systems on fossil-fuel electricity
generating stations is one option that would allow the United States, and other countries, to
continue coal use while reducing atmospheric emissions.1
Before large-scale deployment of carbon capture and storage (CCS) can occur, many
challenges surrounding the use of such technology must be addressed. These challenges
include cost-competitiveness, legal and regulatory obstacles, environmental and public health
risks, and social resistance. The costs of CCS relative to alternative low carbon energy
technologies will largely determine the extent of its deployment. Additionally, the
deployment of CCS may disproportionately impact a variety of stakeholders in numerous
ways. As a result, governments must carefully create policies that address all of these issues.
This report examines the possible roles for CCS, its impacts on various stakeholders and
corresponding regulations and policies. The goal is to advise policymakers in the United
States how CCS could best be incorporated into a carbon management strategy for the short,
medium, and long term and serve as an example for other countries worldwide. The findings
presented in this report will be of interest to CCS stakeholders, including the electric power
industry, investors, insurance companies, public health and environmental organizations,
regulatory agencies, local governments, and residents of communities with proposed CCS
sites.
Background
Current and Future Fossil Fuel Use
Although the uses of alternative energy technologies are increasing, projected fossil-fuel use
is not projected to decline in the near future. Specifically, the Energy Information
Administration (EIA) predicts fossil fuel consumption will still account for 78% of domestic
energy consumption in 2035. While this is down from 84% in 2008, the actual quantity of
fossil fuels consumed is predicted to grow 14% overall due to increased energy demands
(EIA, 2009).
EIA estimates coal and natural gas consumption to increase by 2035, with petroleum use
staying relatively constant. This rise is due to increasing petroleum costs, increases in the
number of coal-based power plants, and the expanding use of coal-to-liquid (CTL)
1 The terms “sequestration” and “storage” are used interchangeably in the literature. We have chosen to use the
term storage in this report.
3
technologies. Natural gas consumption is expected to increase 4% by 2035. The lower-cost
potential for natural gas, when compared to petroleum prices, is the main driving force for
growth in the long term. Consumption of liquid fuels, including both petroleum and biofuels,
is predicted to grow 9% by 2035. Biofuels will account for the majority of this growth while
petroleum use will remain constant (EIA, 2009). Excluding hydroelectricity, renewable
energy production is predicted to grow 2.8% annually. EIA also predicts that international
fossil-fuel energy consumption will increase 42% by 2030. Coal consumption will increase
47%, while renewable energy will increase 48% by 2030 (EIA, 2006).
Current and Future CCS Technology
Currently, there are no large-scale carbon capture projects operating in the United States.
There are smaller projects capturing carbon in industrial processes, but carbon capture has
not been applied to large-scale electricity generating plants (plants greater than 400 MW),
primarily due to the absence of policies mandating reductions in carbon emissions. Some
companies, however, are planning for regulations which will limit CO2 emissions. In
Edwardsport, Indiana, Duke Energy is constructing a 630 megawatt integrated gasification
combined cycle (IGCC) coal-fired power plant. Once completed, the Edwardsport IGCC
plant will be the third of its kind in the United States and the largest in terms of generation
capacity. The plant offers state-of-the-art pollution control equipment and drastically reduces
air pollutants through its gasification process. Also, this type of plant is ideal for the capture
of carbon dioxide. In 2009, Duke Energy sought approval from the Indiana Utility
Regulatory Commission to begin site surveys for potential geologic storage sites. The IGCC
plant has an estimated completion date of 2012 and an estimated cost of three billion dollars.
While it is important to consider technological changes in newly constructed fossil fuel
plants, it is also very important to examine existing plants. According to the EIA, there are
390 coal plants and 748 natural gas plants currently operating in the United States.2 The
Department of Energy‟s National Energy Technology Laboratory (NETL) has been leading
research efforts into retrofitting existing plants for carbon capture and storage. This research
has produced promising results on the future of retrofitting plants which could significantly
reduce the costs of implementation. One of the primary technological challenges to large-
scale CCS implementation is finding low cost methods for the capture of CO2.
2 These plants have a minimum summer capacity of 100 megawatts (EIA, 2010).

4
Chapter II: Carbon Capture
5
Carbon Capture Technologies The carbon capture and storage process involves three separate, yet integrated processes of
capture, transport, and storage. The capture stage of the process involves the physical
separation of carbon dioxide from its source. The captured carbon dioxide is then
compressed to produce a concentrated fluid to be transported and stored. The following
section outlines various technologies for capture of carbon dioxide from electricity
generating plants.
Of the stages involved in the carbon capture and storage process, the capture phase is the
highest cost component representing as much as of 80% of the total cost (Folger, 2009).
Capture costs are a combination of initial capital investment, operation and maintenance, and
reductions in overall electricity output. Commercially available capture technologies, as well
as those under development, require additional amounts of electricity to operate. Most also
require significant amounts of heat and water for various chemical and other operating
processes, thus adding to the operating costs.
Carbon capture technology is still in an early phase of development and has yet to be
demonstrated on a large scale. Much of what has been done is preliminary research and
smaller demonstration projects. While this early research has yielded valuable information
on capture technologies, many questions remain regarding the costs associated with this
technology.
Post-Combustion Capture Systems
Post-combustion capture of CO2 is the separation of carbon dioxide from the flue gas
emission stream of a pulverized coal power plant. The separation can be done with solvents,
membranes, absorbents, or cryogenic methods (Baker, 2009). The more fully developed
technologies are discussed below. These technologies are applicable to the majority of
existing plants through retrofitting options (Figueroa, 2008). A high concentration of CO2 in
the flue gas stream of approximately 15% aids the capture process (IEA, 2006). While
several technologies are commercially available to capture CO2 in this manner, no economic
incentives or legal requirements exist to compel plants to implement such systems.
There are some significant barriers to the use of post-combustion capture. One problem is
that the flue gas is at atmospheric pressure when it exits the stack; therefore has a very low
thermodynamic driving force (Figueroa, 2008). This low pressure CO2 requires considerable
compression for storage. Compression occurs directly after capture and can represent a
substantial portion of the cost of the storage process. Another barrier to the widespread use
of capture technology is the necessity to scale-up from demonstration phase facilities to
commercial power plants.
Amine-based Wet Scrubbing
Amines are organic compounds that react with CO2 to create water-soluble compounds.
Because CO2 is an acidic gas, alkaline solvents such as monoethanolamine (MEA) form
6
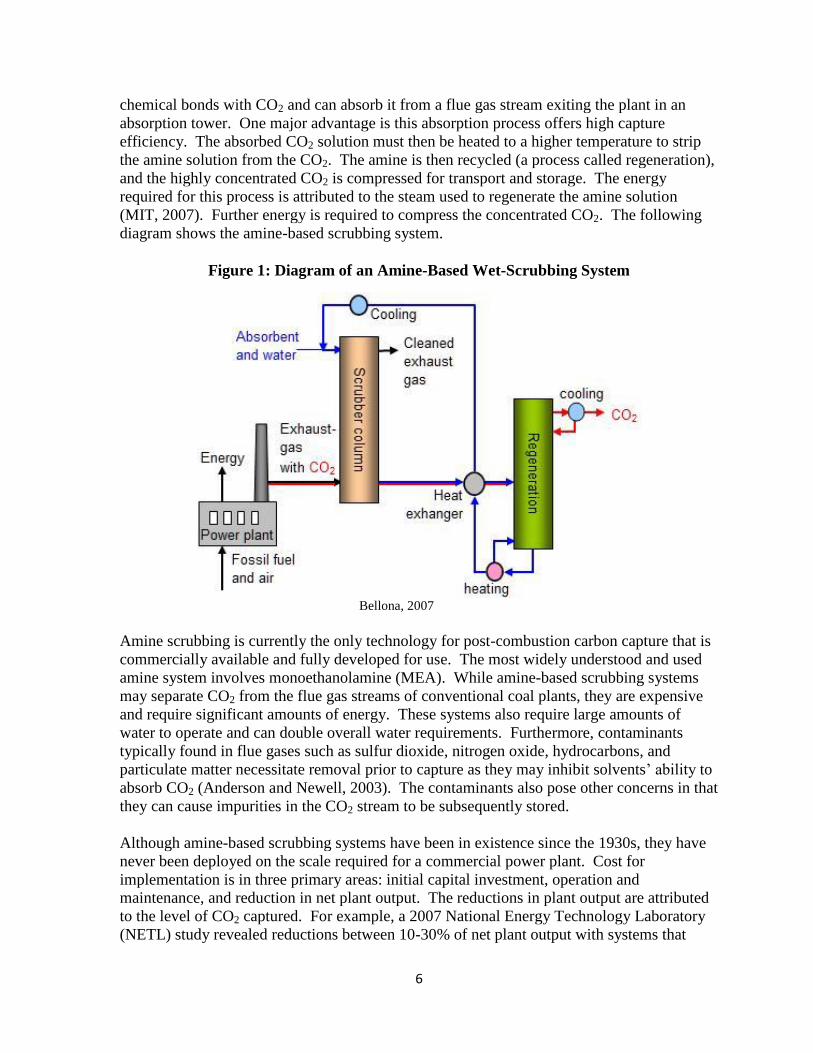
chemical bonds with CO2 and can absorb it from a flue gas stream exiting the plant in an
absorption tower. One major advantage is this absorption process offers high capture
efficiency. The absorbed CO2 solution must then be heated to a higher temperature to strip
the amine solution from the CO2. The amine is then recycled (a process called regeneration),
and the highly concentrated CO2 is compressed for transport and storage. The energy
required for this process is attributed to the steam used to regenerate the amine solution
(MIT, 2007). Further energy is required to compress the concentrated CO2. The following
diagram shows the amine-based scrubbing system.
Figure 1: Diagram of an Amine-Based Wet-Scrubbing System
Bellona, 2007
Amine scrubbing is currently the only technology for post-combustion carbon capture that is
commercially available and fully developed for use. The most widely understood and used
amine system involves monoethanolamine (MEA). While amine-based scrubbing systems
may separate CO2 from the flue gas streams of conventional coal plants, they are expensive
and require significant amounts of energy. These systems also require large amounts of
water to operate and can double overall water requirements. Furthermore, contaminants
typically found in flue gases such as sulfur dioxide, nitrogen oxide, hydrocarbons, and
particulate matter necessitate removal prior to capture as they may inhibit solvents‟ ability to
absorb CO2 (Anderson and Newell, 2003). The contaminants also pose other concerns in that
they can cause impurities in the CO2 stream to be subsequently stored.
Although amine-based scrubbing systems have been in existence since the 1930s, they have
never been deployed on the scale required for a commercial power plant. Cost for
implementation is in three primary areas: initial capital investment, operation and
maintenance, and reduction in net plant output. The reductions in plant output are attributed
to the level of CO2 captured. For example, a 2007 National Energy Technology Laboratory
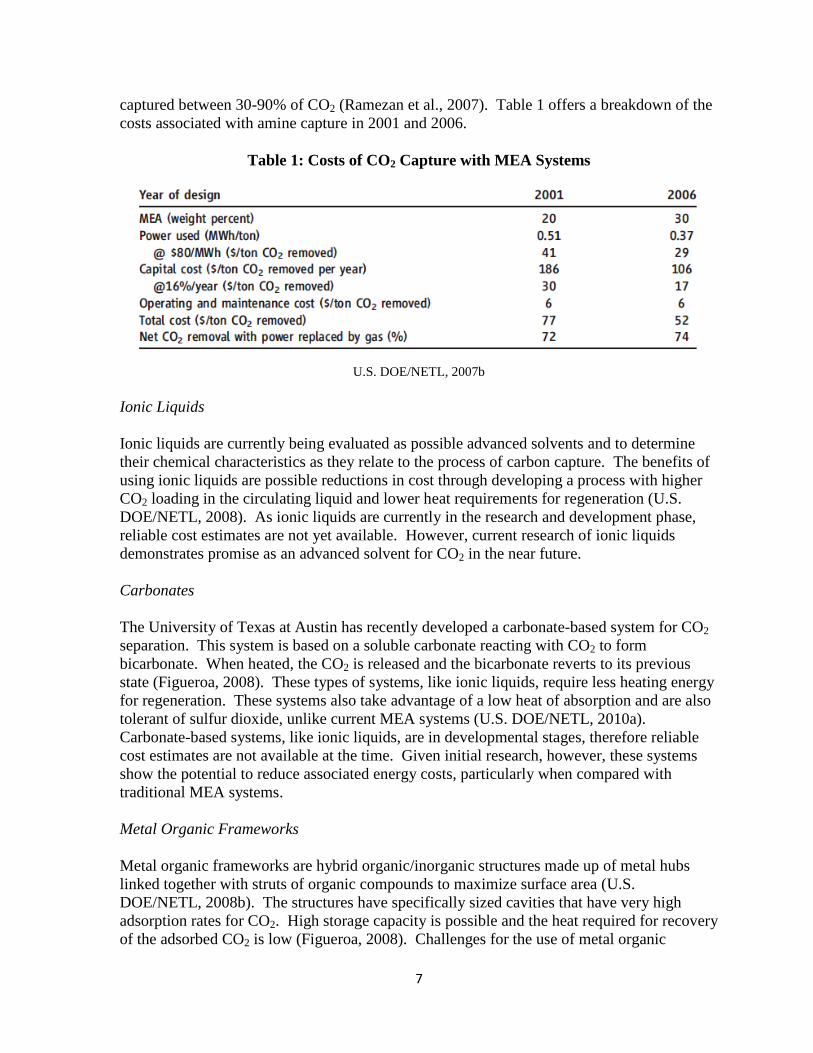
(NETL) study revealed reductions between 10-30% of net plant output with systems that
7
captured between 30-90% of CO2 (Ramezan et al., 2007). Table 1 offers a breakdown of the
costs associated with amine capture in 2001 and 2006.
Table 1: Costs of CO2 Capture with MEA Systems
U.S. DOE/NETL, 2007b
Ionic Liquids
Ionic liquids are currently being evaluated as possible advanced solvents and to determine
their chemical characteristics as they relate to the process of carbon capture. The benefits of
using ionic liquids are possible reductions in cost through developing a process with higher
CO2 loading in the circulating liquid and lower heat requirements for regeneration (U.S.
DOE/NETL, 2008). As ionic liquids are currently in the research and development phase,
reliable cost estimates are not yet available. However, current research of ionic liquids
demonstrates promise as an advanced solvent for CO2 in the near future.
Carbonates
The University of Texas at Austin has recently developed a carbonate-based system for CO2
separation. This system is based on a soluble carbonate reacting with CO2 to form
bicarbonate. When heated, the CO2 is released and the bicarbonate reverts to its previous
state (Figueroa, 2008). These types of systems, like ionic liquids, require less heating energy
for regeneration. These systems also take advantage of a low heat of absorption and are also
tolerant of sulfur dioxide, unlike current MEA systems (U.S. DOE/NETL, 2010a).
Carbonate-based systems, like ionic liquids, are in developmental stages, therefore reliable
cost estimates are not available at the time. Given initial research, however, these systems
show the potential to reduce associated energy costs, particularly when compared with
traditional MEA systems.
Metal Organic Frameworks
Metal organic frameworks are hybrid organic/inorganic structures made up of metal hubs
linked together with struts of organic compounds to maximize surface area (U.S.
DOE/NETL, 2008b). The structures have specifically sized cavities that have very high
adsorption rates for CO2. High storage capacity is possible and the heat required for recovery
of the adsorbed CO2 is low (Figueroa, 2008). Challenges for the use of metal organic
8
frameworks as a CO2 capture technology are problems of moisture and contaminants in the
flue gas stream affecting adsorption (U.S. DOE/NETL, 2010a). Substantial research is
underway to overcome these challenges.
Amine-based Dry Scrubbing
In an attempt to overcome the problems associated with large amounts of water needed for
wet scrubbing amine systems, researchers are exploring the use of solids to react with CO2
(Gray, 2005). These solids, mostly amine based, react with CO2 to form stable compounds
under one set of operating conditions and be regenerated in completely different conditions
to form the same compounds (Figueroa, 2008). Currently, pilot scale tests are being
conducted on a small number of these systems. The goal is to create a solid sorbent that will
have a lower energy penalty than MEA systems.
Physical Solvents
Physical solvents are used in CO2 capture due to their ability to selectively absorb carbon
without a chemical reaction. The amount of carbon absorbed depends on the solvent being
used, the pressure of the CO2 gas in the stream, and the temperature (Figueroa et al., 2006).
Physical solvents have proven to be reliable with solvents, such as Selexol and Rectisol,
having been used for SO2 removal for over 30 years. Previously, the captured CO2 was
vented into the atmosphere while the captured SO2 was scrubbed out of the stream. These
processes are efficient in capturing CO2, but are energy intensive due to the heat transfer
involved. In order for these solvents to work, the pre-combusted pressurized stream of
syngas must be lowered from a temperature of 500°F to 100°F or less. This lowers an IGCC
plant‟s net efficiency by 3-8% (Ciferno, 2010).
Although using physical solvents for capture is a tested and ready-to-use system, it is still
expensive and capital intensive. A new IGCC plant with no CO2 capture has a total
approximate plant cost (TPC) of $1,900/kWe, depending on the gasification system used. A
new plant with CO2 capture has an approximate TPC of $2,500/kWe. This raises the cost of
electricity by an average of 37%, with an avoided cost of carbon at $43/ton for IGCC plants
utilizing Selexol solvents (U.S. DOE/NETL, 2009a).
Permeable Membranes
Researchers are also examining the possible use of membranes to capture CO2 from flue gas
streams. These systems use permeable or semi-permeable materials that allow for the
selective transport and separation of CO2 from flue gas (Ciferno, 2009). These systems have
demonstrated their most effective use in high-pressure applications, but have shown promise
in post-combustion situations as well. In January 2010, the Cholla Power Plant in Holbrook,
Arizona began testing a pilot membrane system using a series of inorganic membranes.
Membrane systems have many advantages. They would reduce costs by avoiding the
expensive absorber system required with amine-based systems (U.S. DOE/NETL, 2008c).
9
The systems also involve no chemical reactions and no moving parts (U.S. DOE/NETL,
2010a). However, membrane capture systems are still in the early phases of development
and will require more research prior to use on a large scale.
Polymer-based Membranes
Polymer-based membranes are under research for the absorption of CO2 from syngas
streams. Membranes are less energy intensive than other types of capture, they require no
temperature or pressure modifications, and they are typically low-maintenance operations
(Figueroa et al., 2006). Commercially available membrane technologies are not stable in the
harsh environments of IGCC plants. They are susceptible to chemical degradation by the
process steam, a problem exacerbated by the plant‟s high temperatures (U.S. DOE/NETL,
2008c).
One membrane under development by NETL has demonstrated long-term hydrothermal
stability, sulfur tolerance, and overall durability in a simulated industrial coal-derived syngas
environment (Figueroa et al., 2006). Research and development of this type of membrane is
funded by a $4 million grant from the Department of Energy as a non-DOE investment of
$1.5 million (U.S. DOE/NETL, 2010a). This technology has been used in post-combustion
capture with polymer-based and ionic liquid membranes, but it faces setbacks for use as a
pre-combustion technology due to the large differences in environmental temperature and
pressure. NETL has set a goal of producing a commercial-ready version of these membranes
by 2012. These membranes will have a 90% capture rate with a parasitic power loss of less
than 10% (Ciferno, 2010).
Natural Gas Combined Cycle (NGCC) Systems
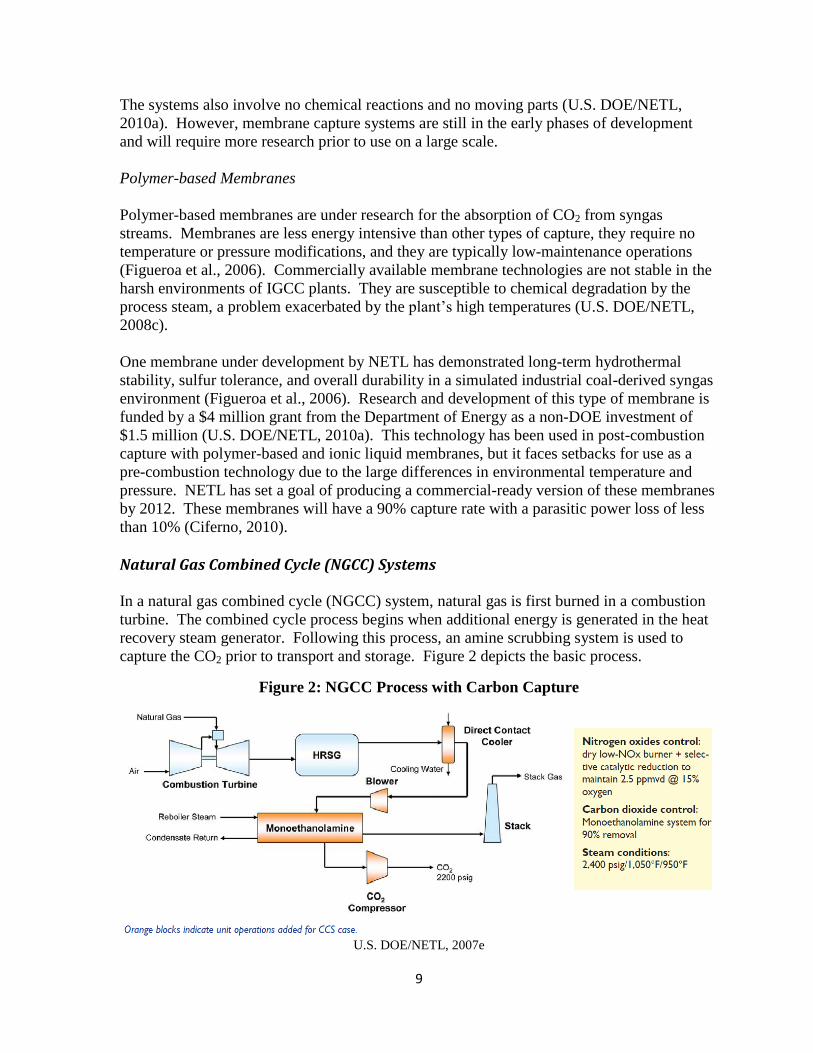
In a natural gas combined cycle (NGCC) system, natural gas is first burned in a combustion
turbine. The combined cycle process begins when additional energy is generated in the heat
recovery steam generator. Following this process, an amine scrubbing system is used to
capture the CO2 prior to transport and storage. Figure 2 depicts the basic process.
Figure 2: NGCC Process with Carbon Capture
U.S. DOE/NETL, 2007e
10
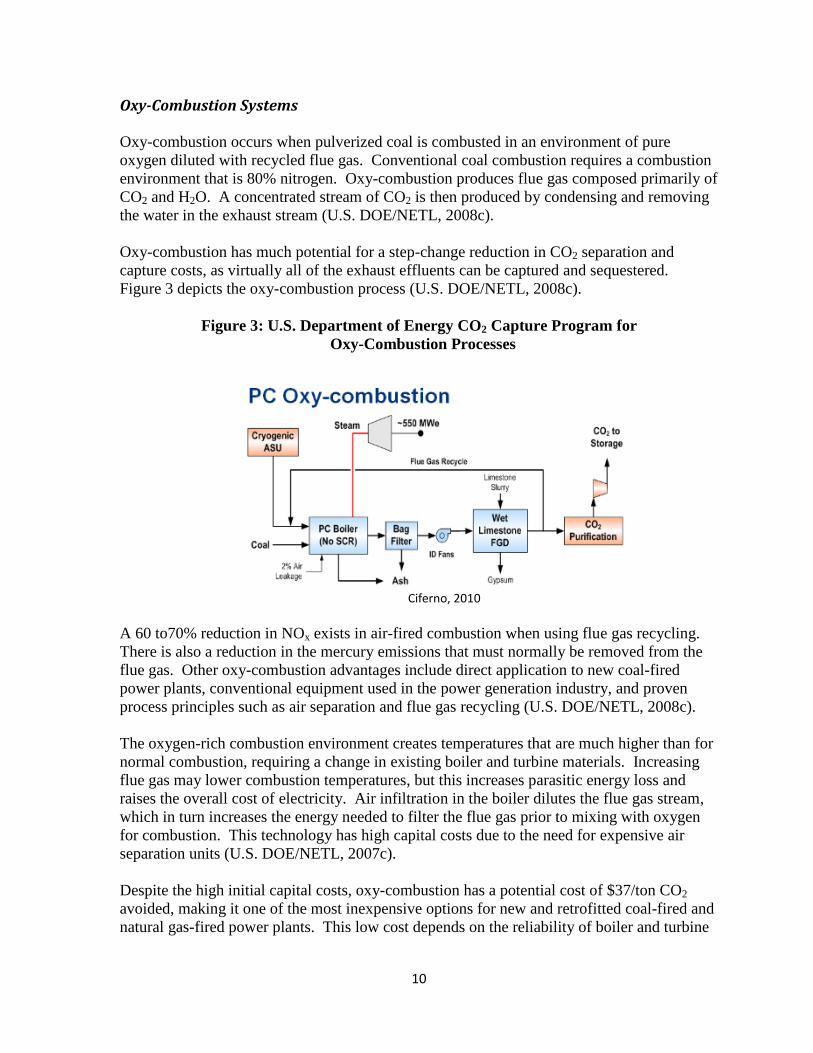
Oxy-Combustion Systems Oxy-combustion occurs when pulverized coal is combusted in an environment of pure
oxygen diluted with recycled flue gas. Conventional coal combustion requires a combustion
environment that is 80% nitrogen. Oxy-combustion produces flue gas composed primarily of
CO2 and H2O. A concentrated stream of CO2 is then produced by condensing and removing
the water in the exhaust stream (U.S. DOE/NETL, 2008c).
Oxy-combustion has much potential for a step-change reduction in CO2 separation and
capture costs, as virtually all of the exhaust effluents can be captured and sequestered.
Figure 3 depicts the oxy-combustion process (U.S. DOE/NETL, 2008c).
Figure 3: U.S. Department of Energy CO2 Capture Program for
Oxy-Combustion Processes
Ciferno, 2010
A 60 to70% reduction in NOx exists in air-fired combustion when using flue gas recycling.
There is also a reduction in the mercury emissions that must normally be removed from the
flue gas. Other oxy-combustion advantages include direct application to new coal-fired
power plants, conventional equipment used in the power generation industry, and proven
process principles such as air separation and flue gas recycling (U.S. DOE/NETL, 2008c).
The oxygen-rich combustion environment creates temperatures that are much higher than for
normal combustion, requiring a change in existing boiler and turbine materials. Increasing
flue gas may lower combustion temperatures, but this increases parasitic energy loss and
raises the overall cost of electricity. Air infiltration in the boiler dilutes the flue gas stream,
which in turn increases the energy needed to filter the flue gas prior to mixing with oxygen
for combustion. This technology has high capital costs due to the need for expensive air
separation units (U.S. DOE/NETL, 2007c).
Despite the high initial capital costs, oxy-combustion has a potential cost of $37/ton CO2
avoided, making it one of the most inexpensive options for new and retrofitted coal-fired and
natural gas-fired power plants. This low cost depends on the reliability of boiler and turbine
11
technology and their ability to withstand significantly increased temperatures (Figueroa et al.,
2008).
Chemical Looping with Oxy-combustion
A limestone-based oxygen carrier would create a highly concentrated CO2 stream and allow
for reuse of the flue gas stream in a loop that requires no new release of oxygen to facilitate
combustion (Figueroa et al., 2008). Thus, there is no need for an oxygen plant to supply the
oxygen for combustion. Research has shown that this technology has great potential to be
the lowest-cost option for CO2 capture and removal, with an increased cost of electricity
(COE) at less than 20% (Ciferno, 2010). This process produces combustible gas and enough
excess heat to power an auxiliary turbine by steam and thereby reduce the total COE.
Obstacles for this option include developing an oxygen carrier material that can withstand
high temperature conditions, transporting the solids in the stream, and advancing membrane
and air separation unit technologies (Ciferno, 2010).
Pre-Combustion Carbon Capture Systems
Removing CO2 from a pre-combustion stream is an efficient way of capturing carbon ready
for storage. There are many different pre-combustion methods, some ready for use in
electricity generation and others still in the laboratory test phase. Examples of these
processes include integrated gasification combined cycle (IGCC) for synthesis gas (syngas)
production, use of physical solvents, ceramic membranes, or sorbents to absorb the CO2 from
syngas, and a process of chemical looping combustion and gasification.
In pre-combustion capture systems, CO2 is recovered from the process stream before the fuel
is burned. Because the CO2 is removed or diverted before combustion, the stream remains
pure and highly concentrated, and requires little to no treatment before storage. Pre-
combustion capture is more economical than post-combustion capture because flue gas
contains only 14% CO2. As pre-combustion capture involves converting fuels to a syngas,
flue gases contain less concentrated amounts of CO2 than the flue gases of non-gasified fuels
(Figueroa et al., 2008).
In the pre-combustion sorbent process, CO2 is filtered through porous materials such as a
lithium silicate, while kept at a high temperature and pressure. These materials are ideally
suited for removal of CO2 from syngas due to their ability to withstand high pressures and
temperatures, and their ability to remove nearly all CO2 from simulated syngas. Pre-
combustion sorbents offer greater adsorption capacities at higher pressures than when
chemical adsorbents are used. The sorbents are thereby more energy efficient as pressures do
not need adjustment between the stages of syngas production, CO2 removal, and
combustion. Given that energy loss does not occur and that pre-combustion sorbents
regenerating at a high rate require little replacement, this technology has a promising future.
If current testing shows this material is able to perform on a commercial level, sorbents may
quickly become one of the more economical choices for CO2 removal from IGCC and other
solid fuel gasification plants (Drage et al., 2010).
12
The costs of pre-combustion capture are still difficult to estimate. Although some of these
technologies have already been tested and are available for use today, others will need more
testing and pilot programs before commercial viability can be achieved.
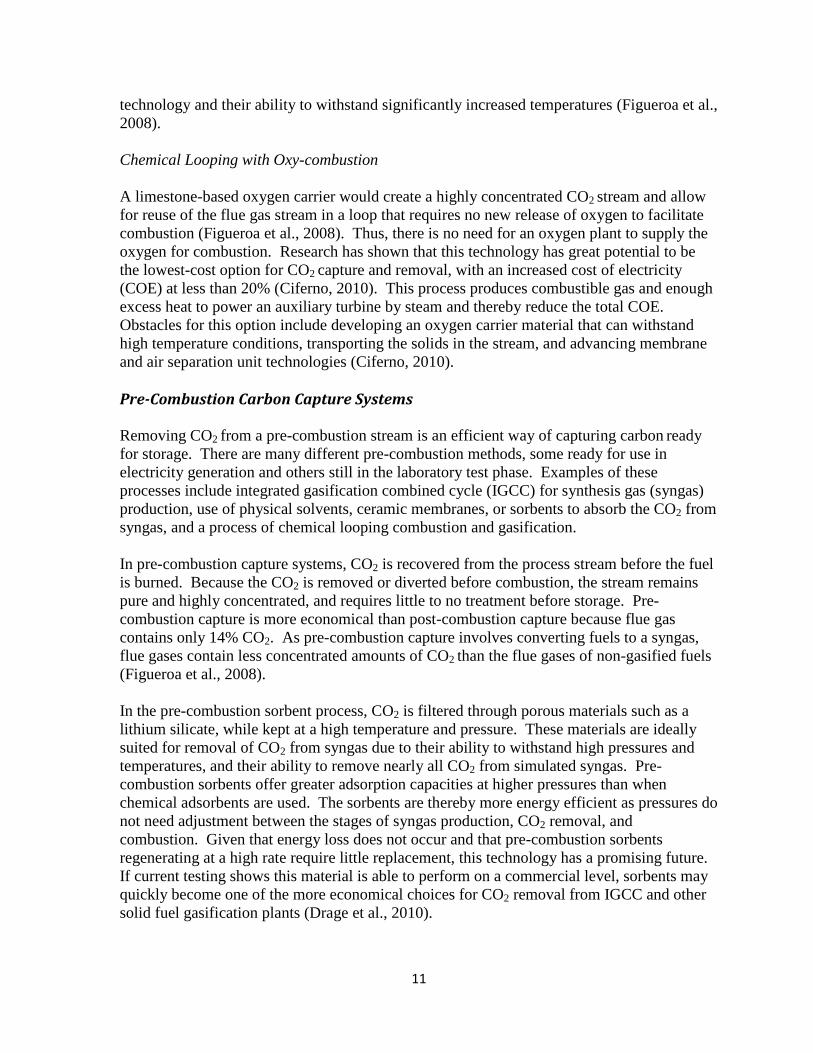
Integrated Gasification Combined Cycle (IGCC) Systems CO2 capture prior to combustion depends on the coal gasification process. Coal slurry (coal
and water) first reacts with oxygen at high temperatures to produce synthesis gas, which is a
mixture of CO, H2, and small amounts of nitrogen and sulfur. Steam is then added to the
syngas and sent to a shift converter where the water-gas shift reaction converts CO to CO2
and H2. The H2 is mixed with steam or nitrogen and sent to a combustion turbine while the
CO2 is separated. The CO2 can then be captured, often in combination with sulfur removal,
an operation mandated by the federal Clean Air Act. As in the NGCC process, the combined
cycle occurs when a heat recovery steam generator (HRSG) acquires the exhaust heat from
the combustion turbine that produces steam for the steam turbine. This produces additional
power and increases overall process efficiency (Figueroa et al., 2008). By removing the
emission-forming components from the syngas under pressure before combustion, an IGCC
power plant produces very low amounts of air pollutants and volatile mercury.
U.S. DOE/NETL, 2007c
Retrofitting Existing Coal-Fired Plants
An examination of carbon capture and storage in the United States would not be complete
without a discussion of retrofitting existing coal-fired power plants for capture. Although
construction of new coal-fired power plants has slowed in the last twenty years, the existing
fleet is very large and likely to remain in use for decades to come. Given the size of the
Figure 4: IGCC Process with Carbon Capture
13
existing fleet and its assumed contribution to baseload generation in the near future, a
greenhouse gas stabilization target cannot be met realistically without reductions from the
existing fleet (MIT, 2009). According to the EIA, 76% of coal-fired carbon emissions will
be attributed to existing coal-fired power plants in 2030 (EIA, 2007).
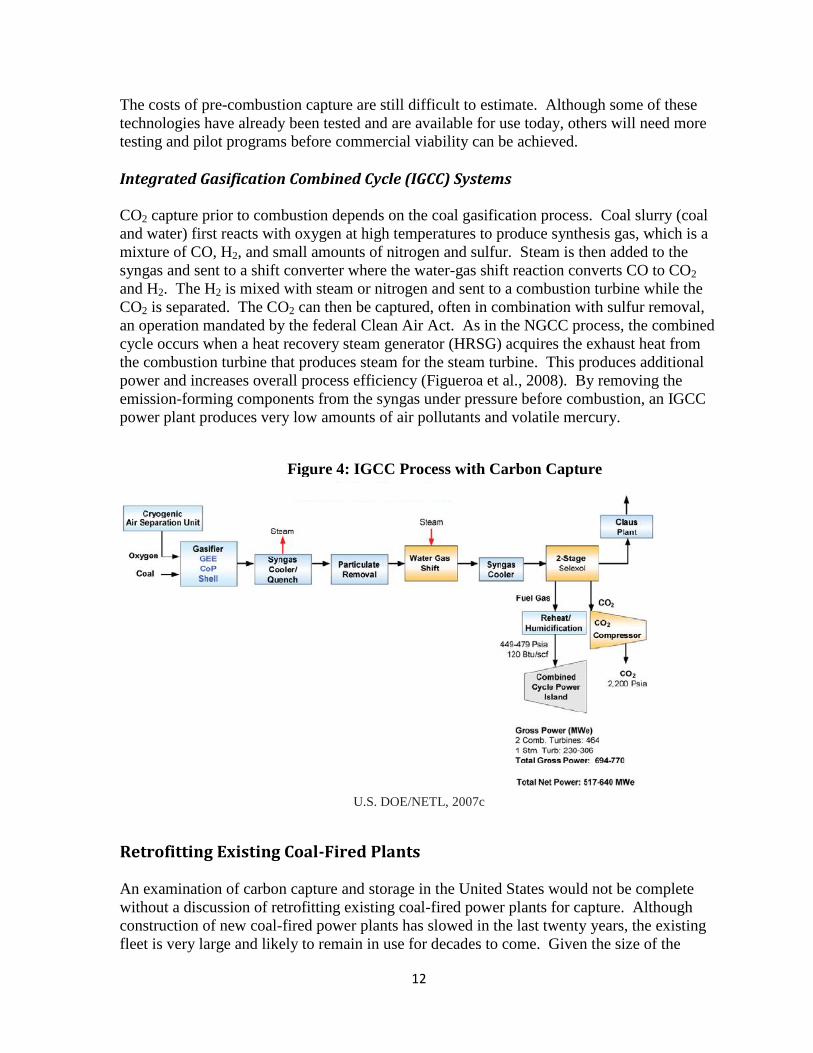
A survey of the existing coal-fired power facilities in the United States found 782 plants
currently in operation with a summer capacity greater than 100 MW (EIA, 2010). The
average age of these plants is approximately 40.4 years but that average is heavily influenced
by the 50% of plants that are greater than forty years. The most important data for this
analysis is the generation capacity by age: 70% of generating capacity is less than forty years
old with 38.4% falling in the 31 to 40 year old range. This age group of plants will be crucial
for retrofitting analysis, as many of these plants are candidates for retrofitting.
Table 2: Generating Units in the United States with 100 MW or greater Summer Capacity by
Age of Unit (EIA, 2010a).
There are a number of challenges to retrofitting existing units. Such challenges will reduce
the total number of plants that are likely candidates for retrofits. First, space limitations are a
significant challenge. Carbon capture infrastructure requires several acres of space and many
plants do not have this space available. Second, other pollution control devices will need to
be installed on those plants that do not have them currently installed. For example, current
MEA systems are unable to process flue gas streams containing modest amounts of sulfur
dioxide. These plants will have to be fitted with state-of-the-art pollution control systems.
Current capture technology requires a 40% increase in water use for operation, so supplying
the retrofitted plant with adequate water will also be a challenge. The regeneration aspect of
the capture process requires a large amount of water, as does the need for additional steam in
the separation process. For a unit to be economically attractive, a sufficient water supply
must be in the proximity of the generating unit. Other challenges to retrofitting existing units
include engineering large modifications, proximity to storage options, and maintaining
expected generation throughout the construction process (Ciferno, 2007).
The estimated additional costs required for retrofitting plants will vary depending on how
these challenges are addressed. For example, from December 2005 to December 2006, the
DOE funded a feasibility study at the AEP Conesville Plant near Conesville, Ohio. A 430
MW unit was retrofitted for a MEA capture system. This particular unit was originally

14
constructed in 1976 and required a flue gas desulfurization unit. Capital costs were well
below what was expected and totaled approximately $327,000,000 when completed (Ciferno,
2007).
The Conesville retrofit provided interesting results. First, no major technical barriers existed
when retrofitting the unit with an amine-based capture system. Second, the retrofit additions
consumed approximately four acres of land space. This study also revealed relationships
between the percentage of carbon captured and the costs associated with capture. A linear
relationship was found for the overall plant efficiency and the level of capture. The
efficiencies range from 24.4% to 31.6% as the capture rate decreases from 30% to 90%. A
linear relationship was also found for incremental investment costs. These costs ranged from
$540 to $1319 per kWe as the capture rate increases from 30% to 90%. Finally, it should be
noted that this study was conducted in 2007 and there have since been advances to these
amine systems that would improve plant performance (DOE/NETL, 2007). However, it
should also be noted that initial capital costs have increased significantly in recent years for
power plant construction and the $327,000,000 cost for the Conesville facility is likely lower
than current costs.
More research will need to be conducted to lower the overall costs of capture systems and to
eliminate or reduce the challenges discussed above. Additional research will also need to be
conducted regarding specific characteristics to narrow the list of plants most suited for
retrofits. Those most likely retrofit candidates will have sufficient water supplies, will be
close to suitable geologic storage sites, and will be larger plants of moderate ages.
Capture Risks
Human Health
Currently, little is known about health risks related to the amines used for large scale CO2
capture. Some amines and amine degradation products can have negative effects on human
health through irritation, sensitization, carcinogenicity, and genotoxicity.
These impacts represent worst-case scenarios, and the possible impacts are strongly
dependent on the type of amines used in the CO2 capture process and the actual amount of
amine emissions. Currently, a wide range of research activities are continuing to develop
new and improved amines, or mixtures of amines, for CO2 capture. While the main purpose
of this research is undoubtedly to reduce the energy consumption in the CO2 capture process,
and hence its cost of operation, it also has a clear objective to minimize health and
environmental impacts (Shao and Stangeland, 2009).
Environmental
Environmental concerns also arise from the construction and operation of CO2 capture
systems. While offering considerable ecological benefits through a reduction in greenhouse
gas emissions, the installation of capture units for post-combustion treatment could induce
unintentional and potential burdens to the environment through four emission pathways:
treated gas, process wastes, fugitive emissions, and accidental releases. For example, amines
15
can also be toxic to animals and aquatic organisms, with eutrophication and acidification
occurring in marine environments (Shao and Stangeland, 2009).
CO2 capture systems also require significant amounts of energy for their operation. This
reduces net plant efficiency, thereby requiring power plants to use more fuel to generate each
kilowatt-hour (kWh) of electricity. The increased fuel requirement results in additional
emissions per kWh generated relative to new state-of-the-art plants without CO2 capture. In
the case of coal, this also means proportionally larger amounts of solid limestone used by
pulverized coal plants for nitrogen oxide and sulfur dioxide emissions control (Thitakamol et
al., 2007).
Water Resources
Water withdrawal and consumption are important consequences of electric power generation
and will change if carbon capture and storage is implemented. Water use is defined as the
overall water supply that is impacted through water withdrawal. Water consumption is
defined as the water lost from a water source, which typically occurs through evaporation. A
plant using a once-through cooling cycle withdraws water from a source, applies it in the
once-through cycle, and then returns it to its source. An estimated 1% of water is lost, or
consumed, through evaporation or leaks during this process. If a plant uses cooling towers
which re-circulate the water, less water is withdrawn but more water is consumed through
evaporation. Water consumption through this process is estimated at 70-90% of the water
withdrawn. Although a once-through system withdrawals significantly more water from a
source, a re-circulating system consumes approximately ten times more (Hoffman et al.,
2004).
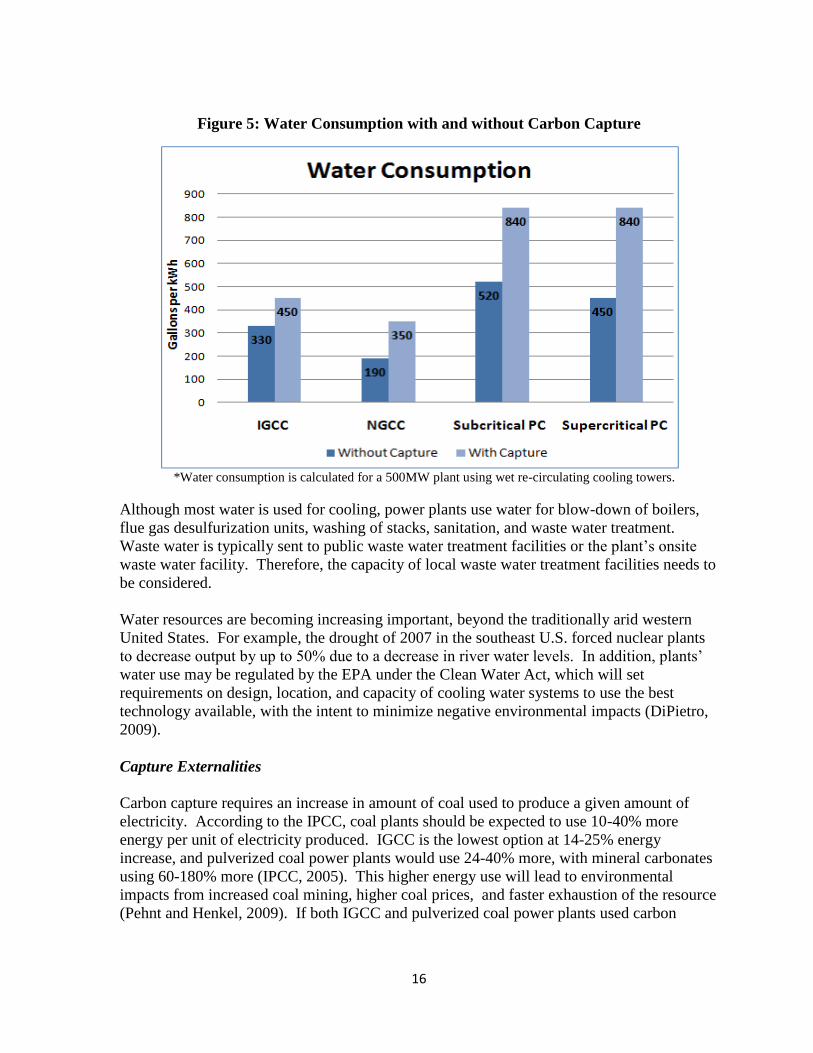
In Figure 5, water consumption is illustrated for four electricity generating technologies with
and without capture of CO2. All facilities are assumed to be 500MW plants. NGCC is the
lowest consumer of water, meaning that out of the four technologies compared, it loses the
least amount of water to evaporation or leaking (DiPietro, 2009).
16
Figure 5: Water Consumption with and without Carbon Capture
*Water consumption is calculated for a 500MW plant using wet re-circulating cooling towers.
Although most water is used for cooling, power plants use water for blow-down of boilers,
flue gas desulfurization units, washing of stacks, sanitation, and waste water treatment.
Waste water is typically sent to public waste water treatment facilities or the plant‟s onsite
waste water facility. Therefore, the capacity of local waste water treatment facilities needs to
be considered.
Water resources are becoming increasing important, beyond the traditionally arid western
United States. For example, the drought of 2007 in the southeast U.S. forced nuclear plants
to decrease output by up to 50% due to a decrease in river water levels. In addition, plants‟
water use may be regulated by the EPA under the Clean Water Act, which will set
requirements on design, location, and capacity of cooling water systems to use the best
technology available, with the intent to minimize negative environmental impacts (DiPietro,
2009).
Capture Externalities
Carbon capture requires an increase in amount of coal used to produce a given amount of
electricity. According to the IPCC, coal plants should be expected to use 10-40% more
energy per unit of electricity produced. IGCC is the lowest option at 14-25% energy
increase, and pulverized coal power plants would use 24-40% more, with mineral carbonates
using 60-180% more (IPCC, 2005). This higher energy use will lead to environmental
impacts from increased coal mining, higher coal prices, and faster exhaustion of the resource
(Pehnt and Henkel, 2009). If both IGCC and pulverized coal power plants used carbon
17
capture, then domestic consumption of coal resources would increase from 20.6 quadrillion
BTU to 25.75 quadrillion BTU, an average increase of 25.75% (EIA, 2008).
Other externalities of carbon capture include the potential of more mountaintop removal
mining and the degradation of water in coal mining areas that accompany an increase in
mining (Derbach, 2009). In addition to mining, there are environmental impacts along the
process chain, such as solvent production and disposal, energy requirements for solvent
regeneration, and energy requirements for CO2 transportation.
Capture Cost Analysis
The plant size and lifetime parameters in this cost analysis were based on expected levels for
commercial-scale facilities with conventional technology. The plant types included in the
base analysis are: IGCC, NGCC, subcritical pulverized coal, supercritical pulverized coal,
oxy-fuel ultra critical, and oxy-fuel ultra supercritical (Figure 6).
The cost analyses include the reduction of net plant output and added energy costs, often
referred to as energy penalties. For amine-based systems energy penalties have been
estimated between 15% to 30% for natural gas and 30% to 60% for coal (Herzog, Drake and
Adams, 1997; Turkenburg and Hendriks, 1999; David and Herzog, 2000). The capture
technologies currently in development seek to reduce these penalties to less than 20%
through better integration of capture systems and improvements in absorption of CO2
(Anderson and Newell, 2003). The Department of Energy (DOE) estimated in 2009 that the
sum of all energy for carbon capture application to existing coal-fired power plants could
equal 20% to 30% of the plants‟ output without capture (Myhre and Stone, 2009).
Additional cost analyses presented later in the report (Chapter VII) include low carbon
alternative plant types such as nuclear, on-shore wind, on-shore wind with NGCC backup,
on-shore wind with NGCC backup plus capture technology, off-shore wind, solar thermal,
and solar photovoltaic.
18
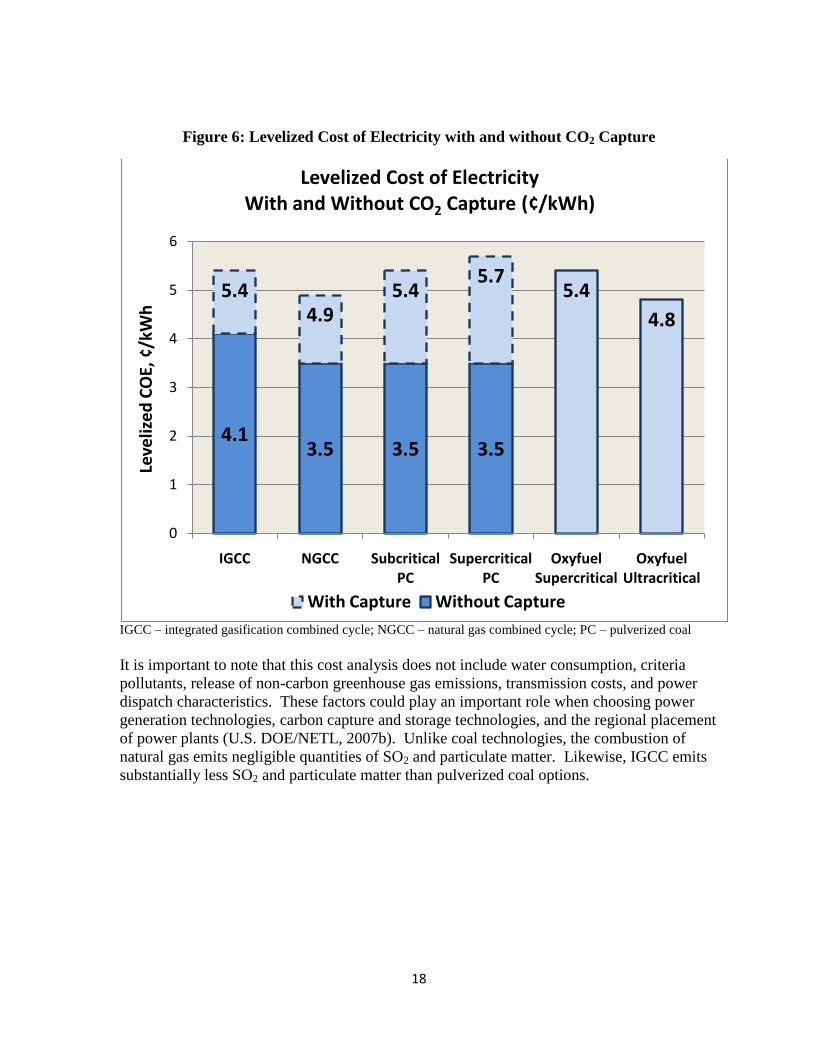
Figure 6: Levelized Cost of Electricity with and without CO2 Capture
IGCC – integrated gasification combined cycle; NGCC – natural gas combined cycle; PC – pulverized coal
It is important to note that this cost analysis does not include water consumption, criteria
pollutants, release of non-carbon greenhouse gas emissions, transmission costs, and power
dispatch characteristics. These factors could play an important role when choosing power
generation technologies, carbon capture and storage technologies, and the regional placement
of power plants (U.S. DOE/NETL, 2007b). Unlike coal technologies, the combustion of
natural gas emits negligible quantities of SO2 and particulate matter. Likewise, IGCC emits
substantially less SO2 and particulate matter than pulverized coal options.
4.13.5 3.5 3.5
5.44.9
5.45.7
5.4
4.8
0
1
2
3
4
5
6
IGCC NGCC Subcritical PC
Supercritical PC
Oxyfuel Supercritical
Oxyfuel Ultracritical
Leve
lize
d C
OE,
¢/k
Wh
Levelized Cost of ElectricityWith and Without CO2 Capture (¢/kWh)
With Capture Without Capture

19
Chapter III: Carbon Transport
20
Carbon Transport Technologies
Current carbon transport options are limited to land transport, including pipeline, highway
and rail, and water transport by ship. At this time, unlike carbon capture and storage
technologies which are still in the development process, carbon transport technologies are
fairly well known and developed. The current issues associated with the transportation of
CO2 are concerned with the proximity of storage facilities to CO2 generating sources. New
policy and regulations may be needed in order to deploy CO2 pipeline transportation and
storage infrastructure on a large scale.
Land Transport
Captured CO2 can be transported over land through the following methods:
1. Low-pressure CO2 gas pipelines operating at a maximum pressure of 4.8 MPa
(maximum pressure);
2. High-pressure CO2 gas pipelines operating at a minimum pressure of 9.6 MPa;
3. Refrigerated liquid CO2 pipelines;
4. Highway tank trucks and rail tankers.
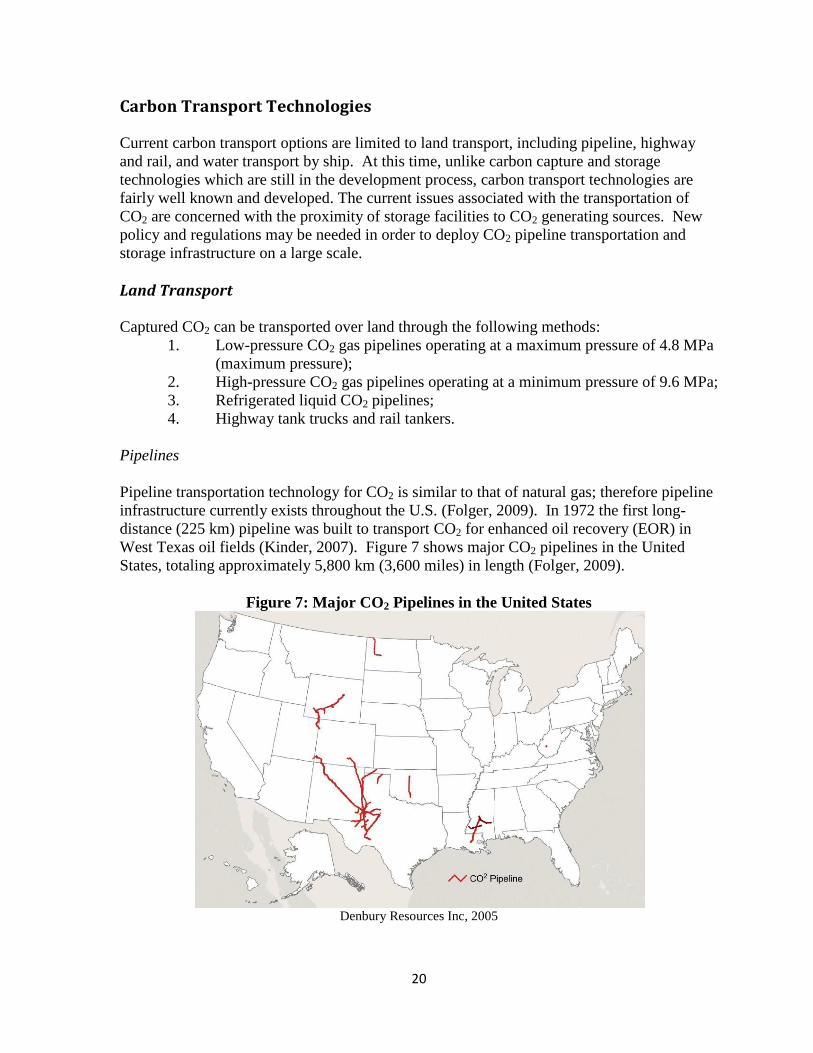
Pipelines
Pipeline transportation technology for CO2 is similar to that of natural gas; therefore pipeline
infrastructure currently exists throughout the U.S. (Folger, 2009). In 1972 the first long-
distance (225 km) pipeline was built to transport CO2 for enhanced oil recovery (EOR) in
West Texas oil fields (Kinder, 2007). Figure 7 shows major CO2 pipelines in the United
States, totaling approximately 5,800 km (3,600 miles) in length (Folger, 2009).
Figure 7: Major CO2 Pipelines in the United States
Denbury Resources Inc, 2005
21
Although capable of handling higher volumes of CO2, refrigerated liquid CO2 pipelines are
unlikely to be used because of the high cost and technical difficulties associated with
liquefaction. Transporting CO2 as an intermediate pressure gas (between 4.8~9.6 MPa) is not
currently an attractive option because of the potential for CO2 to flow in two phases, gas and
liquid, simultaneously. High-pressure CO2 gas pipelines are the most likely to be used
because the compressed CO2 volume is smaller during transportation and high pressure also
is needed to inject CO2 in the storage (IPCC, 2005).
Truck and Rail
Liquefaction facilities will be required to reduce the CO2 volume for truck or rail transport.
Although CO2 transport by both truck and rail tankers is technically feasible, the large
amounts of CO2 that will need to be transported make these options not cost effective; thus,
neither are likely to be used to any extent.
Ships
When suitable storage sites are located in or across an ocean from the sources, it is possible
that CO2 would be transported by ship. The transport cycle requires storage, loading, and
liquefaction facilities to reduce the CO2 volume for ship transport. Transporting CO2 by ship
is similar to that of liquefied petroleum gas (LPG); therefore, current technologies can be
applied to new infrastructure for CO2 transport (IPCC, 2005).
Liquefied food-grade CO2 is transported from large point sources, such as ammonia plants, to
northern Europe for distribution. Norway and Japan are currently designing larger CO2
carrying ships and associated liquefaction and intermediate storage facilities. Historically,
operating oil and gas ships, and marine transportation have been susceptible to various
accidents; and therefore, methods need to be thoroughly researched before they can be fully
implemented (IPCC, 2005).
Transport Risks
Pipelines
Pipeline routing, construction, and maintenance can have an impact on the environment, as
well as pose a threat to local health and safety should a CO2 leak occur. Risks to local
populations and ecosystems range from asphyxiation of flora and fauna to the acidifying
effects on soil, surface, and groundwater. If substantial quantities of impurities, particularly
H2S, are included in the CO2, this could affect the potential impacts of a pipeline leak or
rupture. The exposure threshold at which H2S is immediately dangerous to life or health is
100 ppm, compared to 40,000 ppm for CO2 (IPCC, 2005).
In terms of pipeline failure, an incident is defined as an event that released gas and caused
death, in-patient hospitalization, or property loss of at least $50,000. Pipeline failure incident
rate of approximately 0.001 km per year in 1972 fell to below 0.0002 km per year in 2002.
Most of the incidents refer to very small pipelines, less than 100 mm in diameter, principally
22
applied to gas distribution systems. The failure incidence for 500 mm and larger pipelines is
much lower, 0.00005 km per year. From 1997 to 2001, the related incident frequency for
western European oil pipelines was 0.0003 km per year-1
. The related figure for U.S.
onshore gas pipelines was 0.00011 km per year from 1986 to 2002. The difference in the
reporting threshold is thought to account for the difference between European and U.S.
statistics (IPCC, 2005).
Ships
The total loss of CO2 to the atmosphere is between 3-4 % per 1000 km traveled by ship,
counting both boil-off and the exhaust from engines. Boil-off could be reduced by capture
and liquefaction, and recapture would reduce the loss to 1-2% per 1000 km. Shipping
systems can fail in various catastrophic ways: through collision, foundering, stranding, and
fire (Barrio et al., 2004). Liquid CO2 is not as cold as liquefied natural gas (LNG), nor is it
flammable, though it is denser. In the case of a collision, the possibility of fire or explosion
is thus lower than with LPG, LNG, and oil carriers. Due to its density, however, CO2 can
cause asphyxiation as well as stop the ship‟s engine. As a result of the immediate and long-
term effects of CO2 liquid leakage, further research is needed (IPCC, 2005).
Transport Cost Analysis
Pipelines
This cost analysis focused on CO2 pipelines as the primary method of transportation.
Pipelines are expensive to build, but operate at substantially lower costs when compared to
ship, rail or truck transport. Costs associated with pipeline transportation systems are
composed of three major elements: 1) construction costs (e.g., material, labor, and possible
booster station), 2) operation and maintenance costs (e.g., daily operation, monitoring), and
3) other costs (e.g., insurance, fees,) (IPCC, 2005). According to a study analyzing the
construction costs for pipelines built in the United States between 1991 and 2003, on average
the material costs accounted for approximately 26% of the total construction costs, while
labor, right of way, and miscellaneous costs made up 45%, 22%, and 7%, respectively
(Parker, 2004). This study estimated average total construction costs for the pipelines
constructed between 1991 and 2003 as $800,000 per mile in 2002 dollars (Parker, 2004).
The total construction cost is dependent on the length of the pipeline. One study analyzed
2,082 sources of CO2 (i.e., power plants, natural gas processing plants, refineries, and other
industrial plants), and estimated that it is possible to store 77% of the total annual CO2
captured, beneath the respective plant (Dahowski et al 2005). If so, a smaller number of
long-distance pipelines would be needed and as a result, transport costs would contribute a
relatively small amount to the total carbon capture and storage costs.
A Massachusetts Institute of Technology (MIT) 2007 analysis estimated that the majority of
coal-fired power plants are located in regions with storage sites nearby. Therefore, the cost
of transport and injection of CO2 should be less than 20% of total cost for capture,
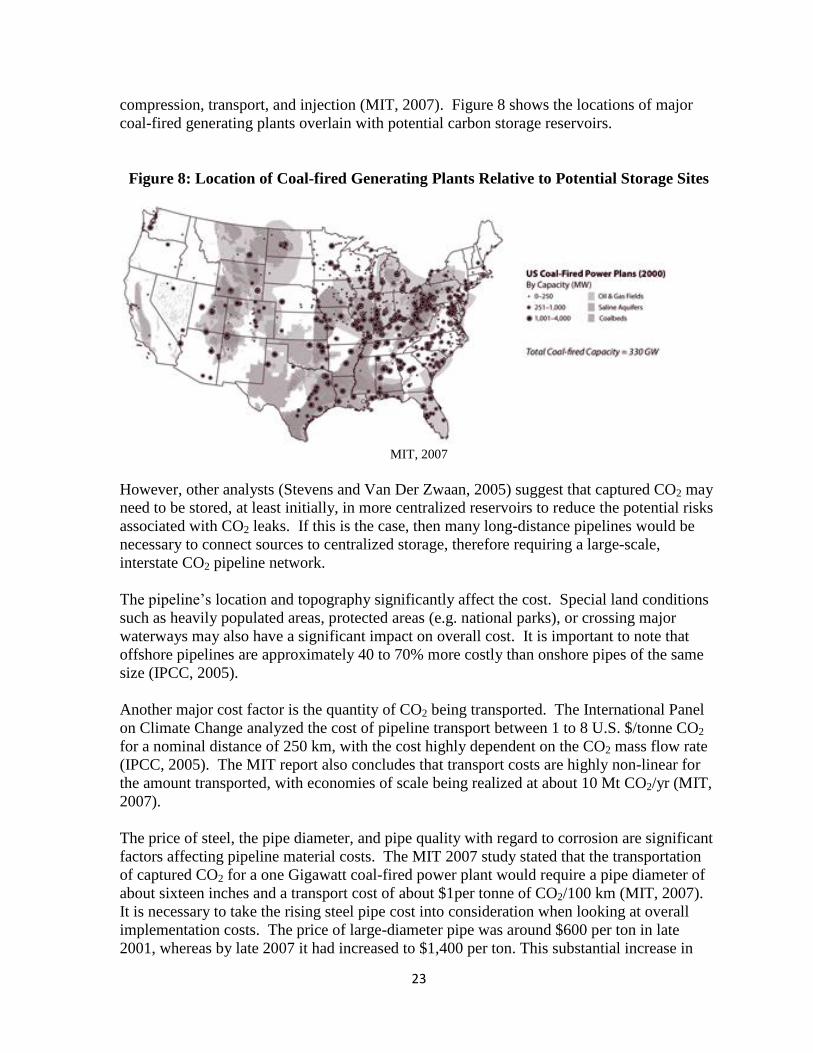
23
compression, transport, and injection (MIT, 2007). Figure 8 shows the locations of major
coal-fired generating plants overlain with potential carbon storage reservoirs.
Figure 8: Location of Coal-fired Generating Plants Relative to Potential Storage Sites
MIT, 2007
However, other analysts (Stevens and Van Der Zwaan, 2005) suggest that captured CO2 may
need to be stored, at least initially, in more centralized reservoirs to reduce the potential risks
associated with CO2 leaks. If this is the case, then many long-distance pipelines would be
necessary to connect sources to centralized storage, therefore requiring a large-scale,
interstate CO2 pipeline network.
The pipeline‟s location and topography significantly affect the cost. Special land conditions
such as heavily populated areas, protected areas (e.g. national parks), or crossing major
waterways may also have a significant impact on overall cost. It is important to note that
offshore pipelines are approximately 40 to 70% more costly than onshore pipes of the same
size (IPCC, 2005).
Another major cost factor is the quantity of CO2 being transported. The International Panel
on Climate Change analyzed the cost of pipeline transport between 1 to 8 U.S. $/tonne CO2
for a nominal distance of 250 km, with the cost highly dependent on the CO2 mass flow rate
(IPCC, 2005). The MIT report also concludes that transport costs are highly non-linear for
the amount transported, with economies of scale being realized at about 10 Mt CO2/yr (MIT,
2007).
The price of steel, the pipe diameter, and pipe quality with regard to corrosion are significant
factors affecting pipeline material costs. The MIT 2007 study stated that the transportation
of captured CO2 for a one Gigawatt coal-fired power plant would require a pipe diameter of
about sixteen inches and a transport cost of about $1per tonne of CO2/100 km (MIT, 2007).
It is necessary to take the rising steel pipe cost into consideration when looking at overall
implementation costs. The price of large-diameter pipe was around $600 per ton in late
2001, whereas by late 2007 it had increased to $1,400 per ton. This substantial increase in
24
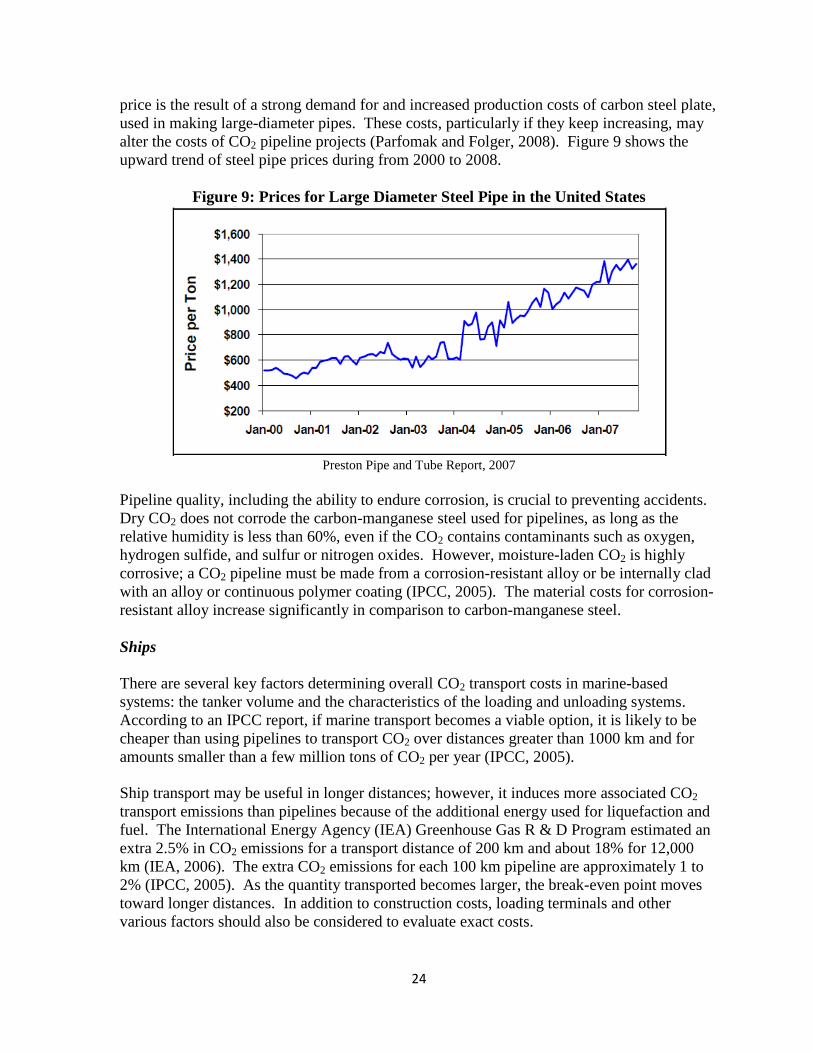
price is the result of a strong demand for and increased production costs of carbon steel plate,
used in making large-diameter pipes. These costs, particularly if they keep increasing, may
alter the costs of CO2 pipeline projects (Parfomak and Folger, 2008). Figure 9 shows the
upward trend of steel pipe prices during from 2000 to 2008.
Figure 9: Prices for Large Diameter Steel Pipe in the United States
Preston Pipe and Tube Report, 2007
Pipeline quality, including the ability to endure corrosion, is crucial to preventing accidents.
Dry CO2 does not corrode the carbon-manganese steel used for pipelines, as long as the
relative humidity is less than 60%, even if the CO2 contains contaminants such as oxygen,
hydrogen sulfide, and sulfur or nitrogen oxides. However, moisture-laden CO2 is highly
corrosive; a CO2 pipeline must be made from a corrosion-resistant alloy or be internally clad
with an alloy or continuous polymer coating (IPCC, 2005). The material costs for corrosion-
resistant alloy increase significantly in comparison to carbon-manganese steel.
Ships
There are several key factors determining overall CO2 transport costs in marine-based
systems: the tanker volume and the characteristics of the loading and unloading systems.
According to an IPCC report, if marine transport becomes a viable option, it is likely to be
cheaper than using pipelines to transport CO2 over distances greater than 1000 km and for
amounts smaller than a few million tons of CO2 per year (IPCC, 2005).
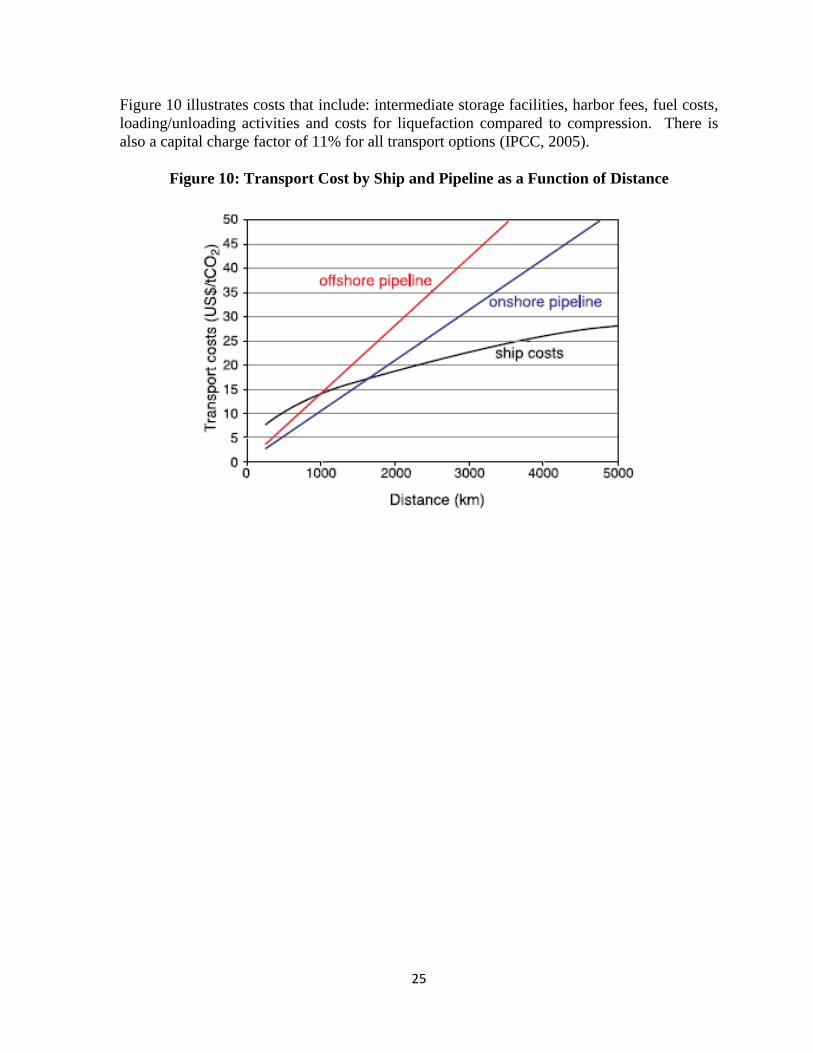
Ship transport may be useful in longer distances; however, it induces more associated CO2
transport emissions than pipelines because of the additional energy used for liquefaction and
fuel. The International Energy Agency (IEA) Greenhouse Gas R & D Program estimated an
extra 2.5% in CO2 emissions for a transport distance of 200 km and about 18% for 12,000
km (IEA, 2006). The extra CO2 emissions for each 100 km pipeline are approximately 1 to
2% (IPCC, 2005). As the quantity transported becomes larger, the break-even point moves
toward longer distances. In addition to construction costs, loading terminals and other
various factors should also be considered to evaluate exact costs.
25
Figure 10 illustrates costs that include: intermediate storage facilities, harbor fees, fuel costs,
loading/unloading activities and costs for liquefaction compared to compression. There is
also a capital charge factor of 11% for all transport options (IPCC, 2005).
Figure 10: Transport Cost by Ship and Pipeline as a Function of Distance

26
Chapter IV: Carbon Storage
27
Carbon Storage Technologies
Carbon dioxide storage technologies include geologic, carbonate mineralization, and oceanic
processes.
Geologic Storage
There are five main geological formations into which CO2 can be injected and stored:
1. Oil and gas reservoirs
2. Deep saline formations
3. Un-mineable coal seams
4. Oil and gas rich shale
5. Basalt formations
Each of these formations has a different capacity for holding and trapping CO2, and each
method of geologic storage has different cost components and projections. The storage of
CO2 can occur in a variety of geologic formations chosen for their ability to effectively trap
CO2, the capacity of the formation to accept the intended volume of CO2, and the area‟s
ability to limit the extent to which it migrates throughout the formation.
Achieving geologic storage involves injecting fluids into wells, located on or offshore, that
are perforated or covered with a porous screen to allow the carbon dioxide to enter the
formation. The CO2 first must be compressed to a dense, fluid state before it can be injected
into the ground; the density required will increase with the depth of injection. Depending on
the site and the formation, the screen will provide different capping capabilities because
pressure buildup varies with each storage site. Pressure buildup allows CO2 to enter porous
spaces in the formation into which it is injected, thus enabling it to displace other fluids
already occupying those spaces. The amount of distribution and pressure buildup depends on
the injection rate, the permeability of the formation, and the presence or absence of
permeable barriers within it, as well as the geometry of the regional underground water
system (IPCC, 2005).
Carbon dioxide can be transported via pipeline to offshore sites; however, much of the
sediment at offshore sites is thin and impermeable, making storage more difficult. A number
of onshore locations in the U.S. and North America have been identified as potential sites for
storage, with deep saline formations holding the majority of storage capacity (Dooley et al.,
2004).
Oil and Gas Reservoirs
Oil and gas reservoirs contain porous rock that once held crude oil and/or natural gas. An
impermeable rock formation overlays the well and acts as a seal to trap the oil and gas. It is
possible to apply this same mechanism to trapping injected CO2. In addition to long-term
storage, the process of injecting CO2 into these reservoirs aids in recovering difficult to reach
oil reserves. Enhanced oil recovery (EOR) occurs when CO2 is injected into wells that hold
28
otherwise unreachable reserves. The carbon dioxide acts buoyantly to push the crude oil
toward the top of the well making it easier to recover. This not only makes for a more
efficient recovery of the resource, but it also requires less energy to power the oil recovery
process. The EOR process is relatively well developed, but the amount of CO2 that is offset
by the process is minimal compared to what could be stored in saline formations and long-
term storage technologies in oil and gas reservoirs are less certain (EPRI, 2007).
Saline Formations
Saline formations that can be used as potential CO2 storage sites consist of porous rock
saturated with brine with a cap of impermeable rock formations to serve as the trapping
mechanism for the CO2 once it is injected. These types of formations have a higher storage
capacity and are more widespread in terms of their location in comparison to oil and gas
reservoirs and coal seams. However, the ability of saline formations to trap CO2 and keep it
from migrating is less understood than the capabilities of other geological formations; still,
these formations are often considered the most promising option for storage today. There are
several reasons for this; first of all, saline formations are the most abundant of the viable
geologic formations in the U.S. Additionally, these formations have several voids partially
filled with brine which will allow more CO2 to be injected. This additional storage capacity
comes from the ability of the CO2 to move into the spaces previously occupied by the brine
and dissolve in the water. Eventually, it would form stable, solid compounds that would
permanently isolate the CO2 (EPRI, 2007).
Un-mineable Coal Seams
Un-mineable coal seams are those found beyond typical recovery depths. Most coals are
capable of adsorbing CO2 resulting in release of previously stored methane. This process,
called Enhanced Coal-Bed Methane (ECBM) recovery, is an added benefit to the storage
process because it creates a lower net cost option because recovery can take place at
shallower depths than EOR. In order to use un-mineable coal seams more research is needed
to fully understand this option. NETL lists these as: 1) storage capacity in coal seams, 2)
geologic and reservoir data defining favorable conditions for injection sites, 3) additional
understanding of the interactions between CO2 and coal, 4) reliable, high-volume injection
strategies, and 5) integrated CO2 storage and ECBM recovery (U.S. DOE/NETL, 2007b).
Shale and Basalt
Shale and basalt formations offer additional geologic storage options due to their relatively
common occurrence throughout the U.S. Shale is the most common type of sedimentary
rock and is comprised of thin horizontal layers of rock with low vertical permeability. The
organic materials found in these layers provide a means for CO2 adsorption through a process
similar to ECBM in which shale-gas production is enhanced and the overall cost for CO2
storage is reduced. It would be difficult to inject large volumes of CO2 because of low
permeability of shale.
29
Additionally, basalt, created from lava formations, has a chemical makeup that increases the
potential to convert all injected CO2 into mineral form or “carbonate minerals.” This process
would essentially permanently isolate the CO2 from the atmosphere. Research on this
technology is still very new, but it is understood that the process of mineralization takes
thousands of years (U.S. DOE/NETL, 2007b). Basalt is also very porous, posing the
potential for leaking before mineralization can take place, and therefore a caprock would be
necessary. According to the IPCC, storage in basalt formations is unlikely due to the lack of
understanding about the technology and its high cost relative to other storage options (2005).
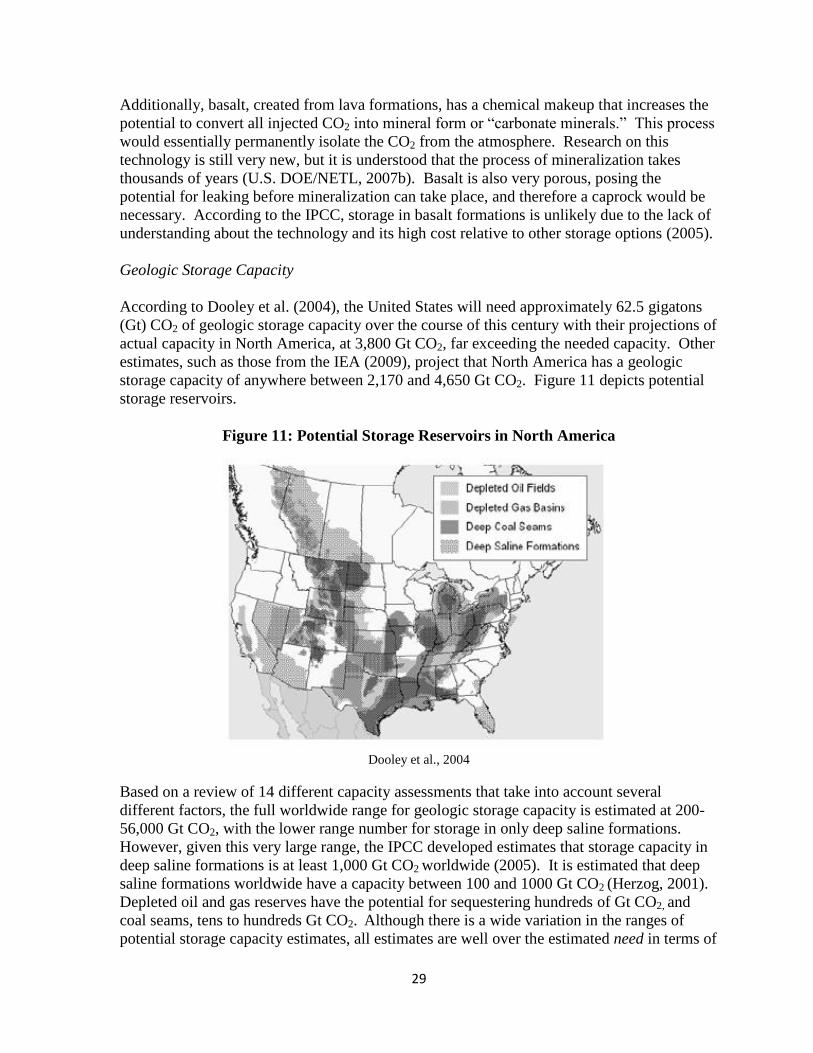
Geologic Storage Capacity
According to Dooley et al. (2004), the United States will need approximately 62.5 gigatons
(Gt) CO2 of geologic storage capacity over the course of this century with their projections of
actual capacity in North America, at 3,800 Gt CO2, far exceeding the needed capacity. Other
estimates, such as those from the IEA (2009), project that North America has a geologic
storage capacity of anywhere between 2,170 and 4,650 Gt CO2. Figure 11 depicts potential
storage reservoirs.
Figure 11: Potential Storage Reservoirs in North America
Dooley et al., 2004
Based on a review of 14 different capacity assessments that take into account several
different factors, the full worldwide range for geologic storage capacity is estimated at 200-
56,000 Gt CO2, with the lower range number for storage in only deep saline formations.
However, given this very large range, the IPCC developed estimates that storage capacity in
deep saline formations is at least 1,000 Gt CO2 worldwide (2005). It is estimated that deep
saline formations worldwide have a capacity between 100 and 1000 Gt CO2 (Herzog, 2001).
Depleted oil and gas reserves have the potential for sequestering hundreds of Gt CO2, and
coal seams, tens to hundreds Gt CO2. Although there is a wide variation in the ranges of
potential storage capacity estimates, all estimates are well over the estimated need in terms of
30
capacity, indicating that the U.S. and the world would have more than enough space to store
its emissions over the next 100 years and beyond.
Deep saline formations present the highest geologic storage capacity in the United States.
Saline formations account for approximately 97% of the total identified onshore capacity
(Dooley et al., 2004). Additionally, these formations are so widespread that transport
requirements are minimized, thus decreasing the costs further. Depleted oil reservoirs
account for 0.3% of storage capacity in North America, equating to 13 GtCO2 of additional
capacity.
Once carbon dioxide has been injected into geological formations, it has a tendency to
remain at the subsurface, and can potentially remain there for millions of years. Based upon
natural gas storage operations, some areas can store oil and natural gas for 5-100 million
years (IPCC, 2005). Natural gas storage projects have been operating around the world for
over 100 years (Bachu, 2007). This technology offers experience similar to CO2 storage,
particularly because natural gas has been stored in depleted oil and gas reservoirs and saline
formations – the storage options identified as most viable for CO2 storage. These projects
have been successful due largely to appropriate site selection, proper design, monitoring, and
maintenance of injection wells, and proper assessment of risks in the reservoir (IPCC, 2005).
Storage in oil and gas reservoirs is a well-developed technology that is presently ready for
CCS application. EOR methods have been used for over 30 years in the U.S. with the first
example occurring in the 1970s in Texas and continuing to today. Oil and natural gas
reservoirs are considered lower risk due to the fact that they previously stored gases for
millions of years. Currently, many EOR projects in the U.S. are taking place in the Permian
Basin in West Texas where CO2 is transported along a pipeline network from sources mainly
in New Mexico and Colorado. Upon arrival, it is subsequently injected into the oil field
(Bachu, 2007).
Additionally, different projects have been developing in various locations. In September
2009, the Mountaineer Power Plant in West Virginia announced plans to become the world‟s
first coal-fired power plant to capture and sequester its CO2 emissions. Beginning in late
2009, the project is estimated to have captured anywhere from 15-30% of the CO2 emitted
and sequester it in a layer of sandstone 7,800 feet below the surface. The project, owned by
American Electric Power will inject approximately 100,000 tons of CO2 annually for two to
five years (Wald, 2009).
The DOE, through its Regional Carbon Sequestration Partnership (RCSP) initiative, has
selected seven partnerships to explore approaches to capturing and storing CO2. RCSPs are
comprised of state and local agencies, coal, oil, and gas companies, electric utilities, and
many other entities as part of a network working to address the issues of suitable
technologies, infrastructure needs, and regulation for carbon storage. One such partnership is
the Southeast Regional Carbon Sequestration Partnership (SECARB) involving 11
southeastern states. As of April 2009, the project was in its validation phase: assessing
injection capacity and containment, advancing monitoring technology, and fostering public
awareness and education programs. Using four field studies that store carbon in oil fields
overlying deep saline formations along the Gulf Coast, SECARB estimated 34 billion tons of
31
potential storage capacity in the region. Already, one of the four sites, located in Mississippi,
has injected 3,000 tons of CO2 into a deep saline reservoir (U.S. DOE/NETL, 2009e).
While many projects and research focus on onshore storage sites, there also exists a
successful example of offshore carbon storage, which began in 1996 at a site in the middle of
the North Sea. The Sleipner Project, operated by Statoil, has been injecting CO2 into deep
saline aquifers below the ocean floor since the mid-1990s and monitoring of storage has been
carried out since 1996. The IEA Greenhouse Gas R and D Program has arranged monitoring
activities and report that approximately 1 Mt CO2 is removed from the natural gas produced
at the Sleipner West Gas Field and injected annually into the formation (IPCC, 2005).
Technological development in the realm of geologic carbon storage involves gaining a larger
understanding of the reservoirs into which the carbon dioxide is to be injected as well as the
flow and trapping of the gas. The DOE has identified areas into which further research is
necessary for each type of geologic storage. For oil and gas reservoirs, shale, basalts, and
saline formations, an improved understanding of the trapping mechanisms, the potential for
chemical alterations in the geologic formation, and improved predictive modeling for
injection have been identified. Additionally, an improved understanding of coal properties
and predictive modeling are necessary for research into storage in un-mineable coal seams
(U.S. DOE/NETL, 2007a).
In 2006, DOE selected nine projects to develop “novel and cost-effective” technologies for
capture and for storage. In terms of storage, researchers are looking into membranes and
mineralization technologies, as well as a project that creates microbes that could potentially
biologically sequester CO2 and convert it for use in other areas such as agriculture and food
production (U.S. DOE/NETL, 2007a).
Carbonate Minerals
Carbonate mineral storage is another possible option for carbon storage. Mineral storage of
CO2 involves aqueous mineral carbonation reactions that take advantage of the natural
alteration of ultramafic or igneous and meta-igneous rock (rock with low silica content, SiO2,
but high magnesium and iron content), a process called serpentinization. At high pressure
and moderate temperatures water that comes into contact with the ultramafic rocks alter the
serpentine (Gerdemann et al., 2003). Carbon is sequestered naturally in geologically stable
mineral magnesite (MgCO3). Two primary classes of magnesium silicate minerals are
olivine (Mg2SiO4) and serpentine (Mg3Si2O5(OH)4). These are converted into magnesite
through time intensive geologic processes. Eventually, serpentine (and other minerals) turn
into olivine, making it more prevalent than any other mineral in geologic formations.
These geologic processes can be accelerated by increasing the surface area, the activity of
CO2 in the solution, the reaction temperature, and the pressure, while decreasing the particle
size, changing the solution chemistry, and using a catalyst. Studies have shown that
conversions of magnesite or calcite formations of over 80% are possible in less than an hour
(Gerdemann et al., 2003; Herzog, 2002). In this method, CO2 is injected and dissolved into a
mixture of water and a mineral reactant, such as olivine or serpentine. This mixture of CO2,
32
water and minerals react forming carbonic acid. The hydrogen cations are consumed by the
carbonic acids and solid minerals, therefore liberating the magnesium cations (Mg2+
). These
Mg2+
further react with HCO3- to form magnesite (MgCO3). The forming of carbonic acid
continues under supercritical CO2 pressures. The following equations depict these reactions.
Mg2SiO4 + 2CO2 + 2H2O 2MgCO3 + H4SiO4
Forsterite Carbon Dioxide Water Magnesite Silicic acid
Mg3Si2O3(OH)4 + 3C02 3MgC0 + 2SiO2 + 2H2O
Serpentine Carbon Dioxide Magnesite Silica Water Fouth et al., 1996
There is approximately 39 million gigatons (Gt) of carbon currently present in carbonate
rocks within the Earth‟s crust. The atmosphere holds approximately 800 Gt of carbon; a
relatively small amount in comparison to the geologic formations of the Earth‟s crust. As
described above, the process of forming carbonate minerals from atmospheric CO2 is a
natural part of the long-term global carbon cycle. Roughly 0.1 Gt of carbon is sequestered
globally by silicate-mineral weathering. It would take 8,000 years to sequester the existing
800 Gt in the atmosphere through this natural process (Oelkers et al., 2008).
The North Cascades of Washington State contain large deposits of ultramafic rock. The
Twin Sisters deposit alone is estimated to contain over two billion tons of unaltered dunite,
an ultramafic type of rock that is over 90% olivine. This is enough to carbonate 100% of
CO2 emissions from 8-10 GW coal fired power plants for approximately 15 years (Norman
and Storman, 2007). Conversely, open-pit mining at this level would result in significant
environmental impacts and require the disposal of large amounts of resulting carbonate
minerals.
An advantage of carbonate mineral storage is that it is “permanent,” at least in terms of
geologic time. This permanence differentiates mineral storage from other storage methods
such as terrestrial, geologic, and oceanic. Over time however, these methods have potential
for leakage; creating uncertainties and environmental health and safety concerns (Herzog,
2002). The second advantage is that carbonates have a lower energy state than CO2. The
carbonation process actually produces energy, releasing heat. Naturally, both magnesite and
silica are found in serpentinized ultramafic rocks. Additionally magnesite is a stable
geologic formation that “is not likely to release bound CO2” (Herzog, 2002). Finally, the raw
materials necessary for storage are abundant. Serpentine, olivine and magnesite are found
naturally in large quantities all over the world estimated to exceed “even the most optimistic
estimates of coal reserves” (Fouth et al., 1996).
Although the reactions given above are stable and thermodynamically favorable, this
technology has yet to be developed (Oelkers et al., 2008). Further research and development
is needed to speed up the reactions enough to make this technology cost competitive with
other storage options. Herzog (2002) points out that studies showing increased reaction rates
need to be read with caution. In some cases, the process included “pretreatment” of the
minerals, thereby drastically improving the kinetics, but at the cost of increased energy
consumption. The kinetics improvements have to be balanced with energy needs.
33
Oceanic Storage
Deep-sea (or oceanic) injection storage employs features of geologic storage and
geochemical storage but does not have some of their problems (House et al., 2006). Carbon
dioxide becomes denser than water at high pressures and low temperatures. Due to pressure
and temperature changes, when the CO2 is injected into the deep sea at depths more than
3,000 meters, it sinks to the seafloor. As ocean currents change, the CO2 mixes with the
current and effectively is released. To avoid mixing, the injection must take place below the
sea floor.
When CO2 is injected into the deep sea at a depth of at least 3,000 meters, the CO2 will be
denser than the surrounding pore fluid (the fluid that occupies the pore space within the
rock). This pore fluid, due to its lower density, acts as a cap (commonly referred to as a
boyancy cap) providing “gravitational stability.” This gravitational stability is what
differentiates deep sea geologic storage from terrestrial geologic storage.
Preliminary tests have shown that the kinetics of the mineralization reactions are slow at
ambient temperature and subcritical CO2 pressures. In order for this technology to be cost
effective, the speed of the kinetic reactions needs to increase by orders of magnitude.
O‟Connor et al. (1999) have shown that the process speeds up when the temperature and
pressure are increased in combination with stirring of the slurry and gas dispersion with the
water column. In this situation, the conversion to carbonate minerals occurs at
approximately 90% in 24 hours at a temperature of 185° C and partial pressure of CO2 (Pco2)
at 11.6 MPa (O‟Connor et al., 1999). In addition, this study demonstrated that there are
essentially no very slow reactions when at ambient or elevated temperatures if the Pco2 is
below its critical point of 7.4 MPa. A test designed to replicate that of an in situ situation set
the MPa at 5.2, and temperature at 150° C; this resulted in 10% conversion after 144 hours
(O‟Connor et al., 1999). Studies have concluded that when temperatures and pressures are
increased past the critical points, to supercritial, the rate of conversion will increase as well.
Furthermore, this process improves the kinetics of the reactions; with more R & D the
process could improve enough to begin projects at the industrial level (O‟Connor et al.,
1999).
Some literature suggests a potentially more cost effective process would be to store other
wastes with the CO2. For example, it may possible to store CO2 along with hydrogen sulfide
(H2S), sulfur dioxide (SO2) or nitrogen dioxide (NO2). This type of system requires more
extensive research, currently the process is too complicated, expensive and the consequences
of the stored combinations are unknown (IPCC, 2005).
CO2 injected into deep oceans has the capability of remaining in place hundreds or thousands
of years. If technology can improve the kinetics of the storage processes, then it is possible
that deep sea storage will play a large role in carbon storage. Furthermore, the buoyancy cap
guarantees that even if the sediment column is disrupted and forms fractures, these fractures
will not serve as conduits for CO2 migration. The CO2 will not be able to migrate upward for
eventual release back into the atmosphere (House et al., 2006). The combination of the
buoyancy cap, hydrate formation and carbonate dissolution acts as a nearly full proof system,
34
relinquishing the need for MMV. Finally, within the ocean boundaries 200 meters off the
U.S. coast, the storage capacity is predicted to be large enough to store thousands of years of
CO2 emissions (O‟Connor et al., 1999).
Storage Risks
Geologic
The main risks associated with geologic carbon storage center around the issue of carbon
dioxide leakage. Carbon dioxide can escape from a geologic site through one of the
following main mechanisms: the pore system of the caprock; openings within the caprock,
fractures, and faults; and man-made wells or injection sites (IPCC, 2005). The types of
hazards associated with a leakage vary greatly depending on if the event is a short, abrupt
occurrence, or a long-term gradual leak. This section will analyze the risks associated with
these different leakage types and the corresponding local and global impacts of such
situations.
The main local concern resulting from an abrupt leak is the resulting immediate danger to
surrounding life forms. Normal atmospheric conditions contain CO2 concentrations around
0.038%. Higher concentrations become problematic, with concentrations around 3%
resulting in hearing loss, impaired vision, and mental disorientation. At concentrations
between 7-10%, carbon dioxide causes asphyxiation and can be fatal (Bachu, 2008).
Should a leak occur, CO2 would have a tendency to flow towards lower-lying areas because
it is 50% denser than air. As a result, shallow depressions and confined areas are at much
higher risk for CO2 concentration build-ups compared to areas with open terrain (IPCC,
2005). Low-lying life forms and small animals may also suffer as a result of CO2‟s natural
migration tendencies. Occupational standards have been developed for CO2, and acute
exposure safety risks are considered to be similar to those of the oil and gas industry, if not
lower because CO2 is not flammable (Bachu, 2008).
The main determining factors in carbon dioxide concentrations are the size and speed of a
leakage. Large and fast leaks have a greater ability to cause atmospheric mixing, reducing
carbon dioxide buildup in a small area. Small leaks may disperse slow enough to prevent
any drastic carbon dioxide concentration changes and therefore potentially pose very little
risk. Therefore, the greatest hazard comes from moderately sized leaks where CO2 either
collects in a confined space or does not sufficiently mix (Bachu, 2008).
Long-term exposure to elevated carbon dioxide levels can overtime also negatively impact
ecosystems. Carbon dioxide will most likely lower soil pH and alter ground chemistry.
While plants may be able to handle such changes for short periods of time, extended
exposure can eventually limit respiration in the roots of plants. Mammoth Mountain
California experienced large tree kills when soil concentrations of carbon dioxide were
between 20-30% due to volcanic off-gassing (Damen et al., 2006). Monitoring of carbon
dioxide near storage areas would be necessary to ensure levels remain at acceptable
concentrations.
35
Another major local concern with geologic storage is the potential contamination of
groundwater. Specifically, an increase in dissolved carbon dioxide concentrations has the
potential to alter groundwater chemistry. The IPCC explains possible alterations as
“dissolved CO2 forms carbonic acid, altering the pH of solution and potentially causing
indirect effects, including mobilization of (toxic) metals, sulfate, or chloride; and possibly
giving the water an odd odor, color, or taste. In the worst case scenario, contamination might
reach dangerous levels, excluding the use of groundwater for drinking or irrigation” (IPCC,
2005). The risk of groundwater contamination from metal leaching is very low because most
storage sites do not contain mineral compositions that CO2 could alter (IPCC, 2005).
The injection of carbon dioxide will also result in the displacement of brine. Displaced
brines have the potential to migrate into shallow aquifers, thus increasing the salinity. Again,
such changes could make the groundwater unsuitable for drinking and agriculture. Yet,
current industrial analogs involving ground injections of different waste fluids reveal
groundwater contamination from displaced brines to be very rare. These low rates are
estimated to be similar to those that would occur with large-scale geologic storage (IPCC,
2005).
Induced seismic activity is the final local concern from large-scale carbon dioxide storage.
As carbon dioxide is pumped underground, pressure greatly increases within the rock
formation. If the pressure becomes too great, ground fractures and movement can occur.
These fractures can cause small, micro-seismic events that would result in new pathways for
carbon dioxide to migrate and potentially leak back into the atmosphere (IPCC, 2005).
Greater seismic activity can also result due to the activation of faults from increased
pressures. Activated faults have a greater potential to cause earthquakes, with surface
damage and carbon dioxide leakage potentially occurring as a result.
Industrial analogs from natural gas storage and deep waste injection show that seismic risk is
minimal, and is not a limiting factor for large CCS deployment (Bachu, 2008). Monitoring is
crucial in the vicinity of injection wells because it can indicate if pressures have exceeded
safe levels. Regulatory limits can also be imposed on injection pressures to ensure they are
kept at safe levels to avoid induced activity (IPCC, 2005).
On the global scale, the primary long run issue with geologic storage is the potential for
leakage to counteract global warming mitigation activities. Therefore, if leakage from
storage is too great, the storage‟s effectiveness diminishes, while also potentially negating
other mitigation activities. Even though some leakage will be unavoidable, it is crucial to
ensure that the majority of captured carbon dioxide remains securely stored overtime to have
a lasting impact (Damen et al., 2006).
While leakage risks are very important to consider, many studies have been conducted to
estimate the probability of leakage from geologic sites. Specifically, IPCC evaluated data
from natural systems, engineered systems, physical, chemical and mechanical processes,
models of CO2 transport, and results from current geologic storage projects (2005). From
these studies, leakage risks appear very low given that the proper storage site is selected.
36
Three crucial elements that effect leakage potential include: the geological characteristics of
a selected storage site and its overall storage system design, the injection system and
reservoir engineering, and abandonment methods including well seals. If all of these
elements are properly addressed, current evidence suggests, it is likely the fraction of stored
CO2 retained is more than 99% over the first 1000 years (IPCC, 2005). These preliminary
results indicate that risks from geologic storage very minimal, as long as proper monitoring
techniques are established.
Carbonate Minerals
The mineral carbonation process requires combining CO2 with metals to form carbonate
minerals. The majority of required metals are divalent cations, including calcium (Ca2+
), magnesium (Mg
2+), and iron (Fe
2+). The most abundant source of cations is in silicate
minerals. To retrieve these minerals, large scale mining is required. The amount of minerals
that would need to be mined is estimated to be larger than the mass of coal used as fuel, by a
factor of six (Herzog, 2002; Oelkers et. al, 2008). Similarly, 2-2.6 tons of ultramafic rock
would be needed in order to bind one ton of CO2 (Norman and Storman, 2007). The entire
mining process will require environmental alterations including land removal and the storage
of silica and carbonates on site. The IEA Greenhouse Gas R and D Program, attempted to
address these environmental concerns and concluded that “the methods for mineral storage of
carbon dioxide present significant potential for adverse environmental impacts, which are
comparable with the issues faced by similar sized modern quarrying/mining operations”
(Herzog, 2002). Mineral storage costs should be evaluated using an avoided costs basis
because energy intensive processes, such as mineral pretreatment, and environmentally
taxing processes, such as mineral mining, most likely have a significantly larger cost per
tonne sequestered than cost per tonne if processes were avoided (Herzog, 2002).
Oceanic
One disadvantage of direct deep-ocean injection is that it may not actually be permanent.
Due to ocean currents and local supersaturation, CO2 could be released back into the
atmosphere after a few hundred years. The ocean‟s total carbon storage capacity has been
estimated between 1000 and 10,000 gigatons (Socolow, 1997), which ostensibly means
recent annual anthropogenic emissions of 6.2 gigatons (Davis and Caldeira, 2010) could be
stored for roughly 200 to 1500 years.
However, leakages at different depths and rates could take place. Several model results have
indicated that retention improves with depth, with retentions of over 70% expected for
injections beneath 3000m after 500 years (Orr, 2004; Herzog et al., 2003; Adams and
Caldeira, 2008). Even in the near term, when annual leaks of 0.1% are projected at depths
beneath 3000m, an injection of 500 gigatons during one century would leak 0.5 gigaton per
year (Baer, 2003; Herzog et al., 2003).
Ocean storage under the most favorable conditions simply delays release of a portion of the
original CO2 injection. Figure 12 shows the gradual nature of leakage as the fraction of
injected CO2 remaining in the ocean at three different depths as predicted by a simple ocean
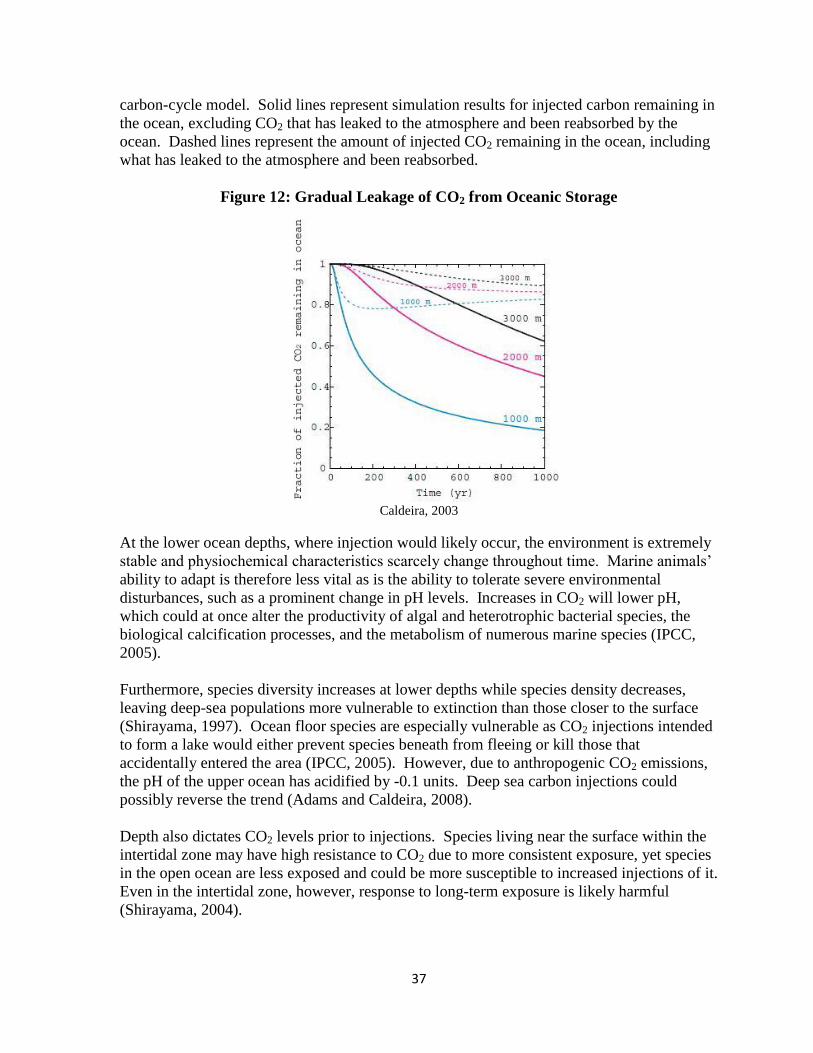
37
carbon-cycle model. Solid lines represent simulation results for injected carbon remaining in
the ocean, excluding CO2 that has leaked to the atmosphere and been reabsorbed by the
ocean. Dashed lines represent the amount of injected CO2 remaining in the ocean, including
what has leaked to the atmosphere and been reabsorbed.
Figure 12: Gradual Leakage of CO2 from Oceanic Storage
Caldeira, 2003
At the lower ocean depths, where injection would likely occur, the environment is extremely
stable and physiochemical characteristics scarcely change throughout time. Marine animals‟
ability to adapt is therefore less vital as is the ability to tolerate severe environmental
disturbances, such as a prominent change in pH levels. Increases in CO2 will lower pH,
which could at once alter the productivity of algal and heterotrophic bacterial species, the
biological calcification processes, and the metabolism of numerous marine species (IPCC,
2005).
Furthermore, species diversity increases at lower depths while species density decreases,
leaving deep-sea populations more vulnerable to extinction than those closer to the surface
(Shirayama, 1997). Ocean floor species are especially vulnerable as CO2 injections intended
to form a lake would either prevent species beneath from fleeing or kill those that
accidentally entered the area (IPCC, 2005). However, due to anthropogenic CO2 emissions,
the pH of the upper ocean has acidified by -0.1 units. Deep sea carbon injections could
possibly reverse the trend (Adams and Caldeira, 2008).
Depth also dictates CO2 levels prior to injections. Species living near the surface within the
intertidal zone may have high resistance to CO2 due to more consistent exposure, yet species
in the open ocean are less exposed and could be more susceptible to increased injections of it.
Even in the intertidal zone, however, response to long-term exposure is likely harmful
(Shirayama, 2004).
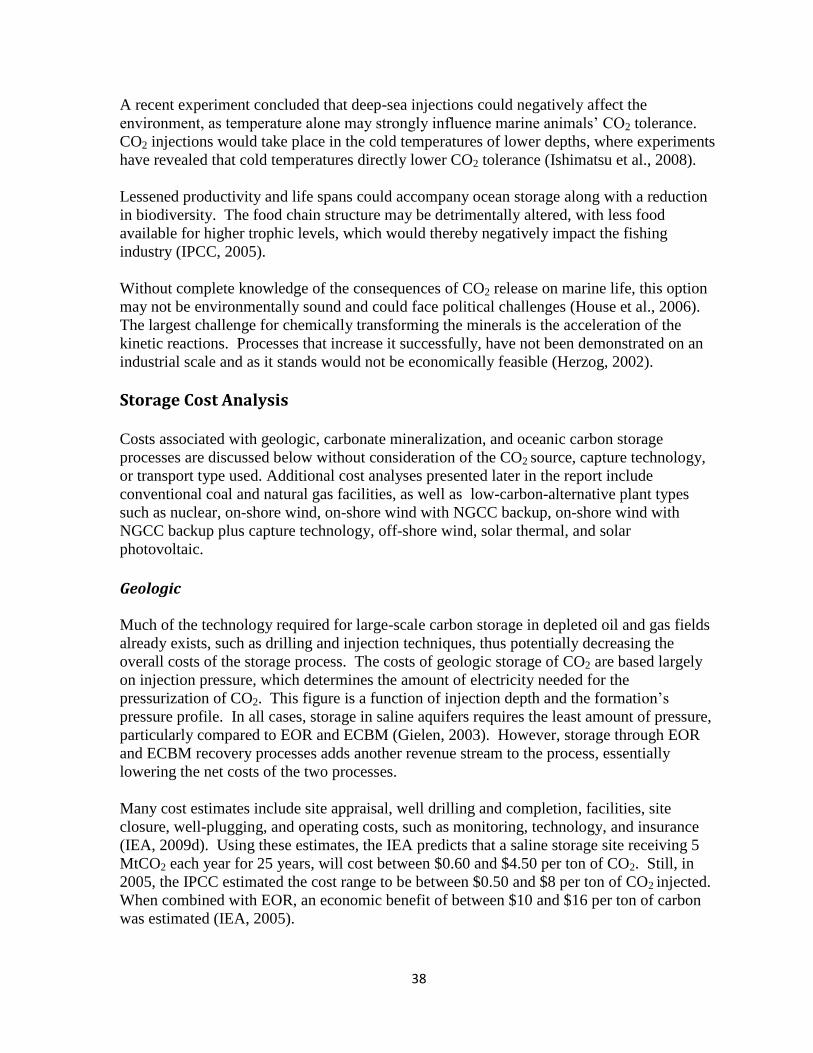
38
A recent experiment concluded that deep-sea injections could negatively affect the
environment, as temperature alone may strongly influence marine animals‟ CO2 tolerance.
CO2 injections would take place in the cold temperatures of lower depths, where experiments
have revealed that cold temperatures directly lower CO2 tolerance (Ishimatsu et al., 2008).
Lessened productivity and life spans could accompany ocean storage along with a reduction
in biodiversity. The food chain structure may be detrimentally altered, with less food
available for higher trophic levels, which would thereby negatively impact the fishing
industry (IPCC, 2005).
Without complete knowledge of the consequences of CO2 release on marine life, this option
may not be environmentally sound and could face political challenges (House et al., 2006).
The largest challenge for chemically transforming the minerals is the acceleration of the
kinetic reactions. Processes that increase it successfully, have not been demonstrated on an
industrial scale and as it stands would not be economically feasible (Herzog, 2002).
Storage Cost Analysis Costs associated with geologic, carbonate mineralization, and oceanic carbon storage
processes are discussed below without consideration of the CO2 source, capture technology,
or transport type used. Additional cost analyses presented later in the report include
conventional coal and natural gas facilities, as well as low-carbon-alternative plant types
such as nuclear, on-shore wind, on-shore wind with NGCC backup, on-shore wind with
NGCC backup plus capture technology, off-shore wind, solar thermal, and solar
photovoltaic.
Geologic
Much of the technology required for large-scale carbon storage in depleted oil and gas fields
already exists, such as drilling and injection techniques, thus potentially decreasing the
overall costs of the storage process. The costs of geologic storage of CO2 are based largely
on injection pressure, which determines the amount of electricity needed for the
pressurization of CO2. This figure is a function of injection depth and the formation‟s
pressure profile. In all cases, storage in saline aquifers requires the least amount of pressure,
particularly compared to EOR and ECBM (Gielen, 2003). However, storage through EOR
and ECBM recovery processes adds another revenue stream to the process, essentially
lowering the net costs of the two processes.
Many cost estimates include site appraisal, well drilling and completion, facilities, site
closure, well-plugging, and operating costs, such as monitoring, technology, and insurance
(IEA, 2009d). Using these estimates, the IEA predicts that a saline storage site receiving 5
MtCO2 each year for 25 years, will cost between $0.60 and $4.50 per ton of CO2. Still, in
2005, the IPCC estimated the cost range to be between $0.50 and $8 per ton of CO2 injected.
When combined with EOR, an economic benefit of between $10 and $16 per ton of carbon
was estimated (IEA, 2005).
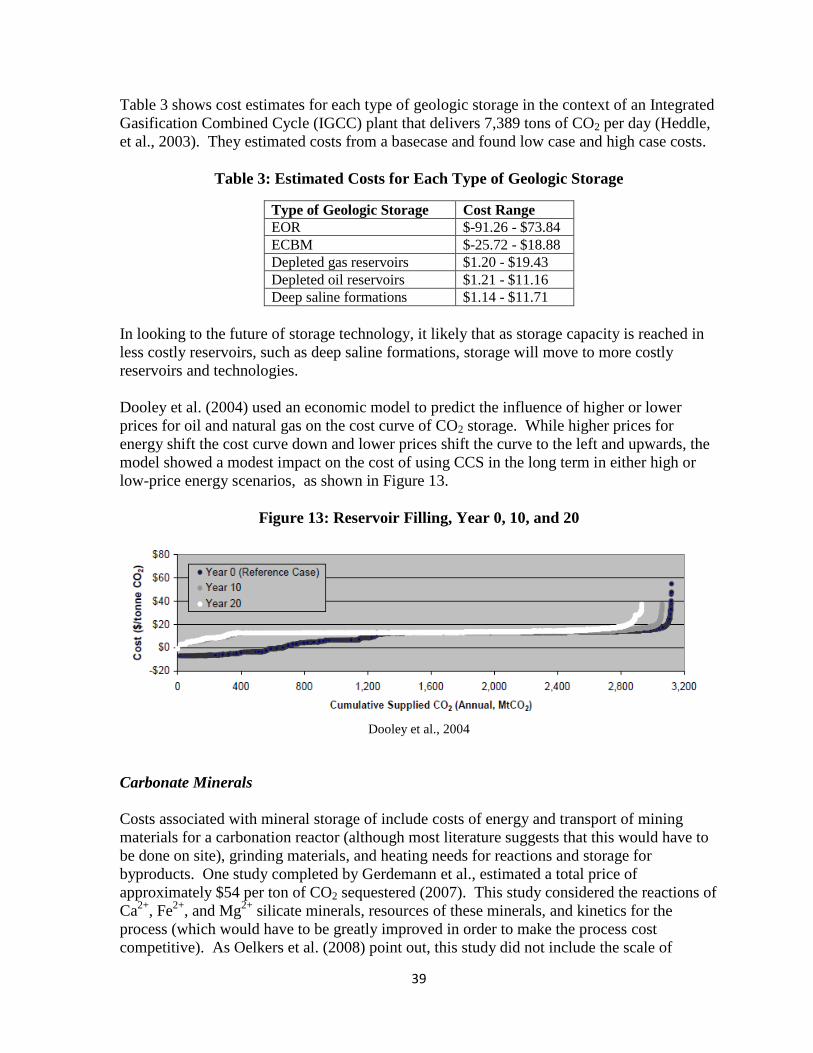
39
Table 3 shows cost estimates for each type of geologic storage in the context of an Integrated
Gasification Combined Cycle (IGCC) plant that delivers 7,389 tons of CO2 per day (Heddle,
et al., 2003). They estimated costs from a basecase and found low case and high case costs.
Table 3: Estimated Costs for Each Type of Geologic Storage
Type of Geologic Storage Cost Range
EOR $-91.26 - $73.84
ECBM $-25.72 - $18.88
Depleted gas reservoirs $1.20 - $19.43
Depleted oil reservoirs $1.21 - $11.16
Deep saline formations $1.14 - $11.71
In looking to the future of storage technology, it likely that as storage capacity is reached in
less costly reservoirs, such as deep saline formations, storage will move to more costly
reservoirs and technologies.
Dooley et al. (2004) used an economic model to predict the influence of higher or lower
prices for oil and natural gas on the cost curve of CO2 storage. While higher prices for
energy shift the cost curve down and lower prices shift the curve to the left and upwards, the
model showed a modest impact on the cost of using CCS in the long term in either high or
low-price energy scenarios, as shown in Figure 13.
Figure 13: Reservoir Filling, Year 0, 10, and 20
Dooley et al., 2004
Carbonate Minerals
Costs associated with mineral storage of include costs of energy and transport of mining
materials for a carbonation reactor (although most literature suggests that this would have to
be done on site), grinding materials, and heating needs for reactions and storage for
byproducts. One study completed by Gerdemann et al., estimated a total price of
approximately $54 per ton of CO2 sequestered (2007). This study considered the reactions of
Ca2+
, Fe2+
, and Mg2+
silicate minerals, resources of these minerals, and kinetics for the
process (which would have to be greatly improved in order to make the process cost
competitive). As Oelkers et al. (2008) point out, this study did not include the scale of
40
operations needed for mineral carbonation using CO2 from a 1 GW coal fired power plant.
This type of operation would entail moving 55,000 tons of material per year. The moving of
that material includes mining, transport and storage.
Mineral storage proponents estimate costs at $70 per tonne of CO2 sequestered if the reaction
processes described above where increased to a larger scale (Herzog, 2002). Costs could be
reduced to $30 per tonne of CO2 sequestered if problems such as expensive pretreatments
and dewatering problems were solved.
The IEA Greenhouse Gas R and D Program Report estimates the cost of current mineral
storage processes at $60-100 per tonne of CO2 sequestered. One should note that all of these
costs estimates are exclusive to only the storage aspect of CCS. These estimates do not
include capture and transport (Newall et al., 2002).
An overall cost estimate of CCS according to IEA, averages the options to reduce CO2
emissions to between $50 and $100 per tonne of CO2 (2009a). The more expensive options
would have a cost up to $200 per tonne CO2. The R and D and deployment of technologies
will require an increase of $2 trillion and $2.5 trillion, respectively, before the year 2050.
Oceanic
The cost of the current technology for oceanic storage is estimated to be approximately three
to ten times higher than terrestrial geologic storage (House et al., 2006). The IEA
Greenhouse Gas R and D Program Report suggests costs for ocean storage at approximately
$1-5 per tonne of CO2 sequestered; a significantly lower cost estimate than other options
such as mineral storage.
Monitoring, Mitigation and Verification
The key components to establish CCS as a successful carbon mitigation technique are being
able to determine (1) its effectiveness in capturing CO2 and (2) reliability in keeping CO2
stored. Monitoring, mitigation, and verification (MMV) techniques help to assure that CCS
is accomplishing its goals and ensure that it does not pose a threat to public health or the
environmental. The purpose of CCS is to reduce CO2 emissions to the atmosphere. MMV
techniques must therefore monitor discrepancies throughout the CCS process from the
amount of carbon emitted from a source, to the amount captured, and finally, to the amount
stored. Furthermore, it must be shown that the amount injected is able to stay in the ground
or ocean indefinitely, without leaking back into the atmosphere.
While the entire CCS process can create greater CO2 emissions by requiring more energy,
CO2 can also be lost through an imperfect capture process, distribution losses through pump
stations and points of transfer, and possible leakage from storage sites. The possibility of
such leakage events solidifies the importance of MMV technology. A significant amount of
the current technology and understanding of geologic storage and its costs, stem from
conclusions drawn from the North American field test sites supported by the DOE‟s Core R
and D program. These test sites “contribute towards gaining the knowledge necessary to one
41
day employ [geologic storage] of CO2 commercially across various geologic and regional
settings” (U.S. DOE/NETL, 2009f).
Monitoring technologies developed by DOE‟s Core R and D program along with the RCSP
Program are divided into four monitoring phases reflecting the process of geologic storage:
pre-operation, operation, closure, and post-closure phases. In each of these phases different
technologies are utilized to “address specific atmospheric, near-surface hydrologic and deep-
subsurface monitoring needs” (U.S. DOE/NETL, 2009f). These technologies are further
categorized as either primary or secondary technologies. The goal of these programs that
monitor CO2 retention and leakage is to determine the appropriate site-specific combination
of protocols and technologies to guarantee 95% retention of stored CO2 by 2008 (primary)
and 99% by 2012 (secondary). These goals are essential to the successful implementation of
geologic storage in order to demonstrate to regulatory authorities and to the general public
that CCS is a viable, safe, and economically efficient way to reduce atmospheric CO2
emissions. Furthermore, MMV programs also use modeling to evaluate the possible
environmental and human health effects in the event of a leak as well as how to mitigate CO2
in the event of such a leak (U.S. DOE/NETL, 2009f).
The Frio Brine Pilot in Texas is one of the first Core R & D field test locations to help
determine the capacity of brine formations to store CO2 and also attempts to monitor the
subsurface movement of CO2. Several monitoring techniques are utilized in this location,
“including baseline aqueous geochemistry, wireline logging, crosswell seismic, crosswell
EM imaging, and vertical seismic profiling (VSP), along with hydrologic testing and surface
water and gas monitoring” (U.S. DOE/NETL, 2009f). Knowledge gained from the testing in
this location is useful and can be transferred to assist in the preparation of CO2 storage in
similar high-permeability sediments in other various locations within the United States and
internationally (U.S. DOE/NETL, 2009f).
The goal of these DOE-sponsored projects is to provide the research that will assist in
making CCS a safe and economically viable commercial application for mitigating CO2 from
coal-fired power plants. These projects test a wide range of technologies over various
geologic conditions in order to provide a greater understanding of trapping mechanisms and
to determine the most effective monitoring techniques and protocols for different
circumstances (U.S. DOE/NETL, 2009f). Furthermore, the benefits of these MMV
techniques, which work to solidify CCS‟s place among the commercially viable CO2
mitigation tools add minimal additional cost to CO2 storage. According to the IPCC (2005),
monitoring costs contribute only an additional $0.01-$0.03 to total storage costs per ton of
CO2 injected in saline formations and depleted oil and gas fields.

42
Chapter V: Legal and Regulatory Aspects
43
CCS presents new challenges for the United States legal institution. Crafting a regulatory
regime that effectively apportions liability may be especially difficult due to the fact that
CO2, once geologically sequestered, will be in the earth indefinitely. Consequences of
geologic storage are not fully understood. Since geologic storage entails permanent isolation
of CO2 from the atmosphere, there may always be some risk associated with CO2 injection
sites (EPA, 2008). Therefore, the primary issue for a body charged with regulating geologic
storage is how to assign responsibility for the long-term stewardship of these sites, especially
since the required site-monitoring period could far outlast the life of the typical firm. For
example, requiring the owner or operator to monitor the site on a permanent and indefinite
basis post-injection could discourage investment in CCS technology, while liability rules that
are too lax could reduce industry incentive to provide effective monitoring. Complicating the
regulators‟ task is the fact that CCS is a relatively new technology; while the oil and gas
industries have been injecting CO2 as part of enhanced oil recovery operations for decades,
CCS operations are still considered experimental and there has been little commercial
deployment (IEA, 2005). There has not been enough experience with CCS to collect the type
or amount of data that would lend itself to a thorough, broad-scope approach to sorting
through the long-term legal complications that CCS presents.
While the short-term liabilities associated with CCS can be placed under existing regulatory
structures, the long-term liabilities, on the other hand, do not have an existing legal
framework. Therefore, questions have arisen as to how liability should be apportioned for
long-term impacts, such as whether to rely on state law or federal law, whether to create new
federal statutory law or rely on state common law, and determining which approach offers
the most equitable solution for industry and private citizens. This section will address the
key concept of liability followed by subsurface property rights. Following that is a
discussion of the current regulatory environment followed by short-term and long-term
liability. Finally, the EPA‟s proposed rule for geologic storage is outlined. While not final,
this proposed rule can provide valuable insight into the way the agency intends to regulate
geologic storage.
Apportionment of Liability for Geologic Storage
Introduction to Liability
Liability is any legal responsibility, duty or obligation. It is the state of one who is bound in
law and justice to do something, which may be enforced by action (Lectric Law Library,
2010). The purpose of establishing a liability regime for geologic storage is two-fold. First,
geologic storage has risks that require parties to be responsible if damages were to occur. A
failure to assign liability for potentially risky activities will result in a lack of accountability,
and thus less incentive to protect others from harm. Therefore, the assignment of liability
protects individuals or entities from damages resulting from negative externalities by 1)
creating a legal responsibility for ones actions and 2) providing remedies for damages such as
compensation or an injunction, a court order to perform or stop some action.
Second, a liability regime is essentially a risk indicator for industry. Risk adverse firms
would be reluctant to enter a market if the liability for potential risks is unknown or too great.
44
At the time of this report, the Department of Energy is entering its third phase of
experimental geologic storage research, which will study geologic storage on an industry
scale (U.S. DOE/NETL, 2010a). Until this research is complete the full extent of the risks
involved in large-scale geologic storage will remain unknown. Consequently, in its current
state, the market is not ripe for significant commercial scale CCS advancement unless state
or federal government offers financial incentives along with a liability threshold to the CCS
industry.
The assignment of liability for both the capture and transportation stages can be expanded
from existing regulatory frameworks. Injection, however, has few regulatory analogues that
mirror the entire range of risks resulting from geologic storage. While EPA‟s 2008 proposed
rule on geologic storage offers some predictability in terms of liability, several risks are not
considered. For instance, risk of seismic activity, CO2 migration underground, and surface
leaks remain unaddressed leaving unknowns for industry and a lack of liability for potentially
risky activities.
Temporal Issues of Liability
Short-term Liability
Liability for CCS projects can be separated into short and long-term. For the short-term
phases of CCS projects, one of the key issues is operational liability, which concerns
environmental, health, and safety risks associated with the CCS process. Short-term liability
is considered to be less problematic than long-term liability. Many issues regarding
operational liability associated with CCS are similar to those already faced by the oil and gas
industry. Therefore, the immediate actions necessary for regulating CCS primarily concern
long-term liability (Robertson et al., 2006).
Long-term Liability
Most CCS research considers the period of long-term liability to begin anywhere from 50 to
200 plus years after site closure. There are three primary types of long-term liability for CCS
projects: environmental, in situ, and trans-national. Environmental liability, also called
climate liability, is associated with leakage from geologic storage reservoirs. In situ liability
is associated with public health risks and environmental or ecosystem damage caused by CO2
leakage or migration resulting from the various phases of CCS operation. Trans-national
liability issues can be evoked when CCS projects affect more than one country such as
projects employing offshore storage, involving CO2 migration across national boundaries
from original source reservoirs, or situations in which leakage can affect global climate (U.S.
DOE/NETL, 2006).
The Challenges of Assigning Long-term Liability
There are three main challenges associated with liability assignment. The first challenge
concerns the difficulty of detecting CO2 leakage and assigning responsibility for damage
resulting from the injection of CO2. Also, it will be difficult for a plaintiff to pinpoint the
45
source of the problem if there were several possible sources. These issues will rely on
technical solutions, such as post-closure monitoring that is well tailored to the characteristics
of the site (Benson et al., 2004). Moreover, if a single operator is responsible for ensuring
the integrity of the storage facility, the multiple-source issue will not be a problem.
A second challenge presented by the assignment of liability involves the length of time
between cause and effect. For example, there could be an extended latency period before any
underground seepage or surface leaks occur. There are several problems that may arise as a
result of this latency period. Not only does it decrease the operator‟s incentive to ensure the
long-term integrity of the storage facility, but the responsible party may no longer be able to
address the damage by the time the problem arises (U.S. DOE/NETL, 2006).
A third challenge is the significant financial cost associated with remediation. It may not be
possible for a firm to adequately rectify damages resulting from its CCS operations. In the
event that an operator goes bankrupt, there will be no funds available to continue site
monitoring and maintenance, or to address any problems that subsequently arise from the
project. This can be a serious problem in cases where firms become insolvent as a result of
their financial responsibility for environmental or safety mishaps (U.S. DOE/NETL, 2006).
Furthermore, since the risk associated with CCS has not been thoroughly quantified, it may
be difficult for projects to acquire the appropriate insurance.
In the long run, the respective legal responsibility of CCS operators as well as federal and
state governments may be interrelated, as long-term liabilities could eventually become
government responsibilities after the contractual lifetime of a project. Thus, setting up the
procedures or guidelines for determining the lifetime of a project is very important. If
responsibility for CCS risks does transfer from the private to the public sector after a
specified period of time, determining when this switch will happen is critical for the
development of the CCS legal framework.
Challenges of Addressing Liability for Geologic Storage
Liability is clear in that it assigns responsibility for potentially damaging activities. What is
less clear, however, is the method(s) to be chosen to assign liability for the risks not
addressed in the EPA‟s proposed rule on geologic storage. The proposed rule indicates
EPA‟s intention to regulate site selection, area of review, well construction, monitoring, and
post-closure care of CO2 injection wells (EPA, 2008). Despite its comprehensiveness, the
Safe Drinking Water Act (SDWA), the framework for the proposed rule, is not
comprehensive in the authority it provides the EPA to regulate geologic storage. The
purpose of the SDWA is to protect public health by regulating the nation‟s drinking water
supply through activities that protect drinking water and its sources (EPA, 2004). Other
sources of harm from geologic storage such as surface leaks of CO2, migration of CO2 from
its designated formation, and induced seismicity are left unaddressed under existing federal
statutes. The result is less protection from geologic storage activities that may result in
damages associated with public health impacts, property disputes, and environmental damage
(Heinrich, 2003).
46
Establishing a Liability Regime for Geologic Storage
EPA‟s final rule governing geologic storage, once promulgated, will dictate the actions taken
by industry and the states as well as the protections awarded to private citizens. The
proposed rule does not address certain risks associated with geologic storage and may allow
states to retain primacy over these risks. However, as more research becomes available the
EPA may decide to draft additional legislation to cover those risks. At this stage in the
development of geologic storage, two scenarios are important to consider: 1) state primacy in
the absence of federal legislation and 2) new federal legislation covering the liability for the
unaddressed risks.
Responsibility for the geologic storage risks not addressed in EPA‟s proposed rule can be
apportioned in one of two ways – either through statutory or common law. While private
insurance has been considered as a tool to manage liability, this section is limited to the role
of government. Both the federal and state governments may create statutory law by enacting
legislation. The federal government, however, is in a much better situation to deal with the
unaddressed risks statutorily. The SDWA is an established framework that the EPA plans on
using to regulate geologic storage. Therefore, any additional risks not addressed under the
Act could potentially be added to it, thereby increasing the authority granted to the EPA.
Additionally, if the states chose to codify their own legislation for the unaddressed risks, they
would have to start from scratch, resulting in high transaction costs. In the absence of
additional federal legislation to cover the risks, state authority and the common law system
will address liability. This system relies on previous case decisions that are applied to
present cases with similar facts. For the purposes of this paper, then, the term „legislation‟
refers to federal action and „common law‟ will refer to state primacy in the absence of federal
action concerning the unaddressed risks of geologic storage.
The method chosen to apportion liability for the remaining risks, whether through federal
legislation or state common law, will affect two issues: 1) the extent of redress granted to
individuals that have experienced damages and 2) the effect of liability on industry. Ideally,
a liability regime would provide maximum protection to individuals while fostering the most
advantageous economic environment for geologic storage operations. Ultimately, the
method chosen to assign liability should attempt to balance the interests of both geologic
storage developers and private citizens.
Common Law Approach to Apportioning Liability
In the absence of federal legislation, the state common law system could become the primary
method of apportioning liability for the risks associated with geologic storage. Common law
is uncodified and relies on previous case precedent to make decisions regarding liability.
Both the states and the federal government may choose a common law approach; however,
states tend to dominate common law application. Common law differs from statutes in terms
of the intent. Statutes are created to assign liability for specific activities that result in
specific externalities whereas common law covers a broader range of legal issues and is not
bounded by a particular situation, such as clean air or water.
47
The finding of liability for damages under common law depends on the outcome of similar
cases in the same jurisdiction. Additionally, lower courts are bounded by decisions made by
higher courts. Common law encompasses broad areas of law such as property, contract, and
tort law (Wilson, 2007). Of primary concern in the case of injected CO2 is tort law, which is
the body of law that allows private parties to obtain relief from the person or entity who
caused an injury (Duhaime, 2009). In the absence of a statute, it is tort law that protects the
public from damages. Torts are brought to court through “causes of action,” which is the act
that resulted in damages. Causes of action can include trespass, negligence, nuisance, and
strict liability with potential remedies being monetary or injunctive relief (Duhaime, 2009).
Unlike contract law, tort law does not require an agreement between the two parties. This is
important because an individual that is injured by injection of CO2 does not have an
agreement with the party that injured them. Under tort law a private citizen can obtain
compensation in the form of monetary and or injunctive relief for damage to oneself or
property.
Statute Approach to Apportioning Liability
As mentioned previously, the EPA‟s proposed rule already identities the underground
injection control program framework under the SDWA as desirable for regulating injected
CO2. If the risks that remain unaddressed in the proposed rule are to be addressed within the
final rule, new legislation adding to the SDWA will be required. In this case, new legislation
would explicitly mandate that certain activities take place to reduce the risks. A failure to
comply with the mandate may result in a court injunction to comply or criminal sanctions.
Assigning liability for activities through legislative mandates changes the way industry
operates.
The ability for private citizens to seek redress for a cause of action is dependent on a citizen
suit provision within the statute. A citizen suit provision allows private citizens to file a
lawsuit against industry for engaging in conduct prohibited under the statute. A common
remedy may include an injunction. Most federal government environmental statutes contain
citizen suit provisions. Under the SDWA, for example, a citizen is allowed to file a lawsuit if
the EPA fails to act within 60 days from the date of notice. If successful, the citizens are
entitled to compensation for legal fees, but any further pecuniary award is not applicable
under the statute (EPA, 2010).
Recommendations for Assigning Liability
While a common law approach to apportioning liability is important for state sovereignty, it
may impede the development of the CCS industry. Each state differs in its approach to
common law. This inconsistency is not attractive to the development of any large-scale
industry, including CCS. For example, as the CO2 reservoir extends beyond state borders, a
geologic storage operator would be concerned about the difference in law between the states.
Unless neighboring states create a similar common law system, a geologic storage operator
would incur significant transaction costs in order to comply with the differing laws.
Furthermore, case precedents are less explicit in their assignment of liability, leaving
unknowns for industry. Case precedents can also be overturned adding to the
48
unpredictability of the common law approach. Therefore the extent that case precedent can
be used to assign liability for all the risks discussed here is difficult to determine. As a result,
knowledge of the extent and apportionment of liability to industry is less predictable, and
consequently less attractive to industry.
In addition to the potential that common law may impede the development of the CCS
industry, this form of law may not provide more protection than a statute approach to
apportioning liability. A common law cause of action carries a high burden of proof on the
plaintiff who has experienced damages. In the case of geologic storage, that burden of proof
may result in high transaction costs. For example, a trespass cause of action, in the case of
CO2 underground migration, requires that one prove an intentional and unauthorized physical
entry of the CO2 and that the entry caused harm. Under a nuisance claim, a plaintiff must
prove a substantial interference with the use and enjoyment of one‟s property. Under a
negligence cause of action one must prove that a defendant had a duty of care, a breach of
that duty by unreasonable conduct occurred, harm was caused by that breach of duty, and
that damages resulted from the harm (Figueiredo, 2007a). The issue is that subsurface pore
space is not accessible except through drilling apparatus. And while modeling can be used to
determine risks, the proof of actual harm, or even migration of CO2 for that matter, is made
much more difficult underground. Therefore proving a cause of action involving the
subsurface could be more difficult under common law. In contrast, the burden of proof is
less of an issue on the surface where damages can easily be assessed and linkages are more
easily understood.
The statute approach has the potential to provide greater benefits to industry as well as
private citizens. By adding legislation to the SDWA to include the unaddressed risks,
industry would benefit from an explicit liability regime in which most of the risks can be
accounted for in the production function. Such an approach would therefore facilitate
development. Another benefit of a statute approach is that it lessens the transactions costs for
private citizens. Bringing suit against an entity for damaging the subsurface may result in
high transaction costs for private citizens. Under a statute approach, however, the burden
placed on private citizens is reduced compared to the common law approach. A citizen must
prove harm and proof that the statute was violated. Therefore, the less a citizen needs to
prove, the lower the transaction cost to that individual. Under the statute approach, however,
injunctive relief is the only means of redress available to the citizens. While the ability to
acquire compensation would seal the deal for comprehensive federal legislation, the need to
provide for monetary compensation is not as necessary for the subsurface. Unlike the
surface, the subsurface is used much less often, therefore, making monetary relief less
necessary.
Approaches to liability apportionment represent a dynamic process. Ultimately, the regime
chosen must be equitable in providing private citizens rights for redress in addition to
avoiding high costs on industry that would prevent the development of CO2 storage
technology.
49
Current Legal Framework
While the oil and gas industries have been injecting CO2 as part of enhanced oil recovery for
decades, the geologic storage of CO2 as part of CCS is still a relatively new concept. As
such, a comprehensive legal framework has not yet been developed to deal with the short-
term risks presented by CCS projects. Short-term risks are those that occur during the
operational stages of a CCS project, or during the period between the commencement of the
project and the point at which the firm stops injecting CO2. The primary operational stages
are transportation, injection, and post-injection storage prior to injection cessation. As
previously indicated, until proposed legislation is passed, existing laws, including those that
regulate underground injection and pipeline transport of other materials, could provide some
measure of regulation.
Recent developments have laid the foundation for federal regulation of CO2 emissions. In
April 2007, in Massachusetts v. EPA, the Supreme Court ruled that the EPA must regulate
CO2 under the Clean Air Act, if a review of the scientific evidence proved that CO2
emissions pose a risk to public health and welfare. In December 2009, the EPA finalized its
endangerment finding, stating that the CO2 and other GHGs brought under scrutiny by
Massachusetts v. EPA do indeed threaten health and welfare, and therefore, can be regulated
by the EPA under the Clean Air Act (Walsh, 2009). The endangerment finding
announcement is a landmark development for organizations concerned about the harmful
effects of CO2 on the environment, and paves the way for future legislation that would limit
CO2 emissions. If this legislation calls for energy producers to cut their CO2 output or face
large penalties, CCS becomes a viable and possibly essential part of any large-scale effort to
reduce emissions.
Both the federal and state governments can potentially regulate CO2. Currently, there are no
federal laws regulating any stage of the CCS process, including capture, transport, injection,
and post-injection storage. However, current federal legislation regulating interstate
pipelines and underground injection wells is fairly comprehensive and components of this
legal framework could be used to regulate CCS. Additionally, some states have crafted their
own legislation to regulate the capture, transport, and injection activities undertaken by the
oil and gas industries. These state laws are also potentially applicable to CCS. The matrix of
state and federal laws that apply to CCS activities may create a complicated and burdensome
task for regulators. The distribution of authority between the federal government and the
states, respectively, will be a fundamental issue to resolve when crafting a workable
regulatory framework (IEA, 2005).
Several state and federal laws currently regulate the underground transport of gas and liquid
fuels. These laws could be used to regulate CO2 transport until a legal framework is
designed to address the risks posed by CCS. The siting of pipelines that transport CO2 to
EOR sites are typically regulated by state law; however, if these pipelines cross federal land,
the Bureau of Land Management has jurisdiction over pipeline placement under both the
Federal Land Policy and Management Act and the Mineral Leasing Act. The Federal Energy
Regultory Commission (FERC) influences siting as well as the rate companies can eventually
charge for energy produced using EOR, and the Department of Transportation monitors the
50
safety of fuel transport under the Hazardous Liquid Pipeline Act. It is reasonable to assume
that these agencies and the laws by which they operate would also apply to the transport of
CO2 for CCS projects, and, in the case of FERC, the rate charged for energy whose
production involves CCS. However, laws that were originally created to regulate gases and
liquid fuels cannot be expected to adequately substitute, on a long-term basis, for legislation
created specifically for CCS. Federal legislative action addressing CCS is needed (Mack et
al., 2009).
There are several federal provisions that could potentially regulate the CO2 storage that takes
place during the operational life of a CCS project. These provisions are found in the Safe
Drinking Water Act (SDWA) of 1974. The SDWA requires the EPA to oversee state
monitoring of drinking water quality and to enforce minimum federal drinking water quality
standards. While states generally enforce the provisions of the SDWA within their respective
boundaries, the EPA can assume enforcement responsibility if state‟s actions are inadequate.
The SDWA houses the Underground Injection Control Program (UIC), which protects
underground sources of drinking water (USDW) from contamination by injection wells. The
UIC also standardizes the injection of all fluids, including liquids, gases, and slurries
(Figueiredo, 2007b). The EPA is currently working on an amendment to the UIC that would
protect USDWs from contamination by geologically sequestered CO2.
Geologically sequestered CO2 may also be subject to provisions contained in the Resource
Conservation and Recovery Act (RCRA), under which the EPA monitors the treatment and
storage of hazardous waste. In response to public inquiry, the EPA is currently considering if
and how it will regulate injected CO2 under both the SDWA and the RCRA. In order to
avoid regulatory overlap, the EPA may decide to issue “conditional exemptions” to RCRA‟s
requirements (EPA, 2004). The proposed rule regarding how EPA plans to divide regulatory
authority between the SDWA and the RCRA is expected in September 2010.
The current legal and regulatory framework for the capture and transportation of other
materials is analogous to CCS and could be used to address most risks, at least in the short
term. CO2 storage, however, lacks a sufficient liability framework of its own.
Comprehensive federal legislation that includes CO2 storage would provide a reliable
framework for companies interested in developing CCS projects. However, under this
approach, the federal government would likely preempt existing state laws that conflict with
federal laws.
Environmental Protection Agency Proposed Rule for Geologic Storage
Given the growing concern about resource scarcity and the current political emphasis on
achieving greater energy independence, CCS is poised to become an important technology in
the effort to mitigate climate change while still meeting increasing energy demands. In
anticipation of increased deployment of CCS technology, the EPA has issued a proposed rule
for the regulation of geologic storage of CO2. This proposed rule is extensive in scope and
comprehensive in its approach. If the final rule resembles the proposed rule, it will play a
key role in regulating the various legalities associated with the long-term storage of CO2.
51
Therefore, this section examines the portions of the rule that are most relevant to long-term
liability concerns and analyses their applicability to future CCS projects.
The EPA‟s proposed rule would regulate CO2 geologic storage under the UIC program,
contained within the SDWA. The UIC program currently delineates five classes that specify
different well requirements and the type of fluid most appropriate for each class. The
proposed rule would create a sixth category of well designed specifically to receive injected
CO2. Currently, geologic storage of CO2 is carried out under the Class II and Class V
categories of the UIC. Since the UIC is contained within the SWDA, the primary focus of
the new CCS regulation would be the protection of underground sources of drinking water
(USDW) from contamination by injected CO2. Although the focus on USDWs precludes the
EPA from specifically addressing other long-term risks induced by CO2 injection, such as
potential damage to the ecosystem or risks to public health, the proposed rule creates a “net”
of regulation that promises to tangentially address other risks posed by CCS. In other words,
assuring that CO2 storage is executed properly and so as not to endanger USDW will also
ensure that other potential problems are avoided. For example, the proposed rule requires the
owner/operator to properly plug all on-site wells and perform adequate post-injection
monitoring; such provisions would also ensure that CO2 does not migrate to the land‟s
surface, where it could endanger human health and negatively impact ecosystem functioning
(EPA, 2008).
Long-term responsibility for CCS sites is rooted in the documentation that the prospective
owner/operator must submit before injection even begins. The documentation must specify
the parameters of the area in which injection will take place and provide a detailed
assessment of the geological formation into which the CO2 will be injected, computational
models of the injection area, mechanical details of the actual injection operation, emergency
procedures, and a post-injection site monitoring plan. Solidifying the CCS project‟s details
prior to its operational stage is important, because the initial plan will serve as a base of
reference for interactions between the EPA and the owner/operator over the duration of the
project. The plan acts as a continuous-feedback model, in that the EPA requires that changes
made to the project be incorporated into the model and the model reconfigured to account for
these changes (EPA, 2008). The preliminary post-closure plan ensures that the
owner/operator will be able to properly close the site earlier than scheduled in the event of
unforeseen problems or complications.
The proposed rule focuses on requirements for the post-injection site care plan that the
owner/operator must submit to the Director at the time of the initial permit application. The
plan must include information on the geological position of and pressure induced by the CO2
plume at the time of injection cessation, as well as the post-closure monitoring schedule, a
description of monitoring activities, and location of monitoring sites. At the actual time of
closure, the operator must either demonstrate to the Director that the original plan is still
adequate or modify the plan to reflect changes made to the operation during the injection
period (EPA, 2008). The initial post-injection plan is an important component of the project,
because it sets the stage for those site maintenance and monitoring activities that the EPA
will require the owner/operator to perform. It also specifies the scope of responsibility for
the CCS operation, at least during the immediate post-injection period.
52
A second essential component of the rule‟s post-injection proposed requirements is
determining the period of time for which the original owner/operator will be legally and
financially responsible for the site. According to the proposed rule, many environmental
programs use 30 years as the default liability period. However, because of the unique
physical properties of CO2, the EPA has determined that owner/operator liability should
extend at least 50 years past the time of injection cessation. The proposed rule also
recommends a performance component, whereby the Director could lengthen or shorten the
period of liability at his/her discretion. If the owner can demonstrate that the site no longer
endangers USDWs, he or she may request that the Director authorize site closure before the
50-year period is complete; conversely, the Director may lengthen the period of liability
beyond 50 years if the owner cannot prove that the site does not poses a threat to USDWs.
EPA considered several factors before arriving at this hybrid solution. First, the potential for
migration of the CO2 plume beyond its originally projected boundaries is greater than for
other injected fluids, due to the buoyancy and viscosity of CO2 and the pressure required to
inject it. Second, the risks associated with geologic storage of CO2 are highly site-specific,
making the designation of a generic default liability period inadvisable. Post-injection
monitoring procedures should be crafted and implemented on a case-by-case basis. This is
important to account for the unique features of each operation and the specificities of the
geological formation, as well as the relative newness of CO2 geologic storage technology
itself. Furthermore, the proposed rule would require that owners/operators demonstrate the
financial capability to perform post-injection maintenance and monitoring at the outset of the
operation (EPA, 2008).
The timeframe specified as part of the rule‟s post-injection requirements represents a
compromise between two options. A liability period that is too short could result in damages
from improperly maintained or remediated geologic storage sites; one that is too long could
require owner/operators to expend significant resources on needless site maintenance and
monitoring. Studies cited in the proposed rule claim that CO2 plumes generally stabilize
within 10 to 100 years of injection cessation (EPA, 2008). The 50-year rule strikes in the
middle of this range, giving the EPA a comfortable margin of safety on the lower end while
allowing owners/operators to avoid unnecessary site responsibility on the higher end. The
performance component, whereby the Director can lengthen or shorten the timeframe, is
meant to account for uncertainty over the appropriate amount of time to require
owner/operators to retain legal responsibility for the site and engage in maintenance and
monitoring. The performance component is basically a tool that the EPA can use to tailor the
50-year liability period to fit the specific features of a given CO2 geologic storage operation,
so that efficiency is maximized and waste is reduced.
Perhaps most importantly, under the current proposed rule, owners/operators of geologic
storage sites would not be financially responsible for site monitoring or remediation “after
the post-injection site care period has ended and the Director has authorized site closure”
(EPA, 2008). However, given the final rule would regulate CO2 geologic storage under the
SDWA, Director-authorized site closure does not exempt owners/operators from liability for
future problems resulting from the operation, such as negative public health effects or
ecosystem damage, that are unrelated to USDWs (EPA, 2008).
53
Legal Constraints of Subsurface Property Rights
The injection of CO2 for geologic storage has raised questions as to whether the existing
property rights regime in the U.S. is sufficient for advancing the industry‟s development.
Two issues dominate the literature regarding the existing regime – acquisition of property
rights and differing state laws. The proposed CO2 reservoirs are expansive and therefore
project developers will encounter many property interests including interests in the surface,
subsurface, and minerals. These rights will have to be acquired before geologic storage
operations can proceed. In the absence of geologic storage specific property legislation,
however, each property right must be acquired through voluntary means. This approach,
some argue, is likely to result in significant transaction costs for geologic storage developers.
In addition to issues of property acquisition, geologic storage developers face a federal
system in which state laws are not in harmony. Traditionally the states have authority over
the allocation of property rights, and each state differs in its approach. Therefore, in the
likely event that a CO2 reservoir crosses state boundaries, project developers will have to
abide by a mix of state laws. Undoubtedly, this would complicate the development process.
A third issue involving is that the existing property rights regime in the U.S. can be viewed
as an impediment to geologic storage development. However, private property rights provide
valuable benefits to land owners by protecting them from activities that interfere with
reasonable use or damage to their property. It is important, then, to consider geologic storage
development from the private property owner‟s perspective in addition to the industry
perspective.
Current Property Rights Regime in the U.S.
Background
In the U.S., property rights are managed by the states with rules governing access,
ownership, and transfer of property varying considerably by state jurisdiction. Generally,
two options for assigning subsurface rights are considered by the states: 1) sever the
subsurface and surface rights or 2) assign subsurface rights to the surface owner in a fee
simple ownership. Overtime most states have adopted what has been referred to as the
“American Rule,” which grants ownership of the subsurface geological formation to the
surface owner. Several states have begun to assign pore space rights specifically for geologic
storage. For example, Wyoming, North Dakota, and Montana have created statutes that
designate pore space ownership to the surface owner (CCSReg Project 2008). These
proactive states, however, could be preempted with federal legislation should the federal
government decide to take an active role in assigning property rights for geologic storage. It
should be noted that ownership of the geologic formation usually excludes mineral rights.
That is, the mineral rights may be “severed” from the surface rights. In the case of
severance, the owner of the mineral rights still has a property interest in exploring for and
removing minerals (Figueiredo, 2005).

54
Property interests that need to be acquired for geologic storage are a function of: 1) whether
the reservoir is depleted of minerals and 2) whether the mineral interest has been severed
from the surface (Figueiredo, 2005). Under the conditions that a severance has not occurred,
the surface interest only needs to be acquired since the mineral interest is explicitly attached
in the deed. However, under the condition that a severance has occurred, it needs to be
determined whether the minerals have been depleted. If mineral depletion has occurred only
the surface interest needs to be acquired. If minerals are still present, then both the surface
interest and mineral interest needs to be acquired.
Relevance to Geologic Storage Developers
Progressive states have codified geologic storage legislation granting subsurface rights to the
surface owner. Under this legal regime, geologic storage developers need only acquire the
surface rights, since the subsurface rights are included in a fee simple ownership. The
condition of mineral rights would likely differ by state. While this system makes acquisition
much easier for geologic storage developers, it will only benefit the industry if states with
connected reservoirs have similar laws. Otherwise, geologic storage developers will be faced
with a patchwork of legal arrangements.
Even if the states create a comprehensive and cohesive property rights regime, geologic
storage developers are still likely to run into high transaction costs for property acquisitions.
Under the current system, acquisition of property interests for geologic storage must occur
through market transactions between buyer and seller. For a typical geologic storage
reservoir, the number of acquisitions could reach into the thousands. Additionally, there is a
likelihood of “hold outs,” where the property owner waits until the price rises before selling.
States could, however, take an advanced step by crafting geologic storage legislation
allowing for the condemnation and or unitization of the subsurface. This intervention into
the market eases the burden of acquiring hundreds or thousands of rights by condemning the
property as part of the public good. This assumes, however, that geologic storage of CO2 is
considered to be in the public interest. If so, more options for acquiring property become
available.
Relevance to the States
While the current property rights regime may pose some challenges for geologic storage
development, the states benefit from retaining the authority and thus flexibility for making
decisions for the good of its own citizenry. If a state has a powerful mineral interest due to
vast mineral deposits, the potential conflict geologic storage poses to those interests may
deter its development. However, if a state has a subsurface that contains less valuable or
worthless material, geologic storage may gain acceptance as a desirable use of the
subsurface. As mentioned, a consistent legal framework is needed for geologic storage
development, at least on a regional level. The future of state property rights for geologic
storage then will depend on whether states can coordinate their property laws for carbon
storage. For example, compacts in which states agree on a regional approach to dealing with
property rights would result in a much-needed consistent regime for industry. Western states
have a spatial advantage in that storage reservoirs will cross fewer state boundaries, and thus

55
fewer states will need to come to an agreement. Eastern states, because of their density, will
have storage reservoirs that span many states. Therefore, extensive cooperation will be
needed for the eastern states to agree on a regional approach. Consequently, eastern states
are more likely to require federal intervention to create a consistent property rights regime.
Under the current property rights regime states would continue to have the flexibility to
change laws to either promote geologic storage development or impede it. For example,
those states that have already codified statutes for geologic storage property rights are doing
so because they want to foster an environment that creates certainty for the CCS industry or
to protect the mineral interest. States that enact such legislation will most likely set a
precedent for other states to follow or possibly influence the EPA decisions to regulate
property rights. On the downside, state flexibility for property rights subject to a race-to-the-
bottom. A race-to-the-bottom occurs when states set minimal standards in order to attract
economic development. For example, a state could transfer liability for subsurface trespass
of CO2 to the public, thus lessening the burden on industry. Industry, in this case, may take
fewer safeguards to prevent damages from occurring. Such a move by the state would do
plenty to attract industry; however, the public would lose if a tragic event caused widespread
damages in which the public would incur the costs. Additionally, the more liability the
public incurs, the more likely innovation will be stifled. Whatever approach the states take,
there is little doubt that time is limited. The EPA plans on promulgating its final rule by
2011 or 2012, leaving little time for state cooperation.
Relevance to Private Property Owners
Under the existing property rights regime, owners maintain the ultimate authority over their
land. Any request from geologic storage developers for acquisition would take place through
normal market transactions in which the owner is compensated as they see fit. Property
owners continue to be protected under common law torts in the event of a subsurface
trespass. In the end, the decision to sell or not to sell is up the landowner.
Government Intervention of Property Rights
Given the interstate nature of geologic storage the federal government may regulate property
rights for this purpose. If the states cannot agree on a comprehensive and cohesive property
rights regime government intervention may be necessary for the good of the public interest.
It could be argued that geologic storage of CO2 is in the public interest, thus opening the door
for. The oil and gas industry, utilizing the public interest argument, gained the power of
government backed unitization and eminent domain. Unitization in the oil and gas industry
is the grouping of oil or gas field leases for resource development that create a consistent
field-wide operation. It is a means by which developers can work together in order to
maximize the efficiency of the well. Unitization statutes are often accompanied by a
“compulsory joinder of interest” clause, which allows for unitization to take place once a
certain percentage of owners agree to a deal. The remaining owners, or “hold outs,” are
subject eminent domain.

56
Eminent domain, or condemnation, is the power possessed by the state or federal government
to appropriate land for public use (Larson, 2007). In the case of eminent domain, the private
right holder must receive at least fair market value for their property. If not, then the act
constitutes a “taking” within the meaning of the Fifth Amendment of the U.S. Constitution.
If geologic storage of CO2 is found to be in the public interest, the state or federal
governments could create unitization and eminent domain legislation for purposes of
subsurface acquisition. In doing so, geologic storage developers can acquire property rights
at reduced transaction costs. Without this legislation, geologic storage developers would be
forced to acquire each property right separately at variable costs and over a longer period of
time.
While the states have the authority to grant both unitization and eminent domain, they would
have to agree on a consistent approach. If not, a comprehensive federal approach may
preempt the states. For example, if a geologic storage reservoir spans two states and one
state authorizes the use of unitization or eminent domain to acquire property rights for
geologic storage, but the neighboring state does not, this inconsistent approach will impede
industry development.
Federal Ownership of Pore Space
In the event that the states cannot agree on a consistent legal regime for property rights, the
federal government has the option of acquiring pore space rights for geologic storage to the
public good. Under this scenario, only the portion of the subsurface that stores carbon would
be under federal ownership, while the state would maintain the mineral rights. Since the
government owns the pore space, a permit would be required to characterize a site for
geologic storage of CO2, which is likely to be a less costly option.

57
Chapter VI: Public Perception and
Acceptance

58
Public perception could play a substantial role in the success of CCS policy. Similar to
electicity generating plant site selection, CCS projects will require community stakeholders
and general public acceptance (Nugent, 2001; Parfomak, 2009). In contrast to broader power
plant issues, CCS‟s need for geologic storage sites on public and private property means that
public opinion will have an even greater potential to either help or hinder its development
(Bachu, 2008).
In order to encourage that public perception help CCS development, some suggest employing
a social site characterization along with the required technical characterization of the storage
site. This is a process in which the company proposing the CCS facility seeks to understand
who the relevant stakeholders are, how the local community perceives risks, what
experiences the local community has with these types of facilities, and how strong the media
presence is (Wade and Greenberg, 2009). This section of the report seeks to support this
recommendation along with two others:
1. Organize public information campaigns using multimedia to provide facts and figures
regarding CCS development in each region; and
2. Discuss CCS as an option in a portfolio of carbon management strategies, providing
proportional information on CO2 mitigation and public funding.
Role and Influence of the Public
The role and influence of the public and stakeholders is vital when considering the
implementation of CCS technologies. The unit of analysis can range from the individual
citizens to local coalitions and regional movements. The following paragraphs provide real-
world examples of the type of influence the public has had on CCS implementation.
The first example is a success story at the FutureGen site in Mattoon, Illinois. FutureGen
Alliance is a public-private partnership established between the DOE and a coalition of coal
producers in order to test and demonstrate the technologies necessary to fully implement
CCS. The FutureGen project includes construction of an IGCC power plant with post-
combustion capture. In selecting the site to build FutureGen, DOE used a competitive
selection process that allowed different sites to bid for the project. In the end, seven states
turned in bids for 12 potential sites, with four selected as semi-finalists before DOE finally
chose Mattoon, Illinois (Bielicki and Stephens, 2008).
According to the Illinois State Geological Survey, the public‟s response to the FutureGen
project was overall very positive because of increased public engagement through a state-
wide CCS awareness campaign. The public viewed the project as a potential source of
economic development for the state of Illinois, due to the high prevalence of saline aquifers
that are perfect for deep saline geologic storage found throughout the region. They saw both
an opportunity to revive the struggling state coal industry and to bring researchers and
scholars to the newly developed world-class research facility (Bielicki and Stephens, 2008).
The media in the Mattoon community has continued to portray the FutureGen project in a
positive light, which, in addition to the competitive site selection process, has helped keep
public opposition at bay (Bielicki and Stephens, 2008). When federal funding was pulled
59
due to a cost overrun in 2008, the Alliance members nevertheless continued working hard to
see the project come to fruition (Biello, 2008; Buchsbaum, 2008). In 2009, DOE reached an
agreement with alliance members to recommence the project. This showed that positive
attitudes of industry representatives, local and state government officials, and Illinois citizens
can keep a project alive that otherwise would have been abandoned (FutureGen, 2009).
However, there are a number of examples that offer precautionary tales of the consequences
of a misinformed and oppositional public. One is the failed PurGen plant proposal for
Linden, New Jersey (Applebome, 2009). This project proposed a 750 MW pulverized coal
plant with post-combustion capture technology and oceanic storage. A number of
environmental groups including the Sierra Club, Edison Wetlands Association, New Jersey
Environmental Federation, and others formed a new coalition called the Arthur Kill
Watershed Alliance to oppose the plan. The Linden Council voted down a memorandum for
the plant which further encouraged the environmental groups prompting them to declare a
win for public health, the environment, and renewable energy (Green Jersey, 2009).
Even though the carbon dioxide would have been pumped underground through a 100 mile
pipeline for storage 70 miles off the New Jersey shoreline, the environmental groups found
reasons to oppose it (Green Jersey, 2009). Former N.J. DEP commissioner Bradley
Campbell is a consultant on the project and warned that environmental groups should learn to
compromise. “One of the difficult challenges that climate change presents is that
environmental groups are very good at opposing projects, and not very good at making
compromises in supporting projects,” he told the New York Times. “We need to get beyond
the mind-set that there‟s a perfect alternative if we ever hope to avoid the worst impacts of
climate change” (Applebome, 2009).
Another example of public skepticism is the Twin River Energy Facility, a proposed coal and
wood gasification plant in Wiscasset, Maine. In this case, an educational campaign helped
gain public acceptance for CCS in general, but mismatch between the developer and local
stakeholders led to further distrust of storage on site within the community. Developers
chose this site due to the community‟s existing infrastructure from a nuclear power plant that
once operated in the area (Bielicki and Stephens, 2008).
The Chewonki Foundation, a local environmental education nonprofit organization,
organized a seminar on CCS in order to educate the community on the role the technology
may potentially play in the Wiscasset community. This seminar gave the community
members an opportunity to ask questions and interact with experts on CCS. In a survey
taken after the seminar, participants reported that their support for CCS increased because of
what they learned throughout the seminar; however, their concerns about the technology
remained the same. The resulting consensus is that Wiscasset citizens support CCS as a part
of a larger carbon mitigation strategy with the understanding that there is no potential for
carbon dioxide storage in or near Maine (Bielicki and Stephens, 2008).
60
Current Public Perception
According to a 2003 study by the MIT Laboratory for Energy and the Environment, the
American public knows little about mitigating global climate change or CCS technology
(Curry et al., 2004). A follow-up study in 2006, however, showed that the American public‟s
awareness of the problem of global climate change and their willingness to pay for solutions
increased 50%. Despite these increases over the three-year time span between studies,
researchers found that the overall knowledge of available solutions had remained unchanged
(Curry et al., 2007).
The 2006 study questioned a pool of 1,596 people, with demographics representative of the
United States as a whole, in order to reveal the public‟s comprehension of carbon capture and
storage in terms of the environment and energy generation. Responses revealed that
respondents rank the environment eleventh out of twenty-two overall issues, and within this
category, rank global warming first out of ten. This ranking is improvement change from the
2003 survey results that place the environment 13 out of 22 and global warming sixth out of
the ten environmental issues listed. The survey also divulged that a large majority of the
respondents were unaware of the existence of CCS and carbon storage, particularly when
these technologies were described using these names. However, people have a tendency to
exaggerate their recognition of items in order to provide what they expect to be the desired
response. Therefore, the actual recognition rates of CCS among survey respondents may in
fact be lower than the numbers reported (Curry et al., 2007).
In order to learn respondents‟ willingness to pay to solve climate change, they were asked
how much each would be willing to pay every month in addition to their normal electric bill
($5, $10, $25, $50, or $100). What researchers found was that individuals had an average
willingness-to-pay of an additional $14 per month, an increase from the 2003 result of $6.50
per month (Curry et al., 2003, 2007). In a follow up question, researchers provided the same
individuals with information regarding the cost of various sources of energy (see Appendix
A) and asked the same willingness-to-pay question. The results showed that there exists a
maximum willingness-to-pay for curbing carbon emissions and global warming. Based on
the results, researchers concluded that they expect public support to decline if people became
aware of the large discrepancies in price and there exists an option to choose a cheaper
electrical source (Curry et al., 2003). Interestingly, the public‟s support for CCS as a carbon
mitigation strategy declined from 6% in 2003 to 3% in 2006 (Curry et al., 2007).
The information generated from this survey combined with the examples above is important
for CCS developers to understand. The examples demonstrate the ability the public has to
make or break a project‟s implementation and the survey gives insight into how the public
views CCS as well as why pilot projects have failed in certain locations. While it seems that
much of America believes that water merely comes from turning on the faucet and electricity
from wall sockets, the opinions generated by this uniformed portion of the public still has the
ability to stall or completely prevent a large scale project, like CCS, from coming to fruition.
With greater media coverage of environmental issues, especially climate change, the
government and CCS supporters have the opportunity to introduce a relatively ignorant
public to the emission reduction technology.
61
Despite the increased exposure CCS and other environmental issues have had within recent
years, public opinion studies have continued to report that most individuals remain
uninformed about CCS (Malone et al., 2009). The public thus ranks CCS technology near
the bottom of potential solutions for global climate change (Bachu, 2007). Before CCS
technology becomes a climate mitigation strategy, the public will need two basic questions
answered:
1. Will the CO2 leak from its storage site?
2. What will happen if it does? (Bachu, 2007)
Several cases suggest that improved public knowledge of CCS increases its public
acceptability, particularly when presenting the technology as a portion of a larger plan for
climate change mitigation. However, as more costs are transferred to the public, the overall
approval rate begins to decrease again. The public perceives risk much differently than the
firms and engineers planning and implementing CCS technology. The public is concerned
with accountability, while CCS developers are concerned with probability and other
qualitative aspects of risk (Bachu, 2007).
Public Perception of Risks
The risk that the public associates with hazardous materials has the potential to increase
opposition for the construction of new coal plants using CCS. Examples of these materials
are amines and solvents used to separate CO2 from the emissions stream and prepare it for
transport and storage. Transporting large quantities of these chemicals over considerable
distances may also be perceived as an additional risk. The public has expressed concern
about potential accidents occurring during transit in addition to the national security risk that
their movement poses (Parfomak, 2008). The catastrophic results of an accident involving
hazardous material transportation could severely affect the communities surrounding the
accident scene. Again, although these risks are minimal, the public is concerned about
accountability.
Leakage of carbon dioxide is the main risk the public associates with CCS technology
(Bachu, 2007). This concern is accompanied by other perceived risks and costs, such as the
possibility of CCS inducing earthquakes, requiring the building of extensive infrastructure, as
well as the high costs of implementation and operation (Parfomak, 2008).
The public may view CCS not only as a hazardous risk, but risky in terms of achieving
climate change mitigation goals. Nearly 40% of those interviewed in a 2007 study felt that
CCS would merely be a “quick fix that would not solve the greenhouse gas problem”
(Parfomak, 2008). This may somewhat explain the reasoning behind a 2004 Carnegie
Mellon University study that found that Americans are much less willing to pay for new CCS
than any other large-scale emissions reduction technology, including the construction of
nuclear plants. The public believes that opting to use CCS to control carbon emissions has
the potential to hinder the development of longer-term solutions (Parfomak, 2008).
62
NIMBY Effect
Accountability issues are another concern of how the public views CCS. Stakeholders want
to know who assumes responsibility for ensuring long-term security and who is accountable
should a problem occur at each storage site (Bielicki and Stephens, 2008). These issues have
yet to be resolved for current and proposed CCS sites, though they pose chief concerns for
those living near pilot storage projects. Many Americans seem to support CCS until it is
perceived to encroach upon their neighborhoods. This “not in my backyard” (NIMBY)
mentality is common with the implementation of new technologies whose accompanying
economic and social costs are somewhat unknown. Yet CCS facilities would not necessarily
bring costs to locals and they could create jobs and advance economic development in the
surrounding communities. Similarly, residents living near potential site locations usually
accept or reject a prospective CCS facility based upon the perceived costs and benefits
(Bachu, 2007).
CCS is not the only technology that uses hazardous materials, yet many people do not think
about this when first learning about a new technology. Water treatment plants use ammonia
and chlorine to treat wastewater, and refrigeration and poultry production facilities use
ammonia and other hazardous materials in their day-to-day operations. Primarily due to
public opposition, it is increasingly difficult to find locations willing to accept the
development and implementation of any form of hazardous waste facility (Hunter and
Leyden, 1995).
Proponents and Opponents of CCS
In addition to the company building the new facility, other interested parties also influence
public attitude: environmentalists, civic groups, and NGOs. Their positions range from
complete opposition to strong support. One opposing group is Greenpeace, which published
a report in 2008 entitled, “False Hope: Why Carbon Capture and Storage Won‟t Save the
Climate” (Greenpeace, 2008). On the other end of the spectrum, the Climate Legislative
Director for the Natural Resources Defense Council (NRDC) stated that, “without
widespread deployment of such technology, the task of fighting global warming will be more
difficult” (NRDC, 2008). The messages from these larger groups tend to be distributed
through press releases, reports, and studies that cover CCS broadly and that do not target a
specific project, or geographic area.
On the other hand, smaller groups at the local level help influence public opinion in regions
where there are proposed CCS projects. In Indiana, the Edwardsport Duke Energy IGCC
plant and planned pilot CCS projects have received opposition from various groups. The
Citizens Action Coalition is skeptical of Duke attempting to run a pilot program and opposes
using ratepayers for financial support (Olson, 2009). Another active group called CLEAN
edited a video approving of the Edwardsport plant and dubbed it over with their contrary
message in an effort to undermine Duke‟s public outreach (CLEAN, 2010).

63
Recommendations for Engaging the Public
How the public is involved in a CCS project will depend on the context. However, there are
general guidelines that the government and industries can follow in order to minimize public
opposition. These guidelines can differ depending on whether the engagement is with a
localized population (community, city, or county) or with a broad portion of the public (state,
region, or nation). The following three recommendations summarize the important points.
First, a social site characterization should be carried out early on in the planning process to
engage the local population regarding any new CCS facilities. This includes identifying key
stakeholders as well as factors that drive public perceptions and attitudes in that particular
geographic area. For example, a community with multiple hazardous waste sites nearby may
oppose another potential hazard on environmental justice grounds. It is possible that a
planned CCS facility may be moved after a social site characterization has been completed
due to expected adverse public acceptance.
Second, the FutureGen project example demonstrates the importance of using multimedia to
inform and engage the public in the CCS development process. In the situation where an
existing facility is retrofitted for CCS, the local residents may already be accustomed to
working with the incumbent company. In this case, if the company already has a poor
reputation with locals it may not matter what kind of public engagement is used. On the
other hand, if the local community only cares about local jobs to spur economic
development, then the company‟s reputation and public engagement plans may not be as
important. In both cases, the company proposing the CCS facility should establish
reasonable public engagement goals, such as responding to all public comments, or holding
public meetings to establish and resolve the most contentious issues. Throughout all the
stages of the project, the company should strive to maintain an open, transparent decision
process through which concerned stakeholders may receive answers (Malone, 2009).
Third, the broader population is going to be more concerned with rate increases on utility
bills and whether CCS is the best approach toward managing carbon emissions. These
individuals will need information on the benefits of CCS relative to other low-carbon
options, as well as some realistic cost estimates. The residents near a proposed facility will
be interested in how many new jobs will be available, what the potential safety and health
risks will be, and who will be held accountable should something go awry.
Thus, in general, in addition to these recommendations, a company proposing a CCS facility
should:
1. Maintain transparency throughout all phases of the project;
2. Reach out to the local community as well as the broader public; and
3. Be aware that certain localities may oppose a project no matter the quality of the
public outreach.

64
Chapter VII: Policy Instruments with
Cost Comparisons
65
Domestic Policy Instruments
The costs associated with potential CCS applications depend on future federal investment,
technology advancements, property rights legislation, and public acceptance. A variety of
policy instruments are necessary to assist CCS deployment, research and development, and
cost minimization. These instruments could include financial incentives, technology
specifications, performance standards, emission quotas, and market-based emission control
schemes. Regulation may target CCS technology itself, emitting facilities, or CO2 emissions.
These instruments differentially affect industry in terms of the flexibility of compliance
pathways, incentives to invest in CO2 abatement innovation, and incurred abatement costs.
Federal financial incentives shift the financial burden from producers to the public.
Marketable allowances (emissions-trading systems) and emissions taxes (fees or charges)
provide distinct economic incentives to reduce emissions. An emissions trading system
utilizes a quantity instrument that limits allowable emissions by restricting CO2 permits and
allows for trading within industry. This feature enables polluting firms to purchase or sell
permits based upon their individual costs to reduce emissions. A CO2 fee or tax, achieves
abatement cost minimization where firms with low abatement costs will invest in pollution
reduction techniques and firms with more expensive costs will continue to emit and pay the
tax (Portney, 2003). Further information on regional initiatives is in Appendix D.
Command-and-Control
Historically, technology standards effectively “froze” pollution control innovation as it
removed the incentive to invest in less expensive technology since a particular type already
received regulatory approval (Portney, 2003). CCS is the leading CO2 abatement technology
from fossil fuel power generators whose technical status will likely determine any
technology-based standards of CO2 control. Under the Clean Air Act (CAA), new point
sources and existing facilities that undergo significant modifications are required to meet
New Source Performance Standards (NSPS). The EPA establishes guidelines for NSPS that
specify standards for pollution control systems.
The Energy Independence and Security Act of 2007 (EISA) mandates that the Environmental
Protection Agency assess the impacts of carbon storage on human and environmental health.
The EISA further indicates that carbon injection is subject to the Federal requirements under
the Underground Injection Control section of the Safe Drinking Water Act of 1974
(Congressional Research Service, 2009). The EPA has since proposed to add a new injection
classification specifically for geologic storage of CO2 (EPA, 2009).
Several states are incorporating emissions performance standards (EPS) into their energy and
climate change policies. Within the legislation, point-source emitters are required to reduce
their emissions by a certain percentage based on varying criteria. Additionally, a number of
states have enacted or are developing clean energy and climate change policies, greenhouse
gas emissions targets, and comprehensive climate action plans. A Pew Report lists
Washington, Oregon, California, Montana, and Illinois as having the most advanced
emission performance standard policies that cite CCS as a mitigation option (Pew Center on
66
Global Climate Change, 2010). For further information regarding state policies see
Appendix E.
Financial Incentives
Subsidies may take a variety of forms, including tax incentives and grants. Government
financing of CCS may also come in the form of public-private partnerships, pilot projects
owned or directed by the government, and funding of CCS research at public institutions. By
supporting demonstration projects, government initiatives may counter the high performance
uncertainty that deters private investment. Advancing the technology from a conceptual
phase to a production phase could enable the "learning-by-doing" environment required to
expand production rates and lower costs (Kapp, 2004). The effect would accelerate the
competitive delivery of CCS to the marketplace. Furthermore, a buy-down policy for CCS
deployment can take the form of subsidies or public purchases. The Pew Center on Global
Climate Change maintains that 10-30 CCS demonstrations at commercial coal plants, at an
$8-$30 billion program cost, are necessary to advance CCS (Kuuskraa, 2007). Therefore,
government supported pilot and demonstration projects may play an instrumental role in
furthering CCS technology development, cost reductions, and deployment.
Federal Actions under the American Recovery and Reinvestment Act (ARRA) include a $3.4
billion appropriation for the Department of Energy‟s Fossil Energy Research and
Development Program (Congressional Research Service, 2009). The program‟s mission is to
further the development of technologies that will allow for continued use of fossil fuels in a
more environmentally conscious manner. This appropriation specifies various allocations of
funds including a $1.52 billion solicitation for industrial CCS projects (U.S. DOE/NETL,
2010b).
The DOE has awarded public-private funding to twelve diverse companies across the U.S. in
October 2009, which included cement plants, paper mills, and oil refineries (U.S.
DOE/NETL, 2010b). The projects that demonstrate the most success of the stated goals will
be awarded funding for a second phase (U.S. DOE, 2009).
Regional Financial Incentives and Public Expenditures
The Regional Carbon Sequestration Partnerships, formed as a part of the DOE‟s Carbon
Sequestration Program under the Clean Coal Power Initiative, are public-private partnerships
that address gaps in regulation, technology, and infrastructure based on seven geographic
regions throughout the United States and Canada. Their efforts occur in three successive
phases lasting from 2003 - 2017: Characterization Phase, Validation Phase, and Deployment
Phase. The program is currently in the Deployment Phase, which consists of large-scale
storage demonstrations. In December of 2009, three projects received $3 billion in DOE
funding. The AARA stipulated an additional $800 million for this effort (U.S. DOE/NETL,
2010a). These projects were selected on the basis of three platforms; (1) the technologies
target a 90% capture efficiency, (2) the technologies do not increase the cost of electricity by
more than 10 %, and (3) the projects capture at least 300,000 tons of CO2 per year (U.S.
DOE, 2009).
67
State funding from ARRA has been committed to various projects that span the continental
U.S. There are dozens of proposed bills that offer financial incentives for CCS from state
generated funds. Colorado, Minnesota, and New Mexico have already established financial
incentives specific to CCS. For more information regarding regional incentives, see
Appendix E.
Cost Comparisons
In this comparative cost analysis, several alternative low-carbon electric generation
technologies were considered along with the fossil technologies examined earlier in the
report. The alternative technologies selected were on-shore and off-shore wind, nuclear,
solar thermal, and photovoltaic. Hydroelectric, biomass, and geothermal were excluded due
to a lack of commercial-scale deployment capacity or limited potential for future expansion.
The undeveloped capacity for domestic hydropower has been estimated at 30,000 MW or
approximately 40 percent of existing capacity from conventional hydropower (DOI, 2005).
Large-scale geothermal technologies have not been demonstrated and the source is unlikely
to exceed hydropower in installed capacity without spectacular improvements (Nature,
2008). The capacity outlook for dedicated biomass facilities appears to be minor and that the
more likely role of biomass is as a co-fired fuel in coal-fired plants. A modified coal-fired
unit may generate upwards of 15 percent of its total power output with biomass fuel (DOE,
2010). Therefore, we conclude that hydropower, geothermal, and biomass cannot compete
with fossil fuel applications of CCS at a large scale.
Power Dispatch Characteristics
Dispatch characteristics are an important cost and reliability aspect of electric power systems.
Generation technologies vary by relative capital and operating cost as well as the ability to
change production levels over time. While demand fluctuates by hour, day, and season, a
minimal amount of load is constant, referred to as the baseload. In an attempt to generate
power at the lowest overall cost per kilowatt-hour, baseload is typically from coal and
nuclear power that have relatively high capital and low operating costs. During periods of
greatest demand, or peak load, the lowest-cost technologies are those with relatively low
capital costs and higher operational costs (Bosselman, 2006). NGCC can play a unique role
as a load-following technology. The generation technologies that are CCS applicable
(namely coal-fired and NGCC plants) typically operate as baseload power with natural gas
serving as the peaking power source (Lazard, 2008). Table 4 illustrates dispatch
characteristics of the technologies included in this analysis.
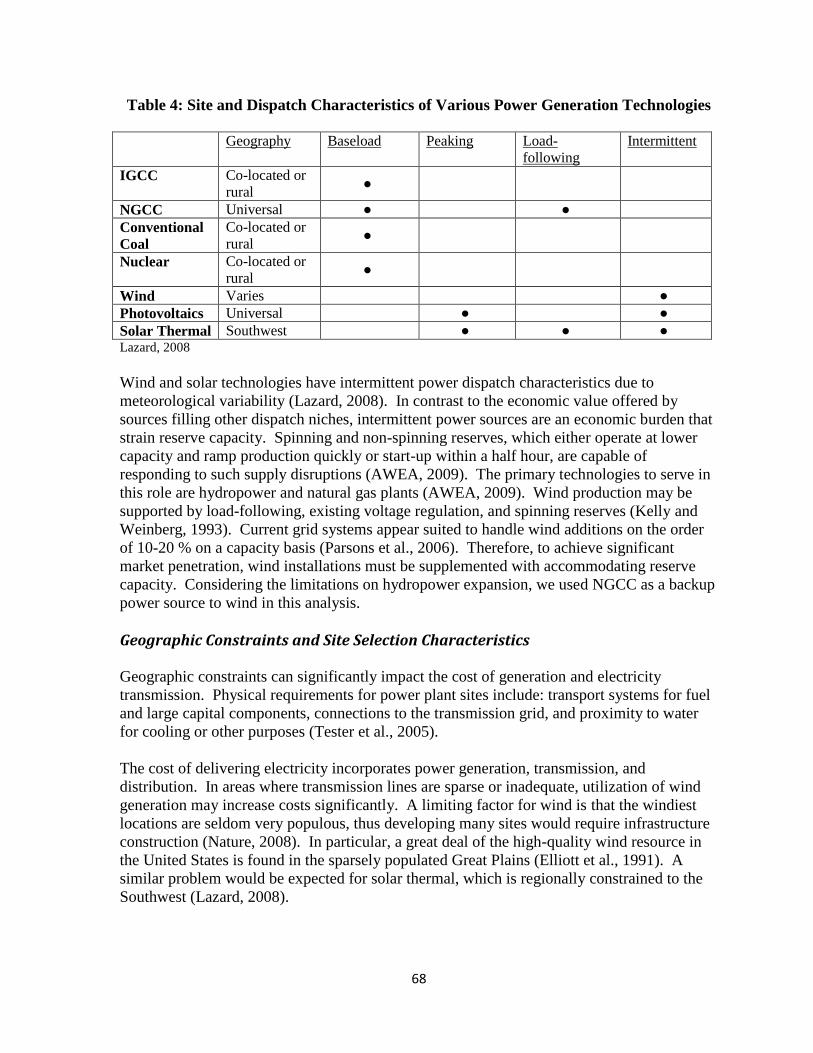
68
Table 4: Site and Dispatch Characteristics of Various Power Generation Technologies Geography Baseload Peaking Load-
following
Intermittent
IGCC Co-located or
rural ●
NGCC Universal ● ●
Conventional
Coal
Co-located or
rural ●
Nuclear Co-located or
rural ●
Wind Varies ●
Photovoltaics Universal ● ●
Solar Thermal Southwest ● ● ● Lazard, 2008
Wind and solar technologies have intermittent power dispatch characteristics due to
meteorological variability (Lazard, 2008). In contrast to the economic value offered by
sources filling other dispatch niches, intermittent power sources are an economic burden that
strain reserve capacity. Spinning and non-spinning reserves, which either operate at lower
capacity and ramp production quickly or start-up within a half hour, are capable of
responding to such supply disruptions (AWEA, 2009). The primary technologies to serve in
this role are hydropower and natural gas plants (AWEA, 2009). Wind production may be
supported by load-following, existing voltage regulation, and spinning reserves (Kelly and
Weinberg, 1993). Current grid systems appear suited to handle wind additions on the order
of 10-20 % on a capacity basis (Parsons et al., 2006). Therefore, to achieve significant
market penetration, wind installations must be supplemented with accommodating reserve
capacity. Considering the limitations on hydropower expansion, we used NGCC as a backup
power source to wind in this analysis.
Geographic Constraints and Site Selection Characteristics
Geographic constraints can significantly impact the cost of generation and electricity
transmission. Physical requirements for power plant sites include: transport systems for fuel
and large capital components, connections to the transmission grid, and proximity to water
for cooling or other purposes (Tester et al., 2005).
The cost of delivering electricity incorporates power generation, transmission, and
distribution. In areas where transmission lines are sparse or inadequate, utilization of wind
generation may increase costs significantly. A limiting factor for wind is that the windiest
locations are seldom very populous, thus developing many sites would require infrastructure
construction (Nature, 2008). In particular, a great deal of the high-quality wind resource in
the United States is found in the sparsely populated Great Plains (Elliott et al., 1991). A
similar problem would be expected for solar thermal, which is regionally constrained to the
Southwest (Lazard, 2008).
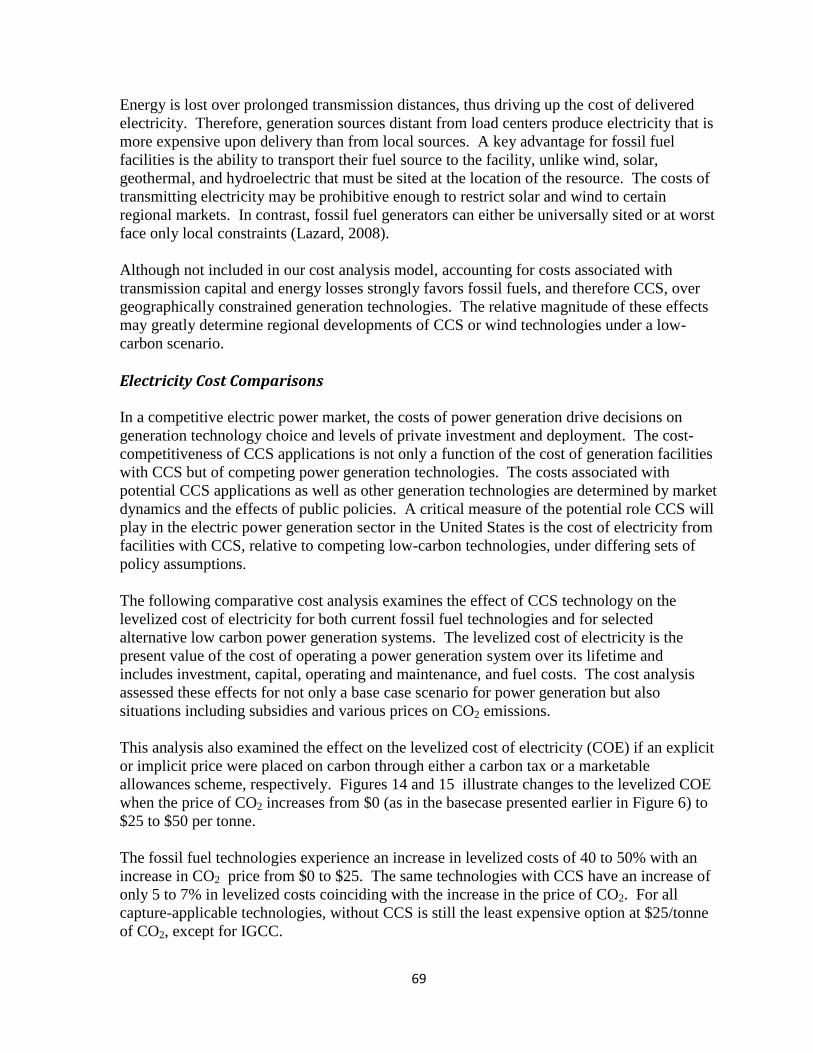
69
Energy is lost over prolonged transmission distances, thus driving up the cost of delivered
electricity. Therefore, generation sources distant from load centers produce electricity that is
more expensive upon delivery than from local sources. A key advantage for fossil fuel
facilities is the ability to transport their fuel source to the facility, unlike wind, solar,
geothermal, and hydroelectric that must be sited at the location of the resource. The costs of
transmitting electricity may be prohibitive enough to restrict solar and wind to certain
regional markets. In contrast, fossil fuel generators can either be universally sited or at worst
face only local constraints (Lazard, 2008).
Although not included in our cost analysis model, accounting for costs associated with
transmission capital and energy losses strongly favors fossil fuels, and therefore CCS, over
geographically constrained generation technologies. The relative magnitude of these effects
may greatly determine regional developments of CCS or wind technologies under a low-
carbon scenario.
Electricity Cost Comparisons
In a competitive electric power market, the costs of power generation drive decisions on
generation technology choice and levels of private investment and deployment. The cost-
competitiveness of CCS applications is not only a function of the cost of generation facilities
with CCS but of competing power generation technologies. The costs associated with
potential CCS applications as well as other generation technologies are determined by market
dynamics and the effects of public policies. A critical measure of the potential role CCS will
play in the electric power generation sector in the United States is the cost of electricity from
facilities with CCS, relative to competing low-carbon technologies, under differing sets of
policy assumptions.
The following comparative cost analysis examines the effect of CCS technology on the
levelized cost of electricity for both current fossil fuel technologies and for selected
alternative low carbon power generation systems. The levelized cost of electricity is the
present value of the cost of operating a power generation system over its lifetime and
includes investment, capital, operating and maintenance, and fuel costs. The cost analysis
assessed these effects for not only a base case scenario for power generation but also
situations including subsidies and various prices on CO2 emissions.
This analysis also examined the effect on the levelized cost of electricity (COE) if an explicit
or implicit price were placed on carbon through either a carbon tax or a marketable
allowances scheme, respectively. Figures 14 and 15 illustrate changes to the levelized COE
when the price of CO2 increases from $0 (as in the basecase presented earlier in Figure 6) to
$25 to $50 per tonne.
The fossil fuel technologies experience an increase in levelized costs of 40 to 50% with an
increase in CO2 price from $0 to $25. The same technologies with CCS have an increase of
only 5 to 7% in levelized costs coinciding with the increase in the price of CO2. For all
capture-applicable technologies, without CCS is still the least expensive option at $25/tonne
of CO2, except for IGCC.
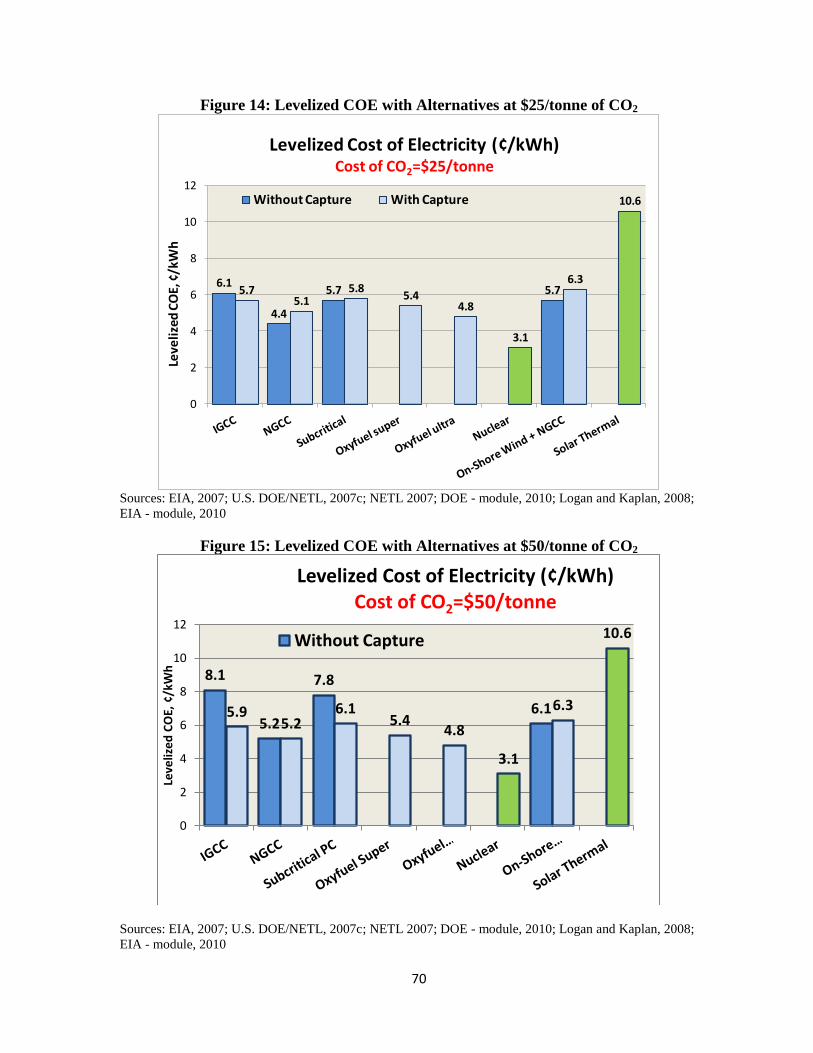
70
Figure 14: Levelized COE with Alternatives at $25/tonne of CO2
Sources: EIA, 2007; U.S. DOE/NETL, 2007c; NETL 2007; DOE - module, 2010; Logan and Kaplan, 2008;
EIA - module, 2010
Figure 15: Levelized COE with Alternatives at $50/tonne of CO2
Sources: EIA, 2007; U.S. DOE/NETL, 2007c; NETL 2007; DOE - module, 2010; Logan and Kaplan, 2008;
EIA - module, 2010
6.1
4.4
5.7 5.75.75.1
5.85.4
4.8
3.1
6.3
10.6
0
2
4
6
8
10
12Le
veli
zed
CO
E, ¢
/kW
h
Levelized Cost of Electricity (¢/kWh)Cost of CO2=$25/tonne
Without Capture With Capture
8.1
5.2
7.8
6.15.95.2
6.15.4
4.8
3.1
6.3
10.6
0
2
4
6
8
10
12
Leve
lize
d C
OE,
¢/k
Wh
Levelized Cost of Electricity (¢/kWh)Cost of CO2=$50/tonne
Without Capture
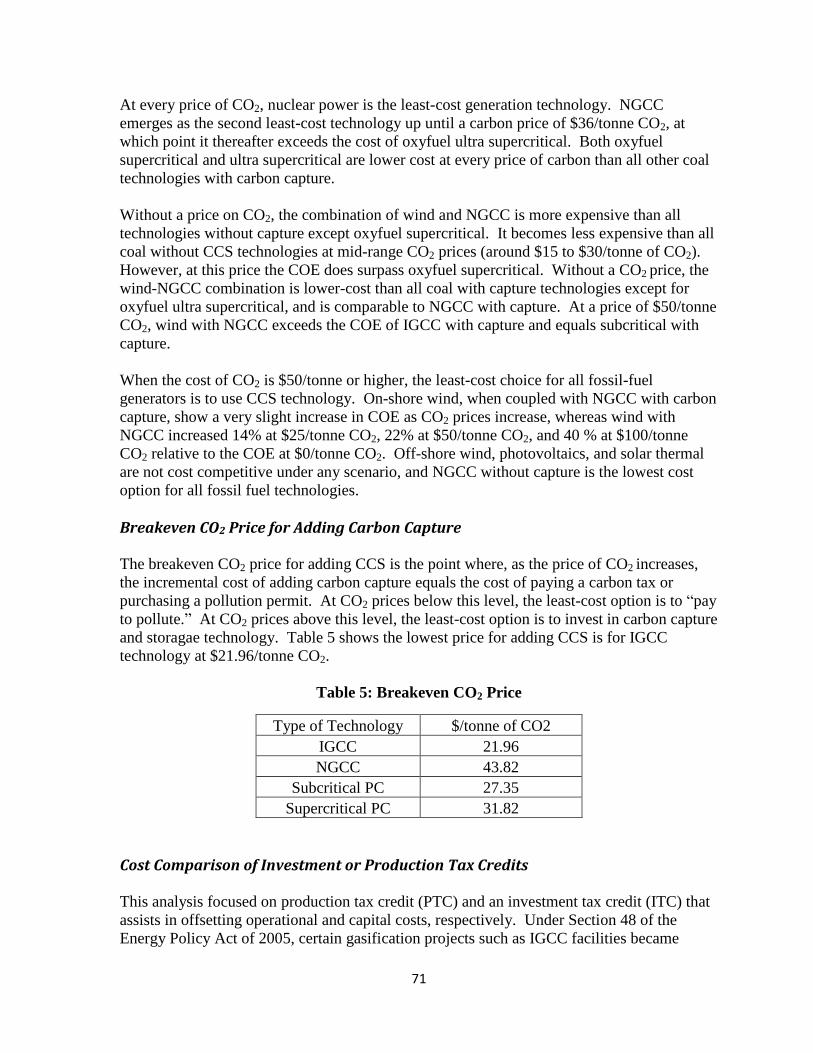
71
At every price of CO2, nuclear power is the least-cost generation technology. NGCC
emerges as the second least-cost technology up until a carbon price of $36/tonne CO2, at
which point it thereafter exceeds the cost of oxyfuel ultra supercritical. Both oxyfuel
supercritical and ultra supercritical are lower cost at every price of carbon than all other coal
technologies with carbon capture.
Without a price on CO2, the combination of wind and NGCC is more expensive than all
technologies without capture except oxyfuel supercritical. It becomes less expensive than all
coal without CCS technologies at mid-range CO2 prices (around $15 to $30/tonne of CO2).
However, at this price the COE does surpass oxyfuel supercritical. Without a CO2 price, the
wind-NGCC combination is lower-cost than all coal with capture technologies except for
oxyfuel ultra supercritical, and is comparable to NGCC with capture. At a price of $50/tonne
CO2, wind with NGCC exceeds the COE of IGCC with capture and equals subcritical with
capture.
When the cost of CO2 is $50/tonne or higher, the least-cost choice for all fossil-fuel
generators is to use CCS technology. On-shore wind, when coupled with NGCC with carbon
capture, show a very slight increase in COE as CO2 prices increase, whereas wind with
NGCC increased 14% at $25/tonne CO2, 22% at $50/tonne CO2, and 40 % at $100/tonne
CO2 relative to the COE at $0/tonne CO2. Off-shore wind, photovoltaics, and solar thermal
are not cost competitive under any scenario, and NGCC without capture is the lowest cost
option for all fossil fuel technologies.
Breakeven CO2 Price for Adding Carbon Capture
The breakeven CO2 price for adding CCS is the point where, as the price of CO2 increases,
the incremental cost of adding carbon capture equals the cost of paying a carbon tax or
purchasing a pollution permit. At CO2 prices below this level, the least-cost option is to “pay
to pollute.” At CO2 prices above this level, the least-cost option is to invest in carbon capture
and storagae technology. Table 5 shows the lowest price for adding CCS is for IGCC
technology at $21.96/tonne CO2.
Table 5: Breakeven CO2 Price
Type of Technology $/tonne of CO2
IGCC 21.96
NGCC 43.82
Subcritical PC 27.35
Supercritical PC 31.82
Cost Comparison of Investment or Production Tax Credits
This analysis focused on production tax credit (PTC) and an investment tax credit (ITC) that
assists in offsetting operational and capital costs, respectively. Under Section 48 of the
Energy Policy Act of 2005, certain gasification projects such as IGCC facilities became
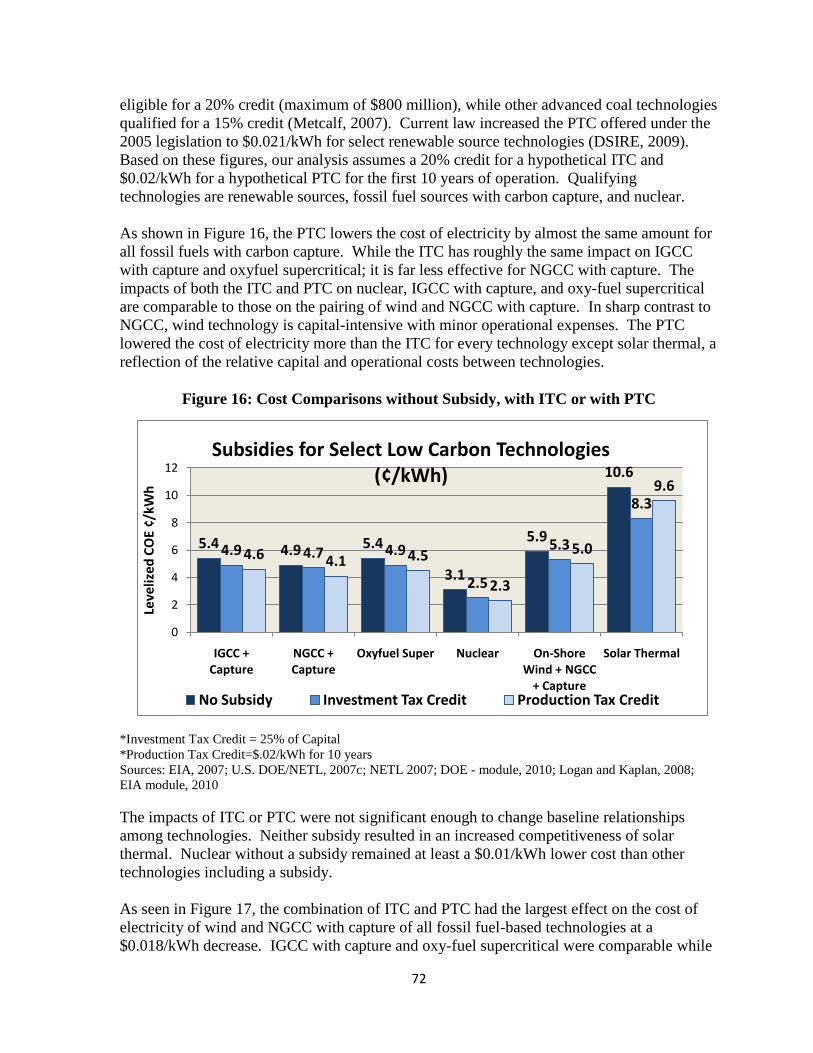
72
eligible for a 20% credit (maximum of $800 million), while other advanced coal technologies
qualified for a 15% credit (Metcalf, 2007). Current law increased the PTC offered under the
2005 legislation to $0.021/kWh for select renewable source technologies (DSIRE, 2009).
Based on these figures, our analysis assumes a 20% credit for a hypothetical ITC and
$0.02/kWh for a hypothetical PTC for the first 10 years of operation. Qualifying
technologies are renewable sources, fossil fuel sources with carbon capture, and nuclear.
As shown in Figure 16, the PTC lowers the cost of electricity by almost the same amount for
all fossil fuels with carbon capture. While the ITC has roughly the same impact on IGCC
with capture and oxyfuel supercritical; it is far less effective for NGCC with capture. The
impacts of both the ITC and PTC on nuclear, IGCC with capture, and oxy-fuel supercritical
are comparable to those on the pairing of wind and NGCC with capture. In sharp contrast to
NGCC, wind technology is capital-intensive with minor operational expenses. The PTC
lowered the cost of electricity more than the ITC for every technology except solar thermal, a
reflection of the relative capital and operational costs between technologies.
Figure 16: Cost Comparisons without Subsidy, with ITC or with PTC
*Investment Tax Credit = 25% of Capital
*Production Tax Credit=$.02/kWh for 10 years
Sources: EIA, 2007; U.S. DOE/NETL, 2007c; NETL 2007; DOE - module, 2010; Logan and Kaplan, 2008;
EIA module, 2010
The impacts of ITC or PTC were not significant enough to change baseline relationships
among technologies. Neither subsidy resulted in an increased competitiveness of solar
thermal. Nuclear without a subsidy remained at least a $0.01/kWh lower cost than other
technologies including a subsidy.
As seen in Figure 17, the combination of ITC and PTC had the largest effect on the cost of
electricity of wind and NGCC with capture of all fossil fuel-based technologies at a
$0.018/kWh decrease. IGCC with capture and oxy-fuel supercritical were comparable while
5.4 4.9 5.4
3.1
5.9
10.6
4.9 4.7 4.9
2.5
5.3
8.3
4.6 4.1 4.5
2.3
5.0
9.6
0
2
4
6
8
10
12
IGCC + Capture
NGCC + Capture
Oxyfuel Super Nuclear On-Shore Wind + NGCC
+ Capture
Solar Thermal
Leve
lize
d C
OE
¢/kW
h
Subsidies for Select Low Carbon Technologies (¢/kWh)
No Subsidy Investment Tax Credit Production Tax Credit
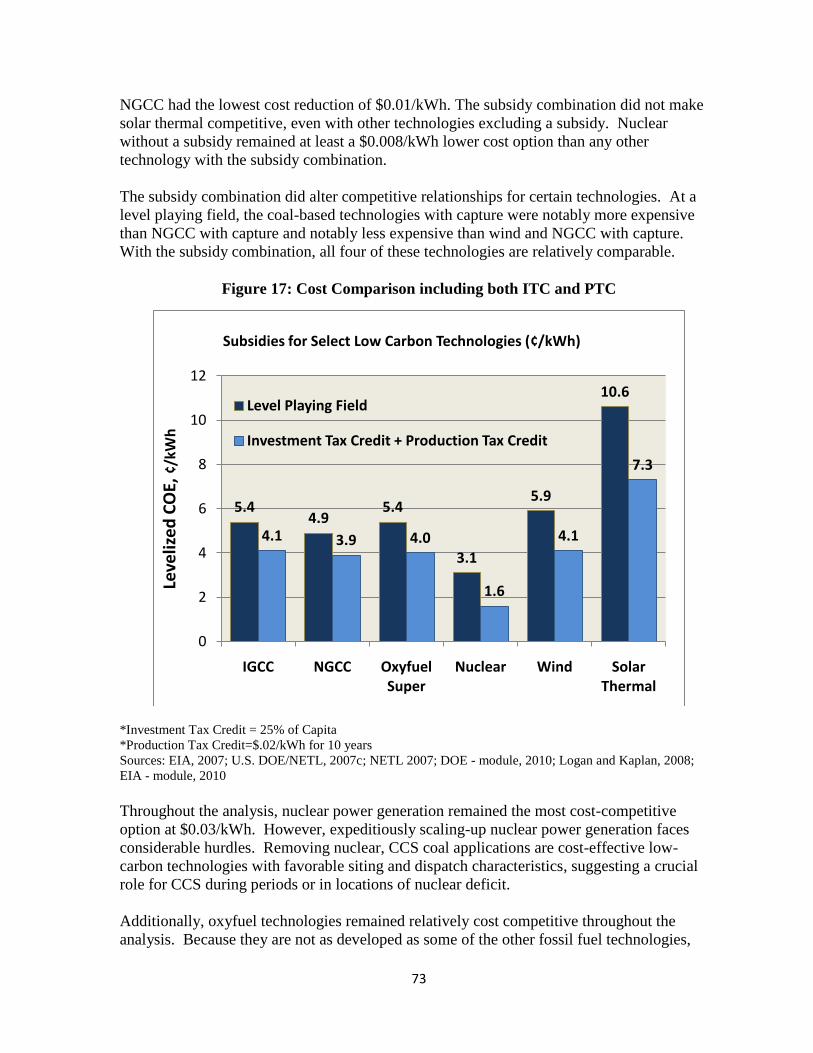
73
NGCC had the lowest cost reduction of $0.01/kWh. The subsidy combination did not make
solar thermal competitive, even with other technologies excluding a subsidy. Nuclear
without a subsidy remained at least a $0.008/kWh lower cost option than any other
technology with the subsidy combination.
The subsidy combination did alter competitive relationships for certain technologies. At a
level playing field, the coal-based technologies with capture were notably more expensive
than NGCC with capture and notably less expensive than wind and NGCC with capture.
With the subsidy combination, all four of these technologies are relatively comparable.
Figure 17: Cost Comparison including both ITC and PTC
*Investment Tax Credit = 25% of Capita
*Production Tax Credit=$.02/kWh for 10 years
Sources: EIA, 2007; U.S. DOE/NETL, 2007c; NETL 2007; DOE - module, 2010; Logan and Kaplan, 2008;
EIA - module, 2010
Throughout the analysis, nuclear power generation remained the most cost-competitive
option at $0.03/kWh. However, expeditiously scaling-up nuclear power generation faces
considerable hurdles. Removing nuclear, CCS coal applications are cost-effective low-
carbon technologies with favorable siting and dispatch characteristics, suggesting a crucial
role for CCS during periods or in locations of nuclear deficit.
Additionally, oxyfuel technologies remained relatively cost competitive throughout the
analysis. Because they are not as developed as some of the other fossil fuel technologies,
5.44.9
5.4
3.1
5.9
10.6
4.1 3.9 4.0
1.6
4.1
7.3
0
2
4
6
8
10
12
IGCC NGCC Oxyfuel Super
Nuclear Wind Solar Thermal
Leve
lize
d C
OE,
¢/k
Wh
Subsidies for Select Low Carbon Technologies (¢/kWh)
Level Playing Field
Investment Tax Credit + Production Tax Credit

74
federal investment in research and development into oxyfuel technology specifically is
necessary for more widespread deployment in the long run. Similar support for IGCC is
necessary as the US lacks experience in IGCC at a reasonable commercial scale of 450 MW
at minimum.

75
Chapter VIII: International Policies,
Regulations, and Public Acceptance
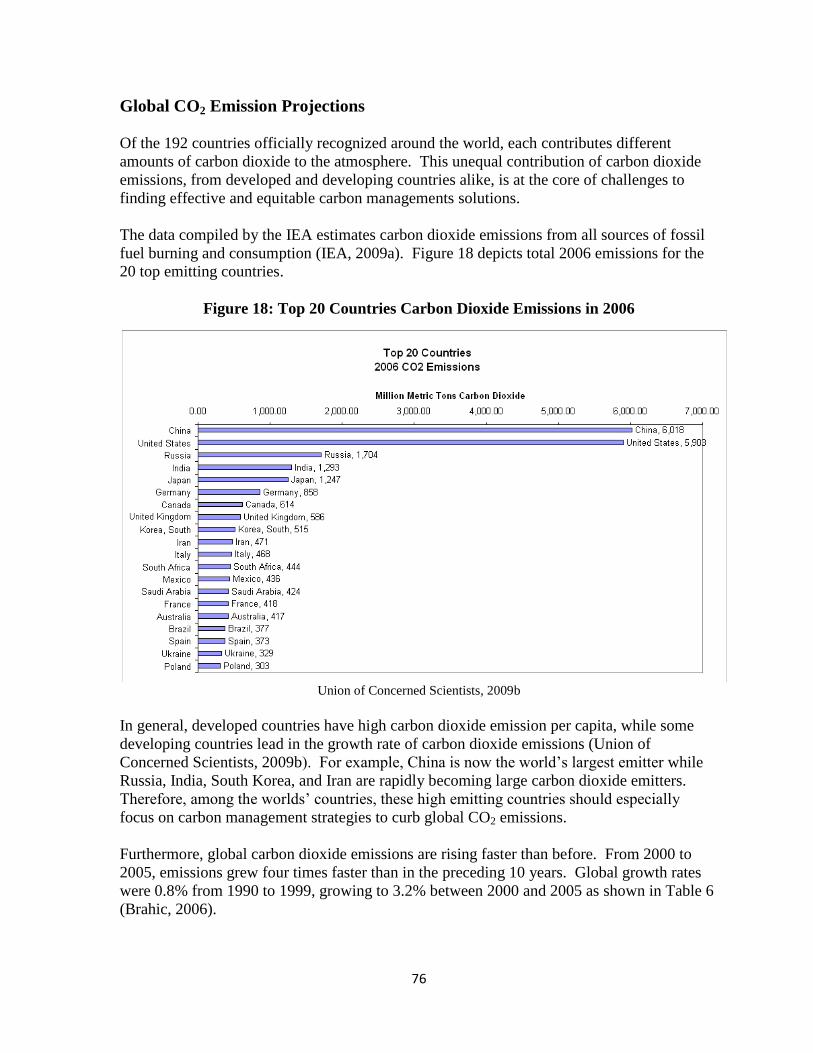
76
Global CO2 Emission Projections
Of the 192 countries officially recognized around the world, each contributes different
amounts of carbon dioxide to the atmosphere. This unequal contribution of carbon dioxide
emissions, from developed and developing countries alike, is at the core of challenges to
finding effective and equitable carbon managements solutions.
The data compiled by the IEA estimates carbon dioxide emissions from all sources of fossil
fuel burning and consumption (IEA, 2009a). Figure 18 depicts total 2006 emissions for the
20 top emitting countries.
Figure 18: Top 20 Countries Carbon Dioxide Emissions in 2006
Union of Concerned Scientists, 2009b
In general, developed countries have high carbon dioxide emission per capita, while some
developing countries lead in the growth rate of carbon dioxide emissions (Union of
Concerned Scientists, 2009b). For example, China is now the world‟s largest emitter while
Russia, India, South Korea, and Iran are rapidly becoming large carbon dioxide emitters.
Therefore, among the worlds‟ countries, these high emitting countries should especially
focus on carbon management strategies to curb global CO2 emissions.
Furthermore, global carbon dioxide emissions are rising faster than before. From 2000 to
2005, emissions grew four times faster than in the preceding 10 years. Global growth rates
were 0.8% from 1990 to 1999, growing to 3.2% between 2000 and 2005 as shown in Table 6
(Brahic, 2006).
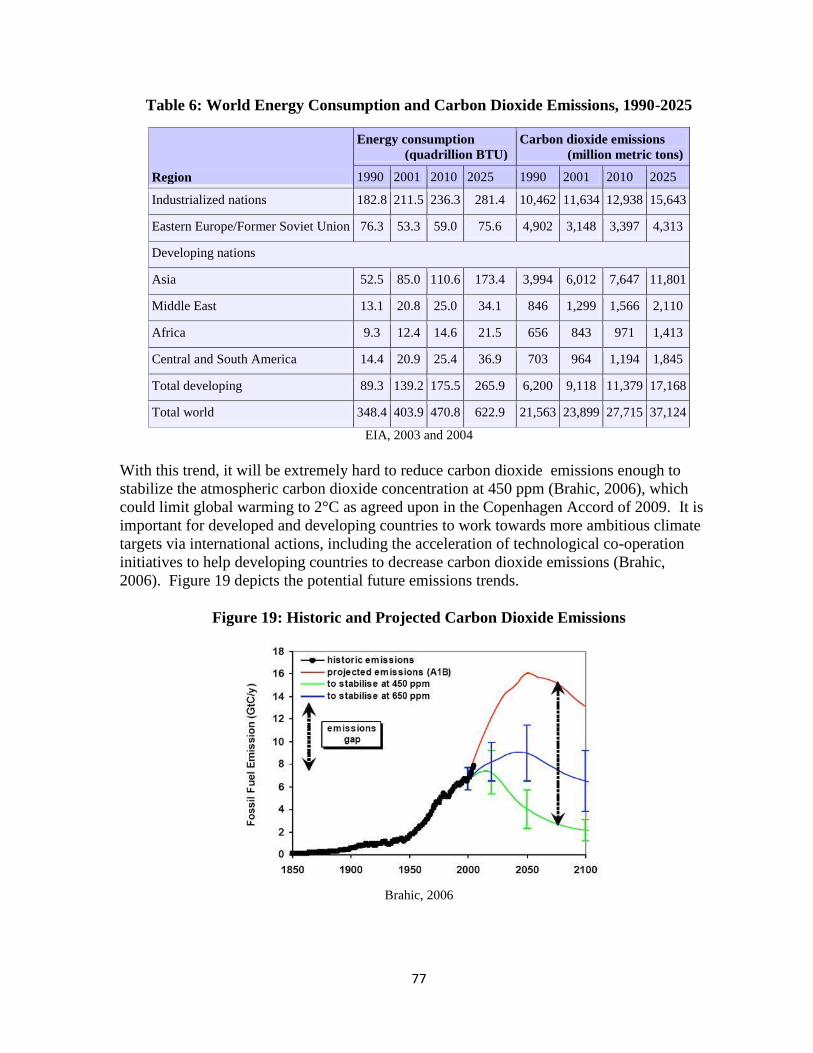
77
Table 6: World Energy Consumption and Carbon Dioxide Emissions, 1990-2025
Region
Energy consumption
(quadrillion BTU)
Carbon dioxide emissions
(million metric tons)
1990 2001 2010 2025 1990 2001 2010 2025
Industrialized nations 182.8 211.5 236.3 281.4 10,462 11,634 12,938 15,643
Eastern Europe/Former Soviet Union 76.3 53.3 59.0 75.6 4,902 3,148 3,397 4,313
Developing nations
Asia 52.5 85.0 110.6 173.4 3,994 6,012 7,647 11,801
Middle East 13.1 20.8 25.0 34.1 846 1,299 1,566 2,110
Africa 9.3 12.4 14.6 21.5 656 843 971 1,413
Central and South America 14.4 20.9 25.4 36.9 703 964 1,194 1,845
Total developing 89.3 139.2 175.5 265.9 6,200 9,118 11,379 17,168
Total world 348.4 403.9 470.8 622.9 21,563 23,899 27,715 37,124
EIA, 2003 and 2004
With this trend, it will be extremely hard to reduce carbon dioxide emissions enough to
stabilize the atmospheric carbon dioxide concentration at 450 ppm (Brahic, 2006), which
could limit global warming to 2°C as agreed upon in the Copenhagen Accord of 2009. It is
important for developed and developing countries to work towards more ambitious climate
targets via international actions, including the acceleration of technological co-operation
initiatives to help developing countries to decrease carbon dioxide emissions (Brahic,
2006). Figure 19 depicts the potential future emissions trends.
Figure 19: Historic and Projected Carbon Dioxide Emissions
Brahic, 2006
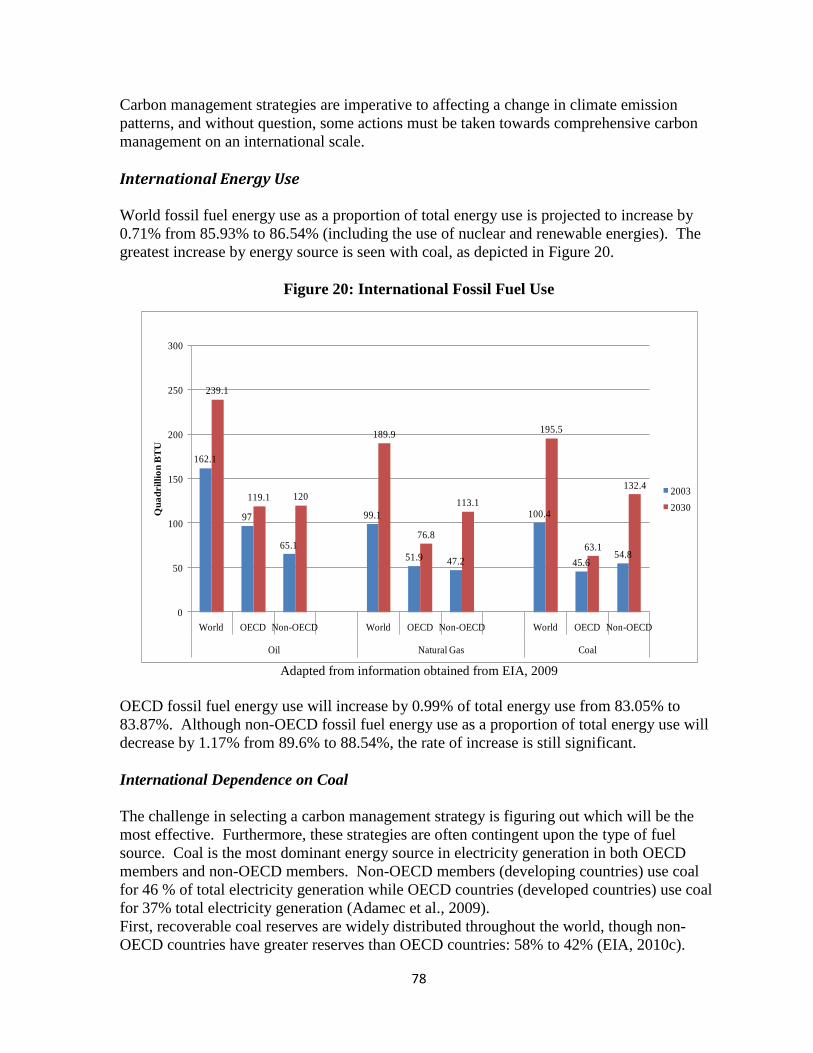
78
Carbon management strategies are imperative to affecting a change in climate emission
patterns, and without question, some actions must be taken towards comprehensive carbon
management on an international scale.
International Energy Use
World fossil fuel energy use as a proportion of total energy use is projected to increase by
0.71% from 85.93% to 86.54% (including the use of nuclear and renewable energies). The
greatest increase by energy source is seen with coal, as depicted in Figure 20.
Figure 20: International Fossil Fuel Use
Adapted from information obtained from EIA, 2009
OECD fossil fuel energy use will increase by 0.99% of total energy use from 83.05% to
83.87%. Although non-OECD fossil fuel energy use as a proportion of total energy use will
decrease by 1.17% from 89.6% to 88.54%, the rate of increase is still significant.
International Dependence on Coal
The challenge in selecting a carbon management strategy is figuring out which will be the
most effective. Furthermore, these strategies are often contingent upon the type of fuel
source. Coal is the most dominant energy source in electricity generation in both OECD
members and non-OECD members. Non-OECD members (developing countries) use coal
for 46 % of total electricity generation while OECD countries (developed countries) use coal
for 37% total electricity generation (Adamec et al., 2009).
First, recoverable coal reserves are widely distributed throughout the world, though non-
OECD countries have greater reserves than OECD countries: 58% to 42% (EIA, 2010c).
162.1
97
65.1
99.1
51.9 47.2
100.4
45.654.8
239.1
119.1 120
189.9
76.8
113.1
195.5
63.1
132.4
0
50
100
150
200
250
300
World OECD Non-OECD World OECD Non-OECD World OECD Non-OECD
Oil Natural Gas Coal
Qu
ad
ril
lio
n B
TU
International Fossil Fuel Use
2003
2030
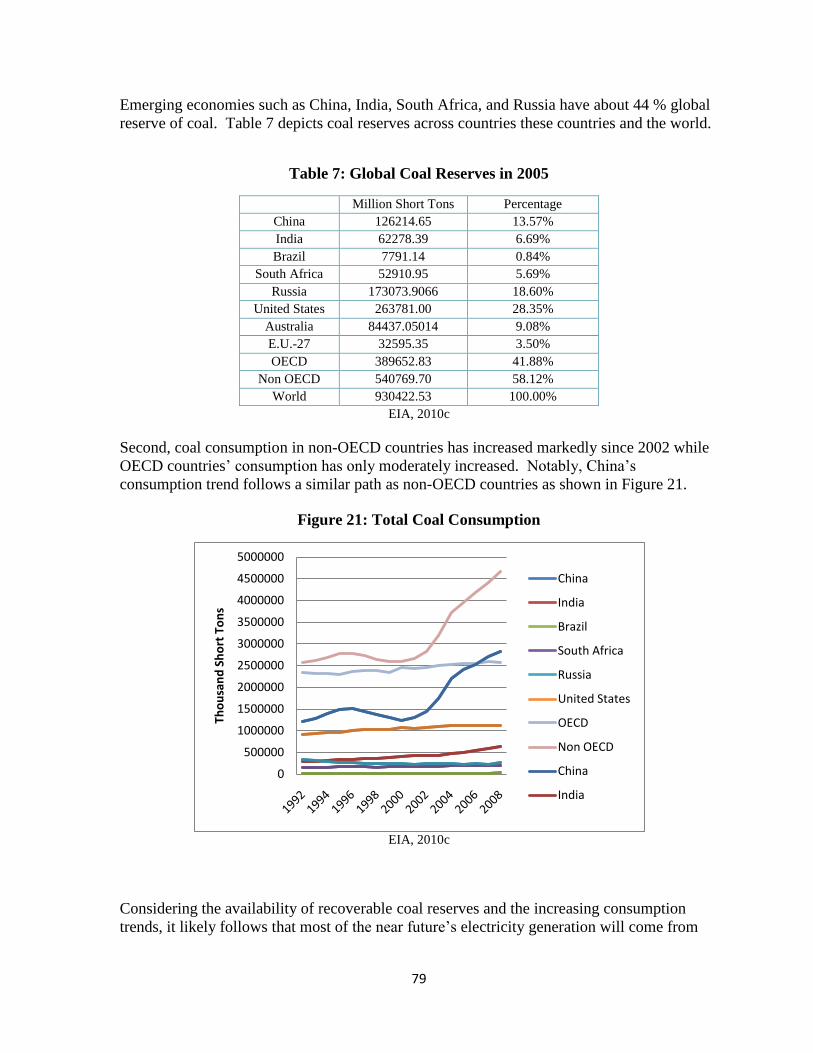
79
Emerging economies such as China, India, South Africa, and Russia have about 44 % global
reserve of coal. Table 7 depicts coal reserves across countries these countries and the world.
Table 7: Global Coal Reserves in 2005
Million Short Tons Percentage
China 126214.65 13.57%
India 62278.39 6.69%
Brazil 7791.14 0.84%
South Africa 52910.95 5.69%
Russia 173073.9066 18.60%
United States 263781.00 28.35%
Australia 84437.05014 9.08%
E.U.-27 32595.35 3.50%
OECD 389652.83 41.88%
Non OECD 540769.70 58.12%
World 930422.53 100.00%
EIA, 2010c
Second, coal consumption in non-OECD countries has increased markedly since 2002 while
OECD countries‟ consumption has only moderately increased. Notably, China‟s
consumption trend follows a similar path as non-OECD countries as shown in Figure 21.
Figure 21: Total Coal Consumption
EIA, 2010c
Considering the availability of recoverable coal reserves and the increasing consumption
trends, it likely follows that most of the near future‟s electricity generation will come from
0
500000
1000000
1500000
2000000
2500000
3000000
3500000
4000000
4500000
5000000
Tho
usa
nd
Sh
ort
To
ns
China
India
Brazil
South Africa
Russia
United States
OECD
Non OECD
China
India
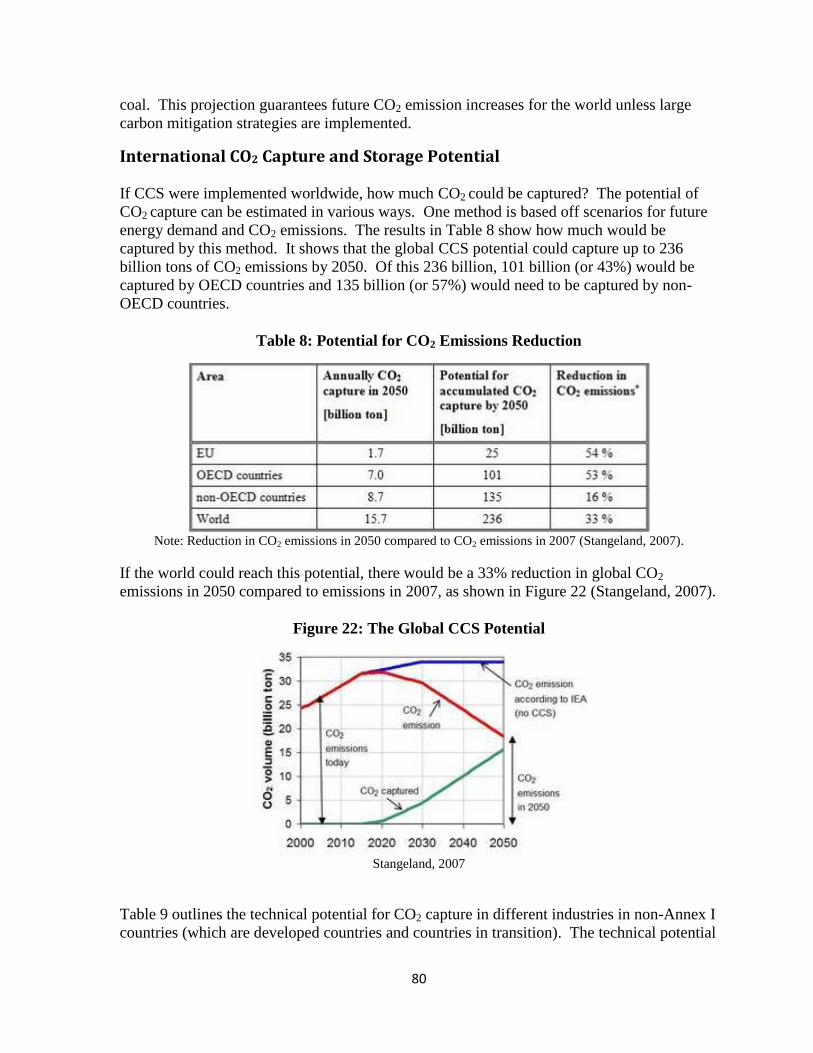
80
coal. This projection guarantees future CO2 emission increases for the world unless large
carbon mitigation strategies are implemented.
International CO2 Capture and Storage Potential
If CCS were implemented worldwide, how much CO2 could be captured? The potential of
CO2 capture can be estimated in various ways. One method is based off scenarios for future
energy demand and CO2 emissions. The results in Table 8 show how much would be
captured by this method. It shows that the global CCS potential could capture up to 236
billion tons of CO2 emissions by 2050. Of this 236 billion, 101 billion (or 43%) would be
captured by OECD countries and 135 billion (or 57%) would need to be captured by non-
OECD countries.
Table 8: Potential for CO2 Emissions Reduction
Note: Reduction in CO2 emissions in 2050 compared to CO2 emissions in 2007 (Stangeland, 2007).
If the world could reach this potential, there would be a 33% reduction in global CO2
emissions in 2050 compared to emissions in 2007, as shown in Figure 22 (Stangeland, 2007).
Figure 22: The Global CCS Potential
Stangeland, 2007
Table 9 outlines the technical potential for CO2 capture in different industries in non-Annex I
countries (which are developed countries and countries in transition). The technical potential
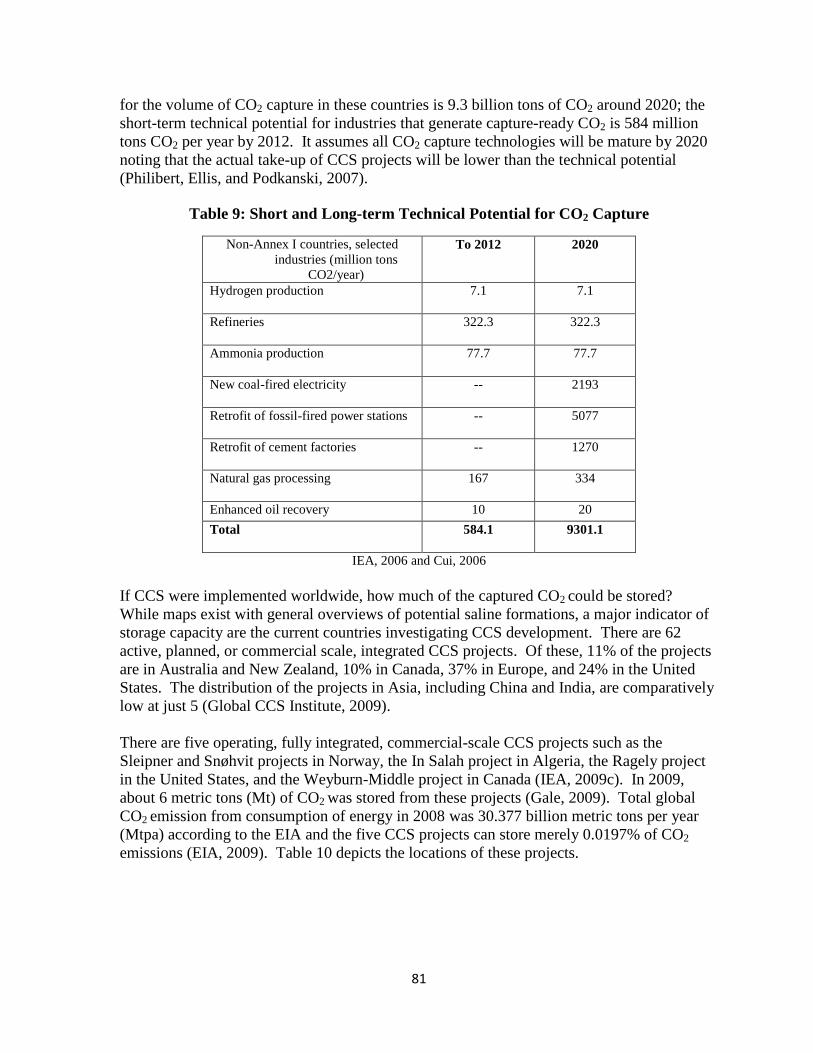
81
for the volume of CO2 capture in these countries is 9.3 billion tons of CO2 around 2020; the
short-term technical potential for industries that generate capture-ready CO2 is 584 million
tons CO2 per year by 2012. It assumes all CO2 capture technologies will be mature by 2020
noting that the actual take-up of CCS projects will be lower than the technical potential
(Philibert, Ellis, and Podkanski, 2007).
Table 9: Short and Long-term Technical Potential for CO2 Capture
Non-Annex I countries, selected
industries (million tons
CO2/year)
To 2012 2020
Hydrogen production 7.1 7.1
Refineries 322.3 322.3
Ammonia production 77.7 77.7
New coal-fired electricity -- 2193
Retrofit of fossil-fired power stations -- 5077
Retrofit of cement factories -- 1270
Natural gas processing 167 334
Enhanced oil recovery 10 20
Total 584.1 9301.1
IEA, 2006 and Cui, 2006
If CCS were implemented worldwide, how much of the captured CO2 could be stored?
While maps exist with general overviews of potential saline formations, a major indicator of
storage capacity are the current countries investigating CCS development. There are 62
active, planned, or commercial scale, integrated CCS projects. Of these, 11% of the projects
are in Australia and New Zealand, 10% in Canada, 37% in Europe, and 24% in the United
States. The distribution of the projects in Asia, including China and India, are comparatively
low at just 5 (Global CCS Institute, 2009).
There are five operating, fully integrated, commercial-scale CCS projects such as the
Sleipner and Snøhvit projects in Norway, the In Salah project in Algeria, the Ragely project
in the United States, and the Weyburn-Middle project in Canada (IEA, 2009c). In 2009,
about 6 metric tons (Mt) of CO2 was stored from these projects (Gale, 2009). Total global
CO2 emission from consumption of energy in 2008 was 30.377 billion metric tons per year
(Mtpa) according to the EIA and the five CCS projects can store merely 0.0197% of CO2
emissions (EIA, 2009). Table 10 depicts the locations of these projects.
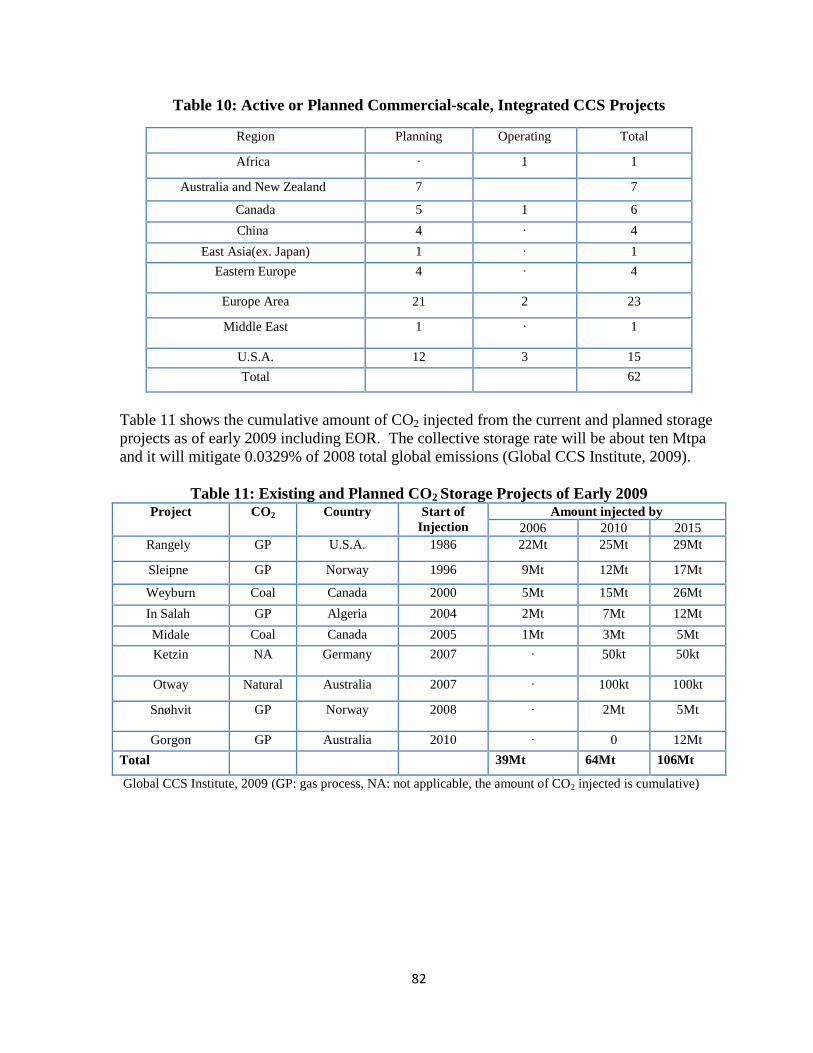
82
Table 10: Active or Planned Commercial-scale, Integrated CCS Projects
Region Planning Operating Total
Africa ∙ 1 1
Australia and New Zealand 7 7
Canada 5 1 6
China 4 ∙ 4
East Asia(ex. Japan) 1 ∙ 1
Eastern Europe 4 ∙ 4
Europe Area 21 2 23
Middle East 1 ∙ 1
U.S.A. 12 3 15
Total 62
Table 11 shows the cumulative amount of CO2 injected from the current and planned storage
projects as of early 2009 including EOR. The collective storage rate will be about ten Mtpa
and it will mitigate 0.0329% of 2008 total global emissions (Global CCS Institute, 2009).
Table 11: Existing and Planned CO2 Storage Projects of Early 2009 Project CO2 Country Start of
Injection
Amount injected by
2006 2010 2015
Rangely GP U.S.A. 1986 22Mt 25Mt 29Mt
Sleipne GP Norway 1996 9Mt 12Mt 17Mt
Weyburn Coal Canada 2000 5Mt 15Mt 26Mt
In Salah GP Algeria 2004 2Mt 7Mt 12Mt
Midale Coal Canada 2005 1Mt 3Mt 5Mt
Ketzin NA Germany 2007 ∙ 50kt 50kt
Otway Natural Australia 2007 ∙ 100kt 100kt
Snøhvit GP Norway 2008 ∙ 2Mt 5Mt
Gorgon GP Australia 2010 ∙ 0 12Mt
Total 39Mt 64Mt 106Mt
Global CCS Institute, 2009 (GP: gas process, NA: not applicable, the amount of CO2 injected is cumulative)
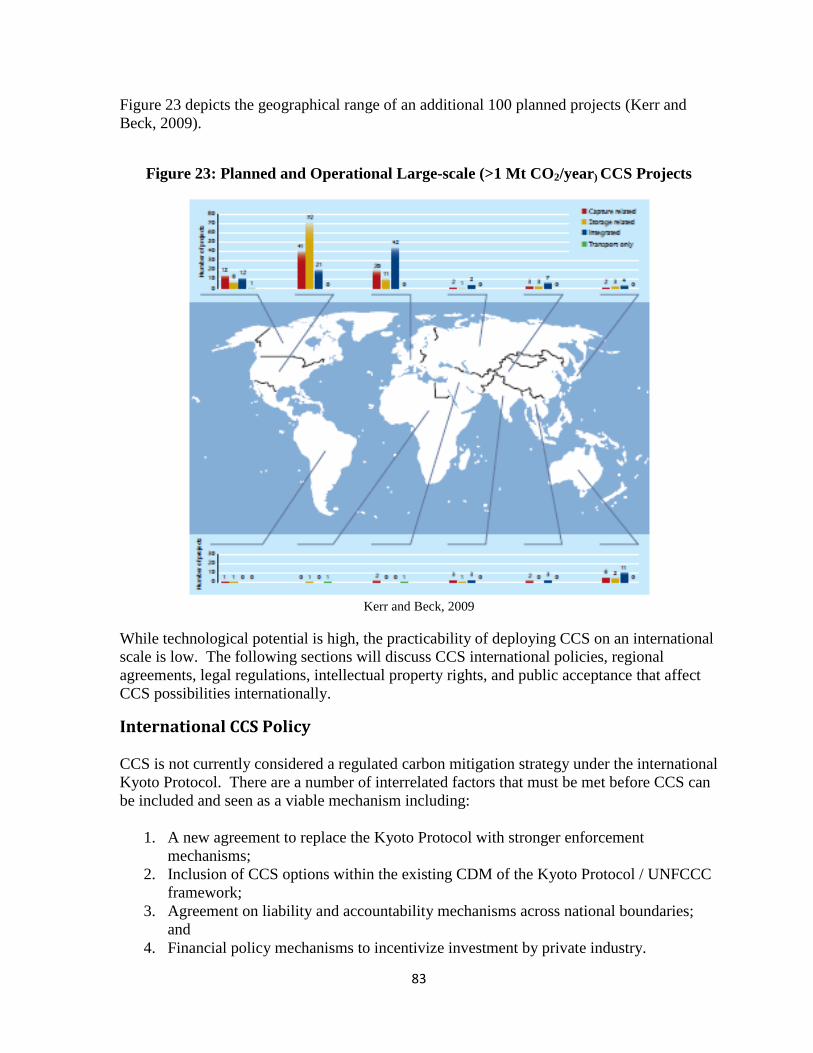
83
Figure 23 depicts the geographical range of an additional 100 planned projects (Kerr and
Beck, 2009).
Figure 23: Planned and Operational Large-scale (>1 Mt CO2/year) CCS Projects
Kerr and Beck, 2009
While technological potential is high, the practicability of deploying CCS on an international
scale is low. The following sections will discuss CCS international policies, regional
agreements, legal regulations, intellectual property rights, and public acceptance that affect
CCS possibilities internationally.
International CCS Policy
CCS is not currently considered a regulated carbon mitigation strategy under the international
Kyoto Protocol. There are a number of interrelated factors that must be met before CCS can
be included and seen as a viable mechanism including:
1. A new agreement to replace the Kyoto Protocol with stronger enforcement
mechanisms;
2. Inclusion of CCS options within the existing CDM of the Kyoto Protocol / UNFCCC
framework;
3. Agreement on liability and accountability mechanisms across national boundaries;
and
4. Financial policy mechanisms to incentivize investment by private industry.
84
The new Kyoto Protocol agreement is still in progress, and the probability of CCS inclusion
is unknown. Meanwhile, countries are exploring regulation frameworks and financial
mechanisms, though the development of these is largely contingent upon stable policy. The
following discussion details current knowledge.
Kyoto Protocol and CCS
The Kyoto Protocol is a legally binding agreement for its 184 signatory members that are
parties to the United Nations Framework Convention on Climate Change (UNFCCC)
(UNFCCC, 2009c). The UNFCCC objective is the "stabilization of greenhouse gas
concentrations in the atmosphere at a level that would prevent dangerous anthropogenic
interference with the climate system” (UNFCC, 2009c). Once the Kyoto Protocol expires in
2012, the UNFCCC must create a more stringent structure to assure compliance with climate
change amelioration pledges. The COP15 meeting in Copenhagen (AKA the 15th
Conference of the UNFCCC 192 Parties) sought to produce a replacement protocol, but so
far only the Copenhagen Accord has been signed which calls for a ceiling on climate change
at 2° C (Pershing, 2010).
Mechanisms and Challenges to CCS Inclusion
There are three interconnecting mechanisms under the Kyoto Protocol that support
technology transfer via economic tools: the Clean Development Mechanisms (CDMs), Joint
Implementation (JI), and Carbon Emission Trading (UNFCCC, 2010). CDMs are alternative
energy projects meant to allow countries a “cleaner” way of developing, and they receive
bilateral investment under Joint Implementation (CDM Executive Board, 2009). The
countries implementing the projects also receive certified emission reduction permits (CERs)
(UNFCCC, 2010).
According to the CDM website, the UNFCCC has considered CCS for incorporation into the
CDM since 2005 (UNFCCC, 2009a). A variety of impediments have precluded CCS‟s
official adoption, such as project boundary, leakage, and permanence, inter alia (UNFCCC,
2009b). Although the UNFCCC created draft decisions at the COP15 to include CCS as a
CDM, discussion is ongoing as to whether CCS fits within the mission of Kyoto Protocol
mechanisms among the other aforementioned concerns (UNFCCC, 2009d). The Executive
Board has requested that baseline and monitoring methodologies be placed on hold until the
supreme governing body of the UNFCCC (the COP) provides further guidance on the
inclusion of CCS in the CDM (UNFCCC, 2009d). Their report categorizes the various
obstacles as technical, environmental, methodological, legal, and market issues (CDM
Executive Board, 2009).
While the mechanisms provide an accountability structure for countries to work together to
achieve the Protocol‟s objective, compliance is not always transparent. Articles 7 and 8
require a national inventory of anthropogenic sources be maintained subject to review by
expert teams (Redgwell, 2008). However, developing countries‟ commitments to these
accountability measures has been controversial, and COP7 at Marrakesh in 2001 established
an agreement on “new guidelines requiring developing country parties to report on their
85
emissions and to indicate the steps being taken to meet their obligations under the UNFCCC”
(Redgwell, 2008, p. 91).
The lack of transparency and compliance has deterred countries like the United States and
Australia from ratifying the treaty in the past, and stronger mechanisms must be in place
before any international cooperation on CCS, due to its risk factors and high capital costs.
Currently Parties to the UNFCCC have doubted the effectiveness of CCS as an optional part
of these mechanisms for these reasons as well as developing countries‟ financial problems
and low technical capacity.
Developing countries have low profiles in CCS deployment because of financing and
technical support challenges. CSS deployment is too expensive for most developing
countries to fund their own projects. As previously mentioned, the CDM is the current
international funding mechanism under UNFCCC, but it has not yet adopted CCS into the
mechanism (IEA, 2009b). Thus, developing countries‟ CCS deployment is limited to small-
scale projects unless outside funding and aid is procured.
Of notable concern in this debate is the amount of capital investment necessary in regions
that do not currently comply with oversight and accountability measures for other
international projects. Although technology transfers will be important for CCS development,
these oversight and accountability issues must be addressed for effective development of the
technology. Nevertheless, the future of any coherent international policy on CCS is at a
standstill until the various parties to the UNFCCC can adequately address these concerns.
Emerging Regional and Bi-lateral Agreements
While global endorsement of CCS through the UNFCCC is delayed, a number of countries
have forged regional/multilateral agreements and are actively pursuing a larger role for CCS
in the portfolio of climate change management. These initiatives will most likely be more
effective in integrating CCS into the global system as a bottom-up approach to policy
development and implementation.
There are several international collaborative institutions to facilitate deployment of CCS.
First, the Carbon Sequestration Leadership Forum (CSLF) is a ministerial-level international
climate change initiative consisting of 24 members including 23 countries and European
Commission. Its projects focus on information exchange and networking, planning, and
road-mapping, facilitation of collaboration, and research and development (Carbon
Sequestration Leadership Forum, 2008)
Second, the International Energy Agency (IEA) Greenhouse Gas R & D Program (IEA
GHG) works on technology evaluation, facilitation of implementation, dissemination of the
result and data from evaluation studies, international collaborative research, development,
and demonstration (IEA, 2009a).
Third, the Global Carbon Capture and Storage Institute (GCCSI) supported by 20 national
governments and over 80 leading corporations, non-governmental bodies, and research
86
organizations provide advice and insight on technologies, economic, and legal aspects of
CCS deployment.
Fourth, the COACH project between the European Union and China aims to prepare the
implementation of large scale clean coal energy production in China. COACH develops a
strong partnership between the countries while including public awareness/acceptance, legal,
regulatory, and economic aspects (The COACH project, 2010).
International Cooperation with the United States
The Clean Energy Fossil Energy Task Force of the Asia-Pacific Partnership (APP) on Clean
Development and Climate is a public-private task force to address climate change between
the United States and Asian countries, such as China and Korea. NETL and the Korea
Institute of Energy Research (KIER) have collaborated on CCS through joint research and
development publications, exchanges of personnel and equipment, and collaborative
meetings/workshops (Asia-Pacific Partnership on Clean Devlopment and Climate Change,
2008).
The World Resources Institute (WRI) and Tsinghua University have a project to build
China‟s capacity to deploy CCS funded by the U.S. Department of State under APP; it aims
to support regulatory framework of CCS in China. The WRI-Tsinghua team is drafting
guidelines for safe and effective CCS in China. The process will engage diverse stakeholders
and technical experts and help build consensus by sharing best practices (Asia-Pacific
Partnership on Clean Devlopment and Climate Change, 2008).
China and the United States
The United States and China are the world‟s largest greenhouse gas emitters; therefore,
collaboration between the two nations offers the greatest opportunity for achieving
reductions in global greenhouse gas emissions. One critical pathway is supporting CCS to
curb fossil fuel atmospheric emissions (Gallagher, 2009). Nevertheless, the policy attitudes
between the two countries differ. China‟s perspective on CCS is that it can be an important
carbon management tool, but it cannot become the priority area in developing countries,
given the high cost and energy penalty of its large-scale development. Currently only a few
memoranda of agreement have been signed (The Center for American Progress, 2009).
Thus, to promote the development of CCS, there must be broad international collaboration to
improve the financial mechanism in technology development and transfer (Peng, 2009).
Furthermore, there is no detailed national carbon storage assessment in China. Many people
within Chinese government circles remain uncertain about the economic value of removing
carbon dioxide from the process of burning coal. A government official reported, "We are
willing to go along with international research, but [CCS] isn't currently our main focus when
it comes to cutting emissions" (Stanway, 2010).
A successful U.S.-China collaboration should be built on mutual respect and recognition of
both countries‟ expertise and incentives. It should also lay the track for substantial emission
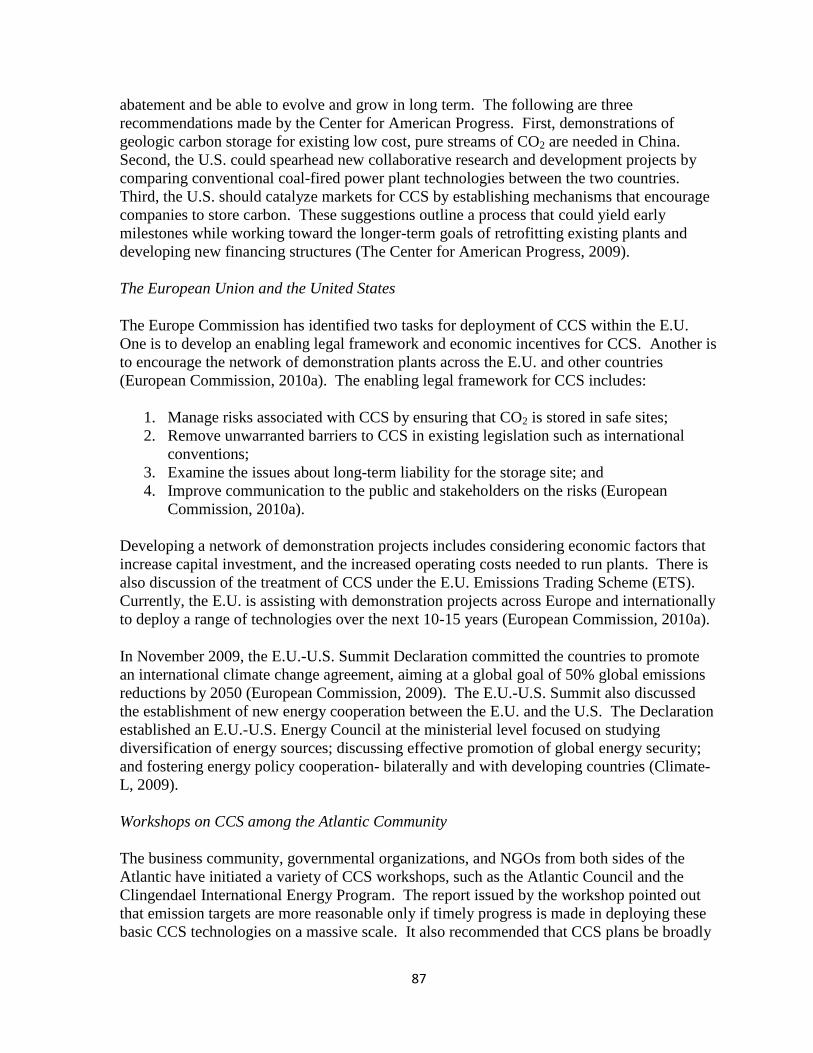
87
abatement and be able to evolve and grow in long term. The following are three
recommendations made by the Center for American Progress. First, demonstrations of
geologic carbon storage for existing low cost, pure streams of CO2 are needed in China.
Second, the U.S. could spearhead new collaborative research and development projects by
comparing conventional coal-fired power plant technologies between the two countries.
Third, the U.S. should catalyze markets for CCS by establishing mechanisms that encourage
companies to store carbon. These suggestions outline a process that could yield early
milestones while working toward the longer-term goals of retrofitting existing plants and
developing new financing structures (The Center for American Progress, 2009).
The European Union and the United States
The Europe Commission has identified two tasks for deployment of CCS within the E.U.
One is to develop an enabling legal framework and economic incentives for CCS. Another is
to encourage the network of demonstration plants across the E.U. and other countries
(European Commission, 2010a). The enabling legal framework for CCS includes:
1. Manage risks associated with CCS by ensuring that CO2 is stored in safe sites;
2. Remove unwarranted barriers to CCS in existing legislation such as international
conventions;
3. Examine the issues about long-term liability for the storage site; and
4. Improve communication to the public and stakeholders on the risks (European
Commission, 2010a).
Developing a network of demonstration projects includes considering economic factors that
increase capital investment, and the increased operating costs needed to run plants. There is
also discussion of the treatment of CCS under the E.U. Emissions Trading Scheme (ETS).
Currently, the E.U. is assisting with demonstration projects across Europe and internationally
to deploy a range of technologies over the next 10-15 years (European Commission, 2010a).
In November 2009, the E.U.-U.S. Summit Declaration committed the countries to promote
an international climate change agreement, aiming at a global goal of 50% global emissions
reductions by 2050 (European Commission, 2009). The E.U.-U.S. Summit also discussed
the establishment of new energy cooperation between the E.U. and the U.S. The Declaration
established an E.U.-U.S. Energy Council at the ministerial level focused on studying
diversification of energy sources; discussing effective promotion of global energy security;
and fostering energy policy cooperation- bilaterally and with developing countries (Climate-
L, 2009).
Workshops on CCS among the Atlantic Community
The business community, governmental organizations, and NGOs from both sides of the
Atlantic have initiated a variety of CCS workshops, such as the Atlantic Council and the
Clingendael International Energy Program. The report issued by the workshop pointed out
that emission targets are more reasonable only if timely progress is made in deploying these
basic CCS technologies on a massive scale. It also recommended that CCS plans be broadly
88
supported by industry and the public. The report confirms that government-to-government
dialogues are underway. It also said that a Transatlantic Forum or Council on Energy should
be formed to coordinate an E.U.-U.S. energy cooperation (The Atlantic Council and the
Clingendael International Energy Program, 2009).
Emerging Regulations
Regulatory frameworks for CCS are under current development within individual countries
worldwide and will be essential to international CCS deployment. The best way to create
these frameworks is to build upon existing national legislation, such as that for air pollution
control, environmental impact assessment, and existing pipeline transport. There are patterns
seen amongst countries as they explore these issues and lessons learned. For example,
ensuring environmental integrity will require individual site-by-site assessment of CCS
development including risk assessment, site characterization, simulation, and monitoring
structures (Odeh and Haydock, 2009). Table 12 compares current regulatory frameworks
across the European Union, the United Kingdom, the United States, and Australia. Check-
marks indicate consideration of the category, while Xs indicate no consideration or lack of
data available.
Table 12: Review of Regulatory Frameworks for CCS Development
Odeh and Haydock, 2009
89
Marine Storage Treaties
In addition to terrestrial territory CCS storage regulation, there are several regulatory
activities in legislations to protect marine environments. For example, the London Protocol
prohibiting waste disposal in marine environments has been amended in 2006 and allows
carbon dioxide to be sequestrated in sub-seabed geological formation (Odeh and Haydock,
2009). Disposal into sub-seabed formation should consist of overwhelmingly carbon dioxide
and wastes should not be added to the disposal. Thirty-seven parties have currently ratified
the amended Protocol (Office for the London Convention and Protocol, 2007).
Similarly, the Oslo-Paris (OSPAR) Convention regulating polluting activities in sub-seabed
and subsoil introduced an amendment to allow for carbon dioxide storage in sub-seabed
formation in 2007. It requires specific CO2 guidelines be applied before a storage permit is
issued. The guidelines focus on the process of injection and post injection and include site
selection, characterization, risk assessment, and monitoring requirement (Odeh and Haydock,
2009). The amendment has yet to be ratified.
Intellectual Property Rights
CCS is a technology-intensive process; therefore copyright laws protecting existing and
future technologies are an important legal aspect to the implementation of CCS. The transfer
of intellectual property rights (IPRs)3 is an issue that has been raised between the
governments of developed and developing countries. Nevertheless, it remains unclear
whether the CCS intellectual property owners (usually developed countries) will be willing to
license them, especially in the absence of a stringent regulatory framework.
Currently, no specific IPR legal regime has been developed, although the World Trade
Organization‟s Trade-Related Aspects of Intellectual Property Rights (TRIPs) agreement
could serve as a stepping stone for CCS IPR development. Yet, there is no guarantee that
developed countries will be willing to transfer or license their technology to developing
countries (U.S. DOE/NETL, 2006).
International Public Perception
Universities and environmental research centers in a number of countries outside of the U.S.
have conducted studies regarding the public‟s view of CCS. The first common result of these
studies is that awareness and knowledge of CCS is generally very low. For example, in
public opinion surveys conducted in the UK, Sweden, and Japan, “carbon capture and
storage” and “carbon storage” received the lowest recognition among a range of technologies
including wind energy, energy efficient appliances, nuclear energy, and biomass. The second
result is that although the common reaction is skepticism, there seems no a priori rejection of
the technology (Reiner et al., 2006).
The potential risks of CCS help explain public rejection. In France, for example, the
question about „approval of or opposition to‟ the use of CCS was asked two times: first after
3 IPR are temporary grants of monopoly intended to give economic incentives for innovative activity.
90
presenting the technology, and then soon after explaining the possible risks. The approval
rates were 59% and 38%, respectively (Pagnier, 2007). On the other hand, other factors such
as the source of information, level of trust in key institutions, and confidence in the
government were significant in the public opinion survey on CCS. For example, a Japanese
survey provided different information on CCS to each group of participants; the group that
received information from neutral newspaper articles returned slightly lower preference
levels than the group that received information from the IPCC Special Report (Itaoka,
Okuda, Saito, and Akai, 2009).
The results of these surveys also show that respondents generally perceive CCS as a bridge
technology to a more sustainable future. A study in the United Kingdom by the Tyndall
Centre, one of the leading research centers on climate issues, found that compared with other
mitigation options, renewable energy and energy efficiency were more strongly favored.
However, CCS was still preferred over nuclear power or higher energy bills (Shackley,
McLachlan and Gough, 2005). In this sense, CCS is tolerable when framed as part of a range
of measures and as an alternative to nuclear power (Pagnier, 2007). It can also be inferred
that larger increases in electricity prices due to CCS technologies could be an important
handicap for the CCS deployment in the U.S.
Finally, the E.U.‟s ACCSEPT Project is an important source for anticipating how NGOs will
respond to deployment of CCS technology in the U.S. The results of surveys conducted
throughout the E.U. show that NGOs are the least accepting of CCS among potential
stakeholders (e.g. energy industry, research/government sectors, and national parliaments).
The NGO respondents were concerned about the potential risks and potential negative
impacts of CCS upon investment in other low- and zero-carbon energy technologies, energy
efficiency, energy demand reduction, and movement towards a decentralized power
generation system (Shackley et al., 2007).
Concluding Comments
Although a variety of policy options are under active consideration, the role of CCS in a
carbon management portfolio is likely to be contingent upon strong political leadership and
available funding to assist industry in complying. While President Obama is supporting R
and D domestically, the current global recession is a hindrance to commercial development
domestically and especially internationally.

91
Chapter IX: Conclusions
92
Technologies and Costs
Overall, CCS proves to be a cost competitive option that results in low-carbon electricity
generation as part of a larger carbon management portfolio. Specifically, we found that CCS
increases the levelized COE by 1.3¢ to 2.2¢ per kWh depending on the technology used.
However, federal funding for research, development, and deployment will be essential to
implement CCS on a commercial scale.
According to the data presented in this report and given the projected coal usage throughout
the next 50 years, IGCC plants are the most practical for immediate application of CCS at
new facilities. IGCC technology is better developed than oxyfuel combustions techniques,
and upgrading an existing IGCC plant to include capture technology provides the lowest
marginal increase in levelized COE. We find that IGCC is the first fossil fuel technology to
be economical with capture at a price of $22 per tonne of CO2.
NGCC technology is also practical for immediate implication of CCS as it is more developed
than other technologies and would be able to move from pilot-scale to commercial-scale
projects given the proper incentives. Furthermore, NGCC provides the lowest levelized COE
(assuming a stable price of natural gas at $4.50/MMBtu) of all the fossil fuels technologies
across all carbon prices, second only to oxy-fuel ultra supercritical. If the price of natural gas
were to increase significantly relative to coal, NGCC‟s levelized COE would become greater
in comparison to all other coal based technologies, thereby making it a less competitive
option (also see Appendix A).
Federal funding for research and development would be best placed in oxyfuel technologies,
particularly ultra supercritical. Given the projection that coal will remain a heavily used fuel
source for at least the next 50 years resulting in continued environmental concerns regarding
CO2 emissions, oxyfuel sources show the greatest potential for future power generation
reliance. Our analysis suggests that oxyfuel ultra supercritical technology has the lowest
levelized COE of all of the fossil fuel technologies with capture at any CO2 price. It is also
specifically designed to produce zero CO2 emissions during coal combustion. The COE
increases with coal based technologies when there is a price on CO2; however, because oxy-
fuel produces zero carbon dioxide emissions, it remains the most cost competitive option as
its levelized COE remains stable among all prices of CO2 . However, as oxy-fuel
technologies are still in early development stages, heavy federal investment in research and
development will be needed in order to bring this technology to commercial-scale.
According to this analysis, nuclear plants provide substantially lower levelized COE at every
price of CO2. Due to the low COE that nuclear power provides, it may become a more
widely utilized power-generating source; however, high initial capital costs, and concerns
about long-term radioactive waste disposal may deter its rapid growth in the short term.
According to sensitivity analyses, when both production and investment tax credits are
available, the levelized COE for wind technology using NGCC with capture for backup
power becomes less than or equal to that of most other coal technologies. Also, as power
generation via wind technology creates far less CO2 emissions than with regular fossil fuel
93
technologies, the levelized COE produced by on-shore wind (with NGCC plus capture as
backup) becomes even less than that of other fossil fuel technologies as a higher cost of CO2
is introduced. Therefore, if a cost of CO2 is introduced in the market, wind-NGCC with
capture technology as a power generation source will become increasingly cost competitive
since it emits less CO2. Of course, while these tax credits to electricity producers reduce the
out of pocket cost of electricity to consumers, those same consumers are the taxpayers who
will pay for the tax credits.
Legal
A legal framework including a time frame for financial responsibility of site injection is
necessary to implement CCS technologies. Currently, underground injection is regulated by
the SWDA, through the UIC program. Only five classes of injection substances exist,
therefore in July 2008, the U.S. EPA proposed “Federal Requirements under the
Underground Injection Control (UIC) Program for Carbon Dioxide (CO2) Geologic
Sequestration (GS) Wells Proposed Rule.” This rule would add a sixth class, specifically
addressing CO2 storage. The primary purpose of the proposed rule is the protection of
underground source drinking water, including the proper plugging and monitoring of all
onsite wells. In ensuring the protection of USDW, it will also prevent other potentially
negative human health and environmental consequences. Moreover, a CCS legal framework
should include surface and subsurface property rights and liability laws regulated by the
federal government. It is important to future CCS programs that this proposed rule is passed
in order to provide the necessary legal framework.
Public Perception
A CCS public outreach program should keep the public and local community informed about
their actions and intentions. This type of transparency would encourage facilities to maintain
integrity of operation, possibly leading to greater community acceptance. This may be
established through distributions of educational materials at the community level. In
addition, facilities should be required to record actions on a website delineating all aspects of
its CCS program. It is advisable for utilities to assign a point person to field questions and
concerns from community members. Community meetings would also improve
communications between a utility and local residents on an individualized basis. These and
other community relations tactics are advisable.
94
References Cited
Adamec, C. et al. (2009). The Future of Electricity: Electricity Today, Drivers of Change,
and Electricity Tomorrow. Unpublished capstone report, Indiana University School of
Public and Environmental Affairs Capstone Course, Bloomington, IN.
Adams, E.E. and Caldeira, K. (2008). Ocean storage of CO2. Elements, 4, 319-24.
American Wind Energy Association (AWEA). (2009). 20% Wind Energy by 2030: Wind,
BackupPower, and Emissions. Retrieved April 10, 2010, from
http://www.awea.org/pubs/factsheets/Backup_Power.pdf
Anderson, S. and Newell, R. (2004). Prospects for carbon capture and storage technologies.
Annual Review of Environmental Resources, 29, 109-42.
Applebome, P. (2009, October 18). In Fighting Coal Plant, A Dilemma. New York Times.
Retrieved April 10, 2010, from
http://www.nytimes.com/2009/10/19/nyregion/19towns.html
Asia-Pacific Partnership on Clean Devlopment and Climate Change. (2008). U.S.
Government Actions in Support of the Asia-Pacific Partnership on Clean
Development and Climate: 2008 Annual Report. Retrieved February 26, 2010, from
http://www.app.gov/library/111305.htm
The Atlantic Council and the Clingendael International Energy Program. (2009). A Shared
Vision for Energy and Climate Change: Establishing a Common Transatlantic
Agenda. Brussels: Atlantic Council.
Bachu, S. (2008). CO2 Storage in Geological Media: Role, Means, Status, and Barriers to
Deployment. Progress in Energy and Combustion Science, 34 (2), 254-73.
Baer, P. (2003). An issue of scenarios: Carbon sequestration as investment and the
distribution of risk. Climatic Change, 59 (3), 283-91.
Baker, E. et al. (2009). Carbon Capture and Storage: Combining Economic Analysis with
Expert Elicitations to Inform Climate Policy. Climate Change, 96, 379-408.
BBC News Staff. (2009, September 23). UN climate summit: Key quotes. Retrieved
December 14, 2009, from http://news.bbc.co.uk/2/hi/science/nature/8269361.stm
Bellona Foundation. (2007). Fact Sheet - CO2 Capture. Retrieved February 21, 2010, from
http://www.bellona.org/ccs/Artikler/fact_sheets_co2_co2
95
Benson, S.M., Hoversten, M., Gasperikova, E., and Haines, M. (2004). Monitoring Protocols
and Life-Cycle Costs for Geologic Storage of Carbon Dioxide. Proceedings of the the
7th
International Conference of Greenhouse Gas Control Technologies (GHGT-7).
Retrieved February 23, 2010, from
http://uregina.ca/ghgt7/PDF/papers/nonpeer/410.pdf
Bielicki, J. and Stephens, J. (2008). Public Perception of Carbon Capture and Storage
Technology Workshop. Retrieved February 28, 2010, from
http://belfercenter.ksg.harvard.edu/publication/18595/public_perception_of_carbon_c
apture_and_storage_technology_workshop.html
Biello, D. (2008, February 6) "Clean" Coal Power Plant Canceled--Hydrogen Economy, Too.
Scientific American. Retrieved February 15, 2010, from
http://www.scientificamerican.com/article.cfm?id=clean-coal-power-plant-canceled-
hydrogen-economy-too
Bosselman, et. al. (2009). Energy, Economics and the Environment (2nd
Ed.). New York:
Foundation Press.
Brahic, C. (2006, November 10). Carbon emissions rising faster than ever. NewScientist.
Retrieved April 8, 2010, from http://www.newscientist.com/article/dn10507-carbon-
emissions-rising-faster-than-ever.html
British Geological Survey. (2010). CO2 Storage - Sleipner Field beneath the North Sea.
Retrieved February 24, 2010, from http://www.bgs.ac.uk/science/co2/home.html
Bucksbaum, L. (2008). The future of FutureGen: coal generation study faces challenges.
EnergyBiz, March/April 2008. Retrieved February 15, 2010, from
http://energycentral.fileburst.com/EnergyBizOnline/2008-2-mar-
apr/Tech_Front_FutureGen.pdf
Caldeira, K. (2003). Monitoring of ocean storage projects. Proceedings of the IPCC
Workshop on Carbon Capture and Storage, November 18-21, 2002. (pp. 153-60).
Regina, Canada: Energy Research Centre of the Netherlands. Retrieved April 2, 2010,
from http//www.climatepolicy.info/ipcc/ipcc-ccs-2002/index.html.
California Air Resources Board. (2010). Cap and Trade – Background. Retrieved February
20, 2010, from http://www.arb.ca.gov/cc/capandtrade/capandtrade.htm
Carbon Sequestration Leadership Forum. (2008). About the CSLF. Retrieved February 13,
2010, from http://www.cslforum.org/aboutus/index.html?cid=nav_about
Carbon Sequestration Leadership Forum. (2009). Carbon Sequestration Leadership Forum
Technology Roadmap. Retrieved February 13, 2010, from
http://www.cslforum.org/publications/index.html?cid=nav_publications
96
Carbon Sequestration Leadership Forum. (2010). The Carbon Sequestration Leadership
Forum. Retrieved February 10, 2010, from
http://www.cslforum.org/index.html?cid=nav_index
CCSReg Project. (2008). Policy Brief: Learning and Adaptation in Regulation of Geologic
Sequestration. Retrieved March 10, 2010, from
www.ccsreg.org/pdf/LearningAdaptation_08282009.pdf
CDM Executive Board. (2009). Clean Development Mechanism 2009 Annual Report. Bonn,
Germany: United Nations Framework Convention on Climate Change.
The Center for American Progress. (2009). A Roadmap for U.S.-China Collaboration on
Carbon Capture and Sequestration. Retrieved March 3, 2010, from
http://www.americanprogress.org/issues/2009/11/china_ccs_factsheet.html
Ciferno, J. P. (2007, May). Carbon Dioxide Capture from Existing Pulverized Coal Power
Plants. Sixth Annual Conference on Carbon Capture and Sequestration, Pittsburg,
PA.
Ciferno, J. P. (2008, July). Meeting Proposed California GHG Emissions [NETL Lecture].
Ciferno, J. P. et al. (2009). Capturing Carbon from Existing Coal-Fired Power Plants.
Chemical Engineering Progress, 105(4), 33.
Ciferno, J. P. (2010, February 18). The U.S. Department of Energy’s CO2 Capture R & D
Program. Lecture presented in Chemistry C033. Indiana University, Bloomington,
IN.
CLEAN. (n.d.). The Duke Energy bailout. Retrieved April 24, 2010, from
http://web.theclean.org/edwardsport.html
Climate-L. (2009). E.U.-U.S. Summit Dominated by Climate Change. Retrieved March 25,
2010, from http://climate-l.org/2009/11/04/eu-us-summit-dominated-by-climate-
change/
The COACH project. (n.d.). The COACH project. Retrieved April 13, 2010, from
http://www.co2-coach.com/
Congressional Research Service. (2009). Energy Provisions in the American Recovery and
Reinvestment Act of 2009 (P.L. 111-5). Retrieved February 18, 2010, from
http://www.state.mn.us/mn/externalDocs/Commerce/Energy_Provisions_of_the_AR
RA_031909101106_EnergyProvisionsOfARRA.pdf
Cooper, M. (2009). A Consumer Analysis of Energy Efficiency and Renewable Energy
Standards: The Cornerstone of Consumer-Friendly Energy/Environmental Policy
[Consumer Federation of America Report]. Retrieved April 5, 2010, from
http://www.consumerfed.org/elements/www.consumerfed.org/file/CFA-EERS-
97
RESReport5-25.pdf
Cowart, R., Vale, S., Bushinsky, J., and Hogan, P. (2008). State Options for Low-Carbon
Coal Policy. Coal Initiative Reports [White Paper Series]. Retrieved February 13,
2010, from http://www.pewclimate.org/docUploads/StateOptions-02-20-08.pdf
Curry, T., Reiner, D. M., Ansolabehere, S. and Herzog, H. J. (2004). How Aware is the
Public of Carbon Capture and Storage? Retrieved February 3, 2010, from
http://knowledge.fhwa.dot.gov/cops/italladdsup.nsf/7ec05a279f17ed79852569590071
284c/f8c06c26809445cf85256fce0066add6/$FILE/Greenhouse%20gas%20public%2
0awareness%20survey.pdf
Curry, T., Reiner, D. M., Ansolabehere, S. and Herzog, H. J. (2007). A Survey of Public
Attitudes Towards Climate Change and Climate Mitigation Technologies in the
United States: Analysis of 2006 Results. Retrieved April 6, 2010, from
http://sequestration.mit.edu/research/survey2006.html#info
Damen, K., Faaij, A., and Turkenburg, W. (2006). Health, Safety and Environmental Risks
of Underground CO2 Storage- Overview of Mechanisms and Current Knowledge.
Climatic Change, 74, 289-318.
Database of State Incentives for Renewables and Efficiency (DSIRE), North Carolina
University Solar Center. (2009). Renewable Electricity Production Tax Credit (PTC).
Retrieved April 25, 2010, from http://www.dsireusa.org/incentives/incentive.cfm?
Incentive_Code=US13FandState=Federal%25C2%25A4tpageid=1
David, J., and Herzog, H. J. (2000). The Cost of Carbon Capture. Fifth International
Conference on Greenhouse Gas Control Technologies. Cairns, Australia.
DiPietro, P. (2009). Water Requirements for Existing and Emerging Thermoelectric Plant
Technologies (Report No. DOE/NETL-402/080108). Retrieved March 20, 2010, from
www.netl.doe.gov/energy-analyses/pubs/WaterRequirements.pdf
Dooley, J.J., et al. (2004). A CO2-Storage Supply Curve for North America and its
Implications for the Deployment of Carbon Dioxide Capture and Storage Systems.
Retrieved March 5, 2010, from http://uregina.ca/ghgt7/PDF/ papers/ peer/282.pdf
Drage, T.C., Arenillas, A., Smith, K., and Snape, C.E. (2010). Comparison of Pre and Post-
Combustion CO2 Absorbent Technology. Retrieved February 11, 2010, from
www.geos.ed.ac.uk/ccs/Publications/Drage.pdf
Duke Energy. (2010). Edwardsport Integrated Gasification Combined Cycle Project
Overview. Retrieved March 15, 2010, from http://www.duke-energy.com/about-
us/edwardsport-overview.asp.
98
Electric Power Research Institute (EPRI). (2007, March 27). Updated Cost and Performance
Estimates for Clean Coal Technologies including CO2 Capture - 2006. Retrieved
February 11, 2010, from http://my.epri.com/portal/server.pt?space=Community
Pageandcached=trueandparentname=ObjMgrandparentid=2andcontrol=SetCommunit
yandCommunityID=404andRaiseDocID=000000000001013355andRaiseDocType=A
bstract_id
Electricity Without Carbon. (2008, August, 14). Nature, 454.
Elliott, D. et al. (2001). Wind energy resource atlas of Mongolia. National Renewable
Energy Laboratory, US Department of Energy. Retrieved April 14, 2010, from
http://nrel.gov/wind/pdfs/32781.pdf
Energy and Commerce Committee. (2009). ACESA 2009 Discussion Draft Summary.
Retrieved February 13, 2010, from http://energycommerce.house.gov/
index.php?option=com_contentandtask=viewandid=1560andItemid=1
Environment Northeast. (2008). Environment Northeast – Projects. Retrieved February 20,
2010, from http://www.env-ne.org/projects/open/p/id/331/program/
Climate%20Change%20Solutions
European Commission. (2009). 2009 EU-U.S. Summit Declaration. Retrieved February 20,
2010, from ec.europa.eu/external_relations/us/sum11_09/ docs/declaration_en.pdf
European Commission. (2010a). CCS in Europe. Retrieved February 4, 2010, from
http://ec.europa.eu/environment/climat/ccs/work_en.htm
European Commission. (2010b). Environment: China. Retrieved February 4, 2010, from
http://ec.europa.eu/environment/climat/china.htm
Factuality Tour. (2009, May 20). Building the Cleanest Coal Plant in the World [Video file].
Retrieved March 12, 2010, from
http://www.youtube.com/watch?v=1eqEcRXXosYandfeature=related
Fauth, D., Goldberg, P., Knoer, J., and Soong, Y. (2000). Carbon dioxide storage as mineral
carbonates. Retrieved February 28, 2010, from http://www.anl.gov/PCS/
acsfuel/preprint%20archive/Files/45_4_WASHINGTON%20DC_08-00_0708.pdf
Federal Register. (2008). Federal Requirments Under the UIC for Carbon Dioxide Geologic
Sequestration Wells, Proposed Rule. Fedeal Register, 73 (144), 43492 -541.
Feeley, T. (2004). Responding to Emerging Power Plant-Water Issues U.S. DOE/NETL’s R
& D Program [PowerPoint slides]. Retrieved April 2, 2010, from
http://www.netl.doe.gov/technologies/coalpower/ewr/pubs/3rd%20Annual%20
V%20Water%20Conf.pdf
99
Figueiredo, M. A. (2005). Property Interests and Liability of Geologic Carbon Dioxide
Storage. Massachusetts Institute of Technology, Laboratory for Energy and the
Environment. Cambridge: MIT.
Figueiredo, M. A., Reiner, D. M., and Herzog, H. J. (2005). Framing the Long-Term In Situ
Liability Issue for Geologic Carbon Storage in the United States. Mitigation and
Adaptation Strategies for Global Change, 10, 647-57. Retrieved February 20, 2010,
from http://sequestration.mit.edu/pdf/ Framing_the_Long-Term_ Liability_Issue.pdf
Figueiredo, M. A. (2007a). Liability of Carbon Dioxide Storage. Retrieved March 5, 2010,
from http://citeseerx.ist.psu.edu/viewdoc/download?doi=10.1.1.84.367
andrep=rep1andtype=pdf
Figueiredo, et al. (2007b). Regulating Carbon Dioxide capture and Storage [Working Paper
0703]. MIT, Center for Energy and Environmental Research. Retrieved March 7,
2010, from http://tisiphone.mit.edu/RePEc/mee/wpaper/2007-003.pdf
Figueroa, J. D., Fout, T., Plasynski, S., McIlvried, H., and Srivastava, R. D. (2008).
Advances in CO2 capture technology - The U.S. Department of Energy's Carbon
Sequestration Program. International Journal of Greenhouse Gas Control, 2 (1), 9-
20.
Fischedick, M., Pietzner, K., Supersberger N., Esken, A., Kuckshinrichs, W., Idrissova, F.
(2009). Stakeholder Acceptance of Carbon Capture and Storage in Germany. Energy
Procedia, 1(1), 4783-87.
Folger, P. (2009). Carbon Capture and Sequestration (CCS) (RL33801). Congressional
Research Service. Retrieved February 1, 2010, from
http://handle.dtic.mil/100.2/ADA502774
Forbes, S. (2009). Carbon Dioxide Capture and Storage and the American Clean Energy and
Security Act of 2009. Retrieved February 13, 2010, from
http://www.wri.org/stories/2009/04/carbon-dioxide-capture-and-storage-and-
american-clean-energy-and-security-act-2009
FutureGen Alliance. (2009). Durbin and Illinois delegation members: FutureGen alliance
board approves agreement. Retrieved February 15, 2010, from
http://www.futuregenalliance.org/news/durbin_06-12-09.stm
Gale, J. (2009). IEA Greenhouse Gas R & D Programme : a summary of current activities
[PowerPoint slides]. Retrieved March 2, 2010, from http://www.ieaghg.org/index.
php?/iea-ghg-presentations.html
Gallagher, K. S. (2009). Key Opportunities for U.S-China Cooperation on Coal and CCS
[Paper, Brookings Institution]. Retrieved February 28, 2010, from
100
http://belfercenter.ksg.harvard.edu/publication/19921/key_opportunities_for_uschina
_cooperation_on_coal_and_ccs.html
Gaus, I., Azaroual, M., and Czernichowski-Lauriol, I. (2005). Reactive transport modelling
of the impact of CO2 injection on the clayey cap rock at Sleipner (North Sea).
Chemical Geology , 217 (3-4), 319-37.
Gerdemann, S., Dahlin, D., and O‟Connor, W. A. (2003). Carbon Dioxide Sequestration by
Aqueous Mineral Carbonation of Magnisium Silicate Minerals (Report No.
DOE/ARC-2003-018). Retrieved February 18, 2010, from
http://www.osti.gov/bridge/purl.cover.
jsp;jsessionid=06038C4C499B2EDC96B034BC344CDEE7?purl=/898299-wXwUr6/
Gerdemann, S., O'Connor, W., Dahlin, D., Penner, L., and Rush, H. (2007). Ex situ aqueous
mineral carbonation. Environmental Science Technology , 41, 2587-93.
Gerrard, M. B. (2008). Carbon Capture, Sequestration Raises Myriad Legal Issues. New York
Law Journal, 239 (100).
Gielen, D. (2003). The Future Role of CO2 Capture and Storage Results of the IEA-ETP
Model (Report No. EET/2003/04). Retrieved March 5, 2010, from
www.iea.org/papers/2003/eet04.pdf
Global CCS Institute. (2009). About the Global CCS Institute. Retrieved Feburuary 16, 2010,
from http://www.globalccsinstitute.com/
Goldstein, J. (2007, April 9). Governor Richardson Enacts Major Clean Energy Bills [Press
Release]. Retrieved February 18, 2010, from
www.governor.state.nm.us/press/2007/april/040907_02.pdf
Gray, M.L. et al. (2005). Improved Immobilized Carbon Dioxide Capture Sorbents. Fuel
Processing Technology, 86, 1449-55.
Green Jersey. (2009, October 21). Linden Council votes down plan for PurGen Plant.
Retrieved April 3, 2010, from http://greenjersey.org/2009/10/21/linden-council-
votes-down-plan-for-purgen-coal-plant/
Greenblatt, et al. (2007). Baseload wind energy: modeling the competition between gas
turbines and compressed air energy storage for supplemental generation. Energy
Policy, 35, 1474- 92.
Groothuis, P. A. and Miller, G. (1994, July). Locating Hazardous Waste Facilities: The
Influences of NIMBY Beliefs. American Journal of Economics and Society, 53 (3).
Retrieved April 3, 2010, from http://www.jstor.org/stable/3487298
101
Ha-Duong, M., Nadai, A., Campos, A. S. (2009). A Survey on the Public Perception of CCS
in France. Energy Procedia, 1 (1), 4757-64.
Harris, J. (2006). Environmental and Natural Resource Economics. Boston: Houghton
Mifflin.
Haefeli, S., Bosi, M., and Philibert, C. (2004). Carbon Dioxide Capture and Storage Issues
Accounting and Baselines Under the United Nations Framework Convention on
Climate Change (UNFCCC). Paris: International Energy Agency.
Hamilton, T. (2007, April 23). Cleantech Mindset Gaining Traction. The Toronto Star.
Retrieved February 8, 2010, from http://www.thestar.com/printArticle/206008
Hawkins, D. and Peridas, G. (2007). No Time Like the Present: NRDC’s Response to MIT’s
‘Future of Coal’ Report [NRDC Brief]. Retrieved March 15, 2010, from
www.nrdc.org/globalWarming/coal/mit.pdf
Heddle, G., Herzog, H., and Klett, M. (2003). The Economics of CO2 Storage (Report No.
LFEE 2003-003 RP). Retrieved February 20, 2010, from
sequestration.mit.edu/pdf/LFEE_2003-003_RP.pdf
Heinrich, J. (2003). Managing Environmental and Human Safety Risks Associated with
Geological Storage of CO2 (Thesis, Massachusetts Institute of Technology,
Engineering Systems Division, 2002). Retrieved March 25, 2010, from
sequestration.mit.edu/pdf/JasonHeinrich_Thesis_2003.pdf
Herzog, H. J., Drake, E., and Adams, E. (1997). CO2 Capture, Reuse, and Storage:
Technologies for Mitigating Global Climate Change [White Paper]. Cambridge, MA:
Massachusetts Institute of Technology Energy Laboratory.
Herzog, H. (2001, April 1). What Future for Carbon Capture and Sequestration?
Environmental Science and Technology, 35 (7), 148A-153A.
Herzog, H., Caldeira, K. and Adams, E. (2001). Carbon sequestration via direct injection. In
Steele, J. H., Thorpe, S. A., and Turekian K. K. (Ed.), Encyclopedia of Ocean
Sciences, 1, 408-14.
Herzog, H. (2002). Carbon Sequestration via Mineral Carbonation: Overview and
Assessment [Report]. Retrieved March 10, 2010 from
http://sequestration.mit.edu/pdf/carbonates.pdf
Herzog, H., Caldeira, K., and Reilly, J. (2003). An issue of permanence: assessing the
effectiveness of temporary carbon storage. Climatic Change, 59, 293–310.
Herzog, H., and Golomb, D. (2004). Carbon capture and storage from fossil fuel use. In C.J.
Cleveland (Ed.), Encyclopedia of Energy, 277-87.
102
Hoffman, J., Forbes, S., and Feeley, T. (2004). Estimating Freshwater Needs to Meet 2025
Electricity Generating Capacity Forecasts. Washington, DC: U.S. Government
Printing Office.
House, K. Z., Schrag, D. P., Harvey, C. F., Lackner, K. S. (2006, August 15). Carbon
Dioxide Storage in Deep-Sea Sediments. Proceedings of the National Academy of
Sciences of the United States of America. Retrieved March 3, 2010, from
http://www.ncbi.nlm.nih.gov/pmc/articles/PMC1567873/.
Huijts, N., Midden, C., and Meijnders, A. (2007). Social acceptance of carbon dioxide
storage. Energy policy, 35, 2780-89.
Hunter, S. and Leyden, K. M. (1995, December 22). Beyond NIMBY: Explaining Opposition
to Hazardous Waste Facilities. Policy Studies Journal. Retrieved April 3, 2010, from
http://www.highbeam.com/doc/1G1-18334307.html
Institutional Investors Group on Climate Change (IIGCC). (2009). Toward An Effective
Global Carbon Market. Retrieved April 3, 2010, from
http://www.iigcc.org/docs/PDF/Public/IIGCCCarbonMarkets.pdf
Intergovernmental Panel on Climate Change (IPCC). (2005). IPCC Special Report on
Carbon Dioxide Capture and Storage. United Kingdom: Cambridge University Press.
Retrieved February 10, 2010, from
http://www.ipcc.ch/publications_and_data/publications_and_data_reports_carbon_dio
xide.htm
International Energy Agency (IEA). (2005). Legal Aspects of Storing CO2. Retrieved
February
10, 2010, from https://www.iea.org/publications/free_new_Desc.asp?
PUBS_ID=1928
International Energy Agency (IEA). (2006). IEA Energy Technology Essentials: CO2
Capture and Storage. Retrieved February 12, 2010, from
https://www.iea.org/techno/essentials1.pdf
International Energy Agency (IEA). (2009a). IEA CCS Roadmap-Brazil CCS Roundtable
Summary. Retrieved February 8, 2010, from
http://www.iea.org/subjectqueries/ccs/Brazil_Summary.pdf
International Energy Agency (IEA). (2009b). Indonesian CCS Roundtable Summary.
Retrieved February 9, 2010, from
http://www.iea.org/subjectqueries/ccs/Indonesia_Summary.pdf
International Energy Agency (IEA). (2009c). South African CCS Roundtable Summary.
Retrieved February 9, 2010, from
http://www.iea.org/subjectqueries/ccs/South_Africa_Summary.pdf
103
International Energy Agency (IEA). (2009d). Technology Roadmap: Carbon Capture and
Storage. Retrieved February 10, 2010, from
www.iea.org/papers/2009/CCS_Roadmap.pdf
International Energy Agency (IEA). (2010a). About the IEA. Retrieved February 13, 2010,
from
http://www.iea.org/about/index.asp
International Energy Agency (IEA). (2010b). Aims and Objective of GHG Program.
Retrieved Feburuary 20, 2010, from
http://www.ieaghg.org/index.php?/2009120353/aims-and-objectives.html
Ishimatsu, A., Kojima, Y., and Hayashi, M. (2008). Effects of CO2 ocean sequestration on
deep-sea animals. Oceans, 1-4. Retrieved April 1, 2010, from
http://hdl.handle.net/10069/20068.
Itaoka, K., Okuda, Y., Saito, A., and Akai, M. (2009). Influential information and factors for
social acceptance of CCS: The 2nd round survey of public opinion in Japan. Energy
Procedia, 1 (1), 4803-10.
Kapp, R. J. (2004). Rethinking Fossil Fuels. Resources, 154, Summer.
Kelly, H. and Weinberg, C.J. (1993). Utility strategies for using renewables. In Johansson, et
al., Renewable energy: Sources for fuels and electricity, 1011-69. Washington D.C.:
Island Press.
Kerr, T., and Beck, B. (2009). Technology Roadmap-Carbon capture and storage. Paris: IEA
Energy Technology Policy Division.
Kerry, J. (2009, September 30). Clean Energy Jobs and American Power Act. Retrieved
March 5, 2010, from http://kerry.senate.gov/cleanenergyjobsandamericanpower
/pdf/SectionbySectionSummary.pdf
Kinder Morgan CO2 Company. (2007). Canyon Reef Carriers Pipeline (CRC). Retrieved
March 10, 2010, from
http://www.kindermorgan.com/business/co2/transport_canyon_reef.cfm
KTH Research Project Database. (2010). KTH research project database. Retrieved March
20, 2010, from http://researchprojects.kth.se/index.php/kb_1/io_9837/io.html
Kuuskraa, V. A. (2007). Coal Initiative Reports: A Program to Accelerate the
Deployment of CO2 Capture and Storage (CCS): Rationale, Objectives, and Costs.
Arlington, VA: The Pew Center on Global Climate Change.
104
Larsen, J. et al. (2009). WRI Summary of the Clean Energy Jobs and American Power Act
(Kerry-Boxer). Retrieved February 13, 2010, from
http://www.wri.org/stories/2009/10/wri-summary-clean-energy-jobs-and-american-
power-act-kerry-boxer
Larson, A. (2007). Eminent Domain. Retrieved February 14, 2010, from Expert Law:
http://www.expertlaw.com/library/real_estate/eminent_domain.html
Lazard, Ltd. (2008). Levelized Cost of Energy Analysis – Version 2.0. New York: Lazard,
Ltd.
Lectric Law Library. (2010). Definition of Liability. Retrieved March 1, 2010, from the
Lectric Law Library Lexicon: http://www.lectlaw.com/def/l031.htm
Logan, J. and Kaplan, S. M. (2008). CRS Report for Congress: Wind Power in the United
States: Technology, Economic, and Policy Issues. Congressional Research Service.
Mack,et al. (2009). Making Carbon Sequestration Feasible: Toward Federal Regulation of
CO2 sequestration Pipelines. Energy Policy , 735-43.
Malone, E. L., Bradbury, J. A., and Dooley, J. J. (2009, February). Keeping CCS Stakeholder
Involvement in Perspective. Energy Procedia, 1 (1), 4789-94.
Management Information Services (MIS), Inc. (2008). Analysis of Federal Expenditures for
Energy Development. Washington, D.C.: MIS.
Massachusetts Institute of Technology (MIT). (2007). The Future of Coal. Retrieved
February 1, 2010, from http://web.mit.edu/coal/
Massachusetts Institute of Technology (MIT). (2009, March 23). Retrofitting of Coal-Fired
Power Plants for CO2 Emissions Reductions [MIT Energy Initiative Symposium].
Retrieved April 22, 2010, from http://web.mit.edu/mitei/docs/reports/coal-paper.pdf
Metcalf, G. E. (2007). Federal Tax Policy Towards Energy. Tax Policy and the Economy, 21,
145-84.
Metz,B., Davidson, O., de Coninck, H., Loos, M., and Meyer, L. (Eds.). (2005). Carbon
Dioxide
Capture and Storage. IPCC. United Kingdom: Cambridge University Press.
Midwestern Greenhouse Gas Reduction Advisory Group. (2009). Advisory Group Draft -
Final Recommendations. Midwestern Greenhouse Gas Reduction Accord. Retrieved
February 20, 2010, from http://www.midwesternaccord.org/index.html
Michaelowa, A., and O'Brien, J. (2006). Domestic UNFCCC Kyoto Protocol Mechanisms
Project. Hamburg, Germany: Springer.
105
Minnesota Office of the Revisor of Statutes. 2009 Minnesota Statutes. Retrieved February
17, 2010, from https://www.revisor.mn.gov/statutes/?id=216B.1694
Moriarty, P., and Honnery, D. (2010). A human needs approach to reducing atmospheric
carbon. Energy Policy, 38, 695-700.
Myhre, R. J. and Stone, M. (2009, September/October). Opportunities for Carbon Capture
and Geologic Storage. Southwest Hydrology. Retrieved February 10, 2010, from
http://www.swhydro.arizona.edu/archive/V8_N5/feature1.pdf
National Research Council. (2008). The National Academies Summit on America's Energy
Future: Summary of a Meeting. Washington, D.C.: National Academies Press.
Norman, D. A. (2007). Feasibility of Using Geologic Formations to Sequester Carbon
Dioxide (CO2) [White Paper]. U.S. Department of Natural Resources. Retrieved
February 20, 2010 from
www.ecy.wa.gov/climatechange/.../co2sequestrationfinal_082807.pdf
Nugent, W. (2001, May 15). Impediments to the siting of energy infrastructure. U.S. Senate
Committee on Energy and Natural Resources. Retrieved April 6, 2010, from
http://energy.senate.gov/public/index.cfm?FuseAction=Hearings.TestimonyandHeari
ng_ID=625232a0-ab4b-47e5-b40b-438732ebf156andWitness_ID=4da958c4-286e-
4d0d-b6ab-d50c10be9589
O‟Connor, W., Dahlin, D., Turner, P. A., Walters, R. (1999). Carbon Dioxide Sequestration
byEx-Situ Mineral Carbonation. Retrieved March 5, 2010, from
www.osti.gov/bridge/ servlets/purl/875354-0nNl2Q/875354.PDF
Odeh, N., and Haydock, H. (2009). International CCS Policies and Regulations (Report No.
WP5.1a/WP5.4). Retrieved February 4, 2010, from
http://www.nzec.info/en/assets/Reports/International-Policies-Regulations-
English.pdf
Oelkers, E., Gislason, S., and Matter, J. (2008). Mineral carbonation of CO2. Elements , 4,
333-37.
Office for the London Convention and Protocol. (2007, February 9). New Internatonal rules
to allow storage of CO2 under seabed. Retrieved April 13, 2010, from
http://www.imo.org/home.asp?topic_id=1488
Olson, K. (2009). Duke Energy Edwardsport Plant: CAC Op-Ed. Retrieved February 30,
2010, from http://www.citact.org/newsite/modules.php?op=modloadandname=
Newsandfile=articleandsid=870.
106
Orr, J. C. (2004). Modeling of ocean storage of CO2—The GOSAC Study (Report No.
PH4/37). Retrieved March 30, 2010, from
http://www.ipsl.jussieu.fr/~jomce/pubs/PH4-37%20Ocean%20Storage%20-
%20GOSAC.pdf.
Pagnier, H. (2007). Public Perception of CCS- International Studies and Case Study
[PowerPoint slides]. Retrieved from March 5, 2010, from
http://www.cenitco2.es/publicaciones/i18nfolder.2007-08-
09.7112763370/Henk%20Pagnier.pdf
Parfomak, P. W. (2008, July 29). Community Acceptance of Carbon Capture and
Sequestration Infrastructure: Siting Challenges. Congressional Research Service.
Retrieved February 3, 2010, from
http://assets.opencrs.com/rpts/RL34601_20080729.pdf
Parker, N. (2004). Using Natural Gas Transmission Pipeline Costs to Estimate Hydrogen
Pipeline Costs (UCD-ITS-RR-04-35). Inst. of Transportation Studies, University of
California, Davis. Retrieved March 5, 2010, from
http://pubs.its.ucdavis.edu/publication_detail.php?id=197
Parsons, B. et al. (2006). Grid Impacts of Wind Power Variability: Recent Assessments from
a Variety of Utilities in the United States [Conference paper NREL/CP-500-3995
European Wind Energy Conference. Reston, Virginia: Utility Wind Integration
Group.
Pehnt, M. and Henkel, J. (2009). Life cycle assessment of carbon dioxide capture and storage
from lignite power plants. International Journal of Greenhouse Gas Control, 3, 49-
66.
Peng, S. (2009). China's Policies and Actions on Carbon Capture and Storage (CCS).
Retrieved April 14, 2010, from
http://ec.europa.eu/environment/climat/pdf/china/China%20Policies%20and%20Acti
ons%20on%20CCS.pdf
Percival, et al. (2009). Environmental Regulation: Law, Science and Policy (6th
ed.). New
York: Aspen Publishers.
Pershing, J. (2010, February 18). Climate Change [Webchat]. Retrieved March 5, 2010, from
http://usembassymalaysia.org.my/lincoln/webchat_pershing-021810.pdf
Pew Center on Global Climate Change. (2006). Carbon Capture and Storage (CCS).
Retrieved February 2, 2010, from http://www.pewclimate.org/docUploads/CCS-Fact-
Sheet1_0.pdf
107
Pew Center on Global Climate Change. (2009). Emissions Caps for Electricity. Retrieved
February 18, 2010, from
http://www.pewclimate.org/what_s_being_done/in_the_states/cap_and_offset_map.c
fm
Philibert, C., Ellis, J., and Podkanski, J. (2007). Carbon Capture and Storage in the CDM
[Report No. COM/ENV/EPOC/IEA/SLT(2007)10]. Retrieved February 10, 2010,
from http://www.iea.org/papers/2007/CCS_in_CDM.pdf
Pizer, W. (2001). Choosing Price or Quantity Controls for Greenhouse Gases. In M. Toman
(Ed.), Climate Change Economics and Policy – An RFF Anthology. Washington,
D.C.: Resources for the Future.
Portney, P. R. (2003, Summer). Market-Based Approaches to Environmental Policy: A
"Refresher" Course. Resources, 151.
Prigiobbe, V., Haenchen, M., Werner, M., Baciocchi, R., and Mazzotti, M. (2009). Mineral
carbonation process for CO2 sequestration. Energy Procedia, 1, 4885-90.
Ramezan, M. et al. (2007). Carbon Dioxide Capture from Existing Coal-fired Power Plants
(Report No. DOE/NETL-401/110907). Retrieved February 12, 2010,
frohttp://www.netl.doe.gov/energy-
analyses/pubs/CO2%20Retrofit%20From%20Existing%20Plants%20Revised%20
Novem ber%202007.pdf
Reiner, D. M. et al. (2006). An International Comparison of Public Attitudes towards Carbon
Capture and Storage Technologies, Presented at the 8th International Conference on
Greenhouse Gas Control Technologies. Trondheim, Norway. Retrieved February 10,
2010, from http://sequestration.mit.edu/pdf/GHGT8_Reiner.pdf
Reiner, D. and Nuttal, W. (2009). Public and Social Acceptability of Geological Disposal of
Carbon Dioxide and Radioactive Waste: Similarities and Differences [Working paper
0918]. Retrieved April 6, 2010 from http://www.eprg.group.cam.ac.uk/wp
content/uploads/2009/07/binder11.pdf
Regional Greenhouse Gas Initiative (RGGI). (2010). Regional Greenhouse Gas Initiative
(RGGI) CO2 Budget Trading Program. Retrieved February 18, 2010, from
http://www.rggi.org/about
Robertson, K. et al. (2006, June 23). International Carbon Capture and Storage Projects
Overcoming Legal Barriers (Report No. DOE/NETL-2006/1236). Retrieved March
10, 2010, from http://www.netl.doe.gov/energy-
analyses/pubs/CCSregulatorypaperFinalReport.pdf
Rochelle, G. et al. (2009). Amine Scrubbing for CO2 Capture. Science, 325, 1652.
108
Rupp, J. A. (2010a, March 3). The Role of Geological Sequestration in the Midwest –
Assessing the Successes and Challenges. Lecture presented in SPEA PV 276. Indiana
University, Bloomington, IN.
Rupp, J. A. (Personal communication, April 30, 2010b).
Shackley, S., McLachlan, C., Gough, C. (2005). The Public Perception of Carbon Dioxide
Capture and Storage in the UK: Results from Focus Groups and A Survey. Climate
Policy 2005, 4, 377-98.
Shackley, S., Waterman, H., Godfroij, P., Reiner, D., Anderson, J., Sigurthorsson, G. (2007).
The ACCSEPT Project: Stakeholder Perceptions of CO2 Capture and Storage in
Europe. Retrieved February 26, 2010, from
http://www.accsept.org/outputs/executive_and_technical_summaries.pdf
Shao, R., and Stangeland, A. (2009). Amines Used in CO2 Capture- Health and
Environmental Impacts [Report, The Bellona Foundation]. Retrieved March 1, 2010,
from www.bellona.org/.../fil_Bellona_report_September__2009_-
_Amines_used_in_CO2_capture.pdf
Shirayama, Y. (1997). Biodiversity and biological impact of ocean disposal of carbon
dioxide. Waste Management , 17, 381-84.
Shirayama Y. and Thorton H. (2005). Effect of increased atmospheric CO2 on shallow water
marine benthos. Journal of Geophysical Research, 110, 1-7.
Simpson, C., and Hausauer, B. (2009). Emissions Performance Standards in Selected States
[Research Brief]. Retrieved February 17, 2010, from
http://www.raponline.org/docs/RAP_Simpson_EPSResearchBrief_2009_11_13.pdf
Sissine, F. (2007). Summary of Major Provisions of Energy Independence and Security Act of
2007 (RL34294). Retrieved February 18, 2010, from
http://energy.senate.gov/public/_files/RL342941.pdf
Socolow, R. (1997). Fuels Decarbonization and Carbon Sequestration: Report of a
Workshop (PU/CEES Report No. 302). Retrieved March 29, 2010, from
http://www.princeton.edu/mae/people/faculty/socolow/
socdoc/socolow_r302_webfinal_2004-03-17.pdf.
Stanway, D. (2010). China skeptical as foreign firms push carbon capture. Retrieved
February 2, 2010, from http://www.reuters.com/article/idUSTRE6102WO20100201
Stevens, J. C. and Van Der Zwaan, B. (2005). The Case for Carbon Capture and Storage.
Issues in Science and Technology, 22 (1), 69-76.
109
Stangeland, A. (2007, October). A model for the CO2 capture potential. International Journal
of Greenhouse Gas Control, 1.
Subsidiary Body for Scientific and Technological Advice, UNFCC. (2009, December 12).
Carbon dioxide capture andstorage in geological formations as clean develoment
mechanism project activities (FCCC/SBSTA/2009/L.20).
Taylor, P. (2009, October 13). Pipeline Would Carry Midwest CO2 to Golf Coasts Oil Fields.
New York Times. Retrieved February 20, 2010, from
http://www.nytimes.com/gwire/2009/10/13/13greenwire-pipeline-would-carry-
midwest-co2-to-gulf-coast-
19951.html?scp=9andsq=carbon%20capture%20and%20storageandst=cse on
2/12/2010
Tester, J. et al. (2005). Sustainable Energy: Choosing Among Options. Cambridge,
Massachusetts: Massachusetts Institute of Technology Press.
Thitakamol, B., Veawab, A., and Aroonwilas, A. (2007, May 7). Environmental impacts of
absorption-based CO2 capture unit for post-combustion treatment of flue gas from
coal-fired power plant. Retrieved February 7, 2010, from http://www.energy-
based.nrct.go.th/Article/Ts-3%20environmental%20impacts%20of%20absorption-
based%20co2%20capture%20unit%20for%20post-
combustion%20treatment%20of%20flue%20gas%20from%20coal-
fired%20power%20plant.pdf
Turkenburg, W. C. and Hendriks, C. A. (1999). Fossil Fuels in a Sustainable Energy Supply:
the Significance of CO2 Removal. A Memorandum at the Request of the Ministry of
Economic Affairs, The Hague.
Union of Concerned Scientists. (2009a). Comparison of the American Clean Energy and
Security Act of 2009 (ACES, House-Passed Bill) and the Clean Energy Jobs and
American Power Act of 2009 (CEJAPA, 9/30/09 version). Retrieved February 18,
2010, from www.ucsusa.org/assets/documents/global.../CEJAPA-ACES-
comparison.pdf
Union of Concerned Scientists. (2009b). Each Country's Share of CO2 Emissions. Retrieved
April 13, 2010, from http://www.ucsusa.org/global_warming/science_and_impacts/
science/each-countrys-share-of-co2.html
United Nations Framework Convention on Climate Change (UNFCCC). (2006, March 30).
Report of the Conference of the Parties serving as the meeting of the Parties to the
Kyoto Protocol on its first session, held at Montreal from 28 November to 10
December 2005 (FCCC/KP/CMP/2005/8/Add.2).
United Nations Framework Convention on Climate Change (UNFCCC). (2009a). Carbon
dioxide capture and storage in geological formations as CDM project activities.
Retrieved February 7, 2010, from http://cdm.unfccc.int/about/ccs/index.html
110
United Nations Framework Convention on Climate Change (UNFCCC). (2009b). Draft
decision-/CMP.5 Further guidance relating to the clean development mechanism.
Retrieved January 15, 2010, from unfccc.int/resource/docs/2009/cmp5/eng/l10.pdf
United Nations Framework Convention on Climate Change (UNFCCC). (2009c). Kyoto
Protocol. Retrieved January 15, 2010, from
http://unfccc.int/kyoto_protocol/items/2830.php
United Nations Framework Convention on Climate Change (UNFCCC). (2009d). UNFCCC
Parties. Retrieved January 15, 2010, from
http://unfccc.int/parties_and_observers/parties/items/2352.php
United Nations Framework Convention on Climate Change (UNFCCC). (2010). Fact sheet:
An introduction to the United Nations Framework. Retrieved January 30th, 2010,
from
unfccc.int/files/press/backgrounders/application/pdf/unfccc_and_kyoto_protocol.pdf
United States Department of Energy (U.S. DOE). (2009, October 2). Secretary Chu
Announces First Awards from $1.4 Billion for Industrial Carbon Capture and
Storage Projects [Press Release]. Retrieved February 17, 2010, from
http://www.energy.gov/news2009/8102.htm
United States Department of Energy (U.S. DOE). (2010a). DOE's Clean Coal Technology
Program. Retrieved February 20, 2010, from
http://fossil.energy.gov/programs/powersystems/cleancoal/
United States Department of Energy (U.S. DOE). (2010b). Fossil Energy. Retrieved
February 13, 2010, from http://www.fossil.energy.gov/
United States Department of Energy/National Energy Technology Laboratory (U.S.
DOE/NETL). (2006). International Carbon Capture and Storage Projects
Overcoming Legal Barriers (Report No. DOE/NETL -2006/1236). Retrieved
February 23, 2010, from http://www.netl.doe.gov/energy-analyses/pubs/
ccsregulatorypaperfinalreport.pdf
United States Department of Energy/National Energy Technology Laboratory (U.S.
DOE/NETL). (2007a). Carbon Sequestration Technology Roadmap and Program
Plan. Retrieved February 20, 2010, from www.netl.doe.gov/technologies/carbon_seq/
refshelf/project%20portfolio/2007/2007Roadmap.pdf - 2010-03-24
United States Department of Energy/National Energy Technology Laboratory (U.S.
DOE/NETL). (2007b). CO2 Capture From Existing Coal-Fired Power Plants (Report
No. DOE/NETL-401/110907). Retrieved April 20, 2010, from
http://www.netl.doe.gov/energy-
111
analyses/pubs/CO2%20Retrofit%20From%20Existing%20Plants%20Revised%20No
vember%202007.pdf
United States Department of Energy/National Energy Technology Laboratory (U.S.
DOE/NETL). (2007c). Cost and Performance Baseline for Fossil Energy Plants
(Report No. DOE/NETL-2007/1281). Retrieved January 20, 2010, from
http://www.netl.doe.gov/energy-
analyses/pubs/Bituminous%20Baseline_Final%20Report.pdf
United States Department of Energy/National Energy Technology Laboratory (U.S.
DOE/NETL). (2007d). Fossil Energy Power Plant Desk Reference (Report No.
DOE/NETL-2007 /1282). Retrieved February 5, 2010, from
http://www.netl.doe.gov/energy-
analyses/pubs/Cost%20and%20Performance%20Baseline-012908.pdf
United States Department of Energy/National Energy Technology Laboratory (U.S.
DOE/NETL). (2007e). Natural Gas Combined-Cycle Plants With and Without
Carbon Capture and Sequestration. Retrieved February 20, 2010, from
http://www.netl.doe.gov/energy-analyses/pubs/deskreference/B_NGCC_051507.pdf
United States Department of Energy/National Energy Technology Laboratory (U.S.
DOE/NETL). (2008a). Design and Evaluation of Ionic Liquids as Novel Absorbents
[Fact Sheet]. Retrieved February 13, 2010, from www.netl.doe.gov/publications/
factsheets/project/Proj332.pdf - 2010-03-24
United States Department of Energy/National Energy Technology Laboratory (U.S.
DOE/NETL). (2008b). Carbon Dioxide Separation with Novel Microporous Metal
Organic Frameworks [Fact Sheet]. Retrieved February 11, 2010, from
www.netl.doe.gov/publications/factsheets/project/Proj315.pdf - 2010-03-24
United States Department of Energy/National Energy Technology Laboratory (U.S.
DOE/NETL). (2008c). Thermally Optimized Membranes for Separation and Capture
of Carbon Dioxide [Fact Sheet]. Retrieved February 20, 2010, from
http://www.netl.doe.gov/publications/factsheets/project/Proj194.
United States Department of Energy/National Energy Technology Laboratory (U.S.
DOE/NETL). (2009a). Assessment of Power Plants That Meet Proposed Greenhouse
Gas Emission Performance Standards (Report No. DOE/NETL -401/110509).
Retrieved February 9, 2010, from http://www.netl.doe.gov/energy-
analyses/refshelf/PubDetails.aspx?Action=ViewandPubId=308
United States Department of Energy/National Energy Technology Laboratory (U.S.
DOE/NETL). (2009b). Pulverized Coal Oxycombustion Power Plants (Report No.
DOE/NETL -2007/1291). Retrieved February 9, 2010, from
www.netl.doe.gov/energy-analyses/pubs/PC%20Oxy-fuel%20Combustion
%20Revised%20Report%202008.pdf - 2010-03-24
112
United States Department of Energy/National Energy Technology Laboratory (U.S.
DOE/NETL). (2009c). Oxy-fuel Combustion [Fact Sheet]. Retrieved February 10,
2010, from http://www.netl.doe.gov/publications/factsheets/rd/R%26D102.pdf
United States Department of Energy/National Energy Technology Laboratory (U.S.
DOE/NETL). (2009d). Solvents for CO2 Capture [Fact Sheet]. Retrieved February 20,
2010, from http://www.netl.doe.gov/publications/factsheets/rd/R%26D048.pdf
United States Department of Energy/National Energy Technology Laboratory (U.S.
DOE/NETL). (2009e). Southeast Regional Carbon Sequestration Partnership –
Validation Phase [Fact Sheet]. Retrieved February 20, 2010, from
http://www.netl.doe.gov/publications/factsheets/project/Proj442.pdf
United States Department of Energy/National Energy Technology Laboratory (U.S.
DOE/NETL). (2009f). Monitoring, Verification, and Accounting of CO2 Stored in
Deep Geologic Formations (Report No. U.S. DOE/NETL-311/081508). Retrieved February
15, 2010, from www.netl.doe.gov/.../2009/Overview/Selected% 20CS%
20Program%20Papers/2009%20NETL%20MVA.pdf - 2010-03-24
United States Department of Energy/National Energy Technology Laboratory (U.S.
DOE/NETL). (2010a). Carbon Sequestration: FAQ Information Portal. Retrieved
February 11, 2010, from http://www.netl.doe.gov/technologies/ carbon_seq/index-
faq.html
United States Department of Energy/National Energy Technology Laboratory (U.S.
DOE/NETL). (2010b). Carbon Sequestration: Program Overview. Retrieved
February 3, 2010, from
http://www.netl.doe.gov/technologies/carbon_seq/overview/index.html
United States Department of Energy/National Energy Technology Laboratory (U.S.
DOE/NETL). (2010c, February). The Carbon Sequestration Newsletter. Retrieved
February 24, 2010, from http://www.netl.doe.gov/technologies/carbon_seq
/refshelf/news/2010/02-10.pdf
United States Department of Energy and United States Environmental Protection Agency
(U.S. DOE and U.S. EPA). (2006). National Action Plan for Energy Efficiency
[Report]. Retrieved April 10, 2010 from http://www.epa.gov/RDEE/energy-
programs/napee/resources/action-plan.html
United States Energy Information Administration (EIA). (2007). Annual Energy Outlook
2007: With Projections to 2030 [Report No. DOE/EIA-0383(2007)]. Retrieved April
21, 2010, from http://www.eia.doe.gov/oiaf/archive/aeo07/pdf/0383(2007).pdf
United States Energy Information Administration (EIA). (2008). Federal Financial
Interventions and Subsidies in Energy Markets (Report No. SR/CNEAF/2008-01).
113
Retrieved April 3, 2010, from
http://www.eia.doe.gov/oiaf/servicerpt/subsidy2/index.html
United States Energy Information Adminstration (EIA). (2009). Annual Energy Outlook
2010 Early Release Overview. Retrieved April 1, 2010, from
http://www.eia.doe.gov/oiaf/aeo/overview.html
United States Energy Information Adminstration (EIA). (2010a). Electric Power Plants,
U.S. Overview. Retrieved April 1, 2010, from
http://tonto.eia.doe.gov/state/?featureclicked=4and
United States Energy Information Administration (EIA). (2010b). Electricity Market Module
[Report No. DOE/EIA-0554(2010)]. Retrieved April 15, 2010, from
http://www.eia.doe.gov/oiaf/aeo/assumption/pdf/electricity.pdf
United States Energy Information Administration (EIA). (2010c). Existing Electricity
Generating Capacity by Source 2008. Retrieved April 18, 2010, from
http://www.eia.doe.gov/cneaf/electricity/page/capacity/capacity.html
United States Energy Information Administration (EIA). (2010d). Renewable Fuels Module
[Report No. DOE/EIA-0554(2010)]. Retrieved April 15, 2010, from
http://www.eia.doe.gov/oiaf/aeo/assumption/pdf/renewable.pdf
United States Environmental Protection Agency (EPA). (2004). Safe Drinking Water Act
Laws and Statutes. Retrieved March 1, 2010, from
http://www.epa.gov/safewater/sdwa/ laws_statutes.html
United States Environmental Protection Agency (EPA). (2008). Hazardous Waste
Management Systems: Identification and Listing of Hazardous Wastes: Carbon
Dioxide (CO2) Injectate in Geological Sequestration Activities. Retrieved April 18,
2010, from http://yosemite.epa.gov/opei/rulegate.nsf/byRIN/2050-
AG60?opendocument
United States Environmental Protection Agency (EPA). (2009). EPA Releases Supplemental
Information on the Proposed Requirements for Geologic Sequestration of Carbon
Dioxide. Retrieved February 10, 2010, from www.epa.gov/ogwdw000/uic/pdfs/
fs_uic_noda_2009-08.pdf
United States Environmental Protection Agency (EPA). (2010). Draft Inventory of U.S.
Greenhouse Gas Emissions and Sinks: 1990 to 2008. Retrieved April 2, 2010, from
http://epa.gov/climatechange/emissions/usinventoryreport.html
United States Senate Committee on Energy and Natural Resources. (2009). Committee
Reports Energy Bill. Retrieved February 20, 2010, from
http://energy.senate.gov/public/index.cfm?FuseAction=PressReleases.DetailandPres
sRelease_id=a3fe85e3-8145-4b45-bb0b-
114
1df967416a1fandMonth=6andYear=2009andParty=0
United States Senator Maria Cantwell. (2009). CLEAR Act Side-by-Side with ACES.
Retrieved February 13, 2010, from
http://cantwell.senate.gov/.../CLEAR%20Act%20Side-by-
Side%20with%20ACES.pdf
Wade, S. and Greenberg, S. (2009). Afraid to Start Because the Outcome is Uncertain?:
Social Site Characterization as a Tool for Informing the Public Engagement Efforts.
Energy Procedia, 1, 4641-47.
Wald, M. (2009, September 21). Refitted to Bury Emissions, Plant Draws Attentions. The
New York Times. Retrieved February 16, 2010, from
http://www.nytimes.com/2009/09/22/science/earth/22coal.html?_r=2andscp=1andsq=
carbon%20capture%20and%20storageandst=cse
Walsh, B. (2009, December 7). EPA moves to regulate CO2 as a hazard to health. Time.
Retrieved April 21, 2010, from
http://www.time.com/time/health/article/0,8599,1946095,00.html
Washington State Department of Ecology. (2008). Chapter 4 - Leading the Way on Climate
Change: Regional, State and Local Actions (INTERIM REPORT). Retrieved
February 18, 2010, from http://www.ecy.wa.gov/biblio/0801008d.html
Western Climate Initiative. (2010a) The WCI Cap and Trade Program. Retrieved February
20, 2010, from http://www.westernclimateinitiative.org/the-wci-cap-and-trade-
program
Western Climate Initiative. (2010b) Western Climate Initiative. Retrieved February 10,
2010, from http://www.westernclimateinitiative.org/
Williams, E., Greenglass, N., and Ryals, R. (2007). Carbon Capture, Pipeline, and Storage:
A Viable Option for North Carolina Utilities? [Working Paper]. Climate Change
Policy Partnership, Duke University.
Zakkour, P. (2007). Technical support for an enabling policy framework for carbon dioxide
capture and geological storage [Discussion Paper]. Retrieved February 10, 2010,
from http://ec.europa.eu/environment/climat/ccs/pdf/policy_options_paper.pdf
115
List of Tables Table 1: Costs of CO2 Capture with MEA Systems 7
Table 2: Generating Units in the US (> 100 MW summer capacity) by Age of Unit 13
Table 3: Estimated Costs for each type of Geologic Storage 39
Table 4: Site and Dispatch Characteristics of Various Power Generation Technologies 68
Table 5: Breakeven CO2 Price 71
Table 6: World Energy Consumption and Carbon Dioxide Emissions, 1990-2025 77
Table 7: Global Coal Reserves in 2005 79
Table 8: Potential For CO2 Emissions Reduction 80
Table 9: Short and Long-Term Technical Potential for CO2 Capture 81
Table 10: Active or Planned, Commercial Scale, Integrated CCS Projects 82
Table 11: Existing and Planned CO2 Storage Projects as of Early 2009 82
Table 12: Review of Regulatory Frameworks For CCS Development 88
116
List of Figures Figure 1: Diagram of an Amine-Based Wet-Scrubbing System 6
Figure 2: NGCC Process With CCS 9
Figure 3: U.S. DOE CO2 Capture R&D Program for Oxy-Combustion Process 10
Figure 4: IGCC Process with Carbon Capture 12
Figure 5: Water Consumption with and without Capture 16
Figure 6: Levelized Cost of Electricity with and without Capture 18
Figure 7: Major CO2 Pipelines in the U.S. 20
Figure 8: Location of Coal Plants Relative to Potential CO2 Storage Sites 23
Figure 9: U.S. Prices for Large Diameter Steel Pipe 24
Figure 10: Transportation Costs by Ship and Pipeline as a Function of Distance 25
Figure 11: Potential CO2 Storage Reservoirs in North America 29
Figure 12: Gradual Leakage of CO2 from Oceanic Storage 37
Figure 13: CO2 Reservoir Filling 39
Figure 14: Levelized Cost of Electricity at $25/Tonne of CO2 70
Figure 15: Levelized Cost with Alternatives at $50/Tonne of CO2 70
Figure 16: Cost Comparisons without Subsidy, with ITC or with PTC 72
Figure 17: Cost Comparisons including both ITC and PTC 73
Figure 18: Top 20 Countries Carbon Dioxide Emissions in 2006 76
Figure 19: Historic and Projected Carbon Dioxide Emissions 77
Figure 20: International Fossil Fuel Use 78
Figure 21: Total Coal Consumption 79
Figure 22: Global CCS Potential 80
Figure 23: Planned and Operational Large-scale CCS Projects 83

117
Appendices

118
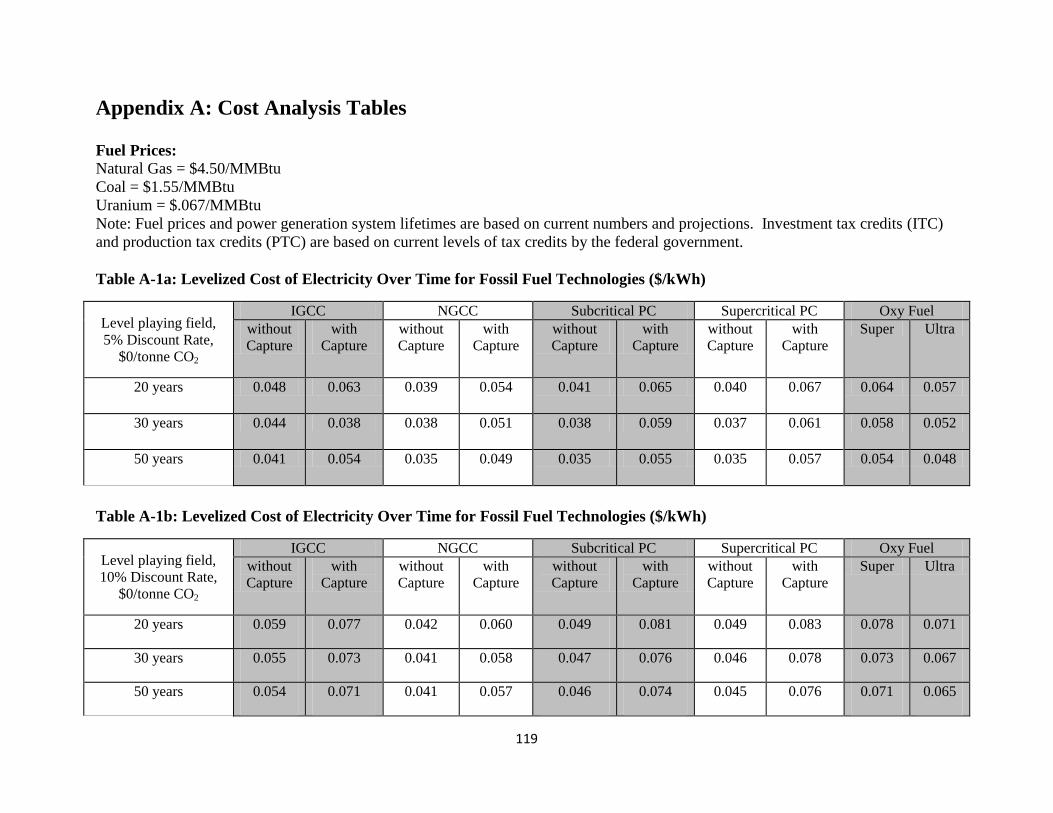
119
Appendix A: Cost Analysis Tables
Fuel Prices:
Natural Gas = $4.50/MMBtu
Coal = $1.55/MMBtu
Uranium = $.067/MMBtu
Note: Fuel prices and power generation system lifetimes are based on current numbers and projections. Investment tax credits (ITC)
and production tax credits (PTC) are based on current levels of tax credits by the federal government.
Table A-1a: Levelized Cost of Electricity Over Time for Fossil Fuel Technologies ($/kWh)
Level playing field,
5% Discount Rate,
$0/tonne CO2
IGCC NGCC Subcritical PC Supercritical PC Oxy Fuel
without
Capture
with
Capture
without
Capture
with
Capture
without
Capture
with
Capture
without
Capture
with
Capture
Super Ultra
20 years 0.048 0.063 0.039 0.054 0.041 0.065 0.040 0.067 0.064 0.057
30 years 0.044 0.038 0.038 0.051 0.038 0.059 0.037 0.061 0.058 0.052
50 years 0.041 0.054 0.035 0.049 0.035 0.055 0.035 0.057 0.054 0.048
Table A-1b: Levelized Cost of Electricity Over Time for Fossil Fuel Technologies ($/kWh)
Level playing field,
10% Discount Rate,
$0/tonne CO2
IGCC NGCC Subcritical PC Supercritical PC Oxy Fuel
without
Capture
with
Capture
without
Capture
with
Capture
without
Capture
with
Capture
without
Capture
with
Capture
Super Ultra
20 years 0.059 0.077 0.042 0.060 0.049 0.081 0.049 0.083 0.078 0.071
30 years 0.055 0.073 0.041 0.058 0.047 0.076 0.046 0.078 0.073 0.067
50 years 0.054 0.071 0.041 0.057 0.046 0.074 0.045 0.076 0.071 0.065
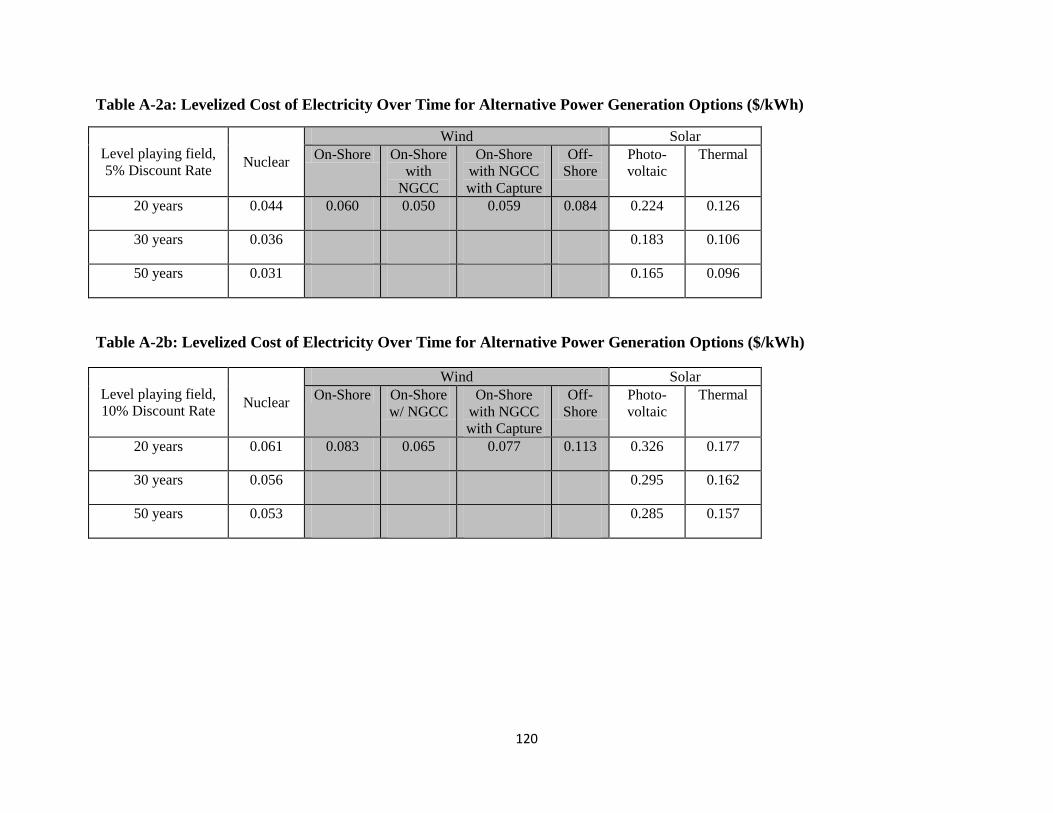
120
Table A-2a: Levelized Cost of Electricity Over Time for Alternative Power Generation Options ($/kWh)
Level playing field,
5% Discount Rate Nuclear
Wind Solar
On-Shore On-Shore
with
NGCC
On-Shore
with NGCC
with Capture
Off-
Shore
Photo-
voltaic
Thermal
20 years 0.044 0.060 0.050 0.059 0.084 0.224 0.126
30 years 0.036 0.183 0.106
50 years 0.031 0.165 0.096
Table A-2b: Levelized Cost of Electricity Over Time for Alternative Power Generation Options ($/kWh)
Level playing field,
10% Discount Rate Nuclear
Wind Solar
On-Shore On-Shore
w/ NGCC
On-Shore
with NGCC
with Capture
Off-
Shore
Photo-
voltaic
Thermal
20 years 0.061 0.083 0.065 0.077 0.113 0.326 0.177
30 years 0.056 0.295 0.162
50 years 0.053 0.285 0.157
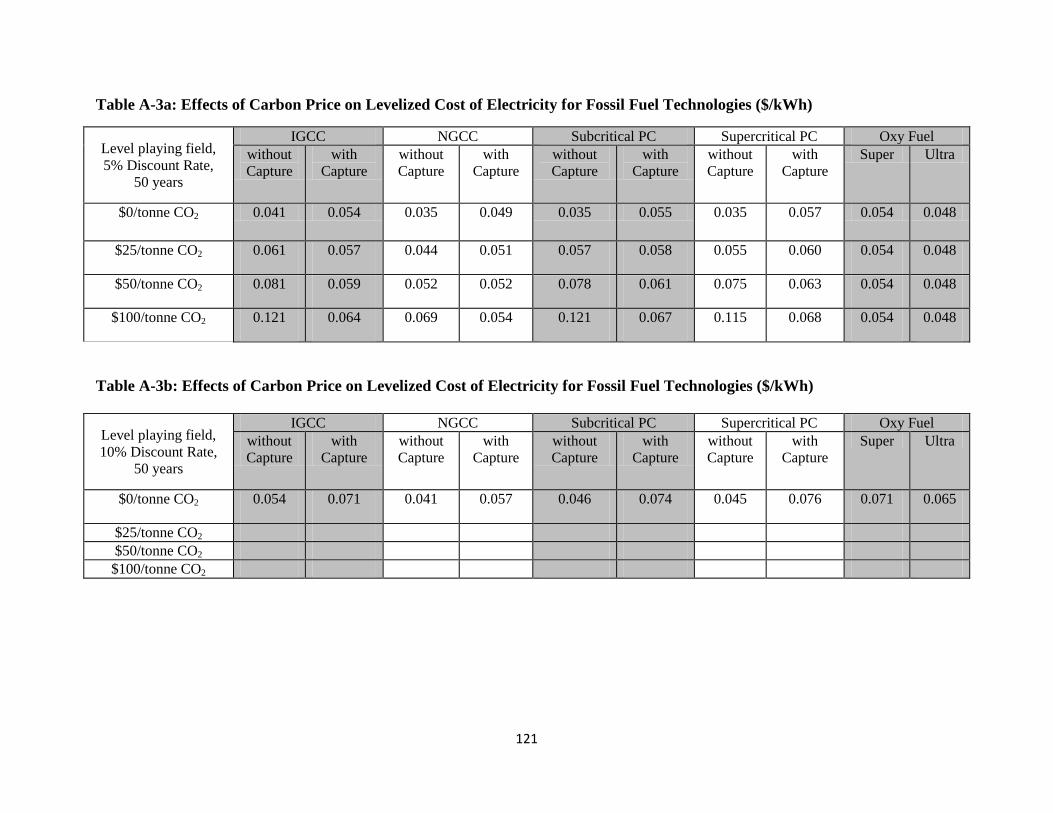
121
Table A-3a: Effects of Carbon Price on Levelized Cost of Electricity for Fossil Fuel Technologies ($/kWh)
Level playing field,
5% Discount Rate,
50 years
IGCC NGCC Subcritical PC Supercritical PC Oxy Fuel
without
Capture
with
Capture
without
Capture
with
Capture
without
Capture
with
Capture
without
Capture
with
Capture
Super Ultra
$0/tonne CO2 0.041 0.054 0.035 0.049 0.035 0.055 0.035 0.057 0.054 0.048
$25/tonne CO2 0.061 0.057 0.044 0.051 0.057 0.058 0.055 0.060 0.054 0.048
$50/tonne CO2 0.081 0.059 0.052 0.052 0.078 0.061 0.075 0.063 0.054 0.048
$100/tonne CO2 0.121 0.064 0.069 0.054 0.121 0.067 0.115 0.068 0.054 0.048
Table A-3b: Effects of Carbon Price on Levelized Cost of Electricity for Fossil Fuel Technologies ($/kWh)
Level playing field,
10% Discount Rate,
50 years
IGCC NGCC Subcritical PC Supercritical PC Oxy Fuel
without
Capture
with
Capture
without
Capture
with
Capture
without
Capture
with
Capture
without
Capture
with
Capture
Super Ultra
$0/tonne CO2 0.054 0.071 0.041 0.057 0.046 0.074 0.045 0.076 0.071 0.065
$25/tonne CO2
$50/tonne CO2
$100/tonne CO2
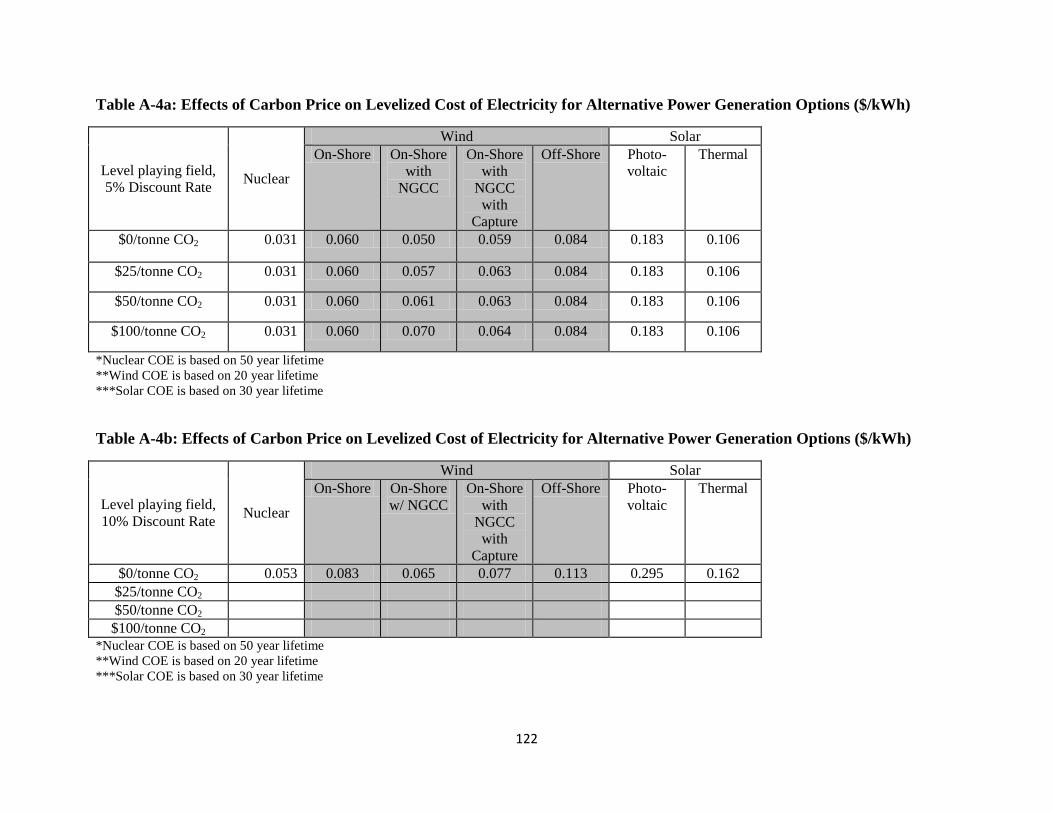
122
Table A-4a: Effects of Carbon Price on Levelized Cost of Electricity for Alternative Power Generation Options ($/kWh)
Level playing field,
5% Discount Rate Nuclear
Wind Solar
On-Shore On-Shore
with
NGCC
On-Shore
with
NGCC
with
Capture
Off-Shore Photo-
voltaic
Thermal
$0/tonne CO2 0.031 0.060 0.050 0.059 0.084 0.183 0.106
$25/tonne CO2 0.031 0.060 0.057 0.063 0.084 0.183 0.106
$50/tonne CO2 0.031 0.060 0.061 0.063 0.084 0.183 0.106
$100/tonne CO2 0.031 0.060 0.070 0.064 0.084 0.183 0.106
*Nuclear COE is based on 50 year lifetime
**Wind COE is based on 20 year lifetime
***Solar COE is based on 30 year lifetime
Table A-4b: Effects of Carbon Price on Levelized Cost of Electricity for Alternative Power Generation Options ($/kWh)
Level playing field,
10% Discount Rate Nuclear
Wind Solar
On-Shore On-Shore
w/ NGCC
On-Shore
with
NGCC
with
Capture
Off-Shore Photo-
voltaic
Thermal
$0/tonne CO2 0.053 0.083 0.065 0.077 0.113 0.295 0.162
$25/tonne CO2
$50/tonne CO2
$100/tonne CO2
*Nuclear COE is based on 50 year lifetime
**Wind COE is based on 20 year lifetime
***Solar COE is based on 30 year lifetime

123
Table A-5: Levelized Cost of Electricity for Fossil Fuel Technologies with Subsidies ($/kWh)
Level playing field,
5% Discount Rate,
50 years,
$0/tonne CO2
IGCC NGCC Subcritical PC Supercritical PC Oxy Fuel
without
Capture
with
Capture
without
Capture
with
Capture
without
Capture
with
Capture
without
Capture
with
Capture
Super Ultra
Investment Tax Credit 0.041 0.049 0.035 0.047 0.035 0.049 0.035 0.051 0.049 0.043
Production Tax Credit 0.041 0.046 0.035 0.041 0.035 0.046 0.035 0.048 0.045 0.039
ITC + PTC 0.041 0.041 0.035 0.039 0.035 0.041 0.035 0.043 0.040 0.034
*Investment Tax Credit=25% of Capital
**Production Tax Credit=$0.02/kWh for 10 years
Table A-6: Levelized Cost of Electricity for Alternative Power Generation Options with Subsidies ($/kWh)
Level playing field, 5%
Discount Rate,
$0/tonne CO2
Nuclear
Wind Solar
On-
Shore
On-Shore
with
NGCC
On-Shore
with
NGCC
with
Capture
Off-Shore Photo-
voltaic
Thermal
Investment Tax Credit 0.025 0.048 0.046 0.053 0.068 0.139 0.083
Production Tax Credit 0.023 0.048 0.046 0.050 0.071 0.173 0.096
ITC + PTC 0.016 0.035 0.040 0.041 0.055 0.129 0.073
*Nuclear COE is based on 50 year lifetime
**Wind COE is based on 20 year lifetime
***Solar COE is based on 30 year lifetime
****Investment Tax Credit=25% of Capital
*****Production Tax Credit=$0.02/kWh for 10 years
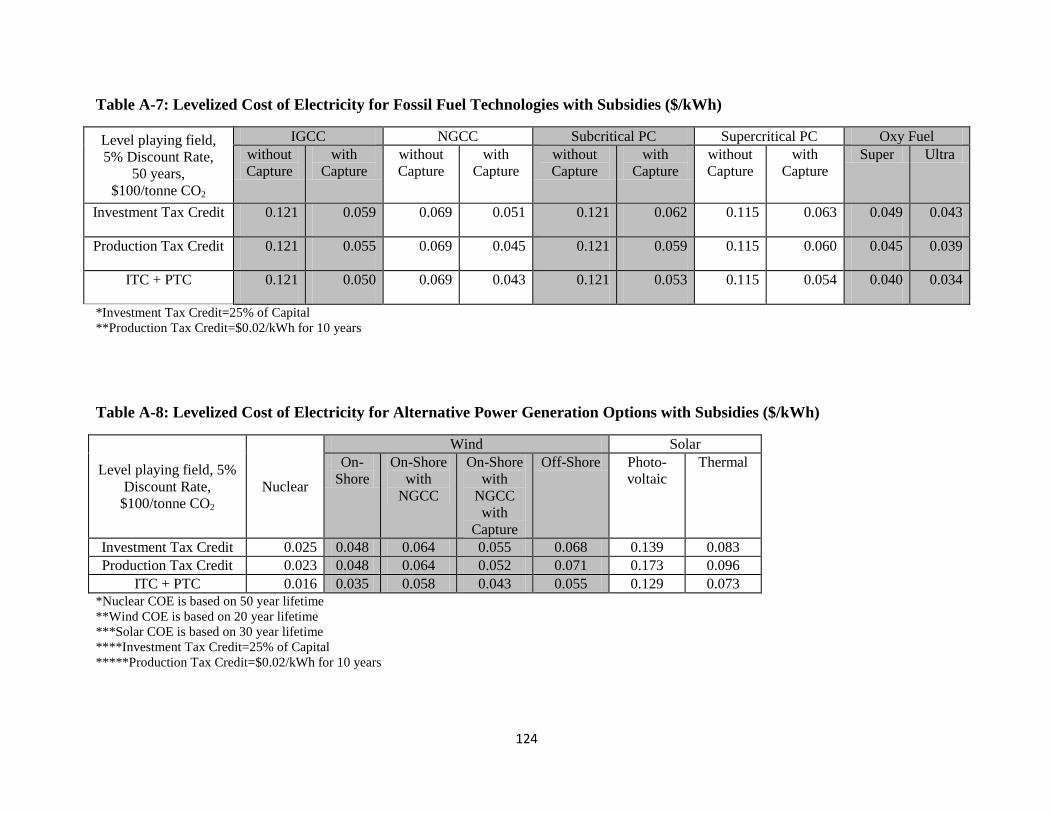
124
Table A-7: Levelized Cost of Electricity for Fossil Fuel Technologies with Subsidies ($/kWh)
Level playing field,
5% Discount Rate,
50 years,
$100/tonne CO2
IGCC NGCC Subcritical PC Supercritical PC Oxy Fuel
without
Capture
with
Capture
without
Capture
with
Capture
without
Capture
with
Capture
without
Capture
with
Capture
Super Ultra
Investment Tax Credit 0.121 0.059 0.069 0.051 0.121 0.062 0.115 0.063 0.049 0.043
Production Tax Credit 0.121 0.055 0.069 0.045 0.121 0.059 0.115 0.060 0.045 0.039
ITC + PTC 0.121 0.050 0.069 0.043 0.121 0.053 0.115 0.054 0.040 0.034
*Investment Tax Credit=25% of Capital
**Production Tax Credit=$0.02/kWh for 10 years
Table A-8: Levelized Cost of Electricity for Alternative Power Generation Options with Subsidies ($/kWh)
Level playing field, 5%
Discount Rate,
$100/tonne CO2
Nuclear
Wind Solar
On-
Shore
On-Shore
with
NGCC
On-Shore
with
NGCC
with
Capture
Off-Shore Photo-
voltaic
Thermal
Investment Tax Credit 0.025 0.048 0.064 0.055 0.068 0.139 0.083
Production Tax Credit 0.023 0.048 0.064 0.052 0.071 0.173 0.096
ITC + PTC 0.016 0.035 0.058 0.043 0.055 0.129 0.073
*Nuclear COE is based on 50 year lifetime
**Wind COE is based on 20 year lifetime
***Solar COE is based on 30 year lifetime
****Investment Tax Credit=25% of Capital
*****Production Tax Credit=$0.02/kWh for 10 years
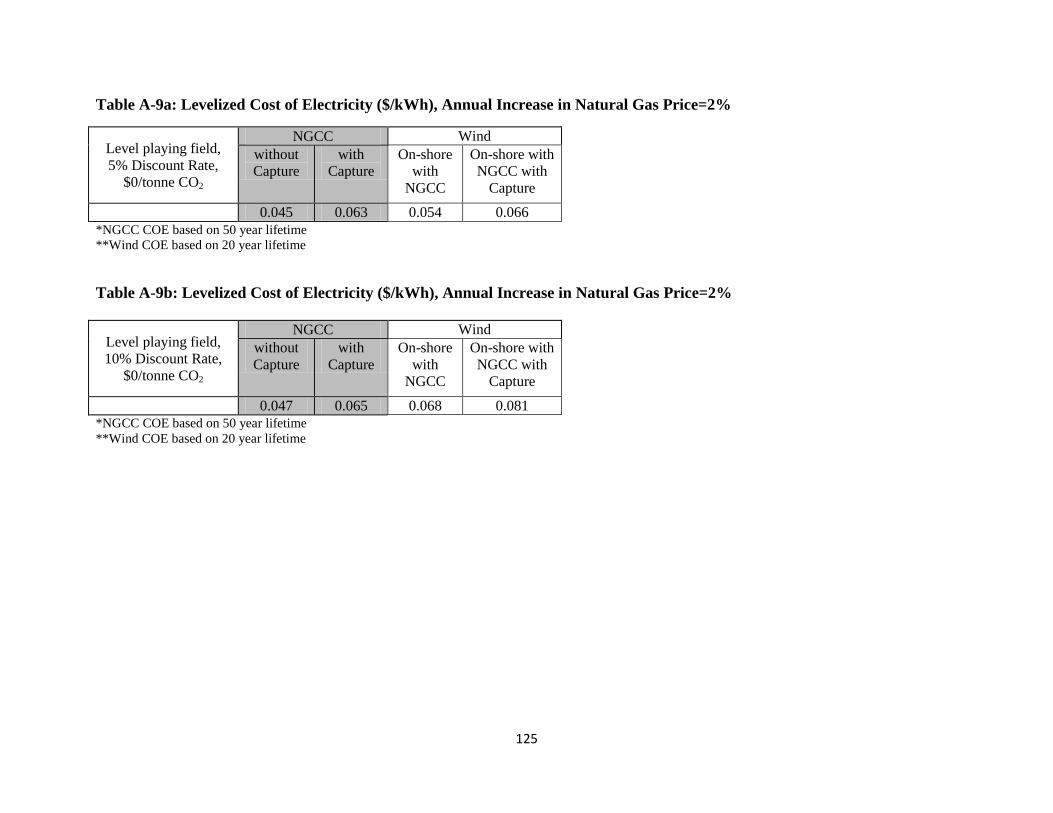
125
Table A-9a: Levelized Cost of Electricity ($/kWh), Annual Increase in Natural Gas Price=2%
Level playing field,
5% Discount Rate,
$0/tonne CO2
NGCC Wind
without
Capture
with
Capture
On-shore
with
NGCC
On-shore with
NGCC with
Capture
0.045 0.063 0.054 0.066
*NGCC COE based on 50 year lifetime
**Wind COE based on 20 year lifetime
Table A-9b: Levelized Cost of Electricity ($/kWh), Annual Increase in Natural Gas Price=2%
Level playing field,
10% Discount Rate,
$0/tonne CO2
NGCC Wind
without
Capture
with
Capture
On-shore
with
NGCC
On-shore with
NGCC with
Capture
0.047 0.065 0.068 0.081
*NGCC COE based on 50 year lifetime
**Wind COE based on 20 year lifetime
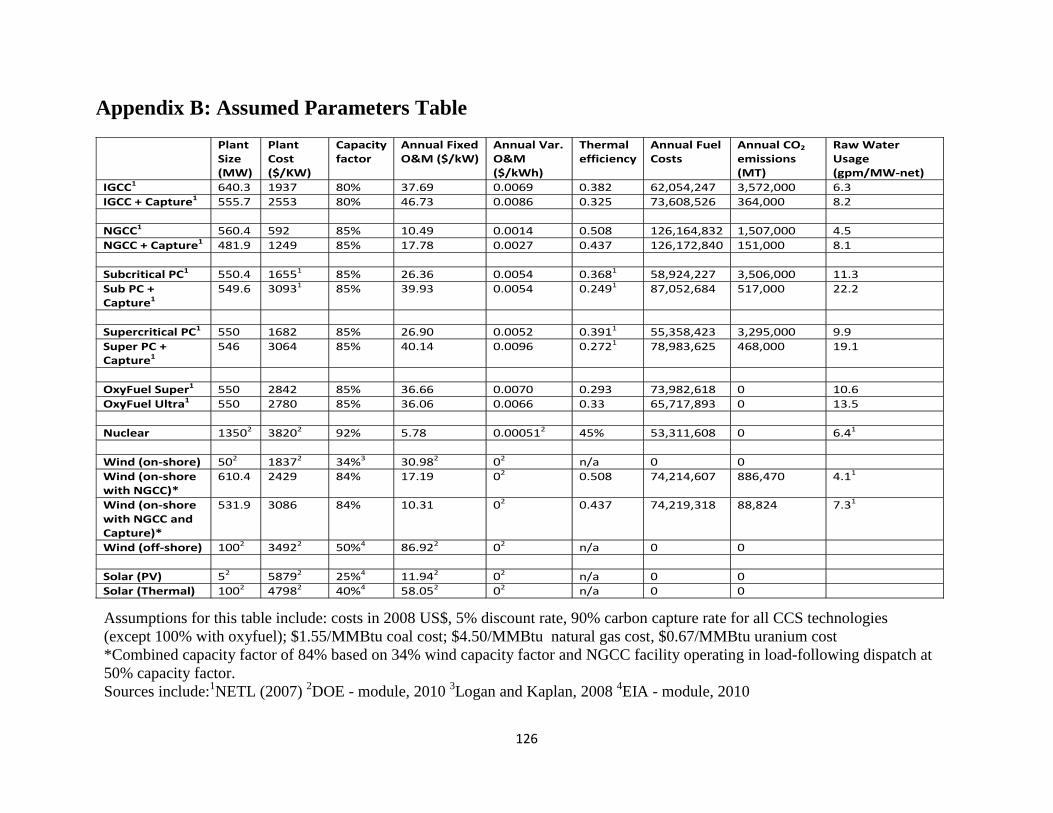
126
Appendix B: Assumed Parameters Table
Plant Size (MW)
Plant Cost ($/KW)
Capacity factor
Annual Fixed O&M ($/kW)
Annual Var. O&M ($/kWh)
Thermal efficiency
Annual Fuel Costs
Annual CO2 emissions (MT)
Raw Water Usage (gpm/MW-net)
IGCC1 640.3 1937 80% 37.69 0.0069 0.382 62,054,247 3,572,000 6.3
IGCC + Capture1 555.7 2553 80% 46.73 0.0086 0.325 73,608,526 364,000 8.2
NGCC1 560.4 592 85% 10.49 0.0014 0.508 126,164,832 1,507,000 4.5
NGCC + Capture1 481.9 1249 85% 17.78 0.0027 0.437 126,172,840 151,000 8.1
Subcritical PC1 550.4 16551 85% 26.36 0.0054 0.3681 58,924,227 3,506,000 11.3
Sub PC + Capture1
549.6 30931 85% 39.93 0.0054 0.2491 87,052,684 517,000 22.2
Supercritical PC1 550 1682 85% 26.90 0.0052 0.3911 55,358,423 3,295,000 9.9
Super PC + Capture1
546 3064 85% 40.14 0.0096 0.2721 78,983,625 468,000 19.1
OxyFuel Super1 550 2842 85% 36.66 0.0070 0.293 73,982,618 0 10.6
OxyFuel Ultra1 550 2780 85% 36.06 0.0066 0.33 65,717,893 0 13.5
Nuclear 13502 38202 92% 5.78 0.000512 45% 53,311,608 0 6.41
Wind (on-shore) 502 18372 34%3 30.982 02 n/a 0 0
Wind (on-shore with NGCC)*
610.4 2429 84% 17.19 02 0.508 74,214,607 886,470 4.11
Wind (on-shore with NGCC and Capture)*
531.9 3086 84% 10.31 02 0.437 74,219,318 88,824 7.31
Wind (off-shore) 1002 34922 50%4 86.922 02 n/a 0 0
Solar (PV) 52 58792 25%4 11.942 02 n/a 0 0
Solar (Thermal) 1002 47982 40%4 58.052 02 n/a 0 0
Assumptions for this table include: costs in 2008 US$, 5% discount rate, 90% carbon capture rate for all CCS technologies
(except 100% with oxyfuel); $1.55/MMBtu coal cost; $4.50/MMBtu natural gas cost, $0.67/MMBtu uranium cost
*Combined capacity factor of 84% based on 34% wind capacity factor and NGCC facility operating in load-following dispatch at
50% capacity factor.
Sources include:1NETL (2007)
2DOE - module, 2010
3Logan and Kaplan, 2008
4EIA - module, 2010
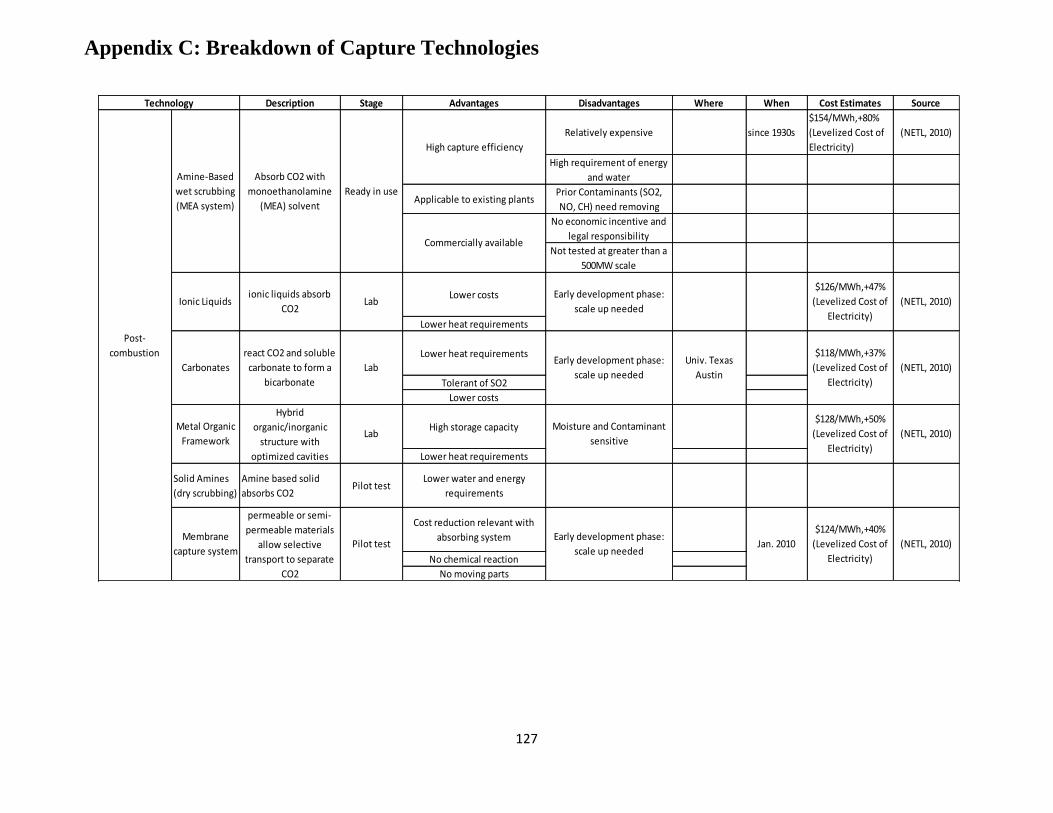
127
Description Stage Advantages Disadvantages Where When Cost Estimates Source
Relatively expensive since 1930s
$154/MWh,+80%
(Levelized Cost of
Electricity)
(NETL, 2010)
High requirement of energy
and water
Applicable to existing plantsPrior Contaminants (SO2,
NO, CH) need removing
No economic incentive and
legal responsibility
Not tested at greater than a
500MW scale
Lower costs
Lower heat requirements
Lower heat requirements
Tolerant of SO2
Lower costs
High storage capacity
Lower heat requirements
Solid Amines
(dry scrubbing)
Amine based solid
absorbs CO2Pilot test
Lower water and energy
requirements
Cost reduction relevant with
absorbing system
No chemical reaction
No moving parts
Early development phase:
scale up needed
High capture efficiency
Commercially available
Early development phase:
scale up needed(NETL, 2010)
(NETL, 2010)
(NETL, 2010)
(NETL, 2010)
Technology
Post-
combustion
Amine-Based
wet scrubbing
(MEA system)
Absorb CO2 with
monoethanolamine
(MEA) solvent
Ready in use
Univ. Texas
Austin
$118/MWh,+37%
(Levelized Cost of
Electricity)
$126/MWh,+47%
(Levelized Cost of
Electricity)
Ionic Liquidsionic liquids absorb
CO2Lab
Carbonates
react CO2 and soluble
carbonate to form a
bicarbonate
Lab
Metal Organic
Framework
Hybrid
organic/inorganic
structure with
optimized cavities
Lab Moisture and Contaminant
sensitive
$128/MWh,+50%
(Levelized Cost of
Electricity)
$124/MWh,+40%
(Levelized Cost of
Electricity)
Membrane
capture system
permeable or semi-
permeable materials
allow selective
transport to separate
CO2
Pilot testEarly development phase:
scale up neededJan. 2010
Appendix C: Breakdown of Capture Technologies
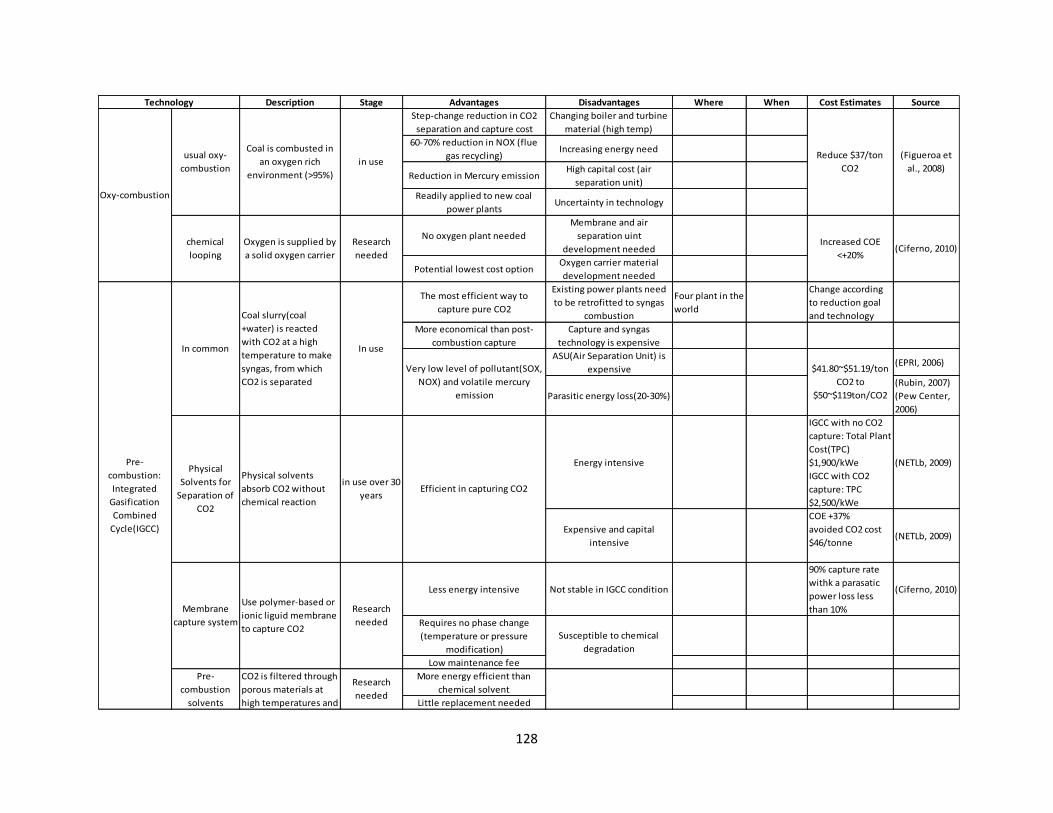
128
Description Stage Advantages Disadvantages Where When Cost Estimates Source
Step-change reduction in CO2
separation and capture cost
Changing boiler and turbine
material (high temp)
60-70% reduction in NOX (flue
gas recycling)Increasing energy need
Reduction in Mercury emissionHigh capital cost (air
separation unit)
Readily applied to new coal
power plantsUncertainty in technology
No oxygen plant needed
Membrane and air
separation uint
development needed
Potential lowest cost optionOxygen carrier material
development needed
The most efficient way to
capture pure CO2
Existing power plants need
to be retrofitted to syngas
combustion
Four plant in the
world
Change according
to reduction goal
and technology
More economical than post-
combustion capture
Capture and syngas
technology is expensive
ASU(Air Separation Unit) is
expensive(EPRI, 2006)
Parasitic energy loss(20-30%)
(Rubin, 2007)
(Pew Center,
2006)
Energy intensive
IGCC with no CO2
capture: Total Plant
Cost(TPC)
$1,900/kWe
IGCC with CO2
capture: TPC
$2,500/kWe
(NETLb, 2009)
Expensive and capital
intensive
COE +37%
avoided CO2 cost
$46/tonne(NETLb, 2009)
Less energy intensive Not stable in IGCC condition
90% capture rate
withk a parasatic
power loss less
than 10%
(Ciferno, 2010)
Requires no phase change
(temperature or pressure
modification)
Low maintenance fee
More energy efficient than
chemical solvent
Little replacement needed
Susceptible to chemical
degradation
Pre-
combustion
solvents
CO2 is filtered through
porous materials at
high temperatures and
Research
needed
$41.80~$51.19/ton
CO2 to
$50~$119ton/CO2
Physical
Solvents for
Separation of
CO2
Physical solvents
absorb CO2 without
chemical reaction
in use over 30
yearsEfficient in capturing CO2
Pre-
combustion:
Integrated
Gasification
Combined
Cycle(IGCC)
In common
Coal slurry(coal
+water) is reacted
with CO2 at a high
temperature to make
syngas, from which
CO2 is separated
In use
Very low level of pollutant(SOX,
NOX) and volatile mercury
emission
Membrane
capture system
Use polymer-based or
ionic liguid membrane
to capture CO2
Research
needed
Reduce $37/ton
CO2
(Figueroa et
al., 2008)
chemical
looping
Oxygen is supplied by
a solid oxygen carrier
Research
needed
Increased COE
<+20%(Ciferno, 2010)
Technology
Oxy-combustion
usual oxy-
combustion
Coal is combusted in
an oxygen rich
environment (>95%)
in use
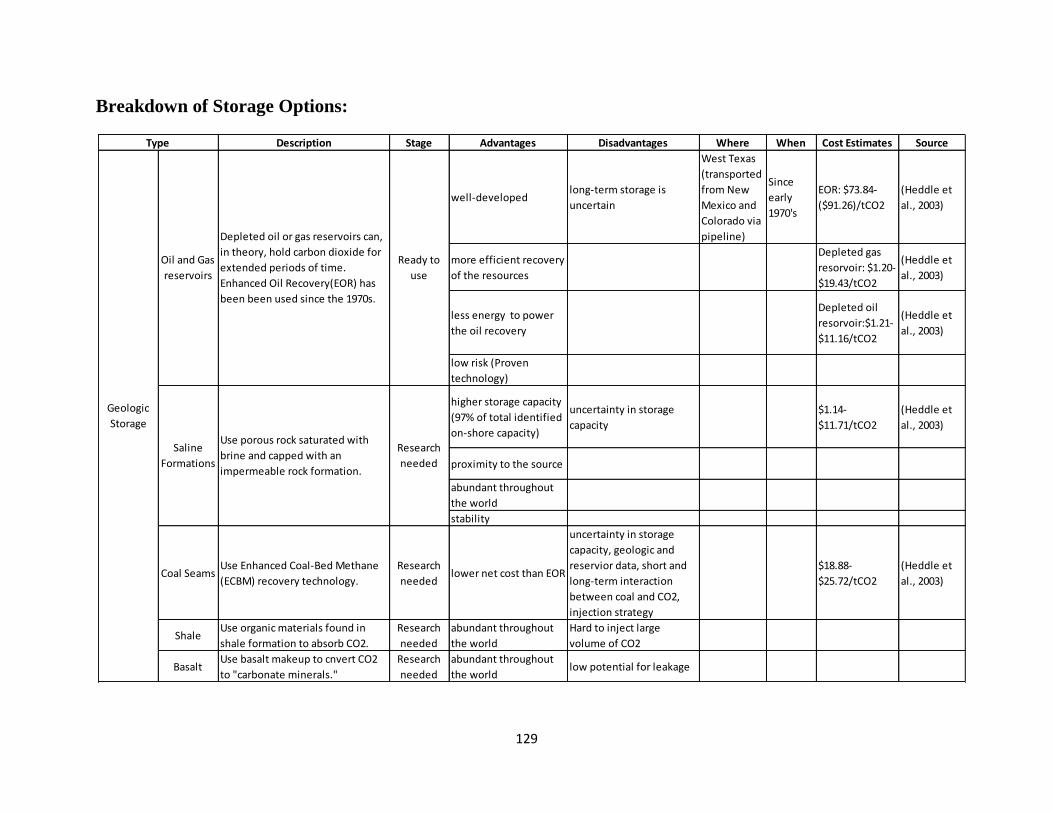
129
Breakdown of Storage Options:
Description Stage Advantages Disadvantages Where When Cost Estimates Source
well-developedlong-term storage is
uncertain
West Texas
(transported
from New
Mexico and
Colorado via
pipeline)
Since
early
1970's
EOR: $73.84-
($91.26)/tCO2
(Heddle et
al., 2003)
more efficient recovery
of the resources
Depleted gas
resorvoir: $1.20-
$19.43/tCO2
(Heddle et
al., 2003)
less energy to power
the oil recovery
Depleted oil
resorvoir:$1.21-
$11.16/tCO2
(Heddle et
al., 2003)
low risk (Proven
technology)
higher storage capacity
(97% of total identified
on-shore capacity)
uncertainty in storage
capacity
$1.14-
$11.71/tCO2
(Heddle et
al., 2003)
proximity to the source
abundant throughout
the world
stability
Coal SeamsUse Enhanced Coal-Bed Methane
(ECBM) recovery technology.
Research
neededlower net cost than EOR
uncertainty in storage
capacity, geologic and
reservior data, short and
long-term interaction
between coal and CO2,
injection strategy
$18.88-
$25.72/tCO2
(Heddle et
al., 2003)
Shale Use organic materials found in
shale formation to absorb CO2.
Research
needed
abundant throughout
the world
Hard to inject large
volume of CO2
BasaltUse basalt makeup to cnvert CO2
to "carbonate minerals."
Research
needed
abundant throughout
the worldlow potential for leakage
Type
Geologic
Storage
Depleted oil or gas reservoirs can,
in theory, hold carbon dioxide for
extended periods of time.
Enhanced Oil Recovery(EOR) has
been been used since the 1970s.
Research
needed
Oil and Gas
reservoirs
Ready to
use
Saline
Formations
Use porous rock saturated with
brine and capped with an
impermeable rock formation.

130

131
Appendix D: MIT Survey
Survey responses were used to answer the following questions:
What are public attitudes toward global warming and climate change mitigation
technologies?
What is the level of public understanding of global warming and carbon dioxide capture
and storage (or carbon sequestration)?
What is the effect of information (national energy usage and price data) on public
preference?
What lessons do the survey results suggest for public outreach campaigns?1
Information given to survey participants regarding the cost of various energy sources:
Using coal and natural gas, the typical family pays $1,200 per year for electricity.
Using all nuclear power would emit no carbon dioxide and would increase electricity cost
for families to $2,400 per year.
Using carbon sequestration along with coal and natural gas would reduce carbon dioxide
emissions by 90% and would also increase electricity costs to $2,400 per year.
Using renewable (solar and wind power) would increase annual electricity costs to
$4,000. 4
4 Curry, Tom, D M Reiner, S Ansolabehere, and H J Herzog. How Aware is the Public of Carbon Capture and
Storage? MIT Laboratory for Energy and the Environment, Cambridge, MA. Available at:
http://knowledge.fhwa.dot.gov/cops/italladdsup.nsf/7ec05a279f17ed79852569590071284c/f8c06c2680944
5cf85256fce0066add6/$FILE/Greenhouse%20gas%20public%20awareness%20survey.pdf Accessed 3
February 2010.
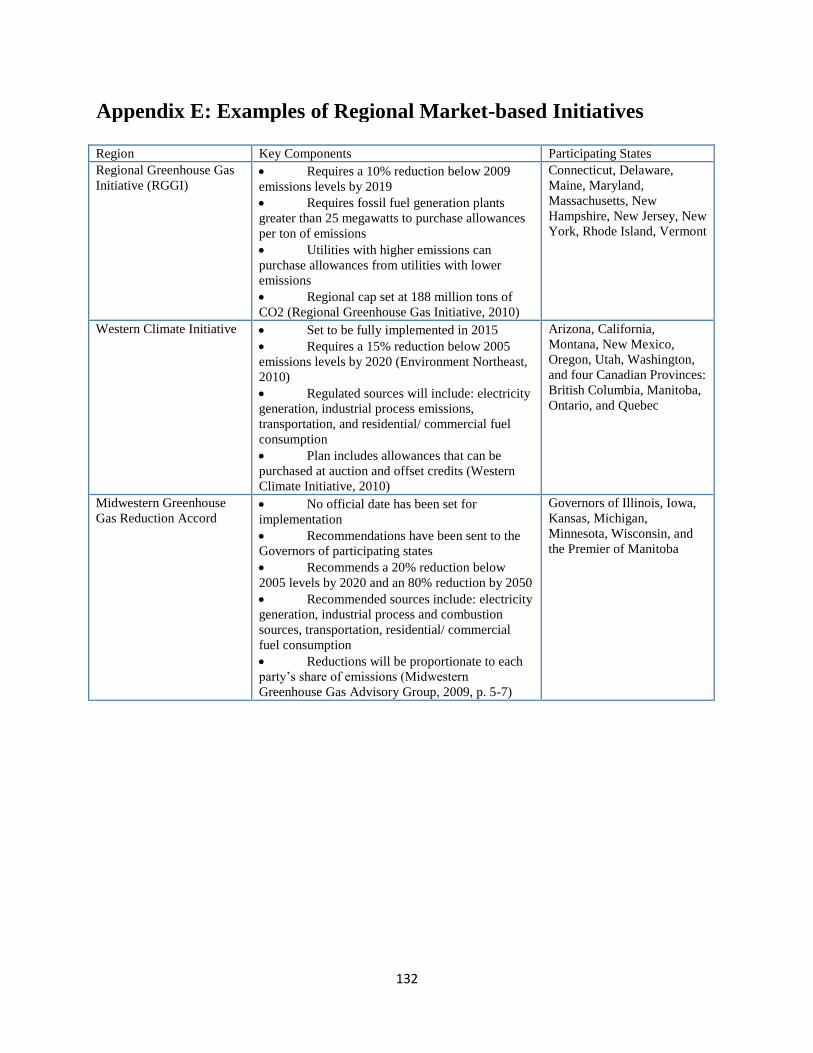
132
Region Key Components Participating States
Regional Greenhouse Gas
Initiative (RGGI) Requires a 10% reduction below 2009
emissions levels by 2019
Requires fossil fuel generation plants
greater than 25 megawatts to purchase allowances
per ton of emissions
Utilities with higher emissions can
purchase allowances from utilities with lower
emissions
Regional cap set at 188 million tons of
CO2 (Regional Greenhouse Gas Initiative, 2010)
Connecticut, Delaware,
Maine, Maryland,
Massachusetts, New
Hampshire, New Jersey, New
York, Rhode Island, Vermont
Western Climate Initiative Set to be fully implemented in 2015
Requires a 15% reduction below 2005
emissions levels by 2020 (Environment Northeast,
2010)
Regulated sources will include: electricity
generation, industrial process emissions,
transportation, and residential/ commercial fuel
consumption
Plan includes allowances that can be
purchased at auction and offset credits (Western
Climate Initiative, 2010)
Arizona, California,
Montana, New Mexico,
Oregon, Utah, Washington,
and four Canadian Provinces:
British Columbia, Manitoba,
Ontario, and Quebec
Midwestern Greenhouse
Gas Reduction Accord No official date has been set for
implementation
Recommendations have been sent to the
Governors of participating states
Recommends a 20% reduction below
2005 levels by 2020 and an 80% reduction by 2050
Recommended sources include: electricity
generation, industrial process and combustion
sources, transportation, residential/ commercial
fuel consumption
Reductions will be proportionate to each
party‟s share of emissions (Midwestern
Greenhouse Gas Advisory Group, 2009, p. 5-7)
Governors of Illinois, Iowa,
Kansas, Michigan,
Minnesota, Wisconsin, and
the Premier of Manitoba
Appendix E: Examples of Regional Market-based Initiatives
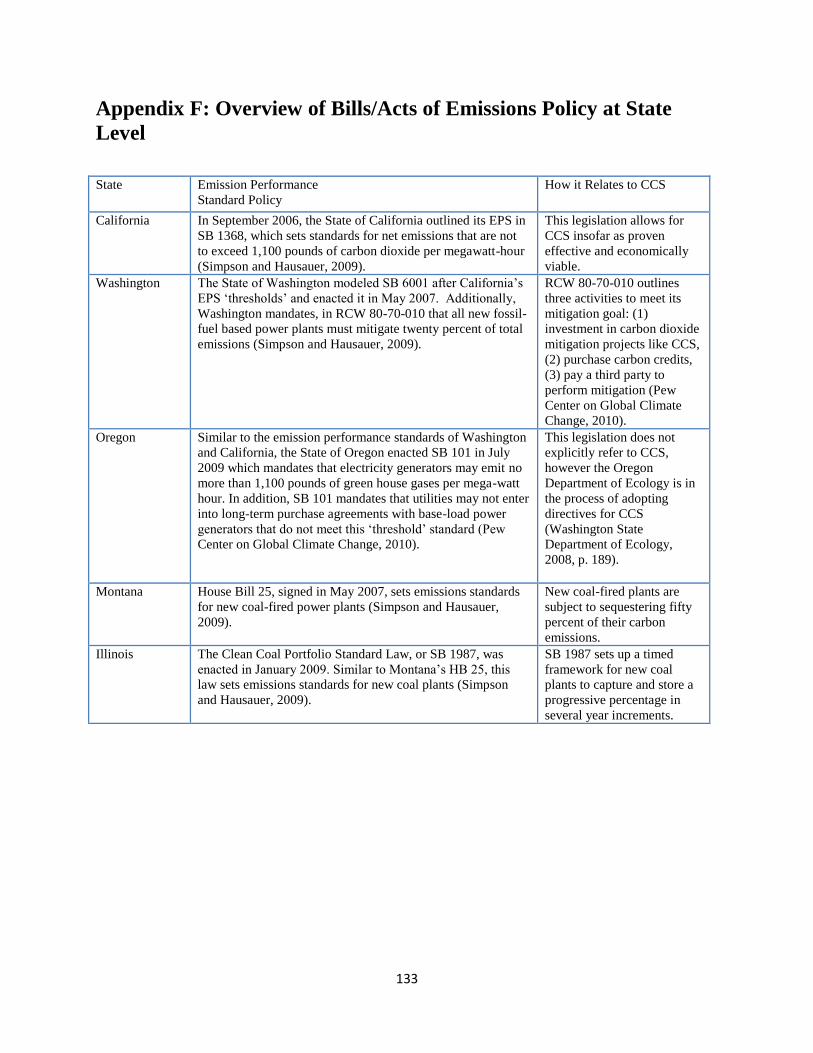
133
Appendix F: Overview of Bills/Acts of Emissions Policy at State
Level
State Emission Performance
Standard Policy
How it Relates to CCS
California In September 2006, the State of California outlined its EPS in
SB 1368, which sets standards for net emissions that are not
to exceed 1,100 pounds of carbon dioxide per megawatt-hour
(Simpson and Hausauer, 2009).
This legislation allows for
CCS insofar as proven
effective and economically
viable.
Washington The State of Washington modeled SB 6001 after California‟s
EPS „thresholds‟ and enacted it in May 2007. Additionally,
Washington mandates, in RCW 80-70-010 that all new fossil-
fuel based power plants must mitigate twenty percent of total
emissions (Simpson and Hausauer, 2009).
RCW 80-70-010 outlines
three activities to meet its
mitigation goal: (1)
investment in carbon dioxide
mitigation projects like CCS,
(2) purchase carbon credits,
(3) pay a third party to
perform mitigation (Pew
Center on Global Climate
Change, 2010).
Oregon Similar to the emission performance standards of Washington
and California, the State of Oregon enacted SB 101 in July
2009 which mandates that electricity generators may emit no
more than 1,100 pounds of green house gases per mega-watt
hour. In addition, SB 101 mandates that utilities may not enter
into long-term purchase agreements with base-load power
generators that do not meet this „threshold‟ standard (Pew
Center on Global Climate Change, 2010).
This legislation does not
explicitly refer to CCS,
however the Oregon
Department of Ecology is in
the process of adopting
directives for CCS
(Washington State
Department of Ecology,
2008, p. 189).
Montana House Bill 25, signed in May 2007, sets emissions standards
for new coal-fired power plants (Simpson and Hausauer,
2009).
New coal-fired plants are
subject to sequestering fifty
percent of their carbon
emissions.
Illinois The Clean Coal Portfolio Standard Law, or SB 1987, was
enacted in January 2009. Similar to Montana‟s HB 25, this
law sets emissions standards for new coal plants (Simpson
and Hausauer, 2009).
SB 1987 sets up a timed
framework for new coal
plants to capture and store a
progressive percentage in
several year increments.

134
Bills/Acts Dealing with CCS at State Level
State Description of Financial Incentive Type of Financial
Incentive
Colorado Colorado Statute 40-2-123 of 2006 designates
unspecified monies from the Colorado Clean Energy
Fund to financial support for development of CCS
(Cowart, et al, 2008, p. 33)
Grant
Minnesota The 2009 statute 216B.1694 Innovative Energy Project
offers grants to eligible projects in the amount of $2
million a year for five years (Minnesota Office of the
Reviser of Statutes, 2010)
Grant
New Mexico The 2007 Advanced Energy Tax Credit SB994 bill is
the first tax credit in the U.S. to cover CCS technology,
providing up to 6% of plant‟s expenditures – not to
exceed $60 million – for development and construction
(Goldstein, 2007)
Tax Credit
Overview of Bills/Acts Dealing with CCS at Federal Level
Act/Bill Name How it Relates to
Financial Incentives for CCS
Date Introduced/Passed
ARRA
Rep. Obey (D-WI) Appropriates $3.4 billion to DOE for industrial carbon
capture projects (Congressional Research Service, 2009)
Introduced: January 2009
Passed: Yes (February 2009)
ACES
Rep. Waxman (D-
CA)
Provides direct payments to coal-fired power plants for
carbon dioxide storage
Provides funding for 10 CCS demonstration projects not
to exceed $1 billion/year (World Resources Institute, 2010)
Time segmented breakdown of coal plant permissions:
2009 – 2015: Coal power generation plants lose financial
assistance for failure to retrofit within 5 years
2015 – 2020: Coal power generation plants lose financial
assistance if CCS technologies were not implemented
2020: Coal power generation plants must use CCS
(CLEAR Act Side-by-Side with ACES, 2010, p. 4)
Introduced: May 2009
Passed: House (June 2009)
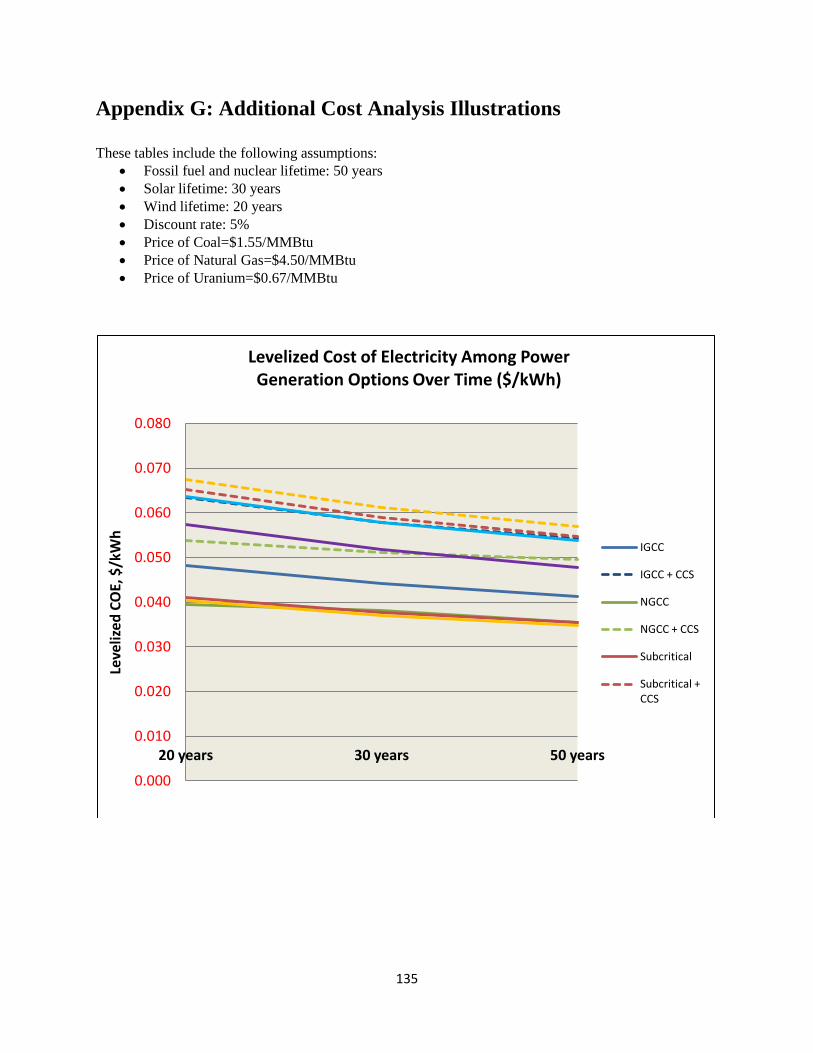
135
Appendix G: Additional Cost Analysis Illustrations
These tables include the following assumptions:
Fossil fuel and nuclear lifetime: 50 years
Solar lifetime: 30 years
Wind lifetime: 20 years
Discount rate: 5%
Price of Coal=$1.55/MMBtu
Price of Natural Gas=$4.50/MMBtu
Price of Uranium=$0.67/MMBtu
0.080
0.070
0.060
0.050
0.040
0.030
0.020
0.010
0.000
20 years 30 years 50 years
Leve
lized
CO
E, $
/kW
h
Levelized Cost of Electricity Among Power Generation Options Over Time ($/kWh)
IGCC
IGCC + CCS
NGCC
NGCC + CCS
Subcritical
Subcritical + CCS
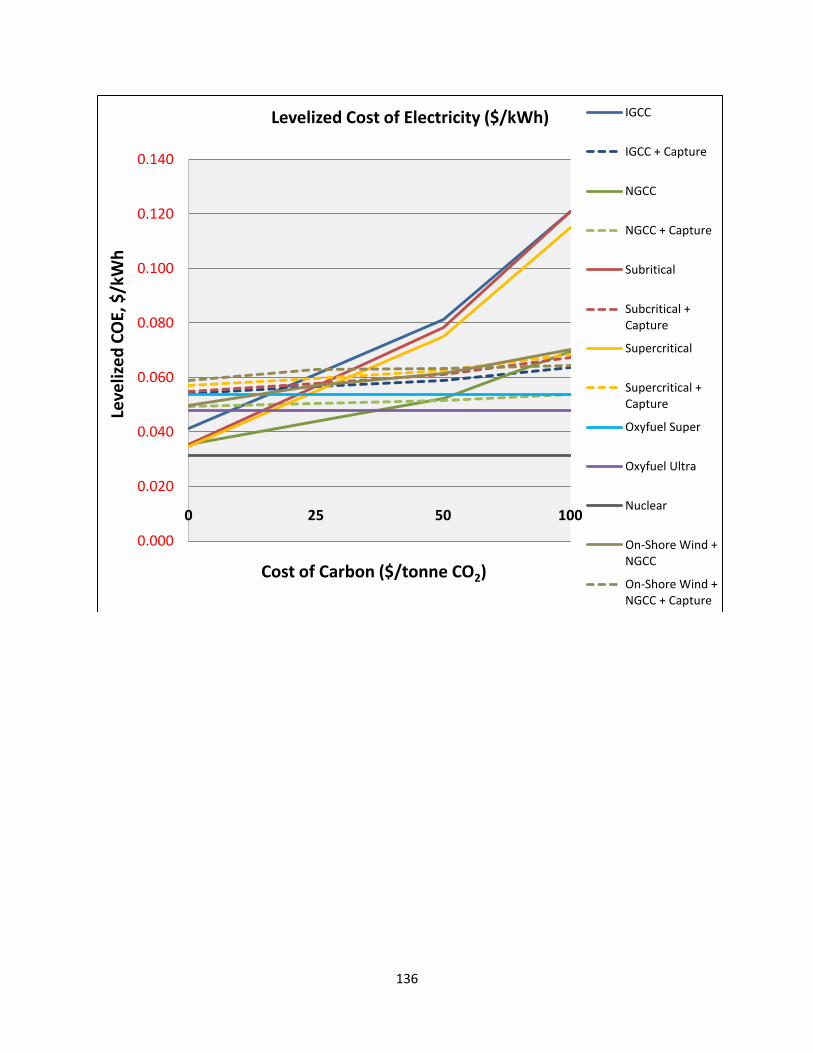
136
0.140
0.120
0.100
0.080
0.060
0.040
0.020
0.000
0 25 50 100
Leve
lize
d C
OE,
$/k
Wh
Cost of Carbon ($/tonne CO2)
Levelized Cost of Electricity ($/kWh) IGCC
IGCC + Capture
NGCC
NGCC + Capture
Subritical
Subcritical + Capture
Supercritical
Supercritical + Capture
Oxyfuel Super
Oxyfuel Ultra
Nuclear
On-Shore Wind + NGCC
On-Shore Wind + NGCC + Capture
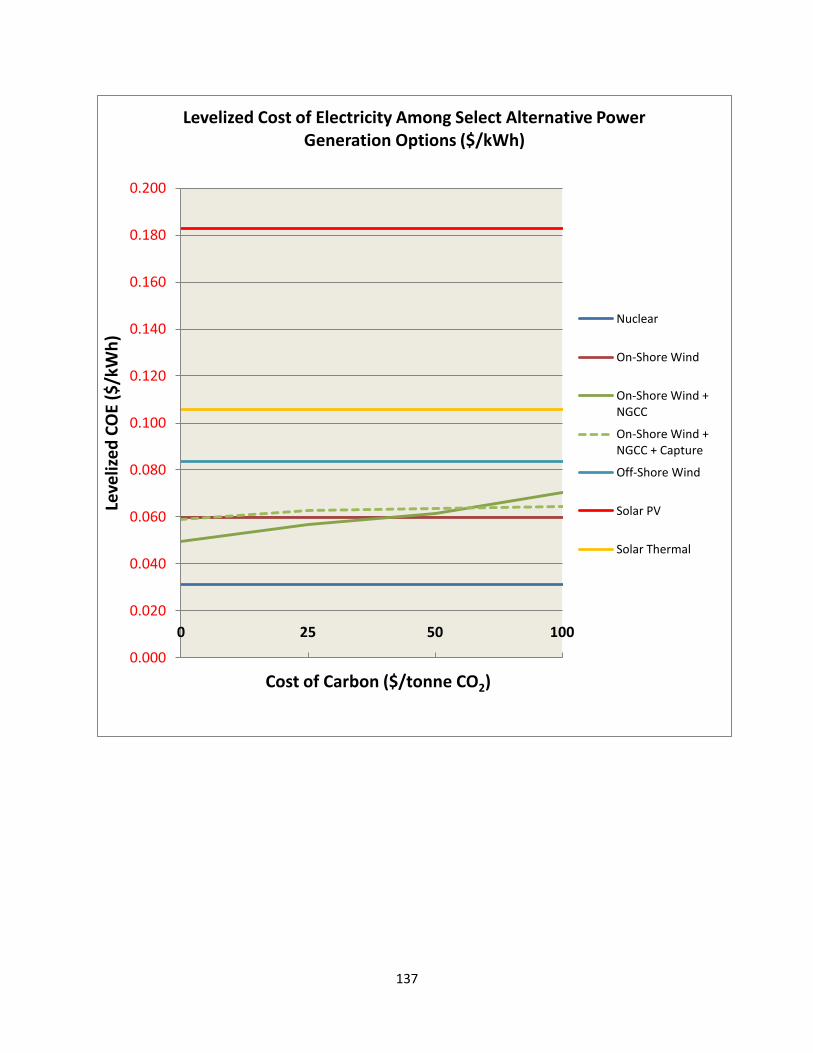
137
0.200
0.180
0.160
0.140
0.120
0.100
0.080
0.060
0.040
0.020
0.000
0 25 50 100
Leve
lize
d C
OE
($/k
Wh
)
Cost of Carbon ($/tonne CO2)
Levelized Cost of Electricity Among Select Alternative Power Generation Options ($/kWh)
Nuclear
On-Shore Wind
On-Shore Wind + NGCC
On-Shore Wind + NGCC + Capture
Off-Shore Wind
Solar PV
Solar Thermal
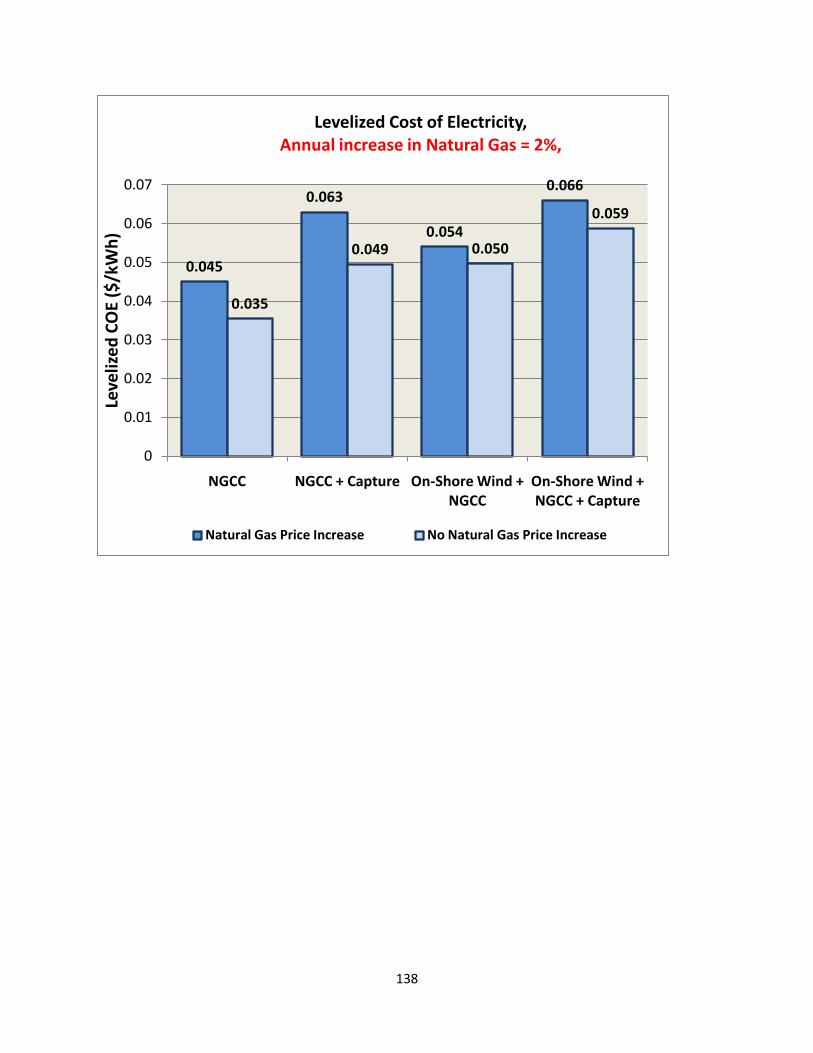
138
0.045
0.063
0.054
0.066
0.035
0.049 0.050
0.059
0
0.01
0.02
0.03
0.04
0.05
0.06
0.07
NGCC NGCC + Capture On-Shore Wind + NGCC
On-Shore Wind + NGCC + Capture
Leve
lize
d C
OE
($/k
Wh
)Levelized Cost of Electricity,
Annual increase in Natural Gas = 2%,
Natural Gas Price Increase No Natural Gas Price Increase
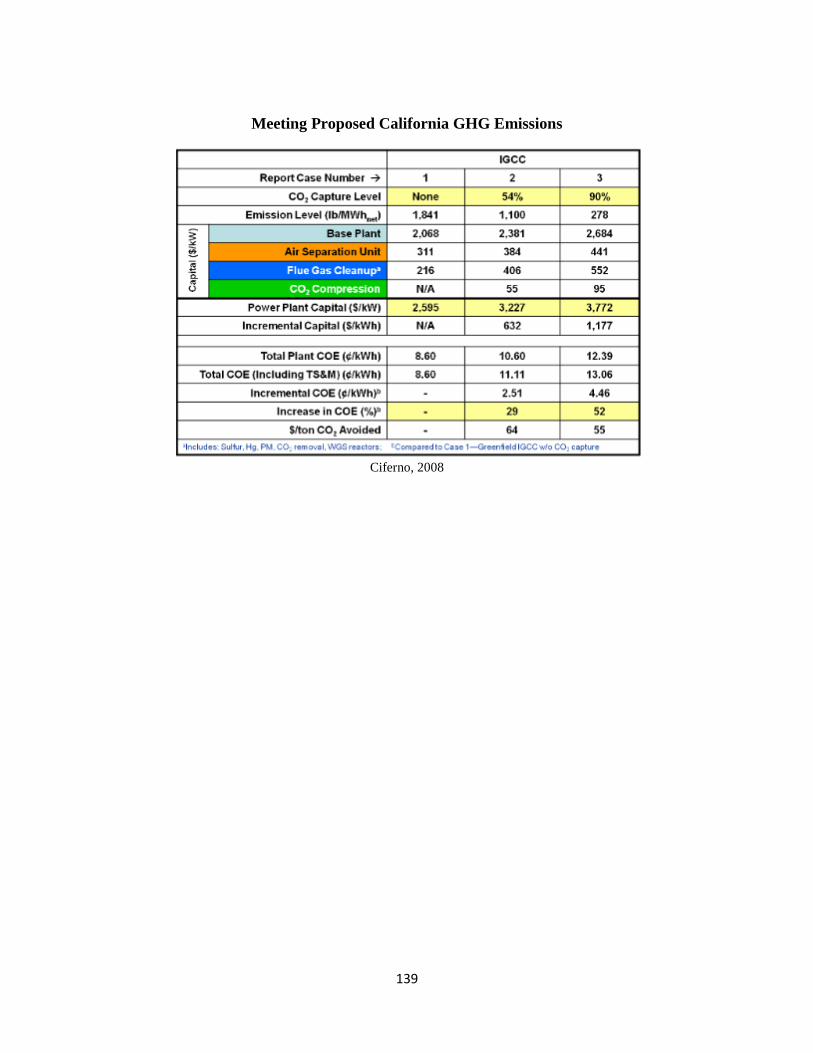
139
Meeting Proposed California GHG Emissions
Ciferno, 2008
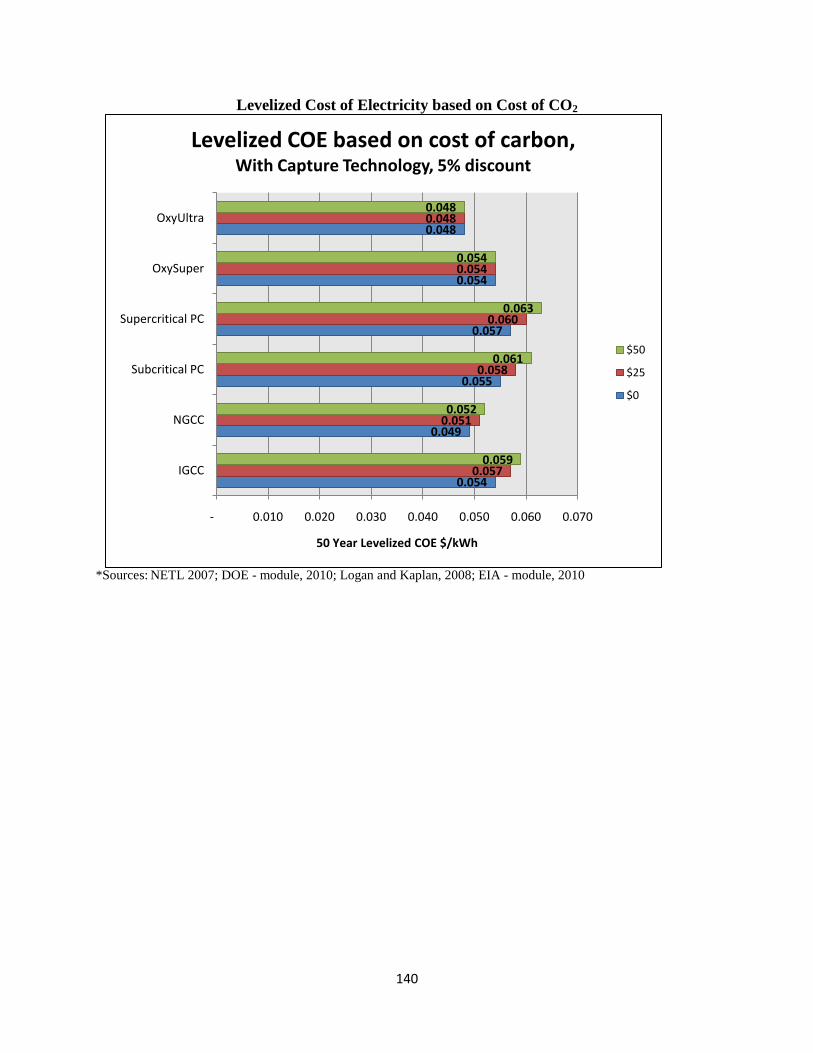
140
Levelized Cost of Electricity based on Cost of CO2
*Sources:
NETL 2007; DOE - module, 2010; Logan and Kaplan, 2008; EIA - module, 2010
0.054
0.049
0.055
0.057
0.054
0.048
0.057
0.051
0.058
0.060
0.054
0.048
0.059
0.052
0.061
0.063
0.054
0.048
- 0.010 0.020 0.030 0.040 0.050 0.060 0.070
IGCC
NGCC
Subcritical PC
Supercritical PC
OxySuper
OxyUltra
50 Year Levelized COE $/kWh
Levelized COE based on cost of carbon,With Capture Technology, 5% discount
$50
$25
$0