Embed Size (px)
Citation preview

Carbon and Nitrogen Isotopes from Top Predator AminoAcids Reveal Rapidly Shifting Ocean Biochemistry in theOuter California CurrentRocio I. Ruiz-Cooley1*, Paul L. Koch2, Paul C. Fiedler3, Matthew D. McCarthy1
1 Ocean Sciences Department, University of California Santa Cruz, Santa Cruz, California, United States of America, 2 Earth and Planetary Sciences Department, University
of California Santa Cruz, Santa Cruz, California, United States of America, 3 Southwest Fisheries Science Center, National Marine Fisheries Service, National Oceanic and
Atmospheric Administration, La Jolla, California, United States of America
Abstract
Climatic variation alters biochemical and ecological processes, but it is difficult both to quantify the magnitude of suchchanges, and to differentiate long-term shifts from inter-annual variability. Here, we simultaneously quantify decade-scaleisotopic variability at the lowest and highest trophic positions in the offshore California Current System (CCS) by measuringd15N and d13C values of amino acids in a top predator, the sperm whale (Physeter macrocephalus). Using a time series of skintissue samples as a biological archive, isotopic records from individual amino acids (AAs) can reveal the proximate factorsdriving a temporal decline we observed in bulk isotope values (a decline of $1 %) by decoupling changes in primaryproducer isotope values from those linked to the trophic position of this toothed whale. A continuous decline in baseline(i.e., primary producer) d15N and d13C values was observed from 1993 to 2005 (a decrease of ,4% for d15N source-AAs and3% for d13C essential-AAs), while the trophic position of whales was variable over time and it did not exhibit directionaltrends. The baseline d15N and d13C shifts suggest rapid ongoing changes in the carbon and nitrogen biogeochemicalcycling in the offshore CCS, potentially occurring at faster rates than long-term shifts observed elsewhere in the Pacific.While the mechanisms forcing these biogeochemical shifts remain to be determined, our data suggest possible links tonatural climate variability, and also corresponding shifts in surface nutrient availability. Our study demonstrates that isotopicanalysis of individual amino acids from a top marine mammal predator can be a powerful new approach to reconstructingtemporal variation in both biochemical cycling and trophic structure.
Citation: Ruiz-Cooley RI, Koch PL, Fiedler PC, McCarthy MD (2014) Carbon and Nitrogen Isotopes from Top Predator Amino Acids Reveal Rapidly Shifting OceanBiochemistry in the Outer California Current. PLoS ONE 9(10): e110355. doi:10.1371/journal.pone.0110355
Editor: Wei-Chun Chin, University of California, Merced, United States of America
Received June 23, 2014; Accepted September 20, 2014; Published October 17, 2014
This is an open-access article, free of all copyright, and may be freely reproduced, distributed, transmitted, modified, built upon, or otherwise used by anyone forany lawful purpose. The work is made available under the Creative Commons CC0 public domain dedication.
Data Availability: The authors confirm that all data underlying the findings are fully available without restriction. All relevant data are within the paper and itsSupporting Information files.
Funding: Funding was provided by Marine Mammal and Turtle Division, Southwest Fisheries Science Center-National Oceanographic AtmosphericAdministration for data collection and isotope analysis and National Science Foundation(Division of Ocean Sciences(OCE)-1155728, and OCE-0623622) for analysisof amino acids and data. Funding for Open Access provided by the University of California, Santa Cruz, Open Access Fund. The funders had no role in studydesign, data collection and analysis, decision to publish, or preparation of the manuscript.
Competing Interests: The authors have declared that no competing interests exist.
* Email: [email protected]
Introduction
The California Current System (CCS) contains one of the five
major coastal upwelling zones in the world’s oceans, and hosts a
great diversity and abundance of marine life [1]. The oceano-
graphic state of this large ecosystem is dynamic. Natural climate
variation and anthropogenic stressors alter biochemical cycling,
food web dynamics, and the fitness of species [1–3]. Known
interannual and decadal changes are related both to the El Nino-
Southern Oscillation (ENSO) and to basin-scale processes
associated with the Pacific Decadal Oscillation (PDO) [1].The
latter, is an index of interannual sea surface temperature (SST)
variability in the North Pacific, that is related to physical and
biochemical variations and influences community changes in
plankton, fish and other taxa [4,5]. In addition to this natural
variability, humans have perturbed climate by increasing atmo-
spheric CO2 concentrations, which have increased ocean temper-
atures, water column stratification, hypoxia, and water column
anoxia and have decreased surface ocean pH [6,7]. These
environmental factors may negatively impact populations of
species, increasing mortality and decreasing reproductive success
due to habitat compression and metabolic constraints [8]. Other
anthropogenic pressures, such as intensive fisheries and the past
whaling industry (which principally targeted sperm whales,
Physeter macrocephalus) might have triggered top-down effects.
Given the lack of detailed proxy records to trace simultaneously
biochemical baselines and length of food webs, assessing the extent
to which biogeochemical cycling and community structure in
pelagic ecosystems have changed over the past century is difficult,
as is attributing change to natural cycles versus anthropogenic
disturbances.
The isotopic values of marine primary producers are sensitive to
environmental variation, such as change in temperature, and CO2
or nitrate concentrations, as well as biological differences such as
physiology and growth rate [9–11]. Hence, the carbon and
nitrogen isotope values (d13C and d15N values, respectively) of
PLOS ONE | www.plosone.org 1 October 2014 | Volume 9 | Issue 10 | e110355
primary producers, also known as ‘‘baseline isotope values’’, vary
in space and time as a function of these fundamental ecosystem
properties [12]. Baseline isotope values are then integrated into
consumers’ tissues through diet, typically with metabolic fraction-
ation leading to enrichment in the heavier isotope (especially 15N)
in consumers [13,14]. Therefore, isotopic values of marine
consumers could be used to reconstruct changes in diet and/or
ecosystem biogeochemistry. The d13C and d15N values from a
resident animal can potentially provide an integrated record of the
biogeochemical characteristics of its habitat, as well as its trophic
position [15]. However, because multiple factors influence the bulk
d13C and d 15N values ultimately recorded in consumer tissues, it is
often difficult to disentangle the effects of changing trophic
position from shifts in baseline values.
Studies in different ocean basins have shown that bulk tissue
d13C or d15N values have declined over the last century, but
interpretations of these trends have varied widely [16]. For
example, declining bulk tissue d 15N values are sometimes
attributed to a drop in consumer trophic level [17,18] or to
baseline shifts due to either changes in foraging zone or
biogeochemical cycles [16]. In particular, two recent studies in
the Pacific have revealed pervasive declines in d 15N values in the
offshore Central Pacific [18] and North Pacific Subtropical Gyre
(NPSG) [19], but offered diametrically opposing interpretations as
to underlying mechanism. In the highly productive CCS, despite
accumulating evidence for oceanographic changes since the 1950s
[2], isotopic data from plankton species have been contradictory.
Bulk d 15N values from three zooplakton species have exhibited no
long-term trends, whereas data for a specialized zooplankton
feeder decreased by approximately 3% [20,21]. Declines in d13C
values over the 20th century are expected due to the combustion of
fossil fuels (i.e., the Suess effect), and have been observed in many
records and ecosystems [22]. However, variability in the
magnitude and timing of d13C declines has suggested that other
factors, such as declining primary productivity, could also
contribute in some regions [16]. In the offshore CCS, there are
currently no d13C time series for organic or inorganic material.
Isotopic analysis of individual amino acids (AAs) can effectively
separate trophic effects from shifts in baseline isotope values
[23,24]. Regardless of an animal’s trophic position, the original
d15N and d13C values from primary producers are relatively well
preserved within the group of ‘source-AAs’ for nitrogen [25] and
the ‘essential-AAs’ for carbon [26]. In contrast, isotopic values
from the ‘trophic-AAs’ for nitrogen, and ‘non-essential-AAs’ for
carbon, undergo significant metabolic fractionation, and vary in
association with a consumer’s diet [23,24], tissue turnover rates,
and possibly metabolism [27]. Hence, isotopic analysis of amino
acids from apex marine mammal predators offers a unique
opportunity to simultaneously investigate temporal variation at the
lowest and highest trophic levels of their food web. Sperm whales
are top predators of the mesopelagic ocean. Mark-recapture
studies, morphology, and acoustic analysis indicate that female
sperm whales forage within the same oceanic region year round
[28]. Consequently, they can function as natural biological
samplers, broadly integrating biogeochemical information from
their home ecosystem. In this study, we use sperm whale skin as a
novel biological archive of time series data. Our data combine
bulk tissue and AA isotope analysis to examine temporal variation
in baseline values (reflecting ecosystem biogeochemistry) and
whale trophic position (indicating trophic structure) from offshore
waters of the California Current ecosystem.
Results and Discussion
Foraging zone of sperm whales sampled in CCSIn the CCS off the US west coast, sperm whales are found in
oceanic waters from California to Washington [29]. Their habitat
therefore excludes the coastal upwelling system that exhibits strong
latitudinal isotopic gradients [30]. Mitochondrial and nuclear
markers reveal that the CCS whales are an independent
population and a single genetic stock [31]. Our isotopic data
from skin biopsies (Figure 1) indicate that whales fed homo-
genously within the offshore northern and central CCS. First, the
variation in bulk isotope values (n = 18; SD = 1.2% for d13C and
1.2% for d15N) is similar to the variation observed in other sperm
whale populations that are considered to be resident (i.e., Gulf of
Mexico and Gulf of California, SD#0.8% for both d15N and d13C
[15]; SE Pacific, SD = 3.5% for d15N and 0.7% for d13C [32]). In
addition, the d15N values for phenylalanine (Phe; n = 12; mean
(SD) = 10.9% (0.9)) are relatively consistent with expected nitrate
and particulate organic matter d15N values from the oceanic
northern CCS (,6 to 10 %) [12], and also with published Phe
d15N values from muscle of the jumbo squid (Dosidicus gigas;potential prey of sperm whales) [33]. Phe d15N values are a proxy
for primary producer values [25] as they exhibit only minor 15N-
enrichment with trophic transfer [23]. In top predators (such as
sperm whales), this likely results in slightly higher Phe d15N values
versus baseline inorganic N sources. Lastly, because latitudinal
trends in the d15N values from predator source-AAs can indicate
their geographic residency [24,33], the lack of any latitudinal
variation in Phe d15N values (r 2 = 0; n = 12) strongly suggests that
the individual sperm whales sampled here were not foraging in
different localized regions, but rather foraged over a broad
latitudinal range within the northern and central CCS. While the
isotopic incorporation rate for extremely large animals like whales
is not well known, the thick skin of sperm whales likely integrates
information for at least three and possibly more than six months
prior to sampling [34]. Our data set encompasses information
mainly from the fall and winter, except for the samples collected in
2001 and 2003, which also integrate information from the
summer.
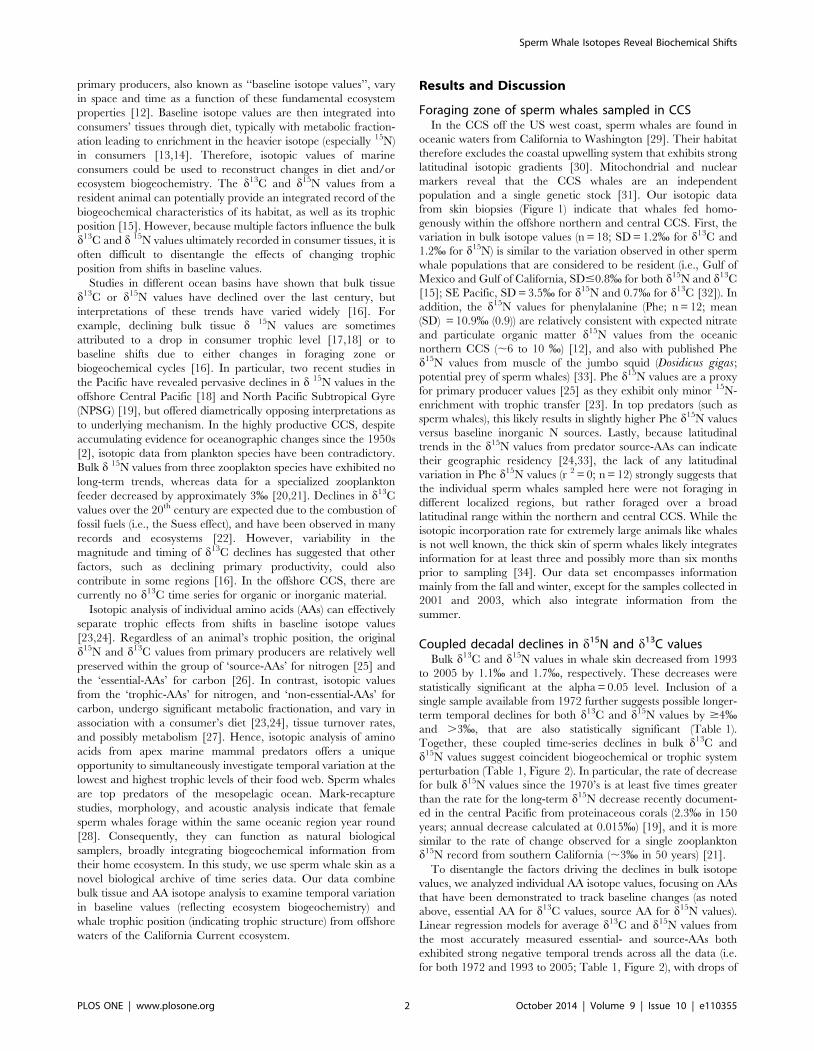
Coupled decadal declines in d15N and d13C valuesBulk d13C and d15N values in whale skin decreased from 1993
to 2005 by 1.1% and 1.7%, respectively. These decreases were
statistically significant at the alpha = 0.05 level. Inclusion of a
single sample available from 1972 further suggests possible longer-
term temporal declines for both d13C and d15N values by $4%and .3%, that are also statistically significant (Table 1).
Together, these coupled time-series declines in bulk d13C and
d15N values suggest coincident biogeochemical or trophic system
perturbation (Table 1, Figure 2). In particular, the rate of decrease
for bulk d15N values since the 1970’s is at least five times greater
than the rate for the long-term d15N decrease recently document-
ed in the central Pacific from proteinaceous corals (2.3% in 150
years; annual decrease calculated at 0.015%) [19], and it is more
similar to the rate of change observed for a single zooplankton
d15N record from southern California (,3% in 50 years) [21].
To disentangle the factors driving the declines in bulk isotope
values, we analyzed individual AA isotope values, focusing on AAs
that have been demonstrated to track baseline changes (as noted
above, essential AA for d13C values, source AA for d15N values).
Linear regression models for average d13C and d15N values from
the most accurately measured essential- and source-AAs both
exhibited strong negative temporal trends across all the data (i.e.
for both 1972 and 1993 to 2005; Table 1, Figure 2), with drops of
Sperm Whale Isotopes Reveal Biochemical Shifts
PLOS ONE | www.plosone.org 2 October 2014 | Volume 9 | Issue 10 | e110355

$3% and .4% respectively indicated by compound-specific
isotope data. Residuals for all regressions exhibited a random
pattern. In contrast, average d15N values for the trophic-AAs were
much variable, resulting in a lower r2, but overall they paralleled
the source-AA trend (Table 1, Figure 2A). These results are not
consistent with any significant drop in sperm whale trophic level as
the primary driver of decreases in bulk isotope ratios, and instead
strongly implicate coupled changes in baseline d15N and d13C
values.
These negative trends in baseline d15N and d13C values might
relate to changes in biochemical cycling, rates of primary
production, or primary producer species composition. In partic-
ular, the decline in average essential-AA d13C values (Figure 2B),
which are a direct proxy for primary producers, is far too high to
be explained solely by the Seuss effect (,0.2 % per decade since
1960 [35]), and it also coincides with the decline in average source-
AA d15N values. This suggests that the mechanism explaining a
drop in primary producer d15N values should be consistent with a
concurrent large decline in d13C values. One possiblity, which
would represent a direct analogy to changes in other ocean
regions, would be a shift towards more oligotrophic conditions for
the outer CCS. This explanation would be consistent with coupled
declines in both isotopes, linked to decreased primary production
and a shift in species composition that is typically associated with
warmer and more stratified ocean conditions [36]. Oligotrophy in
the world ocean is increasing due to climate shifts [37] and is
projected to continue increasing in the North Pacific [38]. Recent
isotopic records from deep sea proteinacous corals, for example,
provide strong support for such linked trends associated with
warming of the NPSG [39]. The nitrogen isotope record from
deep sea coral indicate that the long-term declines in baseline d15N
values are likely linked to progressive increases in seasonal gyre
extent, leading to steady increases in N contribution from
diazotrophy [19]. Therefore, an analogous explanation would
imply that oceanographic conditions in the offshore CCS region
(which have conditions more similar to the open ocean and
represent the base of sperm whales’ food web) might have shifted
toward more ‘‘gyre-like’’ conditions, driving baseline isotope
values toward those more typical of the oligotrophic open ocean.
However, to our knowledge, there is currently no evidence for
substantially increasing SST and diazotrophy in the CCS itself.
Instead, recent analyses suggest largely the opposite: overall, the
thermocline weakened and shoaled in the offshore CCS between
1950 and 1993 [7], possibly increasing nutrient availability in the
euphotic zone despite increased stratification [40]. Additionally,
the offshore CCS has cooled (not heated) since the early 1990s
(Figure 3), and this trend is also reflected in the present ‘‘cool’’
PDO regime. Furthermore, the generalization that global warm-
ing will universally increase stratification and thus decrease surface
nutrient supply has been recently challenged for some regions
including the CCS [41]. For example, one recent model projects
increases in nitrate supply and productivity in the CCS during the
21st century despite increases in stratification and limited change
in wind-driven upwelling [42]. In the southern CCS, coastal
surface nutrients have increased possibly linked to a general
shoaling of the nutricline [43]. In the Southern California Bight,
the most intensively monitored region of the CCS, nutrients in
source waters have also increased over the last three decades, but
the N:P and Si:N ratios were greatly reduced, possibly shifting
phytoplankton species composition and abundance [44]. Whether
or not these trends in nutrient dynamics extend to other regions of
the CCS is unclear, because the oceanographic state of this
ecosystem varies regionally [1,45].
In particular, shifts in offshore and onshore oceanographic
conditions appear to be decoupled. Coastal upwelling has recently
increased, as expected for enhanced alongshore winds [46], but
has decreased offshore where upwelling is driven by wind-stress
curl [47]. Since 1997, trends in satellite chlorophyll estimates, an
index of phytoplankton biomass, have been positive in coastal
upwelling waters but tend to be zero or negative in offshore waters
[48]. Together, this current evidence indicates cooling, but not
increases in productivity, in the offshore CCS concurrent with the
observed 1993–2006 trends in sperm whale d15N and d13C values.
Lower temperatures increase the solubility of CO2 and change the
fractionation associated with carbon fixation, often resulting in
lower phytoplankton d13C values [49]; lower temperatures might
have also changed phytoplankton growth and species composition.
If surface nitrate also increased along the outer CCS region
sampled by these whales, then the degree of nitrate utilization by
primary producers (and so their d15N values) could have also
changed, since phytoplankton preferentially assimilate 14NO32
[50]. In general, proportional nitrate utilization is lower where
surface NO32 concentrations are higher [50]. Therefore, lower
NO32 utilization during seasonal upwelling might also be
expected to depress the d15N values of primary producers,
propagating the 15N-depleted signal into food webs during their
most productive periods. At present, there simply are not enough
detailed data on nutrient concentrations and other oceanographic
factors in the outer CCS to deduce a mechanism. However, the
observed declining baseline values revealed by sperm whales do
indicate a recently progressive shift in primary producer dynamics,
likely associated with changes in SST, average state of surface
nutrients and/or primary production.
Figure 1. Sperm whales are distributed year-round in offshoredeep waters (,.150 km off the US west coast [29]). Skinsamples (#) from free-ranging sperm whales were collected togetherwith skin from stranded individuals. Tissue samples were used for bulk(in black) and amino acid (in red) stable isotope analysis.doi:10.1371/journal.pone.0110355.g001
Sperm Whale Isotopes Reveal Biochemical Shifts
PLOS ONE | www.plosone.org 3 October 2014 | Volume 9 | Issue 10 | e110355

Ta
ble
1.
Te
mp
ora
lva
riat
ion
ind
15N
andd
13C
valu
es
fro
mth
eo
ffsh
ore
Cal
ifo
rnia
Cu
rre
nt
Syst
em
insp
erm
wh
ale
skin
sam
ple
s.
Tim
ep
eri
od
Tra
cer
Lin
ea
rR
eg
ress
ion
nr2
p-v
alu
e
Iso
top
icsh
ift
(%)
An
nu
al
de
cre
ase
19
93
–2
00
5d
15N
Bu
lky
=3
02
–0
.14
3*
year
17
0.2
5,
0.0
51
.70
.14
Me
anSo
urc
e-A
Ay
=7
17
–0
.35
4*
year
11
0.5
2=
0.0
14
.20
.35
Me
anT
rop
hic
-AA
y=
31
1–
0.1
43
*ye
ar1
10
.12
.0
.05
1.7
19
72
–2
00
5d
15N
Bu
lky
=2
18
–0
.10
1*
year
18
0.3
7,
0.0
53
.30
.10
Me
anSo
urc
e-A
Ay
=2
98
–0
.14
5*
year
12
0.3
9,
0.0
54
.70
.14
Me
anT
rop
hic
-AA
y=
88
–0
.03
1*
year
12
0.0
3.
0.0
51
.0
19
93
–2
00
5d
13C
Bu
lky
=1
74
–0
.09
5*
year
17
0.2
4,
0.0
51
.10
.09
Me
anEs
sen
tial
-AA
y=
47
4–
0.2
50
*ye
ar8
0.6
2,
0.0
53
.00
.25
19
72
–2
00
5d
13C
Bu
lky
=2
42
–0
.12
9*
year
18
0.6
7,
0.0
14
.20
.12
Me
anEs
sen
tial
-AA
y=
18
4–
0.1
05
*ye
ar9
0.5
8,
0.0
53
.40
.10
For
me
anca
lcu
lati
on
s:So
urc
e-A
As
are
ph
en
ylal
anin
e,
gly
cin
e,
lysi
ne
,ty
rosi
ne
;T
rop
hic
-AA
:g
luta
mic
acid
,al
anin
e,
iso
leu
cin
e,
leu
cin
e,
pro
line
;Es
sen
tial
-AA
:p
he
nyl
alan
ine
,va
line
,le
uci
ne
.Is
oto
pic
shif
tsw
ere
calc
ula
ted
usi
ng
the
corr
esp
on
din
glin
ear
reg
ress
ion
eq
uat
ion
slis
ted
inth
ista
ble
.T
he
ann
ual
de
cre
ase
was
calc
ula
ted
for
shif
tsth
ate
xhib
ite
da
p-v
alu
e#
0.0
5.
do
i:10
.13
71
/jo
urn
al.p
on
e.0
11
03
55
.t0
01
Sperm Whale Isotopes Reveal Biochemical Shifts
PLOS ONE | www.plosone.org 4 October 2014 | Volume 9 | Issue 10 | e110355
Sperm Whale Isotopes Reveal Biochemical Shifts
PLOS ONE | www.plosone.org 5 October 2014 | Volume 9 | Issue 10 | e110355

Implications of Rapid Change for offshore CCSBiogeochemistry
Although our time series data are limited for both elements, the
compound-specific AA data identify a parallel decline in both
baseline d15N and d13C values in the outer CCS from 1992 to
2005, likely indicative of major recent shifts in biochemical cycling.
At the same time, however, the overall similarity in whale trophic
position signifies that the broad trophic structure is realtively
unaffected. We note that in comparison with the recent deep sea
coral data from the gyre offshore of this region [19], our data
suggest that both the rate and scale of biochemical change on the
CCS margin may be far greater than in the open Pacific Ocean.
The coral record from the NPSG indicates a fairly steady d15N
annual decrease of ,0.015% over the last 150 years with a total
drop of 2.3 % in exported primary production d15N values over
that period. In contrast, our molecular-level proxies for d15N
values at the base of the food chain (the source AAs) indicate more
rapid annual declines of 0.35 % since the 1990’s. The independent
molecular proxies for primary production d13C values (the
essential AAs) indicate relatively similar declines.
Together with the CCS observations discussed above, the
contrast with the NPSG coral data (while not directly comparable
in terms of time scale), suggests that despite the fact that baseline
d15N declines are observed in both data sets, different biogeo-
chemical mechanisms may underlie the changes in these very
different oceanographic regions. Climate variability likely affects
the biochemistry of ecosystems differently depending on the
oceanographic properties, microbial and phytoplankton commu-
nities, and species assemblages. In the eastern Pacific Ocean, the
structure of the pycnocline varies strongly among the known
biogeochemical provinces [51]. This likely influences geographic
variation in surface nutrient availability, and therefore stable
isotope ratios in POM, primary producers [12] and consumers
[14]. Temporal trends in pycnocline depth, SST, stratification,
and mixed layer depths also differ between these biogeochemical
provinces [40]. For example, while SST decreased overall since
1958 in many parts of the California Current, SST increased in
the easternmost southern subtropical gyre and equatorial Pacific
[40]. Ultimately, more detailed data that couple integrated
measures of ecosystem baseline with oceanographic state will be
required to understand the substantial biogeochemical changes
our data indicate.
Our work highlights that detailed time-series of biochemical
baseline and trophic structure records among different ecosystems
will be crucial to identify rapid ecosystem shifts in response to
climate change. In particular, in the face of uncertain coupling of
natural and anthropogenic climate forcing, understanding the
timing, extent and especially the mechanistic basis for baseline
shifts now represents an urgent challenge. However, despite many
efforts to unravel the linkage and feedback controls between the
carbon and nitrogen cycles, and the effect of their variability on
primary production and food-web dynamics, they are still not well
understood. This study has demonstrated the great potential in
coupling molecular isotopic tools with the unique bioarchive of
sperm whales (or other top predators), as sentinels of offshore
ecosystems. This may allow, for the first time, decoding of the
factors that underlie temporal trends in bulk isotopic records,
while simultaneosly monitoring changes at both the highest and
lowest trophic levels. We suggest that integrating this approach
with detailed oceanographic data will be a major new tool to
identify the effects of natural climate variability versus anthropo-
genic global warming on ecosystem biochemistry and primary
production. Elucidating such patterns from this and other ocean
margin regions, in particular their relationships with oceano-
graphic and climatic variations and shifts in primary production,
will be an essential part of the critical task of predicting future
trends in both ecosystem biochemistry and trophic dynamics.
Material and Methods
A total of 18 skin samples (Figure 1) were analyzed for bulk
stable isotope analysis. Skin tissue samples with enough material
(3.5 mg) were selected for CSIA-AA. Data from 12 samples were
obtained for individual AA d15N values, and 9 samples for d13C
values. The Southwest Fisheries Science Center/Pacific Islands
Figure 2. Time series of isotopic data from sperm whale skin. (A) d15N values from bulk skin, average source-AAs and average trophic- AAs (6SD); and (B) d13C values from bulk skin and average essential-AAs (6SD). Bulk isotope data are plotted with a square symbol (%), filled grey squaresindicate the samples that were also analyzed for amino acid stable isotope analysis. The corresponding linear regression equations are provided inTable 1, as are the amino acids included within each AA-group.doi:10.1371/journal.pone.0110355.g002
Figure 3. Time series data of sea surface temperature anomaly (SSTA) from the offshore California Current (inset map) and thePacific Decadal Oscillation (PDO). Monthly SSTA was computed in 0.5-deg fields from the Simple Ocean Data Assimilation version 2.2.4 reanalysis(http://coastwatch.pfeg.noaa.gov/erddap/griddap/hawaii_d90f_20ee_c4cb.html), and then averaged in the offshore area (the plot shows 61sd).Monthly SSTA (uC) and PDO values were smoothed with a 25-month lowess smooth. The linear fit is for 1992–2006 (red line, slope 20.044uC y-1).Sample periods are indicated along the time axis.doi:10.1371/journal.pone.0110355.g003
Sperm Whale Isotopes Reveal Biochemical Shifts
PLOS ONE | www.plosone.org 6 October 2014 | Volume 9 | Issue 10 | e110355

Fisheries Science Center Institutional Animal Care and Use
Committee (IACUC) approved the original animal work that
produced the samples. Sex was determined genetically using
qPCR sexing assay by the PRD-Genetic Lab at NOAA [52].
These samples consisted of 5 females, 2 males and 2 unidentified
individuals possibly corresponding to females or juvenile males.
Large adult males were not included. Bulk isotope values were
analyzed by continuous flow isotope ratio mass spectrometry
(IRMS; Thermo Finnigan) and standardized relative to Vienna-
Pee Belemnite (V-PDB) for carbon and atmospheric N2 for
nitrogen. Results are expressed in part per thousand (%) and
standard notation: dHX = [(Rsample/Rstandard)21]61000, where H
is the mass number of the heavy isotope, X is either C or N, and
Rsample and Rstandard are the ratio of 13C/12C or 15N/14N in the
sample and standard, respectively.
We hydrolyzed and prepared approximately 3.5 mg of skin as
well as a control (Cyanno; bacteria tissue) [53] to quantify d15N
values from source- and trophic-AAs and d13C values from
essential- and non-essential-AAs. All derivatives were injected with
an AA control, N-leucine, to verify accuracy during each run, and
analyzed via gas chromatography-IRMS to obtain d15N and d13C
values from individual AAs. Each sample was run 3–4 times to
maximize accuracy among chromatograms. The associated
analytical error among replicates was ,1.0 %. For all samples,
d15N values were obtained from a total of four source-AAs
(phenylalanine, glycine, lysine, tyrosine), and five trophic-AAs
(glutamic acid, alanine, isoleucine, leucine, proline) (Figure S1A).
For d13C values, the essential-AAs that we consistently determined
were phenylalanine, valine and leucine, and the non-essential-AA
were alanine, proline, aspatic acid, glutamic acid and tyrosine
(Figure S1B).
The relative pattern of AA d15N and d13C values was highly
consistent with past work from other organisms and tissues
[23,25,54]. We grouped data as source- or trophic-AAs for d15N
values, and essential- or non-essential-AAs for d13C values to
increase power in the analysis and evaluate temporal variation. We
calculated average values for each AA group and they are reported
in Table S1. Regression analyses were conducted to evaluate
linear relationship between time and each isotopic tracer for both
bulk and individual-AA d15N and d13C values (Table 1).
There was a weak correlation between average source-AA and
trophic-AA (r2 = 0.13; p = 0.67), indicating that trophic-AA d15N
values could not be predicted by the variability in source-AAs, and
vice versa. However, the correlation between average essential-
AA and non-essential-AA d13C values was moderate (r2 = 0.63,
p = 0.06). Since the controls on isotopic patterns for non-essential-
AA d13C values are complex and dependent on diet quality and
quantity, including de novo synthesis and routing of AAs from
diet-to-tissue, this group was not considered in the linear
regression analysis.
Supporting Information
Figure S1 Stable isotope values of individual aminoacids (AAs) in skin samples of sperm whales (Physetermacrocephalus). (A) Four d15N Source-AAs: phenylalanine
(phe), glycine (gly), lysine (lys), tyrosine (tyr), and five Trophic-AAs:
glutamic acid (glx), alanine (ala), isoleucine (ile), leucine (leu),
proline (Pro); and (B) Three d13C essential-AAs: phe, leu, and
valine (val).
(TIF)
Table S1 Average values and one standard deviations(SD) were calculated for Source-AAs (phenylalanine,glycine, lysine, tyrosine), Trophic-AAs (glutamic acid,alanine, isoleucine, leucine, proline) and Essential-AAs(phenylalanine, valine, leucine).
(DOCX)
Acknowledgments
We thank L. T. Ballance, J. Barlow, K. Robertson (SWFSC/NMFS/
NOAA) and J. Calambokidis (Cascadia Research) for facilitating the use of
tissues samples, and the genetic SWFSC lab for molecular whale sex
identification.
Author Contributions
Conceived and designed the experiments: RIRC MDM. Performed the
experiments: RIRC MDM. Analyzed the data: RIRC PCF. Contributed
reagents/materials/analysis tools: MDM. Contributed to the writing of the
manuscript: RIRC PLK PCF MDM.
References
1. Checkley JDM, Barth JA (2009) Patterns and processes in the California Current
System. Prog Oceanogr 83: 49–64.
2. Bograd SJ, William JS, Barlow J, Booth A, Brodeur RD, et al. (2010) Status and
trends of the California Current region, 2003–2008. PICES Special Publication.
106–141 p.
3. McGowan JA, Bograd SJ, Lynn RJ, Miller AJ (2003) The biological response to
the 1977 regime shift in the California Current. Deep Sea Res II 50: 2567–2582.
4. Brinton E, Townsend A (2003) Decadal variability in abundances of the
dominant euphausiid species in southern sectors of the California Current. Deep
Sea Res II 50: 2449–2472.
5. Chavez FP, Ryan J, Lluch-Cota SE, Niquen CM (2003) From anchovies to
sardines and back: Multidecadal change in the Pacific Ocean. Science 299: 217–
221.
6. Chan F, Barth JA, Lubchenco J, Kirincich A, Weeks H, et al. (2008) Emergence
of anoxia in the California Current Large Marine Ecosystem. Science 319: 920.
7. Palacios DM, Bograd SJ, Mendelssohn R, Schwing FB (2004) Long-term and
seasonal trends in stratification in the California Current, 1950–1993. J Geophy
Res 109: C10016.
8. Bograd SJ, Castro CG, Di Lorenzo E, Palacios DM, Bailey H, et al. (2008)
Oxygen declines and the shoaling of the hypoxic boundary in the California
Current. Geophys Res Lett 35: L12607.
9. Farrell JW, Pedersen TF, Calvert SE, Nielsen B (1995) Glacial-interglacial
changes in nutrient utilization in the equatorial Pacific Ocean. Nature 377: 514–
517.
10. Rau GH, Sweeney RE, Kaplan IR (1982) Plankton 13C:12C ratio changes with
latitude: differences between northern and southern oceans. Deep Sea Res 29:
1035–1039.
11. Goericke R, Fry B (1994) Variations of marine plankton d13C with latitude,
temperature, and dissolved CO2 in the World Ocean. Global Biogeochem Cy 8:
85–90.
12. Somes CJ, Schmittner A, Galbraith ED, Lehmann MF, Altabet MA, et al. (2010)
Simulating the global distribution of nitrogen isotopes in the ocean. Global
Biogeochem Cy 24.
13. Peterson BJ, Fry B (1987) Stable Isotopes in Ecosystem Studies. Annu Rev Ecol
Evol Syst 18: 293–320.
14. Ruiz-Cooley RI, Gerrodette T (2012) Tracking large-scale latitudinal patterns of
d13C and d15N along the eastern Pacific using epi-mesopelagic squid as
indicators. Ecosphere 3: 63.
15. Ruiz-Cooley R, Engelhaupt D, Ortega-Ortiz J (2012) Contrasting C and N
isotope ratios from sperm whale skin and squid between the Gulf of Mexico and
Gulf of California: effect of habitat. Mar Biol: 1–14.
16. Schell DM (2001) Carbon isotope ratio variations in Bering Sea biota: The role
of anthropogenic carbon dioxide. Limnol Oceanogr Methods 46: 999–1000.
17. Emslie SD, Patterson WP (2007) Abrupt recent shift in d13C and d15N values in
Adelie penguin eggshell in Antarctica. Proc Natl Acad Sci USA 104: 11666–
11669.
18. Wiley AE, Ostrom PH, Welch AJ, Fleischer RC, Gandhi H, et al. (2013)
Millennial-scale isotope records from a wide-ranging predator show evidence of
recent human impact to oceanic food webs. Proc Natl Acad Sci USA 110: 8972–
8977.
19. Sherwood OA, Guilderson TP, Batista FC, Schiff JT, McCarthy MD (2013)
Increasing subtropical North Pacific Ocean nitrogen fixation since the Little Ice
Age. Nature 505: 78–81.
Sperm Whale Isotopes Reveal Biochemical Shifts
PLOS ONE | www.plosone.org 7 October 2014 | Volume 9 | Issue 10 | e110355

20. Rau GH, Ohman MD, Pierrot-Bults A (2003) Linking nitrogen dynamics to
climate variability off central California: a 51 year record based on 15N/14N in
CalCOFI zooplankton. Deep Sea Res Part II 50: 2431–2447.
21. Ohman MD, Rau GH, Hull PM (2012) Multi-decadal variations in stable N
isotopes of California Current zooplankton. Deep Sea Res Part I 60: 46–55.
22. Sonnerup RE, Quay PD, McNichol AP, Bullister JL, Westby TA, et al. (1999)
Reconstructing the oceanic 13C Suess Effect. Global Biogeochem Cy 13: 857–
872.
23. Chikaraishi Y, Ogawa NO, Kashiyama Y, Takano Y, Suga H, et al. (2009)
Determination of aquatic food-web structure based on compound-specific
nitrogen isotopic composition of amino acids. Limnol Oceanogr Methods 7 740–
750.
24. Popp BN, Graham BS, Olson RJ, Hannides CCS, Lott MJ, et al. (2007) Insight
into the trophic ecology of yellowfin tuna, Thunnus albacares, from compound-
specific nitrogen isotope analysis of proteinaceous amino acids. In: Dawson TD,
Siegwolf, R. T W., editor. Stable isotopes as indicators of ecological change.
New York: Elsevier Academic Press. pp. 173–190.
25. McClelland JW, Montoya JP (2002) Trophic relationships and the nitrogen
isotopic composition of amino acids in plankton. Ecology 83: 2173–2180.
26. O’Brien DM, Fogel ML, Boggs CL (2002) Renewable and nonrenewable
resources: Amino acid turnover and allocation to reproduction in Lepidoptera.
Proc Natl Acad Sci USA 99: 4413–4418.
27. Germain LR, Koch PL, Harvey JT, McCarthy MD (2013) Nitrogen isotopic
fractionation of amino acids in harbor seals (Phoca vitulina): Differential trophic
enrichment factors based on ammonia vs. urea excretion. Mar Ecol Prog Ser
482: 265–277.
28. Default S, Whitehead H, Dillon M (1999) An examination of the current
knowledge on the stock structure of sperm whales (Physeter macrocephalus)worldwide. J Cetac Res Manage 1: 1–10.
29. Carretta JV, Forney KA, Lowry MS, Barlow J, Baker J, et al. (2010) U.S. Pacific
marine mammal stock assessments: 2009. California, USA. 336 p.
30. Sigman DM, Casciotti KL (2001) Nitrogen Isotopes in the Ocean. In: Editor-in-
Chief: John HS, editor. Encyclopedia of Ocean Sciences. Oxford: Academic
Press. pp. 1884–1894.
31. Mesnick SL, Taylor BL, Archer FI, Martien KK, TreviNO SE, et al. (2011)
Sperm whale population structure in the eastern and central North Pacific
inferred by the use of single-nucleotide polymorphisms, microsatellites and
mitochondrial DNA. Mol Ecol Resour 11: 278–298.
32. Marcoux M, Whitehead H, Rendell L (2007) Sperm whale feeding variation by
location, year, social group and clan: Evidence from stable isotopes. Mar Ecol
Prog Ser 333: 309–314.
33. Ruiz-Cooley RI, Ballance LT, McCarthy MD (2013) Range expansion of the
jumbo squid in the NE Pacific: d15N decrypts multiple origins, migration and
habitat Use. PLoS ONE 8: e59651.
34. Ruiz-Cooley RI, Gendron D, Aguiniga S, Mesnick S, Carriquiry JD (2004)
Trophic relationships between sperm whales and jumbo squid using stable
isotopes of C and N. Mar Ecol Prog Ser 277: 275–283.
35. Francey RJ, Allison CE, Etheridge DM, Trudinger CM, Enting IG, et al. (1999)
A 1000-year high precision record of d13C in atmospheric CO2. Tellus B 51:
170–193.
36. Karl DM, Bidigare RR, Letelier RM (2001) Long-term changes in plankton
community structure and productivity in the North Pacific Subtropical Gyre:The domain shift hypothesis. Deep Sea Res Part II 48: 1449–1470.
37. Polovina JJ, Howell EA, Abecassis M (2008) Ocean’s least productive waters are
expanding. Geophys Res Lett 35: L03618.38. Polovina JJ, Dunne JP, Woodworth PA, Howell EA (2011) Projected expansion
of the subtropical biome and contraction of the temperate and equatorialupwelling biomes in the North Pacific under global warming. ICES J Mar Sci
68: 986–995.
39. Guilderson TP, McCarthy MD, Dunbar RB, Englebrecht A, Roark EB (2013)Late Holocene variations in Pacific surface circulation and biogeochemistry
inferred from proteinaceous deep-sea corals. Biogeosciences 10: 3925–3949.40. Fiedler PC, Mendelssohn R, Palacios DM, Bograd SJ (2012) Pycnocline
Variations in the Eastern Tropical and North Pacific, 1958–2008. J Climate 26:583–599.
41. Dave AC, Lozier MS (2013) Examining the global record of interannual
variability in stratification and marine productivity in the low-latitude and mid-latitude ocean. J Geophysi Res-Oceans 118: 3114–3127.
42. Rykaczewski RR, Dunne JP (2010) Enhanced nutrient supply to the CaliforniaCurrent Ecosystem with global warming and increased stratification in an earth
system model. Geophys Res Lett 37: L21606.
43. Aksnes DL, Ohman MD (2009) Multi-decadal shoaling of the euphotic zone inthe southern sector of the California Current System. Limonol Oceanogr 54:
1272–1281.44. Bograd SJ, Buil MP, Lorenzo ED, Castro CG, Schroeder ID, et al. (2014)
Changes in source waters to the Southern California Bight. Deep Sea R Part II.Available: http://dx.doi.org/10.1016/j.dsr2.2014.04.009.
45. McClatchie S (2013) Regional fisheries oceanography of the California Current
System: the CalCOFI Program. Dordrecht: Springer. 253 p.46. Garcıa-Reyes M, Largier J (2010) Observations of increased wind-driven coastal
upwelling off central California. J Geophy Res 115.47. Jacox MG, Moore AM, Edwards CA, Fiechter J (2014) Spatially resolved
upwelling in the California Current System and its connections to climate
variability. Geophysl Res Lett 41: 3189–3196.48. Kahru M, Kudela RM, Manzano-Sarabia M, Greg Mitchell B (2012) Trends in
the surface chlorophyll of the California Current: Merging data from multipleocean color satellites. Deep Sea Res Part II 77–80: 89–98.
49. Rau GH, Takahashi T, Marais DJD (1989) Latitudinal variations in planktond13C: implications for CO2 and productivity in past oceans. Nature 341: 516–
518.
50. Wada E, Hattori A (1991) Nitrogen in the sea: forms, abundances, and rateprocesses. Boca Raton: CRC Press. 208 p.
51. Longhurst AR (2007) Ecological Geography of the Sea; Press. EA, editor. 542 p.52. Morin PA, Nestler A, Rubio-Cisneros NT, Robertson KM, Mesnick S (2005)
Interfamilial characterization of a region of the ZFX and ZFY genes facilitates
sex determination in cetaceans and other mammals. Mol Ecol 14: 3275–3286.53. McCarthy MD, Benner R, Lee C, Fogel M (2007) Amino acid nitrogen isotopic
fractionation patterns as indicators of heterotrophy in plankton, particulate, anddissolved organic matter. Geochim Cosmochim Acta 71: 4727–4744.
54. Sherwood OA, Lehmann MF, Schubert CJ, Scott DB, McCarthy MD (2011)Nutrient regime shift in the western North Atlantic indicated by compound-
specific d15N of deep-sea gorgonian corals. Proc Natl Acad Sci USA.
Sperm Whale Isotopes Reveal Biochemical Shifts
PLOS ONE | www.plosone.org 8 October 2014 | Volume 9 | Issue 10 | e110355