Embed Size (px)
Citation preview
Engineering and Laboratory Branch Monitoring and Laboratory Division
Method 428
DETERMINATION OF POLYCHLORINATED DIBENZO-P-DIOXIN (PCDD), POLYCHLORINATED DIBENZOFURAN (PCDF),
AND POLYCHLORINATED BIPHENYLE EMISSIONS FROM STATIONARY SOURCES
Adopted: March 23, 1988 Amended: September 12, 1990
ERRATA
This errata page identifies corrections that have been made to Table 8 subsequent to the ARB adoption of the method. Table 8 listed five incorrect standards. These errors were corrected to make Table 8 consistent with Tables 3, 5 and 9 which list the correct standards intended for use in the method. The corrections to Table 8 are described below.
(1) Page M428-?
1.1 Table 8, Column 2
(1) The internal standard for quantitating the surrogate standard, 13C-1,2,3,4,6,7,8-HpCDF, by low resolution mass spectrometry (LRMS) has been changed from 13C-1,2,3,4,6,7,8-HpCDF to 13C-1,2,3,4,6,7,8-HpCDD.
(2) The internal standard for quantitating the recovery standard, 13C-1,2,3,4,7,8-HxCDD, by LRMS has been changed from 13C12-1,2,3,4,7,8-HxCDD to 13C-1,2,3,6,7,8-HxCDD.
(2) Page M428-?
2.1 Table 8 (cont.), Column 2
(1) The internal standard for quantitating the HpCDF in a sample by high resolution mass spectrometry (HRMS) has been changed from 13C-1,2,3,4,6,7,8-HpCDD to 13C-1,2,3,4,7,8,9-HpCDF.
(2) The internal standard for quantitating the surrogate standard, 13C-1,2,3,4,6,7,8-HpCDF has been changed from 13C-1,2,3,4,6,7,8-HpCDF to 13C-1,2,3,4,7,8,9-HpCDF.
(3) The internal standard for quantitating the 13C12-1,2,3,4,7,8-HxCDD recovery standard by HRMS has been changed from 13C12-1,2,3,4,7,8-HxCDD to 13C-1,2,3,6,7,8-HxCDD.
ERRATA
This errata page identifies corrections that have been made to Figure 1 subsequent to the ARBadoption of Method 428. The inclined manometers were drawn incorrectly in Figure 1 (theschematic of the sampling train). This error has been corrected in the revised Figure 1 shownbelow.
TABLE OF CONTENTS
1 INTRODUCTION
1.1 APPLICABILITY
1.2 PRINCIPLE
1.3 DEFINITIONS AND ABBREVIATIONS
1.3.1 Homologue 1.3.2 Congener 1.3.3 PCDDs and PCDFs 1.3.4 PCB 1.3.5 Internal Standard 1.3.6 Surrogate Standard 1.3.7 Recovery Standard 1.3.8 Relative Response Factor 1.3.9 Performance Standard 1.3.10 Performance Evaluation Sample 1.3.11 Quality Control (QC) Check Sample 1.3.12 Executive Officer
1.4 MINIMUM DETECTION LIMITS
1.5 INTERFERENCES
2 SAMPLE COLLECTION
2.1 SAMPLING RUNS, TIME, AND VOLUME
2.1.1 Sampling Runs 2.1.2 Sampling Time 2.1.3 Sample Volume
2.2 SAMPLING TRAIN
2.2.1 Probe Nozzle 2.2.2 Probe 2.2.3 Sample Transfer Line 2.2.4 Filter Holder 2.2.5 Preseparator 2.2.6 Condenser 2.2.7 Sorbent Module
M428 Page 3
2.2.8 Impinger Train 2.2.9 Silica Gel Cartridge 2.2.10 Pitot Tube 2.2.11 Differential Pressure Gauge 2.2.12 Metering System 2.2.13 Barometer 2.2.14 Gas Density Determination Equipment 2.2.15 Filter Heating System
2.3 SAMPLING MATERIALS AND REAGENTS
2.3.1 Filters 2.3.2 Sorbents 2.3.2.1 XAD-2 Cleaning Procedure 2.3.2.2 Storage of Cleaned Resin 2.3.2.3 QC Contamination Check of XAD-2 Resin 2.3.2.4 Silica Gel 2.3.3 Water 2.3.4 Crushed Ice 2.3.5 Glass Wool
2.4 SAMPLING PROCEDURE
2.4.1 Pretest Preparation 2.4.2 Preliminary Determinations 2.4.3 2.4.4 2.4.5 2.4.6 2.4.6.1 2.4.6.2 2.4.6.3 2.4.6.4 2.4.7 2.4.8
2.5
2.5.1 2.5.2 2.5.3 2.5.4 2.5.5 2.5.6
Cleaning Glassware for Sampling Preparation of Amberlite XAD-2 Sorbent Trap Preparation of Collection Train Leak Check Procedures
Pretest Leak Check Leak Checks During Sample Run Post Test Leak Check Correcting for Excessive Leakage Rates
Train OperationCalculation of Percent Isokinetic
CALIBRATION
Probe NozzlePitot TubeMetering SystemTemperature GaugesLeak Check Metering SystemBarometer
M428 Page 4
2.6 QUALITY ASSURANCE/QUALITY CONTROL
2.6.1 Blank Train 2.6.2 Spiked PCDD/PCDF Sampling Trains
2.7 CALCULATIONS
2.7.1 Nomenclature 2.7.2 Average Dry Gas Meter Temperature
and Average Orifice Pressure Drop 2.7.3 Dry Gas Volume 2.7.4 Conversion Factors 2.7.5 Isokinetic Variation 2.7.5.1 Calculation from Raw Data 2.7.5.2 Calculation from Intermediate Values
2.8 ACCEPTABLE RESULTS
3 SAMPLE RECOVERY
3.1 CLEANING OF GLASSWARE FOR SAMPLE RECOVERY
3.2 SAMPLE RECOVERY APPARATUS
3.2.1 Probe Nozzle Brush 3.2.2 Wash Bottles 3.2.3 Glass Sample Storage Containers 3.2.4 Filter Storage Containers 3.2.5 Graduated Cylinder and/or Balance 3.2.6 Storage Containers 3.2.7 Funnel and Rubber Policeman 3.2.8 Funnel 3.2.9 Ground Glass Caps or Hexane Rinsed Aluminum Foil 3.2.10 Aluminum Foil
3.3 SAMPLE RECOVERY REAGENTS
3.3.1 Water 3.3.2 Acetone 3.3.3 Hexane 3.3.4 Benzene 3.3.5 Toluene 3.3.6 Methyl Alcohol 3.3.7 Methylene Chloride
M428 Page 5
3.4 SAMPLE RECOVERY PROCEDURE
3.4.1 Container No.1 3.4.2 Sorbent Modules 3.4.3 Cyclone Catch 3.4.4 Sample Container No.2 3.4.5 Sample Container No.3 3.4.6 Sample Container No.4 3.4.7 Sample Container No.5
M428 Page 6
STATIONARY SOURCE TEST METHOD ARB Method 428
Determination of Polychlorinated Dibenzo-p-dioxin (PCDD), Polychlorinated Dibenzofuran (PCDF), and Polychlorinated Biphenyl
Emissions from Stationary Sources
1 INTRODUCTION
1.1 Applicability
This method applies to the determination of polychlorinated dibenzo-p-dioxins (PCDD), polychlorinated dibenzofurans (PCDF) and polychlorinated biphenyls (PCB) in emissions from stationary sources at nanogram to picogram levels, but the sensitivity which can ultimately be achieved for a given sample will depend upon the types and concentrations of other chemical compounds in the sample, as well as the original sample size and instrument sensitivity.
This method can be used to determine PCDD/PCDF alone, PCB alone, or both PCDD/PCDF and PCB.
The method is restricted to use only by or under the supervision of analysts experienced in the use of capillary column gas chromatography/mass spectrometry and skilled in the interpretation of mess spectra.
Because of the extreme toxicity of these compounds, the analyst must take necessary precautions to prevent exposure to himself or to others of materials known or believed to contain PCDD, PCDF or PCB.
Any modification of this method beyond those expressly permitted shall be considered a major modification subject to approval by the Executive Officer.
1.2 Principle
Particulate and gaseous phase PCDD, PCDF and PCB are extracted isokinetically from the stack and collected on XAD-2 resin, in the impingers or in upstream sampling train components. Only the total amounts of each target PCDD, PCDF or PCB analyte in the stack emissions can be determined with this method. It has not been demonstrated that the partitioning in the different parts of the sampling train is representative of the partitioning in the stack gas sample for particulate and gaseous PCDD, PCDF and PCB.
Isotopically labelled internal standards are added to all samples in known quantities before matrix-specific extraction of the sample with appropriate organic solvents. If both PCDD/PCDF and PCB are to be determined, it is necessary after extraction to split the sample for two different preliminary fractionation and cleanup procedures. The
M428 Page 7
constituents in each of the processed extracts are separated with high resolution capillary column gas chromatography (HRGC) and identified and measured with low resolution, electron ionization mass spectrometry (LRMS). High resolution mass spectrometry (HRMS) is an alternative method that may be used only for detection of PCDDs and PCDFs.
The method presented here is intended to determine:
a) the total concentration of the isomers of several chlorinated classes of PCDD/PCDF (that is, total tetra-, penta-, hexa-, hepta-, and octachlorinated dibenzo-p-dioxins and dibenzofurans)
b) tetra through octa CDD and CDF isomers chlorinated in the 2,3,7,8 positions
c) identify and measure PCB as isomer groups (i.e., by level of chlorination) in samples containing PCB as single congeners or as complex mixtures.
The target analytes are listed in Table 1.
Various performance criteria are specified herein which the analytical data must satisfy to ensure the quality of the data. These represent minimum criteria which must be incorporated into any program in which PCDD, PCDF, and PCB are determined in emissions from stationary sources.
M428 Page 8
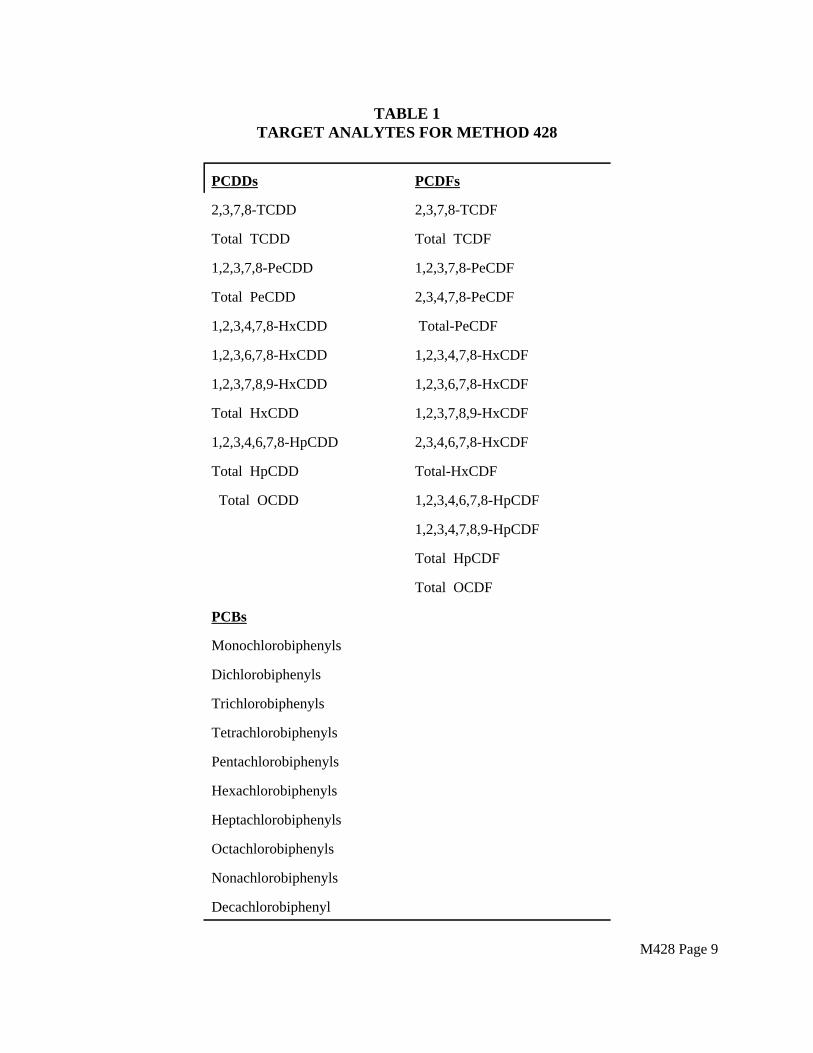
TABLE 1TARGET ANALYTES FOR METHOD 428
PCDDs PCDFs
2,3,7,8-TCDD 2,3,7,8-TCDF
Total TCDD Total TCDF
1,2,3,7,8-PeCDD 1,2,3,7,8-PeCDF
Total PeCDD 2,3,4,7,8-PeCDF
1,2,3,4,7,8-HxCDD Total-PeCDF
1,2,3,6,7,8-HxCDD 1,2,3,4,7,8-HxCDF
1,2,3,7,8,9-HxCDD 1,2,3,6,7,8-HxCDF
Total HxCDD 1,2,3,7,8,9-HxCDF
1,2,3,4,6,7,8-HpCDD 2,3,4,6,7,8-HxCDF
Total HpCDD Total-HxCDF
Total OCDD 1,2,3,4,6,7,8-HpCDF
1,2,3,4,7,8,9-HpCDF
Total HpCDF
Total OCDF
PCBs
Monochlorobiphenyls
Dichlorobiphenyls
Trichlorobiphenyls
Tetrachlorobiphenyls
Pentachlorobiphenyls
Hexachlorobiphenyls
Heptachlorobiphenyls
Octachlorobiphenyls
Nonachlorobiphenyls
Decachlorobiphenyl
M428 Page 9
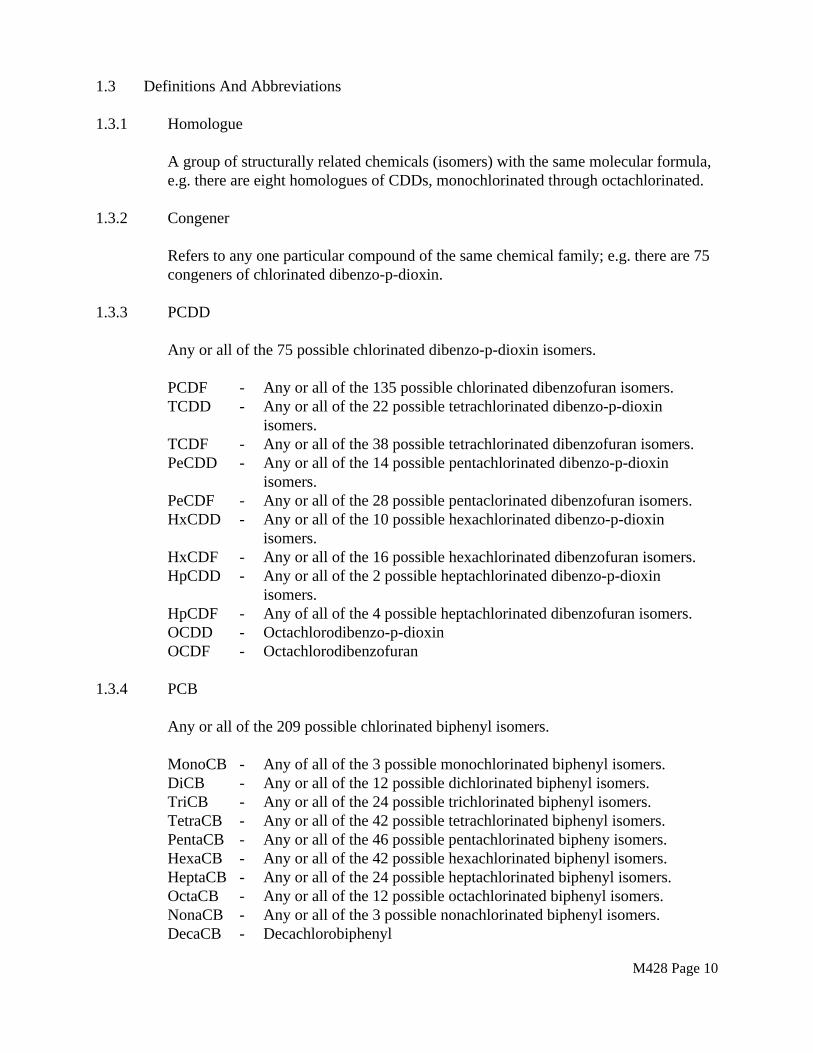
1.3 Definitions And Abbreviations
1.3.1 Homologue
A group of structurally related chemicals (isomers) with the same molecular formula, e.g. there are eight homologues of CDDs, monochlorinated through octachlorinated.
1.3.2 Congener
Refers to any one particular compound of the same chemical family; e.g. there are 75 congeners of chlorinated dibenzo-p-dioxin.
1.3.3 PCDD
Any or all of the 75 possible chlorinated dibenzo-p-dioxin isomers.
PCDF TCDD
--
Any or all of the 135 possible chlorinated dibenzofuran isomers. Any or all of the 22 possible tetrachlorinated dibenzo-p-dioxin isomers.
TCDF PeCDD
--
Any or all of the 38 possible tetrachlorinated dibenzofuran isomers. Any or all of the 14 possible pentachlorinated dibenzo-p-dioxin isomers.
PeCDF HxCDD
--
Any or all of the 28 possible pentaclorinated dibenzofuran isomers. Any or all of the 10 possible hexachlorinated dibenzo-p-dioxin isomers.
HxCDF HpCDD
--
Any or all of the 16 possible hexachlorinated dibenzofuran isomers. Any or all of the 2 possible heptachlorinated dibenzo-p-dioxin isomers.
HpCDF OCDD OCDF
---
Any of all of the 4 possible heptachlorinated dibenzofuran isomers. Octachlorodibenzo-p-dioxin Octachlorodibenzofuran
1.3.4 PCB
Any or all of the 209 possible chlorinated biphenyl isomers.
MonoCB - Any of all of the 3 possible monochlorinated biphenyl isomers. DiCB - Any or all of the 12 possible dichlorinated biphenyl isomers. TriCB - Any or all of the 24 possible trichlorinated biphenyl isomers. TetraCB - Any or all of the 42 possible tetrachlorinated biphenyl isomers. PentaCB - Any or all of the 46 possible pentachlorinated bipheny isomers. HexaCB - Any or all of the 42 possible hexachlorinated biphenyl isomers. HeptaCB - Any or all of the 24 possible heptachlorinated biphenyl isomers. OctaCB - Any or all of the 12 possible octachlorinated biphenyl isomers. NonaCB - Any or all of the 3 possible nonachlorinated biphenyl isomers. DecaCB - Decachlorobiphenyl
M428 Page 10
Specific Isomers
Any of the abbreviations cited above may be modified to designate a specific isomer by indicating the exact positions (carbon atoms) where chlorines are located within the molecule. For example, 2,3,7,8-TCDD refers to only one of the 22 possible TCDD isomers - that isomer which is chlorinated in the 2,3,7,8-position of the dibenzo-p-dioxin ring structure.
1.3.5 Internal Standard
A component which is added to every sample and is present in the same concentration in every blank, quality control sample, and concentration calibration solution. It is added to the sample before extraction and is used to measure the concentration of the analyte and surrogate compound. The internal standard recovery serves as an indicator of the overall performance of the analysis.
1.3.6 Surrogate Standard
A component added in a known amount to the XAD-2 resin of the sampling train, and allowed to equilibrate with the matrix before the gaseous emissions are sampled. Its measured concentration in the extract is an indication of the collection and recovery efficiency of the method. The surrogate standard has to be a component that can be completely resolved, is not present in the sample, and does not have any interference effects, for example, a 13C- or 37C1-labeled PCDD or PCDF.
1.3.7 Recovery Standard
A known amount of component added to the sample immediately before injection. 13C12- 1,2,3,4-TCDD is used as the recovery standard for TCDD and TCDF internal standards. The response of the internal standards relative to the recovery standard is used to estimate the overall recovery of the internal standards.
1.3.8 Relative Response Factor
The response of the mass spectrometer to a known amount of an analyte relative to a known amount of an internal standard.
1.3.9 Performance Standard
A mixture of known amounts of selected standard compounds; it is used to demonstrate continued acceptable performance of the GC/MS system.
M428 Page 11
1.3.10 Performance Evaluation Sample
A sample prepared by EPA or other laboratories containing known concentrations of method analytes that has been analyzed by multiple laboratories to determine statistically the accuracy and precision that can be expected when a method is performed by a competent analyst. Analyte concentrations are unknown to the analyst.
1.3.11 Quality Control (QC) Check Sample
A sample containing known concentrations of method analytes that is analyzed by a laboratory to demonstrate that it can obtain acceptable identifications and measurements with procedures to be used to analyze field samples containing the same or similar analytes. Analyte concentrations are known by the analyst. The QC check sample should be prepared by a laboratory other than the laboratory performing analysis.
1.3.12 Executive Officer
The term Executive Officer as used in this document shall mean the Executive Officer or Air Pollution Control Officer of the state or local air pollution control agency at whose request the test is conducted, or his or her authorized representative.
1.4 Minimum Detection Limits
Target detection limits are listed below for the tetra- through octachlorinated PCDD and PCDF homologues, and the mono through decachlorinated biphenyls. These detection limits apply to the determination of both PCDD/PCDF and PCB from a single sampling run.
M428 Page 12
TABLE 2TARGET DETECTION LIMITS
LRMS HRMS
PCDD/PCDF pg/sample pg/sample
TCDD/TCDF 2000 200
PeCDD/PeCDF 4000 400
HxCDD/HxCDF 4000 400
HpCDD/HpCDF 4000 400
OCDD/OCDF 6000 600
PCB FFg/sample
Monochlorobiphenyl 0.1
Dichlorobiphenyl 0.1
Trichlorobiphenyl 0.1
Tetrachlorobiphenyl 0.2
Pentachlorobiphenyl 0.2
Hexachlorobiphenyl 0.2
Heptachlorobiphenyl 0.4
Octachlorobipheynyl 0.4
Nonachlorobiphenyl 1.0
Decachlorobiphenyl 1.0
1.5 Interferences
1.5.1 Method interferences may be caused by contaminants in solvents, reagents, glassware, and other sample processing hardware that lead to discrete artifacts and/or elevated backgrounds at the ions monitored. All of these materials must be routinely demonstrated to be free from interferences under the conditions of the analysis by running laboratory reagent blanks as described in Section 7.1.
M428 Page 13
1.5.2 The use of high purity reagents and solvents helps to minimize interference problems. Purification of solvents by distillation in all-glass systems may be required.
1.5.3 Matrix interferences may be caused by contaminants that are co-extracted from the sample. The extent of matrix interferences may vary considerably with the source being sampled. PCDDs, PCDFs, and PCBs are often associated with other interfering chlorinated compounds which are at concentrations several orders of magnitude higher than that of the PCDDs, PCDFs, and PCBs of interest. The cleanup procedures in Sections 4.6 and 4.7 can be used to reduce many of these interferences, but unique samples may require additional cleanup approaches or instrumentation with greater resolving power. High resolution mass spectrometry (HRMS) may be used for PCDD/PCDF to eliminate false positives and achieve the required detection limit. A high resolution mass spectrometry method has not been developed for PCB analysis. Therefore, HRMS is not recommended at this time.
1.5.4 Two high resolution capillary columns, 60 m DB-5 and SP-2331 or (SP-2330), are recommended for PCDD/PCDF analysis. Neither column will resolve all dioxin and furan isomers. Both columns are required for quantitation of all 2,3,7,8-substituted isomers. Positive results using any other gas chromatographic column must be shown to be isomer specific.
1.5.5 The DB-5 and SE-54 columns recommended for PCB analysis will produce acceptable results. Because the method measures PCBs as isomer groups., co-eluting PCBs that contain the same number of chlorines are identified and measured together. The problem of co-eluting PCBs with different numbers of chlorine atoms can be averted by rigorous application of the identification criteria described in this method.
1.5.6 If other gas chromatographic conditions or other techniques are used, the tester is required to substantiate the data through an adequate quality assurance program approved by the Executive Officer.
2 SAMPLE COLLECTION
2.1 Sample Runs, Time, and Volume
2.1.1 Sampling Runs
The number of sampling runs must be sufficient to provide adequate statistical data and in no case shall be less than three (3).
2.1.2 Sampling Time
The sampling time must be of sufficient length to provide coverage of the average operating conditions of the source. However, this shall not be less than three (3) hours.
M428 Page 14
2.1.3 Sample Volume
The sample volume must be sufficient to provide the required amount of analyte to meet both the MDL of the analytical method and the allowable stack emissions. It may be calculated using the following formula:
100 100 1 Sample Volume = A · · ·
B C D
Where:
A = The analytical MDL in ng B = Percent (%) of the sample required per analytical run C = Sample recovery (%) D = Allowable stack emissions (ng/dscm)
2.2 Sampling Train
The following apparatus and materials are appropriate for use in these procedures. Mention of trade names of specific products does not constitute endorsement by the California Air Resources Board. In all cases, equivalent items from other suppliers may be used.
The following sampling apparatus is recommended. The tester may use an alternative sampling apparatus only if, after review by the Executive Officer, it is deemed equivalent for the purposes of this test method.
A schematic diagram of the sampling train is shown in Figure 1. The train consists of nozzle, probe, heated particulate filter, condenser, and sorbent module followed by three impingers and a silica gel drying cartridge. An in-stack filter may be used in place of the probe and heated filter if this is required. A cyclone or similar device in the heated filter box may be used for sources emitting a large amount of particulate matter.
For sources with a high moisture content, a water trap may be placed between the heated filter and the sorbent module. Additional impingers may also be placed after the sorbent module. If any of these options are used, details should be provided in the report. The train may be constructed by adaptation of an EPA Method 5 train. Descriptions of the train components are contained in the following sections.
2.2.1 Probe Nozzle
Nickel plated stainless steel, quartz, or borosilicate glass with sharp, tapered leading edge. The angle of taper shall be 30E and the taper shall be on the outside to preserve a constant internal diameter. The probe nozzle shall be of the buttonhook or elbow design, unless otherwise approved by the Executive Officer.
M428 Page 15
A range of sizes suitable for isokinetic sampling should be available, e.g., 0.32 to 1.27 cm (1/8 to 1/2 in.) - or larger if higher volume sampling trains are used - inside diameter (ID) nozzles in increments of 0.16 cm (1/16 in.). Each nozzle shall be calibrated according to the procedures outlined in Section 2.5.1.
2.2.2 Probe
The probe should be lined or made of nickel plated stainless steel, teflon, borosilicate, or quartz glass. The liner or probe is to provide an inert surface for the dioxins and furans in the stack gas. The liner or probe extends past the retaining nut into the stack. A temperature-controlled jacket provides protection of the liner or probe. The liner shall be equipped with a connecting fitting that is capable of forming a leak-free, vacuum tight connection without sealing greases. If an in-stack filter is used, the probe follows the in-stack filter.
2.2.3 Sample Transfer Line
The sample transfer line shall be teflon (1/4 in. O.D. x 1/32 in. wall) with connecting fittings that are capable of forming leak-free, vacuum tight connections without using sealing greases. The line should be as short as possible.
2.2.4 Filter Holder
The filter holder shall be constructed of borosilicate glass, with a glass frit filter support and glass-to-glass seal or teflon gasket. The holder design shall provide a positive seal against leakage from the outside or around the filter. The holder shall be attached immediately at the outlet of the probe, cyclone, or nozzle depending on the configuration use. Other holder and gasket materials may be used subject to the approval of the Executive Officer.
2.2.5 Pre-separator
A cyclone, a high capacity impactor or other device may be used to remove the majority of the particles before the gas stream is filtered. This catch must be used for any subsequent analysis. The device shall be constructed of quartz or borosilicate glass. Other materials may be used subject to the approval of the Executive Officer.
2.2.6 Condenser
The condenser shall be constructed of borosilicate glass and shall be designed to allow the cooling of the gas stream to at least 20EC before it enters the sorbent module. Design for the normal range of stack gas conditions is shown in Figure 3.
M428 Page 16
2.2.7 Sorbent Module
The sorbent module shall be made of glass with connecting fittings that are able to form leak-free, vacuum tight seals without the use of sealant greases (Figure 3). The vertical resin trap is preceded by a coil-type condenser, also oriented vertically, with circulating cold water. Gas entering the sorbent module must be cooled to 20EC (68EF) or less. The gas temperature shall be monitored by a thermocouple placed either at the inlet or exit of the sorbent trap. The sorbent bed must be firmly packed and secured in place to prevent settling or channeling during sample collection. Ground glass caps (or equivalent) must be provided to seal the sorbent-filled trap both prior to and following sampling. All sorbent modules must be maintained in the vertical position during sampling.
2.2.8 Impinger Train
Three or more impingers are connected in series with connecting fittings able to form leak-free, vacuum tight seals without sealant greases. All impingers shall be of the Greenburg-Smith Design modified by replacing the tip with a 1.3 cm (1/2 in.) I.D. glass tube extending to 1.3 cm (1/2 in.) from the bottom of the flask.
The first impinger, connected to the outlet of the sorbent module shall be further modified to have a short stem, so that the sample gas does not bubble through the collected condensate. The first impinger shall be empty.
An oversized impinger may be required for sampling high moisture streams since this impinger collects the condensate which passes through the sorbent module for subsequent analysis. The second impinger initially contains water or alternatively 100 mL ethylene glycol which is intended to collect dioxins and furans not adsorbed by the resin. The third impinger shall be empty.
A thermometer which measures temperatures to within 1EC (2EF), shall be placed at the outlet of the third impinger.
2.2.9 Silica Gel Cartridge
This shall be sized to hold 200 to 300 gm of silica gel to absorb moisture, and to prevent damage to the pumping system.
2.2.10 Pitot Tube
Type S, as described in Section 2.1 of ARB Method 2 or other devices approved by the Executive Officer. The pitot tube shall be attached to the probe extension to allow constant monitoring of the stack gas velocity as required by Section 2.1.3 of ARB Method 5. When the pitot tube occurs with other sampling components as part of an
M428 Page 17
assembly, the arrangements must meet the specifications required by Section 4.1.1 of ARB Method 2. Interference-free arrangements are illustrated in Figures 2-6 through 2-8 of ARB Method 2 for Type S pitot tubes having external tubing diameters between 0.48 and 0.95 cm (3/16 and 3/8 in.).
Source-sampling assemblies that do not meet these minimum spacing requirements (or the equivalent of these requirements) may be used. However, the pitot tube coefficients of such assemblies shall be determined by calibration, using methods subject to approval by the Executive Officer.
2.2.11 Differential Pressure Guage
Two inclined manometers or equivalent devices, as described in Section 2.2 of ARB Method 2. One manometer shall be used for velocity head (AP) readings and the other for orifice differential pressure readings.
2.2.12 Metering System
Vacuum gauge, leak-free pump, thermometers accurate to within 3EC (5.4EF), dry gas meter capable of measuring volume to within 2 percent, and related equipment, as shown in Figure 1. Other metering systems must meet the requirements stated in Section 2.1.8 of ARB Method 5.
2.2.13 Barometer
Mercury, aneroid, or other barometer capable of measuring atomospheric pressure to within 2.5 mm Hg (0.1 in. Hg). In many cases, the barometric reading may be obtained from a nearby national weather service station, in which case the station value (which is the absolute barometric pressure) shall be requested and an adjustment for elevation differences between the weather station and sampling point shall be applied at a rate of minus 2.5 mm Hg (0.1 in. Hg) for 30 m (100 ft.) elevation increase or vice versa for elevation decrease.
2.2.14 Gas Density Determination Equipment
Temperature sensor and pressure gauge, as described in Section 2.3 and 2.4 of Method 2, and gas analyzer, if necessary, as described in Method 3. The preferred configuration and alternative arrangements of the temperature sensor shall be the same as those described in Section 2.1.10 of ARB Method 5.
2.2.15 Filter Heating System
The heating system must be capable of maintaining a temperature around the filter holder during sampling of (120 ± 14E C) (248 ± 25E F). A temperature gauge capable
M428 Page 18
of measuring temperature to within 3E C (5.4E F) shall be installed so that the temperature around the filter holder can be regulated and monitored during sampling.
2.3 Sampling Materials And Reagents
2.3.1 Filters
The in-stack filters shall be glass mats or thimble fiber filters, without organic binders, and shall exhibit at least 99.95 percent efficiency (0.05 percent penetration) on 0.3 micron dioctyl phthalate smoke particles. The filter efficiency test shall be conducted in accordance with ASTM standard Method D 2986-71.
Test data from the supplier’s quality control program are sufficient for this purpose. Prior to use in the field, each lot of filters shall be subjected to pre-cleaning and a quality control or contamination check to confirm that there are no contaminants present that will interfere with the analysis of selected species at the target detection limits.
Filter pre-cleaning shall consist of Soxhlet extraction, in batches not to exceed 50 filters, with the solvent(s) to be applied to the field samples. As a QC check, the extracting solvent(s) shall be subjected to the same concentration, clean-up and analysis procedures to be used for the field samples. The background or blank value observed shall be converted to a per filter basis and shall be corrected for any differences in concentration factor between the QC check (CFQC) and the actual sample analysis procedure (CFS).
Apparent m g of Analyte, CFSBlank Value per filter = · No. filters extracted CFQC
Where:
Initial volume of extracting solventCF =
Final volume of concentrated extract
The quantitative criterion for acceptable filter quality will depend on the detection limit criteria established for the field sampling and analysis program. Filters that give a background or blank signal per filter greater than or equal to the target detection limit for the analyte(s) of concern shall be rejected for field use. Note that acceptance criteria for filter cleanliness depend not only on the inherent detection limit of the analysis method but also on the expected field sample volume and on the desired limit of detection in the sampled stream. If the filters do not pass the QC check, they shall be re-extracted and the solvent extracts re-analyzed until an acceptably low background level is achieved.
M428 Page 19
2.3.2 Sorbents
2.3.2.1 Cleaning of Amberlite XAD-2 Resin
The clean-up procedure may be carried out in a giant Soxhlet extractor, which will contain enough Amberlite XAD-2 for several sampling traps. An all- glass thimble 55-90 mm O.D. x 150 mm deep (top to frit) containing an extra- coarse frit is used for extraction of XAD-2. The frit is recessed 10-15 mm above a crenelated ring at the bottom of the thimble to facilitate drainage. The resin must be carefully retained in the extractor cup with a glass wool plug and stainless steel screen since it floats on methylene chloride. This process involves sequential extraction in the following order:
Solvent Procedure
Water Initial rinse with 1 L H2O for 1 cycle, then discard H2O
Water Extract with H2O for 8 hr
Methyl Alcohol Extract for 22 hr
Methylene Chloride Extract for 22 hr
Hexane Extract for 22 hr
The XAD-2 resin must be dried by one of the following techniques.
(a) After evaluation of several methods of removing residual solvent, a fluidized-bed technique has proven to be the fastest and most reliable drying method.
A simple column with suitable retainers as shown in Figure 4 will serve as a satisfactory column. A 10.2 cm (4 in.) Pyrex pipe 0.6 m (2 ft.) long will hold all of the XAD-2 from the Soxhlet extractor, with sufficient space for fluidizing the bed while generating a minimum resin load at the exit of the column.
The gas used to remove the solvent is the key to preserving the cleanliness of the XAD-2. Liquid nitrogen from a regular commercial liquid nitrogen cylinder has routinely proved to be a reliable source of large volumes of gas free from organic contaminants. The liquid nitrogen cylinder is connected to the column by a length of pre cleaned 0.95 cm (3/8 in.) copper tubing, coiled to pass through a heat source. As nitrogen is bled from the cylinder, it is vaporized in the heat source and passes through the column. A convenient heat source is a water bath heated from a steam line. The final nitrogen temperature should be warm to the touch and not over 40EC. Experience has
M428 Page 20
shown that about 500 g of XAD-2 can be dried overnight consuming a full 160 L cylinder of liquid nitrogen.
As a second choice, high purity tank nitrogen may be used to dry the XAD-2. The high purity nitrogen may first be passed through a bed of activated charcoal approximately 150 mL in volume. With either type of drying method, the rate of flow should gently agitate the bed. Excessive fluidization may cause the particles to break up.
(b) As an alternative, if the nitrogen process is not available, the XAD-2 resin may be dried in a vacuum oven, if the temperature never exceeds 20EC. Even, if purchased clean, the resin blank must be checked before use.
2.3.2.2 Storage of Clean XAD-2 Resin
Resin cleaned and dried as prescribed above is suitable for immediate use in the field, provided it passes the QC contamination check described in Section 2.3.2.3 below. However, pre-cleaned dry resin may develop unacceptable levels of contamination if stored for periods exceeding a few weeks. If pre-cleaned XAD-2 is not to be used immediately, it shall be stored under distilled-in-glass methanol. No more than two weeks prior to initiation of field sampling, the excess methanol shall be decanted, the resin shall be washed with a small volume of methylene chloride and dried with clean nitrogen as described in Section 2.3.2.1 (a) above. An aliquot shall then be taken for the QC contamination check described in Section 2.3.2.3 below.
If the stored resin fails the QC check, it may be re-cleaned by repeating the final two steps of the extraction sequence (sequential methylene chloride and hexane extraction) describes above in Section 2.3.2.1. The QC contamination check shall be repeated after the resin is re-cleaned and dried.
2.3.2.3 QC Contamination Check of XAD-2 Resin
The XAD-2 resin, whether purchased pre-cleaned or cleaned as described above, shall be subjected to a QC check to confirm the absence of any contaminants that might cause interferences in the subsequent analysis of field samples. An aliquot of resin, equivalent in size to one field sampling tube charge, shall be taken to characterize a single batch of resin.
The XAD-2 resin aliquot shall be subjected to the same extraction, concentration, clean up, and analytical procedures as those applied to the field samples. The quantitative criteria for acceptable resin quality will depend on the detection limit criteria established for the field sampling and analysis program.
M428 Page 21
Resin which yields a background or blank signal equal to or greater than that corresponding to the target detection limit for the analyte(s) of concern shall be rejected for field use. Note that the acceptance limit for resin cleanliness depends not only on the inherent detection limit of the analysis method but also on the expected field sample volume and on the desired limit of detection in the sampled stream.
2.3.2.4 Silica Gel
Indicating type, 6 to 16 mesh. If previously used, dry at 175EC (350EF) for 2 hours. New silica gel may be used as received. Alternatively, other desiccants (equivalent or better) may be used, subject to approval by the Executive Officer.
2.3.3 Water
Deionized, then glass-distilled, and stored in hexane-rinsed glass containers with TFE-lined screw caps.
2.3.4 Crushed Ice
Place crushed ice in the water bath around the impingers.
2.3.5 Glass Wool
Cleaned by thorough rinsing, i.e., sequential immersion in three aliquots of hexane, dried in a 110EC oven, and stored in a hexane-washed glass jar with TFE-lined screw cap.
2.4 Sampling Procedure
Because of the complexity of this method, testers must be trained and experienced with the test procedures in order to ensure reliable results.
2.4.1 Pretest Preparation
All components shall be maintained and calibrated according to the procedure described in APTD-0576, unless otherwise specified herein.
Weigh several 200 to 300 g portions of silica gel in air-tight containers to the nearest 0.5 g. As an alternative, the silica gel may be weighed directly in its impinger or sampling holder just prior to assembly of the train.
Check filters visually against light for irregularities and flaws or pinhole leaks. Label filters of the proper size on the back side near the edge using numbering machine ink.
M428 Page 22
As an alternative, label the shipping containers (glass or plastic petri dishes) and keep the filters in those containers at all times except during the sampling weighing.
2.4.2 Preliminary Determinations
Select the sampling site and the minimum number of sampling points according to ARB Method 1 or as specified by the Executive Officer.
Determine the stack pressure, temperature, and the range of velocity heads using ARB Method 2; it is recommended that a leak-check of the pitot lines be performed (see ARB Method 2, Section 3.1).
Determine the moisture content using ARB Method 4 or its alternatives for the purpose of making isokinetic sampling rate settings.
Determine the stack gas dry molecular weight, as described in ARB Method 2, Section 3.6. If integrated sampling (ARB Method 3) is used for molecular weight determination, the integrated bag sample shall be taken simultaneously with, and for the same total length of time as, the ARB Method 4 sample run.
Select a nozzle size based on the range of velocity heads, such that it is not necessary to change the nozzle size in order to maintain isokinetic sampling rates. During the run, do not change the nozzle size. Ensure that the proper differential pressure gauge is chosen for the range of velocity heads encountered (see Section 2.2 of ARB Method 2).
Select a probe extension length such that all traverse points can be sampled. For large stacks, consider sampling from opposite sides of the stack to reduce the length of probes.
Select a total sampling time grater tan or equal to the minimum total sampling time specified in the test procedures for the specific industry such that (1) the sampling time per point is not less than 2 minutes (or some greater time interval as specified by the Executive Officer), (2) the sample volume taken (corrected to standard conditions) will exceed the required minimum total gas sample volume determined in Section 2.1.3. The latter is based on an approximate average sampling rate.
It is recommended tat the number of minutes sampled at each point be an integer or an integer plus one-half minute, in order to avoid timekeeping errors.
In some circumstances, e.g., batch cycles, it may be necessary to sample for shorter times at the traverse points and to obtain smaller gas sample volumes. In these cases, the Executive Officer’s approval must first be obtained.
M428 Page 23
2.4.3 Cleaning Glassware
All glass parts of the train upstream of and including the sorbent module and the first impingers shall be cleaned as described in Section 3A of the 1974 issue of Manual of Analytical Methods for Analysis of Pesticide Residues in Human and Environmental Samples (Reference 13.3). Take special care to remove residual silicone grease sealants on ground glass connections of used glassware. These grease residues should be removed by soaking several hours in a chromic acid cleaning solution prior to routine cleaning as described above.
Rinse all glassware with methylene chloride prior to use in the PCDD/PCDF sampling train.
2.4.4 Preparation of Amberlite XAD - 2 Sorbent Trap
Use a sufficient amount (at least 30 gms or 5 gms/m3 of stack gas to be sampled) of cleaned resin to completely fill the glass sorbent trap which has been thoroughly cleaned as prescribed and rinsed with hexane. Follow the resin with hexane-rinsed glass wool and cap both ends. These caps should not removed until the trap is fitted into the train. See Figure 3 for details.
The dimensions and resin capacity of the sorbent trap, and the volume of gas to be sampled, should be varied as necessary to ensure efficient collection of the target analytes (Table 1).
The surrogate standards (Tables 3 and 5) must be added to the resin in the laboratory.
2.4.5 Preparation of Collection Train
Keep all openings where contamination can occur covered until just prior to assembly or until sampling is about to begin.
CAUTION: Don not use sealant greases in assembling the sampling train.
Prepare the impingers as follows: The first impinger shall be empty. Place 100 ml of either, water or ethylene glycol in the second impinger. Leave the impinger empty, and transfer approximately 200 to 300 g of preweighted silica gel from its container to the silica gel cartridge.
Place the container in a clean place for later use in the sample recovery.
If some means other than impingers is used to condense moisture, prepare the condenser (and, if appropriate, silica gel for condenser outlet) for use.
Using a tweezer or clean disposable surgical gloves, place a labeled (identified) filter holder. Be sure that the filter is properly centered and the gasket properly placed so as not to allow the sample gas stream to circumvent the filter. Check filter for tears after assembly is completed.
M428 Page 24
Mark the probe extension with heat resistant tape or by some other method to denote the proper distance into the stack or duct for each sampling point.
Assemble the train as in Figure 1, or 2. Place crushed ice around the impinger.
2.4.6 Leak Check Procedures
2.4.6.1 Pretest Leak Check
A pretest leak-check is required. The following procedure shall be used.
After the sampling train has been assembled, turn on and set the filter and probe heating systems at the desired operating temperatures. Allow time for the temperature to stabilize. Leak-check the train at the sampling site by plugging the nozzle with a TFE plug and pulling a vacuum of at least 380 mm Hg (15 in. Hg).
NOTE: A lower vacuum may be used, provided that it is not exceeded during the test.
Determine the leakage rate. A leakage rate in excess of 4 percent of the average sampling rate or 0.00057 m³ per min. (0.02 cfm), whichever is less, is unacceptable.
The following leak-check instructions for the sampling train described in Section 4.1.4.1 of ARB Method 5 may be helpful. Start the pump with by-pass valve fully open and coarse adjust valve completely closed. Partially open the coarse adjust valve and slowly close the by-pass valve until the desired vacuum is reached. Do not reverse the direction of the by-pass valve. This will cause water to back up into the filter holder. If the desired vacuum is exceeded, either leak-check at this higher vacuum or end the leak-check as described below and start over.
When the leak-check is completed, first slowly remove the plug from the inlet to the probe nozzle and immediately turn off the vacuum pump. This prevents water from being forced backward and keeps silica gel from being entrained backward.
2.4.6.2 Leak Checks During Sample Run
If during the sampling run, a component (e.g., filter assembly or impinger) change becomes necessary, a leak-check shall be conducted immediately before the change is made. The leak-check shall be done according to the procedure outlined in Section 2.4.6.1 above, except that it shall be done at a vacuum equal to or greater than the maximum value recorded up to that point in the test. If the
M428 Page 25
leakage rate is found to be no greater than 0.00057 m³/min (0.02 cfm) or 4 percent of the average sampling rate (whichever is less), the results are acceptable, and no correction will need to be applied to the total volume of dry gas metered.
If, however, a higher leakage rate is obtained, the tester shall either record the leakage rate and plan to correct the sample volume of gas sampled since the last leak check using the method of Section 11.3 of this protocol, or shall void the sampling run.
Immediately after component changes, leak-checks are to be done according to the procedure outlined in Section 2.4.6.1 above.
2.4.6.3 Post Test Leak Check
A leak-check is mandatory at the conclusion of each sampling run. The leak-check shall be done in accordance with the procedures outlined in Section 2.4.6.1 except that it shall be conducted at a vacuum equal to or greater than the maximum value recorded during the sampling run. If the leakage rate is found to be no greater than 0.00057 m³/min (0.02 cfm) or 4 percent of the average sampling rate (whichever is less), the results are acceptable, and no correction need be applied to the total volume of dry gas metered. If, however, a higher leakage rate is obtained, the tester shall either, (1) record the leakage rate and correct the sample volume as shown in Section 2.7.3 of this method, or (2) void the sampling run.
2.4.6.4 Correcting for Excessive Leakage Rate
The equation given in Section 2.7.3 of this method for calculating Vm (std), the corrected volume of gas sampled, can be used as written unless the leakage rate observed during any leak-check after the start of a test exceeded La, the maximum acceptable leakage rate (see definitions below). If an observed leakage rate exceeds La, then replace Vm in the equation in Equation 428-1 with the following expression:
V = (L - L )q - (L - L )qm 1 a i p a p
Where:
V = Volume of gas sampled as measured by the dry gas meterm
(dscf). L = Maximum acceptable leakage rate equal to 0.00057 m³/mina
(0.02 ft³/min) or 4% of the average sampling rate, whichever issmaller.
L = Leakage rate observed during the post-test leak-check, m³/minp
(ft³/min).
M428 Page 26
Li = Leakage rate observed during the leak-check performed prior to
››the “ith” leak-check (i = 1, 2, 3 … n), m³/min (ft³/min).
I = Sampling time interval between two successive leak-checks beginning with the interval between the first and second leak-checks, min.
›› = Sampling time interval between the last (n th) leak-check andp
the end of the test, min.
Substitute only for those leakage rates (Li or Lp) which exceed La.
2.4.7 Train Operation
During the sampling run maintain a sampling rate within 10 percent of true isokinetic, unless otherwise specified or approved by the Executive Officer. For each run, record the data required on the sample data sheet shown in Figure 5. Be sure to record the initial dry gas meter reading. Record the dry gas meter readings at the beginning and end of each sampling time increment, when changes in flow rates are made, before and after each leak-check, and when sampling is halted.
Take other readings required by Figure 5 at least once at each sample point during each time increment and additional readings when significant changes (20 percent variation in velocity head readings) necessitate additional adjustments in flow rate.
Level and zero the manometer. Because the manometer level and zero may drift due to vibrations and temperature changes, make periodic checks during the traverse.
Clean the portholes prior to the test run to minimize the chance of sampling the deposited material. To begin sampling, remove the nozzle cap and verify that the pilot tube and probe extension are properly positioned. Position the nozzle at the first traverse point with the tip pointing directly into the gas stream.
Immediately start the pump and adjust the flow to isokinetic conditions. Nomographs are available, which aid in the rapid adjustment of the isokinetic sampling rate without excessive computations. These nomographs are designed for use when the Type 5 pitot tube coefficient (Cp) is 0.85 ± 0.02, and the stack gas equivalent density (dry molecular weight) ((Md) is equal to 29 ± 4. APTD-0576 details the procedure for using the nomographs. If Cp and Md are outside the above stated ranges, do not use the nomographs unless appropriate steps (see Citation 12.3) are taken to compensate for the deviations.
When the stack is under significant negative pressure (height of impinger stem), take to close the coarse adjust valve before inserting the probe extension assembly into the stack to prevent water from being forced backward. If necessary, the pump may be turned on with the coarse adjust valve closed.
When the probe is in position, block off the openings around the probe and porthole to prevent unrepresentative dilution of the gas stream.
M428 Page 27
Traverse the stack cross-section, as required by ARB Method 1 or as specified by the Executive Officer, being careful not to bump the probe nozzle into the stack walls when sampling near the walls or when removing or inserting the probe extension through the portholes; this minimizes the change of extracting deposited material.
During the test run, take appropriate steps (e.g., adding crushed ice to the impinger ice bath) to maintain the temperature at the condenser outlet below 20EC (68EF), this will prevent excessive moisture losses. Also, periodically check the level and zero of the manometer.
If the pressure drop across the filter becomes too high, making isokinetic sampling difficult to maintain, the filter may be replaced during a sample run. It is recommended that another complete filter assembly be used rather than attempting to change the filter itself. Before a new filter assembly is installed, conduct a leak-check as outlined in Section 2.4.6.2. The total particulate weight shall include the combined catches of all filter assemblies.
A single train shall be used for the entire sample run, except in cases where simultaneous sampling is required in two or more separate ducts or at two or more different locations within the same duct or in cases where equipment failure necessitates a change of trains. In all other situations, the use of two or more trains will be subject to approval by the Executive Officer.
Note that when two or more trains are used, a separate analysis of the collected particulate from each train shall be performed, unless identical nozzle sizes were used on all trains, in which case the particulate catches from the individual trains may be combined and a single analysis performed.
At the end of the sample run, turn off the pump, remove the probe extension assembly from the stack, and record the final dry gas meter reading. Perform a leak-check, as outlined in Section 2.4.6.3. Also, leak-check the pitot lines as described in Section 3.1 of ARB Method 2; the lines must pass this leak-check, in order to validate thevelocity head data.
2.4.8 Calculation of Percent Isokinetic
Calculate percent isokinetic (see Section 2.7.5) to determine whether another test run should be made. If there was difficulty in maintaining isokinetic rates due to source conditions, consult with the Executive Officer for possible variance on the isokinetic rates.
M428 Page 28
2.5 Calibration
The tester shall maintain a laboratory log of all calibration data which shall be obtained using the standard equipment and procedures indicated below.
2.5.1 Probe Nozzle
Probe nozzles shall be calibrated according to the procedure described in Section 5.1 of ARB Method 5.
2.5.2 Pitot Tube
The procedure for calibrating the Type S pitot tube assembly is outlined in Section 4 of ARB Method 2.
2.5.3 Metering System
Calibration of the metering system shall be performed according to the requirement of Section 5.3 of ARB Method 5.
2.5.4 Temperature Gauges
Use the procedure in Section 4.3 of ARB Method 2 to calibrate in-stack temperature gauges. Dial thermometers, such as those used for the dry gas meter and condenser outlet, shall be calculated against mercury-in-glass thermometers.
2.5.5 Leak-Check of Metering System Shown in Figure 1
The tester shall use the procedure outlined in Section 5.6 of ARB Method 5.
2.5.6 Barometer
Calibrate against a mercury barometer.
2.6 Quality Assurance/Quality Control
The positive identification and quantification of PCDD, PCDF, and PCB in this assessment of stationary sources are highly dependent on the integrity of the samples received and the precision and accuracy of all analytical procedures employed. The QA procedures described in this section are to be used to monitor the performance of the sampling methods, identify problems, and effect solutions.
M428 Page 29
2.6.1 Blank Train
There shall be at least one blank train for each series of three or fewer test runs. For those sources with air pollution control devices, there shall be at least one blank train assembled at the inlet, and one at the outlet of the air pollution control devices for each set of three or fewer runs at each location. Prepare and set up the blank train in a manner identical to that described above for the sampling trains. The blank train shall be taken through all of the sampling train preparation steps including the leak-check without actual sampling of the gas stream. Recover the blank train as described in Section 3.4. Follow all subsequent steps specified for the sample train including data reporting.
2.6.2 Spiked Sampling Trains (Surrogate Standards)
Spiked trains are required as a means of estimating the precision and accuracy of the sampling train for collecting and recovering PCDDs, PCDFs and PCBs in the stack gas sample. Isotopically labeled PCDD and PCDF isomers (Tables 3 and 5) and ¹³Clabeled PCB isomers (if available) shall be spiked onto the XAD-2 resin prior to each test.
All of the sampling and blank trains in each series of test runs shall be spiked. Table 9 shows a spiking plan for method internal standards, recovery internal standards, and surrogate standards (field spikes) for PCDD/PCDF testing. Table 17 shows a comparable scheme for PCB testing. For combined PCDD/PCDF and PCB testing, all of the compounds listed in Tables 9 and 17 shall be used in each sample.
All of these congeners are generally available. Additional congeners may also be used if available. The labeled congeners used in the field spike (surrogate standards) must be different from the internal standards used for quantitation. The appropriate spike level for the surrogate standards will depend on the source to be tested. If the spiking scheme must be modified, the analyst must demonstrate that the proposed plan will generate data of satisfactory quality.
Acceptable surrogate (field spike) recoveries should range between 60 and 140 percent. If field spike recoveries are not within the acceptable range, this must be clearly indicated in the laboratory report. The affected sampling run must be identified in the report of the calculated emissions data.
2.7 Calculations
Carry out calculations retaining at least one extra decimal figure beyond that of the acquired data. Round off figures after the final calculation. Other forms of the equations may be used as long as they give equivalent results.
M428 Page 30
C
2.7.1 Nomenclature
A = Cross-sectional area of nozzle, m² (ft²).n
B = Water vapor in the gas stream, proportion by volume.ws
= Concentration of PCDD/PCDF in stack gas, ng/dscm, corrected tos
standard conditions of 20EC, 760 mm Hg (68EF, 29.92 in. Hg) on dry basis.
G = Total mass of PCDD/PCDF in stack gas sample, ng.s
I = Percent isokinetic sampling.
L = Maximum acceptable leakage rate for either a pretest leak-check or fora
a leak-check or for a leak-check following a component change; equal to 0.00057 m³/min (0.02 cfm) or 4 percent of the average sampling rate, whichever is less.
Li = Individual leakage rate observed during the leak-check conducted prior to the “ith” component change (i = 1, 2, 3, … n), m³/min (cfm).
L = Leakage rate observed during the post-test leak-check, m³/min (cfm).p
P
M = Molecular weight of water, 18.0 g/g-mole (18.0 lb/lb-mole).
bar = Barometric pressure at the sampling site, mm Hg (in. Hg).
P = Absolute stack gas pressure, mm Hg (in. Hg).s
Pstd = Standard absolute pressure, 760 mm Hg (29.92 in. Hg).
R = Ideal gas constant 0.06236 mm Hg-m³/EK-g-mole (21.85 in. Hg-ft³/ER-lb-mole).
T = Absolute average dry gas meter temperature (see Figure 3), EK (ER).m
NOTE: Tm will depend on type of meter used and sampling configuration.
T = Absolute average stack gas temperature EK (ER).s
Tstd = Standard absolute temperature, 293EK (528ER).
M428 Page 31
V = Volume of acetone used in was, mL.aw
V1c = Total volume of liquid collected in impingers and silica gel, mL.
V = Volume of gas sample as measured by dry gas meter, dcm (dcf).m
Vm(std) = Volume of gas sample measured by the dry gas meter, corrected to standard conditions, dscm (dscf).
V = Stack gas velocity, calculated by ARB Method 2, Equation 2-9, usings
››
data obtained from ARB Method 5, m/sec (ft/sec).
Y = Dry gas meter calibration factor.
ªH = Average pressure different across the orifice meter, mm H2O (in. H2O).
›› = Total sampling time, min.
1 = Sampling time interval, from the beginning of a run until the first
››
››
component change, min.
I = Sampling time interval between two successive component changes, beginning with the interval between the first and second changes, min.
p = Sampling time interval, from the final (n )th component change until the end of the sampling run, min.
13.6 = Specific gravity of mercury.
60 = Sec/min.
100 = Conversion to percent.
2.7.2 Average Dry Gas Water Temperature and Average Orifice Pressure Drop
See data sheet, Section 2.4.7 (Figure 5).
M428 Page 32
2.7.3 Dry Gas Volume
Correct the sample volume measured by the dry gas meter to standard conditions (20EC, 760 mm Hg or 68EF, 29.92 in. Hg) by using Equation 428-1.
Tstd Pbar + (D H /13.6) Pbar + (D H /13.6)Vm(std) = V Y = K V m Tm Pstd
1 m Tm
Equation 428 - 1
Where:
K1 = Tstd = 0 3858. � K / mm Hg for metric units Pstd
= 17.65� R / in Hg for English units
NOTE: Equation 428-1 can be used as written unless the leakage rate observed during any of the mandatory leak-checks (i.e., the post-test leak-check or leak-checks conducted prior to component changes) exceeds La. If Lp or Li
exceeds La, Equation 428-1 must be modified as follows:
(a) Case I. No component changes made during the sampling run. In this case, replace Vm in Equation 428-1 with the expression:
V = (L - L )qm p a
(b) Case II. One or more component changes made during the sampling run. In this case, replace Vm in Equation 428-1 with the expression:
n
V - (L - L )q - S (L - L )q - (L - L )qm i a i i a i p a p i=2
and substitute only for those leakage rates (Li or Lp) which exceed La.
M428 Page 33
2.7.4 Conversion Factors
From To Multiply By
scf m³ 0.02832
g/ft³
g/ft³
gr/ft³
lb/ft³
15.43
2.205 x 10⁻³
g/ft³ g/m³ 35.31
2.7.5 Isokinetic Variation
2.7.5.1 Calculation from Raw Data
100 T [K V + (V / T ) (P + D H /13.6)]s 3 1c m m barI =
60 q v P A s s n
K
Equation 428-2
Where:
3 = 0.003454 mm Hg-m³/mL EK for metric units = 0.002669 in. Hg-ft³/mL ER for English units
2.7.5.2 Calculation from Intermediate Values
100T V m std ) P(std )I =T(std
s
) vs
(
q A (1 - Bws )n
T V m std )= K4 P v q s
A ((
1 - Bws )s s n
Equation 428-3
Where:
K4 = 4.320 for metric units= 0.09450 for English units
M428 Page 34
2.8 Acceptable Results
If 90 percent < I < 110 percent, the results are acceptable. If there is a high bias to the results, i.e., I < 90 percent, then the results are defined as at or below the determined value and the Executive Officer may opt to accept the results. If there is a low bias to the results, i.e., I > 100 percent, then the results are defined as at or above the determined value, and the Executive Officer may opt to accept the results. Otherwise, reject the results and repeat the test.
3 SAMPLE RECOVERY
3.1 Cleaning Glassware for Sample Recovery
Glassware used in sample recovery procedures must be cleaned as soon as possible after use by rinsing with the last solvent used in it. This should be followed by detergent washing with hot water, and rinses, with tap water, deionized water, acetone, toluene, and methylene chloride. Other cleaning procedures may be used as long as acceptable method blanks are obtained. Acceptance criteria for method blanks are stated in Section 7-1.
3.2 Sample Recovery Apparatus
3.2.1 Probe Nozzle Brush
Inert bristle brush with stainless steel wire handle. The brush shall be properly sized and shaped to brush out the probe nozzle.
3.2.2 Wash Bottles
Glass wash bottles are recommended; Teflon FEPR. Wash bottles may be used at the option of the tester. Three 500 mL, Nalgene No. 0023A59 or equivalent are recommended.
3.2.3 Glass Sample Storage Containers
Pre-cleaned amber glass bottles or clear glass wrapped in opaque material, 500 mL or 1000 mL. Screw cap liners shall be Teflon. (Narrow mouth glass bottles have been found to be less prone to leakage).
3.2.4 Filter Storage Containers
Sealed filter holder or pre-cleaned, wide-mouth amber glass containers with Teflon lined screw caps or wrapped in hexane-rinsed aluminum foil.
M428 Page 35
3.2.5 Graduated Cylinder and/or Balance
To measure condensed water to within 2 mL or 1 g. Use a graduated cylinder that has a minimum capacity of 500 mL, and subdivisions no greater than 2 mL. (Most laboratory balances are capable of weighing to the nearest 0.5 g or less).
3.2.6 Storage Containers
Air tight metal containers to store silica gel.
3.2.7 Funnel and Rubber Policeman
To aid in transfer of silica gel to container; not necessary if silica gel is weighed in the field.
3.2.8 Funnel
To aid in sample recovery. Glass or Teflon may be used.
3.2.9 Ground Glass Caps or Hexane Rinsed Aluminum Foil
To cap off adsorbent tube and the other sample-exposed portions of the aluminum foil.
3.2.10 Aluminum Foil
Heavy-duty, hexane-rinsed.
3.3 Sample Recovery Reagents
3.3.1 Water
Deionized (DI), then glass distilled, and stored in hexane-rinsed glass containers with TFE-lined screw caps
3.3.2 Acetone
Pesticide quality, Burdick and Jackson “Distilled in Glass” or equivalent, stored in original containers. A blank must be screened by the analytical detection method.
3.3.3 Hexane
Pesticide quality, Burdick and Jackson “Distilled in Glass” or equivalent or stored in original containers. A blank must be screened by the analytical detection method.
M428 Page 36
3.3.4 Benzene
Pesticide quality, Burdick and Jackson “Distilled in Glass” or equivalent or stored in original containers. A blank must be screened by the analytical detection method.
3.3.5 Toluene
Pesticide quality, Burdick and Jackson “Distilled in Glass” or equivalent or stored in original containers. A blank must be screened by the analytical detection method.
3.3.6 Methyl Alcohol
Pesticide quality or equivalent.
3.3.7 Methylene Chloride
Pesticide quality or equivalent.
3.4 Sample Recovery Procedure
Proper cleanup procedure begins as soon as the probe is removed from the stack at the end of the sampling period.
When the probe can be safely handled, wipe off all external particulate matter near the tip of the probe nozzle. Remove the probe from the train and close off both ends with methylene chloride-rinsed aluminum foil. Seal off the inlet to the train with a ground glass cup or hexane-rinsed aluminum foil.
Transfer the probe and impinger assembly to the cleanup area. This area should be clean, and enclosed so that the chances of contaminating or losing the sample will be minimized. No smoking is allowed.
Inspect the train prior to and during disassembly and note any abnormal conditions, broken filters, color of the impinger liquid, etc. Treat the samples as follows:
3.4.1 Container No. 1
Carefully remove the filter from the filter holder and place it in its identified container. Use a pair of pre-cleaned tweezers to handle the filter. If it is necessary to fold the filter, make sure that the particulate cake is inside the fold. Carefully transfer to the container any particulate matter and/or filter fibers which adhere to the filter holder gasket by using a dry inert bristle brush and/or a sharp-edged blade. Seal the container.
M428 Page 37
3.4.2 Sorbent Modules
Remove the sorbent module from the train and cap it off.
3.4.3 Cyclone Catch
If the optional cyclone is used, quantitatively recover the particulate matter into a sample container and cap.
3.4.4 Sample Container No. 2
Quantitatively recover material deposited in the nozzle, probe, transfer line, the front half of the filter holder, and the cyclone, if used, first by brushing and then by sequentially rinsing with methanol, benzene, and methylene chloride three times each. Place all these rinses in Container No. 2.
3.4.5 Sample Container No. 3
Rinse the back half of the filter holder, the connecting line between the filter and the condenser (if using the separate condenser-sorbent trap) three times each with methanol, benzene and methylene chloride, and collect all rinses in Container No. 3. If using the combined condenser/sorbent trap, the rinse of the condenser shall be performed in the laboratory after removal of the XAD-2 portion. If the optional water knockout trap has been employed, the contents and rinses shall be placed in Container No. 3. Rinse it three times each with methanol, benzene, and methylene chloride.
3.4.6 Sample Container No. 4
Remove the first impinger. Wipe off the outside of the impinger to remove excess water and other material. Pour the contents and rinses directly into Container No. 4. Rinse the impinger sequentially three times with methanol, benzene, and methylene chloride.
3.4.7 Sample Container No. 5
Remove the second and third impingers, wipe the outside to remove excess water and other debris. Empty the contents and rinses into Container No. 5. Rinse each with distilled DI water three times.
M428 Page 38
4 ANALYTICAL PREPARATION
4.1 Safety
The toxicity or carcinogenicity of each reagent used in this method has not been precisely defined. Nevertheless, each chemical compound should be treated as a potential health hazard. Therefore, exposure to these chemicals must be reduced to the lowest possible level by whatever means available. The laboratory is responsible for maintaining a current file of OSHA regulations regarding the safe handling of the chemicals specified in this method. A reference file of material data handling sheets should also be made available to all personnel involved in the chemical analysis. Additional references to laboratory safety are available and have been identified for the information of the analyst (Sections 12.5 to 12.7).
PCBs, benzene, methylene chloride, and 2,3,7,8-TCDD have been classified as known or suspected human or mammalian carcinogens.
The following method analytes have been classified as known or suspected human or mammalian carcinogens: PCBs and 2,3,7,8-substituted PCDDs and PCDFs. Primary standards of these compounds should be prepared in a hood. A guideline for the safe handling of carcinogens can be found in Section 5209 of Title B of the California Administrative Code.
4.2 Cleaning of Glassware
Glassware used in the analytical procedures (including the Soxhlet apparatus and disposable bottles) must be cleaned as soon as possible after use by rinsing with the last solvent used in it. This should be followed by detergent washing with hot water, and rinses with tap water, deionized water, acetone, toluene, and methylene chloride. Other cleaning procedures may be used as long as acceptable method blanks are obtained.
4.3 Apparatus
4.3.1 Grab Sample Bottle
Amber glass, 125-mL and 250 mL, fitted with screw caps lined with Teflon. Solvent rinsed foil used with the shiny side away from the sample may be substituted for Teflon if the sample is not corrosive. If amber bottles are not available, protect samples from light. The bottle and cap liner must be acid washed and solvent rinsed with acetone or methylene chloride, and dried before use to minimize contamination.
M428 Page 39
4.3.2 Concentrator Tube, Kuderna-Danish
10 mL, graduated (Kontes-K-570050-1025 or equivalent). Calibration must be checked at the volumes employed in the test. Ground glass stopper is used to prevent evaporation of extracts.
4.3.3 Evaporative Flash, Kuderna-Danish
500-mL (Kontes K-570001-0500 or equivalent). Attach to concentrator tub with springs.
4.3.4 Snyder Column, Kuderna-Danish
Three-ball macro (Kontes K-569001-0121 or equivalent).
4.3.5 Snyder Column, Kuderna-Danish
Two-ball micro (Kontes K-569001-0219 or equivalent).
4.3.6 Mini-vials
1.0 mL vials; cone-shaped to facilitate removal of very small samples; heavy wallborosilicate glass; with Teflon-faced rubber septa and screw caps.
4.3.7 Soxhlet Apparatus
1 liter receiver (Kontes K-601000-0724), 1 heating mantle (Kontes K-721000-1000), Allihn condenser (Kontes K-456000-0022, Soxhlet extractor (Kontes K-586100 with modifications).
4.3.8 Rotary Evaporator
Rotovap R (or equivalent), Brinkmann Instruments, Westbury, NY.
4.3.9 Nitrogen Blowdown Apparatus
N-Evap Analytical Evaporator Model 111 (or equivalent), Organomation Associates Inc., Northborough, MA.
4.3.10 Balance
Analytical. Capable of accurately weighing to the nearest 0.0001 g.
M428 Page 40
4.3.11 Disposable Pipet
5 3/4 inch x 7.0 mm O.D., Catalog No. 14672-200, VWR Scientific, Inc., Kansas City, MO.
4.4 Sample Preparation Reagents
4.4.1 Reagent Water
Same as 3.3.1 above.
4.4.2 Hexane
Pesticide quality or equivalent.
4.4.3 Benzene
Pesticide quality or equivalent.
4.4.4 Toluene
Pesticide quality or equivalent.
4.4.5 Tetradecane
Pesticide quality or equivalent.
4.4.6 Methyl Alcohol
Pesticide quality or equivalent.
4.4.7 Methylene Chloride
Pesticide quality or equivalent.
4.4.8 Sulfuric Acid
ACS. Concentrated, sp. gr. 1.84.
4.4.9 Diethyl Ether
Pesticide quality or equivalent.
Must be free of peroxides as indicated by EM Quant test strips (available from EM Laboratories Inc., 500 Executive Boulevard, Elmsford, NY 10523).
M428 Page 41
Procedures recommended for removal of peroxides are provided with the test strips. After cleanup, 20 mL ethyl alcohol preservative must be added to each liter of ether.
4.4.10 Sodium Sulfate
ACS. Granular, anhydrous. Purify by heating in an oven at 400EC for four hours or by extracting with methylene chloride and drying for four or more hours in a shallow tray. Store in a bottle with Teflon lined screw cap.
4.4.11 Silica Gel
For column chromatography, type 60, EM reagent, 100-200 mesh, or equivalent. Soxhlet extract with methylene chloride, and activate in a foil covered glass container for longer than 12 hours at 130EC, then store at 130EC.
4.4.12 Silica Gel Impregnated with Sodium Hydroxide
Combine 39 g 1N sodium hydroxide with 100 g silica gel (Section 4.4.10) in a screw-capped bottle. Disperse aggregates with a stirring rod until a uniform mixture is obtained. Store in a screw-capped bottle with a Teflon-lined cap.
4.4.13 Silica Gel Impregnated with Sulfuric Acid
(40% w/w). Combine two parts concentrated sulfuric acid with three parts silica gel in a screw capped bottle and mix until a uniform mixture is obtained. Store in a screw-capped bottle with a Teflon-lined cap.
4.4.14 Carbopak/Celite
Carbopak C, 80/100 mesh, Catalog No. 1-0258, Supelco, Inc., Bellefonte, PA. Celite 545, not acid washed, Catalon No. C-212, Fisher Scientific Company, Pittsburgh, PA. Thoroughly mix 3.6 g of Carbopak C and 16.4 g Celite 545 in a 40 mL vial. Activate at 130EC for six hours. Store in a desiccator.
NOTE: If the carbon content of this mixture is greater than 20%, recoveries will be low for those analytes present in low concentrations. Each new batch of Carbopak/Celite must be checked to ensure that PCDD/PCDF recovery is satisfactory. The lowest level calibration standards shall be used for this check. Recovery of each native PCDD/PCDF standard shall be at least 50%.
M428 Page 42
4.4.15 Alumina: Acidic
Acidic, AG-4, Bio-Rad Laboratories (Catalog No. 132-1240 or equivalent). Soxhlet extract with methylene chloride, and activate in a foil covered glass container for 24 hours at 190EC.
NOTE: The performance of alumina in the column cleanup procedure varies with manufacturers and with the method of storage. The analyst shall check the activity of each new batch of alumina to ensure that PCDD/PCDF recovery is satisfactory. The lowest level calibration standards shall be used for this check. Recovery of each native PCDD/PCDF standard shall be at least 70%.
4.4.16 Florisil
PR grade (60/100 mesh). Purchase activated at 1250EF and store in the dark in glass containers with ground glass stoppers or foil-lined screw caps. Before use, activate each batch at least 16 hours at 130EC in a foil-covered glass container and allow to cool. The oven used to store the florisil must be restricted from general use to prevent contamination of the sorbent.
4.4.17 Nitrogen
Obtained from bleed from liquid nitrogen tank.
4.5 Sample Extraction
Stack sampling will yield both liquid and solid samples for PCDD/PCDF and PCB analysis.
Samples must not be split prior to analysis even when they appear homogeneous as in the case of single liquid phase samples. Solid samples such as the resin are not homogeneous and particulate matter may not be uniformly distributed on the filter. In addition, filter samples are generally so small that the desired minimum detection limit might not be attained if the sample were split.
Two schemes for sample preparation are described in Sections 4.5.1 and 4.5.2 below. Either one may be used.
Section 4.5.1 describes sample preparation procedures for separate GC/MS analyses of front and back half sections of the sampling train. Figure 6 is a flowchart of the extraction and cleanup procedures. The recovered samples may be combined as follows:
M428 Page 43
1) Particulate filter and particulate matter collected on the filter (Section 3.4.1), cyclone catch (Section 3.4.3) and Sample Container No. 2 (Section 3.4.4).
1) Sample Container No. 3 (Section 3.4.5), Resin (Section 3.4.2) and rinse of resin cartridge.
3) Sample Containers No. 4 and No. 5 (Sections 3.4.6 and 3.4.7).
Section 4.5.2 describes sample preparation procedures for GC/MS analysis of a single composite extract from each sampling train. The recovered samples are combined as shown in Figure 7.
4.5.1 Separate Front and Back Half Samples for Analysis
4.5.1.1 Extraction of Liquid Samples
A. Sample Container No. 2 (Front Half Rinses)
Concentrate the rinse from Sample Container No. 2 (Section 3.4.4) to a volume of about 1-5 mL using the nitrogen blowdown apparatus ( a stream of dry nitrogen) while heating the sample gently on a water bath at 50EC. Concentrate to near dryness. This residue will likely contain particulates which were removed in the rinses of the train probe and nozzle. Combine the residue (along with three rinses of the final sample vessel) in the Soxhlet apparatus with the filter and particulates and proceed as described under Section 4.5.1.2A below.
B. Sample Container No. 3 (Back Half Rinses)
Concentrate the rinses from Sample Container No. 3 (Section 3.4.5) to a volume of about 1-5 mL using the nitrogen blowdown apparatus (a stream of dry nitrogen) while heating the sample gently on a water bath at 50EC. Concentrate to near dryness. Combine this residue (along with three rinses of the final sample vessel) in the Soxhlet apparatus with the resin sample, and proceed as described under Section 4.5.2B below.
C. Containers No. 4 and No. 5 (Impinger Contents and Rinses)
Place the combined contents of Sample Containers No.4 and No. 5 (Sections 3.4.6 and 3.4.7) in a separatory funnel. Add an appropriate quantity of the isotopically labeled internal standard - surrogate standard mixture to achieve the concentrations indicated in Sections 5.2.5 and 6.2.6. Extract the sample three times with aliquots of methylene chloride. Combine the organic fractions and pour through Na2So4 into a round bottom flask. Add approximately 500 uL tetradecane.
M428 Page 44
The sample must be divided to accommodate the different cleanup procedures required for PCDD/PCDF (Section 4.6) and PCB (Section 4.7). Divide the sample three ways - one portion to be archived, one for PCDD/PCDF cleanup and GC/MS analysis, and one for PCB cleanup and GC/MS analysis. The ratio of the sample size divisions after the split will be determined by the target detection limits. Store the archive sample at 4EC away from light.
Concentrate the remaining two samples to 500 uL with a Kuderna-Danish concentrator or rotoevaporator, then transfer each extract to an 8-mL test tube with hexane. Proceed with sample cleanup procedures below (Section 4.6 for PCDD/PCDF and 4.7 for PCB).
4.5.1.2 Extraction of Solid Samples
A. Filter and Particulate Matter
Clean the Soxhlet apparatus by a 4 to 8-hr Soxhlet at a cycling rate of three cycles per hour. Discard the solvent. Add 20 g Na2SO4 to the thimble. Cut the filter into small strips and place the entire sample and residue rinses (4.5.1A) on top of the Na2SO4. Mix immediately and add the appropriate quantity of isotopically labeled internal standard solution to obtain the extract volume concentrations indicated in Tables 4 and 11.
Place the thimble in the Soxhlet apparatus, and add 250 mL of benzene or toluene to the receiver. Assemble the Soxhlet, turn on the heating controls and cooling water, and extract for 16 hours at a rate of three cycles per hour. After extraction, allow the Soxhlet to cool. Transfer to a 500 mL round bottom flask, and add approximately 500 uL of tetradecane.
The sample must be divided to accommodate the different cleanup procedures required for PCDD/PCDF (Section 4.6) and PCB (Section 4.7). Divide the sample three ways - one portion to be archived, one for PCDD/PCDF cleanup and GC/MS analysis, and one for PCB cleanup and GC/MS analysis. The ratio of the sample size divisions after the split must be determined by the target detection limits. Store the archive sample at 4EC away from light.
Add approximately 25 mL of hexane to each of the two remaining samples and concentrate the extract volume samples to 500 uL with a Kuderna-Danish concentrator or rotoevaporator. Transfer each extract to an 8-mL test tube with hexane. Proceed with sample cleanup procedures below (Section 4.6 for PCDD/PCDF and 4.7 for PCB).
M428 Page 45
B. Resin
Clean the Soxhlet apparatus as in Section 4.5.1.2A. The resin sample volume will most likely be too large for extraction in a single Soxhlet. In such cases, the sample can be divided into two portions. The internal standard spiking solution should also be divided into two approximately equal portions. Combine one of these resin portions with the residue rinses (4.5.1.1B) and proceed with each extraction as in Section 4.5.1.2A. Combine the two extracts, then divide into three samples - two for cleanup and one for archive as described in Section 4.5.1.2A.
4.5.2 Single Composite Sample for Analysis
4.5.2.1 Extraction of Liquid Samples
Containers No. 4 and No. 5 (Impinger Contents and Rinses)
Pour the contents of Sample Containers No. 4 and No. 5 (Sections 3.4.6 and 3.4.7) into an appropriate size separatory funnel. Do not spike with internal standards. Extract the sample three times with aliquots of methylene chloride. Combine the organic fractions and pour through Na2SO4 into a round bottom flask. Add approximately 500 uL tetradecane, and concentrate to 5 mL with a Kuderna-Danish concentrator or rotoevaporator.
4.5.2.2 Extraction of Solid Samples
Concentrate the front and back half rinses as described in Sections 4.5.1.1A and 4.5.1.1B. Clean the Soxhlet apparatus as in Section 4.5.1.2A. Combine the concentrate of the front and back half rinses with the filter and resin, and place in the Soxhlet apparatus. If the sample is too large for the Soxhlet, divide the sample and internal standard solution as described in Section 4.5.1.2B. Proceed with each extraction as described in Section 4.5.1.2A.
Combine the extracts of the solid samples with the extracts of the liquid samples (4.5.2.1). Divide the combined extract into three separate samples. One of these must be archived, one must be used for PCDD/PCDF analysis, and one for PCB analysis. The ratio of the sample size divisions after the split will be determined by the target detection limits. Store the archive sample at 4EC away from light. Add approximately 25 mL of hexane to each of the two remaining samples and concentrate the extract volume to 500 uL with a Kuderna-Danish concentrator or rotoevaporator. Transfer each extract to an 8-mL test tube with hexane. Proceed with sample cleanup procedures below (Section 4.6 for PCDD/PCDF and 4.7 for PCB).
M428 Page 46
Optional Preliminary Cleanup for PCDD/PCDF Analysis
Certain very dirty samples may require preliminary cleanup prior to column chromatography. In such cases, the following procedure is suggested. Wash the organic extract with 25 mL of doubly distilled water by shaking for two minutes and again remove and discard the aqueous layer.
CAUTIOUSLY add 50 mL concentrated sulphuric acid (Section 4.4.8) to the organic extract and shake for ten minutes. Allow the mixture to stand until the aqueous and organic layers separate (approximately ten minutes) and remove and discard the aqueous acid layer. Repeat acid washings until no color is visible in the acid layer.
Add 25 mL of doubly distilled water to the organic extract and shake for two minutes. Remove and discard the aqueous layer and dry the organic layer by adding 10 g of anhydrous sodium sulfate.
Transfer the organic extract to a centrifuge tube and concentrate to near dryness by placing the tube in a water bath at 55EC, and passing a gentle stream of filtered, purified N2 over the surface of the extract.
Reconstitute in hexane before proceeding with column chromatography.
4.6 Column Cleanup-pcdd/pcdf
Several column chromatographic cleanup options are available. The three described below are used in the order give, although not all may be required. In general, the silica and alumina column procedures are considered to be a minimum requirement. The solid samples may require the carbon/celite cleanup procedure. Acceptable alternative cleanup procedures may be used provided that they are demonstrated to generate acceptable accuracy and precision as required in Sections 5.5 and 5.6.
The analyst must demonstrate that the requirements of Sections 5.8.5 and 5.8.6 can be met using the method revised to incorporate the proposed cleanup procedure.
An extract obtained as described in the foregoing sections is concentrated to a volume of about 1 mL using the nitrogen blowdown apparatus, and this is transferred quantitatively (with rinsings) to the combination silica gel column described below.
M428 Page 47
4.6.1 Column Preparation
A. Combination Silica Gel Column
Pack a glass gravity column (200 mm x 15 mm) in the following manner:
Insert a glass wool plug (cleaned) into the bottom of the column and add, in sequence, 1 g silica gel (Section 4.4.11), 2 g base-modified silica gel (Section 4.4.14), 1 g silica gel, 4 g acid-modified silica gel (Section 4.4.13), 1 g silica gel, and a 1 cm layer of anhydrous sodium sulfate (Section 4.4.10).
B. Acid Alumnia Column
Pack a 11 mm glass gravity column as follows:
Insert a glass wool plug (cleaned) into the bottom of the column. Add 6 g of acid alumina prepared as described in Section 4.4.15. Tap the column gently to settle the alumina, and add 1 cm of anhydrous sodium sulfate to the top.
C. Carbopak/Celite Column
Take a 5 mL disposable serological pipette and cut off a 1 cm section from the constricted tip. Insert a glass wool plug (cleaned) 2.5 cm from the constriction. Add a sufficient quantity (0.3 g) of Carbopak/Celite (prepared as described in Section 4.4.14) to the tube to form a 2 cm length of the Carbon/Celite. Cap with a glass wool plug.
4.6.2 Cleanup Procedure
Elute columns A and B with hexane and discard the eluate. Check the column for channeling. If channeling is present, discard the column. Do not tap a wetted column.
Add the sample extract in 5 mL of hexane to the top of Column A along with two additional 5 mL rinses. Elute column A with 90 mL hexane directly onto column B. Elute column B with 20 mL of hexane, and discard the eluate. Elute with 20 mL of 20% methylene chloride by volume in hexane. Concentrate this fraction to about 0.5 mL using the nitrogen blowdown apparatus.
NOTE: The optimum concentration of methylene chloride will vary with activity of the alumina. With each batch of alumina, the analyst shall determine the optimum concentration for eluting the low concentration calibration standards without eluting interferences.
M428 Page 48
Elute the column with 5 mL hexane in the forward direction of flow and then in the reverse direction of flow. While still in the reverse direction, elute with 2 mL toluene, 1 mL methylene chloride/methanol/benzene (75:20:5 v/v), 1 mL methylene chloride/cyclohexane (50:50 v/v), and 2 mL hexane. Discard the eluates.
While still in the reverse direction of flow, transfer the sample concentrate to the column with hexane and elute the column in sequence with 1 mL hexane, 1 mL hexane, 1 mL hexane, 1 mL methylene chloride/cyclohexane (50:50 v/v) and 1 mL methylene chloride/methanol/benzene (75:20:5 v/v). Discard the eluate.
Turn the column over and elute in the forward direction with 4 mL toluene. Save this eluate for PCDD/PCDF analysis. Evaporate the toluene fraction to about 1 mL on a rotary evaporator using a water bath at 50EC.
Transfer to a mini-vial using a toluene rinse and concentrate to the desired volume using a gentle stream of nitrogen. Store the extracts at 4EC away from light until GC/MS analysis.
4.7 Column Cleanup - PCB
Two column chromatographic cleanup options are described below. Either may be used to remove interferences that are co-extracted from the sample. The florisil column will eliminate polar interferences.
Acceptable alternative cleanup procedures may be used provided that they are demonstrated to generate acceptable accuracy and precision as required in Sections 6.5 and 6.6.
Before using any cleanup procedure, the analyst must process a series of calibration standards through the procedure to validate elution patterns and the absence of interferences from the reagents.
An extract obtained as described in the foregoing sections is concentrated to a volume of about 1 mL using the nitrogen blowdown apparatus, and this is transferred quantitatively (with rinsings) to one of the two columns described below.
4.7.1 Column Preparation
A. Florisil Column
Place a weight of florisil (Section 4.4.16) - nominally 20 g - predetermined by calibration (see Note below) into a chromatographic column. Tap the column to settle the florisil and 1 to 2 cm of anhydrous sodium sulfate to the top.
M428 Page 49
NOTE: Florisil from different batches or sources may vary in adsorptive capacity. To standardize the amount of florisil which is used, EPA Method 625 suggests the use of a “lauric acid value.” To determine this value, an excess of lauric acid in hexane is added to a weighed amount of florisil, and the amount not adsorbed is measured by titration with sodium hydroxide. The “lauric acid value” is the milligrams of lauric acid adsorbed per gram of florisil. The amount of florisil to be used for each column is calculated by dividing 110 by this ratio and multiplying by 20 g.
B. Silica Gel Column
Pack a glass gravity column (200 mm x 15 mm) in the following manner:
Insert a glass wool plug (cleaned) into the bottom of the column and add a slurry of 10 grams of activated silica gel (Section 4.4.11) in methylene chloride. Tap the column to settle the silica gel, and then add a 1 cm layer of anhydrous sodium sulfate (Section 4.4.10).
Variations among batches of silica gel may affect the elution volume of the various PCB. Therefore, the volume of solvent required to completely elute all of the PCB must be verified by the analyst. The weight of the silica gel can then be adjusted accordingly.
4.7.2 Cleanup Procedure
A. Florisil Column
Add 60 mL of hexane to wet and rinse the sodium sulfate and florisil. Just before the exposure of the sodium sulfate layer to the air, stop the flow. Discard the eluate.
Add the sample extract in 10 mL to the top of the column along with two 2 mL rinses.
Let the column drain until the sodium sulfate layer is nearly exposed. Elute the column with 200 mL of 6% ethyl ether (Section 4.4.9) in hexane (v/v) at a rate of about 5 mL/min. All the PCB should be in this fraction. Concentrate this fraction to about 1 mL using the nitrogen blowdown apparatus.
Transfer to a mini-vial using a toluene rinse and concentrate to the desired volume using a gentle stream of nitrogen. Store the extracts at 4EC away from light until GC/MS analysis.
M428 Page 50
B. Silica Gel Column
Elute the column with 40 mL of hexane. The rate for all elutions should be about 2 mL/min. Discard the eluate and just prior to exposure of the sodium sulfate layer to the air, transfer the 1 mL sample extract onto the column using an additional 2 mL of hexane to complete the transfer. Just prior to exposure of the sodium sulfate layer to the air, add 25 mL of hexane and continue the elution of the column.
Next, elute the column with 25 mL of methylene chloride/pentane (2:3) (v/v). Concentrate the collected fraction to about 1 mL using the K-D apparatus or a rotary evaporator.
Transfer to a mini-vial using a toluene rinse and concentrate to the desired volume using a gentle stream of nitrogen. Store the extracts at 4EC away from light until GC/MS analysis.
5 GC/MS ANALYSIS - PCDD/PCDF
5.1 Apparatus - PCDD/PCDF
5.1.1 Gas Chromatograph
An analytical system complete with a temperature programmable gas chromatograph and all required accessories including syringes, analytical columns, and gases. The injection port must be designed for capillary columns. Either split, splitless, or on-column injection techniques may be employed.
5.1.2 Column
Fused silica columns are required.
A. 60 M long x 0.32 mm ID glass, coated with DB-5. This column effectively resolves each of the chlorinated groups and therefore provides data on the total concentration of each group (that is total tetra-, penta-, hexa-, hepta- and octa CDDs and CDFs).
B. 60 M Long x 0.32 mm ID fused silica capillary SP-2331 (or SP-2330) 0.25 micron film thickness.
C. Any column equivalent to the DB-5 column may be used as long as it provides separation of the PCDD/PCDF into congener classes, and resolution of 2,3,7,8-TCDD as specified in Section 5.3.5.1. This separation must be demonstrated using the performance test mixture described in Section 5.2.7.
M428 Page 51
D. Any column equivalent to the SP-2331 may be used as long as it provides resolution of 2,3,7,8-TCDD equivalent to that specified in Section 5.3.5.2. This separation must be demonstrated and documented using the performance test mixture described in Section 5.2.7.
E. Both a 60 meter DB-5 and a 60 meter SP-2331 (or SP-2330) column are required to do 2,3,7.8-substituted tetra-through hexaclorinated dioxin and furan analysis.
5.1.3 Mass Spectrometer
A low resolution mass spectrometer (LRMS) equipped with a 70 eV (nominal) ion source and capable of acquiring ion abundance data in real time Selected Ion Monitoring (SIM) for groups of seven or more ions. Electron impact ionization mode must be used. Alternatively, a high resolution mass spectrometer may be used.
5.1.4 GC/MS Interface
Any gas chromatograph to mass spectrometer interface may be used as long as it gives acceptable calibration response for each analyte of interest at the concentration required and achieves the required tuning performance criteria (Section 5.3.3). All components of the interface should be glass or glass-lined materials. Glass surfaces can be deactivated by silanizing with dichloro-dimethylsilane. To achieve maximum sensitivity, the exit end of the capillary column should be placed in the ion source. A short piece of fused silica capillary can be used as the interface to overcome problems associated with straightening the exit end of glass columns.
5.1.5 Data Acquisition System
A computer system must be interfaced to the mass spectrometer. The system must allow the continuous acquisition and storage on machine-readable media of all mass spectra obtained throughout the duration of the chromatographic program. The computer must have software that can search any GC/MS data file for ions of a specific mass and can plot such ion abundances versus time or scan number. This type of plot is defined as a Selected Ion Current Profile (SICP). Software must also be available to integrate, in any SICP, the abundance between specified time or scan-number limits.
For analysis using high resolution mass spectrometry, mass spectrometer drift must be less than or equal to 5% of the mass spectral peak width at 5% peak height during the course of GC/MS analysis. For example, ±5 parts per million for a high resolution mass spectrometer operated at 10,000 resolving power.
M428 Page 52
5.2 Reagents - PCDD/PCDF
5.2.1 Helium
Ultra high purity.
5.2.2 Standard Solutions
All TCDD standard solutions must be verified by comparison to 2,3,7,8-TCDD check standard solutions available from EPA (Environmental Monitoring Systems Lab - Las Vegas). Surrogate and internal standard solutions of 37C14-2,3,7,8-TCDD (mo 1 wt 328) and 13C12-2,3,7,8-TCDD (mo 1 wt 332), respectively, can be prepared from pure standard materials or purchased as solutions. These standards can be obtained from commercial sources (KOR isotopes,
Fifty-six Rogers Street, Cambridge, MA 02142 and Cambridge Isotope Laboratories, Inc., 141 Magazine Street, Cambridge, MA 02139). The standards should be analyzed to verify that there is no contribution from native 2,3,7,8-TCDD.
5.2.3 Stock Standard Solutions
Stock solutions must be stored in the dark at 4EC and checked frequently for signs of degradation or evaporation, especially just before preparation of working standards.
A. Prepare a mixed stock solution of 13C12-2,3,7,8-TCDD at 2.5 ng/FL and 13C12-2,3,7,8-TCDF at 2.5 ng/FL in isooctyane by appropriately diluting the commercial standards. A working solution is then prepared by dilution of the stock solution.
B. Prepare a mixed solution of 13C12-1,2,3,7,8-PeCDD and 13C12-1,2,3,6,7,8-HxCDD, each at 2.5 ng/FL in toluene by appropriate dilution of commercial standards. A working solution is then prepared by dilution of the stock solution.
C. Prepare a separate solution of 13C12-1,2,3,4,6,7,8-HpCDD and 13C12-OCDD at 5.0 ng/FL in toluene by appropriate dilution of a commercial standard.
D. Prepare mixed solutions of 2,3,7,8-TCDD, 2,3,7,8,X-PeCDD at 5.0 ng/FL, 2,3,7,8,X,Y-HxCDD, and 2,3,7,8,X,Y,Z-HpCDD at 12.5 ng/FL, and OCDD, at 25 ng/FL in toluene by appropriate dilution of commercial standards.
E. Prepare mixed solutions of 2,3,7,8-TCDF, 2,3,7,8,X-PeCDF at 5.0 ng/FL, 2,3,7,8,X,Y-HxCDF, and 2,3,7,8,X,Y,Z-HpCDF at 12.5 ng/FL, and OCDF at 25 ng/FL in toluene by appropriate dilution of commercial standards.
M428 Page 53
F. Prepare a mixed solution of 13C12-1,2,3,4-TCDD and 13C12-1,2,3,4,7,8-HxCDD at 1.0 ng/FL in toluene by appropriate dilution of commercial standards.
G. Prepare a mixed solution of 37C14-2,3,7,8-TCDD at 5.0 ng/FL and 13C12-1,2,3,7,8,9-HxCDD and 13C12-1,2,3,4,5,6,7,8-HpCDF each at 12.5 ng/FL in toluene by appropriate dilution of standards.
H. Prepare a mixed solution of 37C14-2,3,7,8-TCDD at 1.0 ng/FL, and 13C12-2,3,4,7,8-PeCDF, 13C12-1,2,3,7,8,9-HxCDD, 13C12-1,2,3,4,7,8-HxCDF, and 13C12-1,2,3,4,6,7,8-HpCDF each at 5.0 ng/FL in toluene by appropriate dilution of standards.
5.2.4 Calibration Standards
The calibration standard solutions must contain fixed concentrations of internal standards, surrogate standards, and recovery standards with varying amounts of native PCDD and PCDF standards as shown in Tables 3 and 5.
One of the calibration standard solutions should contain native standards at a concentration near but above the MDL. The other native PCDD and PCDF concentrations should include the range of concentrations expected in the stack gas sample, or should define the working range of the GC/MS system.
Some samples may require extension of the calibration range beyond the maximum concentration shown in Table 3.
Combine appropriate volumes of individual and mixed standards (Section 5.2.3) with measured amounts of tetradecane to obtain the calibration daily working standards show in Tables 3 and 5.
All standards must be stored at room temperature away from light. The solutions must be examined regularly for signs of evaporation. Calibration standard solutions must be replaced routinely after six months.
5.2.5 Internal Standard (IS) Spiking Solution
Prepare internal standard spiking solution by using appropriate volumes of stock solutions of Section 5.2.3 A, B, and C to give the desired concentrations in the calibration solution (Tables 3 and 5) and in the final extract volume (Table 4).
5.2.6 Recovery Internal Standard Spiking Solution
Use an appropriate volume or stock solution of Section 5.2.3 F to give the desired concentrations in the final extract volume (Table 4).
M428 Page 54
5.2.7 Column Performance Solutions
Any mixture of PCDD/PCDF which contains the isomers listed below may be used to check column performance. The column performance solution contains the first and the last eluting isomers of each chlorinated class on the DB-5 capillary GC column under the conditions recommended in this method, and is used to define the PCDD/PCDF homologue retention time windows. Section 5.3.5 describes other performance checks.
TCDD 1,3,6,8; 1,2,8,9; 2,3,7,8; 1,2,3,7; 1,2,3,8; 1,2,3,4; 1,2,3,9; 1,4,7,8 PeCDD 1,2,4,6,8; 1,2,3,8,9 HxCDD 1,2,3,4,6,9; 1,2,3,4,7,8; 1,2,3,4,6,8; 1,2,3,4,6,7 HpCDD 1,2,3,4,6,7,8; 1,2,3,4,6,7,9 OCDD 1,2,3,4,6,7,8,9
TCDF 1,3,6,8; 1,2,8,9 PeCDF 1,3,4,6,8; 1,2,3,8,9 HxCDF 1,2,3,4,6,8; 1,2,3,4,8,9 HpCDF 1,2,3,4,6,7,8; 1,2,3,4,7,8,9 OCDF 1,2,3,4,6,7,8,9
5.3 Initial Calibration - PCDD/PCDF
The GC/MS system must be calibrated using the internal standard technique.
Two types of calibration procedures are required. The initial calibration is required before any samples are analyzed and is required intermittently throughout sample analyses as dictated by results of routine calibration procedures described in Section 5.4.
5.3.1 GC Operating Conditions
Table 6 summarizes typical gas chromatographic capillary columns and operating conditions. The GC conditions must be established by each analyst for the particular instrumentation used by injecting aliquots of the performance check mixtures. It may be necessary to adjust the operating conditions slightly based on the observations from analysis of these mixtures. Other columns and/or conditions may be used as long as isomer specificity is demonstrated. Thereafter, a calibration mixture of isomers should be analyzed on a daily basis in order to verify the performance of the system.
5.3.2 MS Operating Conditions
Analyze standards and samples with the mass spectrometer operating in the selected ion monitoring (SIM) mode using a scan time to give at least five data points for each ion during elution of each GC peak. For LRMS, use accurate masses from Table 7 to
M428 Page 55
one decimal place for the tetra to octa congeners and their appropriate internal standards. If HRMS is desired, then accurate masses to four decimal places shall be used.
5.3.3 GC/MS Tuning Criteria
Establish operating parameters for the GC/MS system. The instrument should be tuned to meet the isotopic ratio criteria listed in Table 7 for PCDDs and PCDFs.
5.3.4 Calibration Procedure
Using stock standards, prepare multi-level GC/MS calibration standards keeping the recovery standards and the internal standards at fixed concentrations (Tables 3 and 5). Recommended concentration levels for calibration standards are given in Section 5.2.4 (Tables 3 and 5). These values may be adjusted to ensure that the analyte concentration falls within the calibration range.
Inject a 1 FL or 2 FL aliquot of calibration standards. All injections of standards, sample extracts and blank extracts must be of an equal volume.
Standards must be analyzed using the same solvent as that used in the final sample extract. A wider calibration range is useful for higher level samples, provided it can be described with the linear range of the method, and the identification criteria defined in Section 5.6.2 are met. Calculate relative response factors as described in Section 5.7.1.
5.3.5 GC Performance Criteria
Once tuning and mass calibration procedures have been completed, inject a column performance check mixture (Section 5.2.7) into the GC/MS system.
The GC column performance check solution must be analyzed under the same chromatographic and mass spectrometric conditions used for other samples and standards.
Because of the known overlap between the late-eluting tetra isomers and the early-eluting penta isomers under certain column conditions, it may be necessary to perform two injections to define the TCDD/TCDF and PeCDD/PeCDF elution windows, respectively.
Use this performance check mixture to check the following parameters:
(a) The retention windows for each of the homologues. (b) The GC resolution of 2,3,7,8-TCDD as described in Sections 5.3.5.1 and 5.3.5.2. (c) The relative ion abundance criteria listed for PCDDs and PCDFs in Table 7.
M428 Page 56
GC column performance should be checked daily for resolution and peak shape using the check mixture.
5.3.5.1 DB-5 Column Performance Criteria
GC column performance must be demonstrated initially and verified prior to analyzing any sample in a 12-hour period (Section 5.3).
The DB-5 column performance solution must establish chromatographic resolution between 2,3,7,8-TCDD and other close eluting TCDD isomers. There must be a 25% valley or less between the gas chromatographic peak observed for 2,3,7,8-TCDD and adjacent peaks arising from the close eluters.
At a minimum, the solution must contain 1237, 1238, 2378, and 1239-TCDD.
Draw a baseline for the isomer cluster representing 1478, 1239, 2378, 1237, 1238, and
1234-TCDD. Measure the distance X from the baseline to the valley preceding or following the 2,3,7,8-TCDD peak and Y, the peak height of 2,3,7,8-TCDD.
Valley Percent = (X/Y) x 100
It is the responsibility of the laboratory to verify the conditions suitable for maximum resolution of 2,3,7,8-TCDD from the close eluting TCDD isomers. The peak representing 2,3,7,8-TCDD should be labeled and identified as such on all chromatograms.
The 2,3,7,8-TCDD must be separated from close eluting isomers with no more than a 25 percent valley relative to the 2,3,7,8-TCDD peak.
The following must be resolved on a 60 meter DB-5 column with a 60% valley.
1,2,3,4,7,8-HxCDD and 1,2,3,4,6,8-HxCDD
5.3.5.2 SP-2331 GC Column Performance
GC column performance must be demonstrated during initial calibration and verified prior to analyzing any sample in a 12-hour period (Section 5.3).
The verification consists of injecting a mixture containing TCDD isomers that elute close to 2,3,7,8-TCDD, and demonstrating separation of 2,3,7,8-TCDD from close eluters with no more than a 25 percent valley relative to the 2,3,7,8-TCDD peak.
M428 Page 57
The minimum requirement is a solution which contains 1478, 2378, 1237, and 1238-TCDD.
The column performance solution must also contain both isotopically labeled 2,3,7,8-TCDD standards.
5.3.6 SIM Sensitivity
Verify acceptable SIM sensitivity during initial calibration. This is demonstrated by a minimum signal-to-noise ratio of 5:1 for the quantitation ions obtained from injection of the calibration standard with the lowest concentration.
5.4 Daily Calibration - PCDD/PCDF
Routine calibration requires analysis of the column performance check solution (Section 5.2.7) and a concentration calibration solution (Section 5.4.2) containing all of the calibration standards listed in Table 3.
5.4.1 Column Performance Check
Inject a 2 FL aliquot of the column performance check mixture (Section 5.2.7). Acquire at least five data points for each GC peak and use the same data acquisition time for each of the ions being monitored.
Use the same data acquisition parameters previously used to analyze concentration calibration solutions during the initial calibration.
The column performance check solution must be run at the beginning and end of a 12hour period. If the laboratory operates during consecutive 12-hour shifts, analysis of the performance check solution at the beginning of each 12-hour period and at the end of the final 12-hour period is sufficient.
Document acceptable column performance as described in Section 5.3.5.
5.4.2 Calibration Check Standard
Inject a 2 FL aliquot of the calibration standard solution at 200 pg/FL (mid-range) at the beginning of a 12-hour period. Determine and document acceptable calibration, that is, SIM sensitivity and relative abundance criteria as specified in Section 5.3.5 and 5.3.6.
The measured RRFs of all analytes must be within 30 percent of the mean values established by initial analyses of the calibration standard solutions.
M428 Page 58
5.5 GC/MS Analysis - PCDD/PCDF
Approximately one hour before HRGC/LRMS or HRGC/HRMS analysis, adjust the sample extract volume to approximately 50 FL or 10 FL depending on the desired detection limit. This may be done by adding to the sample extract sufficient recovery standard (Section 5.2.6) to give the required concentration (Table 4).
Calibrate the system daily as described in Section 5.3.4. The volume of calibration standard injected should be approximately the same as all sample injection volumes.
Inject a 1 FL or 2 FL aliquot of the sample extract on to the DB-5 column. Use the same volume as that used during calibration.
The presence of tetra - octa congeners is qualitatively confirmed if the criteria of Section 5.6.2 are achieved.
For quantitation, measure the response of the native congener and the internal standard mass (see Table 7). A correction must be made for contribution to m/e 328 by any native TCDD which may be present. To do this, subtract 0.009 of the 322 response from the 328 response.
Calculate the concentration of native congener using the mean relative response factor (RRF) and Equations 428-7 and 428-8. If the calculated concentration is above the upper calibration range, report, with an appropriate not, the data obtained by extropolation of the calibration curve. The sample shall be diluted and re-injected only if there is saturation of the amplifier of the mass spectrometer. The point of saturation must have been determined previously during a multipoint calibration. If the native congener is not present, calculate the detection limit as described in Section 5.7.3.
This method allows re-analysis by HRMS of extracts prepared for LRMS. In such cases, the internal standard to analyte ratios are less than ideal, and the analyst must indicate this when reporting the data.
5.5.1 Quantitation of 2,3,78-substituted PCDDs and PCDFs
The concentrations of 1,2,3,4,6,7,8-HpCDD, 1,2,3,4,6,7,8-HpCDF, 1,2,3,4,7,8,9-HpCDF, and OCDF are determined from analysis on the 60 m DB-5 column.
The concentrations of 2,3,7,8-TCDD, 2,3,7,8-TCDF, 1,2,3,7,8-PeCDD and PeCDF, 2,3,4,7,8-PeCDF, 1,2,3,4,7,8-HxCDD and HxCDF, 1,2,3,6,7,8-HxCDD and HxCDF, 1,2,3,7,8,9-HxCDD and HxCDF, 2,3,4,6,7,8-HxCDF are obtained from the analysis of the sample extract on the 60 m SP-2331 or SP-2330 column.
M428 Page 59
5.6 Qualitative Analysis - PCDD/PCDF
5.6.1 Retention Windows
The retention window for a given homologous series is defined as the period of elution of the congener groups starting at the point where the first isomer elutes and ending at the point where the last isomer elutes.
Retention time windows for each isomer group must be established with the column performance solution prior to sample analysis and whenever the retention times shift significantly.
5.6.2 Identification Criteria for PCDD & PCDF
5.6.2.1 Ion Criteria for PCDD and PCDF
1. All of the characteristic ions, that is, quantitation ions and confirmation ions, listed in Table 7 for each class of PCDD and PCDF must be present in the reconstructed ion chromatogram. If LRMS is use, the M - COC1 ion must be monitored as well. This is optional when detection is by HRMS.
Detection limits will be based on quantitation ions within the molecules in cluster.
2. The maximum intensity of each of the specified characteristic ions must coincide within two scans or two seconds.
3. The monitored mass ratio must be within ±15% of the standard mass ratio specified in Table 7.
5.6.2.2 Relative Retention time (RRT) Criteria
The retention time of the native congener must be within ±0.006 RRT units of the standard RRT. This relationship of native substituted CDDs and CDFs and their isotopically labeled internal standards must be maintained.
5.6.2.3 Signal-to-Noise Ratio
The signal to mean noise ratio must be 2.5 to 1 or better for the quantitation and confirmation ions. The level can be predetermined by the instrument software.
Co-eluting impurities are suspected if all criteria except the isotone ratio criteria are achieved. If broad background interference restricts the sensitivity of the GC/MS analysis, the analyst must employ additional cleanup procedures and reanalyze by GC/MS.
M428 Page 60
Where these procedures do not yield conclusive results, the use of high resolution mass spectrometry or HRGC/MS/MS is suggested.
5.6.2.4 Monitoring Interfering Ions
For reliable detection and quantitation of PCDF, it is required that the analyst monitor signals arising from chlorinated diphenyl ethers which, if present, could give rise to fragment ions with masses identical to those monitored as indicators of PCDF.
Appropriate chlorinated diphenyl ether masses (M-70) must be monitored simultaneously with the PCDF ion masses (M). Only when the response for the diphenyl ether ion mass is not detected at the same time as the PCDF ion mass, can the signal obtained for the apparent PCDF be considered unique. Chlorinated diphenyl ether interferences must be reported.
5.7 Quantitative Analysis - PCDD/PCDF
Table 6 summarizes typical gas chromatographic capillary columns and operating conditions. For the particular instrument used, the GC conditions must be established by each analyst by injecting aliquots of the performance check mixtures. It may be necessary to adjust the operating conditions slightly based on the observations from analysis of these mixtures. Other columns and/or conditions may be used as long as isomer specificity is demonstrated. Thereafter, a calibration mixture of isomers must be analyzed on a daily basis in order to verify the performance of the system.
The laboratory may proceed with the analysis of samples and blanks only after demonstrating acceptable calibration as specified in Sections 5.4.1 and 5.7.2.
Analyze standards and samples with the mass spectrometer operating in the selected ion monitoring (SIM) mode using a scan time to give at least five points per peak. For LRMS, use accurate masses from Table 7 to one decimal place for the tetra to octa congeners, and their appropriate internal standards. If HRMS is desired, then accurate masses to four decimal places should be used.
5.7.1 Relative Response Factors
5.7.1.1 RRF from Initial Calibration Data
Use equation 428-4 to calculate the relative response factors (RRFs) for each calibration congener in each calibration solution (Table 3 and 5).
Table 8 lists the native dioxins and furans, surrogate standards, internal standards, and the corresponding internal standards and calibration standards used for quantitation and calculation of RRFs.
M428 Page 61
Calculate the mean RRF for each congener. This is the average of the five RRFs calculated for that congener (one RRF calculated for each calibration solution).
5.7.1.2 RRF from Daily Calibration Data
The RRF must be verified on each work shift if 12 hours or less, by the measurement of one or more calibration standards (one must be the medium level standard). If the calculated response differs from the predicted response by more than 30%, a new calibration curve must be prepared.
5.7.1.3 RRF for Determining Total Homologue Concentration
If the homologue group contains only one isomer (e.g., OCDD, OCDF) or only one 2,3,7,8-substituted isomer (TCDD, PeCDD, HpCDD, TCDF), use the same RRF as the mean RRF determined in Section 5.7.1.1.
If the homologue group contains more than one 2,3,7,8-substituted isomer (HxCDD, PeCDF, HxCDF, HpCDF), use the mean of the RRFs calculated in Section 5.7.1.1 for all individual 2,3,7,8-substituted isomers of that homologue group. This assumes that for a homologous series, the relative response factors of the isomers other than the 2,3,7,8-substituted isomers are the same as the mean response of all of the 2,3,7,8-substituted isomers in that homologous series.
5.7.1.4 RRF for Determining Internal Standard Recovery
Use calibration data and equation 428-6 to calculate the response factor of each internal standard relative to an appropriate recovery standard. Calculate the mean RRF for each internal standard. This is the average of the five RRFs calculated for that internal standard (one RRF per calibration solution).
5.7.1.5 RRF for Determining Surrogate Standard Recovery
Use calibration data and Equation 428-6 to calculate the response factor of each surrogate standard relative to an appropriate internal standard. Calculate the mean RRF for each surrogate standard. This is the average of the five RRFs calculated for that surrogate standard (one RRF per calibration solution).
5.7.2 Relative Standard Deviation of Relative Response Factors
For each analyte, calculate the standard deviation (SD) and the percent relative standard deviation (%RSD).
(% RSD = SD + RRF x 100)
M428 Page 62
The laboratory must demonstrate that RRF values over the working range for native dioxins/furans are constant. Use the mean RRF (Sections 5.7.1.1 to 5.7.1.5) for calculations. The percent relative standard deviation of the RRFs must not exceed 15 percent. When the RSD exceeds 15%, analyze additional aliquots of appropriate calibration solutions to obtain an acceptable RSD of RRFs over the entire concentration range or take action to improve GC/MS performance.
The surrogate RRF must also be verified on each work shift of twelve (12) hours or less. If the response varies by more than 30% from the predicted response, the test must be repeated.
5.7.3 Minimum Detection Limits
If the signal-to-noise ratio is less than 2.5 for both quantitation ions for a particular 2,3,7,8-substituted isomer, measure the mean noise for the quantitation ion in the region of the mass chromatogram corresponding to the elution of the internal standard for that congener. For those congeners that do not have 13C-labeled standard, use the mean noise in the region of the mass chromatogram where, from comparison with routine calibration data, the calibration congener is expected to elute.
Calculate the minimum detection limit according to Equations 428-9 and 428-10.
If an interfering signal is present in the mass window, choose the ion not interfered with to calculate a detection limit using Equations 428-9 and 428-10. If both ions have interferences which are more than 2.5 times the noise, compute the detection limit using the mass which will give the most conservative result. Report the presence of interferences.
5.7.4 Estimated Maximum Possible Concentration
If the response of the quantitation ions is determined to be greater than 2.5 times the background signal, but qualitative identification criteria are not met, an “estimated maximum possible concentration” must be calculated according to Equations 428-7 and 428-8.
6 GC/MS ANALYSIS - PCB
6.1 Apparatus - PCB
6.1.1 Gas Chromatograph
An analytical system complete with a temperature programmable gas chromatograph equipped with all required accessories such as syringes, gases, and a capillary column. The GC injection port must be designed for capillary columns. Splitless injection is the standard method.
M428 Page 63
On-column injection is encouraged. Split injections are not recommended.
6.1.2 Column
Fused silica capillary columns are required.
A. 30 M long x 0.32 mm ID silica, coated with a 0.25 F or thicker (< 1 F) film cross linked phenyl methyl silicone such as DB-5.
B. 30 M long x 0.32 mm ID silica coated with a 0.25 F or thicker (< 1 F) film polydiphenyl vinyl dimethyl siloxane, such as SE-54, Alltech Associates, Deerfield, IL.
Both columns, under appropriate operating conditions, will produce acceptable results which can be used to determine total concentration of each isomer group (that is, total mono to decachlorinated PCD).
A 60 M column is recommended to minimize the need for the corrections for interferences described in Section 6.6.2.4.
Any column equivalent to the DB-5 or SE-54 columns may be used as long as it has the same separation capabilities as the DB-5 and SE-54 columns.
6.1.3 Mass Spectrometer
A low resolution mas spectrometer (LRMS) capable of acquiring Single Ion Monitoring (SIM) data with electron ionization at a nominal electron energy of 70 eV. The required scan rate must allow acquisition of at least five data points for each monitored ion during elution of each GC peak.
6.1.4 GC/MS Interface
The requirements are the same as those described in Section 5.1.4 for PCDD/PCDF analysis.
6.1.5 Data Acquisition System
The requirements are the same as those described in Section 5.1.5 for PCDD/PCDF analysis.
6.2 Reagents - PCB
6.2.1 Stock Standard Solutions (1.00 Fg/FL)
Standard solutions can be prepared from pure standard materials or purchased as certified solutions.
M428 Page 64
6.2.2 Preparation of Stock Solutions
Ten individual PCB congeners listed in Table 10 are used as concentration calibration compounds for PCB determinations. One isomer at each level of chlorination is used as the concentration calibration standard for all other isomers at that level of chlorination.
A. Prepare stock standard solutions of each of the PCB concentration calibration congeners (Table 10) by accurately weighing about 0.0125 g of pure material. Dissolve the material in hexane and dilute to volume in a 10 mL volumetric flask. Larger volumes may be used at the convenience of the analysts.
When compound purity is assayed to be 96% or greater, the weight may be used without correction to calculate the concentration of the stock standard. Commercially prepared stock standards may be used at any concentration if they are certified by the manufacturer or by an independent source.
Transfer each stock standard solution to a clean glass vial with a Teflon-lined screw cap. Store at 4EC and protect from light. Stock standard solutions should be checked frequently for signs of degradation or evaporation, especially just prior to preparing calibration standards from them.
Stock standard solutions must be replaced every six months or sooner, if comparison with quality control check samples indicates a problem.
B. Prepare stock solutions of the four internal standards listed in Table 10 at concentrations of 1000 ng/FL.
C. Prepare stock solutions of the recovery standard - 2,2'-difluorobiphenyl, d12-chrysene, or d10-phenanthrene at concentrations of 1000 ng/FL.
CAUTION: Each time a vial containing a small volume of solution is warmed to room temperature and opened, a small volume of solvent in the vial head space evaporates, significantly affecting concentration. Store solutions with the smallest possible volume of head space, and minimize the frequency of opening vials.
6.2.3 PCB Primary Dilution Standard
Take aliquots of the ten PCB stock standard solutions and mix together in the proportions of one part of each solution of the monoCB, diCB, and triCB congeners, with two parts of each solution of the tetraCB, pentaCB, and hexaCB congeners, three parts of each solution of the heptaCB and octaCB congeners, and five parts of the nonaCB and decaCB congener solution. This will provide a primary dilution standard
M428 Page 65
solution containing 50 ng/FL monoCB, diCB and triCB, 100 ng/FL tetra, penta, and hexaCB, 150 ng/FL hepta and octaCB, and 250 ng/FL nona and decaCB. Place each solution in a clean glass vial with a Teflon-lined screw cap and store at 4EC. Mark the meniscus on the vial wall to monitor solution volume during storage. Stock standard solutions must be replaced every six months or sooner, if comparison with quality control, check samples indicates a problem.
6.2.4 Calibration Standards
Prepare calibration standards at a minimum of five concentration levels. One of the calibration standards should be at a concentration near, but above, the method detection limit: The others should correspond to the range of concentrations found in real samples but should not exceed the working range of the GC/MS system.
Prepare solutions by diluting appropriate primary dilution standards and adding an appropriate volume of internal standard solution.
Appropriate concentrations for LRMS are given in Table 10. Combine appropriate volumes of individual standards with measured volumes of hexane to obtain the calibration daily working standards shown in Table 10.
The solutions must contain constant concentrations of the internal standards with varying amounts of the native PCB standards (Table 10).
All standards must be stored at 4EC and must be freshly prepared if QC check acceptance criteria (Section 7.5) indicate a problem. The daily calibration standards must be prepared every three months and stored at 4EC.
6.2.5 Internal Standard (IS) Spiking Solution
Prepare internal standard spiking solution by using appropriate volumes of stock solutions of Section 6.2.2 to give the desired concentrations in the final extract volume (Table 11). The concentration of the internal standards in the IS spiking solution must be such that the amount of solution spiked is in the range of 25 to 250 FL.
6.2.6 Recovery Internal Standard Spiking Solution
Use an appropriate volume of stock solution of Section 6.2.2 to give the desired concentrations in the final extract volume (Table 11). These values change depending on the matrix.
M428 Page 66
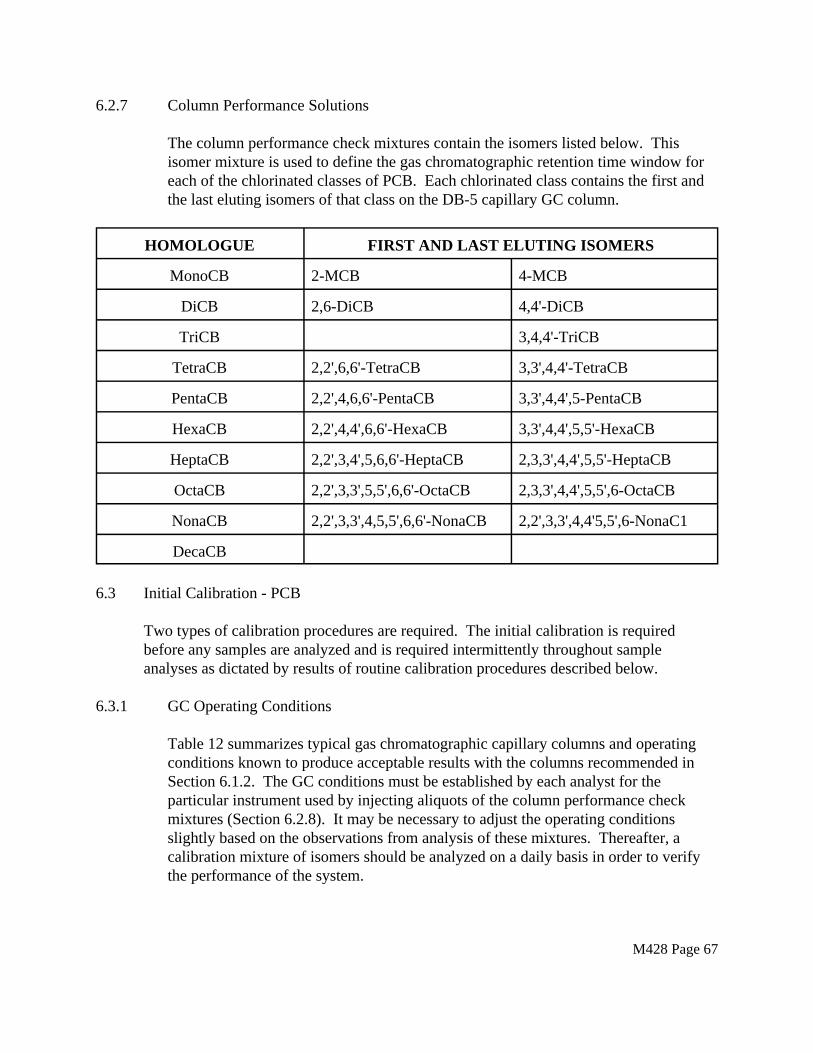
6.2.7 Column Performance Solutions
The column performance check mixtures contain the isomers listed below. This isomer mixture is used to define the gas chromatographic retention time window for each of the chlorinated classes of PCB. Each chlorinated class contains the first and the last eluting isomers of that class on the DB-5 capillary GC column.
HOMOLOGUE FIRST AND LAST ELUTING ISOMERS
MonoCB 2-MCB 4-MCB
DiCB 2,6-DiCB 4,4'-DiCB
TriCB 3,4,4'-TriCB
TetraCB 2,2',6,6'-TetraCB 3,3',4,4'-TetraCB
PentaCB 2,2',4,6,6'-PentaCB 3,3',4,4',5-PentaCB
HexaCB 2,2',4,4',6,6'-HexaCB 3,3',4,4',5,5'-HexaCB
HeptaCB 2,2',3,4',5,6,6'-HeptaCB 2,3,3',4,4',5,5'-HeptaCB
OctaCB 2,2',3,3',5,5',6,6'-OctaCB 2,3,3',4,4',5,5',6-OctaCB
NonaCB 2,2',3,3',4,5,5',6,6'-NonaCB 2,2',3,3',4,4'5,5',6-NonaC1
DecaCB
6.3 Initial Calibration - PCB
Two types of calibration procedures are required. The initial calibration is required before any samples are analyzed and is required intermittently throughout sample analyses as dictated by results of routine calibration procedures described below.
6.3.1 GC Operating Conditions
Table 12 summarizes typical gas chromatographic capillary columns and operating conditions known to produce acceptable results with the columns recommended in Section 6.1.2. The GC conditions must be established by each analyst for the particular instrument used by injecting aliquots of the column performance check mixtures (Section 6.2.8). It may be necessary to adjust the operating conditions slightly based on the observations from analysis of these mixtures. Thereafter, a calibration mixture of isomers should be analyzed on a daily basis in order to verify the performance of the system.
M428 Page 67
6.3.2 MS Operating Conditions
Analyze standards and samples with the mass spectrometer operating in the selected ion monitoring (SIM) mode using a scan time to give at least five data points for each ion during elution of each GC peak. Total cycle time should be $ 1.5 seconds. Use the masses listed in Table 13 for the mono to deca chlorinated biphenyls and their appropriate internal standards.
6.3.3 GC/MS Tuning Criteria
The instrument must be tuned to meet the isotopic ratio criteria listed in Table 13 and the sensitivity requirements of Section 6.3.6.
6.3.4 Calibration Procedure
Using stock standards, prepare multi-level GC/MS calibration standards keeping the recovery standard and the internal standards at fixed concentrations. Recommended concentration levels for calibration standards are given in Section 6.2.5. These values must be adjusted as necessary to ensure that the analyte concentration falls within the calibration range.
Inject a 1 FL or 2 FL aliquot of calibration standards. All injections of standards, sample extracts and blank extracts must be of an equal volume.
Standards must be analyzed using the same solvent as that used in the final sample extract. A wider calibration range is useful for higher level samples provided it can be described with the linear range of the method, and the identification criteria defined in Section 6.6.2 are met.
Record a spectrum of each component of the concentration calibration solution using GC and MS operating conditions described in Sections 6.3.1 and 6.3.2.
When acquiring SIM data, GC operating conditions must be carefully reproduced for each analysis to provide reproducible retention times. This will ensure that ions are monitored at the appropriate times.
Data can be acquired with five ion sets (# 25 ions each) according to the option presented in Tables 14 and 15.
The time (scan number) for initiation of data acquisition with each ion set must be determined from the retention times (scan numbers) of the retention time congeners.
Begin data acquisition with Ion Set #1 before elution of the first eluting Mono-CB. Stop acquisition with Ion Set #1 and begin acquisition with Ion Set #2 just
M428 Page 68
(approximately 10 s) before elution of the first eluting penta-CB. Stop acquisition with Ion Set #2 and begin acquisition with Ion Set #3 just (approximately 10 s) after elution of the last eluting tetra-CB congener. Stop acquisition with Ion Set #3 and begin acquisition with Ion Set #4 just (approximately 10 s) after elution of the last eluting penta-CB. Stop acquisition with Ion Set #4 just (approximately 10 s) after elution of the last eluting hepta-CB. Begin acquisition with Ion Set #5 just (approximately 10 s) before elution of the first eluting nona-CB.
Whether the analyst uses the SIM descriptors suggested in Tables 14 and 15 or combines different ion sets, the analyst must document that no information will be lost in switching from one ion set to the next. The analyst shall satisfy this requirement by using a mixture that contains all of the PCB isomers. If such a mixture is not available, a commercially available mixture of Arachlors shall be used.
From analyses of each of the five concentration calibration solutions, calculate the mean RRF for each PCB calibration congener (Section 6.7.1). Section 6.7.2 describes the criteria for reproducibility of relative response factors.
Update the relative response factors after daily calibration.
6.3.5 GC Performance Criteria
Once tuning and mass calibration procedures have been completed according to Section 6.3, inject a column performance check mixture (Section 6.2.8) into the GC/MS system.
Use the performance check mixture to check the following parameters:
(a) The retention windows for each of the homologues. (b) The isotopic ratio criteria listed for PCB in Table 13.
Establish retention windows for congeners in each chlorinated class.
The analyst must demonstrate baseline separation of 2,2', 3,4,5'-pentachlorobiphenyl from 2,2',4,4',5,6'-hexachlorobiphenyl and 3,3,'4,4'-tetrachlorobiphenyl which may co-elute.
Absolute retention times from one analysis to the next must not vary by more than ±10 seconds for those PCB retention time congeners that are used to determine when ion sets are changed.
M428 Page 69
6.3.6 SIM Sensitivity
Verify acceptable SIM sensitivity during initial calibration. This is indicated by a signal-to-noise ratio $ 5 for the quantitation ions of the lowest concentration calibration standard.
6.4 Daily Calibration
With the daily calibration procedures described in Section 6.4.1 and 6.4.2, verify initial calibration at the beginning and end of each 12-hour period during which analyses are to be performed. Routine calibration requires analysis of the column performance check solution (Section 6.2.7) and a concentration calibration solution containing all of the calibration standards listed in Table 10.
6.4.1 Column Performance Check
Inject a 1 FL or 2 FL aliquot of the column performance check mixture (Section 6.2.8). Acquire at least five data points for each GC peak and use the same data acquisition time for each of the ions being monitored.
NOTE: Use the same data acquisition parameters previously used to analyze concentration calibration solutions during the initial calibration.
This column performance check solution must be run at the beginning and end of each 12-hour period during which analyses are to be performed. If the laboratory operates during consecutive 12-hour shifts, analysis of the performance check solution at the beginning of each 12-hour period and at the end of the final 12-hour period is sufficient.
Demonstrate and document acceptable reproducibility of absolute retention times of PCB retention time congeners as required in Section 6.3.5.
Document acceptable column performance according to criteria described in Sections 6.3.5 and 6.3.6.
6.4.2 Calibration Standard Check
Inject a 1 FL or 2 FL aliquot of the medium level calibration standard solution at the beginning of each 12-hour period. Analyze with the same conditions used during the initial calibration.
Determine and document acceptable calibration as specified in Sections 6.3.4 and 6.3.5 above, that is, SIM sensitivity and isotope ratio criteria.
M428 Page 70
The measured RRFs of all analytes must be within 30 percent of the mean values established during initial calibration or the daily calibration, whichever is the most recent. Otherwise, remedial action must be taken. Re-calibrate if necessary.
Determine that neither the area measured for m/z 240 for d12 chrysene nor that for m/z 188 for d10 phenanthrene has decreased by more than 30% from the area measured in the most recent previous analysis of a calibration solution or by more than 50% from the mean area measured during initial calibration.
The following remedial actions must be undertaken when the calibration criteria are not met.
1. Check and adjust GC and/or MS operating conditions. Perform all initial calibration procedures.
2. Clean or replace injector liner. 3. Flush column with solvent according to manufacturer’s instructions. Perform all
initial calibration procedures. 4. Break off a short portion (approximately 0.33 m) of the column; check column
performance by analysis of the performance check solution. 5. Replace GC column. Perform all initial calibration procedures. 6. Adjust MS for greater or lesser resolution. 7. Calibrate MS mass scale.
6.5 GC/MS Analysis - PCB
Approximately 1 hr before HRGC/LRMS analysis, adjust the sample extract volume to approximately 500 FL or 200 FL depending on the desired detection limit. This may be done by adding to the sample extract sufficient recovery standard (Section 6.2.7) to give the required concentration (Table 11).
Calibrate the system daily as described in Section 6.3.4. The volume of calibration standard injected should be approximately the same as all sample injection volumes.
Inject a 1 FL or 2 FL (normally 2 FL) aliquot of the sample extract in the GC. Operate the GC under the same conditions used to produce acceptable results during calibration.
Acquire mass spectral data. Use the same data acquisition time and MS operating conditions previously used to determine relative response factors during calibration (Section 6.3.4).
The presence of mono to deca congeners is qualitatively confirmed if the criteria of Section 6.6.2 are achieved.
For quantitation, measure the response of the native congener and the internal standard mass (see Table 13).
M428 Page 71
Calculate the total mass of native congener in the sample using the relative response factor (RRF) (Equation 428-4) and Equation 428-7. If the calculated concentration is above the upper calibration range, report, with an appropriate note, the data obtained by extrapolation of the calibration curve. The sample shall be diluted and re-injected only if there is saturation of the amplifier of the mass spectrometer. The point of saturation must have been determined previously during a multipoint calibration.
If the native congener is not present, calculate the detection limit as described in Section 6.7.3.
6.6 Qualitative Analysis - PCB
6.6.1 Retention Windows
The retention window is defined as the period of elution of the congener groups starting at the point where the first isomer elutes and ending at the point where the last isomer elutes. Retention time windows for each isomer group can be determined with the column performance standard (Section 6.2.8).
6.6.2 Identification Criteria for PCB
6.6.2.1 Ion Criteria for PCB
1. All of the characteristic ions, that is, quantitation ions and confirmation ions, listed in Table 13 for each class of PCB must be present in the reconstructed ion chromatogram. Detection limits will be based on quantitation ions within the molecules in cluster.
2. The quantitation and confirmation ions for each PCB isomer group must maximize within ±1 scan of each other.
3. For each PCB isomer group candidate, the ratio of the quantitation ion area to the confirmation ion area must be within ±15% of the theoretical ratio specified in Table 13.
6.6.2.2 Retention Time Criteria
Absolute retention times of the internal standard compounds must be within ±10 seconds of that measured during the last previous continuing calibration check.
The retention time of the native congener must be within ±0.006 RRT units of the standard RRT. This relationship of native substituted PCB and their isotopically labeled internal standards must be maintained.
M428 Page 72
6.6.2.3 Signal-to-Noise Ratio
The signal for each quantitation and confirmation ion must be at least $2.5 times the mean noise, and must not have saturated the detector.
Co-eluting impurities are suspected if all criteria except the isotope ratio criteria are achieved. If broad background interference restricts the sensitivity of the GC/MS analysis, the analyst must employ additional cleanup procedures and reanalyze by GC/MS.
6.6.2.4 Monitoring Interfering Ions
The following identification procedures and methods for correcting for interfering ions were obtained from EPA Method 680.
For all PCB target compounds, confirm the presence of an (M-70) ion cluster by examining SICPs for at least one of the most intense ions in the appropriate cluster.
For trichlorinated to heptachlorinated isomer groups, examine SICPs for intense (M+70) ions that would indicate a co-eluting PCB containing two additional chlorines. If this interference occurs, obtain and record the area for the appropriate ion (Table 13) for the candidate PCB isomer group, and use the information in Tables 18 to correct the measured abundance or M .
For example, if a C17-PCB and a C15-PCB candidate co-elute, the C17-PCB will contribute to the ion measured for m/z 326 and 324, the quantitation and confirmation ions, respectively, for a C15-PCB. Obtain and record the area for m/z 322 (the lowest mass ion produced by a CL7-PCB in the (M±70) ion cluster of a C15-PCB fragment). To determine the m/z 326 and m/z 324 areas produced by the C15-PCB, calculate C17-PCB contribution to each and subtract it from the measured areas for m/z 326 and m/z 324. In this example, 164% of the area measured for m/z 322 should be subtracted from m/z 324, and 108% of the m/z 322 area should be subtracted from the area measured for m/z 326 (Table 18).
For dichlorinated to octachlorinated PCB target compounds, examine SICPs for intense (M+35)+ ions that would indicate a co-eluting PCB containing one additional chlorine. This co-elution causes interferences because of the natural abundance of 13C. This inference will be small and can be neglected except when measuring the area of a small amount of a PCB co-eluting with a large amount of another PCB containing one more chlorine. To correct for this interference, obtain and record the area for appropriate ion (Table 19) from the (M-1)+ ion cluster, and use the information in Table 19 to correct the measured area of the quantitation ion.
M428 Page 73
6.7 Quantitative Analysis - PCB
Table 12 summarizes typical operating conditions for the DB-5 gas chromatographic capillary column. For the particular instrument used, the GC conditions must be established by each analyst by injecting aliquots of the performance check mixtures. It may be necessary to adjust the operating conditions slightly based on the observations from analysis of these mixtures. Other columns and/or conditions may be used as long as acceptable results are obtained as required by Sections 6.3.5 and 6.3.6. Thereafter, a calibration mixture of isomers should be analyzed on a daily basis in order to verify the performance of the system.
The laboratory may proceed with the analysis of samples only if acceptable calibration has been demonstrated according to Sections 6.4.1 and 6.7.2.
Analyze standards and samples with the mass spectrometer operating in the selected ion monitoring (SIM) mode using a scan time to give at least five points per peak. Use the masses from Table 13, and the data acquisition program used during calibration (Section 6.3.4).
Use SICP data to calculate the ratio of the measured peak areas of the quantitation ion and confirmation ion(s), and compare to the acceptable ratio (Table 13). If acceptable ratios are not obtained, a co-eluting compound may be interfering. Examine the data from several scans to determine whether additional background corrections can be made to improve the ion ratio.
6.7.1 Relative Response Factors
6.7.1.1 RRF from Initial Calibration Data
Use Equation 428-4 to calculate the relative response factors (RRFs) for each calibration congener in each calibration solution.
The native PCBs and the corresponding internal standards and calibration standards used for quantitation and calculation of RRFs are listed in Table 16.
Calculate the mean RRF for each calibration congener. This is the average of the five RRFs calculated for that congener (one RRF calculated for each calibration solution).
6.7.1.2 RRF from Daily Calibration Data
The RRF must be verified on each work shift of 12 hours or less, by the measurement of one or more calibration standards (one must be the medium level standard). If the calculated response differs from the predicted response by more than 30%, a new calibration curve must be prepared.
M428 Page 74
6.7.1.3 RRF for Determining Total Homologue Concentrations
Use the mean RRF determined in Section 6.7.1.1 for the calibration congener for that homologue group. This assumes that for a homologous series, the relative response factors of the isomers other than the calibration congener are the same as the mean response of the calibration congener.
6.7.2 Relative Standard Deviation of Relative Response Factors
For each analyte, calculate the standard deviation (SD) and the percent relative standard deviation (%RSD).
(% RSD = SD / RRF x 100)
The laboratory must demonstrate that RRF values over the working range for native dioxins/furans are constant. Use the mean RRF (Section 6.7.1.1) for calculations. The percent relative standard deviation of the RRFs must not exceed 15 percent. When the RSD exceeds 15%, analyze additional aliquots of appropriate calibration solutions to obtain an acceptable RSD of RRFs over the entire concentration range, or take action to improve GC/MS performance.
6.7.3 Minimum Detection Limits
If the signal-to-noise ratio is less than 2.5 for both quantitation ions for the congeners of a homologue group, measure the mean noise for the retention window of the quantitation ion of the calibration standard for that homologue group.
Calculate the minimum detection limit according to Equations 428-9 and 428-10.
If an interfering signal is present in the mass window, choose the ion not interfered with to calculate a detection limit using Equations 428-9 and 428-10. If both ions have interferences which are more than 2.5 time the noise, compute the detection limit using the mass which will give the most conservative result. Report the presence of interferences.
If an interfering signal is present in the mass window, choose the ion not interfered with to calculate a detection limit using Equations 428-9 and 428-10. If both ions have interferences which are more than 2.5 times the noise , compute the detection limit using the mass which will give the most conservative result.
6.7.4 Estimated Maximum Possible Concentration
If the response of the quantitation ions is determined to be greater than 2.5 times the background signal, but qualitative identification criteria are not met, an “estimated
M428 Page 75
maximum possible concentration” must be calculated according to Equations 428-7 and 428-8.
7 QUALITY ASSURANCE/QUALITY CONTROL
Each laboratory that uses this method is required to operate a formal quality control program. The minimum quality control requirements of this program consists of an initial demonstration of laboratory capability (according to Section 5.3), and an ongoing analysis of spike samples to evaluate and document data quality. The laboratory must maintain performance records to document the quality of data that are generated. Ongoing data quality checks are compared with established performance criteria to determine if results of analyses meet the requirements of the method.
7.1 Laboratory Method Blank
Before processing any samples, the analyst must demonstrate through the analysis of a method blank that all glassware and reagents are free of interferences at the method detection limit of the matrix of interest.
Each time a set of samples is extracted or there is a change in reagents, a method blank must be processed as a safeguard against laboratory contamination.
A laboratory “method blank” must be run along with each set of samples (20 or fewer). A method blank run is performed by executing all of the specified extraction and cleanup steps, except for the introduction of a sample. The method blank must contain the same amount of each 13C-labeled internal standard as that added to the sample before extraction.
If the method blank is contaminated, check solvents, reagents, standard solutions apparatus and glassware to locate and eliminate the source of contamination before any more samples are analyzed.
If samples showing positive levels of PCDD/PCDF have been processed with a contaminated method blank, another aliquot of each sample extract must then be analyzed.
7.2 Matrix Blank
Portions of the sample matrix (resin and filter) shall be subjected to extraction and cleanup followed by HRGC/MS analysis. There should be at least one matrix blank for every extraction set of 20 or fewer samples.
M428 Page 76
7.3 Performance Evaluation Samples
The laboratory is expected to periodically analyze performance evaluation samples throughout the course of a given project. Further sample analysis will not be permitted if the performance criteria are not achieved. Corrective action must be taken and acceptable performance demonstrated before sample analysis can resume.
7.4 Quality Control (QC) Check Sample
The laboratory must analyze at least one QC check sample for each batch of 20 samples or less. If a QC check sample cannot be obtained from an external source, the laboratory must prepare a QC check sample concentrate using stock standards prepared independently from those used for calibration.
Use the QC check sample concentrate to prepare QC check samples with concentrations of the analytes similar to those expected in the field samples.
Analyze three aliquots of the well-mixed QC check samples according to the method beginning in Section 4.5 with extraction of the samples.
7.5 QC Check Acceptance Criteria
Use the results of the three analyses (Section 7.4) to calculate the average recovery in Fg/sample, and the standard deviation of the recovery (s) for each analyte.
Acceptable accuracy is a percent recovery between 60 and 140 percent. Acceptable precision is a relative standard deviation <30%.
If any individual standard deviation exceeds the precision limit, or any calculated recovery falls outside the range for accuracy, the laboratory performance for that analyte is unacceptable.
Beginning with Section 7.4, repeat the test only for those analytes that failed to meet criteria. Repeated failure, however, will confirm a general problem with the measurement system. If this occurs, locate and correct the source of the problem and repeat the test for all compounds of interest beginning with Section 7.4.
7.6 Field Duplicates
These are individual samples taken from the same location at the same time. Field duplicates should be analyzed periodically to determine the total precision (field and lab).
M428 Page 77
7.7 Laboratory Control Sample
The laboratory must spike a method blank with a mixture of native dioxins and furans and PCB to assess the accuracy of the entire analytical procedure.
The laboratory control sample must contain at least one representative of each chlorinated class of compounds to be determined in the samples. The signal of the lab spike must be at least 5 times higher than the background. There must be one laboratory spike for every extraction set of 20 or fewer samples.
The laboratory spike must be analyzed according to the methods described for extraction column cleanup and GC/MS analysis of the standards and field samples.
Calculate average recovery as a percentage of the amount added. The acceptance criteria is 100 + 40% of the known amount.
7.8 Acceptance Criteria for Internal Standard Recovery
Each sample is spiked with known amounts of stable isotopically labelled internal standards (Sections 5.2.5 and 6.2.6) before extraction and analysis. Recoveries obtained for each of these standards should be greater than 40 percent and less than 120 percent of the known value.
If internal standard recoveries are outside of the acceptable limits, the signal to noise ratio of the internal standard must be greater than 10. Otherwise the analytical procedure must be repeated on the stored portion of the extract.
NOTE: This criterion is used to assess method performance. As this is an isotope dilution technique, it is , when properly applied, independent of internal standard recovery. Lower recoveries do not necessarily invalidate the analytical results for native PCDD/PCDF or PCB, but may result in higher detection limits than are desired.
If low internal standard recoveries result in detection limits that are unacceptable, the cleanup and GC/MS analysis must be repeated with the stored portion of the extract. If the analysis of the archive sample gives low recoveries and high detection limits, the results both analyses must be reported.
If a surrogate standard other than method internal standards is used, the action limits for surrogate standard results will be 100 + 4% of the known value. Samples showing surrogate standard results outside of these limits must have a signal to noise ratio greater than or equal to 10, otherwise the analytical procedure must be repeated on the stored portion of the extract.
M428 Page 78
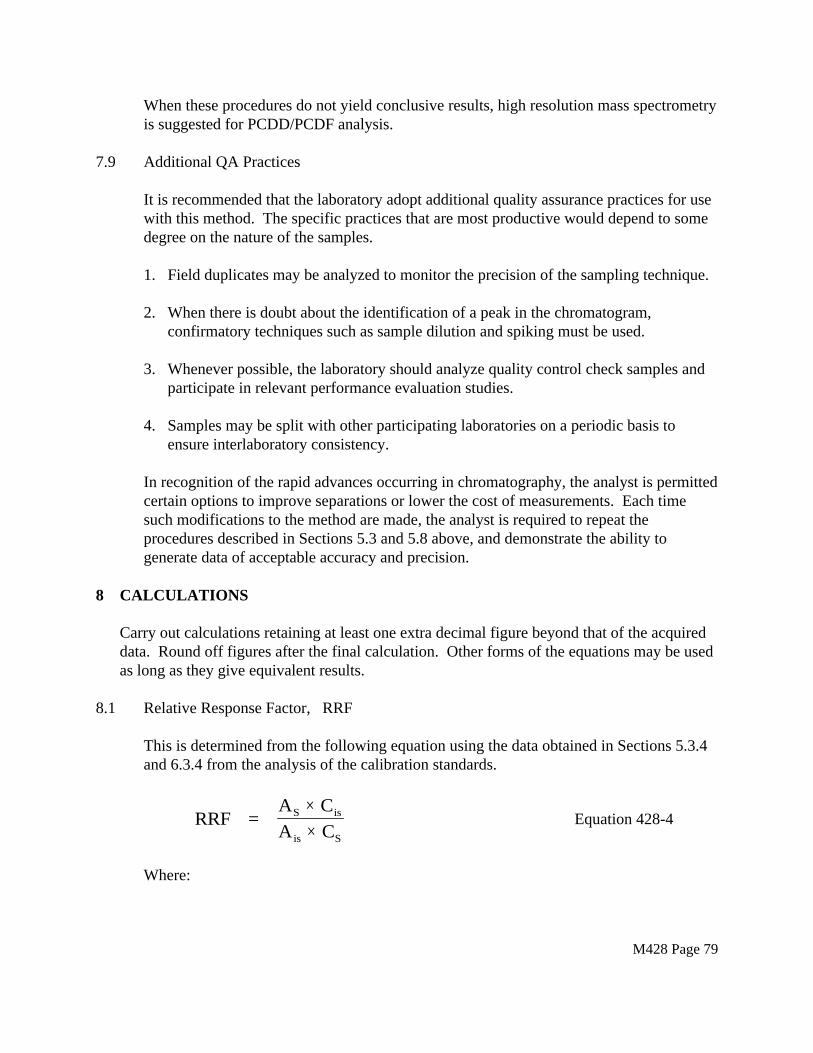
When these procedures do not yield conclusive results, high resolution mass spectrometry is suggested for PCDD/PCDF analysis.
7.9 Additional QA Practices
It is recommended that the laboratory adopt additional quality assurance practices for use with this method. The specific practices that are most productive would depend to some degree on the nature of the samples.
1. Field duplicates may be analyzed to monitor the precision of the sampling technique.
2. When there is doubt about the identification of a peak in the chromatogram, confirmatory techniques such as sample dilution and spiking must be used.
3. Whenever possible, the laboratory should analyze quality control check samples and participate in relevant performance evaluation studies.
4. Samples may be split with other participating laboratories on a periodic basis to ensure interlaboratory consistency.
In recognition of the rapid advances occurring in chromatography, the analyst is permitted certain options to improve separations or lower the cost of measurements. Each time such modifications to the method are made, the analyst is required to repeat the procedures described in Sections 5.3 and 5.8 above, and demonstrate the ability to generate data of acceptable accuracy and precision.
8 CALCULATIONS
Carry out calculations retaining at least one extra decimal figure beyond that of the acquired data. Round off figures after the final calculation. Other forms of the equations may be used as long as they give equivalent results.
8.1 Relative Response Factor, RRF
This is determined from the following equation using the data obtained in Sections 5.3.4 and 6.3.4 from the analysis of the calibration standards.
AS · CisRRF = Equation 428-4 · CSAis
Where:
M428 Page 79
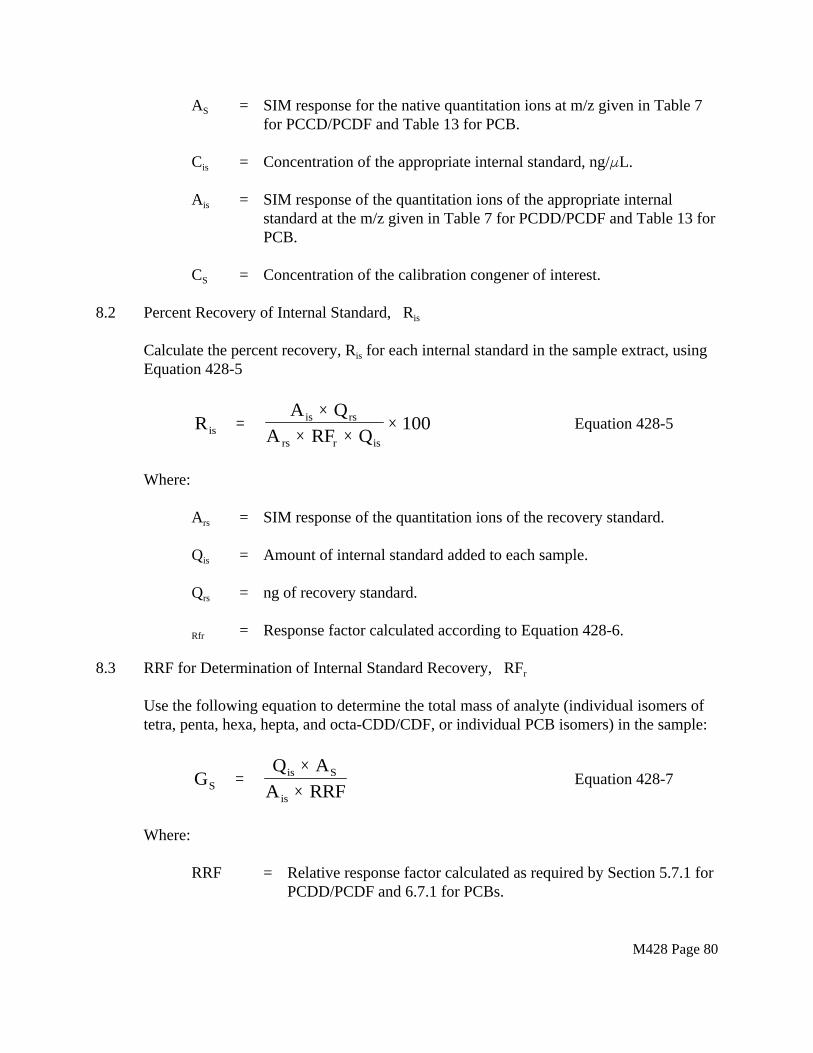
AS = SIM response for the native quantitation ions at m/z given in Table 7 for PCCD/PCDF and Table 13 for PCB.
Cis = Concentration of the appropriate internal standard, ng/FL.
Ais = SIM response of the quantitation ions of the appropriate internal standard at the m/z given in Table 7 for PCDD/PCDF and Table 13 for PCB.
CS = Concentration of the calibration congener of interest.
8.2 Percent Recovery of Internal Standard, Ris
Calculate the percent recovery, Ris for each internal standard in the sample extract, using Equation 428-5
· QrsAis= · 100 Equation 428-5Ris A · RF · Qisrs r
Where:
A = SIM response of the quantitation ions of the recovery standard.rs
Q
Qis = Amount of internal standard added to each sample.
rs = ng of recovery standard.
= Response factor calculated according to Equation 428-6.Rfr
8.3 RRF for Determination of Internal Standard Recovery, RFr
Use the following equation to determine the total mass of analyte (individual isomers of tetra, penta, hexa, hepta, and octa-CDD/CDF, or individual PCB isomers) in the sample:
· ASQisGS = Equation 428-7 · RRFAis
Where:
RRF = Relative response factor calculated as required by Section 5.7.1 for PCDD/PCDF and 6.7.1 for PCBs.
M428 Page 80
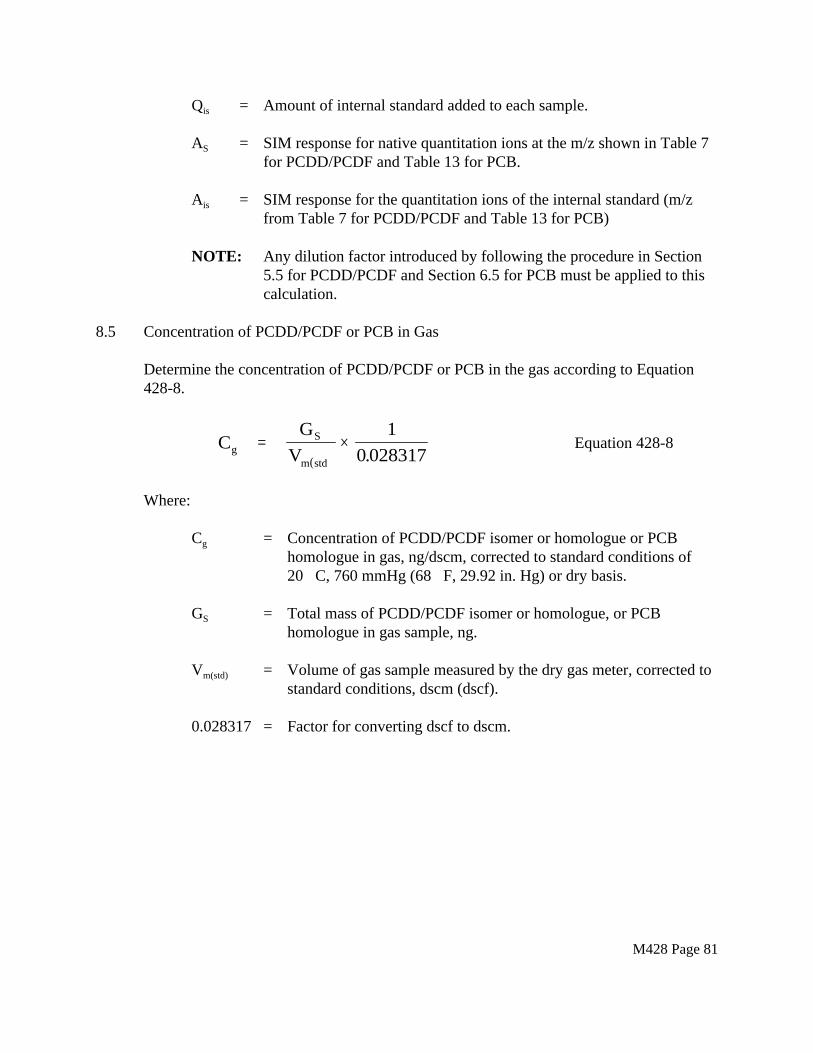
A
A
Qis = Amount of internal standard added to each sample.
S = SIM response for native quantitation ions at the m/z shown in Table 7 for PCDD/PCDF and Table 13 for PCB.
is = SIM response for the quantitation ions of the internal standard (m/z from Table 7 for PCDD/PCDF and Table 13 for PCB)
NOTE: Any dilution factor introduced by following the procedure in Section 5.5 for PCDD/PCDF and Section 6.5 for PCB must be applied to thiscalculation.
8.5 Concentration of PCDD/PCDF or PCB in Gas
Determine the concentration of PCDD/PCDF or PCB in the gas according to Equation 428-8.
GS 1 C = · Equation 428-8g
( 0 028317. Vm std )
Where:
C = Concentration of PCDD/PCDF isomer or homologue or PCBg
homologue in gas, ng/dscm, corrected to standard conditions of 20E C, 760 mmHg (68E F, 29.92 in. Hg) or dry basis.
GS = Total mass of PCDD/PCDF isomer or homologue, or PCB homologue in gas sample, ng.
Vm(std) = Volume of gas sample measured by the dry gas meter, corrected to standard conditions, dscm (dscf).
0.028317 = Factor for converting dscf to dscm.
M428 Page 81
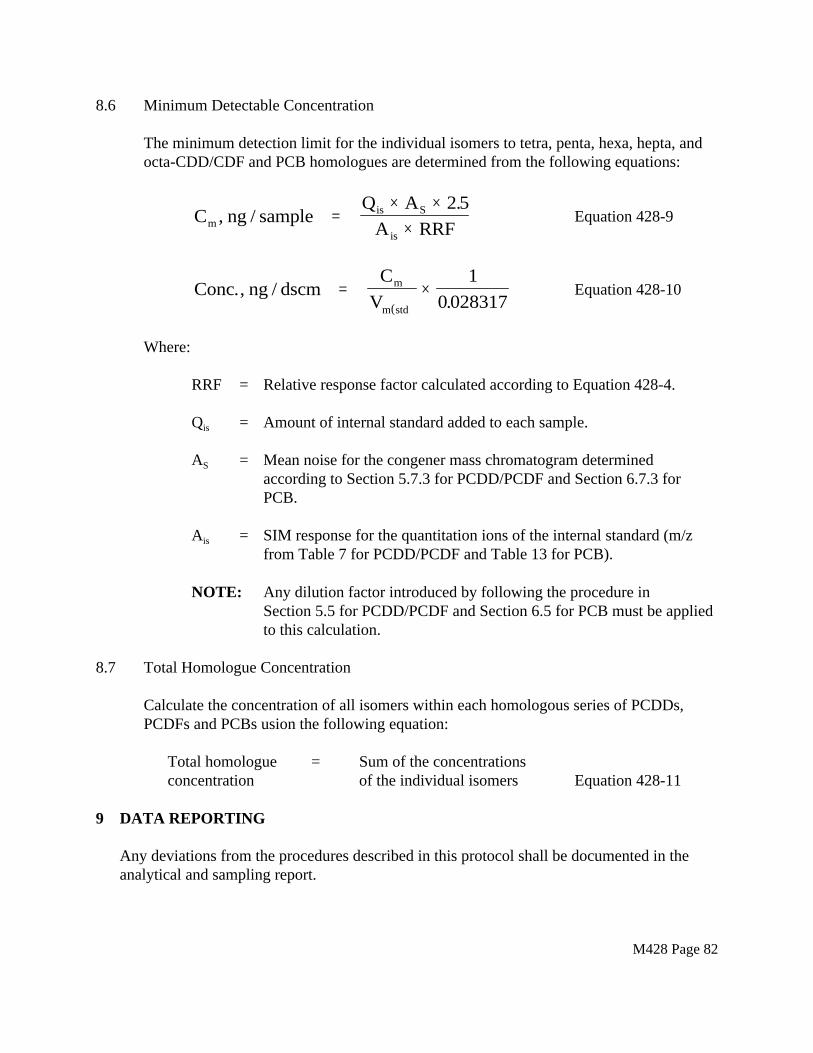
8.6 Minimum Detectable Concentration
The minimum detection limit for the individual isomers to tetra, penta, hexa, hepta, and octa-CDD/CDF and PCB homologues are determined from the following equations:
· AS · 2 5 .QisC , ng / sample = Equation 428-9m · RRFAis
C 1mConc., ng / dscm = · Equation 428-10 .( 0 028317 Vm std )
Where:
RRF = Relative response factor calculated according to Equation 428-4.
Qis = Amount of internal standard added to each sample.
AS = Mean noise for the congener mass chromatogram determined according to Section 5.7.3 for PCDD/PCDF and Section 6.7.3 for PCB.
Ais = SIM response for the quantitation ions of the internal standard (m/z from Table 7 for PCDD/PCDF and Table 13 for PCB).
NOTE: Any dilution factor introduced by following the procedure in Section 5.5 for PCDD/PCDF and Section 6.5 for PCB must be applied to this calculation.
8.7 Total Homologue Concentration
Calculate the concentration of all isomers within each homologous series of PCDDs, PCDFs and PCBs usion the following equation:
Total homologue = Sum of the concentrations concentration of the individual isomers Equation 428-11
9 DATA REPORTING
Any deviations from the procedures described in this protocol shall be documented in the analytical and sampling report.
M428 Page 82
Each report of analyses shall contain tables of results which include the following:
A. Complete identification of the samples analyzed (sample numbers and source). Pertinent information should be submitted to the analytical laboratory via a chain of custody record.
B. Date of submittal of the sample, date and time of GC/MS analysis. The latter should appear on each mass chromatogram included with the report.
C. The raw mass chromatographic data which consists of the absolute intensities (based on either peak height or area) of the signals observed for the ion masses monitored.
D. The calculated ratios of the intensities of the molecular ions for all PCDD/PCDFdetected.
E. The calculated amounts of PCDD, PCDF and PCB reported as nanograms (ng) per sample. Values are reported for total tetra, penta, hexa, hepta, and octa-CDDs and CDFs, and for 2,3,7,8-substituted isomers. If no PCDD/PCDF or PCB are detected, the minimum detectable amount must be reported.
F. The same raw and calculated data which are provided for the actual samples will also be reported for the duplicate analyses, method blank analyses, the spiked sample analyses, and any other QA or method performance samples analyzed in conjunction with the actual sample set(s).
G. The recoveries of the internal standards in percent.
H. The recoveries of native PCDD/PCDF or PCB from spiked samples in percent.
I. The calibration data, including average response factors calculated from the five point calibration procedure described in Section 5.4 for PCDD/PCDF and 6.4 for PCB. Include the relative standard deviation, and data showing that these factors have been verified at least once during each 12 hour period of operation or with each separate set of samples analyzed.
10 ALTERNATIVE TEST METHOD FOR PCDDs, PCDFs, AND PCBs
If any other test method is used, the tester must substantiate the data through an adequate quality assurance program which is subject to approval by the Executive Officer.
11 BIBLIOGRAPHY
11.1 U.S. Environmental Protection Agency/Office of Solid Waste, Washington D.C., Method 8280. The Analysis of Polychlorinated Dibenzo-p-dioxins and Polychlorinated Dibenzofurans. In “Test Methods for Evaluating Solid Waste - Physical/Chemical Methods” SW-846 (1986).
M428 Page 83
11.2 EPA Method 613 - 2,3,7,8-Tetrachlorodibenzo-p-dioxin. 40 CFR 136 Appendix A (7-1-85).
11.3 Thomaspon, J.R., ed., Analysis of Pesticide Residues in Human and Environmental Samples, Environmental Protection Agency, Research Triangle Park, N.C. (1974).
11.4 ARB Contract No. A5-115-45. California Analytical Laboratories. Total and/or 2,3,7,8-substituted dioxin and furan analysis. October, 1986.
11.5 Alford-Stevens, A., Bellar, T.A., Eichelberger, J.W., and Budde, W.L., November, 1985. EPA Method 680. Determination of Pesticides and PCBs in Water and Soil/Sediment by Gas Chromatography/Mass Spectrometry. Environmental Monitoring and Supprot Laboratory, USEPA, Cincinnati, Ohio 45268.
11.6 “Carcinogens-Working with Carcinogens,” Department of Health Education, and Welfare, Public Health Service, Center for Disease Control, National Institute for Occupational Safety and Health, Publication No. 77-206, Aug. 1977.
11.7 “OSHA Safety and Health Standards, General Industry,” (29CFR1910), Occupational Safety and Health Administration, OSHA 2206, (Revised, January 1976).
11.8 “Safety in Academic Chemistry Laboratories,” American Chemical Society Publication, Committee on Chemical Safety, 3rd Edition, 1979.
M428 Page 84
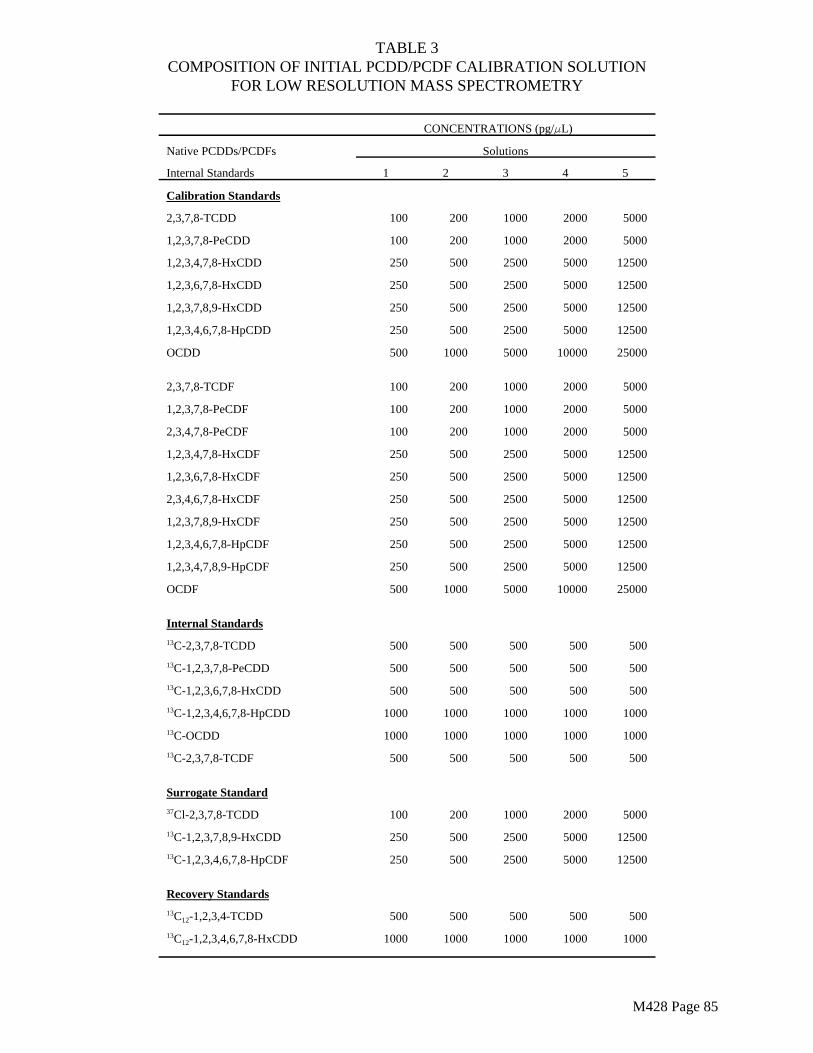
TABLE 3COMPOSITION OF INITIAL PCDD/PCDF CALIBRATION SOLUTION
FOR LOW RESOLUTION MASS SPECTROMETRY
CONCENTRATIONS (pg/FL)
Native PCDDs/PCDFs Solutions
Internal Standards 1 2 3 4 5
Calibration Standards
2,3,7,8-TCDD
1,2,3,7,8-PeCDD
1,2,3,4,7,8-HxCDD
1,2,3,6,7,8-HxCDD
1,2,3,7,8,9-HxCDD
1,2,3,4,6,7,8-HpCDD
OCDD
2,3,7,8-TCDF
1,2,3,7,8-PeCDF
2,3,4,7,8-PeCDF
1,2,3,4,7,8-HxCDF
1,2,3,6,7,8-HxCDF
2,3,4,6,7,8-HxCDF
1,2,3,7,8,9-HxCDF
1,2,3,4,6,7,8-HpCDF
1,2,3,4,7,8,9-HpCDF
OCDF
Internal Standards
13C-2,3,7,8-TCDD
13C-1,2,3,7,8-PeCDD
13C-1,2,3,6,7,8-HxCDD
13C-1,2,3,4,6,7,8-HpCDD
13C-OCDD
13C-2,3,7,8-TCDF
Surrogate Standard
37Cl-2,3,7,8-TCDD
13C-1,2,3,7,8,9-HxCDD
13C-1,2,3,4,6,7,8-HpCDF
Recovery Standards
13C12-1,2,3,4-TCDD
13C12-1,2,3,4,6,7,8-HxCDD
100
100
250
250
250
250
500
100
100
100
250
250
250
250
250
250
500
500
500
500
1000
1000
500
100
250
250
500
1000
200
200
500
500
500
500
1000
200
200
200
500
500
500
500
500
500
1000
500
500
500
1000
1000
500
200
500
500
500
1000
1000
1000
2500
2500
2500
2500
5000
1000
1000
1000
2500
2500
2500
2500
2500
2500
5000
500
500
500
1000
1000
500
1000
2500
2500
500
1000
2000
2000
5000
5000
5000
5000
10000
2000
2000
2000
5000
5000
5000
5000
5000
5000
10000
500
500
500
1000
1000
500
2000
5000
5000
500
1000
5000
5000
12500
12500
12500
12500
25000
5000
5000
5000
12500
12500
12500
12500
12500
12500
25000
500
500
500
1000
1000
500
5000
12500
12500
500
1000
M428 Page 85
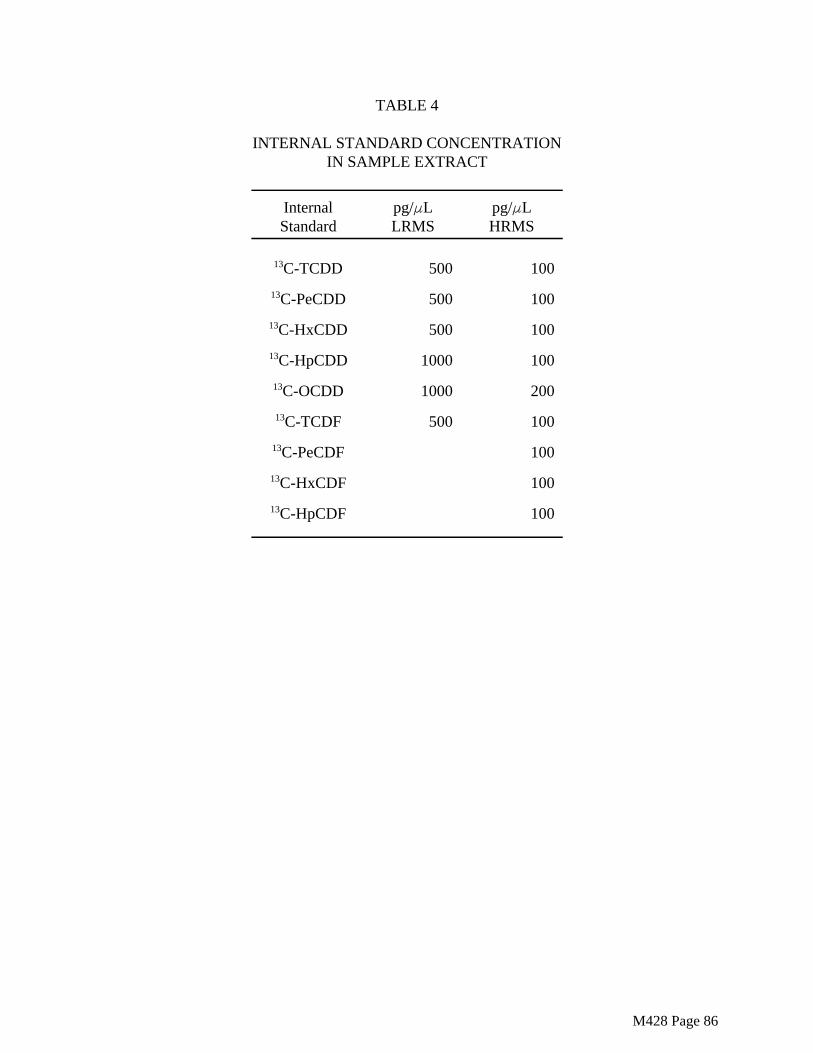
TABLE 4
INTERNAL STANDARD CONCENTRATION IN SAMPLE EXTRACT
Internal pg/FL pg/FL Standard LRMS HRMS
13C-TCDD 500 100
100
100
100
200
100
100
100
100
13C-PeCDD 500
13C-HxCDD 500
13C-HpCDD 1000
13C-OCDD 1000
13C-TCDF 500
13C-PeCDF
13C-HxCDF
13C-HpCDF
M428 Page 86
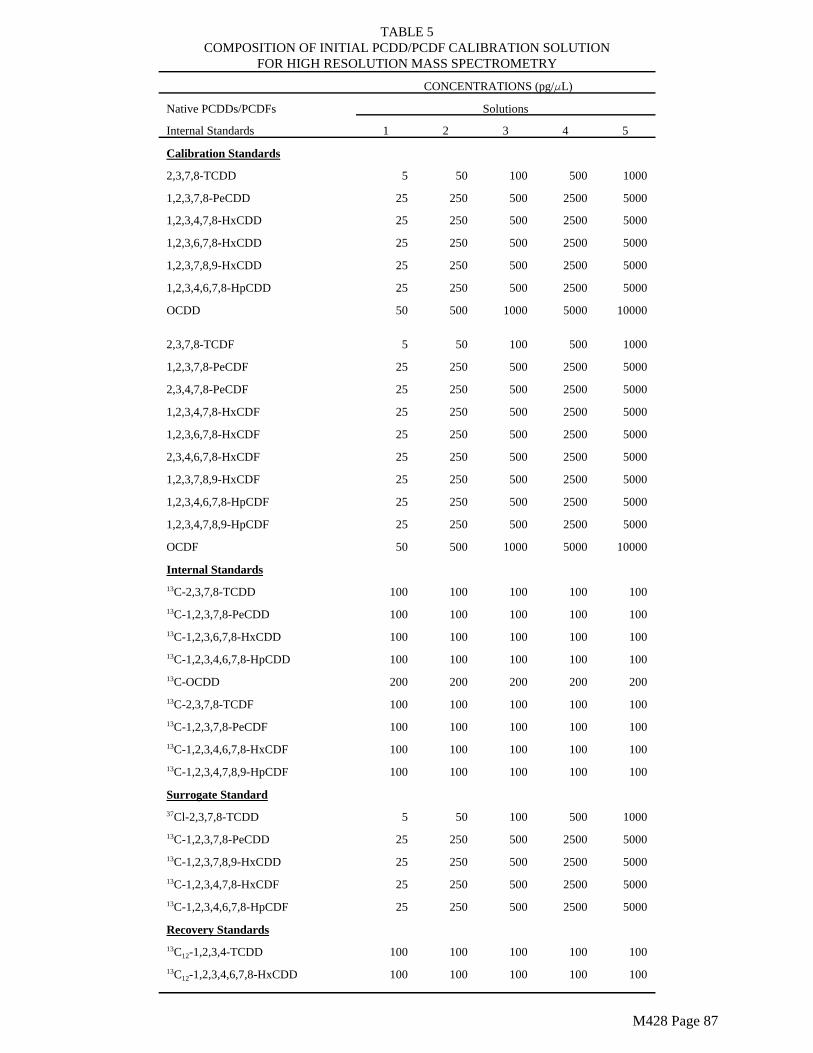
TABLE 5COMPOSITION OF INITIAL PCDD/PCDF CALIBRATION SOLUTION
FOR HIGH RESOLUTION MASS SPECTROMETRY
CONCENTRATIONS (pg/FL)
Native PCDDs/PCDFs Solutions
Internal Standards 1 2 3 4 5
Calibration Standards
2,3,7,8-TCDD
1,2,3,7,8-PeCDD
1,2,3,4,7,8-HxCDD
1,2,3,6,7,8-HxCDD
1,2,3,7,8,9-HxCDD
1,2,3,4,6,7,8-HpCDD
OCDD
2,3,7,8-TCDF
1,2,3,7,8-PeCDF
2,3,4,7,8-PeCDF
1,2,3,4,7,8-HxCDF
1,2,3,6,7,8-HxCDF
2,3,4,6,7,8-HxCDF
1,2,3,7,8,9-HxCDF
1,2,3,4,6,7,8-HpCDF
1,2,3,4,7,8,9-HpCDF
OCDF
Internal Standards
13C-2,3,7,8-TCDD
13C-1,2,3,7,8-PeCDD
13C-1,2,3,6,7,8-HxCDD
13C-1,2,3,4,6,7,8-HpCDD
13C-OCDD
13C-2,3,7,8-TCDF
13C-1,2,3,7,8-PeCDF
13C-1,2,3,4,6,7,8-HxCDF
13C-1,2,3,4,7,8,9-HpCDF
Surrogate Standard
37Cl-2,3,7,8-TCDD
13C-1,2,3,7,8-PeCDD
13C-1,2,3,7,8,9-HxCDD
13C-1,2,3,4,7,8-HxCDF
13C-1,2,3,4,6,7,8-HpCDF
Recovery Standards
13C12-1,2,3,4-TCDD
13C12-1,2,3,4,6,7,8-HxCDD
5
25
25
25
25
25
50
5
25
25
25
25
25
25
25
25
50
100
100
100
100
200
100
100
100
100
5
25
25
25
25
100
100
50
250
250
250
250
250
500
50
250
250
250
250
250
250
250
250
500
100
100
100
100
200
100
100
100
100
50
250
250
250
250
100
100
100
500
500
500
500
500
1000
100
500
500
500
500
500
500
500
500
1000
100
100
100
100
200
100
100
100
100
100
500
500
500
500
100
100
500
2500
2500
2500
2500
2500
5000
500
2500
2500
2500
2500
2500
2500
2500
2500
5000
100
100
100
100
200
100
100
100
100
500
2500
2500
2500
2500
100
100
1000
5000
5000
5000
5000
5000
10000
1000
5000
5000
5000
5000
5000
5000
5000
5000
10000
100
100
100
100
200
100
100
100
100
1000
5000
5000
5000
5000
100
100
M428 Page 87
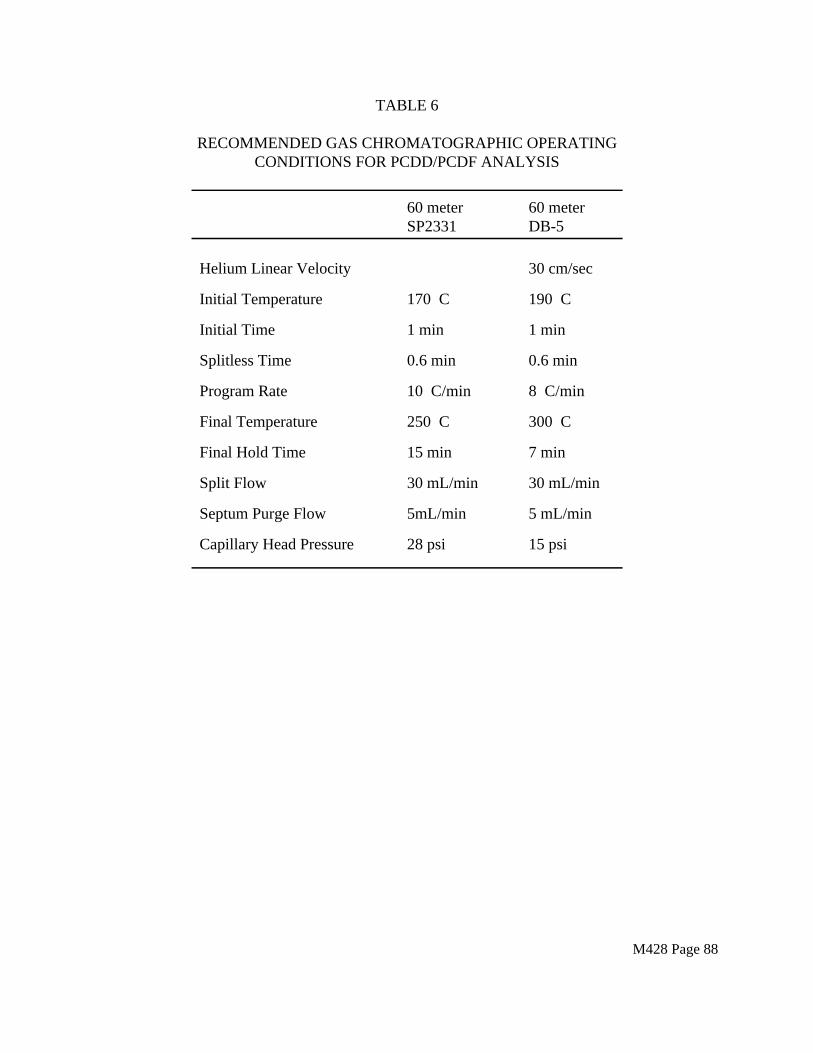
TABLE 6
RECOMMENDED GAS CHROMATOGRAPHIC OPERATING CONDITIONS FOR PCDD/PCDF ANALYSIS
60 meter 60 meter SP2331 DB-5
Helium Linear Velocity 30 cm/sec
Initial Temperature 170EC 190EC
Initial Time 1 min 1 min
Splitless Time 0.6 min 0.6 min
Program Rate 10EC/min 8EC/min
Final Temperature 250EC 300EC
Final Hold Time 15 min 7 min
Split Flow 30 mL/min 30 mL/min
Septum Purge Flow 5mL/min 5 mL/min
Capillary Head Pressure 28 psi 15 psi
M428 Page 88
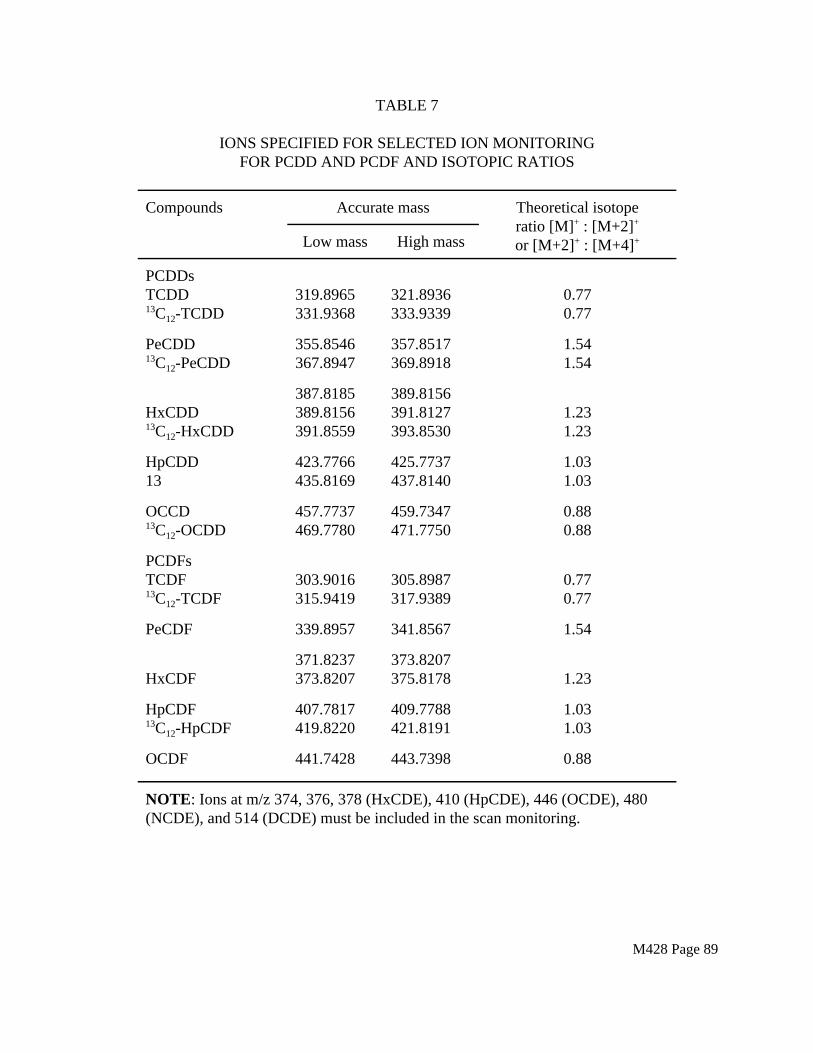
TABLE 7
IONS SPECIFIED FOR SELECTED ION MONITORING FOR PCDD AND PCDF AND ISOTOPIC RATIOS
Compounds Accurate mass
Low mass High mass
Theoretical isotope ratio [M]+ : [M+2]+
or [M+2]+ : [M+4]+
PCDDs TCDD 319.8965 321.8936 0.77 13C12-TCDD 331.9368 333.9339 0.77
PeCDD 355.8546 357.8517 1.54 13C12-PeCDD 367.8947 369.8918 1.54
387.8185 389.8156 HxCDD 389.8156 391.8127 1.23 13C12-HxCDD 391.8559 393.8530 1.23
HpCDD 423.7766 425.7737 1.03 13 435.8169 437.8140 1.03
OCCD 457.7737 459.7347 0.88 13C12-OCDD 469.7780 471.7750 0.88
PCDFs TCDF 303.9016 305.8987 0.77 13C12-TCDF 315.9419 317.9389 0.77
PeCDF 339.8957 341.8567 1.54
371.8237 373.8207 HxCDF 373.8207 375.8178 1.23
HpCDF 407.7817 409.7788 1.03 13C12-HpCDF 419.8220 421.8191 1.03
OCDF 441.7428 443.7398 0.88
NOTE: Ions at m/z 374, 376, 378 (HxCDE), 410 (HpCDE), 446 (OCDE), 480 (NCDE), and 514 (DCDE) must be included in the scan monitoring.
M428 Page 89
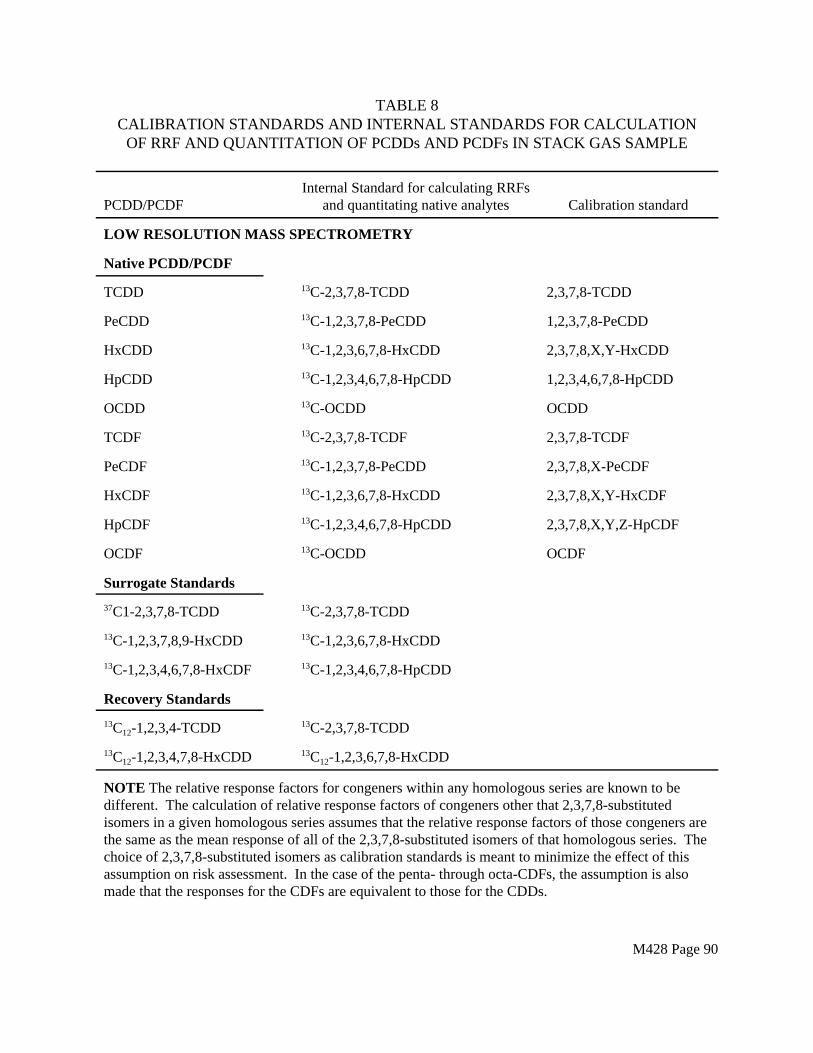
TABLE 8 CALIBRATION STANDARDS AND INTERNAL STANDARDS FOR CALCULATION
OF RRF AND QUANTITATION OF PCDDs AND PCDFs IN STACK GAS SAMPLE
Internal Standard for calculating RRFs PCDD/PCDF and quantitating native analytes Calibration standard
LOW RESOLUTION MASS SPECTROMETRY
Native PCDD/PCDF
TCDD 13C-2,3,7,8-TCDD 2,3,7,8-TCDD
PeCDD 13C-1,2,3,7,8-PeCDD 1,2,3,7,8-PeCDD
HxCDD 13C-1,2,3,6,7,8-HxCDD 2,3,7,8,X,Y-HxCDD
HpCDD 13C-1,2,3,4,6,7,8-HpCDD 1,2,3,4,6,7,8-HpCDD
OCDD 13C-OCDD OCDD
TCDF 13C-2,3,7,8-TCDF 2,3,7,8-TCDF
PeCDF 13C-1,2,3,7,8-PeCDD 2,3,7,8,X-PeCDF
HxCDF 13C-1,2,3,6,7,8-HxCDD 2,3,7,8,X,Y-HxCDF
HpCDF 13C-1,2,3,4,6,7,8-HpCDD 2,3,7,8,X,Y,Z-HpCDF
OCDF 13C-OCDD OCDF
Surrogate Standards
37C1-2,3,7,8-TCDD 13C-2,3,7,8-TCDD
13C-1,2,3,7,8,9-HxCDD 13C-1,2,3,6,7,8-HxCDD
13C-1,2,3,4,6,7,8-HxCDF 13C-1,2,3,4,6,7,8-HpCDD
Recovery Standards
13C12-1,2,3,4-TCDD 13C-2,3,7,8-TCDD
13C12-1,2,3,4,7,8-HxCDD 13C12-1,2,3,6,7,8-HxCDD
NOTE The relative response factors for congeners within any homologous series are known to be different. The calculation of relative response factors of congeners other that 2,3,7,8-substituted isomers in a given homologous series assumes that the relative response factors of those congeners are the same as the mean response of all of the 2,3,7,8-substituted isomers of that homologous series. The choice of 2,3,7,8-substituted isomers as calibration standards is meant to minimize the effect of this assumption on risk assessment. In the case of the penta- through octa-CDFs, the assumption is also made that the responses for the CDFs are equivalent to those for the CDDs.
M428 Page 90
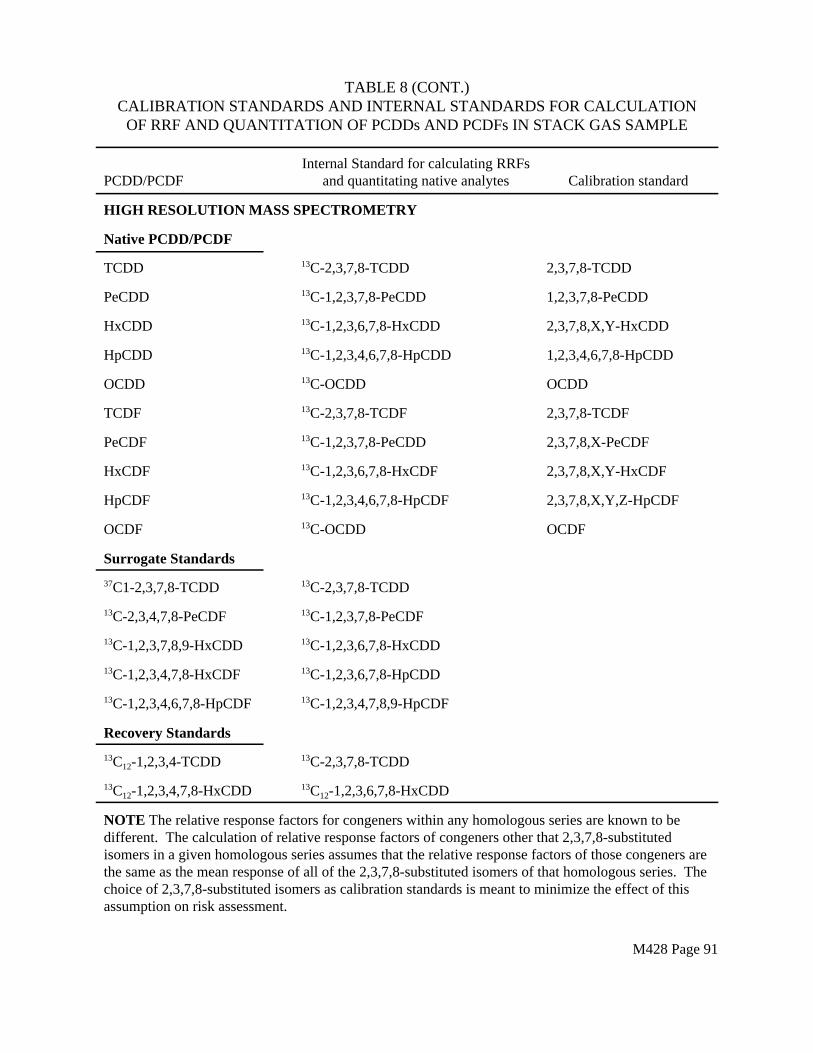
TABLE 8 (CONT.)CALIBRATION STANDARDS AND INTERNAL STANDARDS FOR CALCULATION
OF RRF AND QUANTITATION OF PCDDs AND PCDFs IN STACK GAS SAMPLE
Internal Standard for calculating RRFs PCDD/PCDF and quantitating native analytes Calibration standard
HIGH RESOLUTION MASS SPECTROMETRY
Native PCDD/PCDF
TCDD 13C-2,3,7,8-TCDD 2,3,7,8-TCDD
PeCDD 13C-1,2,3,7,8-PeCDD 1,2,3,7,8-PeCDD
HxCDD 13C-1,2,3,6,7,8-HxCDD 2,3,7,8,X,Y-HxCDD
HpCDD 13C-1,2,3,4,6,7,8-HpCDD 1,2,3,4,6,7,8-HpCDD
OCDD 13C-OCDD OCDD
TCDF 13C-2,3,7,8-TCDF 2,3,7,8-TCDF
PeCDF 13C-1,2,3,7,8-PeCDD 2,3,7,8,X-PeCDF
HxCDF 13C-1,2,3,6,7,8-HxCDF 2,3,7,8,X,Y-HxCDF
HpCDF 13C-1,2,3,4,6,7,8-HpCDF 2,3,7,8,X,Y,Z-HpCDF
OCDF 13C-OCDD OCDF
Surrogate Standards
37C1-2,3,7,8-TCDD 13C-2,3,7,8-TCDD
13C-2,3,4,7,8-PeCDF 13C-1,2,3,7,8-PeCDF
13C-1,2,3,7,8,9-HxCDD 13C-1,2,3,6,7,8-HxCDD
13C-1,2,3,4,7,8-HxCDF 13C-1,2,3,6,7,8-HpCDD
13C-1,2,3,4,6,7,8-HpCDF 13C-1,2,3,4,7,8,9-HpCDF
Recovery Standards
13C12-1,2,3,4-TCDD 13C-2,3,7,8-TCDD
13C12-1,2,3,4,7,8-HxCDD 13C12-1,2,3,6,7,8-HxCDD
NOTE The relative response factors for congeners within any homologous series are known to be different. The calculation of relative response factors of congeners other that 2,3,7,8-substituted isomers in a given homologous series assumes that the relative response factors of those congeners are the same as the mean response of all of the 2,3,7,8-substituted isomers of that homologous series. The choice of 2,3,7,8-substituted isomers as calibration standards is meant to minimize the effect of this assumption on risk assessment.
M428 Page 91
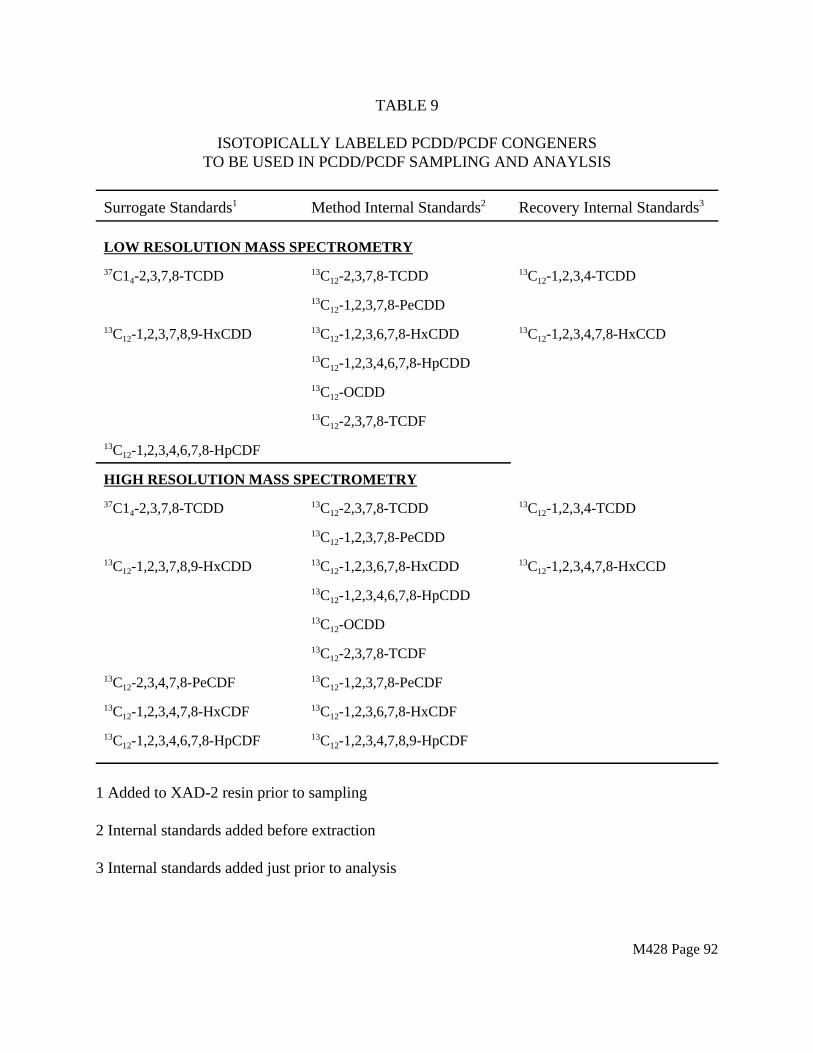
TABLE 9
ISOTOPICALLY LABELED PCDD/PCDF CONGENERS TO BE USED IN PCDD/PCDF SAMPLING AND ANAYLSIS
Surrogate Standards1 Method Internal Standards2 Recovery Internal Standards3
LOW RESOLUTION MASS SPECTROMETRY
37C14-2,3,7,8-TCDD
13C12-1,2,3,7,8,9-HxCDD
13C12-1,2,3,4,6,7,8-HpCDF
13C12-2,3,7,8-TCDD
13C12-1,2,3,7,8-PeCDD
13C12-1,2,3,6,7,8-HxCDD
13C12-1,2,3,4,6,7,8-HpCDD
13C12-OCDD
13C12-2,3,7,8-TCDF
13C12-1,2,3,4-TCDD
13C12-1,2,3,4,7,8-HxCCD
HIGH RESOLUTION MASS SPECTROMETRY
37C14-2,3,7,8-TCDD 13C12-2,3,7,8-TCDD
13C12-1,2,3,7,8-PeCDD
13C12-1,2,3,7,8,9-HxCDD 13C12-1,2,3,6,7,8-HxCDD
13C12-1,2,3,4,6,7,8-HpCDD
13C12-OCDD
13C12-2,3,7,8-TCDF
13C12-2,3,4,7,8-PeCDF 13C12-1,2,3,7,8-PeCDF
13C12-1,2,3,4,7,8-HxCDF 13C12-1,2,3,6,7,8-HxCDF
13C12-1,2,3,4,6,7,8-HpCDF 13C12-1,2,3,4,7,8,9-HpCDF
1 Added to XAD-2 resin prior to sampling
2 Internal standards added before extraction
3 Internal standards added just prior to analysis
13C12-1,2,3,4-TCDD
13C12-1,2,3,4,7,8-HxCCD
M428 Page 92
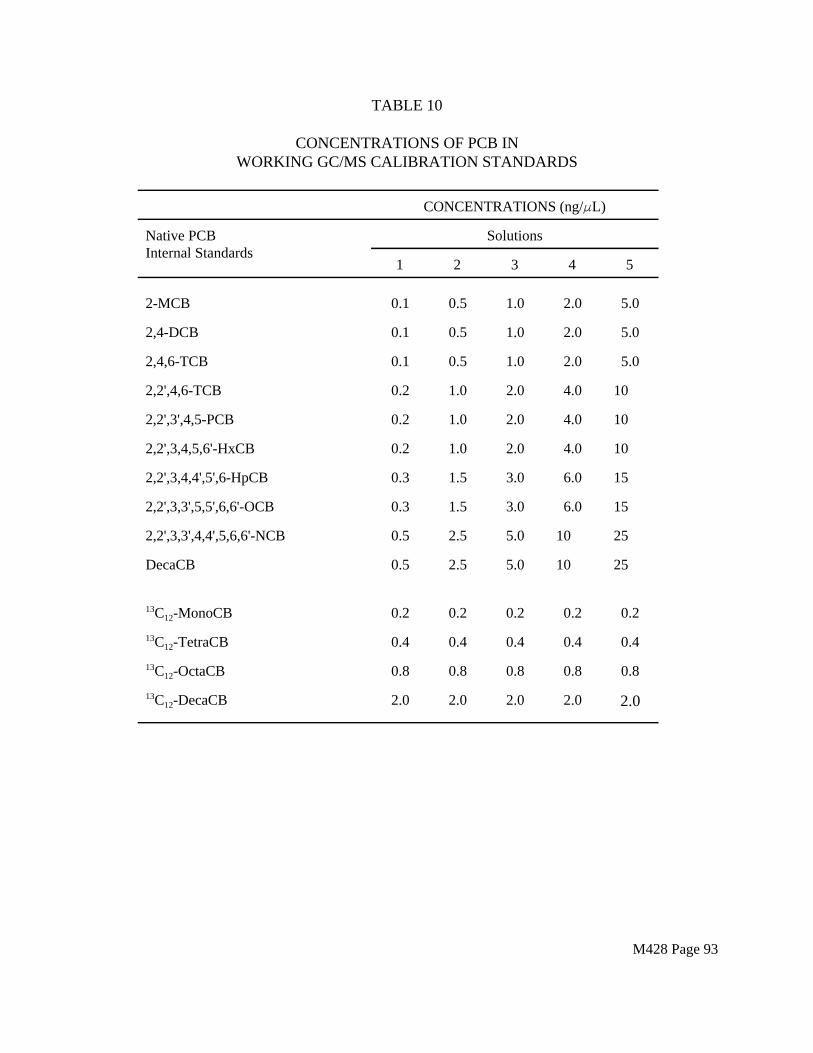
TABLE 10
CONCENTRATIONS OF PCB IN WORKING GC/MS CALIBRATION STANDARDS
CONCENTRATIONS (ng/FL)
Native PCB Solutions Internal Standards
1 2 3 4 5
2-MCB 0.1 0.5 1.0 2.0 5.0
2,4-DCB 0.1 0.5 1.0 2.0 5.0
2,4,6-TCB 0.1 0.5 1.0 2.0 5.0
2,2',4,6-TCB 0.2 1.0 2.0 4.0 10
2,2',3',4,5-PCB 0.2 1.0 2.0 4.0 10
2,2',3,4,5,6'-HxCB 0.2 1.0 2.0 4.0 10
2,2',3,4,4',5',6-HpCB 0.3 1.5 3.0 6.0 15
2,2',3,3',5,5',6,6'-OCB 0.3 1.5 3.0 6.0 15
2,2',3,3',4,4',5,6,6'-NCB 0.5 2.5 5.0 10 25
DecaCB 0.5 2.5 5.0 10 25
13C12-MonoCB 0.2 0.2 0.2 0.2 0.2
13C12-TetraCB 0.4 0.4 0.4 0.4 0.4
13C12-OctaCB 0.8 0.8 0.8 0.8 0.8
13C12-DecaCB 2.0 2.0 2.0 2.0 2.0
M428 Page 93
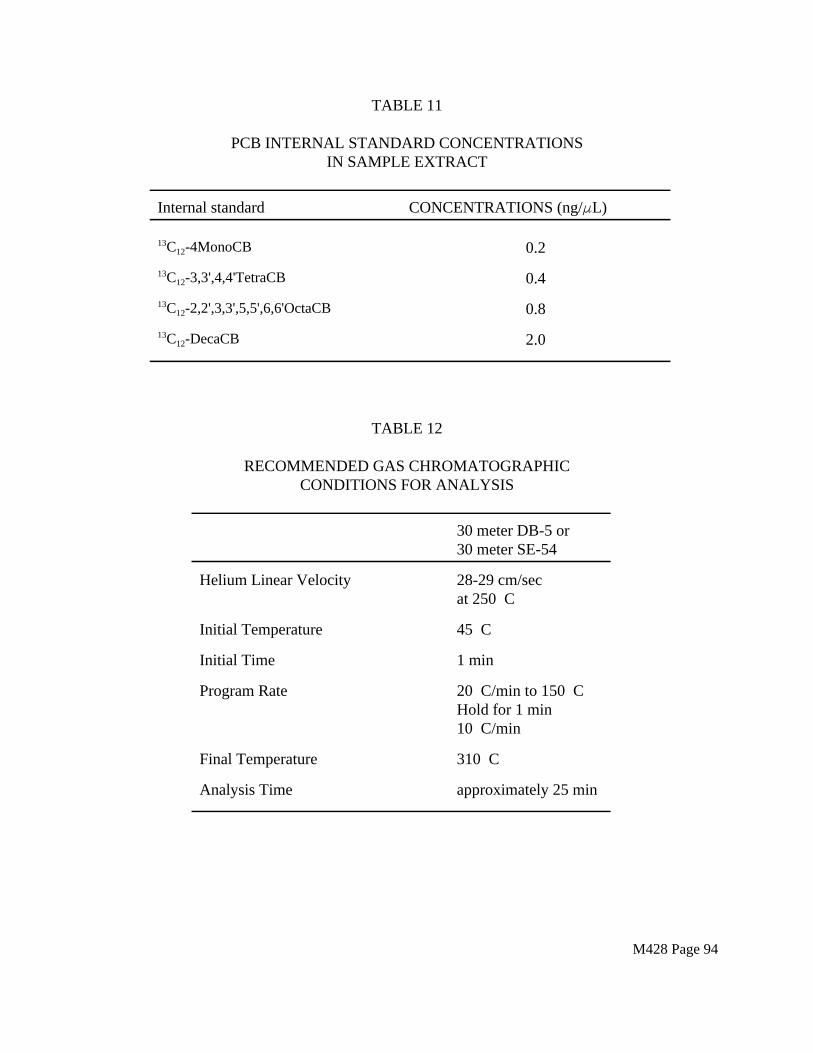
TABLE 11
PCB INTERNAL STANDARD CONCENTRATIONS IN SAMPLE EXTRACT
Internal standard CONCENTRATIONS (ng/FL)
13C12-4MonoCB 0.2
13C12-3,3',4,4'TetraCB 0.4
13C12-2,2',3,3',5,5',6,6'OctaCB 0.8
13C12-DecaCB 2.0
TABLE 12
RECOMMENDED GAS CHROMATOGRAPHIC CONDITIONS FOR ANALYSIS
30 meter DB-5 or 30 meter SE-54
Helium Linear Velocity 28-29 cm/sec at 250EC
Initial Temperature 45EC
Initial Time 1 min
Program Rate 20EC/min to 150EC Hold for 1 min 10EC/min
Final Temperature 310EC
Analysis Time approximately 25 min
M428 Page 94
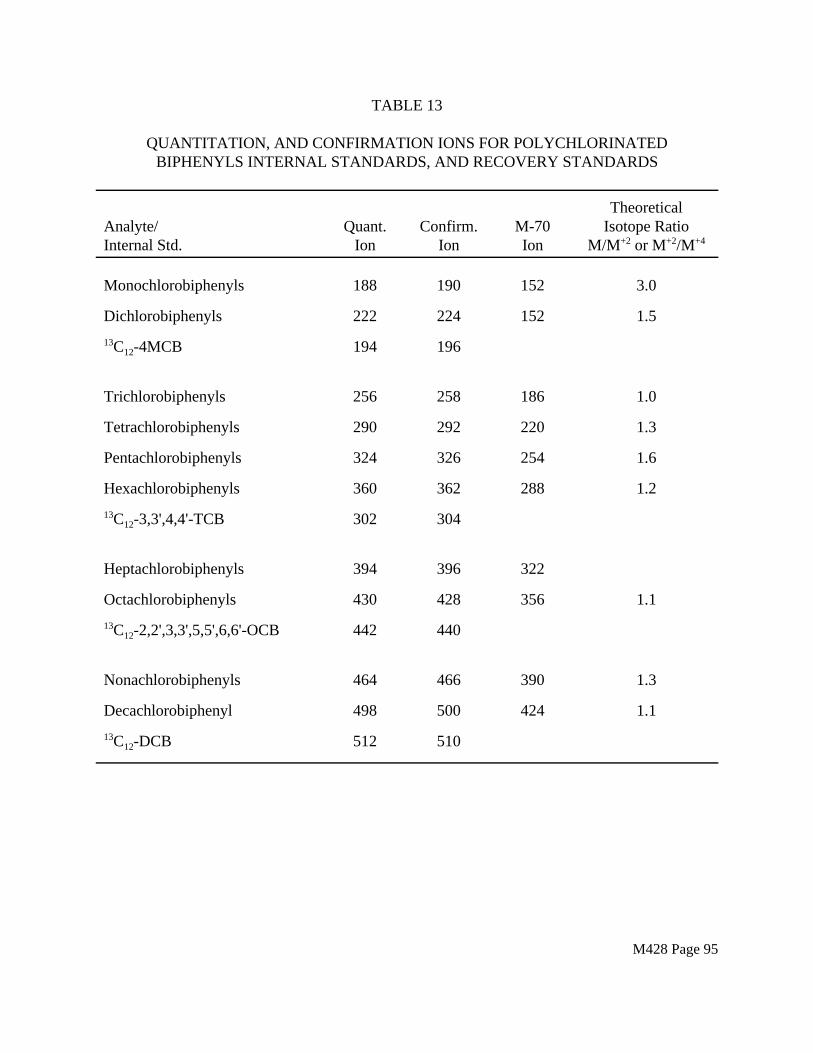
TABLE 13
QUANTITATION, AND CONFIRMATION IONS FOR POLYCHLORINATED BIPHENYLS INTERNAL STANDARDS, AND RECOVERY STANDARDS
Theoretical Analyte/ Quant. Confirm. M-70 Isotope Ratio Internal Std. Ion Ion Ion M/M+2 or M+2/M+4
Monochlorobiphenyls 188 190 152 3.0
Dichlorobiphenyls 222 224 152 1.5
13C12-4MCB 194 196
Trichlorobiphenyls 256 258 186 1.0
Tetrachlorobiphenyls 290 292 220 1.3
Pentachlorobiphenyls 324 326 254 1.6
Hexachlorobiphenyls 360 362 288 1.2
13C12-3,3',4,4'-TCB 302 304
Heptachlorobiphenyls 394 396 322
Octachlorobiphenyls 430 428 356 1.1
13C12-2,2',3,3',5,5',6,6'-OCB 442 440
Nonachlorobiphenyls 464 466 390 1.3
Decachlorobiphenyl 498 500 424 1.1
13C12-DCB 512 510
M428 Page 95
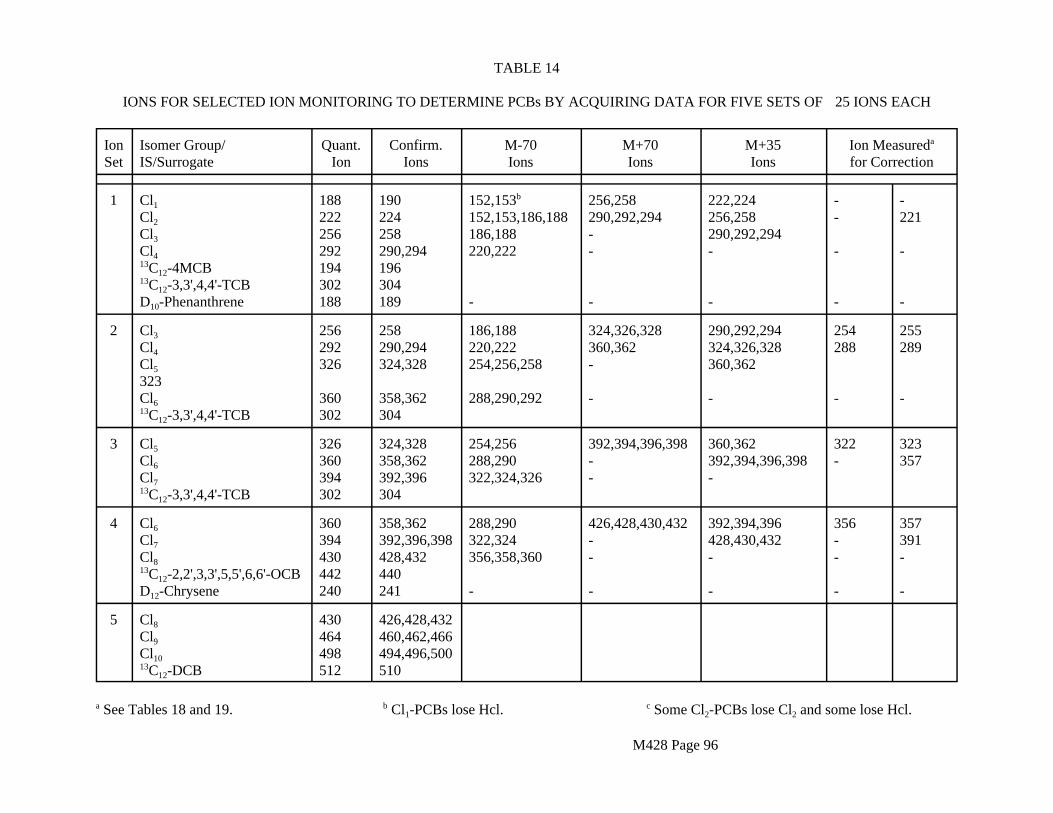
TABLE 14
IONS FOR SELECTED ION MONITORING TO DETERMINE PCBs BY ACQUIRING DATA FOR FIVE SETS OF #25 IONS EACH
Ion Set
Isomer Group/ IS/Surrogate
Quant. Ion
Confirm. Ions
M-70 Ions
M+70 Ions
M+35 Ions
Ion Measureda
for Correction
1 Cl1
Cl2
Cl3
Cl4 13C12-4MCB 13C12-3,3',4,4'-TCB D10-Phenanthrene
188 222 256 292 194 302 188
190 224 258 290,294 196 304 189
152,153b
152,153,186,188 186,188 220,222
-
256,258 290,292,294 --
-
222,224 256,258 290,292,294 -
-
--
-
-
-221
-
-
2 Cl3
Cl4
Cl5
323 Cl6 13C12-3,3',4,4'-TCB
256 292 326
360 302
258 290,294 324,328
358,362 304
186,188 220,222 254,256,258
288,290,292
324,326,328 360,362 -
-
290,292,294 324,326,328 360,362
-
254 288
-
255 289
-
3 Cl5
Cl6
Cl7 13C12-3,3',4,4'-TCB
326 360 394 302
324,328 358,362 392,396 304
254,256 288,290 322,324,326
392,394,396,398 --
360,362 392,394,396,398 -
322 -
323 357
4 Cl6
Cl7
Cl8 13C12-2,2',3,3',5,5',6,6'-OCB D12-Chrysene
360 394 430 442 240
358,362 392,396,398 428,432 440 241
288,290 322,324 356,358,360
-
426,428,430,432 --
-
392,394,396 428,430,432 -
-
356 --
-
357 391 -
-
5 Cl8
Cl9
Cl10 13C12-DCB
430 464 498 512
426,428,432 460,462,466 494,496,500 510
a See Tables 18 and 19. b Cl1-PCBs lose Hcl. c Some Cl2-PCBs lose Cl2 and some lose Hcl.
M428 Page 96
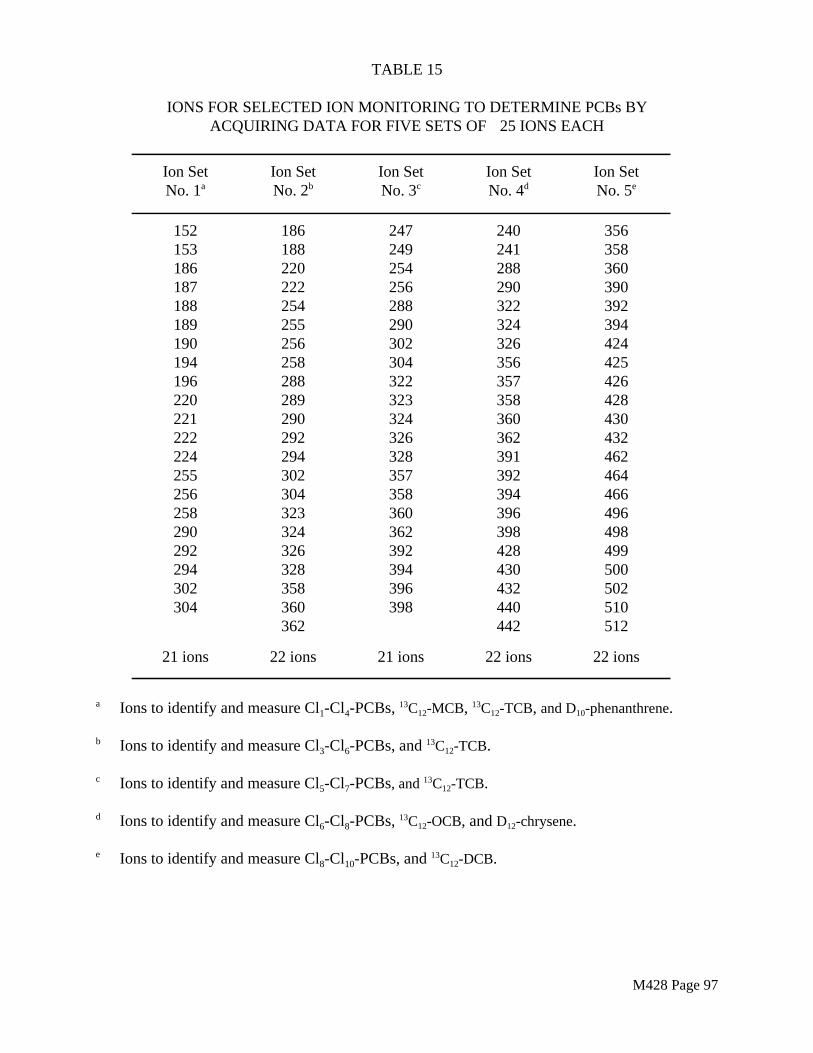
c
TABLE 15
IONS FOR SELECTED ION MONITORING TO DETERMINE PCBs BY ACQUIRING DATA FOR FIVE SETS OF #25 IONS EACH
Ion Set Ion Set Ion Set Ion Set Ion Set No. 1a No. 2b No. 3c No. 4d No. 5e
152 186 153 188 186 220 187 222 188 254 189 255 190 256 194 258 196 288 220 289 221 290 222 292 224 294 255 302 256 304 258 323 290 324 292 326 294 328 302 358 304 360
362
21 ions 22 ions
247 249 254 256 288 290 302 304 322 323 324 326 328 357 358 360 362 392 394 396 398
21 ions
240 241 288 290 322 324 326 356 357 358 360 362 391 392 394 396 398 428 430 432 440 442
22 ions
356 358 360 390 392 394 424 425 426 428 430 432 462 464 466 496 498 499 500 502 510 512
22 ions
a Ions to identify and measure Cl1-Cl4-PCBs, 13C12-MCB, 13C12-TCB, and D10-phenanthrene.
b Ions to identify and measure Cl3-Cl6-PCBs, and 13C12-TCB.
Ions to identify and measure Cl5-Cl7-PCBs, and 13C12-TCB.
d Ions to identify and measure Cl6-Cl8-PCBs, 13C12-OCB, and D12-chrysene.
e Ions to identify and measure Cl8-Cl10-PCBs, and 13C12-DCB.
M428 Page 97
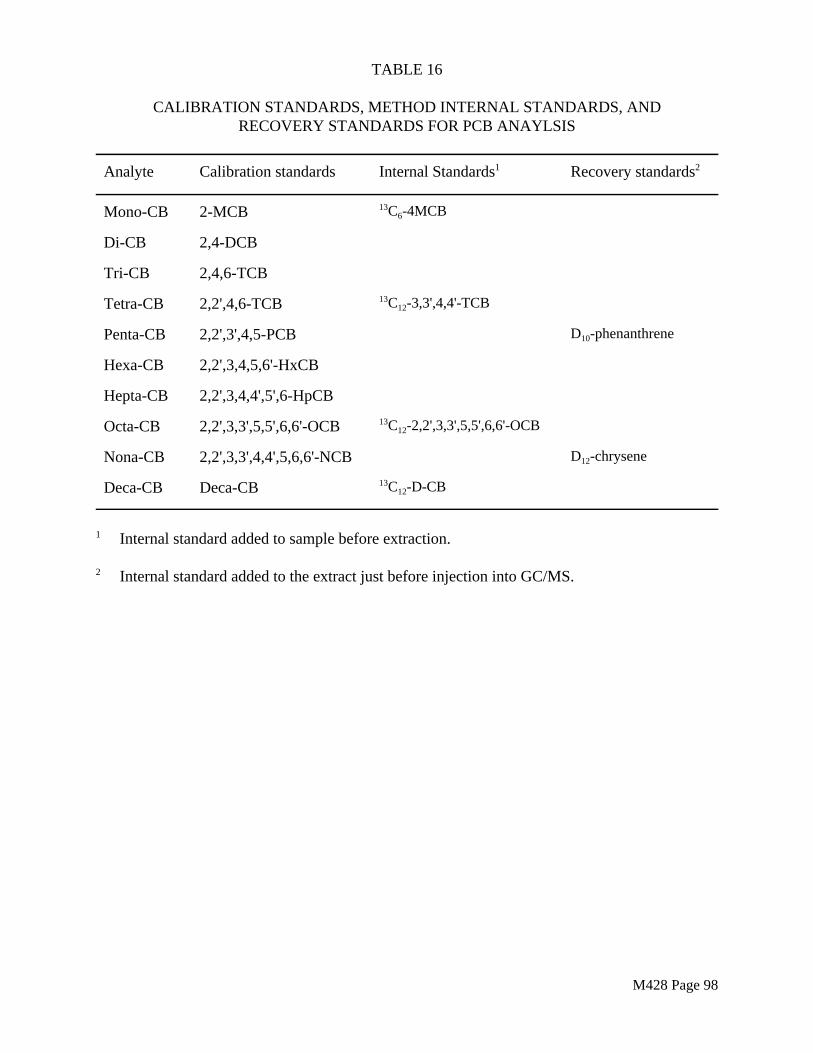
TABLE 16
CALIBRATION STANDARDS, METHOD INTERNAL STANDARDS, AND RECOVERY STANDARDS FOR PCB ANAYLSIS
Analyte Calibration standards Internal Standards1 Recovery standards2
Mono-CB 2-MCB 13C6-4MCB
Di-CB 2,4-DCB
Tri-CB 2,4,6-TCB
Tetra-CB 2,2',4,6-TCB 13C12-3,3',4,4'-TCB
Penta-CB 2,2',3',4,5-PCB D10-phenanthrene
Hexa-CB 2,2',3,4,5,6'-HxCB
Hepta-CB 2,2',3,4,4',5',6-HpCB
Octa-CB 2,2',3,3',5,5',6,6'-OCB 13C12-2,2',3,3',5,5',6,6'-OCB
Nona-CB 2,2',3,3',4,4',5,6,6'-NCB D12-chrysene
Deca-CB Deca-CB 13C12-D-CB
1 Internal standard added to sample before extraction.
2 Internal standard added to the extract just before injection into GC/MS.
M428 Page 98
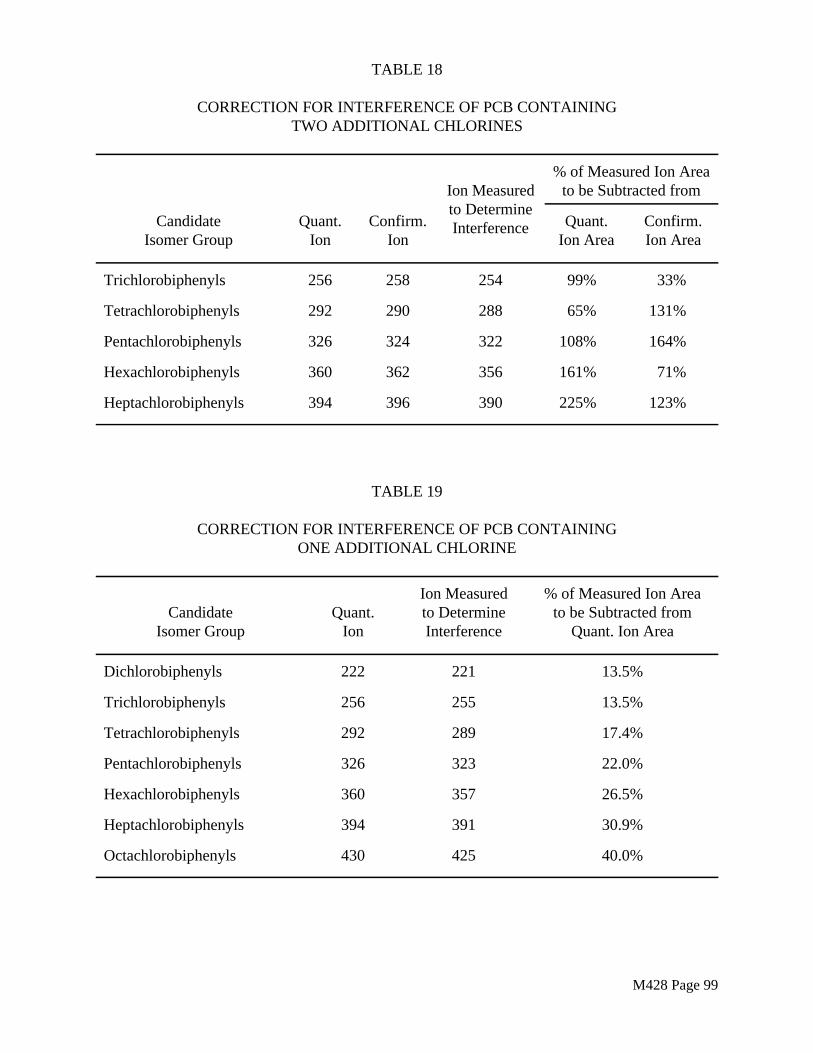
TABLE 18
CORRECTION FOR INTERFERENCE OF PCB CONTAINING TWO ADDITIONAL CHLORINES
% of Measured Ion Area Ion Measured to be Subtracted from to Determine
Candidate Quant. Confirm. Interference Quant. Confirm. Isomer Group Ion Ion Ion Area Ion Area
Trichlorobiphenyls 256 258 254 99% 33%
Tetrachlorobiphenyls 292 290 288 65% 131%
Pentachlorobiphenyls 326 324 322 108% 164%
Hexachlorobiphenyls 360 362 356 161% 71%
Heptachlorobiphenyls 394 396 390 225% 123%
TABLE 19
CORRECTION FOR INTERFERENCE OF PCB CONTAINING ONE ADDITIONAL CHLORINE
Candidate Isomer Group
Quant. Ion
Ion Measured to Determine Interference
% of Measured Ion Area to be Subtracted from
Quant. Ion Area
Dichlorobiphenyls 222 221 13.5%
Trichlorobiphenyls 256 255 13.5%
Tetrachlorobiphenyls 292 289 17.4%
Pentachlorobiphenyls 326 323 22.0%
Hexachlorobiphenyls 360 357 26.5%
Heptachlorobiphenyls 394 391 30.9%
Octachlorobiphenyls 430 425 40.0%
M428 Page 99
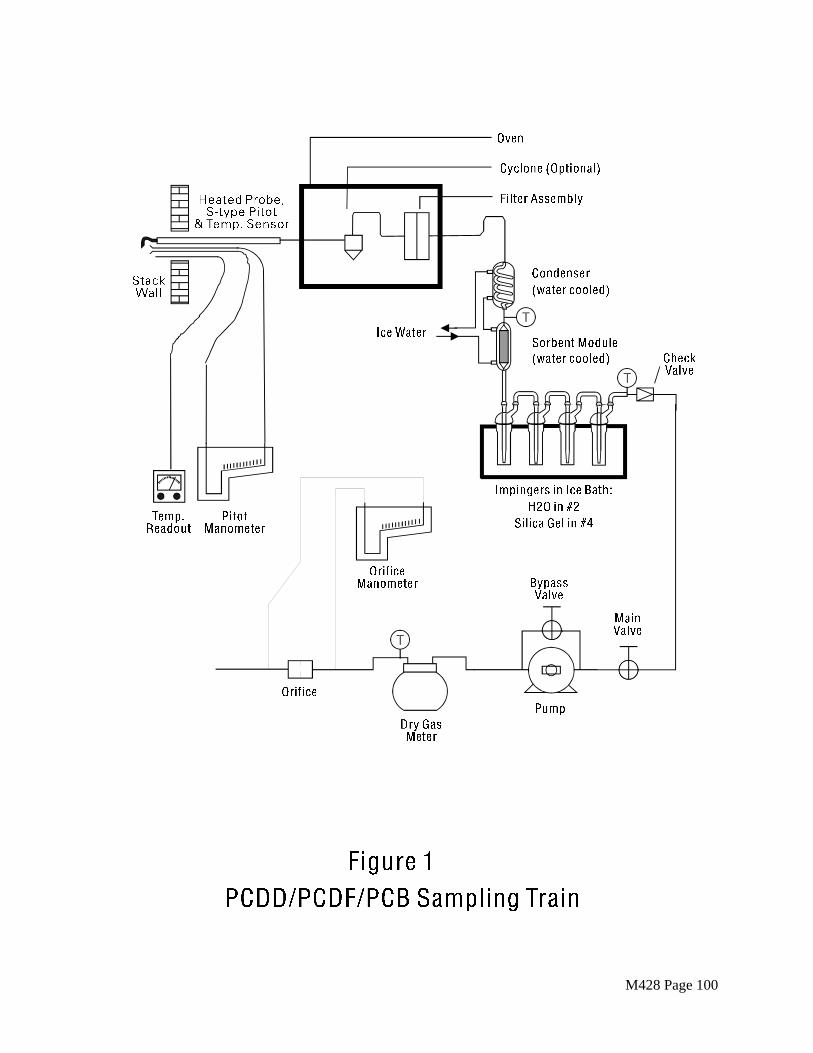
M428 Page 100
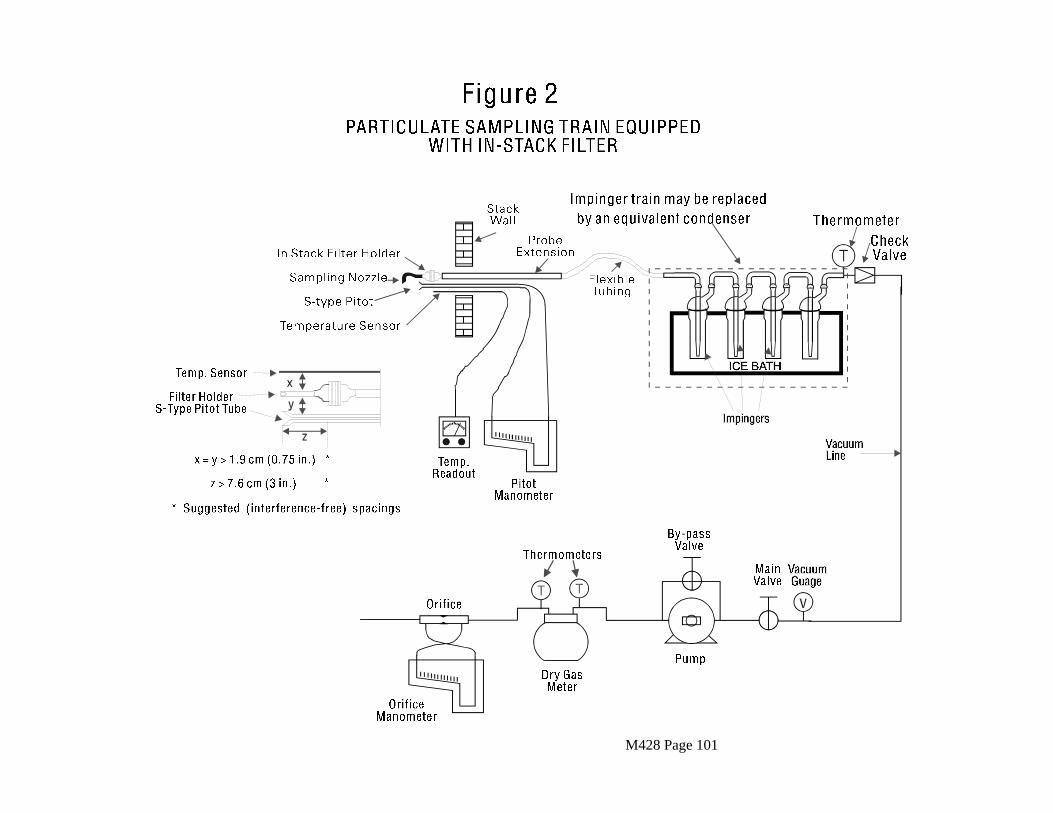
M428 Page 101
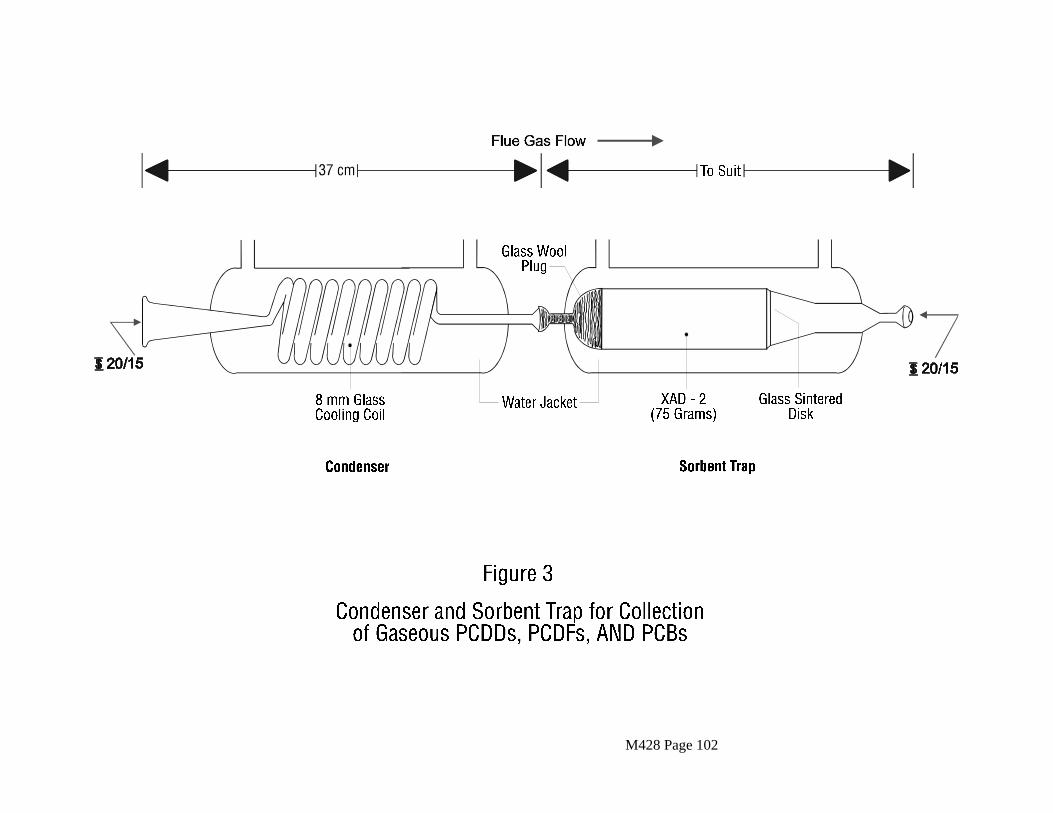
M428 Page 102
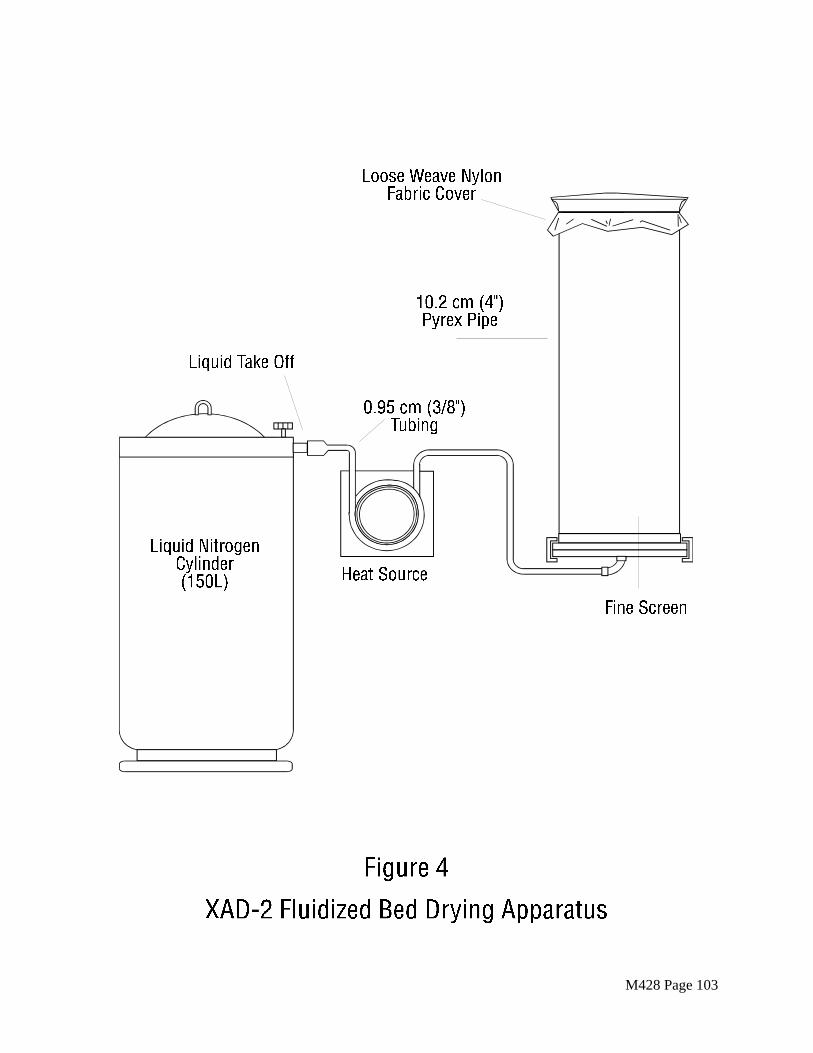
M428 Page 103
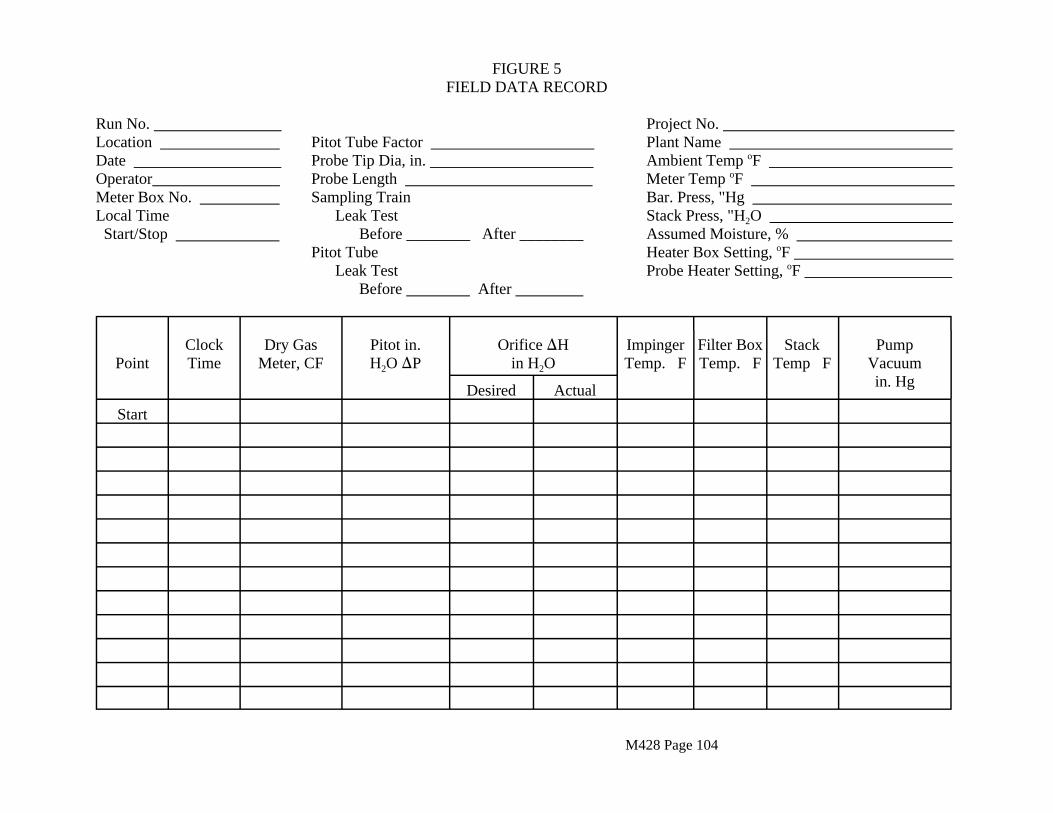
FIGURE 5 FIELD DATA RECORD
Run No. Project No. Location Pitot Tube Factor Plant Name Date Probe Tip Dia, in. Ambient Temp oF Operator Probe Length Meter Temp oF Meter Box No. Sampling Train Bar. Press, "Hg Local Time Leak Test Stack Press, "H2O Start/Stop Before ________ After ________ Assumed Moisture, %
Pitot Tube Heater Box Setting, oF Leak Test Probe Heater Setting, oF
Before After
Point Clock Time
Dry Gas Meter, CF
Pitot in. H2O )P
Orifice )H in H2O
Impinger Temp. EF
Filter Box Temp. EF
Stack Temp EF
Pump Vacuum in. Hg
Desired Actual
Start
M428 Page 104
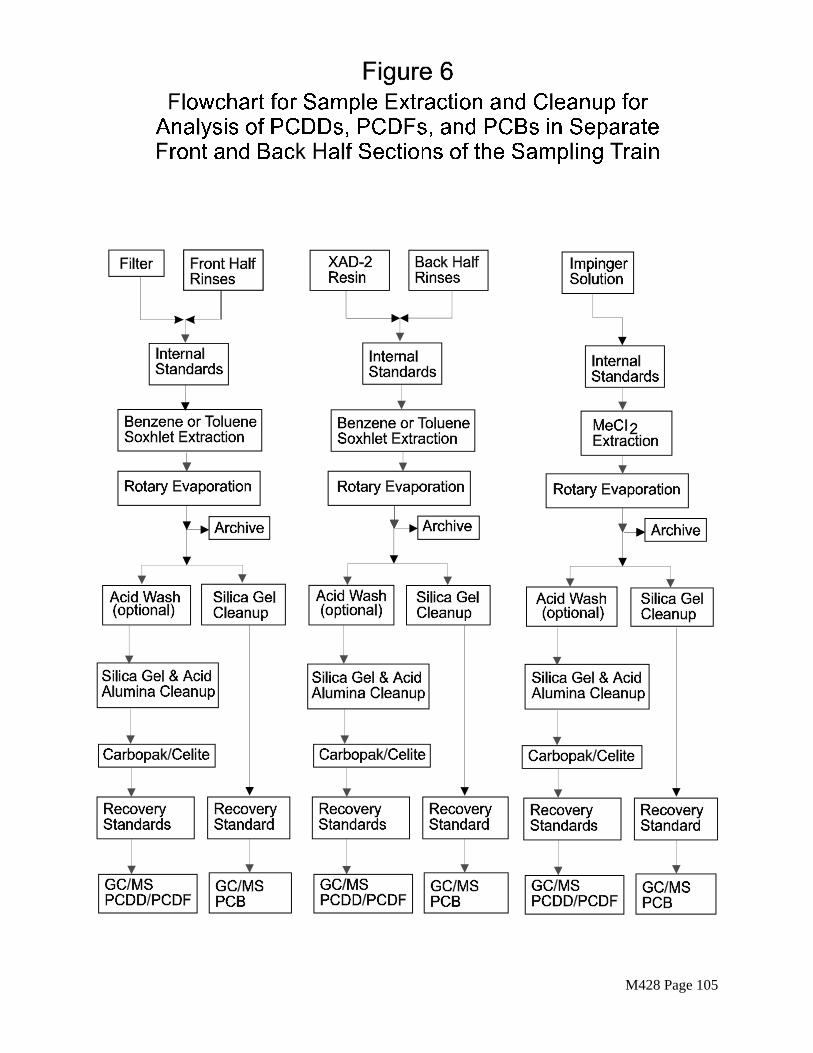
M428 Page 105
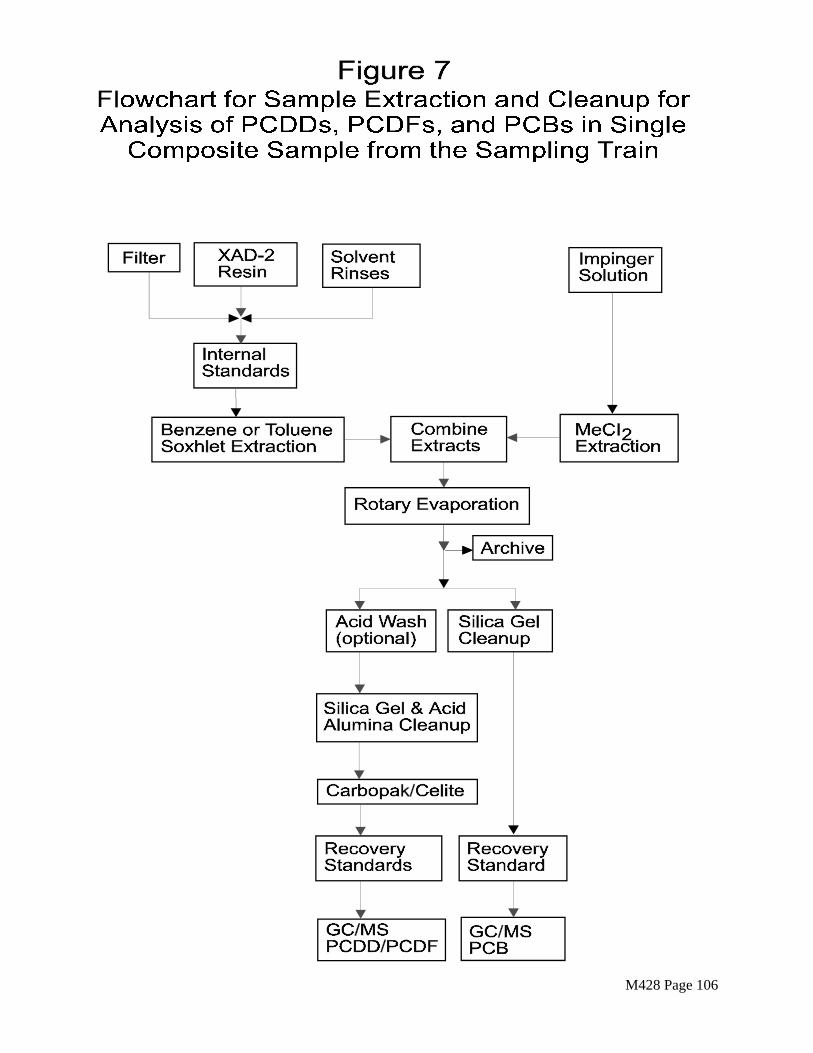
M428 Page 106