Embed Size (px)
Citation preview
Capturing Uncertainty in Geomodels – Best Practices and Pitfalls
December 2013 Page 1
Capturing Uncertainty in Geomodels:
Best Practices and Pitfalls
11-12 December 2013
Corporate Supporters
Conference Sponsors

Capturing Uncertainty in Geomodels – Best Practices and Pitfalls
December 2013 Page 2
CONTENTS PAGE
Conference Programme Pages 3 - 4 Oral Presentation Abstracts Pages 5 - 62 Poster Presentation Abstracts Pages 63 - 65 Fire and Safety Information Pages 66 – 68

Capturing Uncertainty in Geomodels – Best Practices and Pitfalls
December 2013 Page 3
PROGRAMME
Wednesday 11 December
08.30 Registration
08.50 Opening Welcome
09.00 Keynote Speaker: Mark Bentley (AGR TRACS Training) Modelling for Comfort
09.50 Arne Skorstad (Roxar Software Solutions) Propagating Uncertainties through Disciplines – Avoiding Local Optimizations on Wrong Assumptions
10.20 David J. Cox (BP) Capturing Stratigraphic and Depositional Framework uncertainty in inter-well areas: an example from the Magnus Field, Northern North Sea, UK
10.50 Break
11.10 Clare Bond (Univeristy of Aberdeen) Methods to Minimize and Capture Uncertainty During Model Creation
11.40 Dan Cornford (IGI Ltd) What To Do When We Know Our Models Are Wrong, And How Can We Tell When They Are Probably Right?
12.10 Patrick Fichtl (BP) From Subsurface Uncertainty Assessment to Risk Management: How to Make Best Use of Our Static Reservoir Models.
12.40 Lunch
13.40 Keynote Speaker: Martha Stunell (Schlumberger) Integration Matters- The Challenge of Adopting Technology for Effective Subsurface Uncertainty Assessments
14.30 Gary Skinner (Baker Hughes) Wellbore Position Uncertainty: A primer for Geomodellers
15.00 Claire Imrie (Senergy) Application of the ‘Design of Experiments’ method to estimate oil-in-place volumes
15.30 Break
15.50 April Lloyd (GDF SUEZ) Testing the Darwin Visualisation Tool - As Part of Frontsim Streamline Simulation for Efficient Dynamic Model Selection. Case Study: Austen Field, Central North Sea UK
16.20 Renaud Meunier (Geovariances, France) Model-Derived Uncertainties or Uncertainty about Models?
16.50 Liz Chellingsworth (AGR-TRACS) Expectation Analysis in the Assessment of Volume Ranges in Appraisal and Development – A Case Study
17.20 Finish
17.30 Wine Reception

Capturing Uncertainty in Geomodels – Best Practices and Pitfalls
December 2013 Page 4
Thursday 12 December
08.30 Registration
09.00 Keynote Speaker: Neil Dunlop (BG Group) Making Uncertainty Useful
09.50 Mike Hawkins (Shell) Using Stochastic Material Balance Techniques to Reduce Uncertainty during Static Model Building
10.20 Simone Silcock (Statoil) Stochastic Modeling of the Mariner Heimdal Reservoir and the Need for a Deterministic Input.
10.50 Break
11.10 John Marshall (Shell) Goldeneye: Modelling a Depleted Field for Carbon Capture - How Much Uncertainty is Left?
11.40 Roger Kimber (Centrica) Volumetric & Dynamic Uncertainty Modelling in Block 22, Trinidad & Tobago
12.10 Lunch and Posters
13.00 Keynote Speaker: Christian Höcker (Baker Hughes JewelSuite) Structural Uncertainty – Real or Caused by Flaws in Analysis and Modelling?
13.50 Kathryn Hardacre (Shell) Automation and Anchoring: Challenges for Managing Fault-Horizon Framework Uncertainty in Geomodels
14.20 Charline Julio (Université de Lorraine) Stochastic Approach to Manage Uncertainties Related to Relay Zone Modeling
14.50 Break
15.10 Richard Todd (Maersk) Uncertainty Modelling in the Maclure Field, A Statistical Approach to Complex Injectite Systems
15.40 Andre Jung (Stanford University) A Geologically Consistent and Rapid Workflow Bridging from Discrete Fracture Networks to Geo-Cellular Grids
16.10 Tim Wynn (AGR-TRACS) Data Constraints on Reservoir Concepts and Model Design
16.40 Finish
Poster
Defining Uncertainty & Modelling of Thin-bed pay using an integrated approach in a JV partnership; including an example. Bhagaban Das(Reliance Industries) and Douglas Dickey (BP India)

Capturing Uncertainty in Geomodels – Best Practices and Pitfalls
December 2013 Page 5
Oral Presentation Abstracts
(Presentation order)

Capturing Uncertainty in Geomodels – Best Practices and Pitfalls
December 2013 Page 6
Wednesday 11 December

Capturing Uncertainty in Geomodels – Best Practices and Pitfalls
December 2013 Page 7
Keynote Speaker: Modelling for Comfort Mark Bentley, AGR TRACS Training,
For most E&P decisions the stakes are high and the decision must be made in the face of significant uncertainty, and hence commercial risk. Our role as technical professionals is to use modelling tools to support such decisions and this presents us with two options: we either use the tools to quantify the uncertainty and highlight the risks, or we use the same tools to determine an optimum, preferred path and hence give comfort to the decision maker. These paths are not the same, and it is argued here that while we may strive for the former, natural biases (heuristics) lead us quickly to the latter – we end up ‘modelling for comfort’ and regressing to a best guess much earlier than is necessary in the process. The risk is that we use a cloak of modelling technology to simply make ourselves feel better about a tough decision. Why? Perhaps because big modelling exercises serve the purposes of: - Allowing us to do a technical piece of work,
which we’re good at; - Offering scope for smart solutions, which
we like; - Making us and others feel we’ve done all
that can be done; - Giving comfort to the decision makers that
their technical team has been thorough.
Complex modelling workflows can also be useful in partner meetings, although not always with altruism in mind.
***
It is proposed that reservoir modelling and simulation tools should be employed to reveal both the exciting upside and the looming downside. Modelling should make us uncomfortable. Is this just a call to a neurotic lifestyle? No, although from a business perspective some mild neurosis is preferable to an over-confident best guess. This is instead a call to use modelling to quantify upsides and downsides – NOT to determine then fine polish a best guess which we know is unlikely to be correct. With risks exposed we are better placed to make a decision. The subtlety is how to choose a workflow which keeps us on that path, avoiding the common biases which lead us to collapse on a preferred case too soon.
***

Capturing Uncertainty in Geomodels – Best Practices and Pitfalls
December 2013 Page 8
So what workflow? Generically, we can identify three options: distinguishing those who prefer statistically-led solutions from those who prefer concept-led multi-determinism. The third option is the best guess route, which few claim as a technical solution to uncertainty handling, but often represents our end point once we’ve collapsed on a comfortable preferred case. .
Any form of multiple modelling workflow can deliver a good result, if handled carefully, and hopefully we will see several alternatives show-cased at this event. The risk to success is that we fall prey to in-built heuristics which cause a quantified range to collapse. We love to anchor, as illustrated by the chart below, taken from risking courses in which 110 individuals have estimated P90-P10 ranges for a field volume. The ranges are too narrow and the P50 best guesses within those ranges are highly unstable. Moreover, it is relatively easy to prime ourselves and each other to drop a P50 anchor in a misleading place.
The advice is to choose a method which avoids common biases, particularly anchoring and priming and to resist the temptation to believe that exhaustive, complex modelling solutions in themselves put us in a better place. Often we are simply using these for comfort. Less is sometimes more.
Best GuessAnchored on a preferred ‘base case’
Multiple StochasticModels selected by building
‘equiprobable’ realisations from a base case model
Multiple DeterministicModels designed manually based on
discrete alternative concepts
Where we
tend to end
up
What we say
we do at
conferences

Capturing Uncertainty in Geomodels – Best Practices and Pitfalls
December 2013 Page 9
NOTES
Capturing Uncertainty in Geomodels – Best Practices and Pitfalls
December 2013 Page 10
Propagating Uncertainties through Disciplines – Avoiding Local Optimizations on Wrong Assumptions Arne Skorstad and Garrett Leahy, Roxar Software Solutions
In all areas of reservoir modelling there are uncertainties involved. All the different data we gather tell us a lot about the reservoirs, but it is a mistake to consider them 100% accurate. Also the assumptions we as geomodellers make are subject to uncertainties; sometimes comprehensibly small, other times decisive for the conclusion of the modelling, with possibly major financial downsides. In a situation with both uncertain input data and model assumptions the industry produces a lot of detailed reservoir characterization that proves useful, but can we still do it better? Of course there is room for improvement. We argue that anchoring the geomodelling to a precise representation based on uncertain data is inferior to capturing the uncertainties of the data, and use these uncertainties in the following steps of the modelling. A too common pitfall is to assume that e.g. the structural model based on the seismic data is accurate, restricting subsequent modelling to the framework defined by this initial structural model. Why is this often done? A partial answer is found by looking at the software-workflows used by the industry, since what a geomodellers can do is restricted by what is allowed within the software. We demonstrate a workflow where uncertainty in seismic data is captured at time of interpretation, and how this uncertainty plays an integral part in the structural modelling together with conditioning on well picks data also associated with uncertainties, and onwards to automatic grid building. By combining these uncertainties a more representative distribution of possible static uncertainties is achieved. The next step is to explore the dynamic uncertainties. Instead of letting dynamic uncertainties be a topic only in the reservoir engineering domain and static uncertainty be a completely different topic, a better approach is to promote multi-discipline workflows where uncertainties are acknowledged throughout the modelling cycle. Thereby it will in the end give solutions where the risks and opportunities associated with the different decisions can be identified, and where the realistic span of a prospect is not suppressed before the decision gate.

Capturing Uncertainty in Geomodels – Best Practices and Pitfalls
December 2013 Page 11
NOTES

Capturing Uncertainty in Geomodels – Best Practices and Pitfalls
December 2013 Page 12
Capturing Stratigraphic and Depositional Framework Uncertainty in Inter-Well Areas: An Example from the Magnus Field, Northern North Sea, UK David J. Cox, Michael A. Cottam, R. Alan Carruthers, Euan Laws and Tim Nash, BP Exploration Operating Company Limited, 1-4 Wellheads Avenue, Dyce, Aberdeen, AB21 7PB
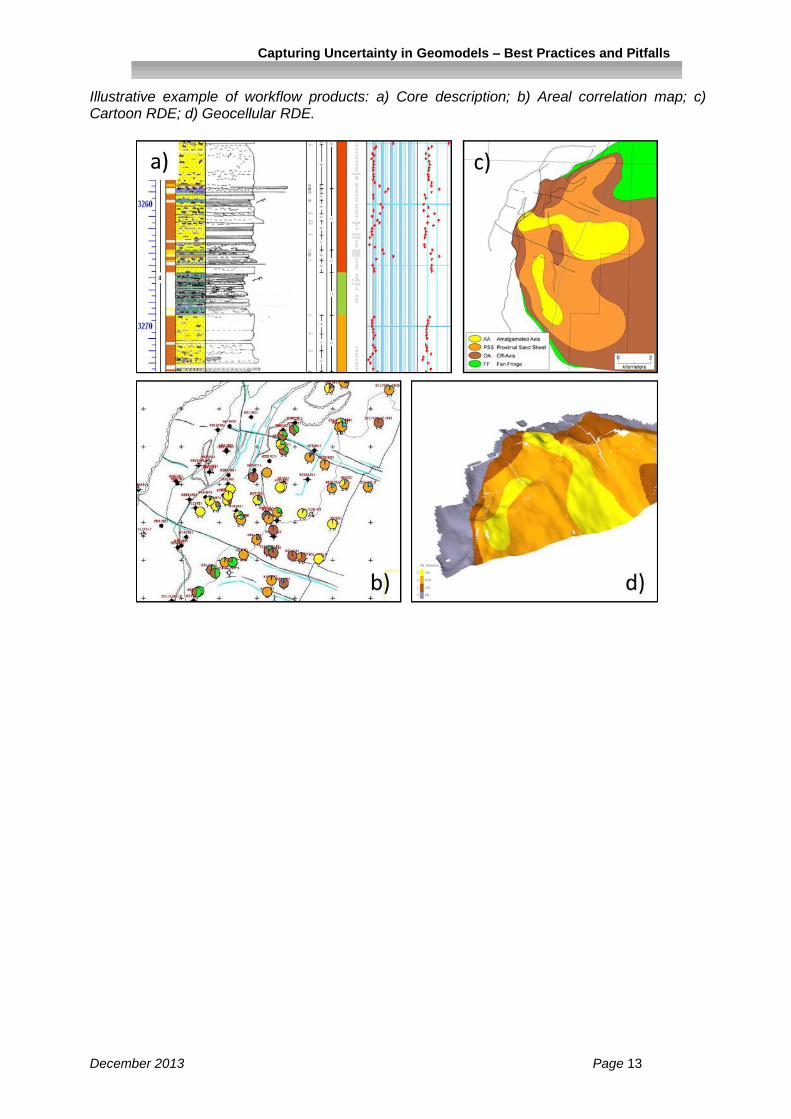
We present workflows for capturing static model uncertainties within the geomodelling process based on recent work from the Magnus Field, Northern North Sea, UK. The Magnus Field comprises a series of Upper Jurassic high net to gross deep water submarine fan sandstones, which lay within the south-easterly dipping footwall of the NE-SW End of the World Fault system at the north-western boundary of the East Shetland Basin. The field commenced production in 1983, and is currently celebrating 30 years, with successive development under water injection and water-alternating-gas enhanced oil recovery mechanisms. During development the field has been penetrated by more than 100 wellbores, and over 3 km of core has been acquired. Impact versus manageability analysis identified key modelling uncertainties that include the field’s stratigraphic layering and the extrapolation of depositional elements in to the inter-well areas. Seismic data afford good constraint on the gross Structural and Stratigraphic Framework of the field, and the abundant well penetrations and core data provide excellent – but finite – deterministic control on the Stratigraphic and Depositional Frameworks. However, away from well control the Depositional Framework is poorly resolved by the current seismic data, and meaningful extrapolation into the inter well areas remains challenging. We present a multiphase workflow used to capture uncertainties associated with modelling these depositional elements within the inter-well areas and translating the resulting model in to the dynamic realm. The static Stratigraphic Framework is defined based on deterministic well control. Uncertainties associated with extrapolating the Stratigraphic Framework into the inter-well areas are explored and captured by integrating static and dynamic data into two-dimensional correlation panels and cartoons. The resulting correlation panels and isochores maps are combined with analogue data to generate the three-dimensional Depositional Framework. The resulting Reservoir Depositional Element maps (RDEs) are used to condition the Rock Properties Framework (e.g. facies, net to gross, porosity, permeability) input into the static geocellular model. Upscaled into the dynamic geocellular model, the RDEs form a key variable for exploring uncertainty space.
Capturing Uncertainty in Geomodels – Best Practices and Pitfalls
December 2013 Page 13
Illustrative example of workflow products: a) Core description; b) Areal correlation map; c) Cartoon RDE; d) Geocellular RDE.

Capturing Uncertainty in Geomodels – Best Practices and Pitfalls
December 2013 Page 14
NOTES
Capturing Uncertainty in Geomodels – Best Practices and Pitfalls
December 2013 Page 15
Methods to Minimize and Capture Uncertainty during Model Creation Clare E. Bond, Geology and Petroleum Geology, Kings College, University of Aberdeen, AB24 3UE
Geological models are simplifications of the complexities inherent in ‘true’ geology. These simplifications are not only essential, but sensible given the true complexities involved. Understanding how geologists use data to create geological interpretations and ultimately geological models is an essential element in understanding their uncertainty. If it is possible to better understand the uncertainties in creating interpretations then we are better placed to understand uncertainties in the geological models created from them. In a series of experiments investigations into how geoscientists interpret data were undertaken (Bond et al., 2007, 2011, 2012; Torvela and Bond, 2011). These experiments investigated both how interpretations were made, e.g. techniques employed and thought processes; as well as the final interpretation outcome. The results suggest that technique use and specifically ‘model’ validation tools can have important implications on the final outcome. Use of formal validation techniques and software, allows the interpreter to check if the geometrical configuration of faults and horizons are valid and ‘balance’ (i.e. can the final geometry be created as a sequence depicting the geological evolution?). In the experiments, even using non-formal validation techniques and thought processes are shown to have a significant impact on interpretational outcome. In this paper I present the result of these earlier experiments with more recent work, including video footage of interpreters in action and analysis of the impact of different data types on outcome and technique use. Video analysis allows the ‘verbalized’ thought processes of interpreters to be considered as part of the interpretative process. In computer-based interpretation environments there are minimal options for annotation with no tools to capture thought processes. The video footage suggests that geological context, intellectual property and knowledge are lost because of these constraints. In terms of data type initial experimental analysis suggests that certain data types and environments are more conducive to ongoing model validation during interpretation. The outcomes of the experiments are placed in the context of geological model creation and analysis, with suggestions made for methods to minimize and capture uncertainty during model creation. References Bond, CE., Lunn, RJ., Shipton, ZK. & Lunn, AD. (2012). 'What makes an expert effective at interpreting seismic images?'. Geology, vol 40, no. 1, pp. 75-78. DOI: 10.1130/G32375.1
Torvela, TM. & Bond, CE. (2011). 'Do experts use idealised structural models?: Insights from a deepwater fold-thrust belt'. Journal of Structural Geology, vol 33, pp. 51-58. DOI: 10.1016/j.jsg.2010.10.002 Bond, CE., Philo, C. & Shipton, ZK. (2011). 'When there isn’t a right answer: interpretation and reasoning, key skills for 21st century geoscience'. International Journal of Science Education, vol 33, no. 5, pp. 629-652. DOI: 10.1080/09500691003660364 Bond, CE., Shipton, ZK., Gibbs, AD. & Jones, S. (2008). 'Structural models: Optimizing risk analysis by understanding conceptual uncertainty'. First Break, vol 26, no. 6, pp. 65-71.http://fb.eage.org/content.php?id=28406
Bond, CE., Gibbs, AD., Shipton, ZK. & Jones, S. (2007). 'What do you think this is?: "Conceptual uncertainty" In geoscience interpretation'. GSA Today, vol 17, no. 11, pp. 4-10. DOI: 10.1130/GSAT01711A.1

Capturing Uncertainty in Geomodels – Best Practices and Pitfalls
December 2013 Page 16
NOTES

Capturing Uncertainty in Geomodels – Best Practices and Pitfalls
December 2013 Page 17
What To Do When We Know Our Models Are Wrong, And How Can We Tell When They Are Probably Right? Dan Cornford, IGI Ltd, UK and Computer Science, Aston University, UK
As scientists we use models every day. We know they are without exception wrong, that is they are by definition approximations, and we often use our expertise to judge the value of the information we obtain from using them. However we are building and using increasingly complicated and complex models, or simulators, which exhibit behaviour that is often not well understood apriori across all possible input permutations by the scientists using them.
In this presentation I argue that the only mechanism for dealing with large, complicated models is to build them as stochastic simulators from inception. Retro-fitting uncertainty on such simulators is likely to produce stochastic structures which are too complex, or over-simplify the error structure. Thus at construction where approximations are made in the simulators these should be described probabilistically. A probabilistic description allows us to learn about, and potentially reduce, uncertainties in our simulators and their predictions from our observational data using data assimilation and history matching.
Figure 1. An overview of the Bayesian framework within which modelling can be understood.
I will develop a Bayesian framework within which such inference processes can take place and briefly review the state of the art in data assimilation and probabilistic modelling, highlighting relevant resources and techniques. I will finish with a discussion of how to validate predictions made from probabilistic models. This requires us to consider the calibration and sharpness of the predictions, for which I will show a number of diagnostics.
Figure 2. An example of data assimilation on a stochastic model (black – ‘truth’, blue points –
observations, red line – mean estimate, pink envelope – 90% confidence interval).

Capturing Uncertainty in Geomodels – Best Practices and Pitfalls
December 2013 Page 18
NOTES
Capturing Uncertainty in Geomodels – Best Practices and Pitfalls
December 2013 Page 19
From Subsurface Uncertainty Assessment to Risk Management: How to Make Best Use of our Static Reservoir Models. Patrick Fichtl, Philip Hirst and Ismar Kaesbach, BP Exploration Operating Company Limited, Chertsey Road, Sunbury-on-Thames, TW16 7LN
Risk assessment and management is paramount to all reservoir management activities: from economical prospect evaluation to depletion planning without omitting well planning. Identifying and understanding the impact of key risks and their underlying subsurface uncertainties requires a multi-disciplinary approach, a common process and good communication. Static models can be a very powerful vehicle to manage these multiple activities if used in the right way. In that regard static models should not be used as a platform to lead the risk and uncertainty assessment process but should be considered as tools “for thinking”, integration and adaptation when necessary.
This paper presents methods on the use of static reservoir models for risk and uncertainty management through two field based examples respectively with low and high data quality illustrating the everyday challenges we face when making business decisions.
Application
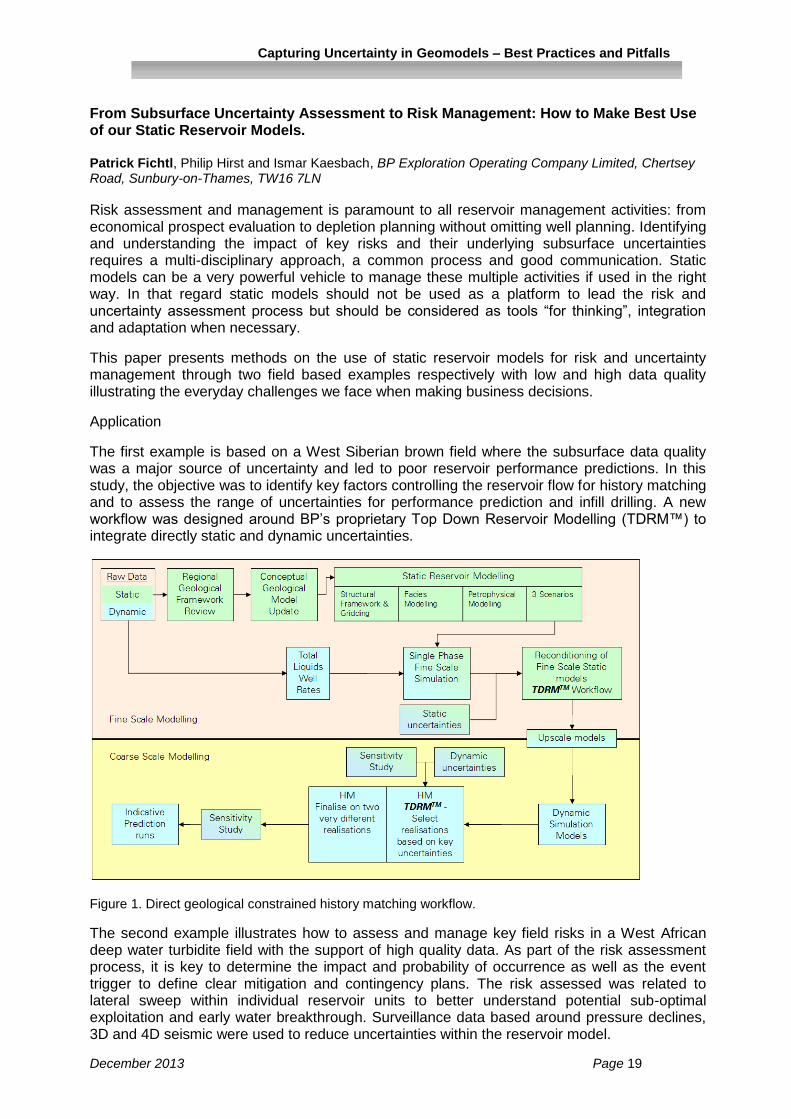
The first example is based on a West Siberian brown field where the subsurface data quality was a major source of uncertainty and led to poor reservoir performance predictions. In this study, the objective was to identify key factors controlling the reservoir flow for history matching and to assess the range of uncertainties for performance prediction and infill drilling. A new workflow was designed around BP’s proprietary Top Down Reservoir Modelling (TDRM™) to integrate directly static and dynamic uncertainties.
Figure 1. Direct geological constrained history matching workflow.
The second example illustrates how to assess and manage key field risks in a West African deep water turbidite field with the support of high quality data. As part of the risk assessment process, it is key to determine the impact and probability of occurrence as well as the event trigger to define clear mitigation and contingency plans. The risk assessed was related to lateral sweep within individual reservoir units to better understand potential sub-optimal exploitation and early water breakthrough. Surveillance data based around pressure declines, 3D and 4D seismic were used to reduce uncertainties within the reservoir model.

Capturing Uncertainty in Geomodels – Best Practices and Pitfalls
December 2013 Page 20
Figure 2. Assessing lateral sweep risk by comparing 4D anomalies and predicted water front from reservoir model.
Results, Observations, and Conclusions
These two field based examples demonstrated that in order to accommodate data of variable quality for risk and uncertainty assessment, integration, flexibility and adaptability are key features when designing static reservoir models and associated workflows.
In the first example, the integrated approach answered most of the initial geological issues and delivered a small set of matching models in terms total liquid rates. These matching models were further investigated through a more dynamically focused uncertainty analysis resulting in a fully constrained range of possible models for infill drilling optimization and well design.
The second example illustrates the need for a robust process to relate uncertainties to specific risk events. By understanding the limits of predictability of the existing reservoir model by analysing 4D anomalies, key reservoir risks could be quantified and subsequent mitigation and contingency plans put in place for reservoir management purposes.

Capturing Uncertainty in Geomodels – Best Practices and Pitfalls
December 2013 Page 21
NOTES

Capturing Uncertainty in Geomodels – Best Practices and Pitfalls
December 2013 Page 22
Keynote Speaker: Integration Matters- The Challenge of Adopting Technology for Effective Subsurface Uncertainty Assessments Martha Stunell, Reservoir Engineering Technical Consultant, Schlumberger Information Solutions
E&P companies want to speed up and increase confidence in making business decisions so that oil and gas resources are developed at a faster pace with better understanding of uncertainties and reduced risk. The past few decades has seen enormous advances in reservoir engineering and geoscience software applications that are used to support this decision making as well as the hardware systems on which these applications can be run. This has led to both an increase in the size of geological and simulation models as well as the number of different realizations that can be created; many realizations are often needed to express the uncertainty in data, both measured and interpreted, and in people’s conceptual understanding of the subsurface. In addition, software platforms have transformed the ability of subsurface teams to work in an integrated manner. But despite software and hardware enabling things we could only dream of 15 years ago, making effective use of these tools is a challenge now facing the industry. Significant changes to workflows, processes, and capability is often required and best practice is yet to be fully established. In this talk, I would like to share experiences of adopting new technology and in particular the value that can be added through an integrated approach to uncertainty assessment. I will describe not only the software technology required but also the computing infrastructure, workflows and processes, and most importantly the implications for engineers and geoscientists so that the benefits of multiple realization workflows can be realised. Incorporating sub-surface static and dynamic uncertainties in a consistent and integrated manner for decision makers to make use of is a challenge. Not only do business processes need to be updated, but human psychology and risk intelligence also come into play. This is a change management exercise for many companies, and usually relies on individuals to drive this transformation. I will present both the technology that is available, and also discuss key tools for framing uncertainty studies and for communicating the results both within a multi-disciplinary team and to management/decision takers. I hope to show that integration matters and, in fact, is essential when studying uncertainty in the subsurface and when taking key field development decisions.

Capturing Uncertainty in Geomodels – Best Practices and Pitfalls
December 2013 Page 23
NOTES
Capturing Uncertainty in Geomodels – Best Practices and Pitfalls
December 2013 Page 24
Wellbore Position Uncertainty: A primer for Geomodellers Gary Skinner, Baker Hughes
Understanding the subsurface position of a well path is critical when trying to use the information from a wellbore for development, planning and subsequent drilling operations. This paper will briefly discuss the history of wellbore position uncertainty, how it is quantified, and what a geomodeller needs to consider when using formation evaluation data to update a model. Directional Surveying Uncertainty modelling and the ISCWSA
In 1995 the Industry Steering Committee on Wellbore Survey Accuracy (ISCWSA) formed with the mission to (ISCWSA, 2013):
Produce and maintain standards for the industry relating to wellbore survey accuracy
To set standards for terminology and accuracy specifications.
Establish a standard framework for modelling and validation of tool performance.
Raise awareness & understanding of wellbore survey accuracy issues across the industry
The ISCWSA has published several peer-reviewed papers, two of which describe the mathematical framework used to predict survey tool uncertainty for magnetic (Williamson, 2000) and gyroscopic-based (Torkildsen et al, 2004) tools. These two frameworks have predominately obsoleted the simple fixed uncertainty per depth cone-based and the Wolff and De Wardt (1981) model. Further publications include: The Joint Industry Project e-book "Introduction to Wellbore Positioning” (UHI, 2013a), a training presentation associated with the guide (UHI, 2013b) and a Collision Avoidance Lexicon (with position uncertainty terminology) (ISCWSA, 2011). The ISCWSA framework accounts for several uncertainty sources and assumes tools are calibrated, standard operating procedures and quality control are applied, and the well path has been surveyed frequently enough to characterise its true path without gross errors. Williamson and Wilson (2000) describe some of the gross error sources generally not accounted for within the industry. From a geomodeller’s perspective, the two most important are a consistent mapping grid system and whether grid scale factor has been applied. This “surface positional uncertainty” also needs to be considered, especially older (pre-1990s) offshore exploration wells. Survey Program, Tools and Techniques
Different survey tools have different uncertainty characteristics; a survey program needs to be designed to achieve the requirements of the drilling and the geology and geophysics groups. Techniques exist that can be applied to improve directional survey uncertainty. These can be grouped into lateral, vertical, or reliability improvements. Vertical Improvement
The largest component of vertical uncertainty in deviated wells is a result of bottomhole assembly (BHA) sag. This is caused by the tubular housing the directional sensor to bend due to gravity offsetting the actual inclination measured. Recently, techniques have been developed using two independent inclination sensors to provide a dual inclination service to improve true vertical depth (TVD) control and reduce uncertainty. Stockhausen and Lesso (2003) identified an issue when drilling with motors because a single survey in a stand may not truly account for the well path’s trajectory, one of the uncertainty models assumptions, due to

Capturing Uncertainty in Geomodels – Best Practices and Pitfalls
December 2013 Page 25
the slide / rotate pattern involved. Continuous inclination monitoring and rotary steerable systems can avoid this. Lateral Improvement
Magnetic survey tools must be corrected for the magnetic declination (the angle between magnetic north and true north). Global geomagnetic models are available, but sometimes a localised knowledge of the magnetic field is required, this is known as in-field referencing (IFR). For high latitudes interpolated in-field referencing (IIFR) is often used, which also accounts for the variation caused by interactions between the solar wind and the Earth’s magnetic field. Reliability improvement
Multi-station analysis (MSA) enables deeper investigation and a higher level of quality assurance than the rigsite standard single-station QC. Application of multi-station analysis, as well as corrections such as IFR, requires specialists as an understanding of the magnetics and tool behaviour is required. It is possible to use a multi-station analysis to identify, and correct for, environmental anomalies such as magnetic drilling fluid or a magnetic hot-spot on an MWD collar. Having an actively managed, definitive directional survey database ensures that a clean set of positional information exists that can be referenced for validation of positional information associated with the formation evaluation data used to refine models. Uncertainty Reporting
Well path position uncertainty is represented by a 3-dimensional ellipsoid of uncertainty. Two systems are used to report positional uncertainty; the tool-centric High side, Lateral, Along Hole (HLA) and the Earth-centric North, East, Vertical (NEV) systems. For geomodelling the NEV system is most useful. A NEV report will usually consist of 4 columns:
Horizontal Major semi-axis: Largest ellipsoid dimension projected on the horizontal plane
Horizontal Minor semi-axis: Shortest ellipsoid dimension projected on the horizontal plane
Horizontal Minor axis azimuth: Azimuth from north of the semi-axis
Vertical Semi-axis: Ellipsoid dimension projected on the vertical plane
The confidence of this data will be reported as either standard deviations or confidence percentage. It is important that this confidence level is applied consistently throughout a project.
Model MD [m]
Incl. [°]
Vertical Semi-axis [m]
Horizontal Semi-axis Major [m]
Standard MWD 8000 90.00 60.86 246.85 29.26 75.1
IFR + Sag + Dual Inclination
8000 90.00 14.98 176.59 22.42 75.2
Difference 45.88 70.26 6.84
Table of Uncertainty at 3 Standard derivations for Standard measurement-while-drilling (MWD) and IFR
+ Sag + Dual Inclination models using ISCWSA Test Well No. 1 profile

Capturing Uncertainty in Geomodels – Best Practices and Pitfalls
December 2013 Page 26
Lateral uncertainty. 100m grid spacing, 3 Standard Deviations
Vertical uncertainty. 50m grid spacing, 3 Standard deviations
Fig. IFR + Sag + Dual Inclination error model (inner ellipses) vs. ‘Standard’ MWD error model (outer ellipses)
What geomodellers can do for Directional Drillers and Well planners
One of the biggest challenges for well planners is to know the source of the well design criteria. It is possible to share geomodels with the well planner and incorporate them into the planning process. By working as a team to design the well time can be saved by reducing iteration delays. Defining a volumetric target allows the target to be ‘eroded’ with the well path position uncertainty to create a driller’s target – enabling the driller to see the tolerance for being off plan and whether it is necessary to put in higher dogleg corrections or do them smoothly. It is also important to know how where the uncertainties lie in the geomodels, especially if there are one or two intermediate people (geologist and / or drilling engineers) passing data between the geomodeller and the well planner. Reservoir and production engineers and asset managers all need to appreciate the source of survey data, and its associated uncertainties, showing their usefulness through the entire value chain of oilfield operations.
References ISCWSA (2013) http://www.iscwsa.net/index.php/about/, 2013 ISCWSA, Collision Avoidance Lexicon 2011,http://www.iscwsa.net/index.php/download_file/view/164/85/ 2011 ISCWSA, Position Uncertainty Bibliography 2010, http://www.iscwsa.net/index.php/download_file/view/205/85/ 2010 Stockhausen E.J., Lesso, W.G. Jr., “Continuous Direction and Inclination Measurements Lead to an Improvement in Wellbore Positioning” SPE/IADC Drilling Conference, 19-21 February 2003, Amsterdam, Netherlands Torkildsen, T. Et al.: “Prediction of Wellbore Position Accuracy When Surveyed With Gyroscopic Tools,” SPE paper 90408 SPE Drilling & Completion (March 2008) Williamson, H.S.: “Accuracy Prediction for Directional Measurement While Drilling,” SPEDE (December 2000) 221-233. Williamson, H.S. and Wilson, H.F.: “Directional Drilling and Earth Curvature,” SPEDE (March 2000) 37-43. Wolff, C.J.M. and de Wardt, J.P.: “Borehole Position Uncertainty - Analysis of Measuring Methods and Derivation of Systematic Error Model,” JPT (December 1981) 2338-2350. UHI 2013a Joint Industry Project e-book "Introduction to wellbore positioning" http://www.uhi.ac.uk/en/research-enterprise/energy/wellbore-positioning-download UHI 2013b "Making the Most of Borehole Surveying" with Prof Angus Jamieson. http://www.uhi.ac.uk/surveying-summary

Capturing Uncertainty in Geomodels – Best Practices and Pitfalls
December 2013 Page 27
NOTES
Capturing Uncertainty in Geomodels – Best Practices and Pitfalls
December 2013 Page 28
Application of the ‘Design of Experiments’ Method to Estimate Oil-In-Place Volumes Claire Imrie and Euan Macrae, Senergy, Aberdeen, UK
When investigating a subsurface reservoir’s oil-in-place volume there are often many variables that affect the predicted volumes. Variables used in geomodels typically represent the geology, the size of the reservoir and reservoir properties. If all possible combinations are considered, there can be tens of thousands of permutations, directly impacting the computation time even though some variables will have negligible impact. In addition, some input variables are inherently based upon subjective expert knowledge and therefore, could be affected by cognitive biases (Baddeley et al., 2004), increasing uncertainty in the predicted volume. Hence, it is desirable to identify which variables are most influential since additional work can then be focussed on decreasing their uncertainty ranges, thereby maximising value.
Design of Experiments (DoE) is a statistical method that allows a smaller, representative model to be constructed that is less computationally intensive. The DoE method has been applied to reservoir modelling increasingly frequently since 2005 (as measured by the number of SPE papers related to it). Two key parts of the method are the selection of the design matrix (which defines what subset of combinations is to be run) and the choice of proxy model (a mathematical function relating the outcome of interest to the variables that affect it). Monte Carlo simulations of the proxy model are then run to generate a distribution, reflecting the uncertainty in the original input variables.
In this presentation, we demonstrate a refined DoE method where a two-step modelling approach is combined with best-practice recommendations for the elicitation of input variables, as well as the use of an artificial neural network for the proxy model. The benefits are as follows: the two-step modelling process allows the non-significant variables to be filtered out at an early stage, decreasing computation time; the effects of cognitive biases on the input variables are reduced; and, the neural network allows the non-linearity of the subsurface to be better represented. We focus on geological uncertainties, such as the choice of input horizons and the internal reservoir architecture. The resulting output distribution of oil-in-place volumes allows better decisions to be made with the additional benefit of reduced computation time. This presentation will identify the lessons learnt and potential pitfalls using a worked example.
Reference Baddeley, M. C., Curtis, A., and Wood, R. A. (2004). “An introduction to prior information derived from probabilistic judgements: Elicitation of knowledge, cognitive bias and herding”, in Curtis, A., and Wood, R., eds., Geological Prior Information: Informing Science and Engi

Capturing Uncertainty in Geomodels – Best Practices and Pitfalls
December 2013 Page 29
NOTES

Capturing Uncertainty in Geomodels – Best Practices and Pitfalls
December 2013 Page 30
Testing the Darwin Visualisation Tool - As Part of Frontsim Streamline Simulation for Efficient Dynamic Model Selection. Case Study: Austen Field, Central North Sea UK Lloyd A
1, Stunell M
2, Paterson G
3
1GDF SUEZ E&P UK Ltd
2Schlumberger Oilfield UK Plc
3RPS Energy
The Austen field (formerly known as Jacqui) is situated within the HPHT region of the Central North Sea (Figure 1) and is represented by a complex faulted anticline. GDF SUEZ E&P UK Ltd as the operator in partnership with E.ON E&P UK Ltd, have initiated concept select studies to assess development options. The discovery consists of 7 fault blocks, 3 of which have been penetrated by exploration or appraisal wells.
The Austen discovery is located in license block 30/13b and 5 exploration/appraisal wells have been drilled on the structure to date. The field was discovered in 1989/90 with well 30/13-3 which tested oil in Upper Jurassic mass flow sands. This was followed by two appraisal wells: 30/13-4 (1991/92) and 30/13-6 (1996) which encountered gas condensate and oil respectively. The Operator has drilled one well and sidetrack in 2012 to appraise the potential of the gas condensate fault block.
Static reservoir modelling is being carried out using Petrel to capture the potential volumetric range and to generate cases for dynamic testing. This work will form the basis for assessing development scenarios during the concept select phase. Three static models representing low/mid/high structural cases have been built, each with an integrated, variable, uncertainty workflow in order to capture the main geological sensitivities. In the Austen field, the main uncertainties are the hydrocarbon water contacts, the extent and connectivity of the reservoir sands and the petrophysical parameters.
Monte-Carlo simulations have been run on each structural model, in the gas condensate region, using the uncertainty workflows to generate static volume cases. In parallel, FrontSim coupled with Darwin has been utilised to determine the Dynamic Connectivity of each scenario. The results have been used in the screening stage using both static and dynamic criteria for model selection – optimising the choice of static models to fully represent the impact of subsurface uncertainty on production forecasts and therefore streamlining the selection process.
Typical selection processes for dynamic initialisation are based on ranking of the generated cases using a static variable parameter or In-Place volumetric estimate. In order to ensure that the selected models represent the spread in dynamic recovery, additional flow-based screening criterions were used (FrontSim). This streamline simulator enables tracer type simulations for efficient dynamic connectivity analysis on the geological models generated. These are not
Figure 1: Austen field location in UKCNS
Capturing Uncertainty in Geomodels – Best Practices and Pitfalls
December 2013 Page 31
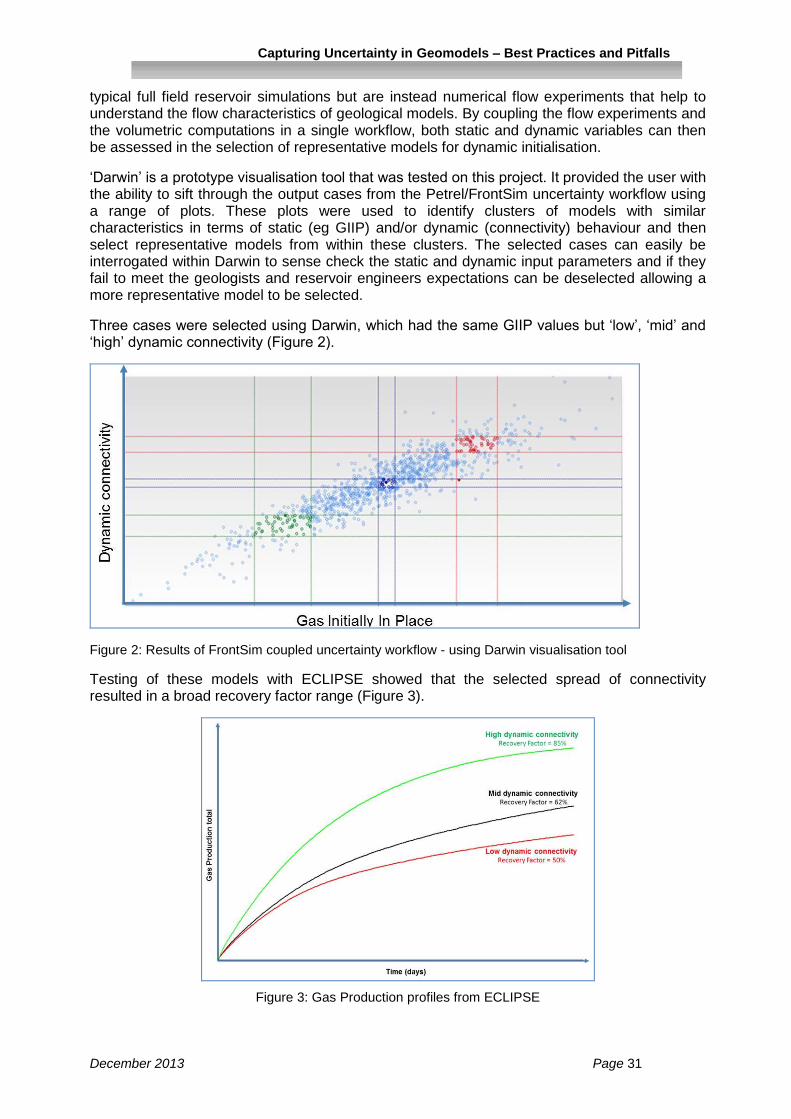
typical full field reservoir simulations but are instead numerical flow experiments that help to understand the flow characteristics of geological models. By coupling the flow experiments and the volumetric computations in a single workflow, both static and dynamic variables can then be assessed in the selection of representative models for dynamic initialisation.
‘Darwin’ is a prototype visualisation tool that was tested on this project. It provided the user with the ability to sift through the output cases from the Petrel/FrontSim uncertainty workflow using a range of plots. These plots were used to identify clusters of models with similar characteristics in terms of static (eg GIIP) and/or dynamic (connectivity) behaviour and then select representative models from within these clusters. The selected cases can easily be interrogated within Darwin to sense check the static and dynamic input parameters and if they fail to meet the geologists and reservoir engineers expectations can be deselected allowing a more representative model to be selected.
Three cases were selected using Darwin, which had the same GIIP values but ‘low’, ‘mid’ and ‘high’ dynamic connectivity (Figure 2).
Figure 2: Results of FrontSim coupled uncertainty workflow - using Darwin visualisation tool
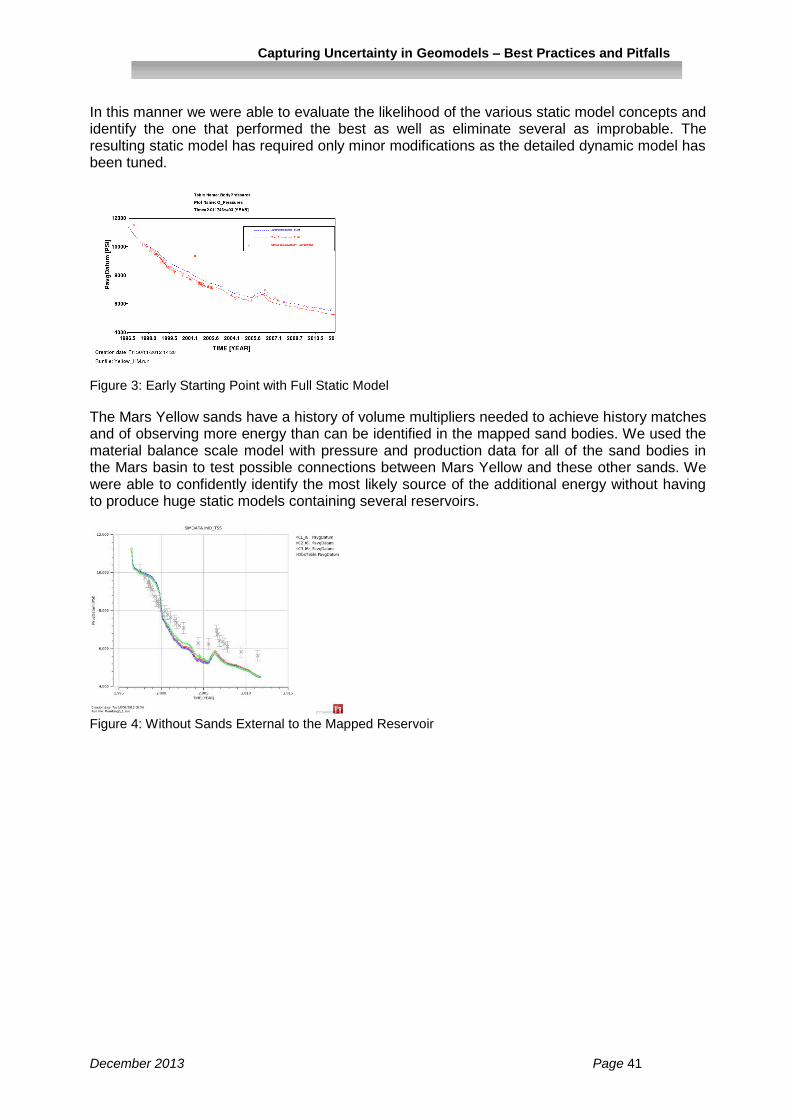
Testing of these models with ECLIPSE showed that the selected spread of connectivity resulted in a broad recovery factor range (Figure 3).
Figure 3: Gas Production profiles from ECLIPSE

Capturing Uncertainty in Geomodels – Best Practices and Pitfalls
December 2013 Page 32
NOTES

Capturing Uncertainty in Geomodels – Best Practices and Pitfalls
December 2013 Page 33
Model-Derived Uncertainties or Uncertainty about Models? Renaud Meunier, Jean-Marc Chautru, Nicolas Jeannée, Geovariances, France
Most decision-making processes in E&P are based on models, which are representations of the reality, not on the reality itself. These models can be conceptual (geological depositional concept), mathematical or a combination of both as is the case for geomodeling workflows involving various steps (Structural/Geometry, Facies/Rock Type, Petrophysical properties, Fluid properties, dynamic flow simulation).
Uncertainty is affecting most compartments of such models. This uncertainty is due to numerous factors: lack of precise data (e.g. well control), imprecise data (e.g. seismic), impossibility to conceive with certainty a conceptual model (e.g. what is the geology of this area, how did it dynamically formed?). Some of the factors can be accounted for (known source of uncertainty) and therefore be captured in a model, leading to classical uncertainty quantification. Other factors cannot be accounted for (unknown source of uncertainty), therefore limiting the capacity of prediction of the model.
Once defined the geomodel, one can quantify the related uncertainty by stochastically varying its parameters and generating equiprobable outcomes (typical geostatistical approach). To account for conceptual uncertainty, one generally uses scenario-based techniques where a weight can be given to a scenario.
The geomodel quality then depends on the amount of information (knowledge) that it incorporates. Integrating inputs (knowledge) from various disciplines helps reducing the risk of radical errors. As quoted by Dubrule (2003), “The value of modelling is in the modelling process itself, by sharing ideas and bringing discipline together to share idea and concepts". This is typically the case for reservoir characterization and for instance facies modelling. In this framework, dynamic data (production data, well tests, pressure…) synthetized by reservoir engineers is critical to validate the facies model. Indeed, hydraulic connectivity between wells or stratigraphic units can be assessed at that stage, leading to review/refine the static model and for instance facies proportion matrices.
Finally, it has to be kept in mind that uncertainty quantification should help decision making. For instance accuracy might be more important at the development or production stage than it is at appraisal where a model could only be used to figurate what parameters has more impact on uncertainty and what should be the best new target to drill to reduce it. The type of uncertainty we need to quantify should therefore vary and evolve with the development of knowledge about our targets.
The presentation will detail these concepts, discuss their practical consequences and illustrate them on real and synthetic cases.

Capturing Uncertainty in Geomodels – Best Practices and Pitfalls
December 2013 Page 34
NOTES

Capturing Uncertainty in Geomodels – Best Practices and Pitfalls
December 2013 Page 35
Expectation Analysis in the Assessment of Volume Ranges In Appraisal and Development – A Case Study Liz Chellingsworth and Pete Kane, AGR TRACS
Managers, economists and banks often require a probabilistic expression of in-place or recoverable volumes. A key challenge in describing ranges of in-place volumes or recoverable resources is relating deterministic cases to a position on the probability distribution. Research in the field of judgment and decision making has shown that humans tend to overestimate their ability to estimate parameters. Often ‘the Base Case’ is put forward as the P50 case, when it merely represents the first (or sometimes the only) case considered in the volume assessment process. Similarly, ‘the Low Case’ is often labelled as the P90 case whereas in reality it might be a P99 case (all the lows). Sometimes ‘the Low Case’ lies closer to the P50 simply because our perception of the sub-surface is more optimistic than reality. More troubling is the human tendency to anchor on a certain description, such as ‘the Best Technical Case’, and describe the uncertainty range by adjusting away from that anchor – the curse of plus or minus 10%, often resulting in a very narrow range. It is our over-confidence in the initial value (the anchor) that drives the entire uncertainty range. Pure probabilistic techniques suffer from the same problem. The P10-P50-P90 results from a Monte Carlo simulation are in effect locked in by the user who defines the input distributions upfront. The answer simply reflects the inputs. We propose a multi-deterministic workflow designed to explore and quantify the key uncertainties that define the sub-surface description and thus volumes. We demonstrate the workflow using a case study from a developed asset in the Central North Sea. The most important step in the workflow is the initial framing where the entire team comes together to put forward elements that are expected or considered to have an impact on the volumes. The elements are combined to generate an exhaustive set of realisations which can be brought together in a realisation tree. The range of each parameter is assessed individually incorporating not only inputs that are considered ‘most likely’, but also end member values and if necessary, ‘off-the-wall’ ideas. This method allows distinctly different concepts to be assessed without rejecting or fixing on a model beforehand. The probability assigned to each branch of the realisation tree can be discussed with the various stakeholders (team, managers, partners) and altered, or switched on/off altogether to assess the impact of each element. Crucially the probability of any particular parameter of uncertainty is entered only after the answers have been gathered, that is after the total range has been quantified. The outputs are collated in an expectation curve and appropriate P10-P50-P90 cases can be selected. Note that the method of implementing the assessment is secondary to the definition of the realisations to be assessed. There are numerous advantages to this approach. First and foremost, there is no requirement to anchor on a preferred case; the P50 case is defined by its position on the expectation curve. Second, each realisation is a real and plausible description of the sub-surface and can be linked back to a concept and ultimately a development plan. The method facilitates the discussion about inputs, probabilities and ranges and allows the impact of a single factor to be assessed and quantified. The workflow has been used successfully in the quantification of both in-place volumes (static) and recoverable resources (dynamic).

Capturing Uncertainty in Geomodels – Best Practices and Pitfalls
December 2013 Page 36
NOTES

Capturing Uncertainty in Geomodels – Best Practices and Pitfalls
December 2013 Page 37
Thursday 12 December

Capturing Uncertainty in Geomodels – Best Practices and Pitfalls
December 2013 Page 38
Keynote Speaker: Making Uncertainty Useful Neil Dunlop, BG Group
Have you given up trying to deal with uncertainty? Is it all about intuition? This talk looks at the way in which different uncertainties impact the Company, fields at different stages of their life, and the design of reservoir models. These different perspectives should drive the choice of approach and the amount of effort made to identify unbiased estimates of the outcomes from a development. Both proxy models and full physics models can be useful in the search for the best possible development decisions. The talk explores the relationship between these modelling approaches and the appropriate effort to make at different project stages. A framework for tuning the effort to ensure a good quality decision with a minimum of work is suggested.

Capturing Uncertainty in Geomodels – Best Practices and Pitfalls
December 2013 Page 39
NOTES

Capturing Uncertainty in Geomodels – Best Practices and Pitfalls
December 2013 Page 40
Using Stochastic Material Balance Techniques to Reduce Uncertainty during Static Model Building Mike Hawkins, SIEP PTU/D IRM Team
It is possible to use the dynamic production data in a simplified material balance scale model to quickly test many different geologic concepts and quantify the key drive mechanisms gaining useful insight prior to the construction of the static model. By working more closely together during the static model building in this manner the reservoir engineer and production geologist can reduce the size and number of changes that will be needed in the static model during the detailed history matching. The objective of our study was to produce a history matched model of the Mars Yellow sands which began production in 1996. Approximately 220 [MMBBL] of oil have been produced from these sands from a STOIIP of approximately 550 [MMBBL]. Water injection began in 2004 and succeeded in injecting 22 [MMBBL] of water. Several core samples have been tested and the rock compressibility varies from approximately 8 to 50 [µ/PSI]. The average rock compressibility is between 20 and 30 [µ/PSI]. The field history contains reservoir pressures measured by RFT and estimated from PTA.
Figure 1: Yellow RFT and PTA Values
We allocated the measured reservoir pressures to the geologic sand bodies and identified the major pressure trends. From that we identified several possible geologic concepts. Prior to building the static model, we built a simple material balance scale model (one grid block per sand body) and employed stochastic techniques to explore the full range of geologic uncertainty with each concept. Each dynamic model runs in a minute or two and thus we can complete the full evaluation of the geologic concept in one day.
Figure 2: Good Material Balance Match and Schematic
Capturing Uncertainty in Geomodels – Best Practices and Pitfalls
December 2013 Page 41
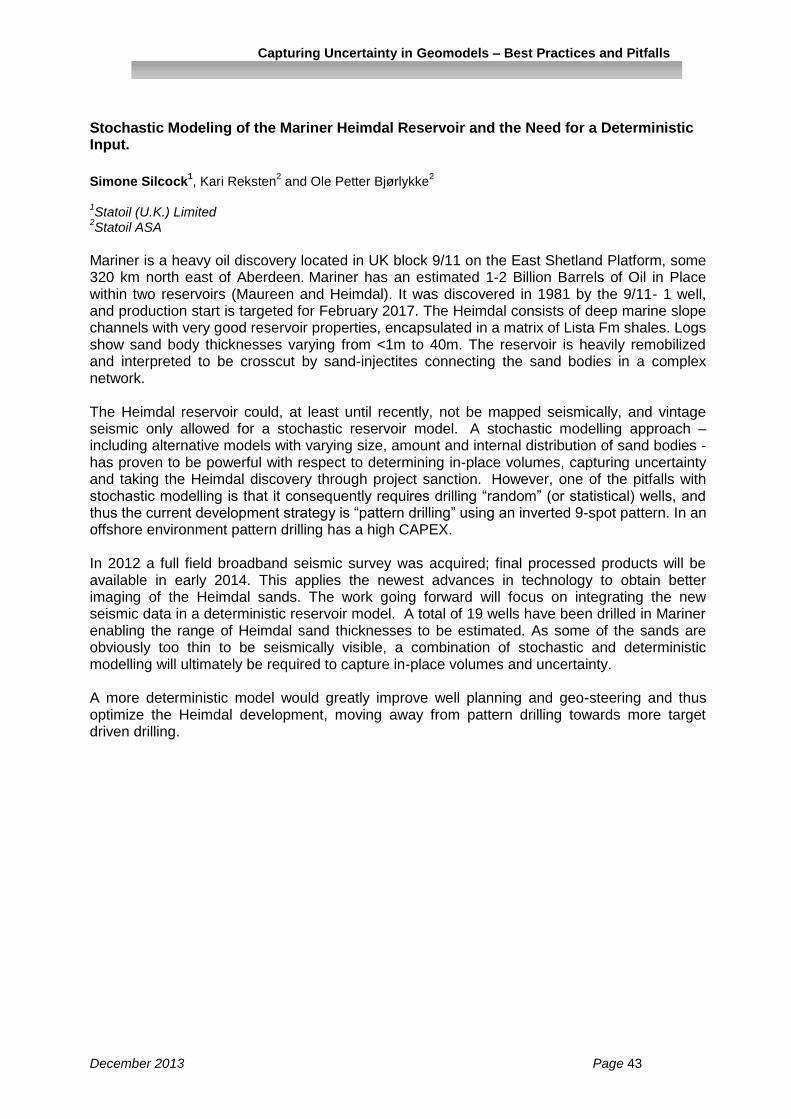
In this manner we were able to evaluate the likelihood of the various static model concepts and identify the one that performed the best as well as eliminate several as improbable. The resulting static model has required only minor modifications as the detailed dynamic model has been tuned.
Figure 3: Early Starting Point with Full Static Model
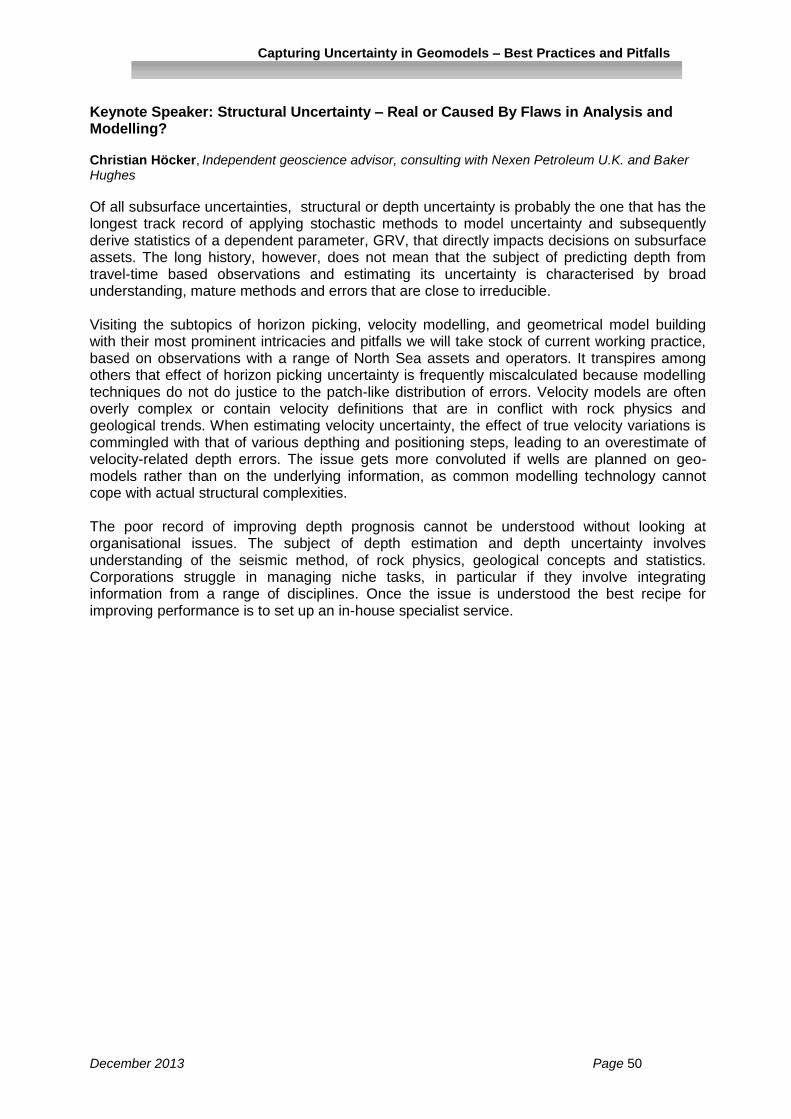
The Mars Yellow sands have a history of volume multipliers needed to achieve history matches and of observing more energy than can be identified in the mapped sand bodies. We used the material balance scale model with pressure and production data for all of the sand bodies in the Mars basin to test possible connections between Mars Yellow and these other sands. We were able to confidently identify the most likely source of the additional energy without having to produce huge static models containing several reservoirs.
Figure 4: Without Sands External to the Mapped Reservoir

Capturing Uncertainty in Geomodels – Best Practices and Pitfalls
December 2013 Page 42
NOTES
Capturing Uncertainty in Geomodels – Best Practices and Pitfalls
December 2013 Page 43
Stochastic Modeling of the Mariner Heimdal Reservoir and the Need for a Deterministic Input.
Simone Silcock
1, Kari Reksten
2 and Ole Petter Bjørlykke
2
1Statoil (U.K.) Limited
2Statoil ASA
Mariner is a heavy oil discovery located in UK block 9/11 on the East Shetland Platform, some 320 km north east of Aberdeen. Mariner has an estimated 1-2 Billion Barrels of Oil in Place within two reservoirs (Maureen and Heimdal). It was discovered in 1981 by the 9/11- 1 well, and production start is targeted for February 2017. The Heimdal consists of deep marine slope channels with very good reservoir properties, encapsulated in a matrix of Lista Fm shales. Logs show sand body thicknesses varying from <1m to 40m. The reservoir is heavily remobilized and interpreted to be crosscut by sand-injectites connecting the sand bodies in a complex network. The Heimdal reservoir could, at least until recently, not be mapped seismically, and vintage seismic only allowed for a stochastic reservoir model. A stochastic modelling approach – including alternative models with varying size, amount and internal distribution of sand bodies - has proven to be powerful with respect to determining in-place volumes, capturing uncertainty and taking the Heimdal discovery through project sanction. However, one of the pitfalls with stochastic modelling is that it consequently requires drilling “random” (or statistical) wells, and thus the current development strategy is “pattern drilling” using an inverted 9-spot pattern. In an offshore environment pattern drilling has a high CAPEX. In 2012 a full field broadband seismic survey was acquired; final processed products will be available in early 2014. This applies the newest advances in technology to obtain better imaging of the Heimdal sands. The work going forward will focus on integrating the new seismic data in a deterministic reservoir model. A total of 19 wells have been drilled in Mariner enabling the range of Heimdal sand thicknesses to be estimated. As some of the sands are obviously too thin to be seismically visible, a combination of stochastic and deterministic modelling will ultimately be required to capture in-place volumes and uncertainty. A more deterministic model would greatly improve well planning and geo-steering and thus optimize the Heimdal development, moving away from pattern drilling towards more target driven drilling.

Capturing Uncertainty in Geomodels – Best Practices and Pitfalls
December 2013 Page 44
NOTES

Capturing Uncertainty in Geomodels – Best Practices and Pitfalls
December 2013 Page 45
Goldeneye: Modelling a Depleted Field for Carbon Capture - How Much Uncertainty is Left?
John Marshall1, Owain Tucker
1, and Cliff Lovelock
2
1Shell International Petroleum Company Projects and Technology;
2Shell UK
The Goldeneye gas field lies in the Moray Firth: it is located in the Captain turbidite fairway and has recently ceased production. It’s situation and dimensions have made is an excellent candidate for CO2 sequestration and it is currently under evaluation for this purpose. The field was extensively modelled for the original development planning and uncertainty was assessed from the perspective of volumetrics and field behaviour. The subsequent need to revisit the field to assess its suitability as a CO2 store has given the opportunity to look back at an uncertainty analysis with the benefit of full field performance, and to perform a new analysis aimed at different uncertainties concerning behaviour during CO2 injection. Both sets of analyses required coupled static dynamic modelling runs in which the key static parameter ranges of the field were varied, including depth conversion, internal geometries, aquifer and fluid properties. For the field development work the parameter ranges were explored to assess recoverable volumes and field behaviour under natural aquifer and depletion drive whilst for the CO2 uncertainty work the parameter ranges were explored to demonstrate storage capacity, injectivity and CO2 containment. The lookback to the production planning work showed that the field volumes indicated by production data landed in the middle of the uncertainty range but the original base case scenario could not be history matched against performance without modification. The production data also showed that certain parameter ranges could be reduced for the CO2 work: for example, the field had produced more than the low end of the original recovery volume range. Even at this stage, however, there still remained a significant range of uncertainty. The critical issues addressed for the CO2 work required assessment of uncertainty upsides, thus:
Goldeneye can store more CO2 within the storage area than is planned for injection
(storage margin)
Goldeneye can take higher pressures and injection rates than planned (injection
margin)
Ideally, a case may not reasonably be constructed where the CO2 escapes to an
unwanted area (containment margin).
The results indicated that there is some 50% spare capacity in the field relative to the planned injection volume. The only way to allow CO2 to migrate beyond the spill point of the field was found to be a scenario where CO2 was artificially injected at the spill point – not a reasonable case for a real project.

Capturing Uncertainty in Geomodels – Best Practices and Pitfalls
December 2013 Page 46
NOTES

Capturing Uncertainty in Geomodels – Best Practices and Pitfalls
December 2013 Page 47
Volumetric & Dynamic Uncertainty Modelling in Block 22, Trinidad & Tobago R. Kimber
1, A. Uwaga
1, P. Diamond
2, M. Curtis
1, F. Boundy
3
1 Centrica Energy Upstream,Millstream West, Maidenhead Road,Windsor SL4 5GD, England
2 Present address:
Prescience Consulting Limited, Jervis Cottage, Aston Street, Aston Tirrold, Didcot,
Oxfordshire, OX11 9DJ, England 3
Present Address:
Nexen Petroleum UK Limited, Uxbridge, Middlesex, UB8 1JG England
Block 22 is located in the North Coast Marine Area just north of Tobago and contains the Cassra discovery. Cassra was tested by the Cassra-1 and Cassra-2 wells which both encountered dry gas in early Pliocene sandstone reservoirs similar to the NCMA-1 producing fields located 80 km to the WSW. A subsurface evaluation of Cassra and other satellite prospects was initiated in support of a pre-development project. This included both static geological modelling and reservoir simulation to capture appropriate ranges of GIIP (Gas Initially In Place) and recoverable resources. Given the limited well control within the project area, the study needed to capture the key geological and production properties interpreted for the Block 22 gas discoveries. An ‘Uncertainty Workflow’ approach was taken to quantify the impact of both the static and dynamic uncertainties. The modelling had three main objectives:
1. Generate a range of models to honour key geological and dynamic uncertainties 2. Capture an appropriate range of GIIP 3. Undertake reservoir simulation studies to derive an appropriate range of production
profiles The early Pliocene shallow marine reservoirs in Block 22 represent the sand-prone deposits of progradational shoreline to inner shelf sequences within a dominantly outer shelf mudstone succession. Detailed seismic interpretation has resulted in a subsurface model of this sequential progradation and gross reservoir distribution. However, considerable uncertainty remains in the understanding across the full suite of geological and petrophysical parameters impacting both GRV (Gross Rock Volume) and NRV/NPV (Net Rock- and Net-Pore Volume) estimation. Static geological uncertainties were modelled using an Uncertainty Workflow methodology in Petrel, resulting in multiple static model realisations and probabilistic GIIP distributions for both Cassra and outlying satellite prospects. From these realisations, an appropriate range of cases were selected for reservoir simulation, ranked using a combination of GIIP and GRV. In addition to modelling the static uncertainties a separate dynamic uncertainty study was undertaken to examine the impact of key properties such as horizontal/vertical permeability, well productivity, drawdown limits and tubing/flowline size, on recoverable resources and production profile predictions. The static and dynamic modelling studies are considered suitable for pre-development project planning and capture an appropriate uncertainty in the production profiles for a Block 22 development.
Comparing the different examples of Early Aptian Lithocodium-Bacinella growth studied in various depositional settings of the Oman Platform, it seems appropriate to postulate a palaeoenvironmental control on the various observed geometries of Lithocodium-Bacinella geobodies and morphotypes. Possible drivers that may have influenced Lithocodium-Bacinella growth over the study area are discussed; specifically against the background of a coeval period of world-wide palaeo-oceanographic turn-over (Oceanic Anoxic Event 1a, “Selli level”).

Capturing Uncertainty in Geomodels – Best Practices and Pitfalls
December 2013 Page 48
From an applied point of view, the developed qualitative model for Lithocodium-Bacinella growth geometries allows for providing more realistic input data for reservoir modelling. On the science side, the presented results advance the understanding on how carbonate factories in Early Aptian central and southern Tethys epeiric seas reacted to global changes that probably also induced Oceanic Anoxic Event 1a. Finally, the wide range of observational dimensions documented here (km to cm scale) highlights the perhaps underestimated problem of scale bias in purely outcrop-based or core-based studies.

Capturing Uncertainty in Geomodels – Best Practices and Pitfalls
December 2013 Page 49
NOTES
Capturing Uncertainty in Geomodels – Best Practices and Pitfalls
December 2013 Page 50
Keynote Speaker: Structural Uncertainty – Real or Caused By Flaws in Analysis and Modelling? Christian Höcker,
Independent geoscience advisor, consulting with Nexen Petroleum U.K. and Baker
Hughes
Of all subsurface uncertainties, structural or depth uncertainty is probably the one that has the longest track record of applying stochastic methods to model uncertainty and subsequently derive statistics of a dependent parameter, GRV, that directly impacts decisions on subsurface assets. The long history, however, does not mean that the subject of predicting depth from travel-time based observations and estimating its uncertainty is characterised by broad understanding, mature methods and errors that are close to irreducible. Visiting the subtopics of horizon picking, velocity modelling, and geometrical model building with their most prominent intricacies and pitfalls we will take stock of current working practice, based on observations with a range of North Sea assets and operators. It transpires among others that effect of horizon picking uncertainty is frequently miscalculated because modelling techniques do not do justice to the patch-like distribution of errors. Velocity models are often overly complex or contain velocity definitions that are in conflict with rock physics and geological trends. When estimating velocity uncertainty, the effect of true velocity variations is commingled with that of various depthing and positioning steps, leading to an overestimate of velocity-related depth errors. The issue gets more convoluted if wells are planned on geo-models rather than on the underlying information, as common modelling technology cannot cope with actual structural complexities. The poor record of improving depth prognosis cannot be understood without looking at organisational issues. The subject of depth estimation and depth uncertainty involves understanding of the seismic method, of rock physics, geological concepts and statistics. Corporations struggle in managing niche tasks, in particular if they involve integrating information from a range of disciplines. Once the issue is understood the best recipe for improving performance is to set up an in-house specialist service.

Capturing Uncertainty in Geomodels – Best Practices and Pitfalls
December 2013 Page 51
NOTES

Capturing Uncertainty in Geomodels – Best Practices and Pitfalls
December 2013 Page 52
Automation and Anchoring: Challenges for Managing Fault-Horizon Framework Uncertainty in Geomodels
Kathryn Hardacre and Viki Wood, Shell Global Solutions International BV
Structural uncertainties (like top reservoir depth, reservoir thickness and the geometry of block-defining faults) drive the gross rock volume range estimates of many hydrocarbon accumulations. They can have consequences for the estimated range of hydrocarbons in-place beyond GRV. For example, if a reservoir has a strong compactional porosity versus depth trend, flexing the top structure up or down will affect the average porosity. The average saturation can also be affected by structural uncertainty: reducing the dip of the structure increases the fraction of the reservoir in the transition zone, most dramatically in tight reservoirs with short columns. When we consider fluid flow, how we model fault geometries and cross-fault juxtapositions can significantly alter our estimate of a reservoir’s ultimate recoverable volume. Industry-standard geomodelling tools generally have automated methods for handling top structure depth and isochore thickness uncertainty. By contrast, cascading uncertainty in the seismic image into multiple, plausible fault-horizon frameworks is generally a hands-on, labourious task. The resulting risk is that modelers focus not on the critical uncertainty, but the easy-to-implement uncertainty. Using the Ocean technology in Petrel, Shell has created a number of tools that allow geologists to investigate fault framework uncertainty in a semi-automated way at an early stage in the modeling process. This prevents anchoring on a single deterministic structural scenario.

Capturing Uncertainty in Geomodels – Best Practices and Pitfalls
December 2013 Page 53
NOTES

Capturing Uncertainty in Geomodels – Best Practices and Pitfalls
December 2013 Page 54
Stochastic Approach to Manage Uncertainties Related to Relay Zone Modeling Charline Julio
1, Guillaume Caumon
1, Mary Ford
2
1 Géoressources (UMR 7359), Université de Lorraine-ENSG / CNRS / CREGU, Vandœuvre-lès-Nancy,
F-54518, France 2 CRPG (UMR 7358), Université de Lorraine-ENSG / CNRS, Vandœuvre-lès-Nancy, F-54500, France
Since the 1960s, seismic surveys have greatly enhanced our understanding of the subsurface. Nowadays the majority of hydrocarbon fields are imaged in 3D. The seismic cube has become the main source of information for structural modeling. However, despite recent improvements in seismic acquisition and processing, the occurrence of fluids, of damage zones, and possibly of salt in the overburden, introduces imaging problems and uncertainties in fault network interpretation. In extensional contexts, the relay zones are typical structures which may have a significant impact on fluid flow by controlling connections between two fault blocks. They are also complex structures difficult to characterize on seismic data because of resolution or noise effects that could lead to a misinterpretation of overlapping segments as one single fault. In this paper, we present a stochastic method to downscale a fault interpreted and modeled as one continuous fault into soft-linked or hard-linked segments. The method is composed of three main steps: (1) fault segment identification, (2) fault segment modeling, and (3) likely breaching of overlap zones. The fault segment identification uses geometrical and displacement criteria to identify overlapping segments composing a fault of interest (denoted F). From a numerical point of view, the fault F is a triangulated surface conditioned by fault sticks (i.e. fault occurrences on seismic images). The geometry of F is interpolated between conditioning data and especially in zones where the seismic images are too blurred for a precise identification of fault position. We assume that a large domain of anomalous fault orientation is an indicator of a relay ramp, while small domains are related to geometry interpolation effects. The presented downscaling algorithm is based on the identification of relatively-planar fault zones oriented in the main expected direction of the fault relay structures. Then, the displacement field observed along the fault surface is used to provide information on the desired segment size and number. The occurrence of several local displacement maxima along the fault F may be related to the linkage of several segments. The fault segment identification splits the fault F into several subsets, each one characterizing an overlapping segment. The fault segment modeling consists in modeling the segment associated with each subset. The segments have elliptical shape which is often considered in the case of an isolated fault. The relative segment position is determined by the relative position of the subset barycentres. The segment sizes are function of the distances between barycentres. The width of the overlap zones between two segments is proportional to the mean segment length. The likely breaching step consists in estimating the linkage maturity of simulated overlap zones from the ratio between the overlap zone length and the width between the two segments. If the ratio is superior to a given random threshold, the overlap zone is breached and a secondary fault is modeled connecting the two segments of interest. The downscaling steps depend on parameters which can be defined constant or randomly chosen from probability distributions. In total, eight parameters condition the downscaling simulation and therefore handle uncertainty related to coalescent structure geometry. They have to be carefully chosen in accordance with the geological knowledge of the studied zone. The stochastic downscaling simulation results in modeling of fault relay structures with different geometries which vary in segment number, in relative segment position and in linkage maturity. The study of the fluid flow responses allows us to classify the geometries according to their effect on flow behavior. The most relevant geometry pattern could be identified by comparing their behavior to dynamic field data. The main perspective of this paper is to include

Capturing Uncertainty in Geomodels – Best Practices and Pitfalls
December 2013 Page 55
downscaling parameters in a history matching workflow and determining geometry characteristics which better fit data behavior. Acknowledgements This works has been performed in the frame of the Gocad research project. We thank the industry and academic members of the Gocad Research Consortium for supporting this research. We also thank Paradigm for the Gocad-SKUA software and API.

Capturing Uncertainty in Geomodels – Best Practices and Pitfalls
December 2013 Page 56
NOTES

Capturing Uncertainty in Geomodels – Best Practices and Pitfalls
December 2013 Page 57
Uncertainty Modelling In the Maclure Field, a Statistical Approach to Complex Injectite Systems Richard Todd and Duncan Chedburn, Maersk
The Maclure field lies in Block 9/19 in the Central North Sea. The reservoirs in Quad 9 comprise high quality sand in the Eocene Balder formation deposited in a series of stacked turbidite lobes sourced from the Dornoch shelf to the west. Much of these sands underwent subsequent remobilisation and injection later in the Eocene. Until 2003 most activity in the Quad 9 area involved drilling into the deposited remobilised sand systems. Since then the focus has been switched into accessing volume in the injection wings. Modelling of these systems is more challenging due to the fact that the sands do not follow predictable patterns and exist on several levels of scale (from log scale to seismic). This presentation will focus on the modelling approach taken to handle the uncertainties associated with this play concept. It will show the results of a statistical approach in which several seismic attributes have been used to extract multiple geobodies. These attributed have been compared to well data and a series of the best extractions have been carried forward into a dynamic uncertainty simulation study. The seismic extractions have been further weighed against production history, with the best matches used as a series of base cases to generate a range of predicted reserves for infill wells in Maclure.

Capturing Uncertainty in Geomodels – Best Practices and Pitfalls
December 2013 Page 58
NOTES

Capturing Uncertainty in Geomodels – Best Practices and Pitfalls
December 2013 Page 59
A Geologically Consistent and Rapid Workflow Bridging From Discrete Fracture Networks to Geo-Cellular Grids A. Jung¹, D. Fenwick², J. Caers¹ ¹ Department of Energy Resources Engineering, Stanford University, USA ² Streamsim Technologies, USA
The geological characterization of naturally fractured reservoirs can be subject to a significant degree of uncertainty, notably in the multiple interpretations of depositional scenarios and stress history resulting in different fracture networks. Rapid, accurate quantification of the uncertainty in fractured reservoirs is crucial for making good decisions on potentially costly development or clean-up plans. While accuracy in geological modelling is desirable, in practice uncertainty modelling based on conventional flow simulators is considerably disconnected from the geological modelling of naturally fractured reservoirs. On the one hand, discrete fracture network (DFN) models provide a geologically consistent way of modelling fractures in reservoirs. On the other hand, flow simulation of such DFN models is currently infeasible at the field scale, and thus requires a difficult and time-consuming upscaling to an effective dual-media continuum model used for flow simulation. To bridge the gap between DFN and dual-media models, we propose a geostatistical approach based on patterns that translates DFN models to dualmedia descriptions efficiently and fast, while maintaining the important flow properties of the DFN models.The first step in the approach is to employ experimental design to capture the uncertainties in the fracture descriptions and generate DFN models. The DFN models are then upscaled to equivalent dual-medium models.
The patterns of dual-media grid cells derived from each model are reduced to a manageable set of scenarios through the use of clustering techniques, and used as training images for multiple-point statistics (MPS). The reduction of a large number of fracture scenarios to a manageable set of training images reduces redundancy while preserving the full extent of uncertainty present in the geological descriptions. Once the set of training images is obtained, they allow for fast generation of dual-porosity descriptions with MPS directly – while circumventing the time-consuming process of DFN modelling and upscaling. These training images can then be used to generate earth models of fractured reservoirs for uncertainty quantification and history matching. To identify scenarios – represented through training images – inconsistent with production data, we apply statistical techniques to estimate the posterior probability of each fracture scenario instantly. Fracture scenarios with low probabilities can be eliminated from history matching and prediction. The likelihood of the remaining scenarios is updated according to Bayes’ rule. Thereby we can demonstrate a rapid geomodelling and uncertainty workflow which we will illustrate on a synthetic model derived from a Middle Eastern fractured reservoir.

Capturing Uncertainty in Geomodels – Best Practices and Pitfalls
December 2013 Page 60
NOTES

Capturing Uncertainty in Geomodels – Best Practices and Pitfalls
December 2013 Page 61
Data Constraints on Reservoir Concepts and Model Design Tim Wynn & Ed Stephens, AGR-TRACS
All good models must honour the data but do all good models have to be limited by the data? The well-worn phrase “it depends” is relevant here depending on how well the data has sampled the true ranges of parameters and how well the data and interpretations have been integrated. In one case presented here, the geological concept based on well logs, seismic and core data indicated a highly anisotropic heterogeneous fracture system. However, the interpreted results of vertical well tests led to a concept of a compartmentalised reservoir with low level, isotropic fracture permeability enhancement. These well test results drove the subsequent field development plan. A later study indicated that the well test results could also be matched to an anisotropic fault related fracture system scenario. The actual development drilling results showed the reality was somewhere in-between. Mud losses during drilling indicated a highly conductive fault related fracture network with field-wide pressure communication. Hydrocarbon production history matching indicated some fault baffling was required to get an optimal match. This uncertainty in the validity of a sampled data range goes beyond integrating interpretations of existing data or adding or subtracting a ‘bit more’ to a sampled range. This is because the missing data could include the omission of entire geological units or geological features like conductive faults. So how do we define concepts and design models if we suspect we have some unknown unknowns? This is where geoscientists get creative, reservoir engineers get sceptical and facilities engineers are downright terrified. We need to invoke plausible concepts based on regional information (The CDA data shows a lot of Jurassic sand in this area), nearby analogue fields (Company X has a field like this one and they found this…) or simple geological logic (What other reservoir units could exist between the Base Cretaceous and Top Carboniferous?). Once we have defined a robust, realistic and unbiased group of concepts and parameter ranges, they need to be incorporated into an unbiased modelling process. Chellingsworth and Kane describe one approach using an expectation curve process. Another method to define unbiased model outputs is Experimental Design. This uses a matrix of parameters combined in optimal ways to allow efficient sampling of parameter space and the generation of representative models. Multivariate regression on the parameter values with respect to some output variable (e.g. STOIIP or reserves) then allows a simple but realistic relationship to define the link between parameter variation and output in a probabilistic simulation. Several cases have been reviewed where a best technical case is used with symmetrically distributed sensitivities to define parameter ranges that are then put into Experimental Design. However, this approach will yield a P50 estimate that is close to the case first thought of. This is often taken as independent confirmation of the best technical case whereas in reality it is an example of a biased assessment of uncertainty. If an unbiased definition of parameter ranges and concepts has been defined these can be used directly to define the low mid high or P90-P50-P10 models as outputs rather than as inputs.

Capturing Uncertainty in Geomodels – Best Practices and Pitfalls
December 2013 Page 62
NOTES

Capturing Uncertainty in Geomodels – Best Practices and Pitfalls
December 2013 Page 63
Poster Presentation Abstracts

Capturing Uncertainty in Geomodels – Best Practices and Pitfalls
December 2013 Page 64
Defining Uncertainty & Modelling of Thin-bed pay using an integrated approach in a JV partnership; including an example. Bhagaban Das
1 and Douglas Dickey
2
1Reliance Industries
2BP India
Introduction: Working in a JV always provides opportunities to capture the best from each partner and optimize an integrated process. We have a significant data set and have developed an integrated process to capture geologic content. At a high level we have developed a workflow to identify key uncertainties, define the range of properties, and use geologic concepts to distribute the properties in our models. A comprehensive and integrated workflow focuses on a range of activity to construct static and dynamic reservoir models through simultaneous and stochastic inversion techniques. Finally the use of appropriate analogues helped guide the modelling and especially the distribution of properties. These analogues with benchmarking and sensible property ranges were key to creating the range of applicable models that fully captured the subsurface uncertainties, volumetric range and potential development scenarios. We periodically revisit the key uncertainties, check ranges, and incorporate any geological and stratigraphic updates and improvements. An example of one of our key geomodeling uncertainties and how it has been managed through an integrated workflow is discussed here. Modelling of thin-bedded to laminated shaly-sand pays, often with individual bed thickness less than the log resolution, are a major challenge in most of JV operated deep-water fields in Krishna Godavari basin, as this pay constitutes a significant part of the estimated resources. Modelling spatial distribution of this pay is a key uncertainty with several constraints such as (i) scale of seismic data resolution, (ii) sparse well control and (iii) resolution of the geomodeling process. Integration of various scales of data (core, log and seismic) is necessary for capturing the spatial distribution of thin beds/laminations, but is limited by tool resolution, poor calibration between different data sets and non-unique integration approaches. In our endeavour to generate numeric models that are consistent with geo-scientific interpretation, available data and capture appropriate uncertainty, we customised some of our workflows and used multiple tools and processes for capturing appropriate model content. The workflow and the processes are discussed below. Workflow and Processes Example: The deep water sediments of channel-complex reservoirs of a Tertiary deep water gas field in the Krishna-Godavari basin consist of different facies ranging from amalgamated clean channel sands with a high net to gross to thin-bedded levee /overbank deposits with a lower net-to-gross. A significant proportion of the pay is present in thin bed and laminated sands. Key uncertainties in the reservoir model are the distribution and connectivity of the thin-bedded reservoirs. A comprehensive and integrated workflow was applied for modelling these reservoirs and capturing the uncertainties. The integration of core, calibrated well logs - defined at the centimetre level with the seismic data with a resolution of several metres, was achieved through rock physics modelling. In the rock physics model the high-resolution well data were used to understand the effect of reservoir and fluid properties on seismic measurements in the borehole as well as at the surface. An iterative approach from petrophysical interpretation to the synthetic-to-seismic match resulted in a rock physics model that is consistent with the geological, petrophysical and seismic data. This rock physics model therefore allows the seismic inversion results to be used to characterize and assess the potential of thin-bedded reservoirs. Combining this with appropriate analogues and bench mark data base case, high and low case models can be envisioned. Geo-statistical processes were applied to integrate the rock physics based seismic facies from inverted data and the core calibrated log facies to

Capturing Uncertainty in Geomodels – Best Practices and Pitfalls
December 2013 Page 65
produce multiple realisations of lithology and thus quantify uncertainty. The models were ranked to determine the Base Case realisation that was used for flow simulation and Development planning. Discussion & Results: Reservoir characterization and modeling of thin-bedded sands relies on our ability to properly integrate the different subsurface data at relevant scales. Rock physics modelling and upscaling and downscaling are involved in the workflow. The enhancement of the standard logs, performed to model the individual response of thin sands was achieved through the use of the high-resolution image logs and core. The upscaling of high-resolution logs was performed to create the primary input data for the geostatistical modeling. The geostatistical inversion, which can be viewed as downscaling from seismic to a finer scale, resulted in the generation of multiple realizations of equiprobable thin gas sand distributions. Here the non-uniqueness of the downscaling was addressed by the generation of a high number of simulations. This study resulted in high quality geomodels that captured the spatial distribution of thin bedded laminated pay consistent with available data, geological concepts and defined the uncertainty in the gas-in-place volumes.
Fig.1a. Left: Modeling workflow. Fig.1b: A typical thin-bedded pay interval in the reservoir.
Fig.2a. Cross plot of P- and S-impedance well data at standard ½ ft log resolution. The channel gas sands (red) can be separated from the shales (green) and brine sands (blue) The separation between the thin gas sands (yellow) and the non-pay lithologies is more ambiguous.
Fig.2b, Section through the near angle seismic (upper left), a geostatistical lithology model (upper right), a geostatistical porosity model (lower right) and an upscaled porosity model (lower right). Colors in the lithology model: channel gas sands (red), thin-bedded gas sands (yellow), and shales (green). Brighter colors in the porosity models correspond to cells with higher porosities

Capturing Uncertainty in Geomodels – Best Practices and Pitfalls
December 2013 Page 66
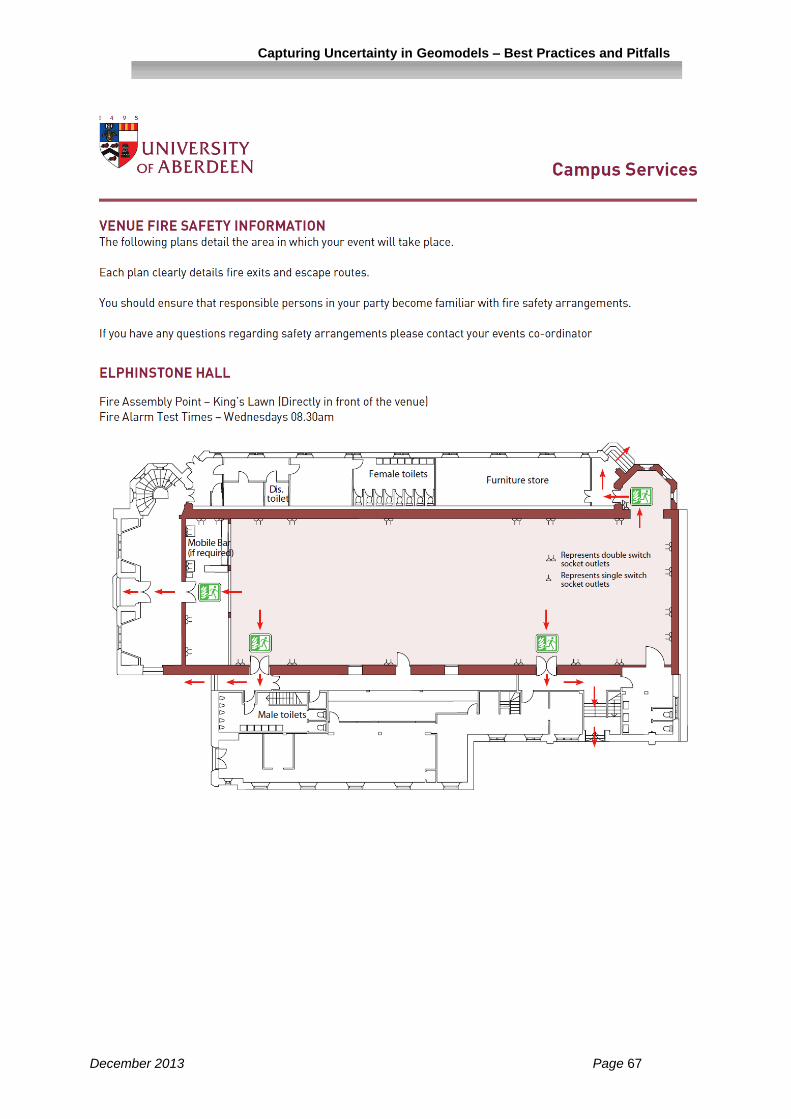
Capturing Uncertainty in Geomodels – Best Practices and Pitfalls
December 2013 Page 67
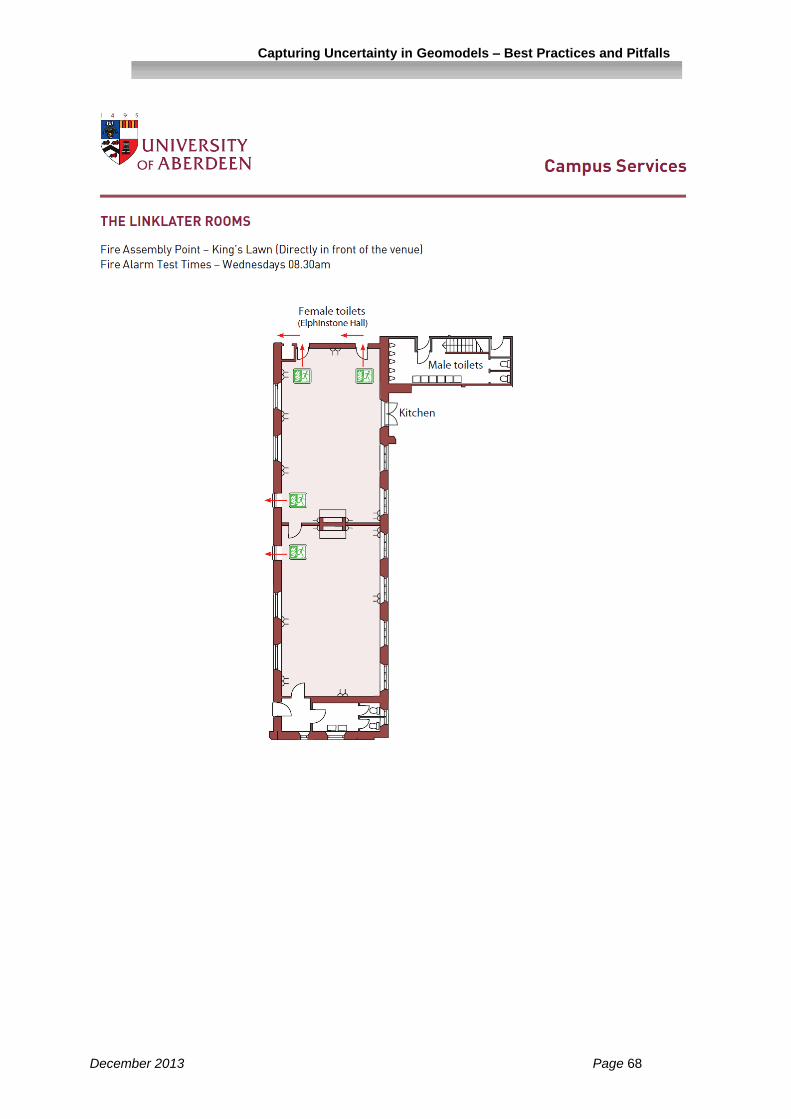
Capturing Uncertainty in Geomodels – Best Practices and Pitfalls
December 2013 Page 68