Embed Size (px)
Citation preview

Capturing the Valueof Your Business
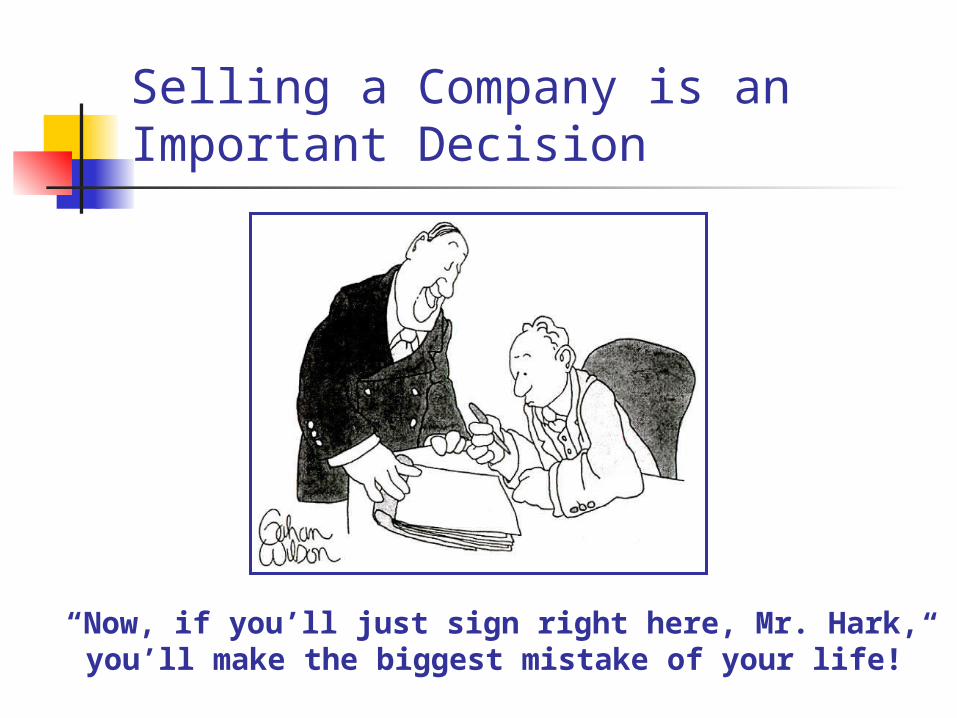
Selling a Company is an Important Decision
“Now, if you’ll just sign right here, Mr. Hark,you’ll make the biggest mistake of your life!”
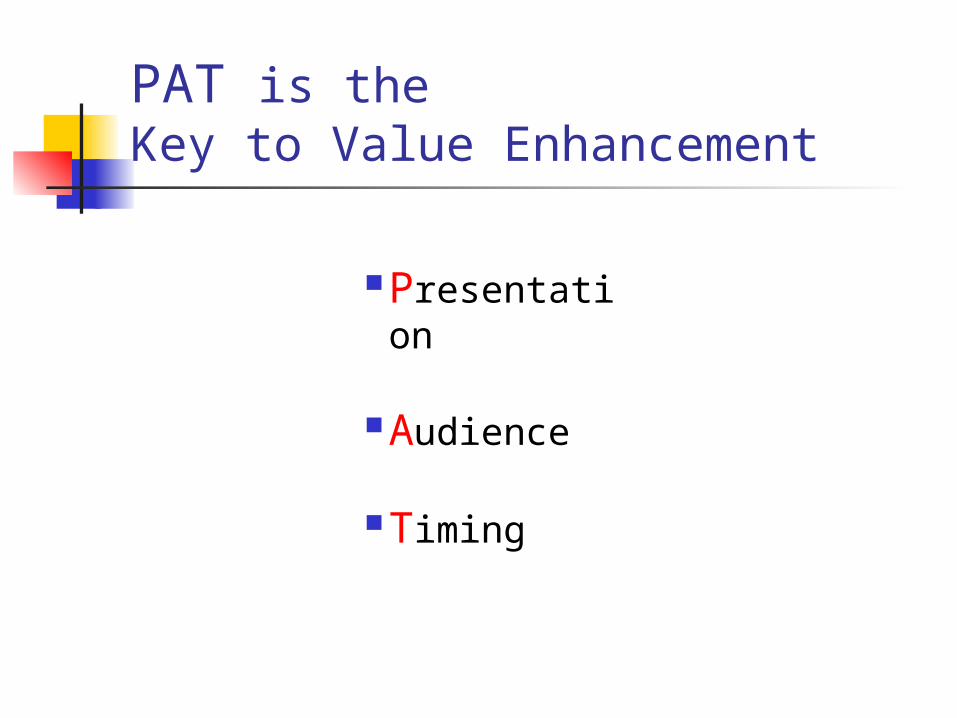
PAT is the Key to Value Enhancement
Presentation
Audience
Timing
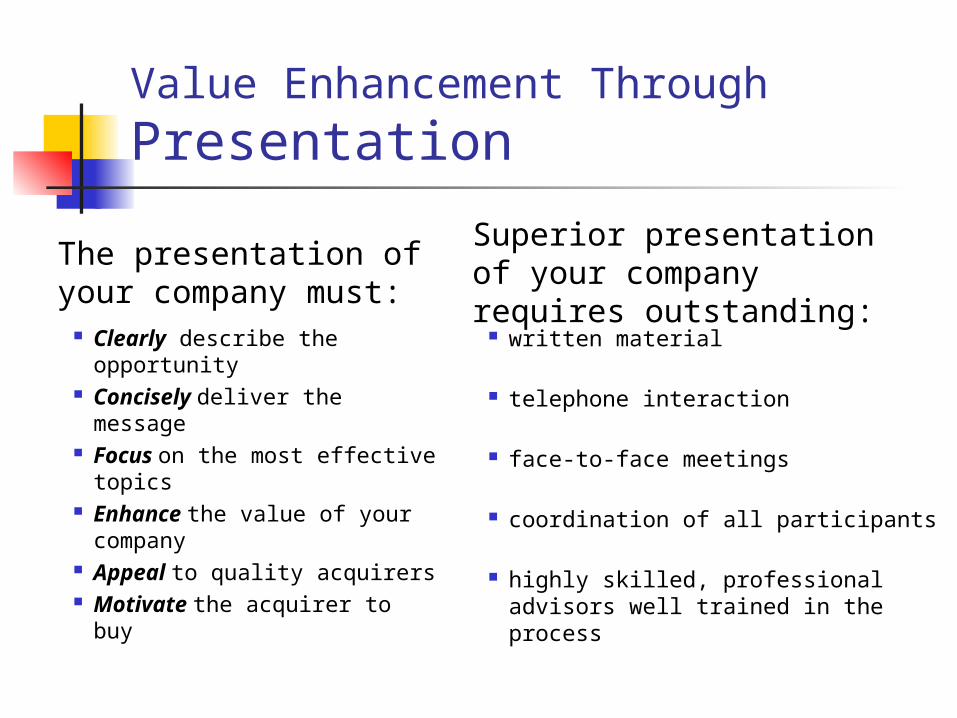
Value Enhancement Through
Presentation
Clearly describe the opportunity
Concisely deliver the message
Focus on the most effective topics
Enhance the value of your company
Appeal to quality acquirers Motivate the acquirer to buy
written material
telephone interaction
face-to-face meetings
coordination of all participants
highly skilled, professional advisors well trained in the process
The presentation of your company must:
Superior presentation of your company requires outstanding:
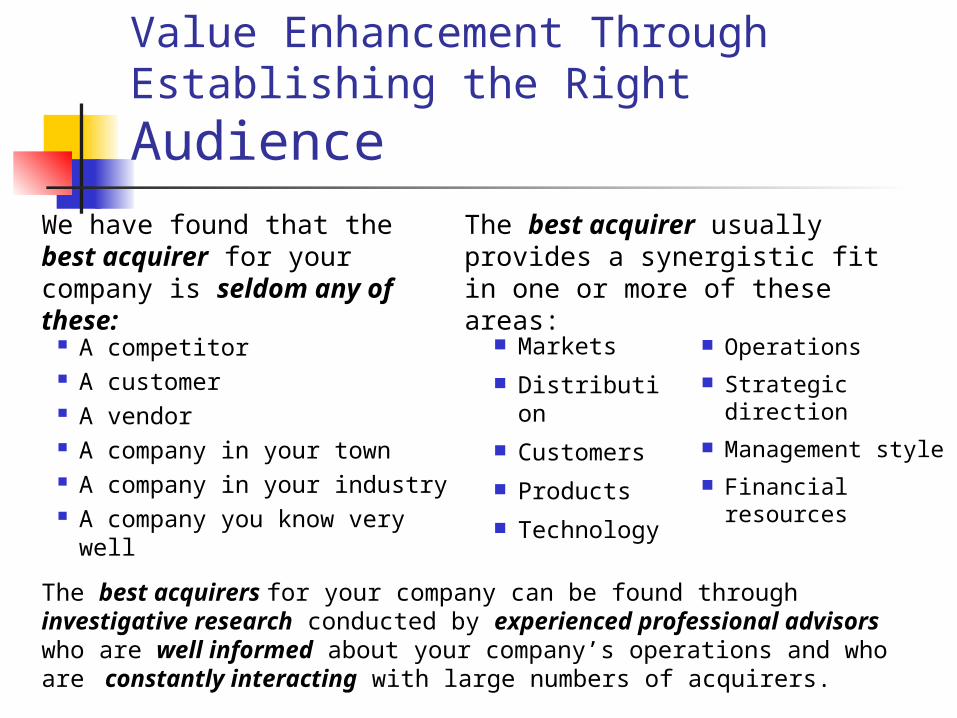
Value Enhancement ThroughEstablishing the Right
Audience
A competitor A customer A vendor A company in your town A company in your industry A company you know very well
Markets Distribution Customers Products Technology
We have found that the best acquirer for your company is seldom any of these:
The best acquirer usually provides a synergistic fit in one or more of these areas:
Operations Strategic direction Management style Financial
resources
The best acquirers for your company can be found through investigative research conducted by experienced professional advisors who are well informed about your company’s operations and who are constantly interacting with large numbers of acquirers.
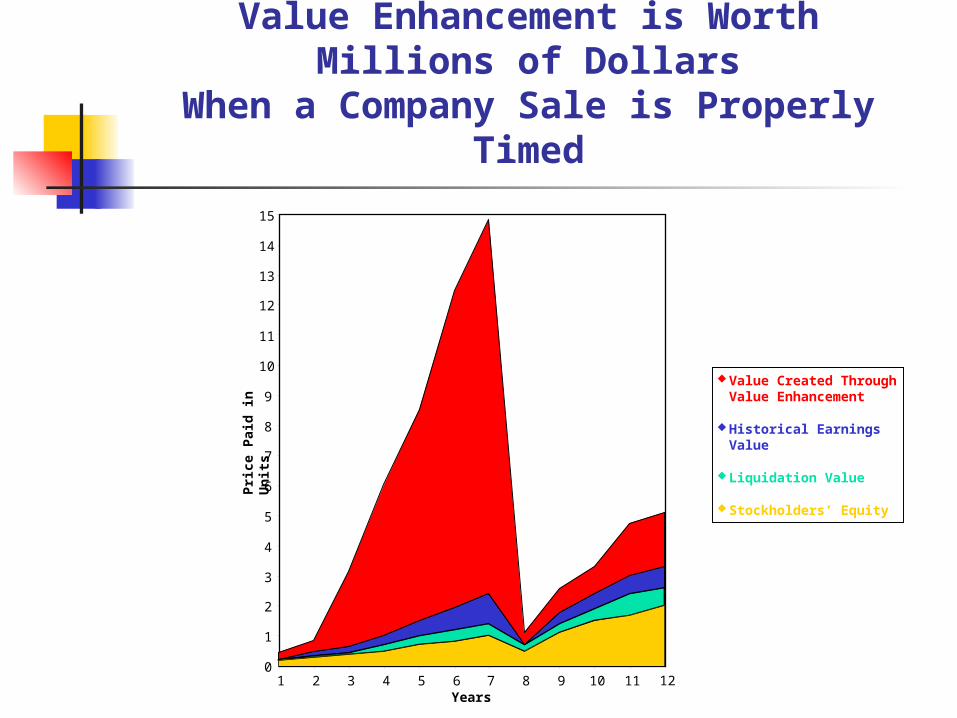
Value Enhancement is WorthMillions of Dollars
When a Company Sale is Properly Timed
0
1
2
3
4
5
6
7
8
9
10
11
12
13
14
15
1 2 3 4 5 6 7 8 9 10 11 12
Pri
ce P
aid
in U
nit
s
Years
Value Created ThroughValue Enhancement
Historical Earnings Value
Liquidation Value
Stockholders’ Equity
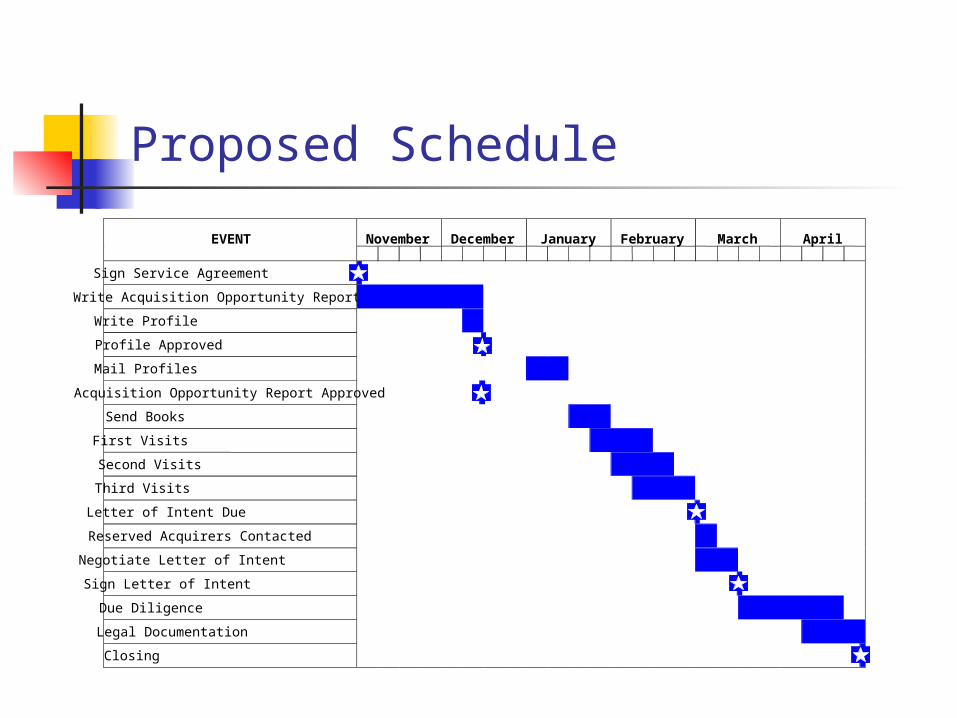
Proposed Schedule
EVENT
November
December
January
February
March
April
Sign Service Agreement
Write Acquisition Opportunity Report
Write Profile
Profile Approved
Mail Profiles
Acquisition Opportunity Report Approved
Send Books
First Visits
Second Visits
Third Visits
Letter of Intent Due
Reserved Acquirers Contacted
Negotiate Letter of Intent
Sign Letter of Intent
Due Diligence
Legal Documentation
Closing
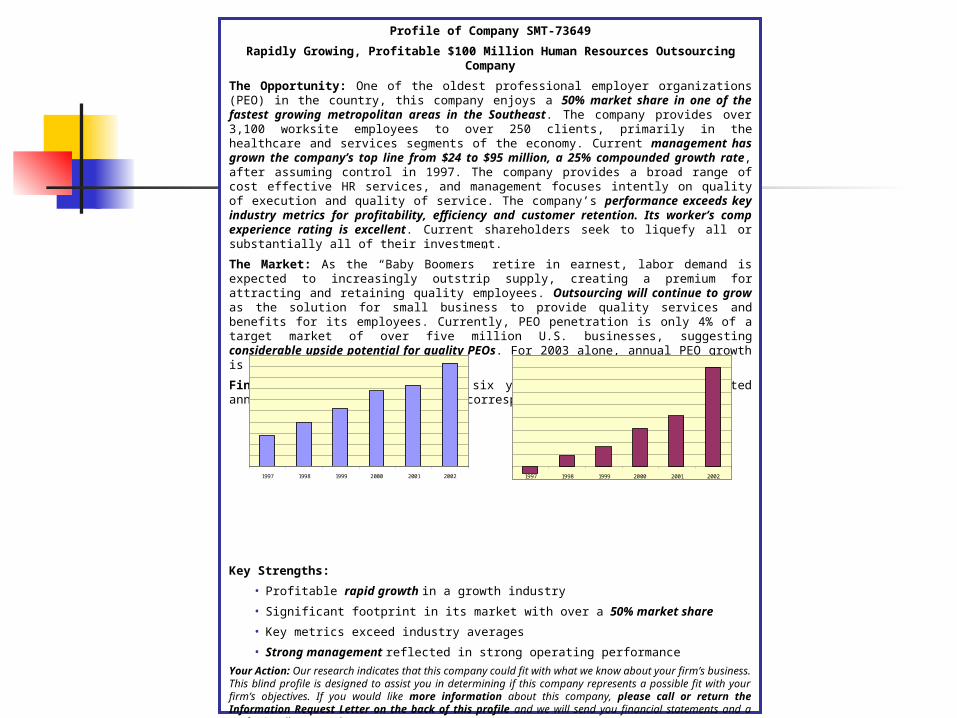
Profile of Company SMT-73649
Rapidly Growing, Profitable $100 Million Human Resources Outsourcing Company
The Opportunity: One of the oldest professional employer organizations (PEO) in the country, this company enjoys a 50% market share in one of the fastest growing metropolitan areas in the Southeast. The company provides over 3,100 worksite employees to over 250 clients, primarily in the healthcare and services segments of the economy. Current management has grown the company’s top line from $24 to $95 million, a 25% compounded growth rate, after assuming control in 1997. The company provides a broad range of cost effective HR services, and management focuses intently on quality of execution and quality of service. The company’s performance exceeds key industry metrics for profitability, efficiency and customer retention. Its worker’s comp experience rating is excellent. Current shareholders seek to liquefy all or substantially all of their investment.
The Market: As the “Baby Boomers” retire in earnest, labor demand is expected to increasingly outstrip supply, creating a premium for attracting and retaining quality employees. Outsourcing will continue to grow as the solution for small business to provide quality services and benefits for its employees. Currently, PEO penetration is only 4% of a target market of over five million U.S. businesses, suggesting considerable upside potential for quality PEOs. For 2003 alone, annual PEO growth is projected to be 25%.
Financial Summary: In the past six years, the company has generated annual revenue growth of 25% and corresponding EBITDA growth of 75%.
Gross Billings EBITDA
Key Strengths:
• Profitable rapid growth in a growth industry
• Significant footprint in its market with over a 50% market share
• Key metrics exceed industry averages
• Strong management reflected in strong operating performance
Your Action: Our research indicates that this company could fit with what we know about your firm’s business. This blind profile is designed to assist you in determining if this company represents a possible fit with your firm’s objectives. If you would like more information about this company, please call or return the Information Request Letter on the back of this profile and we will send you financial statements and a professionally prepared summary.
Note: We are solely compensated by the seller. We are a performance organization with over 25 years of experience closing transactions in a wide variety of industries.
Contact: Tim McMillin or Brad Buttermore 214-638-8280 Profile No. SMT-73649
1997 1998 1999 2000 2001 2002 1997 1998 1999 2000 2001 2002
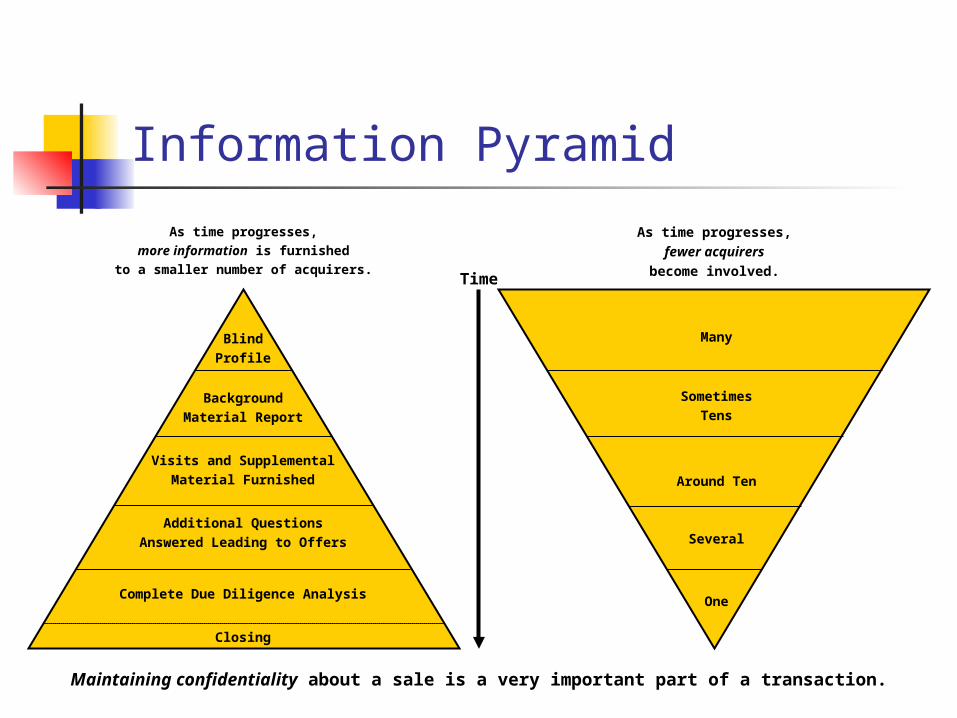
Information Pyramid
As time progresses,
more information is furnished
to a smaller number of acquirers.
As time progresses,
fewer acquirers
become involved.Time
Blind
Profile
Background
Material Report
Visits and Supplemental
Material Furnished
Additional Questions
Answered Leading to Offers
Complete Due Diligence Analysis
Closing
Many
Sometimes
Tens
Around Ten
Several
One
Maintaining confidentiality about a sale is a very important part of a transaction.
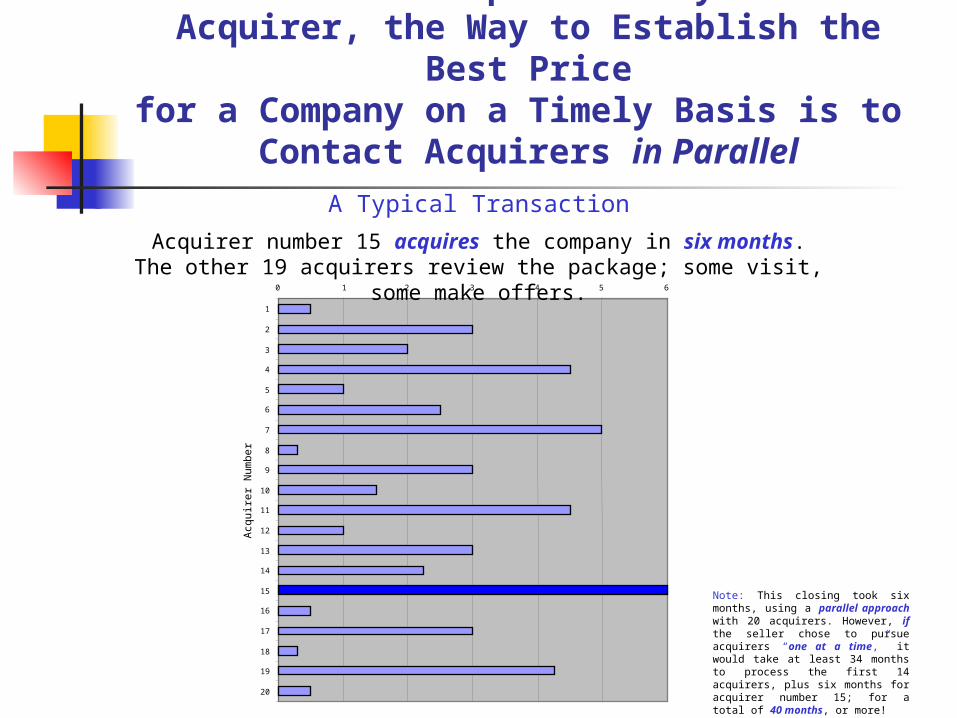
Since Price Perceptions Vary With Each Acquirer, the Way to Establish the Best Price
for a Company on a Timely Basis is to Contact Acquirers in Parallel
0 1 2 3 4 5 6
1
2
3
4
5
6
7
8
9
10
11
12
13
14
15
16
17
18
19
20
A Typical Transaction
Acquirer number 15 acquires the company in six months.The other 19 acquirers review the package; some visit, some make offers.
Note: This closing took six months, using a parallel approach with 20 acquirers. However, if the seller chose to pursue acquirers “one at a time,” it would take at least 34 months to process the first 14 acquirers, plus six months for acquirer number 15; for a total of 40 months, or more!
Acq
uire
r N
umbe
r
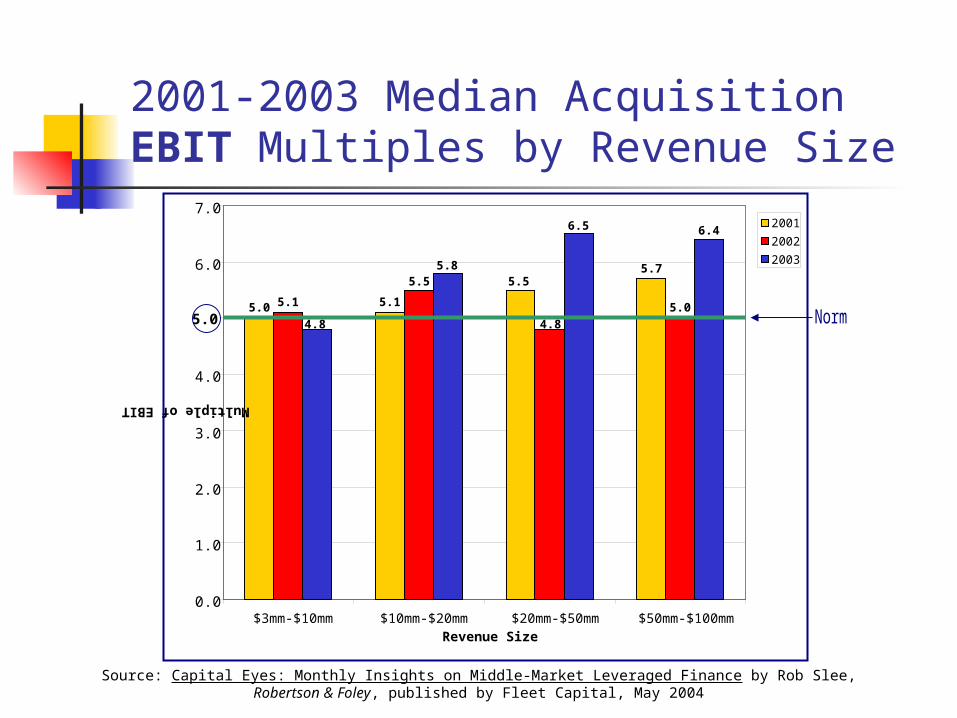
2001-2003 Median Acquisition EBIT Multiples by Revenue Size
5.1
5.7
5.1 5.05.0
5.55.5
4.8
6.5 6.4
5.8
4.8
0.0
1.0
2.0
3.0
4.0
5.0
6.0
7.0
$3mm-$10mm $10mm-$20mm $20mm-$50mm $50mm-$100mmRevenue Size
Multiple of EBIT
2001
2002
2003
Source: Capital Eyes: Monthly Insights on Middle-Market Leveraged Finance by Rob Slee,Robertson & Foley, published by Fleet Capital, May 2004
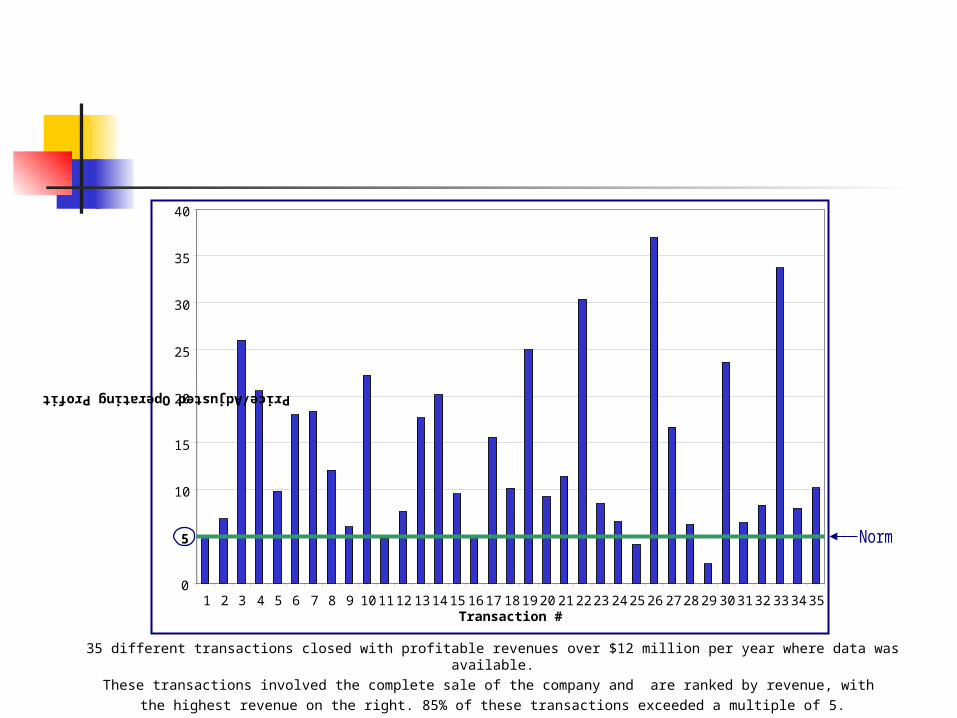
35 different transactions closed with profitable revenues over $12 million per year where data was available.
These transactions involved the complete sale of the company and are ranked by revenue, with
the highest revenue on the right. 85% of these transactions exceeded a multiple of 5.
0
5
10
15
20
25
30
35
40
1 2 3 4 5 6 7 8 9 10 11 12 13 14 15 16 17 18 19 20 21 22 23 24 25 26 27 28 29 30 31 32 33 34 35
Price/Adjusted Operating Profit
Transaction #
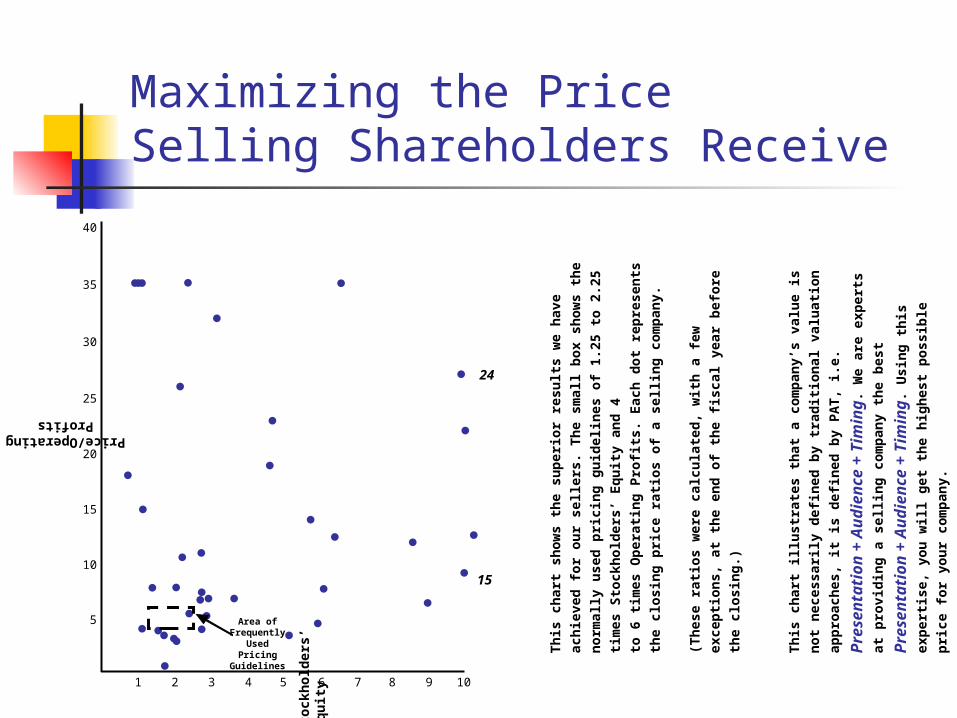
Maximizing the Price Selling Shareholders Receive
Area of Frequently
Used Pricing Guidelines
40
30
35
25
20
15
10
5
1 2 3 4 5 6 7 8 9 10
24
15
Price/Operating Profits
Th
is c
har
t sh
ow
s th
e su
per
ior
resu
lts
we
hav
e ac
hie
ved
fo
r
ou
r se
llers
. Th
e sm
all b
ox
sho
ws
the
no
rmal
ly u
sed
pri
cin
g
gu
idel
ines
of
1.25
to
2.2
5 ti
mes
Sto
ckh
old
ers’
Eq
uit
y an
d 4
to 6
tim
es O
per
atin
g P
rofi
ts. E
ach
do
t re
pre
sen
ts t
he
clo
sin
g
pri
ce r
atio
s o
f a
selli
ng
co
mp
any.
(Th
ese
rati
os
wer
e ca
lcu
late
d, w
ith
a f
ew e
xcep
tio
ns,
at
the
end
of
the
fisc
al y
ear
bef
ore
th
e cl
osi
ng
.)
Th
is c
har
t ill
ust
rate
s th
at a
co
mp
any’
s va
lue
is n
ot
nec
essa
rily
def
ined
by
trad
itio
nal
val
uat
ion
ap
pro
ach
es, i
t is
def
ined
by
PA
T, i
.e. P
res
en
tati
on
+ A
ud
ien
ce
+ T
imin
g. W
e ar
e
exp
erts
at
pro
vid
ing
a s
ellin
g c
om
pan
y th
e b
est
Pre
se
nta
tio
n +
Au
die
nc
e +
Tim
ing
. Usi
ng
th
is e
xper
tise
,
you
will
get
th
e h
igh
est
po
ssib
le p
rice
fo
r yo
ur
com
pan
y.
Pri
ce/S
tock
ho
lder
s’ E
qu
ity
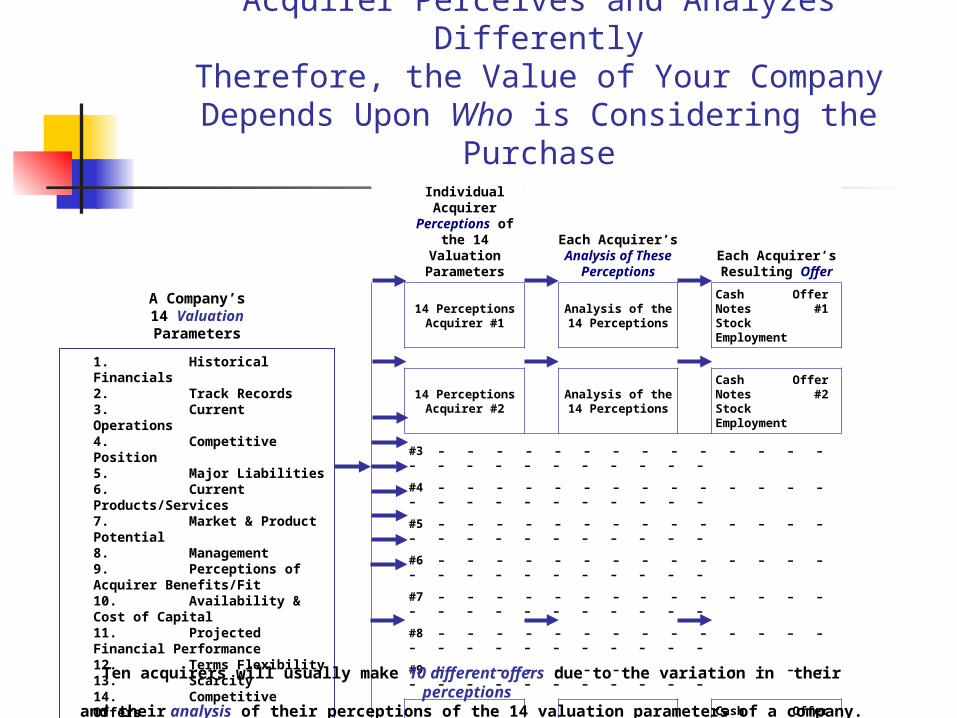
Offers Vary Because EachAcquirer Perceives and Analyzes Differently
Therefore, the Value of Your CompanyDepends Upon Who is Considering the Purchase
Individual Acquirer
Perceptions of the 14
Valuation Parameters
Each Acquirer’s Analysis of
These Perceptions
Each Acquirer’sResulting Offer
14 PerceptionsAcquirer #1
Analysis of the14 Perceptions
Cash OfferNotes #1StockEmployment
14 PerceptionsAcquirer #2
Analysis of the14 Perceptions
Cash OfferNotes #2StockEmployment
#3 – – – – – – – – – – – – – – – – – – – – – – – – –
#4 – – – – – – – – – – – – – – – – – – – – – – – – –
#5 – – – – – – – – – – – – – – – – – – – – – – – – –
#6 – – – – – – – – – – – – – – – – – – – – – – – – –
#7 – – – – – – – – – – – – – – – – – – – – – – – – –
#8 – – – – – – – – – – – – – – – – – – – – – – – – –
#9 – – – – – – – – – – – – – – – – – – – – – – – – –
14 PerceptionsAcquirer #10
Analysis of the14 Perceptions
Cash OfferNotes #10StockEmployment
1.Historical Financials2.Track Records3.Current Operations4.Competitive Position5.Major Liabilities6.Current Products/Services7.Market & Product Potential8.Management9.Perceptions of Acquirer Benefits/Fit10. Availability & Cost of Capital11. Projected Financial Performance12. Terms Flexibility13. Scarcity14. Competitive Offers
A Company’s14 ValuationParameters
Ten acquirers will usually make 10 different offers due to the variation in their perceptions and their analysis of their perceptions of the 14 valuation parameters of a company.
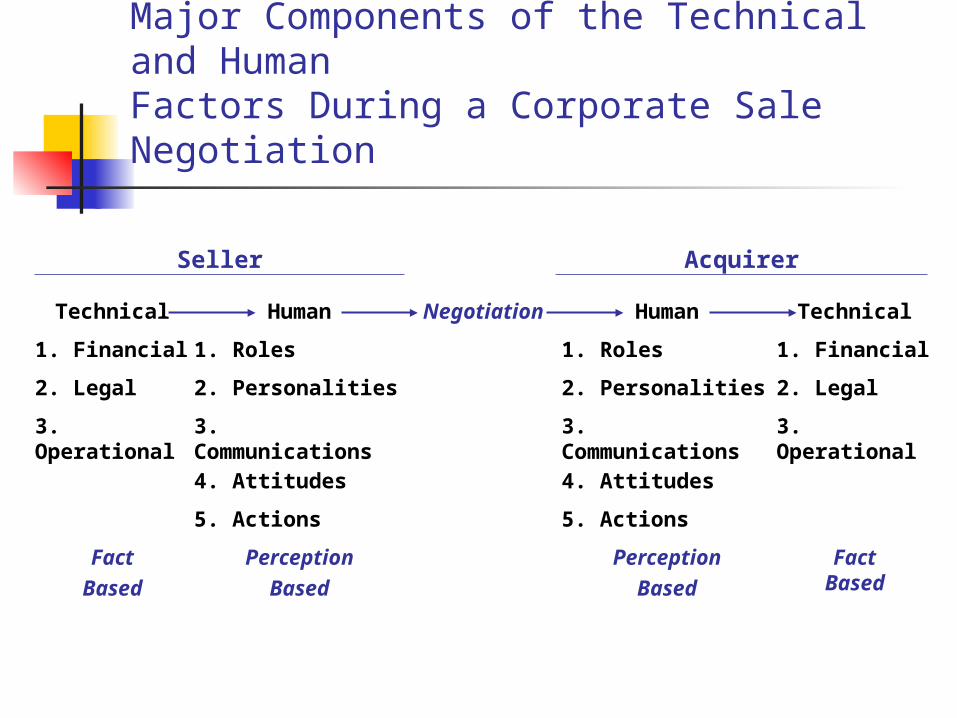
Major Components of the Technical and HumanFactors During a Corporate Sale Negotiation
Technical Human Negotiation Human Technical
1. Financial 1. Roles 1. Roles 1. Financial
2. Legal 2. Personalities 2. Personalities 2. Legal
3. Operational 3. Communications 3. Communications 3. Operational
4. Attitudes 4. Attitudes
5. Actions 5. Actions
Fact
Based
Perception
Based
Perception
Based
FactBased
Seller Acquirer
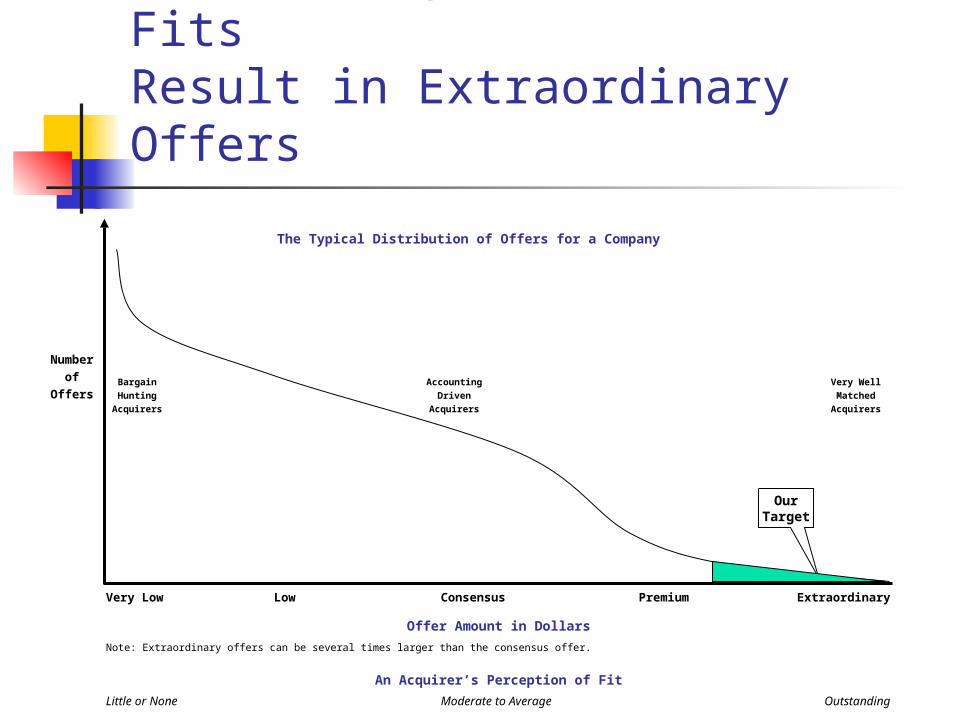
Outstanding Operational FitsResult in Extraordinary Offers
OurTarget
The Typical Distribution of Offers for a Company
Very Low Low Consensus Premium Extraordinary
Number
of
Offers
Note: Extraordinary offers can be several times larger than the consensus offer.
Offer Amount in Dollars
An Acquirer’s Perception of Fit
Little or None Moderate to Average Outstanding
Bargain Accounting Very Well
Hunting Driven Matched
Acquirers Acquirers Acquirers
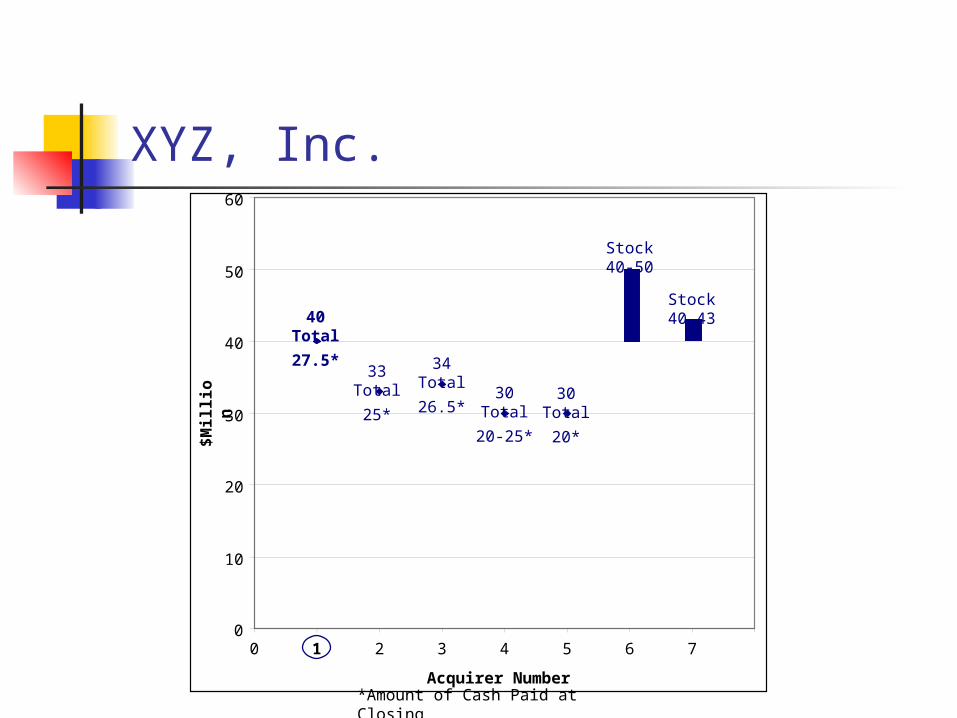
XYZ, Inc.
Acquirer Number
0
10
20
30
40
50
60
0 1 2 3 4 5 6 7
40Total
27.5*33
Total
25*
34Total
26.5*30
Total
20-25*
30Total
20*
Stock40-50
Stock40-43
$M
illi
on
*Amount of Cash Paid at Closing
Negotiations Will Have Many Ups and Downs
“And, while there’s no reason yet to panic,I think it only prudent that we make preparations to panic.”
Manage Transaction Resources
“Would everyone check to see if they have an attorney?I seem to have ended up with two.”
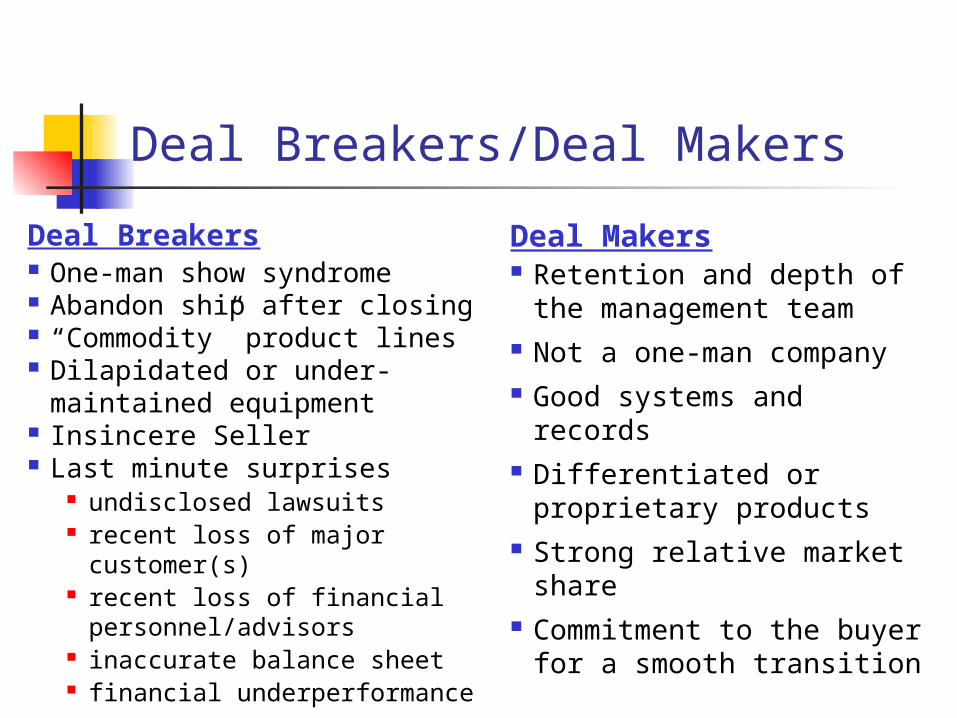
Deal Breakers/Deal Makers
Deal Breakers One-man show syndrome Abandon ship after closing “Commodity” product lines Dilapidated or under-maintained
equipment Insincere Seller Last minute surprises
undisclosed lawsuits recent loss of major customer(s) recent loss of financial
personnel/advisors inaccurate balance sheet financial underperformance
Deal Makers Retention and depth of the
management team Not a one-man company Good systems and records Differentiated or proprietary
products Strong relative market share Commitment to the buyer for
a smooth transition


![thesongoftherighteous.files.wordpress.com · Hark the Herald Angels Sing Score (Come Thou Fount of Every Blessing) Voice Piano [Composer] Michael D. Young Hark the her ald an gels](https://img.pdfslide.us/doc/110x75/5ae90def7f8b9ab24d8b8b5f/t-the-herald-angels-sing-score-come-thou-fount-of-every-blessing-voice-piano-composer.jpg)

![Hark Hark [E,134 bpm,6/8] - Brentwood Benson...Hark [G, 134 bpm, 6/8] [Hillsong Worship] Intro |G.\.|.Csus2.Cmaj9.|.Dsus.\.|.Em7..\.| Verse.1 Csus2.Cmaj9 Hark.the.herald.angels.sing](https://img.pdfslide.us/doc/110x75/60d22042ffbbf117fb1a77a3/hark-hark-e134-bpm68-brentwood-benson-hark-g-134-bpm-68-hillsong.jpg)