Embed Size (px)
Citation preview

Capturing the Green Jobs Opportunity
Joel RogersUW-Madison, COWS, CSI, MIP, GLSC, Apollo, G4A
EARN, Las Vegas, December 9, 2008

What I’ll talk about
1. What are green jobs? How do we improve them in state policy?
2. How dirty and inefficient our current energy generation and use is, and why efficiency’s progressive
3. An easy place to start

Skepticism welcome

Blinding self-concern not

I made some slides for you

Like this slide.

And this one.

I wonder about PowerPoint.

Power corrupts.

Absolute power corrupts absolutely.

Absolute PowerPoint just can’t be good.

The end of the Anthropocene?• 8M BC-1780, CO2 in atmosphere was steady (give or take 10 parts per
million) at ~ 280ppm• Increased 35ppm over next 150 yrs (1930s), 15ppm over next 40 yrs
(1970s), 20ppm over next 20 (199 ~ 0s), 20ppm over next ten (2005)
• CO2 is 385 ppm today (2008)
• At present rates of growth, it should reach 500 ppm before mid-century
• Last time that happened was the Eocene period, 50 million years ago, when sea levels were 300 feet higher than today
• Global warming already associated with massive ice cap melting, extreme weather, crop collapse, population migration

Now
Time (thousands of years)160 120 80 40
Temperature difference from
now °C
CO2concentration
(ppmv)
The last 160,000 years and the next 100 years
CO2 now
CO2 in 2100(w/BAU)
100
200
300
400
500
600
700
–10
0
10
Deg
rees
Cel
sius
CO2 P
PMV
CO2 in 2050 (with business as usual)


Green jobs: what’s real and what’s not and how to improve

What are “green jobs”?
1. “Green” is work devoted to climate mitigation or adaptation or, more broadly, to improving productive use of natural capital
2. “Green jobs” (GJs) are either actual jobs devoted to these tasks either wholly (close to zero) or partly (soon, virtually all) or FTEs devoted wholly to them
3. Even on an FTE basis, most GJs look a lot like current jobs. The difference lies less in their technologies, materials, or skills than in what those are used for.
4. This said, there are clusters of characteristic, or expected, green job activity that will require some reordering and reframing of skills transfer

GJ estimates in energy
Source: Bezdek (MISI)/ASES
Today
Projected in 2030

GJ jobs in misc related sectors
Source: PERI & CAP

RE jobs per Project Investment
U.S. Total New MW Number of Firms Investment (Millions) New FTE Jobs
Wind 124,900 16,480 $62,338 398,470
Solar 23,150 10,272 $69,624 298,194
Geothermal 15,190 3,926 $15,330 72,324
Biomass 21,760 12,020 $13,248 81,615
Total: 185,000 42,698 $160,540 850,603
Source: REPP

Potential RE MFG by state
Source: REPP
Location Firms (total)
Wind (millions)
Solar (millions)
Geothermal(millions)
Biomass(millions)
Total (millions)
California 5,409 $5,449.50 $12,115.90 $2,181.10 $1,165.30 $20,911.80
Texas 3,358 $3,977.70 $7,237.80 $906.90 $1,093.70 $13,216.10
New York 1,925 $3,297.10 $3,451.60 $2,005.20 $1,178.40 $9,932.30
Illinois 2,289 $4,406.50 $3,231.50 $592.40 $613.60 $8,844.00
Ohio 2,465 $4,431.90 $2,201.60 $1,023.00 $744.00 $8,400.50
Pennsylvania 2,188 $3,061.10 $3,428.20 $738.80 $689.80 $7,917.90
Indiana 1,321 $3,779.30 $1,342.20 $610.10 $531.40 $6,263.00
Wisconsin 1,331 $3,729.20 $991.50 $357.20 $451.30 $5,529.20
Michigan 2,050 $3,452.50 $1,255.60 $271.50 $348.80 $5,328.40
North Carolina 1,096 $1,785.00 $2,242.80 $647.80 $588.20 $5,263.80
South Carolina 488 $2,253.00 $839.20 $1,512.90 $559.40 $5,164.50
Massachusetts 1,193 $1,235.40 $2,687.20 $286.90 $214.00 $4,423.50

A modest estimate on RE
Source: Kammen, Kapadia, and Fripp, 2006

Wind Production jobs
Source: COWS
Occupation Training 25H 25A MH MA
Team assemblers* Moderate-term on-the-job training 10.41 21,650 12.81 26,640
Laborers and freight, stock, and material movers, hand* Short-term on-the-job training 10.45 21,740 12.95 26,940
Computer-controlled machine tool operators, metal and plastic
Moderate-term on-the-job training 11.88 24,710 15.54 32,320
Cutting, punching, and press machine setters, operators, and tenders, metal and plastic
Moderate-term on-the-job training 12.16 25,290 14.34 29,830
Drilling and boring machine tool setters, operators, and tenders, metal and plastic
Moderate-term on-the-job training 12.86 26,740 17.45 36,290
Customer service representatives* Moderate-term on-the-job training 13.70 28,490 16.81 34,970
Welders, cutters, solderers, and brazers* Postsecondary vocational award 14.24 29,620 17.35 36,080
Production, planning, and expediting clerks*
Moderate-term on-the-job training 14.50 30,150 19.41 40,370
Machinists* Long-term on-the-job training 14.74 30,650 17.72 36,870
Maintenance and repair workers, general
Moderate-term on-the-job training 16.03 33,350 19.39 40,330
Energy Efficiency JobsOccupation Training 25H 25A MH MA
Construction laborers* Moderate-term on-the-job training 10.24 21,310 12.82 26,670
Sheet metal workers* Long-term on-the-job training 10.48 21,800 13.57 28,230
Insulation workers, floor, ceiling, and wall*
Moderate-term on-the-job training 11.37 23,660 18.45 38,370
Cement masons and concrete finishers* Moderate-term on-the-job training 12.66 26,340 16.24 33,780
Heating, air conditioning, and refrigeration mechanics and installers*
Long-term on-the-job training 12.75 26,530 15.32 31,860
Hazardous materials removal workers* Moderate-term on-the-job training 12.88 26,780 16.52 34,370
Carpenters* Long-term on-the-job training 13.58 28,250 17.39 36,180
Plumbers, pipefitters, and steamfitters* Long-term on-the-job training 13.84 28,780 18.38 38,240
Electricians* Long-term on-the-job training 14.76 30,700 18.10 37,650
Boilermakers* Long-term on-the-job training 19.09 39,710 24.42 50,800
Source: COWS

BioFuels Production JobsOccupation Training 25H 25A MH MALaborers and freight, stock, and material movers, hand*
Short-term on-the-job training 9.94 20,670 13.01 27,070
Mixing and blending machine setters, operators, and tenders*
Moderate-term on-the-job training 11.80 24,550 15.00 31,190
Shipping, receiving, and traffic clerks* Short-term on-the-job training 12.56 26,120 15.66 32,570
Separating, filtering, clarifying, precipitating, and still machine setters, operators, and tenders*
Moderate-term on-the-job training 14.17 29,480 18.43 38,330
Truck drivers, heavy and tractor-trailer* Moderate-term on-the-job training 15.34 31,910 19.10 39,730
Chemical equipment operators and tenders
Moderate-term on-the-job training 16.08 33,440 20.74 43,150
Chemical technicians* Associate's degree 17.70 36,810 21.89 45,530
Chemical plant and system operators Long-term on-the-job training 20.25 42,120 24.72 51,410
Electrical and electronics repairers, commercial and industrial equipment*
Postsecondary vocational training 22.38 46,540 26.02 54,110
Sales representatives, wholesale and manufacturing, technical and scientific products*
Work Experience in related occupation 24.24 50,410 33.97 70,660
Source: COWS/BLS

How to capture the GJ opportunity
1. Map your economy, identify competitive advantage or local demand, maintain real-time data on demand, wages, skills needs, etc.
2. Make public training responsive to but not bullied by existing employer demand; upgrade that demand using any tools you have, including regulation, subsidies, standards, etc.
3. Require local benefit, credentialing and transferability and recognition of skills, career ladders
4. Build an industry, not just project demand

A career ladder

How dirty and wasteful we are, and why improving that will help the poor

Dirty generation

Measure for measure
• A quad is a quadrillion BTUs• 1.0 Btu = 252 calories• 1Btu/hour = 0.293 W• 3.413 Btu/hr = 1.0 watt • 1 Quad/hour = 293,000,000,000,000 W = 293,000 gW or 293 million mW• 1 Quad = 170 million barrels of oil equivalent (boe)

U.S. energy flows (1)

US energy flows (2)

Source: ACEEE
Energy Consumption in the United States 1949 - 2005
0
25
50
75
100
125
150
175
200
1949 1953 1957 1961 1965 1969 1973 1977 1981 1985 1989 1993 1997 2001 2005
Qu
ad
s/Y
ea
r
$ 1.7 Trillion
$ 1.0 Trillion
New Physical Supply = 25 Q
Avoided Supply = 70 Quads in 2005
If E/GDP had dropped 0.4% per
Actual (E/GDP drops 2.1% per year)
70 Quads per year saved or avoided corresponds to 1 Billion cars off the road
Efficiency is the first fuel

3.0
4.0
5.0
6.0
7.0
8.0
9.0
10.00
0 10 20 30 40 50
Wind @ 29% CF
IGCC w/o CCS
NGCCBiomass
NuclearPulverized Coal w/o CCS
Energy Efficiency
Cen
ts p
er K
Wh
Price of carbon per ton Source: ACEEE
Cheap and getting cheaper

Good financial returns

Building energy consumption
• About $400B annually• About 50 percent savings available on “simple” cost-
effective basis (i.e., lifetime energy savings from efficiency measures exceed their purchase, installation, and maintenance costs)
• That’s a lot of money

Benefits of building energy retrofits
• Income to tenants and owners• Climate and public health• Extended building life and higher property values• Tenant/occupant health and productivity• Non-offshorable employment, at about 12.5 person
years of employment per $1M invested

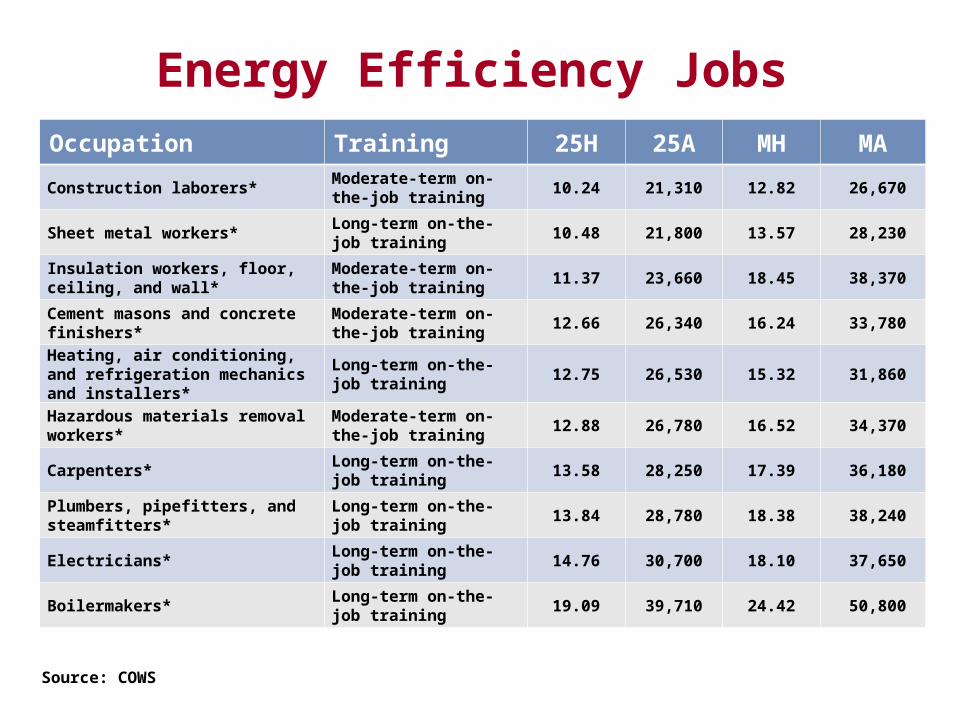
Median household consumption
Source: Center for Neighborhood Technology and National Housing Policy Center, 2007
“Drive ’til you qualify”

Source: ICF International, 2007
Gains from one less car

Comprehensive urban building retrofits as a project

Transportation 32%
Buildings 43%
Industry 25%
Source: Pew Center on Global Climate Change
Residential 21%
Commercial 17%
Industrial 5%
Building contribution to CO2 emissionsBuilding contribution to CO2 emissions
Building contribution to CO2 emissions
Building contribution to CO2 emissions
U.S. sources of CO2

Rebuilding America?
82.0 billion new squarefeet from replacement
131.4 billion new square feet
295.6 billion square feet in 2000
427.3 billion square feet in 2030
213.4 billion new square feet of built space
Source: Nelson, “Toward a new Metropolis”

100 US Metros

Why cities are great•Big population with associated buying power •Strategic location and regional linkages•Population and firm density, with agglomeration effects,
complementary skill sets, associated innovation•Infrastructure (ports, airports, other transportation
networks)•Higher wages/productivity•Lower waste•Centers for research, education, health care, “knowledge”
economy, finance, business services, hospitality, etc.•More diverse, tolerant, attractive to youth and immigrants•More progressive in politics•More easily organized

The riddle of unclaimed value

Benefits of building energy retrofits
• Income to tenants and owners• Climate and public health• Extended building life and higher property values• Tenant/occupant health and productivity• Non-offshorable employment, at about 12.5 person
years of employment per $1M invested
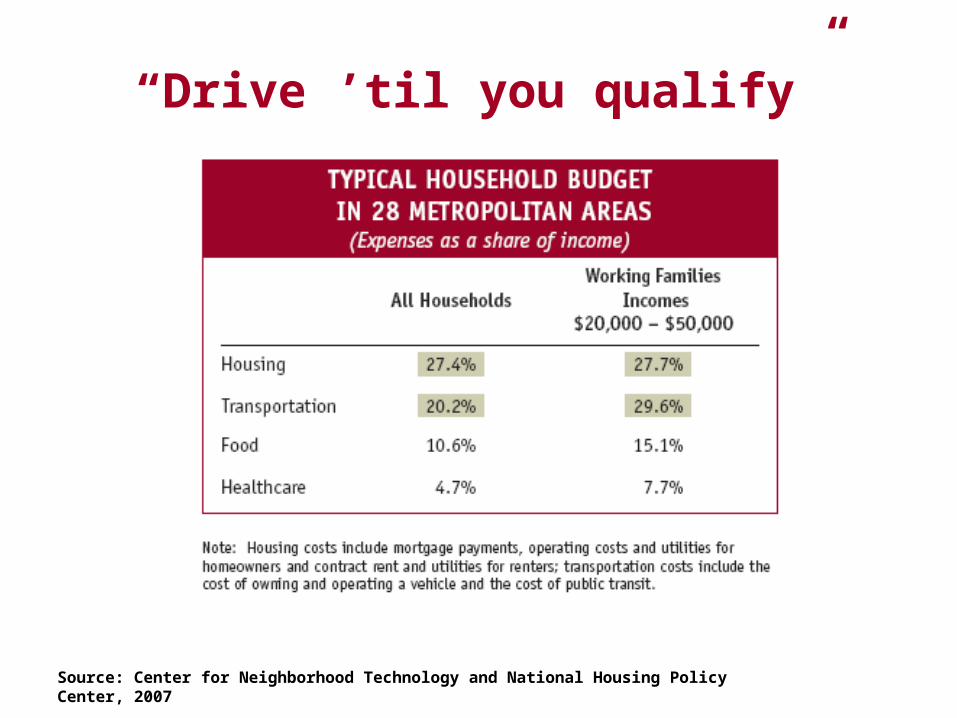
RRIDDLLS• Regulatory surround is bad (efficiency not encouraged) • Risk aversion among tenants and owners, especially given
uncertain duration of tenancy/ownership• Information problems on everything (benefits, cost, reliable
service)• Disaggregated savings • Disruption • Lack of capital• Lack of interest• Split incentives (tenants vs. owners, developers vs. owners)

An offer they can’t refuse?
E2 will buy and install cost-effective energy-efficiency measures in your home or business with no up-front payment from you and no new debt obligation. The cost of this service included, your net energy bill should drop immediately and always be lower than it would have been without E2 participation. Your service obligation ends when you quit this property and is suspended during any period of measure malfunction, which we will repair at no cost to you.

Solving the riddle

Your expected (pre-E2-participation) energy bill $170
Your energy consumption this month $135E2 service charge
$ 25You owe $160
Sample utility bill

Your expected (pre-E2-participation) energy bill $170
This month’s energy consumption $135Demand response savings credit ($ 30) Negawatts credit for forward capacity ($ 30)Climate exchange credit($ 30)Energy sold back to grid ($ 30)
Your net energy bill this month $ 15E2 service charge $ 25You owe $ 40
Future utility bill

Energy costs for 2,252,800 Wisconsin households 20% savings
Total cost of residential energy (gas, electricity, fuel oil, propane) consumption $4,572,463,104 $914,492,621
Average monthly cost per household $169.14 $33.83
Available capital under Me2-styled program
Average available capital per household if amortized over 10 yrs at 6% interest and $33.83/month $3,047
Total available capital (2,252,800 X $3,047) $6,864,281,600
Current direct WI public spending on residential energy efficiency ~ $70M
Ratio of available capital under Me2-styled program to current WI public spending ~ 100/1
High leverage