Embed Size (px)
Citation preview
Capturing the Effects of Smart Growth on Travel Capturing the Effects of Smart Growth on Travel and Climate Changeand Climate Change
Jerry Walters, Fehr & PeersJerry Walters, Fehr & Peers
Modeling for Regional and Interregional PlanningModeling for Regional and Interregional PlanningCaltrans Division of Transportation PlanningCaltrans Division of Transportation Planning January 24, 2008January 24, 2008
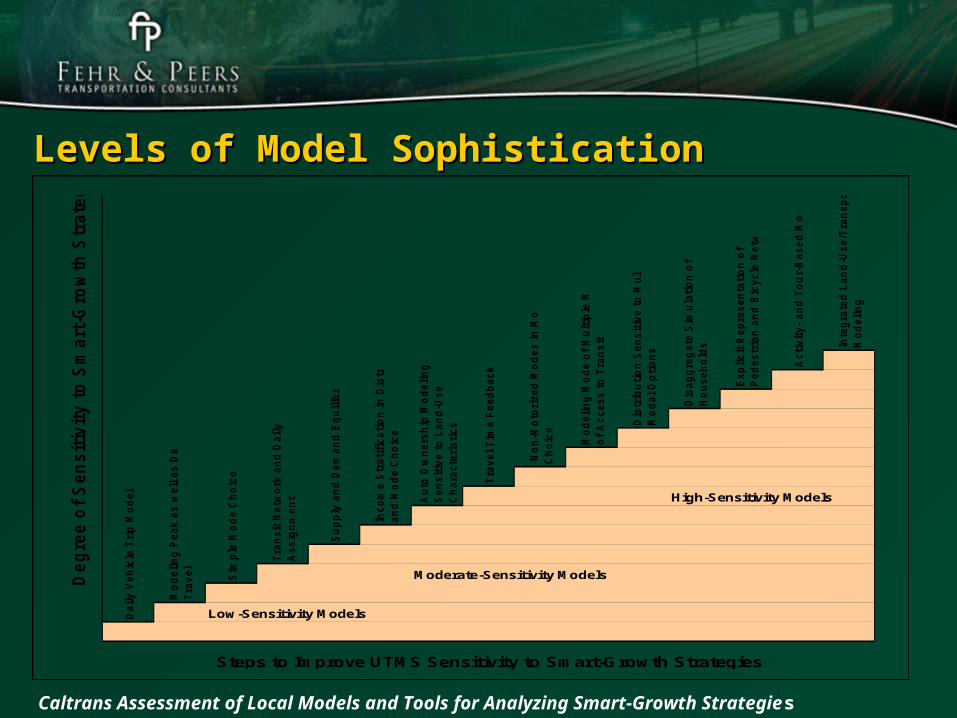
Levels of Model SophisticationLevels of Model Sophistication
Caltrans Assessment of Local Models and Tools for Analyzing Smart-Growth Strategies
High-Sensitivity Models
Moderate-Sensitivity Models
Low-Sensitivity Models
Inc
om
e S
tra
tifi
cati
on
in
Dis
trib
uti
on
an
d M
od
e C
ho
ice
Au
to O
wn
ers
hip
Mo
deli
ng
Sen
sit
ive t
o L
an
d-U
se
Ch
ara
cte
ris
tics
Deg
ree o
f S
en
sit
ivit
y t
o S
mart
-Gro
wth
Str
ate
gie
s
Mo
de
lin
g M
od
e o
f M
ult
iple
Mo
des
of
Ac
ces
s t
o T
ran
sit
Dis
trib
uti
on
Sen
sit
ive t
o M
ult
i-
Mo
da
l O
pti
on
s
Dis
ag
gre
gate
Sim
ula
tio
n o
f
Ho
us
eh
old
s
Da
ily V
eh
icle
Tri
p M
od
el
Steps to Improve UTMS Sensitivity to Smart-Growth Strategies
Tra
vel
Tim
e F
ee
db
ack
No
n-M
oto
rized
Mo
des
in
Mo
de
Ch
oic
e
Mo
de
lin
g P
ea
k a
s w
ell
as D
ail
y
Tra
vel
Sim
ple
Mo
de C
ho
ice
Tra
nsit
Netw
ork
an
d D
ail
y
As
sig
nm
en
t
Su
pp
ly a
nd
Dem
an
d E
qu
ilib
rati
on
Inte
gra
ted
Lan
d-U
se
/Tra
nsp
ort
ati
on
Mo
de
lin
g
Ac
tivit
y-
an
d T
ou
r-B
ased
Mo
deli
ng
Exp
licit
Re
pre
sen
tati
on
of
Ped
es
tria
n a
nd
Bic
ycle
Netw
ork
s

AgendaAgenda
1. Limitations of 4-Step Models
2. 4D Effects of Land Use on Travel
3. Smart Growth Blueprint -- Case Study

AgendaAgenda
1. Limitations of 4-Step Models
2. 4D Effects of Land Use on Travel
3. Smart Growth Blueprint -- Case Study

Shortcomings of Conventional Travel Models Shortcomings of Conventional Travel Models in Assessing Smart Growthin Assessing Smart Growth
• Primary use is to forecast long-distance auto travel on Primary use is to forecast long-distance auto travel on freeways and major roadsfreeways and major roads
• Secondary use is to forecast system-level transit useSecondary use is to forecast system-level transit use
• Short-distance travel, local roads, non-motorized travel Short-distance travel, local roads, non-motorized travel modes are not addressed in model validationmodes are not addressed in model validation
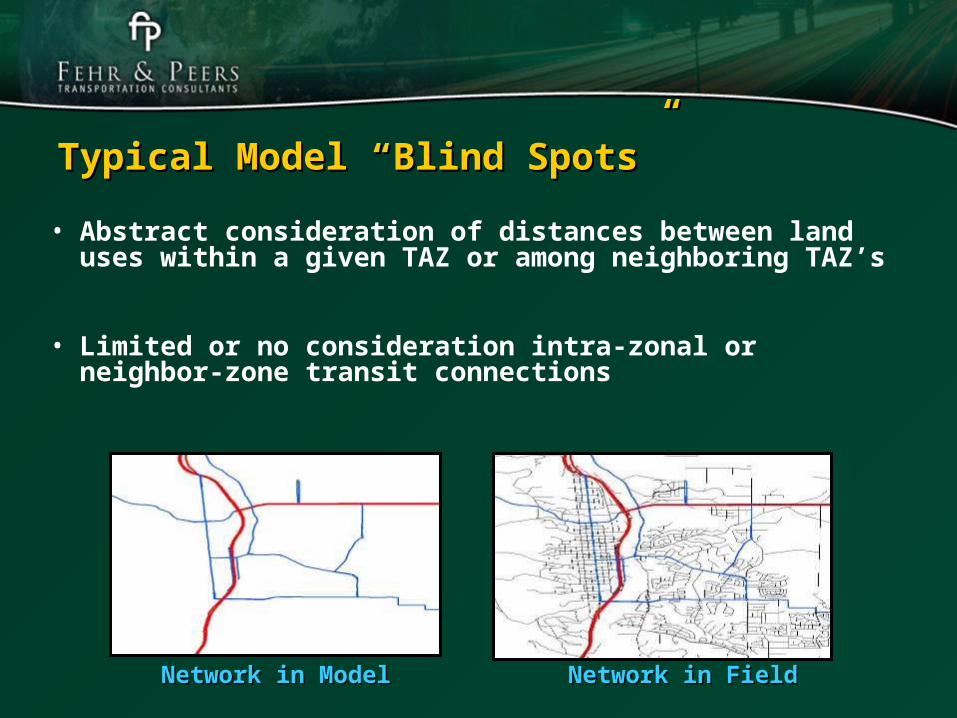
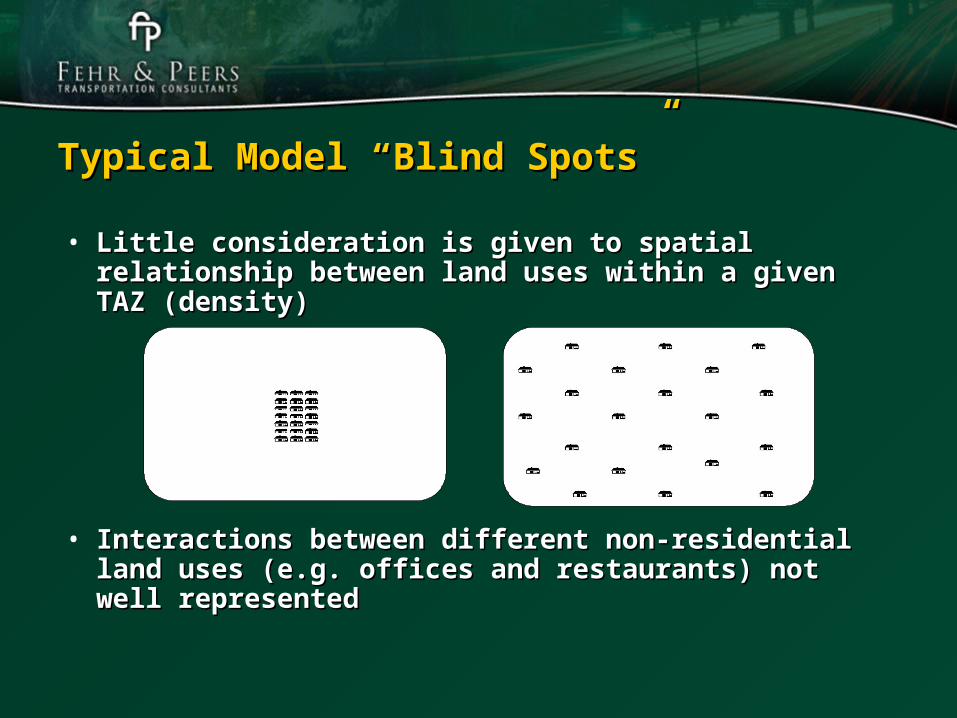
Typical Model “Blind Spots”Typical Model “Blind Spots”
• Abstract consideration of distances between land uses within a given TAZ or among neighboring TAZ’s
• Limited or no consideration intra-zonal or neighbor-zone transit connections
Network in ModelNetwork in Model Network in FieldNetwork in Field
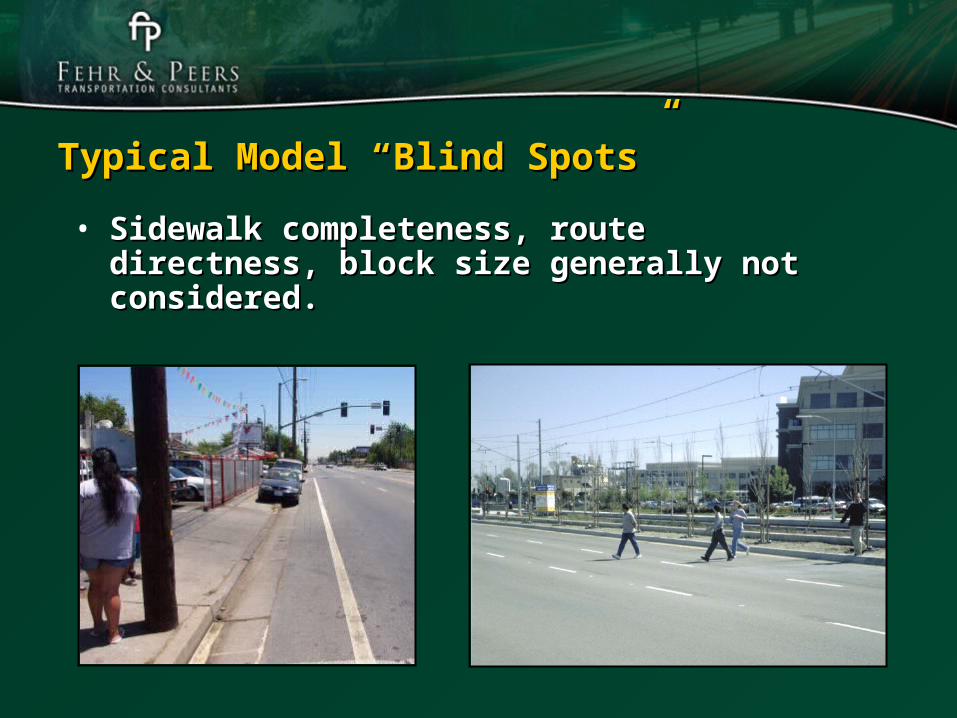
Typical Model “Blind Spots”Typical Model “Blind Spots”
• Sidewalk completeness, route directness, block Sidewalk completeness, route directness, block size generally not considered.size generally not considered.
Typical Model “Blind Spots”Typical Model “Blind Spots”
• Little consideration is given to spatial relationship Little consideration is given to spatial relationship between land uses within a given TAZ (density)between land uses within a given TAZ (density)
• Interactions between different non-residential land Interactions between different non-residential land uses (e.g. offices and restaurants) not well uses (e.g. offices and restaurants) not well representedrepresented

AgendaAgenda
1. Limitations of 4-Step Models
2. 4D Effects of Land Use on Travel
3. Smart Growth Blueprint -- Case Study

Daily Vehicle Miles per Person vs. Residential DensitySource: Baltimore Metropolitan Council, 2001 Travel Survey
0
10
20
30
40
50
60
0 2 4 6 8 10 12 14 16 18
Households per Acre
Dail
y V
eh
icle
Mil
es p
er
Pers
on
Charles Street
Hampstead
Odenton
Owings Mills
Dundalk
Reservoir Hill
Butcher's Hill
Brewer's HillBolton Hill
Canton
Federal Hill
Taneytown
Westminster Greens
Westminster Downtown
Havre de Grace
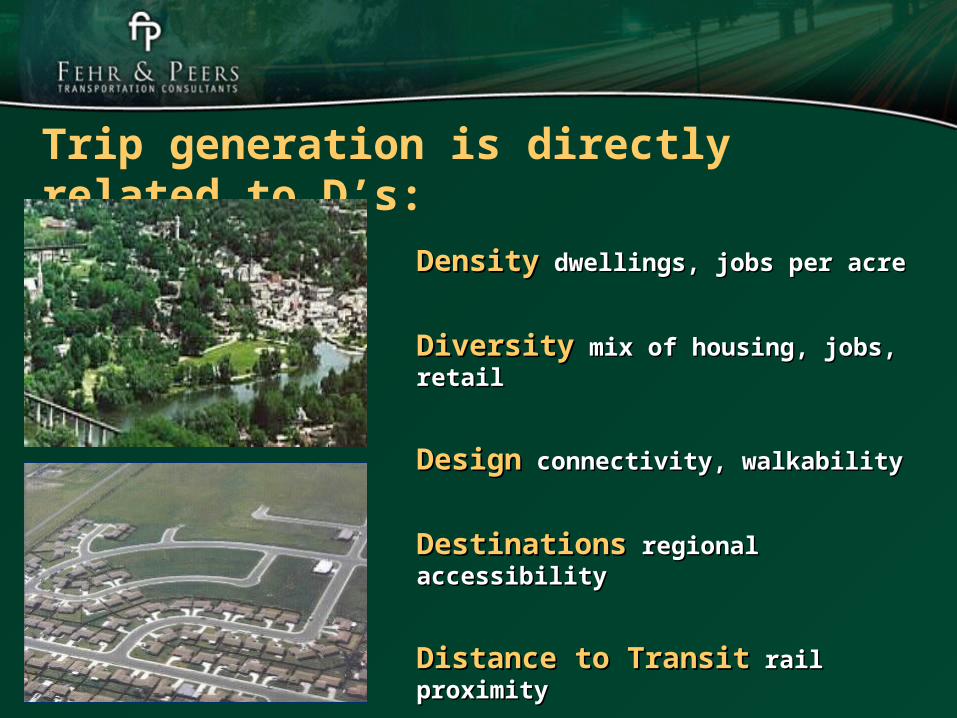
Trip generation is directly related to D’s:
DensityDensity dwellings, jobs per acredwellings, jobs per acre
DiversityDiversity mix of housing, jobs, retailmix of housing, jobs, retail
DesignDesign connectivity, walkability connectivity, walkability
DestinationsDestinations regional accessibility regional accessibility
Distance to TransitDistance to Transit rail proximity rail proximity
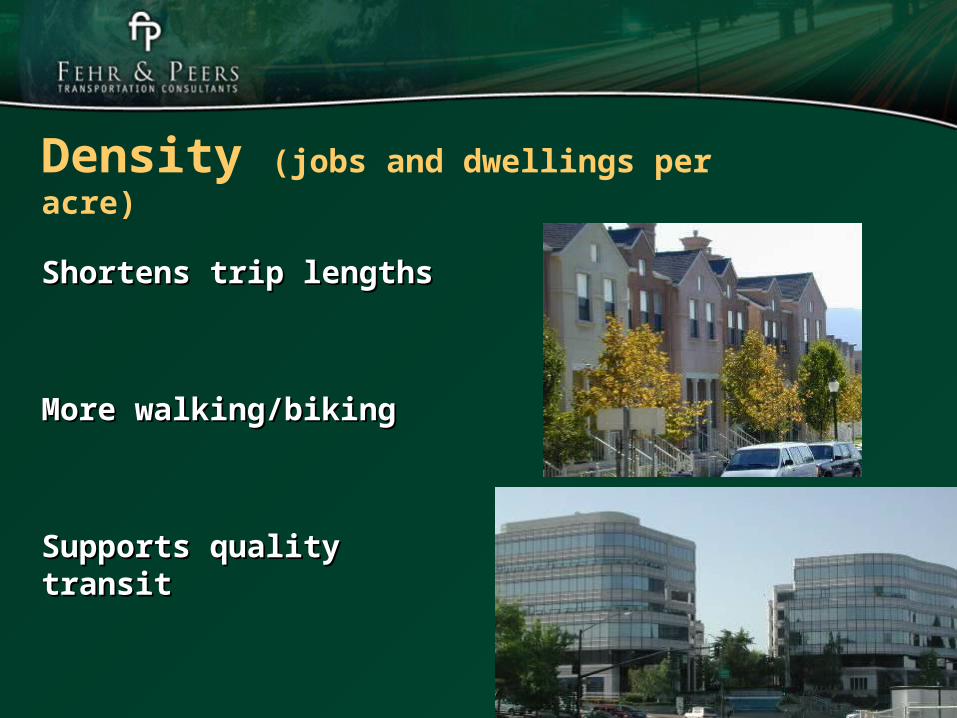
Shortens trip lengthsShortens trip lengths
More walking/bikingMore walking/biking
Supports quality transitSupports quality transit
Density (jobs and dwellings per acre)

Links trips, shortens distancesLinks trips, shortens distances
More walking/ bikingMore walking/ biking
Allows shared parkingAllows shared parking
Diversity (mix of housing, jobs, retail)

Design (connectivity, walkability)

Destinations (accessibility to regional activities)
Development at infill or close-in locations reduces Development at infill or close-in locations reduces vehicle trips and milesvehicle trips and miles

Transit shares higher within ¼ mile and ½ mile of station
Distance to Transit
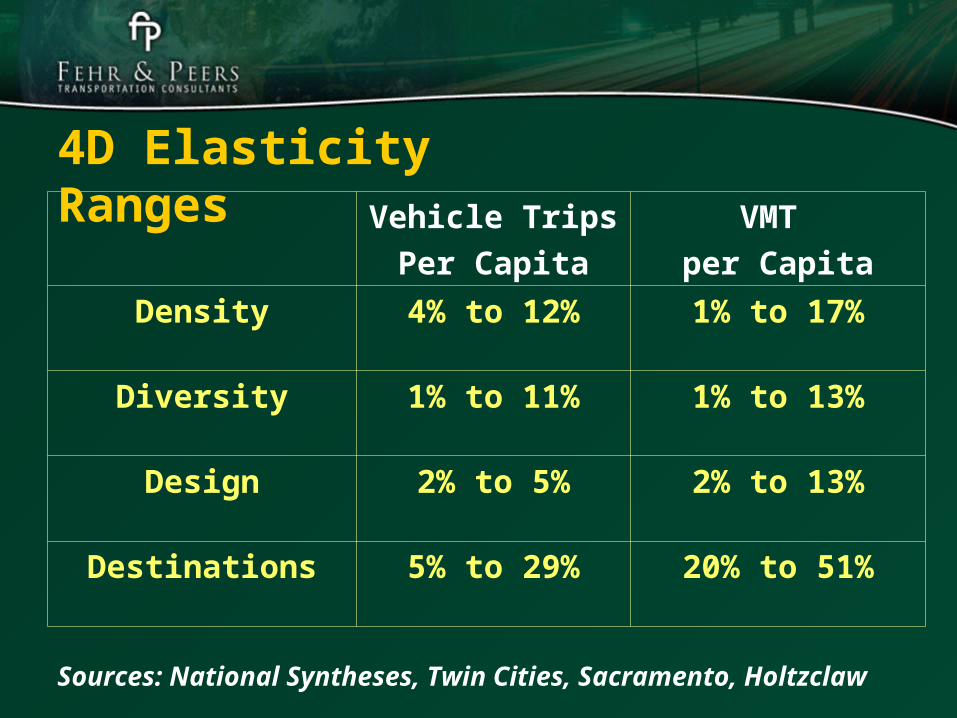
Vehicle Trips
Per Capita
VMT
per Capita
Density 4% to 12% 1% to 17%
Diversity 1% to 11% 1% to 13%
Design 2% to 5% 2% to 13%
Destinations 5% to 29% 20% to 51%
4D Elasticity Ranges
Sources: National Syntheses, Twin Cities, Sacramento, Holtzclaw
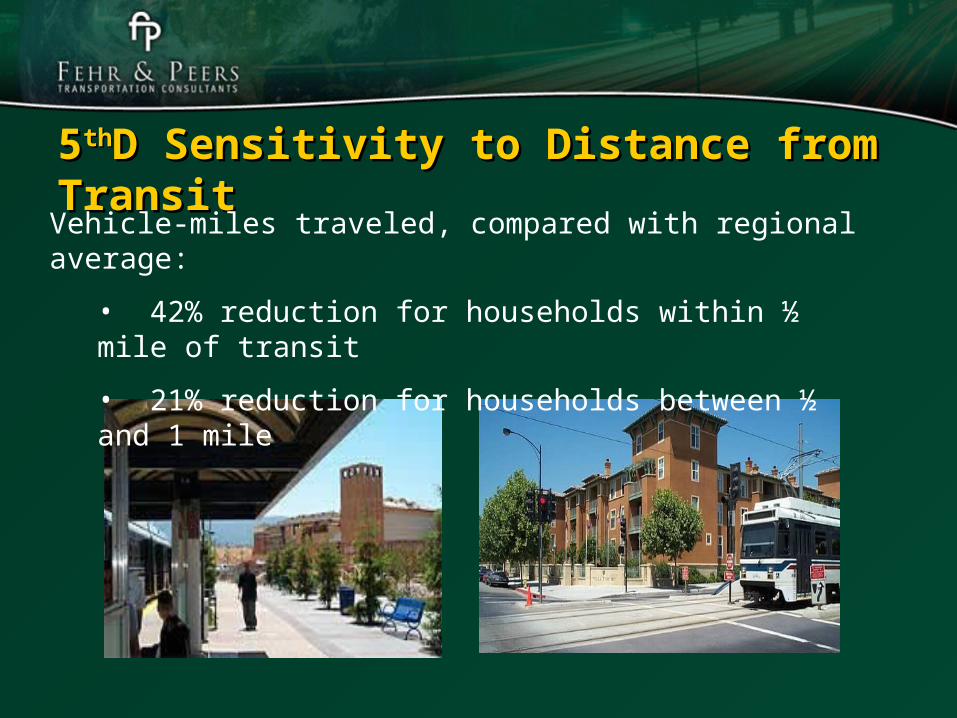
55ththD Sensitivity to Distance from TransitD Sensitivity to Distance from Transit
Vehicle-miles traveled, compared with regional average:
• 42% reduction for households within ½ mile of transit
• 21% reduction for households between ½ and 1 mile
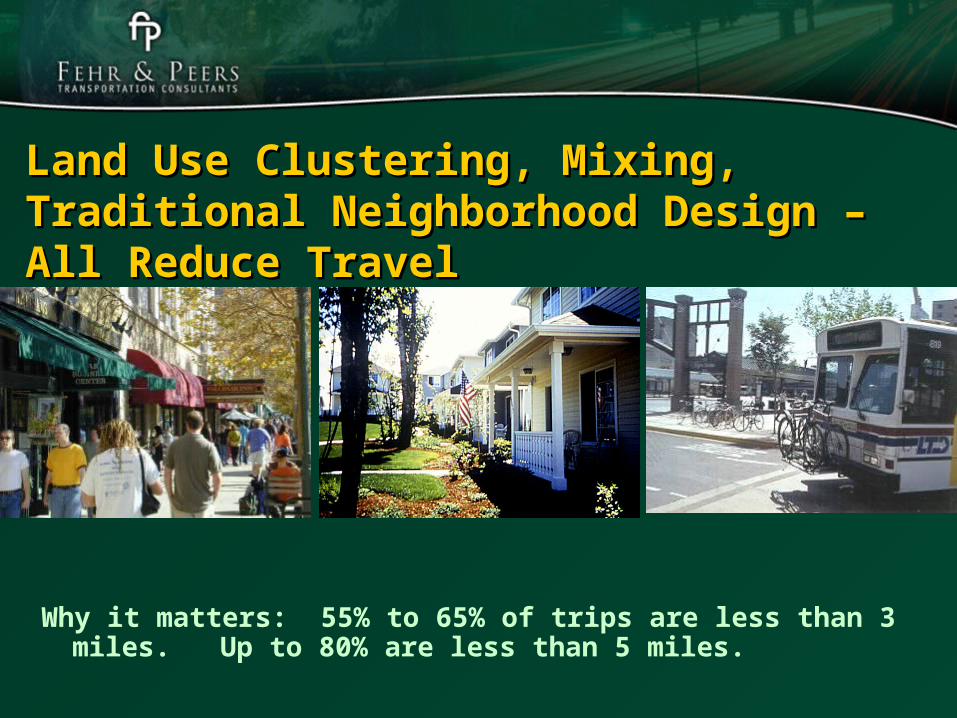
Land Use Clustering, Mixing, Traditional Land Use Clustering, Mixing, Traditional Neighborhood Design – All Reduce TravelNeighborhood Design – All Reduce Travel
Why it matters: 55% to 65% of trips are less than 3 miles. Up to 80% are less than 5 miles.
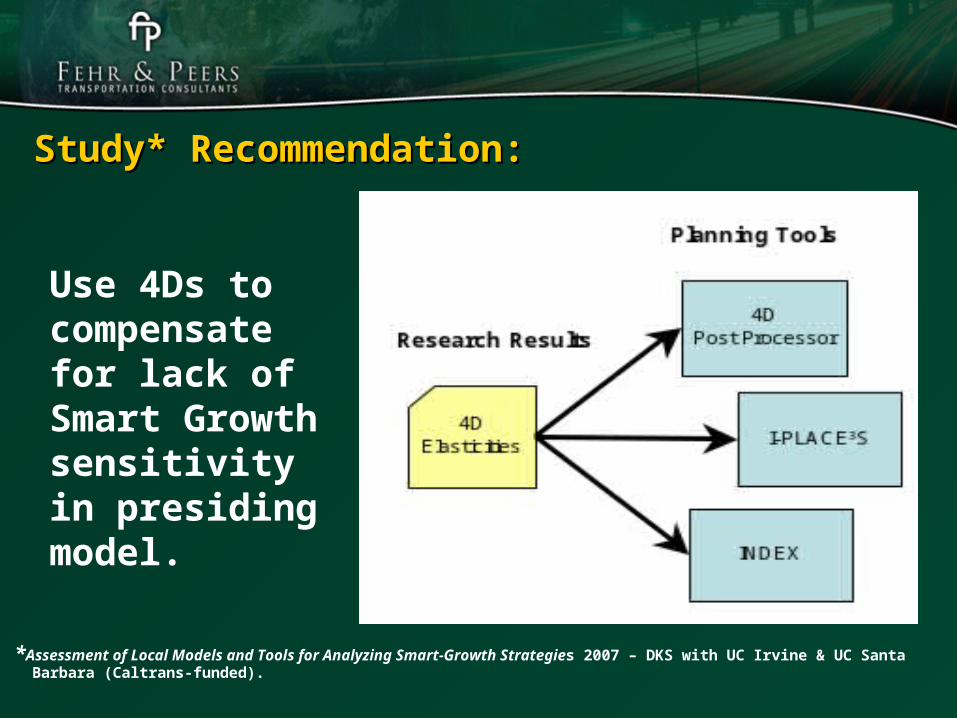
Study* Recommendation:Study* Recommendation:
*Assessment of Local Models and Tools for Analyzing Smart-Growth Strategies 2007 – DKS with UC Irvine & UC Santa Barbara (Caltrans-funded).
Use 4Ds to compensate for lack of Smart Growth sensitivity in presiding model.
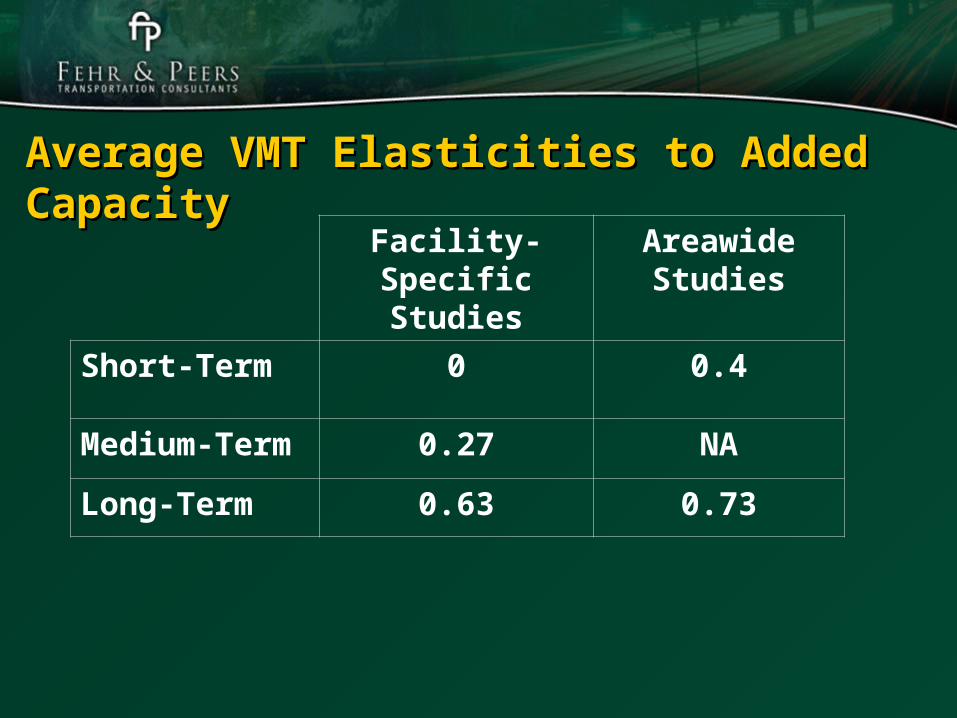
Average VMT Elasticities to Added CapacityAverage VMT Elasticities to Added Capacity
Facility-Specific Studies
Areawide Studies
Short-Term 0 0.4
Medium-Term 0.27 NA
Long-Term 0.63 0.73

Investment in System ContinuityInvestment in System Continuity

1. Test model sensitivity to BE, and use 4D’s to compensate for any limitations
2. Use scenario planning or integrated land use/ transport models to account for induced development and travel
3. Conduct constraints analysis for critical corridors to refine/prioritize improvements
Conclusions on Modeling Land Use < > Transportation < > Climate ChangeLand Use < > Transportation < > Climate Change

AgendaAgenda
1. Limitations of 4-Step Models
2. 4D Effects of Land Use on Travel
3. Smart Growth Blueprint -- Case Study
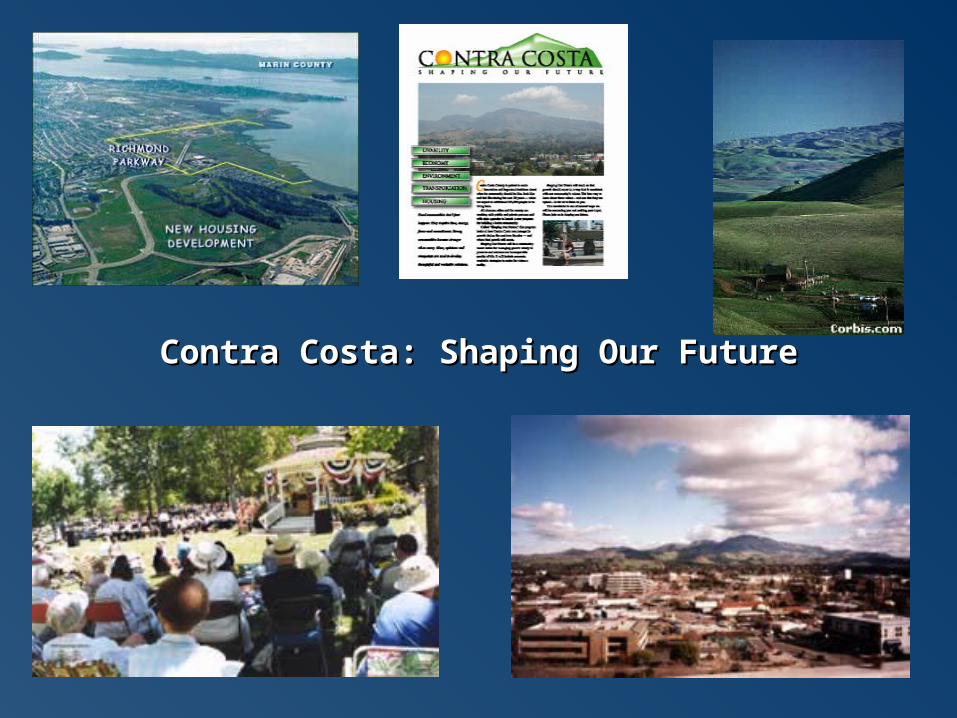
Contra Costa: Shaping Our FutureContra Costa: Shaping Our Future

Integrated Land Use/ Transportation Integrated Land Use/ Transportation Visioning and Planning StrategyVisioning and Planning Strategy
Concentrate land use around Concentrate land use around potential transit nodespotential transit nodes
Prioritize transportation system Prioritize transportation system expansions that work best with expansions that work best with compact, transit oriented compact, transit oriented development.development.
Emphasize development forms known to reduce travel perEmphasize development forms known to reduce travel per
capita: density, mix, transit-oriented design, infill and capita: density, mix, transit-oriented design, infill and
close-in locationsclose-in locations
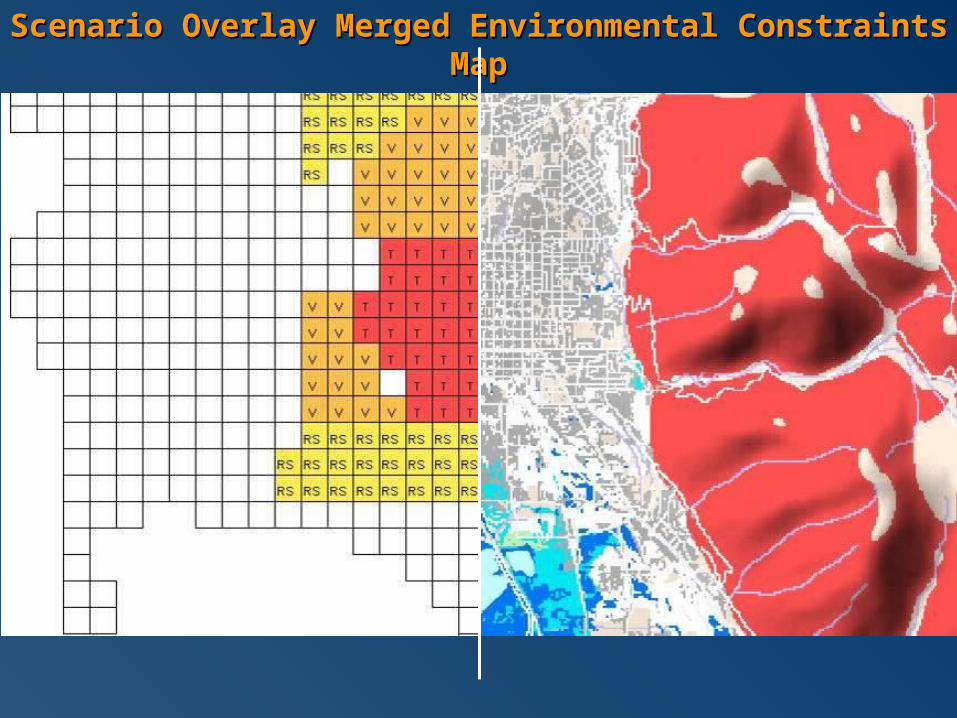
ScenarioScenario Overlay Merged Environmental Overlay Merged Environmental Constraints MapConstraints Map

Contra Costa Model Contra Costa Model OverviewOverview
Modeling Future Development ScenariosModeling Future Development Scenarios
Virtual Land Virtual Land Use Future, Use Future, 20302030
Available Available LandLand
Future Future Transportation & Transportation & Land Use Model, Land Use Model, 20302030
Measurements and Metrics:
•Economic Analysis
•Environmental Impact
•Land Conversion
•Social/Demographic Impacts
•Other Metrics
TransportatioTransportation Networkn Network
TransportatioTransportation Policiesn Policies
Transportation Modeling
Land Use Modeling
Jobs & Jobs & Population Population ForecastForecast
Development Development Policy Policy ScenarioScenario

1. Higher development densities reduce trip lengths and 1. Higher development densities reduce trip lengths and vehicle travelvehicle travel
Forecast Scenario increases development density for new growth by 11%.
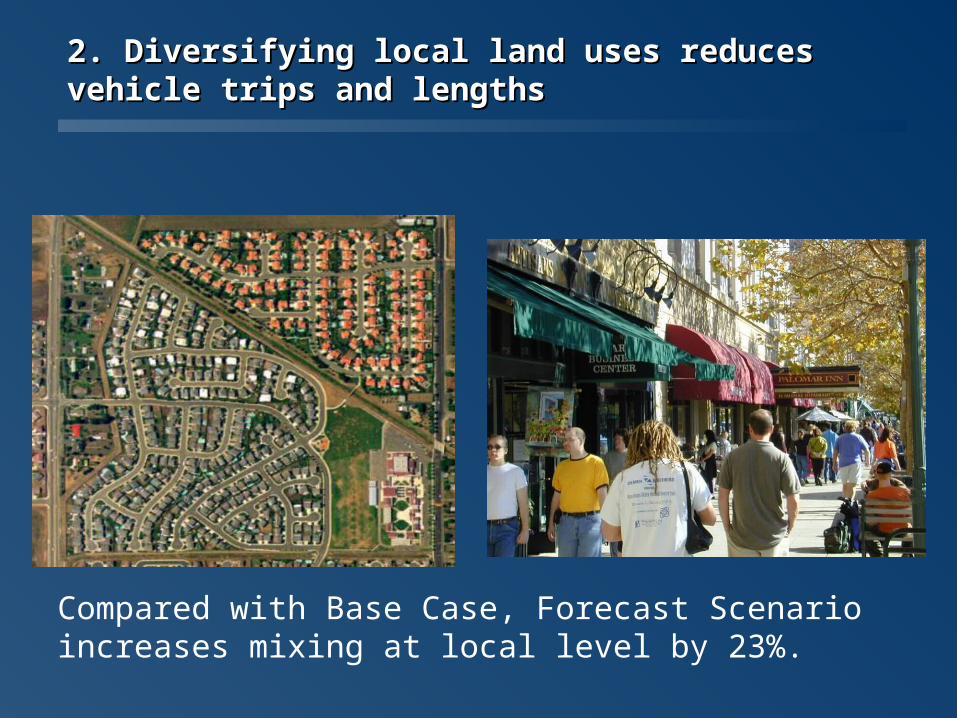
2. Diversifying local land uses reduces vehicle trips 2. Diversifying local land uses reduces vehicle trips and lengthsand lengths
Compared with Base Case, Forecast Scenario increases mixing at local level by 23%.
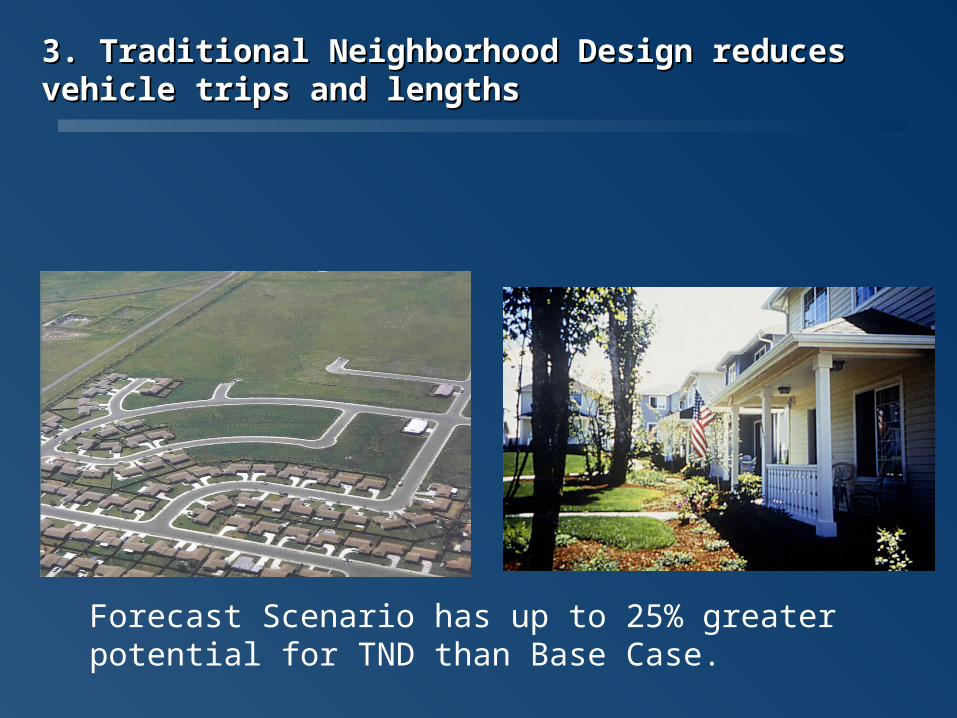
3. Traditional Neighborhood Design reduces vehicle trips 3. Traditional Neighborhood Design reduces vehicle trips and lengthsand lengths
Forecast Scenario has up to 25% greater potential for TND than Base Case.

4. Dense, diverse, well-designed development is more 4. Dense, diverse, well-designed development is more effective at infill or close-in locationseffective at infill or close-in locations
Scenario places more development at infill locations than Base Case.
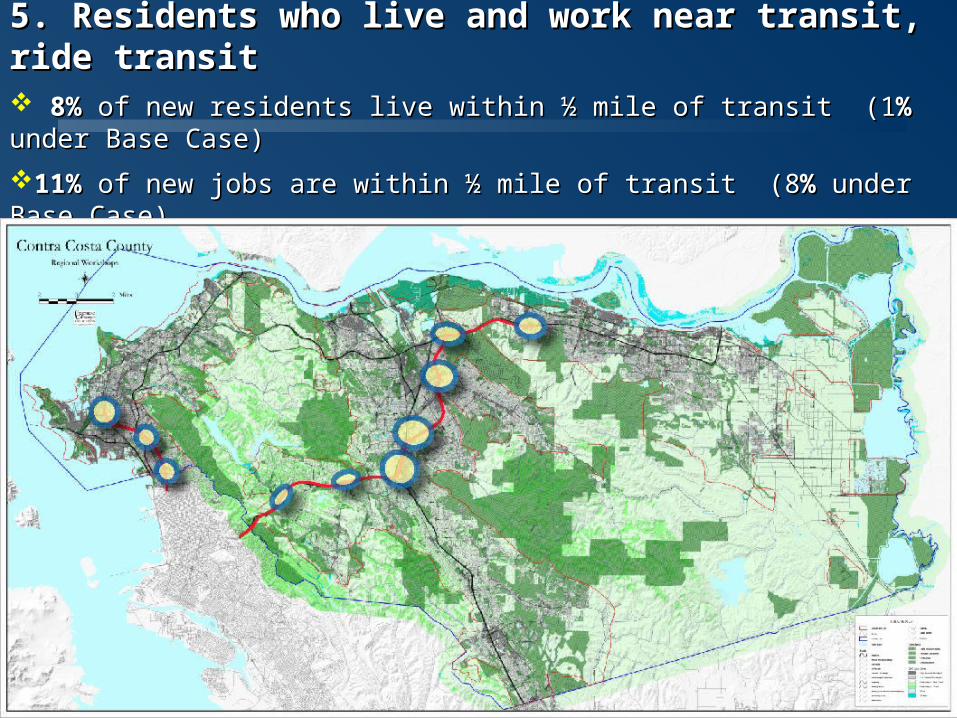
5. Residents who live and work near transit, ride transit5. Residents who live and work near transit, ride transit 8%8% of new residents live within ½ mile of transit (1 of new residents live within ½ mile of transit (1%% under Base Case) under Base Case)
11%11% of new jobs are within ½ mile of transit (8 of new jobs are within ½ mile of transit (8%% under Base Case) under Base Case)
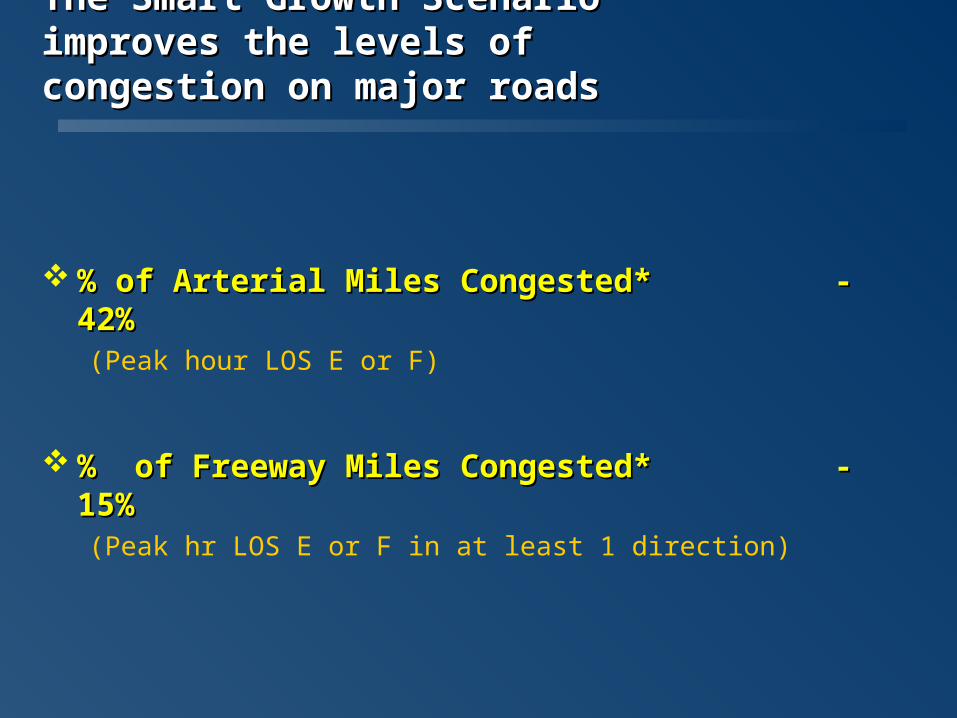
The Smart Growth Scenario improves The Smart Growth Scenario improves the levels of congestion on major roadsthe levels of congestion on major roads
% of Arterial Miles Congested* % of Arterial Miles Congested* - 42% - 42% (Peak hour LOS E or F)
% of Freeway Miles Congested*% of Freeway Miles Congested* - 15%- 15%(Peak hr LOS E or F in at least 1 direction)
Capturing the Effects of Smart Growth on Capturing the Effects of Smart Growth on
Travel and Climate ChangeTravel and Climate Change
Jerry Walters, Fehr & PeersJerry Walters, Fehr & Peers


![Fehr Bros Garage Door Catalog[1]](https://img.pdfslide.us/doc/110x75/543ca277b1af9f5f378b466c/fehr-bros-garage-door-catalog1.jpg)