Embed Size (px)
Citation preview
AD-A245 119
Technical Report 939
Capturing Temperament Constructs
With Objective Biodata
Fred A. Mael and Amy C. SchwartzU.S. Army Research Institute
November 1991
A ZCT I-•"•9" JANZ 199ZJ
I United States Army Research Institute:or the Behavioral and Social Sciences
Approved for public release; disiribution is 92-01867
92 1 22 101
U.S. ARMY RESEARCH INSTITUTE
FOR THE BEHAVIORAL AND SOCIAL SCIENCES
A Field Operating Agency Under the Jurisdiction
of the Deputy Chief of Staff for Personnel
EDGAR M. JOHNSON MICHAEL D. SHALERTechnical Director COL, AR
Commanding
Technical review by
Henry BusciglioRobert Kilcullen
NOTICES1I I 0 IOnma stribJn oft hjtport ha ln mad • I. P• ad ls/
0 ore xld ee on eri ti• # tii Of rorto: tiS iy Isl IiUtu for~lB n c ISie s I"i wr x a itr ia
FINAL DISPOSITION: This report may be destroyed when it is no longer needed. Please do notreturn it to the U.S. Army Research Institute for the Behavioral and Social Sciences.
NOTE: The findings in this report are not to be construed as an official Department of the Armyposition, unless so designated by other authorized documents.
UNCLASSIFIEDSECURITY CLASSIFICATION OF THIS PAGE
Form ApprovedREPORT DOCUMENTATION PAGE OMeINo. o04-0.is#Ia. REPORT SECURITY CLASSIFICATION lb. RESTRICTIVE MARKINGSUnclassified --2a. SECURITY CLASSIFICATION AUTHORITY 3. DISTRIBUTION• IAVAILABILITY OF REPORT
Approved for public release;2b. DECLASSIFICATION/DOWNGRADING SCHEDULE distribution is unlimited.
4. PERFORMING ORGANIZATION REPORT NUMBER(S) 5. MONITORING ORGANIZATION REPORT NUMBER(S)ARI Technical Report 939
6a. NAME OF PERFORMING ORGANIZATION 6b. OFFICE SYMBOL 7a. NAME OF MONITORING ORGANIZATIONU.S. Army Research Institute (If applicable) __
PERI-RS6c. ADDRESS (City, State, and ZIP Code) 7b. ADDRESS (City, State, and ZIP Code)
5001 Eisenhower AvenueAlexandria, VA 22333-5600
Ba. NAME OF FUNDING /SPONSORING 8b. OFFICE SYMBOL 9. PROCUREMENT INSTRUMENT IDENTIFICATION NUMBERORGANIZATION U. S. Army Research (if applicable)
Institute for the Behavioral --and Social Sciences PERI-R8c. ADDRESS (City, State, and ZIP Code) 10. SOURCE OF FUNDING NUMBERS
PROGRAM PROJECT TASK WORK UNIT5001 Eisenhower Avenue ELEMENT NO. NO. NO. ACCESSION NO.Alexandria, VA 22333-5600 62785A 791 2211 HI
11. TITLE (Include Security Classification)
Capturing Temperament Constructs With Objective Biodata
12. PERSONAL AUTHOR(S)Mael, Fred A.; and Schwartz, Amy C.13a. TYPE OF REPORT 13b. TIME COVERED 14. DATE OF REPORT (Year, Month, Day) 15. PAGE COUNTInterim FROM 89/11 TO 91/0._ 7 1991, November16. SUPPLEMENTARY NOTATION .
17. COSATI CODES 18. SUBJECT TERMS (Continue on reverse if necessary and identify by block number)FIELD GROUP SUB-GROUP Biographical data (biodata),
- Military Academy.,emperament~ #/4 -. t~L,- -(Lq 1
1
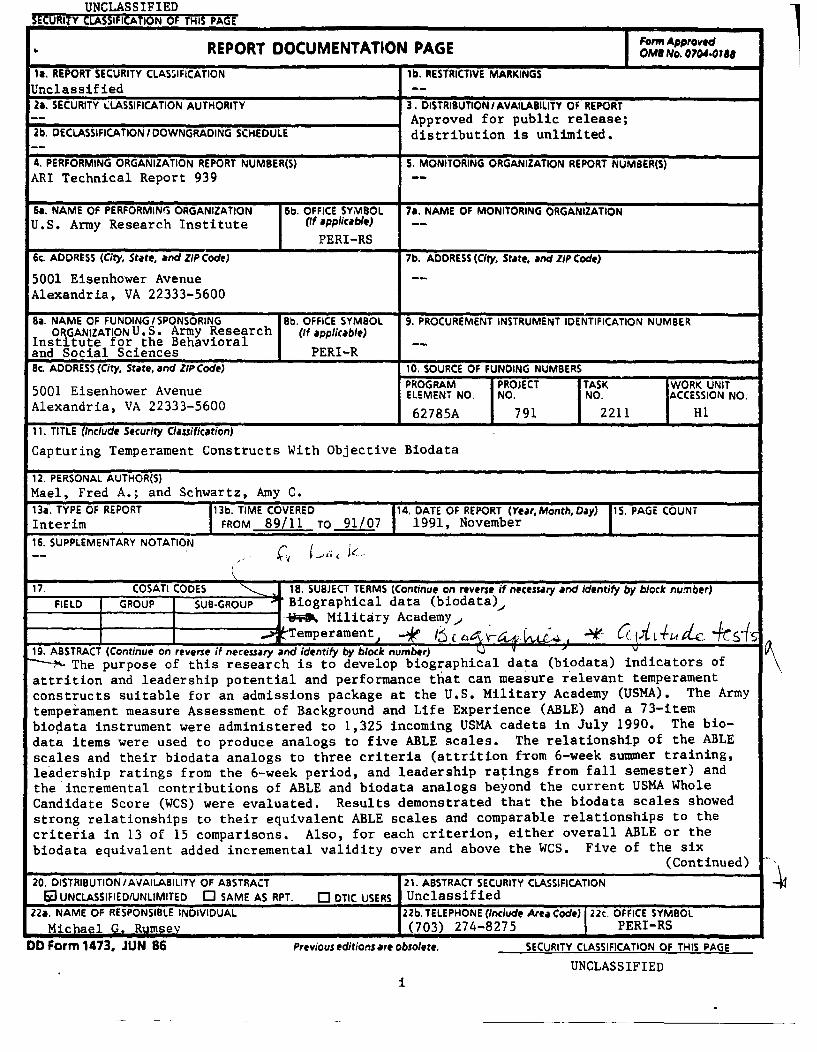
19, ABSTRACT (Continue on reverse if necessary and identify by block number)S The purpose of this research is to develop biographical data (biodata) indicators of
attrition and leadership potential and performance that can measure relevant temperament
constructs suitable for an admissions package at the U.S. Military Academy (USMA). The Armytemperament measure Assessment of Background and Life Experience (ABLE) and a 73-itembiodata instrument were administered to 1,325 incoming USMA cadets in July 1990. The bio-data items were used to produce analogs to five ABLE scales. The relationship of the ABLEscales and their biodata analogs to three criteria (attrition from 6-week summer training,leadership ratings from the 6-week period, and leadership ratings from fall semester) andthe incremental contributions of ABLE and biodata analogs beyond the current USMA WholeCandidate Score (WCS) were evaluated. Results demonstrated that the biodata scales showedstrong relationships to their equivalent ABLE scales and comparable relationships to thecriteria in 13 of 15 comparisons. Also, for each criterion, either overall ABLE or thebiodata equivalent added incremental validity over and above the WCS. Five of the six
(Continued)20. DISTRIBUTION /AVAILABILITY OF ABSTRACT 21. ABSTRACT SECURITY CLASSIFICATION
10 UNCLASSIFIED/UNLIMITED 0 SAME AS RPT. 0 DTIC USERS Unclassified22a. NAME OF RESPONSIBLE INDIVIDUAL 22b. TELEPHONE (Include Area Code) 22c. OFFICE SYMBOL
Michael G. Rumsev (703) 274-8275 PERI-RSDO Form 1473. JUN 86 Previous editions are obsolete. SECURITY CLASSIFICATION OF THIS PAGE
UNCLASSIFIED
UNCLASSIFIEDSECURITY CLASSIFICATION OF THIS PAOI(WhMa D&ta RnUeted)
ARI Technical Report 939
19. ABSTRACT (Continued)
biodata scales had significantly smaller correlations with a socialdesirability scale than the equivalent ABLE scale. The results demonstratethe potential role of a biodata measure in an admissions package as a versatileindicator of attrition and leadership ability. :ij
NNTIS G'RA&I.TS" ';'m"DTIC TAB
Unannoumo.4
Juyst ifr tiot
By . .
AveLiability Co•
lAvail aWc/6z,Dist S Special
UNCLASSIFIEDSECURITY CLASSIFICATION OF THIS PAGEr*?en Date Entered)
ii
Technical Report 939
Capturing Temperament ConstructsWith Objective Biodata
Fred A. Masi and Amy C. SchwartzU.S. Army Research Institute
Selection and Classification Technical AreaMichael G. Rumsey, Chief
Manpower and Personnel Research LaboratoryZita M. Simutis, Director
U.S. Army Research Institute for the Behavioral and Social Sciences5001 Eisenhower Avenue, Alexandria, Virginia 22333-5600
Office, Deputy Chief of Staff for PersonnelDepartment of the Army
November 1991
Army Project Number Manpower, Personnei, and Training20162785A791
Approved for public release; distrbution is unlimited.
FOREWORD
A primary objective of research task 2211HI of the U.S. Army Research Institute for theBehavioral and Social Sciences (ARI) is to provide enhancements to selection throughdevelopment and refinement of new measures.
The focus of this research is to develop biodata indicators of attrition from training andleadership potential and performance that will measure relevant temperament constructs andbe suitable for use in an admissions package at the U.S. Military Academy (USMA). Theresults of this phase of the research indicate that biodata scales can be used to provideindexes of attrition from training and leadership performance during a cadet's first 6 monthsat USMA. In addition, the biodata measures demonstrate properties in cadets that makethem more suitable for admissions than theit temperament counterparts. Moreover, thetemperament and biodata measures add incremental validity over and above that of measurescurrently used for admissions to USMA.
This research is the result of a collaborative effort between the Office of InstitutionalResearch (OIR) at USMA and ARI initiated in November 1989. The commander andresearchers at OIR have been apprised of research results on a continuous basis. Follow-upresearch will include cross-validation of results and additional measures of performance fromsubsequent stages of the cadets' tenure at USMA and in the officer corps.
EDGAR M. JOHNSONTechnical Director
ACKNOWLEDGMENTS
We would like to acknowledge the help of William Burke of the Office of InstitutionalResearch (OIR) at the U.S. Military Academy (USMA). Dr. Burke provided and continuesto provide sage advice and direction on all aspects of this research effort. Jane Richards andJackie Pittard also provided invaluable technical assistance. Additional thanks must go toColonel Patrick Toffler for his support of our efforts. We hope that our findings will beuseful for OIR and USMA in the future.
Leonard White's extensive experience with the Army ABLE, his methodologicalacumen, and his support were drawn upon regularly at all stages of this research. FrankErwin, Michael Mumford, and Richard Reilly were among a number of researchers andpractitioners who freely shared their expertise in the field of biodata. Michael Rumsey,Henry Busciglio, and Robert Kilcullen provided initial reviews of the paper. Their manyuseful suggestions have been incorporated.
vi
CAPTURING TEMPERAMENT CONSTRUCTS WITH OBJECTIVE BIODATA
EXECUTIVE SUMMARY
Requirement:
The purpose of this research is to develop biodata indicators of attrition from trainingand leadership potential and performance that will measure relevant temperamentconstructs, yet still be potentially suitable for use in an admissions package at the U.S.Military Academy (USMA).
Procedure:
The Army temperament measure Assessment of Background and Life Experience(ABLE) and a 73-item biodata instrument developed for this research were administered to1,325 members of the USMA Class of 1994. Criterion measures were attrition from the 6-week preliminary summer training period, leadership ratings from that summer period, andleadership ratings from the fall semester. The biodata items were coded in order to produceanalogs to the five ABLE scales in the research. The relationship of each ABLE scale and itsbiodata analog to each of the three criteria, as well as the incremental contributions of thetotal ABLE and its biodata analog over and above that of the currently used USMA WholeCandidate Score (WCS), were evaluated. In addition, the relative contribution of eachcomponent ABLE scale as an indicator for each criterion was assessed. Finally, thesusceptibility of both the ABLE and biodata scales to socially desirable responding wasinvestigated.
Findings:
The biodata scales showed strong relatiunships to their equivalent ABLE scales andsmaller relationships to the other ABLE ..Wales. When compared with the ABLE scalesregarding their relationship to the criteria, the biodata measures demonstrated comparablevalidities in 13 of 15 cases. Further, for each criterion, either overall ABLE or the biodataequivalent added incremental validity over and above the WCS. Four of the five individualbiodat, scales, as well as the overall biodata scale, had significantly smaller correlations with asocial desirability scale than the equivalent ABLE scale.
vii
Utilization of Findings:
The results of this research can be used to develop an indicator of attrition andleadership potential that will enhance the USMA admissions package. The research alsorefined the methodology for developing biodata analogs to temperament measures. Thismethodology will prove useful in ongoing investigations of the feasibility for using thesemeasures in officer and enlisted selection.
viii
CAPTURING TEMPERAMENT CONSTRUCIS WITH OBJECTIVE BIODATA
CQNTENTS
Page
INTRODUCTION ............................................................ 1
Research Problem: The Keying Dilemma ....................................... 1Tie Research Program at USMA .............................................. 2
Current USMA Admissions Procedures ......................................... 3The Arm y's ABLE ........................................................... 3What Makes Biodata Biodata? ......... . . . . . . . . . . . . . . . . . . . . . . . . . . . . . . . . . . . . . . . . 5D efining Biodata ............................................................ 6Biodata Item Attributes ....................................................... 7Sum m ary .................................................................. 10The USMA Research Effort ................................................... 10
M ETH O D . ................................................................. 11
Sqm ple .................................................................... 11Questionnaire Development ............................ ................... .. 11Keying Procedures and Strategies ............................................. 13Keying to ABLE Scales ...................................................... 14
RESULTS ................................................................... 15
ABLE and Bioabsum ........................................................ 15Interrelationships Among Predictors ........................................... 17Relationships to Six-Week Attrition ........................................... 18Relationships to Six-Week Leadership Ratings .................................. 19Relationships to Fall Semester Leadership Ratings ............................. 20Social Desirability Analyses .................................................. 21
D ISCU SSION ............................................................... 23
REFERENCES .............................................................. 27
APPENDIX: EXAMPLES OF EMPIRICAL KEYING EMPLOYED IN USMARESEARCH .......................................................... A-1
ix
CONTENTS (Continued)
Page
LIST OF TABLES
Table 1. Temperament scales by construct in the Assessment ofBackground and Life Experience (ABLE) ................................. 4
2. A taxonomy of biodata items ............................................ 8
3. Descriptive statistics and intercorrelations forABLE scales ......................................................... 16
4. Intercorrelations between ABLE-keyed biodata scalesand ABLE scales ..................................................... 16
5. Intercorrelations between ABLE, ABLE-keyed biodata(bioabsum), and current USMA predictors ............................... 17
6. Correlations of ABLE scales, biodata keyed to ABLE, and USMAattrition and leadership criteria ......................................... 20
7. Correlations ( 'ABLE scales, biodata keyed to ABLE, andUSMA predictors with ABLE validity (social desirability) scales ............. 22
CAPTURING TEMPERAMENT CONSTRUCTS WITH OBJECTIVE BIODATA
INTRODUCTION
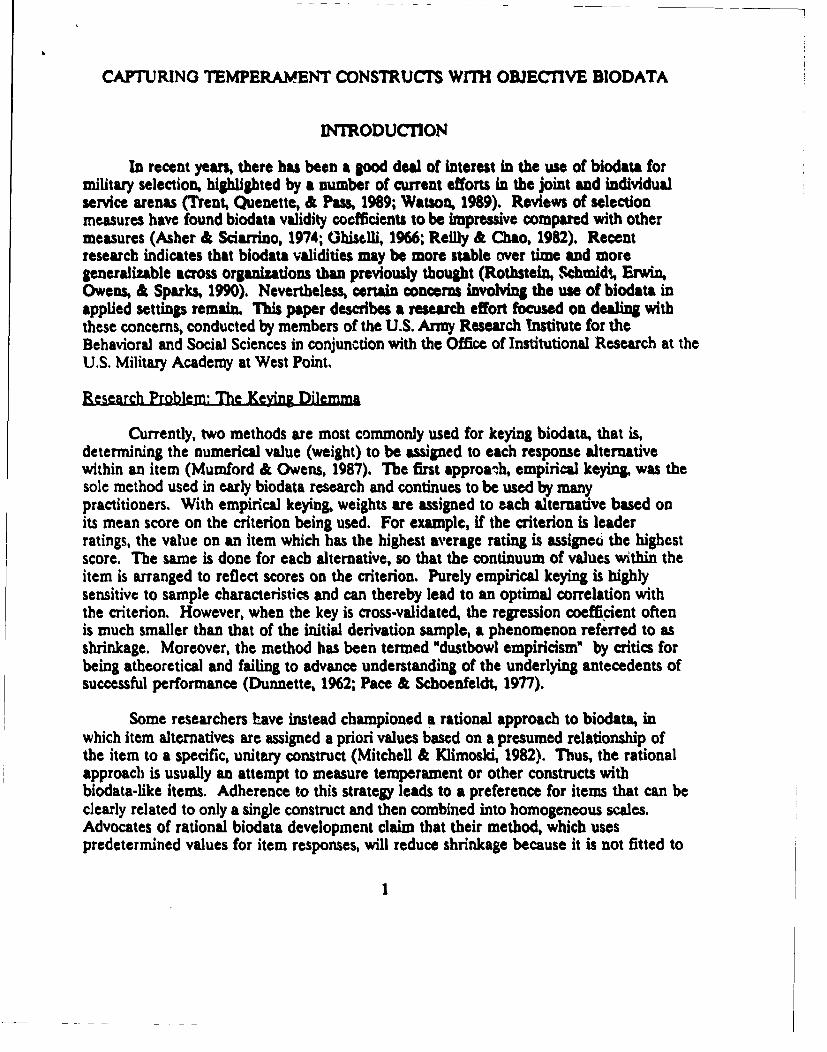
In recent years, there has been a good deal of interest in the use of biodata formilitary selection, highlighted by a number of current efforts in the joint and individualservice arenas (Trent, Quenette, & Pass, 1989; Watson, 1989). Reviews of selectionmeasures have found biodata validity coefficients to be impressive compared with othermeasures (Asher & Sciarrino, 1974; Ghiselli, 1966; Reilly & Chao, 1982). Recentresearch indicates that biodata validities may be more stable over time and moregeneralizable across organizations than previously thought (Rothstein, Shwidt, Erwin,Owens, & Sparks, 1990). Nevertheless, certain concerns involving the use of biodata inapplied settings remain. TMi paper describes a research effort focused on dealing withthese concerns, conducted by members of the U.S. Army Research !nstitute for theBehavioral and Social Sciences in conjunction with the Office of Institutional Research at theU.S. Military Academy at West Point.
Research Problem: The Keying Dilemma
Currently, two methods are most commonly used for keying biodata, that is,determining the numerical value (weight) to be assigned to each response alternativewithin an item (Mumford & Owens, 1987). The first approa-h, empirical keying, was thesole method used in early biodata research and continues to be used by manypractitioners. With empirical keying, weights are assigned to each alternative based onits mean score on the criterion being used. For example, if the criterion is leaderratings, the value on an item which has the highest average rating is assigne6 the highestscore. The same is done for each alternative, so that the continuum of values within theitem is arranged to reflect scores on the criterion. Purely empirical keying is highlysensitive to sample characteristics and can thereby lead to an optimal correlation withthe criterion. However, when the key is cross-validated, the regression coefficient oftenis much smaller than that of the initial derivation sample, a phenomenon referred to asshrinkage. Moreover, the method has been termed "dustbowl empiricism" by critics forbeing atheoretical and failing to advance understanding of the underlying antecedents ofsuccessful performance (Dunnette, 1962; Pace & Schoenfeldt, 1977).
Some researchers have instead championed a rational approach to biodata, inwhich item alternatives are assigned a priori values based on a presumed relationship ofthe item to a specific, unitary construct (Mitchell & Klimoski, 1982). Thus, the rationalapproach is usually an attempt to measure temperament or other constructs withbiodata-like items. Adherence to this strategy leads to a preference for items that can beclearly related to only a single construct and then combined into homogeneous scales.Advocates of rational biodata development claim that their method, which usespredetermined values for item responses, will reduce shrinkage because it is not fitted to
I
sample-specific idiosyncracies. A possible problem with this approach, however, is thatresponses to complex, heterogeneous behaviors would also have to be coded in terms ofsingle constructs, even if they were really a function of multiple infiaences. Also, bymaking a priori decisions about item directionality across any or all criteria, thepossibility that a certain behavior will be beneficial for some outcomes andcounterproductive for others is generally downplayed.
In recent years, another issue has surfaced. Many researchers have expressedconcern about the possibility of socially desirable responding and faking on self-reportmeasures, notably temperament measures (Crowne & Marlowe, 1960; Hough, Eaton,Dunnette, Kamp, & McCloy, 1990; Paulhus, 1984). While the same concern has beenexpressed about biodata, one proposed solution has been to limit biodata to objectiveand verifiable items. This presents a problem for those advocating rational keying, inthat objective and verifiable actions tend to be heterogenous (determined by multiplecauses) and therefore difficult to attribute to a single temperament. Conversely,adherence to this strategy would eliminate the use of subjective, homogenous items.Because researchers using the rational approach do not limit themselves to objective,historical and/or verifiable items, their measures are often indistinguishable fromtemperament scales, and may be more fakable than empirically keyed biodata.
In this research effort, an attempt was made to gain the conceptual benefits ofrational methods, while gaining the less fakable properties associated with objective,verifiable biodata. Specifically, an attempt was made to key verifiable biodata directly totemperament scales, and then use those scales rationally with multiple criteria. Thoughno attempt was made to assign items exclusively to a single construct, the goal was todetermine if biodata scales could be utilized to parallel individual temperament scales.A secondary concern, if this method constitutes an optimal use of objective biodata itemscompared with some form of direct empirical keying, is to be covered in subsequentresearch.
The Research Program at USMA
Leadership research has been an abiding interest of the U.S. Military Academy(USMA) at West Point for many years (Page, 1934). A current example of thisemphasis is the Leadership Development Project, an ongoing research effort, approvedin March, 1988, and directed by the USMA Office of Institutional Research (0IR). Thestated goals of the project are to a) improve measurement of candidate leader potential,b) improve measurement of cadet leadership performance, and c) measure contributionsof USMA graduates to the comr,)n defense. In late 1989, OIR and the U.S. ArmyResearch Institute (ARI) decided to jointly pursue their mutual interest in working onthe first of these goals.
USMA uses a three-pronged approach to selection, attempting to find candidateswho will excel academically, physically, and militarily. As officer military excellence is
2
largely defined as the ability to lead others, measurement of leadership potential andperformance is a priority. OIR/USMA felt that although candidate academic andphysical capabilities were adequately measured, improved measurement of leadershippotential was possible. In addition, while SAT scores have had a strong, demonstratedrelationship to academic attrition, interest was expressed in finding better indicators ofnonacademic attrition.
Current USMA Admissions Procedures
Currently, an important indicator of candidate potential used in the admissionsdecision at West Point is based 60% on an applicant's standardized test scores (i.e., SAT,ACT) and graduating rank in high school; 30% on the Leadership Potential Score (LPS),derived from the School Official Evaluation (an evaluation form filled out by high schoolinstructors), and the Candidate Activities Record (CAR), a checklist of extracurricularactivities and varsity sports; and 10% on scores on the Physical Aptitude Examination(PAE). This information is combined in a weighted composite known as the WholeCandidate Score (WCS). The information on the CAR is similar to that on a biodatainstrument. However, scoring keys were based on content validity judgments of USMApersonnel rather than on criterion-related validity judgements. This raised the possibilitythat an alternative approach might yield higher relationships with relevant outcomemeasures.
In conjunction with the Leadership Development Project, OIR exploredapproaches toward improving USMA's selection procedures with two goals in mind. Thefirst was to attempt to capture motivational indicators of leadership performance, withthe possible goal of including these measures in future admissions packages. The secondwas to explore empirical methods of scoring new and existing inventories of previousbehaviors and experiences. Accordingly, OIR/USMA suggested that ARI administer abiodata questionnaire, as well as ABLE, an Army temperament measure, in order toaccomplish these goals. The next section describes ABLE, the Army's temperament test,and its role in the current project. The following section defines what a biodata measureis, especially in contradistinction to a temperament measure, and describes the guidelinesconsidered in the development of the USMA biodata measure. Finally, the specificapproach and goals of this research are outlined.
The Armoy's ABLE
The Assessment of Background and Life Experiences (ABLE), is a temperamentmeasure developed and validated by the U.S. Army Research Institute as part of a long-term research program called Project A, which was designed to revalidate the ArmedServices Vocational aptitude battery (ASVAB) and design supplementary tests measuringadditional constructs. ABLE was included in Project A to capture the motivationalelement of performance ("will do"), as opposed to the ability ("can do") element. ABLE
3
is also under consideration in the Joint Services arena as part of a measure ofadaptability to military life.
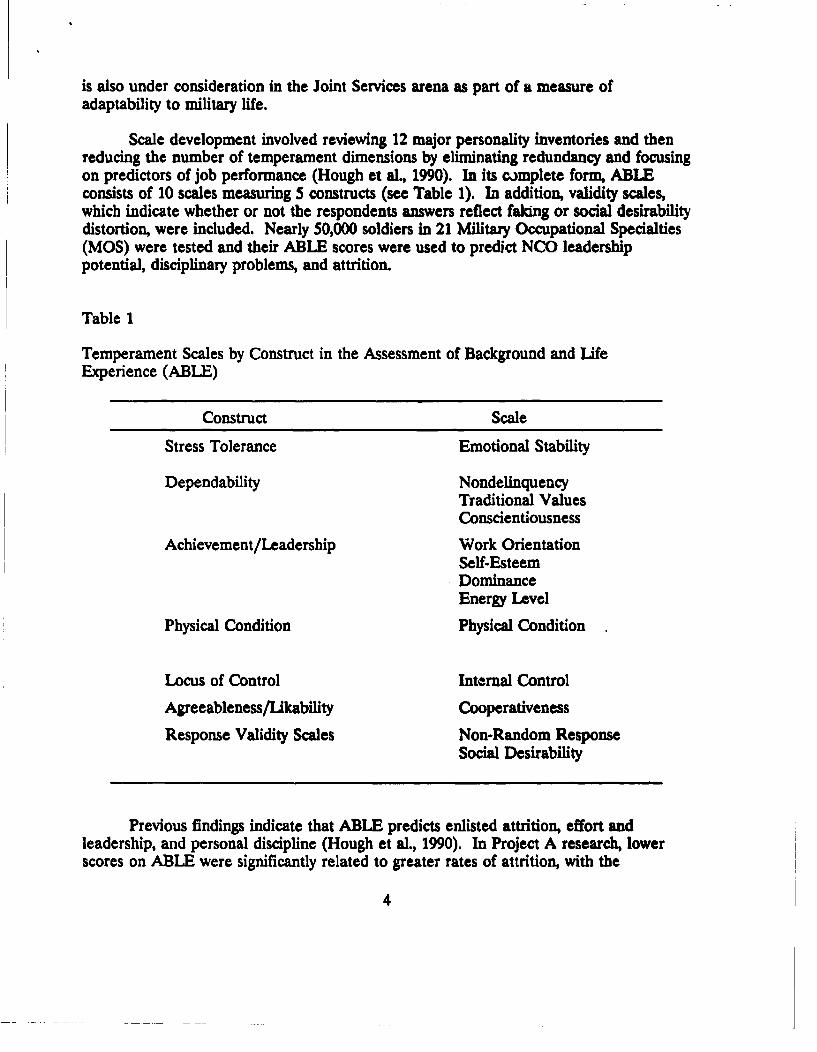
Scale development involved reviewing 12 major personality inventories and thenreducing the number of temperament dimensions by eliminating redundancy and focusingon predictors of job performance (Hough et al., 1990). In its complete form, ABLEconsists of 10 scales measuring 5 constructs (see Table 1). In addition, validity scales,which indicate whether or not the respondents answers reflect faking or social desirabilitydistortion, were included. Nearly 50,000 soldiers in 21 Military Occupational Specialties(MOS) were tested and their ABLE scores were used to predict NCO leadershippotential, disciplinary problems, and attrition.
Table 1
Temperament Scales by Construct in the Assessment of Background and LifeExperience (ABLE)
Construct Scale
Stress Tolerance Emotional Stability
Dependability NondelinquencyTraditional ValuesConscientiousness
Achievement/Leadership Work OrientationSelf-EsteemDominanceEnergy Level
Physical Condition Physical Condition
Locus of Control Internal Control
Agreeableness/Likability Cooperativeness
Response Validity Scales Non-Random ResponseSocial Desirability
Previous findings indicate that ABLE predicts enlisted attrition, effort andleadership, and personal discipline (Hough et al., 1990). In Project A research, lowerscores on ABLE were significantly related to greater rates of attrition, with the
4
relationship most pronounced among those scoring low on ABLE (White, Nord & Mael,1990). ABLE was also related to probability of graduation of USMA graduates andother trainees at the Ranger school course. In addition, the Achievement construct ofABLE was found to be a significant predictor of effort and leadership (for the WorkOrientation scale, uncorrected r - .23). Other scales which significantly predicted effortand leadership included Dominance, Energy Level, and Emotional Stability. Finally, theABLE Dependability construct significantly predicted discipline problems among enlistedsoldiers, with (uncorrected) validities ranging from 23 to .29 for the three Dependabilityscales. ABLE was thus seen as an attractive measure of adaptability because itspecifically addressed dominance and leadership proclivities, and because of itsdocumented relationship to prediction of attrition, indiscipline, and leader potentialamong NO~s.
However, ABLE has potential drawbacks for use in an enlistment or admissionspackage. One is the fear of extensive faking and socially desirable responses. ABLE is arelatively transparent test, with no attempt to obscure desirable responses, and withvirtually all items arranged in a linear continuum of desirability. In a previousadministration with enlisted soldiers, faking has not contaminated ABLE's validity(Hough, et al., 1990). However, the fear of faking would be increased in an admissionssituation, where the instrument is often taken at home under the tutelage of parents andother advisors. A second concern was that some ABLE items concerned somewhatintrusive and "psychological" topics, such as physical symptoms, fears, anxieties, andfeelings of depression and failure. USMA researchers felt that these types of items couldbe resented, thus driving away capable candidates.
Therefore, the researchers sought to determine if ABLE constructs could bemeasured with more palatable biodata items. Given that a biodata measure was sought.,pecifically because of the qualities distinguishing it from temperament measures, itbecame crucial to define the unique characteristics of biodata, as well as how they differfrom temperament measures. The guidelines which emerged from this effort aredescribed next.
What Makes Biodata Biodata?
There is considerable controversy regarding the criteria for specifying thedomain and attributes of biodata items (Asher, 1972; Gandy, Outerbridge, Sharf, & Dye,1989; Henry, 1965; Stricker, 1987). In addition, while some have attempted todifferentiate biodata items from temperament, attitude, or interest items (Guthrie, 1944;Mumford & Owens, 1987), in practice, many items termed "biodata" are indistinguishablefrom self-report temperament items (Crosby, 1990). It is not uncommon to find itemsabout internal states, opinions, and reactions to hypothetical situations included inbiodata measures. The result has been a continued blurring of what constitutes biodata.
5
The confusion is especially problematic in light of claims that biodata scales aremore resistant to social desirability distortion (Telenson et al., 1983) and generallyachieve higher validities (Asher, 1972; Reilly & Chao, 1982) than temperamentmeasures. However, this may be true only of certain types of biodata, such as verifiableitems. It is therefore worthwhile to enumerate the attributes that have been used todefine biodata and differentiate it from other self-report measures.
Definina Biodata
Biodata items attempt to measure previous and current life events which haveshaped the behavioral patterns, dispositions, and values of the person. Owens has statedthat "one of our most basic measurement axioms holds that the best predictor of what aman will do in the future is what he hs done in the past" (1976, p. 625). It is presumedthat a person's outlook is affected by life experiences and that each experience has thepotential to make subsequent life choices more or less desirable, palatable, or feasible.One possible reason is that the focal experience reinforces a pattern of behavior.Alternatively, the focal experience may be partly or wholly determined by earlier causaldeterminants- genetic, dispositional, or learned- which account for variations in bothearlier and current behavior.
Moreover, every experience or series of experiences which conceivably categorizes(or stigmatizes) a person has the potential to shape that person's behavioral patterns,though each component's influence is mitigated by the effects of all other identifications.Thus, when a person associates with a team, club, school, or any other "psychologicalgroup," the person takes on (to varying degrees) the aspirations, preferences, values, andself-perceptions which are endemic to group members. Even negative categorizations(e.g., the inability to swim, ride a bike, or drive a car at the same age as classmates), orso-called "input variables" (Owens & Schoenfeldt, 1979), such as place of upbringing, sizeof high school, and parental occupation, could place the person in a self-perceivedcategory with a specific profile.
From a biodata perspective, therefore, previous events and experiences are notonly indications of underlying dispositions, but are themselves seen as shaem ofsubsequent behavior. By contrast, temperament measures primarily attempt to capturesomewhat stable dispositional tendencies. Thus, the typical temperament item asks therespondent direct questions about dispositions. Alternatively, a temperament item mayinfer the construct from tendencies evident in narrowly focused reactions to past andcurrent events, or from expressed responses to hypothetical and future situations. Whenreactions are sampled, they are seen merely as outcomes of the pre-existingtemperament.
In summary, the realm of biodata is more inclusive than temperament in terms ofcontent, in that it includes behavioial antecedents and indicators of skills, abilities, andtemperaments (Mumford & Stokes, 1991). Conversely, because biodata items attempt to
6
measure only events and behaviors that have definitely occurred, many researchers haveargued that biodata items be more restrictive in their attributes than temperament ones.The attributes fall into two categories: those that aim at increasing the accuracy of theinformation generated as biodata, and those that seek to limit the domain of biodatacontent on legal or ethical grounds. These attributes are drawn partly from an earliertypology by Asher (1972), and includes new categories mentioned previously by others(Barge, 1987; Stricker, 1987). They have been reviewed in depth by Mael (in press), andare summarized below. Examples of each attribute appear in Table 2.
Biodata Item Attributes
Historical versus hypothetical. Biodata items should pertain solely to historialevents, events which have taken place, or continue to take place. This would excludeitems about behavioral intentions or about presumed behavior in a hypothetical situation.This appears to be the core attribute of biodata items.
External versus Internal. Some have argued that biodata items should deal withexternal, though not necessarily publicly seen, actions. This would exclude items aboutthoughts, attitudes, opinions, and unexpressed reactions to events. Items about what oneWically does in situations could be considered historical and external. While theexternal attribute, as well the objective and verifiable attributes mentioned below, havebeen ignored by a number of researchers (e.g. England, 1971; Glennon, Albright, &Owens, 1966; Russell, Mattson, Devlin & Atwater, 1990), each may be crucial to claimsof greater freedom from distortion for biodata compared to temperament scales.
Objective and First-hand versus Subjective. Some who endorse the externalattribute also feel that biodata should be gbiective recollections, requiring only thefaculty of recall. Subjective interpretation of events, such as assessing if one wasdisappointed, angry, or depressed in a given situation, would not fit this attribute.Evaluation of one's qualities or performance relative to that of others also would beconsidered subjective. A corollary would be that biodata items ask only for the fsL-han knowledge of the respondent, as opposed to estimation of how others (peers,parents, teachers) would evaluate one's performance or temperament, which involves anadditional level of speculative subjectivity.
Discrete versus Summary Actions. Methodologically, it may be preferable tofocus on discret actions, dealing with a single, unique behavior (e.g., age when receiveddriver's license), as opposed to summary responses (e.g. average time spent studying).Responses to summary items also require computation or estimation and increase thechance of inaccuracy. However, with a regularly performed behavior, summary recallcould be more realistic and accurate than recall of a single, arbitrarily chosen instanve.
"7
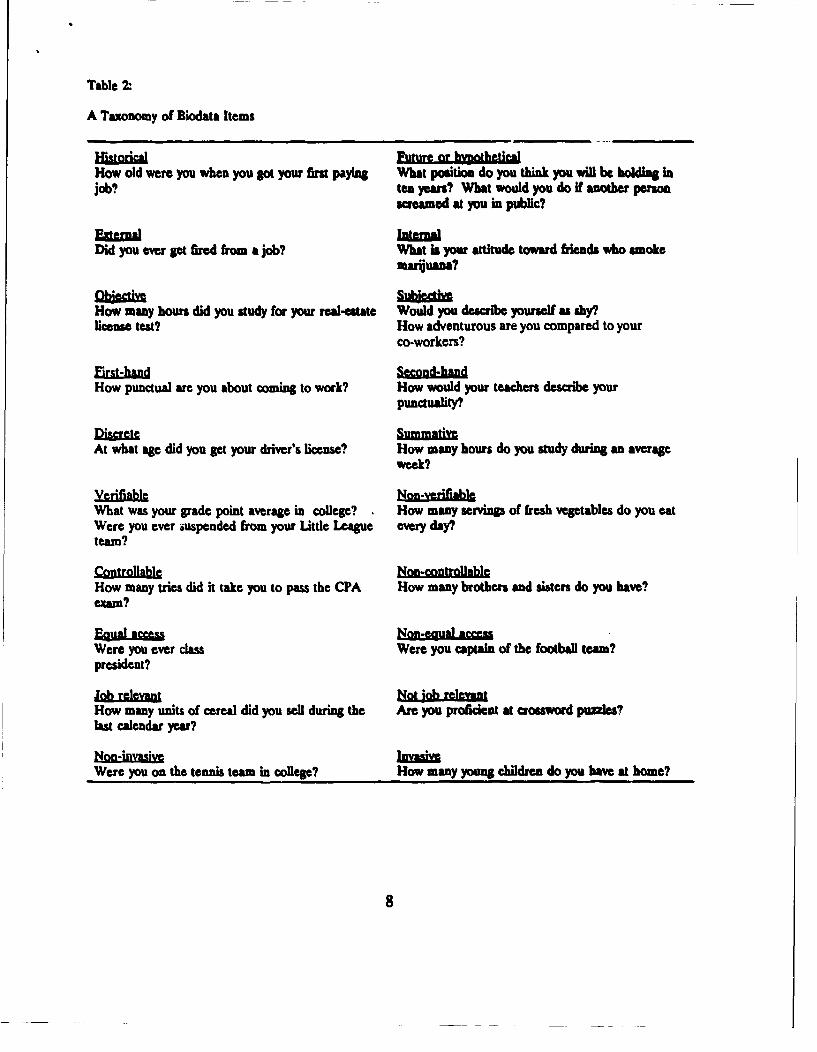
Table 2:
A Taxonomy of Biodata Items
Hka" Future or hvntLblheHow old were you when you got your first paying What position do you think you will be holding injob? ten years? What would you do If another person
screamed at you in public?
Did you ever get fired from a job? What is your attitude toward frends who smokemarijuana?
How many hours did you study for your real-estate Would you descnrbe yourself as shy?license test? How adventurous are you compared to your
co-workers?
First-hand k add dHow punctual are you about coming to work? How would your teachers describe your
punctuality?
At what age did you get your driver's license? How many hours do you study during an averageweek?
What was your grade point average in college? How many servings of fresh vegetables do you catWere you ever auspended from your Little League every day?team?
COnIEDUAb No-cntI1QUablHow many tries did it take you to pass the CPA How many brothers and sisters do you have?exam?
Were you ever class Were you captain of the football team?president?
Job relevant Not ialevntHow many units of cereal did you sell during the Are you proficient at crossword puaJes?last calendar year?
Were you on the tennis team in college? How many young children do you have at home?
8
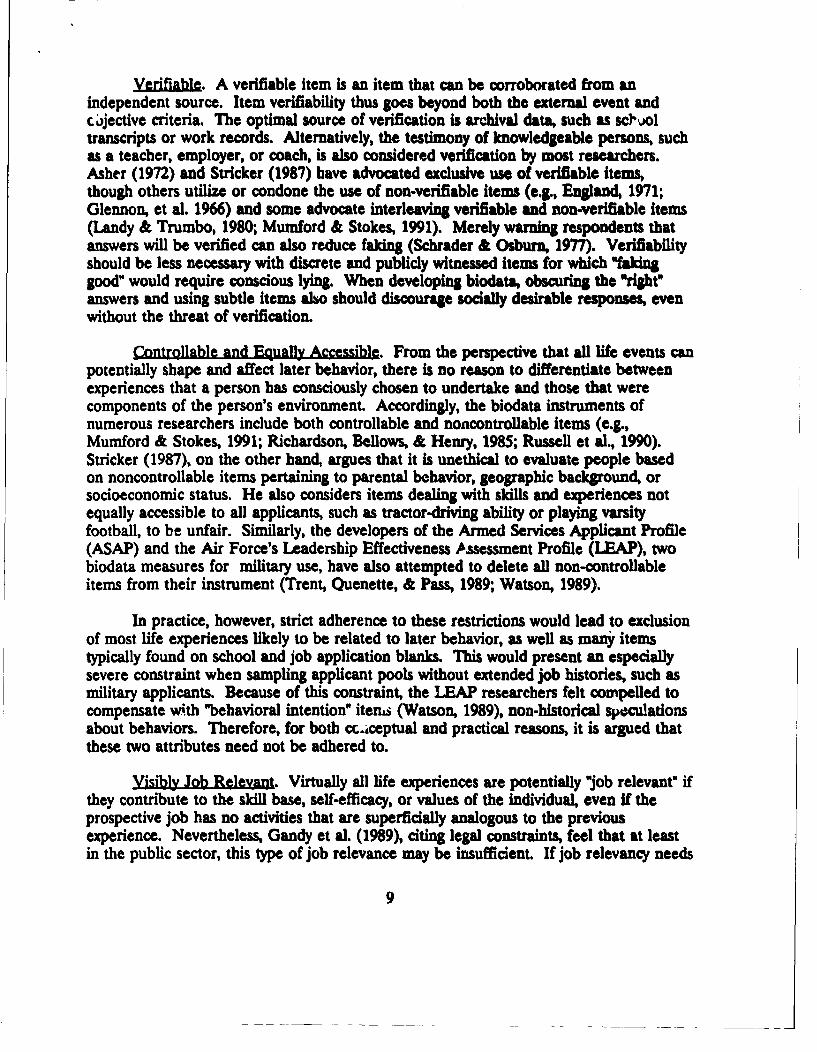
rfii. A verifiable item is an item that can be corroborated from anindependent source. Item verifiability thus goes beyond both the external event andc jective criteria. The optimal source of verification is archival data, such as scJ.,oltranscripts or work records. Alternatively, the testimony of knowledgeable persons, suchas a teacher, employer, or coach, is also considered verification by most researchers.Asher (1972) and Stricker (1987) have advocated exclusive use of verifiable items,though others utilize or condone the use of non-verifiable items (e.g., England, 1971;Glennon, et al. 1966) and some advocate interleaving verifiable and non-verifiable items(Landy & Trumbo, 1980; Mumford & Stokes, 1991). Merely warning respondents thatanswers will be verified can also reduce faking (Schrader & Osburn, 1977). Verifiabilityshould be less necessary with discrete and publicly witnessed items for which "fakinggood" would require conscious lying. When developing biodata, obscuring the "right"answers and using subtle items also should discourage socially desirable responses, evenwithout the threat of verification.
Controllable and Equally Accessible. From the perspective that all life events canpotentially shape and affect later behavior, there is no reason to differentiate betweenexperiences that a person has consciously chosen to undertake and those that werecomponents of the person's environment. Accordingly, the biodata instruments ofnumerous researchers include both controllable and noncontrollable items (e.g.,Mumford & Stokes, 1991; Richardson, Bellows, & Henry, 1985; Russell et al., 1990).Stricker (1987), on the other hand, argues that it is unethical to evaluate people basedon noncontrollable items pertaining to parental behavior, geographic background, orsocioeconomic status. He also considers items dealing with skills and experiences notequally accessible to all applicants, such as tractor-driving ability or playing varsityfootball, to be unfair. Similarly, the developers of the Armed Services Applicant Profile(ASAP) and the Air Force's Leadership Effectiveness Assessment Profile (LEAP), twobiodata measures for military use, have also attempted to delete all non-controllableitems from their instrument (Trent, Quenette, & Pass, 1989; Watson, 1989).
In practice, however, strict adherence to these restrictions would lead to exclusionof most life experiences likely to be related to later behavior, as well as many itemstypically found on school and job application blanks. This would present an especiallysevere constraint when sampling applicant pools without extended job histories, such asmilitary applicants. Because of this constraint, the LEAP researchers felt compelled tocompensate with "behavioral intention" items (Watson, 1989), non-historical speculationsabout behaviors. Therefore, for both cciceptual and practical reasons, it is argued thatthese two attributes need not be adhered to.
Visibly Job Relevant. Virtually all life experiences are potentially "job relevant" ifthey contribute to the skill base, self-efficacy, or values of the individual, even Kf theprospective job has no activities that are superficially analogous to the previousexperience. Nevertheless, Gandy et al. (1989), citing legal constraints, feel that at leastin the public sector, this type of job relevance may be insufficient. If job relevancy needs
9
to be narrowly defined as showing face valid job pertinence then the domain of u16relevant items would be severely limited. Moreover, paradoxically, items which fit thenarrowest d•rinition of job relevant would be the most transparent and most fakable.
Invasion of privaq. A final concern, which pertains to afl self-report items,involves invasion of prlvaq. Many items pertaining to topics such as national origin,religious or political affiliation, or financial status, may fall afoul of Federal, state, orlocal privacy protection laws (Arvey, 1983; Gandy et al, 1989; Van Rijn, 1980).Genuinely intrusive questions, such as those dealing with sexual behavior, bodilyfunctions, or specific religious and ethnic practices, are also likely to incur resistance andresentment and thereby encourage willful faking, random responding, or other behavioraimed at foiling the testers. Unfortunately, the parameters of intrusiveness and invasionof privacy have yet to be defined clearly in the literature.
Summa
The core attribute of a biodata item is that it addresses an historical event orexperience. The rationale is that previous events shape the behavioral patterns,attitudes, and values of the person, and combine with individual temperaments to definethe person's identity. Other attributes, though not defining biodata, may have theadvantage of minimizing social desirability distortion. These include limiting items tothose regarding external events, those requiring only objective, first-hand recollection,and those pertaining to verifiable events. Items involving discrete, unique events mayalso be preferred when appropriate. Exclusive use of controllable and equally accessibleitems, as well as items narrowly defined as "job relevant" should not be required unlesslegally mandated. While clearly intrusive items are offensive and probablycounterproductive, definition of invasiveness remains unclear.
Because of concerns about faking associated with subjective items, the items usedin the current research effort were all historical, external, objective, and first-person, andprimarily verifiable, at least in principle. Both controllable and non-controllable itemswere used, and "relevance" was of necessity defined broadly. Attempts were made toavoid invasive or otherwise inflammatory items.
The USMA Research Effort
As mentioned above, OIR researchers sought to determine if temperamentconstructs, specifically those in the ABLE, could be measured with biodata items withoutloss of validity. To do this, ABLE scales deemed most appropriate for the USMAcandidate pool were selected. Next, biodata items were developed which would bekeyed to the appropriate ABLE scales. Because ABLE's relationship with enlistedattrition and leadership potential has been demonstrated, linking biodata to the ABLE
10
could determine l)if the same relationships hold for cadets, 2) whether the ABLEconstructs could be adequately measured by objective, verifiable biodata items, and 3)under these conditions, would the ABLE and the biodata only account for the samevariance in attrition and leadership, or would each contribute uniquely to accounting forvariance in these criteria.
Also, as opposed to other attempts at rational biodata development, the currentapproach takes advantage of the possibility that the behaviors or events behind eachbiodata item may be a result of or an antecedent of several different temperaments. Forexample, family birth order may be predictive of both dominance and emotional stability,while classroom performance may be related to work orientation and energy. Themultidimensionality of objective life events, although problematic for the typicaltemperament scale, is an important feature of biodata which should be capitalized upon,rather than ignored. Conversely, perhaps keying Eint to ABLE constructs, and thenusing the predetermined key without reference to the criterion, would show greaterimmunity to shrinkage than that typical of empirically keyed biodata.
In summary, there were a number of important purposes for administering bothABLE and biodata at West Point. First, the feasibility of using objective and verifiablebiodata items to measure temperament constructs was explored. Second, keying biodatato ABLE was examined as a quasi-rational approach which would enable the use of anempirically derived biodata measure without the shrinkage in validities often associatedwith criterion-keyed measures. Third, biodata and temperament analogs were comparedin terms of their relationship with attrition and leadership, as well as their vulnerabilityto faking. Finally, the incremental contribution of both ABLE and the biodata analogsover and above that of the Whole Candidate Score currently used at West Point wasexamined.
METHOD
The incoming USMA Class of 1994 served as the sample for this research. Theclass was made up of 1338 plebes, of which 1325 participated. Of the 1325, 1164 (88%)were men and 161 were women. The incoming class represented approximately 10% ofthe total applicants, so that the subjects are a select group, with expected restriction ofrange on many of the variables.
QOustionnaire lDeelopment
The complete questionnaire was administered in July, 1990, shortly after theirarrival at West Point. Three measures were included in the questionnaire:
11
Biodata questionnaire. A 73-item biographical data questionnaire was developedfor this research. A number of the items or Item topics appeared in previous biodataforms (England, 1971; Glennon et &l., 1966; Richardson et aL, 1985), while others weredeveloped expressly for this research. Items were included if they addressed behaviorsor events seen as relating to: (1) the criteria of interest, with leadership performance asthe primary criterion, and attrition from USMA as the secondary one; (2) the ABLEtemperaments included in the research, especially Dominance; or (3) aspects of militaryadaptability and other constructs not covered on the version of the ABLE being used.Those falling into the last category included interpersonal style, preference for ruggedpastimes, and quality of familial structure and relationships.
There were a number of constraints involved in item development. First, asmentioned above, preference was to be given to objective and verifiable behaviors, evenwhen the conceptual relationship to the constructs was more tenuous. Second, unlikebiodata measures used to predict adult c.uccess in work situations, the subjects in thisresearch did not have diecly applicable "work experience" as either soldiers orcommanders, so that the option of fitting items to a detailed job analysis was notfeasible. Third, test administration had to be accomplished within tight time constraints,thus forcing the abandonment of numerous potentially useful items.
Hundreds of items were reviewed for potential inclusion in the questionnaire,from which an initial pool of 124 items were developed. Subsequently, 30 items whichwere perceived as intrusive or likely to generate hostility from the respondents weredropped, which had the effect of minimizing coverage of some temperaments, notablyEmotional Stability. The remaining 94-item questionnaire was then shortened to 66items because of time constraints during a subsequent, cross-validation administration.
An additional seven items came from a 97-item extracurricular activity and sportsparticipation checklist used previously in Air Force research. The checklist asked aboutleadership roles in 22 different high school extracurricular organizations or activities, andparticipation and leadership in 25 varsity sports. Because of low variances on a numberof activities and sports, as well as cross-validation time constraints, the activiiies itemsand 18 of the sports in the extracurricular activities section were dropped from the cross-validation measure and from further analysis. For each of the seven remaining sportsitems, questions about sport participation, having lettered in the sport, and teamcaptaincy were combined into a single item. Thus, the final 73-item biodata measurewas made up of 66 of the potentially best items from the 94-item version, as well as 7sports items from the 97-item activity and sports inventory.
Am.L An 88-item version of ABLE was assembled for this research. Themeasure included the following scales: a 21-item Emotional Stability scale; a 10-itemDependability scale, here composed primarily of items dealing with endorsement oftraditional values, as opposed to other forms of ABLE, which also includenondelinquency items in the Dependability construct; a 14-item Work Orientation scale;
12
a 12-item Dominance scale; and an 18-item Energy scale. An 11-item Validity scale,designed to detect persons whose responses are consistently contaminated with sociallydesirable and/or dishonest responses (Hough el al., 10), was also included.
In addition, the selection measures currently used at USMA were included in theresearch for the purpose of determining the incremental contribution of ABLE and thebiodata. The primary measure is the weighted composite called the Whole CandidateScore. However, other WCS components were also evaluated Individually against thecriteria, in order to isolate the determinants of success on each criterion. These werescores on the SAT (V + M combined), high school rank, the Leadership Potential Score(LPS), and the Physical Aptitude Examination (PAE), all of which were describedearlier.
Keying Procedures and Strategies
In keying the biodata, a balance was struck between the rational and empiricalapproaches. While rational, a priori keying assumes that relationships between item andcriteria should be intuitively obvious, an empirical strategy allows for less obvious andmore complex relationships to be uncovered. However, an overly empirical approachcould lead to the coding of items in illogical ways that are unlikely to be replicated infuture samples. For this reason, a number of experienced practitioners commonly usesome judgement in empirical keying. Based on consultations with some practitioners,including Mumford (personal communication), the following strategies for logicallytempering "dustbowl empiricism" with a more theoretical "rainforest empiricism" (Mael,in press) emerged.
One issue concerns the correct keying of non-continuous items, such as "Which ofthese courses did you enjoy most?". The experts advised treating each responsealternative as a separate item, so that those choosing "Math" were contrasted with allothers, as were those choosing "English*, "Science", etc. The reasoning is that the exactconfiguration of the five choices may be too idiosyncratic to be replicated consistently,thus leading to increased shrinkage upon cross-validation. When two or morealternatives form a logical subset, they would of course be combined, and contrasted as aunit to the other options. Thus, a non-continuous item with five alternatives couldactually be used as up to five separate items (Hogan & Stokes, 1989).
Another common problem regards items that contaif, alternatives chosen by fewpeople. For example, in the question "How much sleep do you need per night?", if only3% of subjects respond "5 hours or less" to the question, the mean associated with thatresponse will likely be unreliable. Therefore, for the present research, alternativeschosen by less than 10% of the sample were considered low frequency alternatives, andtreated in one of two ways. If the item was continuous, as in the example above, thelow-frequency response was combined with an adjacent response. In this example, the
13
"5 hours or less" response group would be merged with the "6-7 hours" response group toform one category. With a non-continuous item, low frequency responses were coded "1"and set at the mean, or, in the case of dichotomous coding, set to the same value as therest of the "other" category. In both these cases, these adjustments would minimize thecorrelations with the criterion, but would be expected to provide more conservative andstable indications of underlying relationships. Items having overall poor variance (i.e.lacking at least two response choices each endorsed by 10% of the respondents)inevitably did not correlate with any criteria, and therefore had to be droppedcompletely.
Another issue involves possible illogical keying of items based on strictempiricism. For example, in the item "How many years did you play varsity chess in highschool?", suppose that the criterion means for responses on this sample were 2.8 ("not atall"), 3.1 ("1 year"), 3.4 (2 years"), 3.0 (3 years"), and 3.7 ('4 years'). Using a strictempirical key, one would have to assign a lower value to 3-year participation than 1 or 2year participation. However, barring a compelling post-hoc theory, one would probablyassume a sample-specific quirk, especially if the sample was only moderate-sized. Ratherthan code it this way and incur significant shrinkage, a more logical approach would beto fit this response within the continuum and accept a smaller derivation samplecorrelation in return for a more stable estimate of true population values.
Keving to ABLE Scales
In the current research, keying to ABLE was empirical, although a good deal ofthe logical discretion described above was used in assigning weights. Keying of items toeach ABLE scale involved several steps. First, means on the ABLE scale for eachbiodata item response were calculated. Next, a 0, 1, or 2 was assigned to each responsealternative. If the response fell within .05 of the mean, it was considered to be at themean and was assigned a value of 1. Responses with means greater than .05 above themean were assigned a 2 while responses with means greater than .05 below the meanwere assigned a 0. If no responses were more than .05 away from the mean but twoheavily-endorsed responses were further than .05 from each other, those responses werecoded 0 and 1 or 1 and 2, depending on whether the higher or lower choice was closer tothe mean. Based on advice from other practitioners, options were limited to 0, 1, and 2,even if a 4 or 5-point continuum was feasible. Examples of keying items in this mannerare presented in Appendix A.
Once all items were coded in this way, they were correlated with each ABLEscale. Items with significant correlations of at least .075 with a scale were used to createeach of five ABLE-equivalent biodata scales. This .07-.08 value was indicated byMumford (personal communication) as generally being the minimum threshold forstability upon cross-validation. The five scales were: Bio-Emotional Stability (22 items);Bio-Dependability (27 items); Bio-Work Orientation (32 items); Bio-Dominance (57
14
items); and Bio-Energy (40 items). As mentioned above, the item pools for each scalewere not mutually exclusive, and no attempt was made to derive factorially distinctscales.
Finally, a biodata composite for the whole ABLE was created. To do this, thebest codings of each item, regardless of which ABLE-keyed scale they had come from,were utilized to form a composite, representing the best of the five temperament-keyedscales. The resultant 75 item scale was called Bioabsum.
Criterion Mure. Three criterion measures were used for this research. Thefirst was attrition from the initial six-week basic training period known colloquially as"Beast Barracks", which takes place before the onset of classes. The second was ratingsof demonstrated leadership capability, which were also collected at the end of the six-week training period. The third criterion was ratings of demonstrated leadershipcapability, which were collected at the end of the first semester of classes in December,1990. Although the leadership rating scales for the six-week and fall periods wereidentical, the moderate correlation between the two measures (: = .35), as well asevidence of differential relationships with the predictors, served as compelling groundsnot to combine the ratings or treat them as repeated measures of the same criterion.
RESULTS
ABLE and Bioabsum
Descriptive statistics for the five ABLE scales used in this research are shown inTable 3.
The intercorrelations between the ABLE scales are also shown in Table 3. AllABLE reliabilities were in the acceptable range, and were comparable to those inprevious ABLE research.
The correlations between each of the biodata scales keyed to ABLE scales andthe ABLE scales appear in Table 4. The correlation between the composite biodatascale Bioabsum and the overall ABLE also appears in Table 4. As can be seen, thecorrelations between each ABLE scale and its equivalent biodata scale range between.37 and .53. The only off-diagonal correlations between ABLE scales and the biodatascales of other ABLE scales that were o. similar magnitude were those between Bio-Dependability and ABLE Work Orientation (r =.50) and between Bio-Enery andABLE Dominance (r - .39).
15
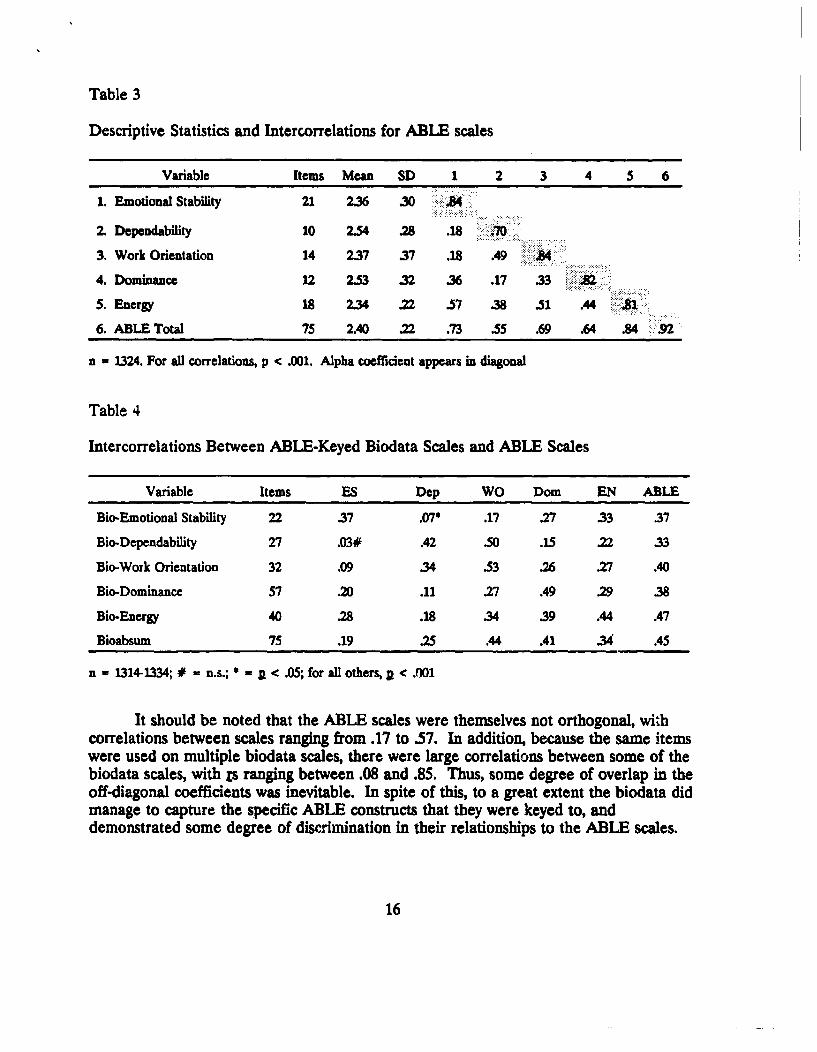
Table 3
Descriptive Statistics and Intercorrelations for ABLE scales
Variable Items Mean SD 1 2 3 4 5 6
1. Emotional Stability 21 2.36 .30 .84
2. Dependability 10 2.54 .28 .18 .70: .. ...:.: :... ; :: ....... .... .. ..
3. Work Orientation 14 2.37 .37 a1 .49 4
4. Domac 12 2.53 32 36 .17 33
5. Energy 18 2.34 .22 .57 M3 .51 .44 9.-1
6. ABLE Total 75 2.40 .22 .73 .55 .69 .64 .4 .92
n w 1324. For all correlations, p < .001. Alpha coefficient appears in diagonal
Table 4
Intercorrelations Between ABLE-Keyed Biodata Scales and ABLE Scales
Variable Items ES Dep WO Dom EN ABLE
Bio-Emotional Stability 22 .37 ,07" .17 .27 .33 .37
Bio-Dependability 27 .03# .42 .50 .15 .22 33
Bio-Work Orientation 32 .09 .34 .53 .26 .27 .40
Bio-Dominance 57 20 .11 .27 .49 29 38
Bio-Energy 40 28 .18 .34 .39 .44 .47
Bioabsum 75 .19 .25 .44 .41 .3 .45
n = 1314-1334; # = n.s.; = < .05; for all others, V < .001
It should be noted that the ABLE scales were themselves not orthogonal, withcorrelations between scales ranging from .17 to .57. In addition, because the same itemswere used on multiple biodata scales, there were large correlations between some of thebiodata scales, with ts ranging between .08 and .85. Thus, some degree of overlap in theoff-diagonal coefficients was inevitable. In spite of this, to a great extent the biodata didmanage to capture the specific ABLE constructs that they were keyed to, anddemonstrated some degree of discrimination in their relationships to the ABLE scales.
16
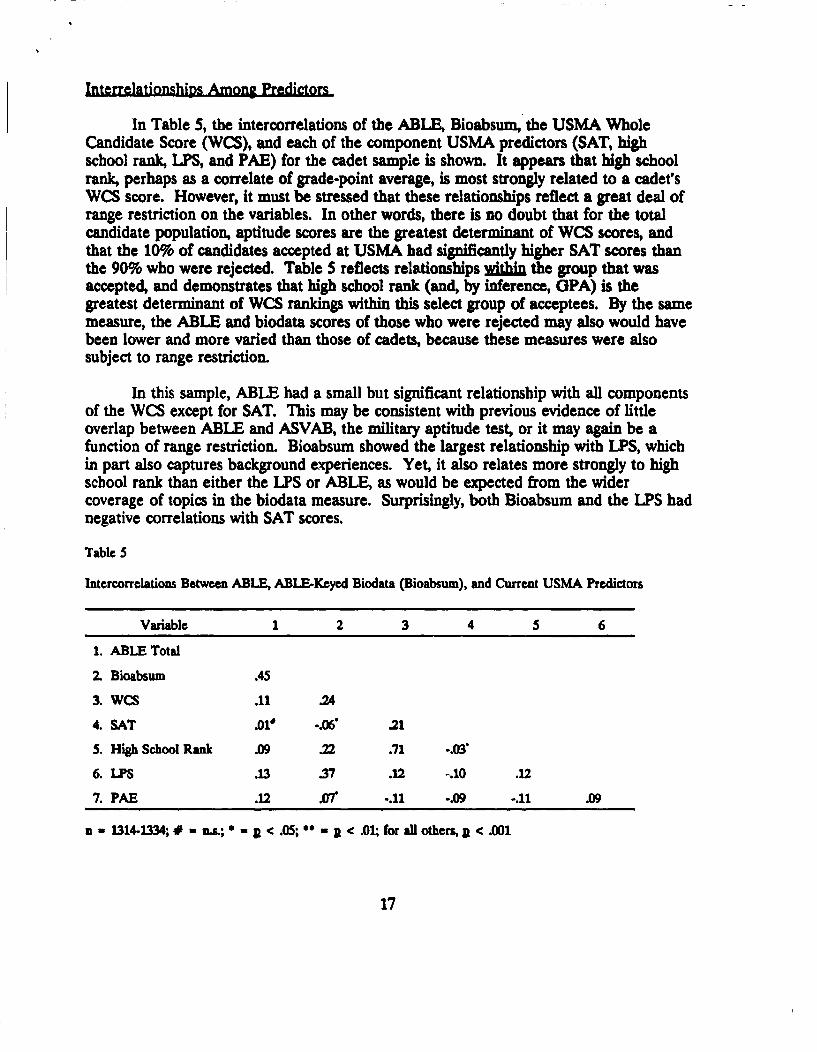
Interrelationships Among Predictors
In Table 5, the intercorrelations of the ABLE, Bioabsum, the USMA WholeCandidate Score (WCS), and each of the component USMA predictors (SAT, highschool rank, LPS, and PAE) for the cadet sample is shown. It appears that high schoolrank, perhaps as a correlate of grade-point average, is most strongly related to a cadet'sWCS score. However, it must be stressed that these relationships reflect a great deal ofrange restriction on the variables. In other words, there is no doubt that for the totalcandidate population, aptitude scores are the greatest determinant of WCS scores, andthat the 10% of candidates accepted at USMA had significantly higher SAT scores thanthe 90% who were rejected. Table 5 reflects relationships wthin the group that wasaccepted, and demonstrates that high school rank (and, by inference, GPA) is thegreatest determinant of WCS rankings within this select group of acceptees. By the samemeasure, the ABLE and biodata scores of those who were rejected may also would havebeen lower and more varied than those of cadets, because these measures were alsosubject to range restriction.
In this sample, ABLE had a small but significant relationship with all componentsof the WCS except for SAT. This may be consistent with previous evidence of littleoverlap between ABLE and ASVAB, the military aptitude test, or it may again be afunction of range restriction. Bioabsum showed the largest relationship with LPS, whichin part also captures background experiences. Yet, it also relates more strongly to highschool rank than either the LPS or ABLE, as would be expected from the widercoverage of topics in the biodata measure. Surprisingly, both Bioabsum and the LPS hadnegative correlations with SAT scores.
Table 5
Intercorrelations Between ABLE, ABLE-Keyed Biodata (Bioabsum), and Current USMA Predictors
Variable 1 2 3 4 5 6
1. ABLE Total
2. Bioabsum .45
3. WCS .11 .24
4. SAT .01 -.06' .21
5. High School Rank .09 .22 .71 -.03
6. LPS .13 .37 .12 -.10 .12
7. PAE .12 or -.11 -.09 -.11 .09
n - 1314-1334; # - na.; < = < .05; -= .01; for all others, V < .001
17
Relationships to Six-week Attrition
The correlations between the ABLE scales, the equivalent biodata scales, theUSMA predictors, and six-week attrition appear in Table 6. It should be noted thatbecause attrition was a dichotomous criterion measure, and there was less than 10%attrition in the sample, the maximum correlation possible was .55, as explained byNunnally (1978, p. 146). Nevertheless, each of the ABLE scales was related to attrition,with the relationships for Emotional Stability, Dependability, and Energy Level beinghighest. Each of the biodata scales was related to attrition as well. None of the ABLEscales had a significantly higher or lower relationship to attrition than the equivalentbiodata scale.
Currently, USMA does not utilize any measure to anticipate six-week attrition.Thus, strictly speaking, the WCS was not developed as an indicator of attrition fromcadet basic training. However, as it is the current USMA basis for selection, it is ofinterest to compare the performance of the WCS and its components to that of theABLE and biodata. In contrast to the ABLE and biodata, the WCS was not related toattrition for this sample. This may be explained by the dominant influence of highschool rank, which had a negative, non-significant relationship to attrition, on WCSvariance in this sample. The SAT, LPS, and PAE had small, significant relationshipswith attrition, though they did not equal those of ABLE total or Bioabsum, nor those ofthe most powerful ABLE and Biodata scales.
Incremental Validily of ABLE and Biodata. A series of multiple regressions wasperformed to determine the incremental contributions of the ABLE and biodata scalesto accounting for attrition over and above the WCS. Both the ABLE and Bioabsumwere found to have incremental validity when entered separately. By contrast, the WCSdid not account for significant variance when entered with either the ABLE orBioabsum. When all three were entered together, only the ABLE was individuallysignificant, thus demonstrating considerable overlap between ABLE and biodata whenkeyed in this fashion.
The contribution of individual ABLE and biodata scales, over and above theWCS, was also evaluated in order to pinpoint the temperaments that played the biggestrole in successfully accounting for variance in the criterion. For six-week attrition, eachABLE scale made a significant contribution when entered separately with WCS.However, when entered together, the Emotional Stability and Dependability scales werethe only ones to have significant beta weights.
In order to do the same assessment for the biodata scales, it was necessary to firstmerge scales with extremely high intercorrelations in order to avoid multicollinearity. Asnoted earlier, the biodata scales shared items and thus inevitably overlapped at times,even though keyed differentially. Thus, Bio-Dependability and Bio-Work Orientation
18
- .85) were merged, as were Bio-Emotional Stability and Bio-Energy (r -. 71). Whenentered separately with WCS, each combined biodata scale, as well as Bio-Dominance,provided incremental value. When entered together, however, only the Bio-EmotionalStability/Energy combination showed a significant individual contribution. When ABLEwas also entered, however, no biodata analog was significant.
Relationships to Six-week Leadership Ratings
The correlations of the ABLE scales, the equivalent biodata scales, and theUSMA predictors with six-week leader ratings appear in Table 6. Each of the ABLEscales was related to leadership performance, with the relationships for EmotionalStability, Dominance, and Energy Level being highest. In a departure from the othercriteria, two of the biodata scales, Bio-Dependability and Bio-Work Orientation, did nothave a significant relationship with the criterion. Using the formula for comparingcorrelations of two variables with a third variable found in Cohen and Cohen (1983, p.56-57), it was determined that in these two cases, the correlations for the biodata scaleswere significantly lower than those of the equivalent ABLE scales. Each of the otherbiodata scales, as well as Bioabsum, was related to attrition, although Bioabsum'srelationship with the ratings was clearly pulled down by the inclusion of Bio-Dependability and Bio-Work Orientation items. The result was that Bioabsum'scorrelation with the criterion was significantly lower than that of ABLE (t1• = 3.21,
<.01).
Once again, the WCS was not related to the criterion. The same was true of SATand high school rank. Conversely, the PAE had a significant relationship to the ratings,while the LPS had a smaller, but still significant, relationship as well.
Incremental Validity of ABLE and Biodata. An identical series of multipleregressions was performed to determine the incremental contributions of the ABLE andbiodata scales over and above the WCS. Both the ABLE and Bioabsum providedincremental validity when entered separately. By contrast, the WCS did not account forsignificant variance when entered with either the ABLE or Bioabsum. When all threewere entered together, only the ABLE had a significant value.
Each ABLE scale made a significant contribution when entered separately withWCS. However, when entered together, the Emotional Stability scale was the only oneto have a significant beta weight.
19
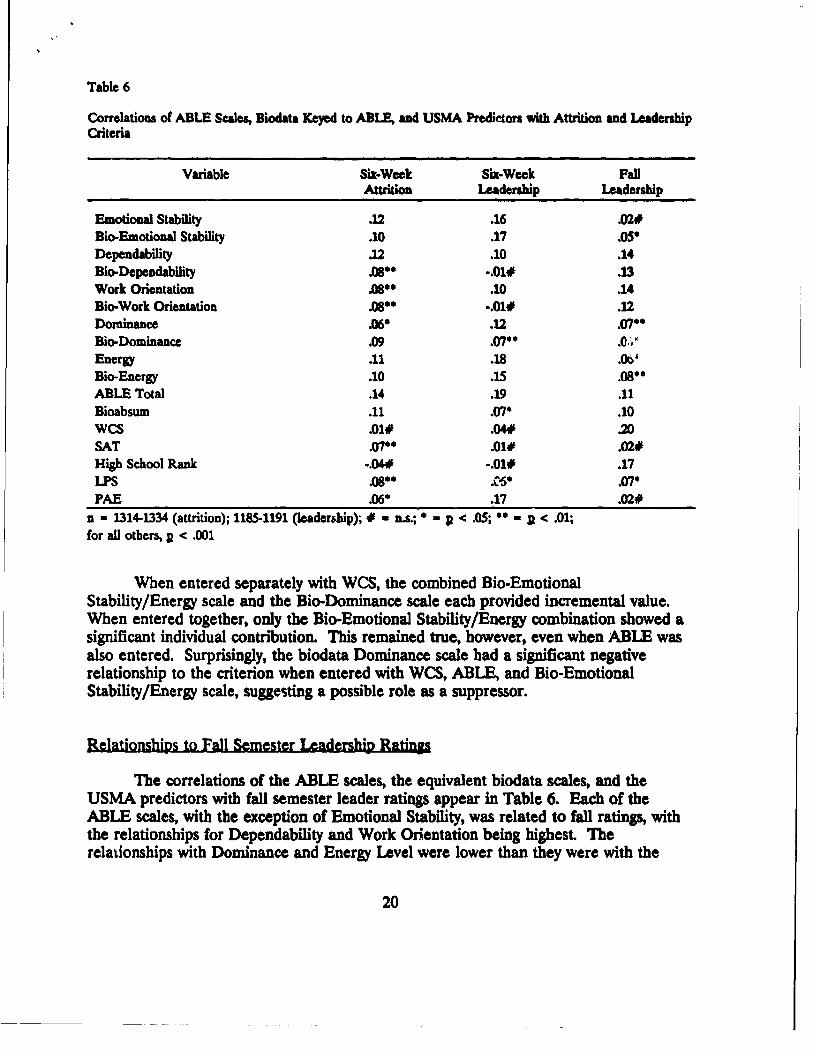
Table 6
Correlations of ABLE Scales, Biodata Keyed to ABLE, and USMA Predictors with Attrition and LeadershipCriteria
Variable Six-Week Six-Week FallAttrition Leadership Leadership
Emotional Stability .12 .16 .02#Bio-Emotional Stability .10 .17 .05*Dependability .12 .10 .14Bio-Dependability .08"* -.01# .13Work Orientation .08" .10 .14Bio-Work Orientation .08" -.01# .12Dominance .06" .12 .070*Bio-Dominance .09 .07** .0. )Energy .11 .18 .06Bio-Energy .10 .15 .080"
ABLE Total .14 .19 .11Bioabsum .11 .07* .10WCS .01# .04# .20SAT .070* .01# .02#High School Rank ..04# -.01# .17LPS .08** Cj* .07*PAE .06" .17 .02#
a = 1314-1334 (attrition); 1185-1191 (leadership); # - n.s.; -= < .05; i t < .01;for all others, R < .001
When entered separately with WCS, the combined Bio-EmotionalStability/Energy scale and the Bio-Dominance scale each provided incremental value.When entered together, only the Bio-Emotional Stability/Energy combination showed asignificant individual contribution. This remained true, however, even when ABLE wasalso entered. Surprisingly, the biodata Dominance scale had a significant negativerelationship to the criterion when entered with WCS, ABLE, and Bio-EmotionalStability/Energy scale, suggesting a possible role as a suppressor.
Relationships to Fall Semester Leadership Ratinf
The correlations of the ABLE scales, the equivalent biodata scales, and theUSMA predictors with fall semester leader ratings appear in Table 6. Each of theABLE scales, with the exception of Emotional Stability, was related to fall ratings, withthe relationships for Dependability and Work Orientation being highest. Therelationships with Dominance and Energy Level were lower than they were with the
20
other criteria. By contrast, each of the biodata scales, including Bio-Emotional Stability,was related to these leadership ratings. In each case, the relationship to the ratings wascomparable to that of the equivalent ABLE scale, with no statistically 4nificantdifferences. Overall ABLE and Bioabsum also showed their closest proximity to eachother with this criterion.
In contrast to the previous criteria, WCS had the strongest relationship of anypredictor to the fall ratings. The correlation between high school rank and the fallratings was also higher than that of any ABLE or biodata scales. The LPS had a smallbut significant relationship with fall ratings, while the SAT and PAE did not
Incremental Validity of ABLE and Biodata The same series of multipleregressions were performed with this criterion. Both the ABLE and Bioabsum werefound to add incremental validity when entered separately with WCS. As opposed to theprevious criteria, when Bioabsum and ABLE were entered together without WCS, thebiodata scale added significantly to the coefficient. Once again, though, when enteredwith both ABLE and WCS, Bioabsum did not add significant variance. In this instance,WCS also accounted for significant variance when entered with either ABLE orBioabsum, or with both together. Apparently the redundancy of Bioabsum derives frompartial overlap with both ABLE and WCS, rather than from extensive overlap withABLE.
Three ABLE scales (Dependability, Work Orientation, and Dominance) madesignificant contributions to WCS when entered separately. However, when enteredtogether, only Dependability had a significant beta weight. When the biodata scaleswere entered separately with WCS, Bio-Emotional Stability/Energy alone providedincremental value. Entered simultaneously, however, none provided a significantcontribution, demonstrating the possibility of still more multicollinearity.
Social Desirability Analyses
Table 7 shows the correlation between the ABLE validity (social desirabilitydetection) scale and each of the ABLE scales, as well as the overall ABLE. The samecorrelations are shown for the biodata scales keyed to each ABLE scale, and the overallABLE composite (Bioabsum). In each cast, the correlation with social desirability forthe ABLE scale was significantly higher ban the correlation for the equivalent biodatascale (Emotional Stability, t•., - 230, p < .05; Dependability, tin - 2.34, p < .05;Work Orientation, tw, - 6.12, p < .01; Energy, tur - 3.51, p < .01; overall ABLEversus Bioabsum, t,= - 6.12, p < .01). The sole exception was Dominance, for whichboth the ABLE and biodata scales had small relationships to the social desirability scale.
21
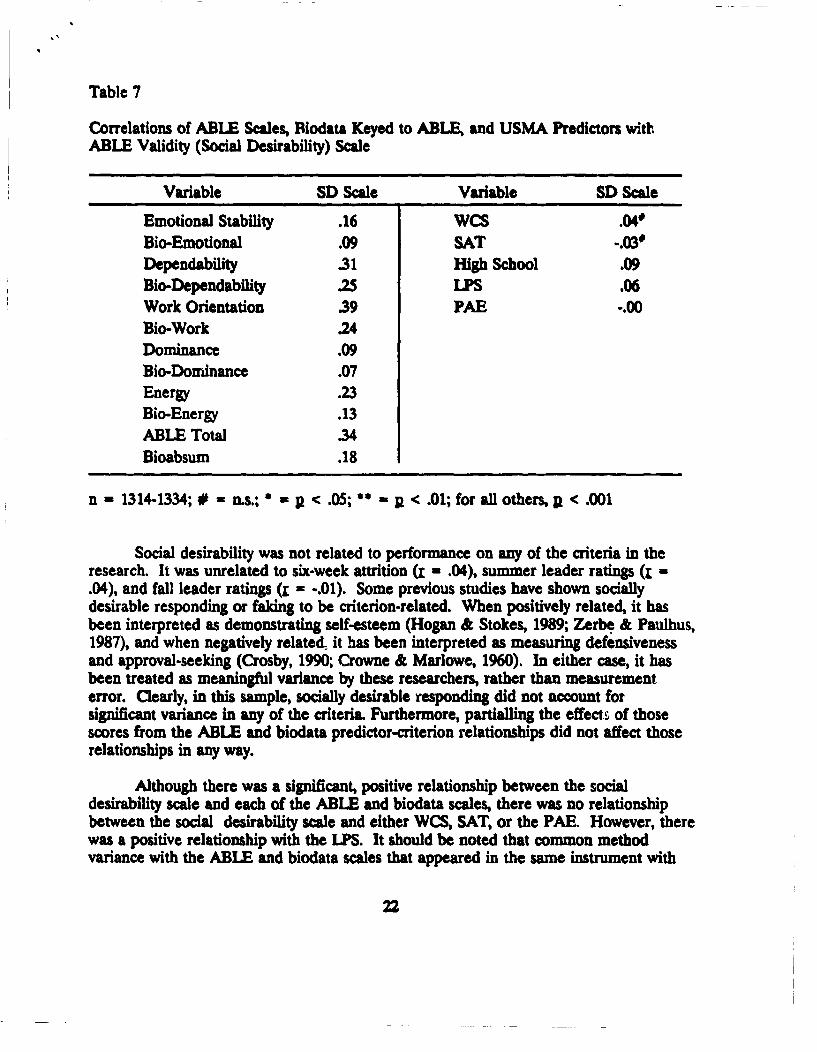
Table 7
Correlations of ABLE Scales, Biodata Keyed to ABLE, and USMA Predictors withABLE Validity (Social Desirability) Scale
Variable SD Scale Variable SD Scale
Emotional Stability .16 WCS .040Bio-Emotional .09 SAT 430Dependability 31 High School .09Bio-Dependability .25 LPS .06Work Orientation .39 PAE -.00Bio-Work .24Dominance .09Bio-Dominance .07Energy .23Bio-Energy .13ABLE Total .34Bioabsum .18
n = 1314-1334; # - n.s.; - -c .05; R < .01; for all others, R < .001
Social desirability was not related to performance on any of the criteria in theresearch. It was unrelated to six-week attrition (r - .04), summer leader ratings (I ..04), and fall leader ratings (L - -.01). Some previous studies have shown sociallydesirable responding or faking to be criterion-related. When positively related, it hasbeen interpreted as demonstrating self-esteem (Hogan & Stokes, 1989; Zerbe & Paulhus,1987), and when negatively related, it has been interpreted as measuring defensivenessand approval-seeking (Crosby, 1990; Crowne & Marlowe, 1960). In either case, it hasbeen treated as meaningful variance by these researchers, rather than measurementerror. Clearly, in this sample, socially desirable responding did not account forsignificant variance in any of the criteria. Furthermore, partialling the effectk of thosescores from the ABLE and biodata predictor-criterion relationships did not affect thoserelationships in any way.
Although there was a significant, positive relationship between the socialdesirability scale and each of the ABLE and biodata scales, there was no relationshipbetween the social desirability scale and either WCS, SAT, or the PAE. However, therewas a positive relationship with the LPS. It should be noted that common methodvariance with the ABLE and biodata scales that appeared in the same instrument with
22
the validity scale would exaggerate their relationships. Surprisingly, the relationship withhigh school rank was positive and comparable to that of some of the biodata sales, eventhough the USMA high school rankinp were not derived from self-report sources.
DISCUSSION
The current research effort was conducted under a number of severe constraints.First, because incoming cadets rather than applicants were sampled, the range ofvariance on all predictor variables was sharply restricted. The attrition criterion measurewas also restricted, limiting the maximum correlation coefficient to .55. Second, althoughtypical biodata inventories often have 200-300 items, time constraints in the USMAsetting, especially in the cross-validation effort, limited the researchers to 73 items.Third, the item pool was limited to external, objective, and mainly verifiable items inorder to render the instrument potentially usable for admissions. Finally, the age andlack of military experience of the cadets made it impossible to measure directly "job-relevant"previous experiences.
In spite of these limitations, the findings of this research were highly encouraging.Five biodata scales were created to parallel temperament scales from the Army ABLE.In each case, the biodata scales showed a clear relationship to the equivalent ABLEscale and almost always a smaller relationship to the other ABLE scales. The biodatascales were also compared with the ABLE scales in their relationship to each of threecriterion measures. Out of a total of 15 such comparisons, the biodata measures had astatistically smaller relationship to the criterion in only two cases. In some cases, thebiodata scales actually had a slightly higher relationship to the criterion. These resultsdemonstrate that it is possible to develop objective biodata measures that will besubstantially analogous to valid temperament measures, even under the aforementioned"onstraints.
Furthermore, with each criterion, either overall ABLE or Bioabsum (the biodata,,ivalent) added incremental validity over and above the WCS measure currently used
by USMA. For two of the criteria, Bioabsum was redundant with ABLE and did notacce- nt for additional variance, while for the third Bioabsum had a lesser overlap.Ins. 'ir as the biodata were keyed to maximize their relationship with ABLE scales inthis research, this redundancy is desirable. The resudts do not preclude the possibilitythaL the biodata, keyed directly to the criterion, would show less overlap with ABLE andaccount for more variance in the criteria. Results of empirical keying were not includedin this report because of the need to properly cross-validate empirical keys.
Moreover, another anticipated benefit of using biodata analogs, that of reducingvulnerability to socially desirable responding, was also realized. Four of the fiveindividual biodata scales, as well as the overall biodata scale, had a significantlysmaller correlation with the ABLE validity scale than the equivalent ABLE scale. Thus,while socially desirable responding did not seem to contaminate relationships of the
23
predictors to the criteria, the use of objective blodata does seem to provide a possibleminimization of the faking problem. Once again, the present research does not precludethe possibility thut biodata keyed directly to the criterion would show less vulnerability tosocially desirable responding than either a temperament scale or even the same biodatakeyed to a temperament scale. In fact, initial indications from empirical keying of thesescales suggest that this is so.
The results are also useful in pinpointing which temperament factors are mostimportant in determining early success at West Point. Cadets who attrited during thesix-week training tended to be especially lower in stress tolerance (emotional stability)and in the endorsement of traditional values (dependability). The cadet who succeeds incompleting initial training period may tolerate stress, and be willing to accept authorityand regzmentation, to a greater degree than peers who choose to leave USMA at thatstage. Among those who did not attrit, cadets rated hghest in leadership performanceduring the six-week training period were also distinguished most dearly by their greateremotional stability and stress tolerance. Finally, dependability, again in the sense ofendorsement of traditional values, had the strongest relationship of all temperaments toleadership behavior in the ratings from the fall semester.
One of the puzzling results of this research was the relatively minor role played bythe temperament construct referred to as dominance. Although it was related to bothleadership criteria, dominance was never the primary predictor of either training or fallsemester leadership ratings. It is possible that because the primary role of the plebe isto be a good team player, rather than to direct other cadets in the accomplishment oftheir duties, the importance of dominance does not become apparent until later in thecadet's career. It would be important to obtain criterion measures from a cadet's lasttwo years at USMA before dismissing the role of dominance.
The relatively low relationship between summer and fall leadership ratingsillustrate that summer and fall performance represent two components of the cadetleader role, rather than repeated measures of the same construct. In support of thispremise, it can be seen that the PAE is among the best predictors of summer leadershipratings, yet had a non-significant relationship to fall ratings. Conversely, high schoolrank is strongly related to fall ratings, yet unrelated to summer ratings. Seemingly,successful summer performance is associated with excellent physical conditioning andstress tolerance, which is also manifested in high energy level, while success in the fallsemester relates strongly to previous academic achievement and dependability. However,the degree to which leadership propensity or ability accounts for variance in each of thesettings, given the aforementioned lack of actual leadership opportunities for new plebes,is unclear. These discrepant results suggest the need to evaluate the temperament andbiodata measures against leadership scores throughout the four-year USMA experience,as well as beyond.
24
In summary, the results of the current research suglest a usefual role for biodata esan indicator of success at USMA. Additional research is needed to substantiate andelaborate on these finding First, the biodata need to be keyed empirically to each ofthe criteria, and the results compared to the findings of the current effort. In this way, itcan be determined if keying biodata to temperament scales is an optimal or counter-productive use of biodata. Second, the research needs to be replicated, in order toevaluate the stability of the biodata-to-ABLE keys, as well as to cross-validate theempirical keys. This replication is currently underway. Finally, additional effort must bemade to relate these temperament and blodata measures to more longitudinal measuresof leadership success. In this way, the full value of intesrating temperament and biodatainto USMA admissions can be determined.
25
'S
REFERENCES
Arvey, R. D. (1983). Fairness In selectin" emlovesM. Readlnk. MA: Addison-Wesley.
Asher, J. J. (1972). TIe biographical item: Can it be improved? E&ann-mel Pchaoing,U 251-269.
Asher, J. J., & Sciarrino, J. A. (1974). Realistic work sample tests: A review. ECuQudSxdId .21519-533.
Barge, B. N. (1987), Characteristics of biodata items and their relationship to validity.Paper presented at the 95th annual meeting of the American PsychologicalAssociation, NY, NY.
Cohen, J., & Cohen, P. (1983). Applied multiple rearession/ orrelation analysis for thebehavioral sciences (2nd edition). Hillsdale, N1J: Lawrence Erlbaum.
Crosby, M. M. (1990). Social desirability and biodata: predicting sales success. Paperpresented at the fifth annual conference of the Society for Industrial andOrganizational Psychology, Miami Beach, Florida.
Crowne, D. P., & Marlowe, D. (1960). Te aprovl motie New York: Wiley.
Dunnette, M. D. (1962). Personnel management. Annual Review of Psycbolgo• 285-313.
England, 0. W. (1971). Development and use of weighted apcpliation blAnks (Rev. Ed.).Minneapolis: University of Minnesota, Industrial Relations Center.
Gandy, J. A., Outerbridge, A. N., Sharf, J. C., and Dye, D. A. (1989). Develoment andinitial validation of the Individual Achievement Record. Washington, IC: U.S.Office of Personnel Management.
Ghiselli, E. E. (1966). The validity of occupational aptitude tests. New York: Wiley.
Glennon, J. R., Albright, L E., & Owens, W. A. (1966). A catalog of life history items.Greensboro, NC: Creativity Research Institute of the Richardson Foundation.
Guthrie, E. R. (1944). Personality in terms of associative learning. In J. McV. Hunt(Ed.), Personality and the behavior disorders (Vol. 1). New York: Ronald Press.
Henry, E. R. (1965). Research conference on the use of autobiogmaphical data asIycholnaical predictors. Greensboro, NC: The Richardson Foundation.
27
Hogan, J. B., & Stokes, 0. S. (1989). The influence of socially desirable responding onbiographical data of applicant venus incumbent samples: Implications for predictiveand concurrent research designs. Paper presented at the annual meeting of theSociety for Industrial and Organizational Psychology, Boston, MA.
Hough, L M., Eaton, N. K., Dunnette, M. D., Kamp, J. D. & McCloy, R. A. (1990).Criterion-related validities of personality constructs and the effect of responsedistortion on those validities. Journal of Applied Psyehology 25.L 581-595.
Landy, F. J., & T"rumbo, D. A. (1980). EascbologXy_ of work behavior. Homewood,Illinois: Dorsey.
Mael, F. A. (in press). A conceptual rationale for the domain and attributes of biodataitems. Personnel Pslchology.
Mitchell, T.W. & Klimoski, RJ. (1982). Is it rational to be empirical? A test ofmethods for scoring biographical data. Journal of Apnlied Psychology. 67. 411-418.
Mumnford, M. D., & Owens, W. A. (1987). Methodology review: Principles, procedures,and findings in the application of background data measures. Applied EyeboloicalMasrern ,JL , 1.31.
Mumnford, M. D., & Stokes, G. S. (1991). Developmental determinants of individualaction: Theory and practice in the application of background data. In M.D.Dunnette (ed.) The handbook of industrial and organizational psycholoa. (2ndedition, pp. 1-78). Palo Alto, CA: Consulting Psychologists Press.
Nunnally, J. C. (1978). Pscdmxetric They. New York: McGraw-Hill.
Owens, W. A. (1976). Background data. In M. D. Dunnette (Ed.) Hndbook ofIndustrial Psychology. New York: Rand McNally.
Owens, W. A., & Schoenfeldt, L F. (1979). Toward a classification of persons. Journalof Applied Psychology 65L 569-607.
Pace, L A., & Scboenfeldt, L F. (1977). Legal concerns in the use of weightedapplication blanks. Personnel PsDblo ,% 159-166.
Page, D. P. (1934). Measurement and prediction of leadership. American Journal ofSociology, 4I1 31-43.
Paulhus, D. L (1984). Two-component models of socially desirable responding. luma1of Personalily and Social Psycholo-, .4, 598-609.
28
Reilly, R. R., & Chao, G. T. (1982). Validity and fairness of some alternative employeeselection procedures. Personnel sybcholoa. 3L, 1-62.
Richardson, Bellows, Henry & Co. (1985). Supervisory Profile Record. Washington,D.C.: Author.
Rothstein, H. R., Schrmidt, F. L, Erwin, F. W., Owens, W. A., & Sparks, C. P. (1990).Biographical data in employment selection? Can validities be made generalizable?Journal of Applied PEVcholoa. 2L. 175-184.
Russell, C. J., Mattson, J., Devlin, S. E., & Atwater, D. (1990). Predictive validity ofbiodata items generated from retrospective life experience essays. JouralofAplied Psycholo, 27. 569-580.
Schrader, A., & Osburn, H. G. (1977). Biodata faking: Effects of induced subtlety andposition specificity. ersonnal PsycholoS . 30. 395-405.
Stricker, L J. (1987). Developing a biographical measure to assess leadership potential.Presented at the Annual Meeting of the Military Testing Association, Ottawa,Ontario.
Telenson, P. A., Alexander, R. A., & Barrett, 0. V. (1983). Scoring the biographicalinformation blank: A comparison of three weighting techniques. AnpliadPsychological Measurement, 1 73-80.
Trent, T., Quenette, M. A., & Pass, I. J. (1989). An old-fashioned biographicalinventory. Paper presented at the 97th Annual Convention of the AmericanPsychological Association, New Orleans, LA.
Van Rijn, P. (1980). Biographical questionnaires and scored application blanks inperonnel selection. Washington, D.C.: U.S. Office of Personnel Management,Personnel Research and Development Center.
Watson, T. W. (1989). The Leadership Effectiveness Assessment Profile (LEAP):Prototype development and future plans. Paper presented at the annual meeting ofthe Military Testing Association, San Antonio, IX.
White, L A., Nord, R. D., & Mael, F. A. (1990). Setting enlistment standards on theABLE to reduce attrition. Paper presented at the annual Army Science Conference,Durham, NC.
Zerbe, WJ., & Paulhus, D. L (1987). Socially desirable responding in organizationalbehavior: A reconception: Academy of Management Review. 12. 250-264.
29
S
APPENDIX
EXAMPLES OF EMPIRICAL KEYING EMPLOYED IN USMA RESEARCH
A-1
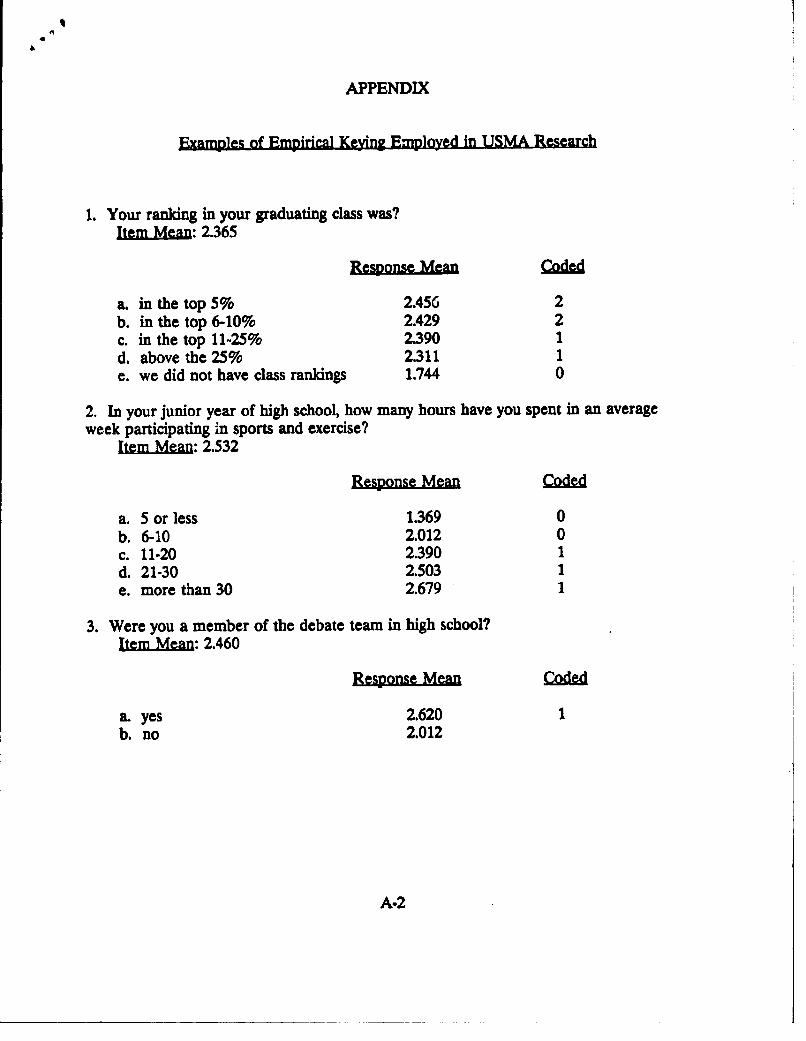
APPENDIX
Examples of Empirical Keying Employed in USMA Research
1. Your ranking in your graduating class was?
Item Mean: 2.365
Response Mean Coded
a. in the top 5% 2.456 2b. in the top 6-10% 2.429 2c. in the top 11-25% 2.390 1d. above the 25% 2.311 1e. we did not have class rankings 1.744 0
2. In your junior year of high school, how many hours have you spent in an averageweek participating in sports and exercise?
Item Mean: 2.532
Response Mean Coded
a. 5 or less 1.369 0b. 6-10 2.012 0c. 11-20 2.390 1d. 21-30 2.503 1e. more than 30 2.679 1
3. Were you a member of the debate team in high school?
Item Mean: 2.460
Response Mean
a. yes 2.620 1b. no 2.012
A-2