Embed Size (px)
Citation preview

The Condition of Education 2017 | 1
Chapter: 3/Elementary and Secondary Education Section: Assessments
Reading Performance
While the 2015 average 4th-grade reading score was not measurably different from the 2013 score, the average 8th-grade score was lower in 2015 than in 2013, according to data from the National Assessment of Educational Progress. At grade 12, the average reading score in 2015 was not measurably different from that in 2013.
The National Assessment of Educational Progress (NAEP) assesses student performance in reading at grades 4, 8, and 12 in both public and private schools across the nation. NAEP reading scores range from 0 to 500 for all grade levels. NAEP achievement levels define what students should know and be able to do:
Basic indicates partial mastery of fundamental skills, and Proficient indicates demonstrated competency over challenging subject matter. NAEP reading assessments have been administered periodically since 1992. The most recent reading assessments were conducted in 2015 for grades 4, 8, and 12.
Figure 1. Average National Assessment of Educational Progress (NAEP) reading scale scores of 4th-, 8th-, and 12th-grade students: Selected years, 1992–2015
217 214 215 213219 218 219 221 221 221 222 223
260 260 263 264 263 262 263 264 265 268 265
292 287 290 287 286 288 288
Grade 12
1992 1994 1998 2000 2002
Year
2003 2005 2007 2009 2011 2013 2015
0
150
200
250
300
500
Scale score
287
Grade 8
Grade 4
NOTE: Includes public and private schools. The reading scale scores range from 0 to 500. Assessment was not conducted for grade 8 in 2000 or for grade 12 in 2000, 2003, 2007, and 2011. Testing accommodations (e.g., extended time, small group testing) for children with disabilities and English language learners were not permitted in 1992 and 1994. SOURCE: U.S. Department of Education, National Center for Education Statistics, National Assessment of Educational Progress (NAEP), selected years, 1992–2015 Reading Assessments, NAEP Data Explorer. See Digest of Education Statistics 2015, table 221.10.
In 2015, the average reading score for 4th-grade students (223) was not measurably different from the 2013 score, but it was higher than the score in 1992 (217). For 8th-grade students, the average reading score in 2015 (265) was lower than in 2013 (268), but it was higher than
in 1992 (260). In 2015, the average reading score for 12th-grade students (287) was not measurably different from the score in 2013, but it was 5 points lower than in 1992 (292).
The Condition of Education 2017 | 2
Chapter: 3/Elementary and Secondary Education Section: Assessments
Reading Performance
Figure 2. Percentage of 4th-, 8th-, and 12th-grade students across National Assessment of Educational Progress (NAEP) reading achievement levels: Selected years, 1992–2015
10
30
50
70
90
0
20
40
60
80
100
10
30
50
70
90
0
20
40
60
80
100
10
30
50
70
90
1992 1994 1998 2000 2002 2003 2005 2007 2009 2011 2013 2015
38
62
29
40
60
30
40
60
29
41
59
29
36
64
31
37
63
31
36
64
31
33
67
33
33
67
33
33
67
34
32
68
35
31
69
36
1992 1994 1998 2002 2003
Grade 12
Year
2005 2007 2009 2011 2013 2015
31
69
29
30
70
30
27
73
32
25
75
33
26
74
32
27
73
31
26
74
31
25
75
32
24
76
34
22
78
36
24
76
34
1992 1994 1998 2002 2005 2009 20130
20
40
60
80
100
Percent
Grade 8
Year
Percent
Grade 4
Year
Percent
20
80
40
25
75
36
24
76
40
26
74
36
27
73
35
26
74
38
25
75
38
Below Basic
At or above Basic
At or above Proficient
2015
28
72
37
NOTE: Includes public and private schools. Achievement levels define what students should know and be able to do: Basic indicates partial mastery of fundamental skills, and Proficient indicates demonstrated competency over challenging subject matter. Assessment was not conducted for grade 8 in 2000 or for grade 12 in 2000, 2003, 2007, and 2011. Testing accommodations (e.g., extended time, small group testing) for children with disabilities and English language learners were not permitted in 1992 and 1994. Although rounded numbers are displayed, the figures are based on unrounded estimates. Detail may not sum to totals because of rounding. SOURCE: U.S. Department of Education, National Center for Education Statistics, National Assessment of Educational Progress (NAEP), selected years, 1992–2015 Reading Assessments, NAEP Data Explorer. See Digest of Education Statistics 2015, table 221.12.
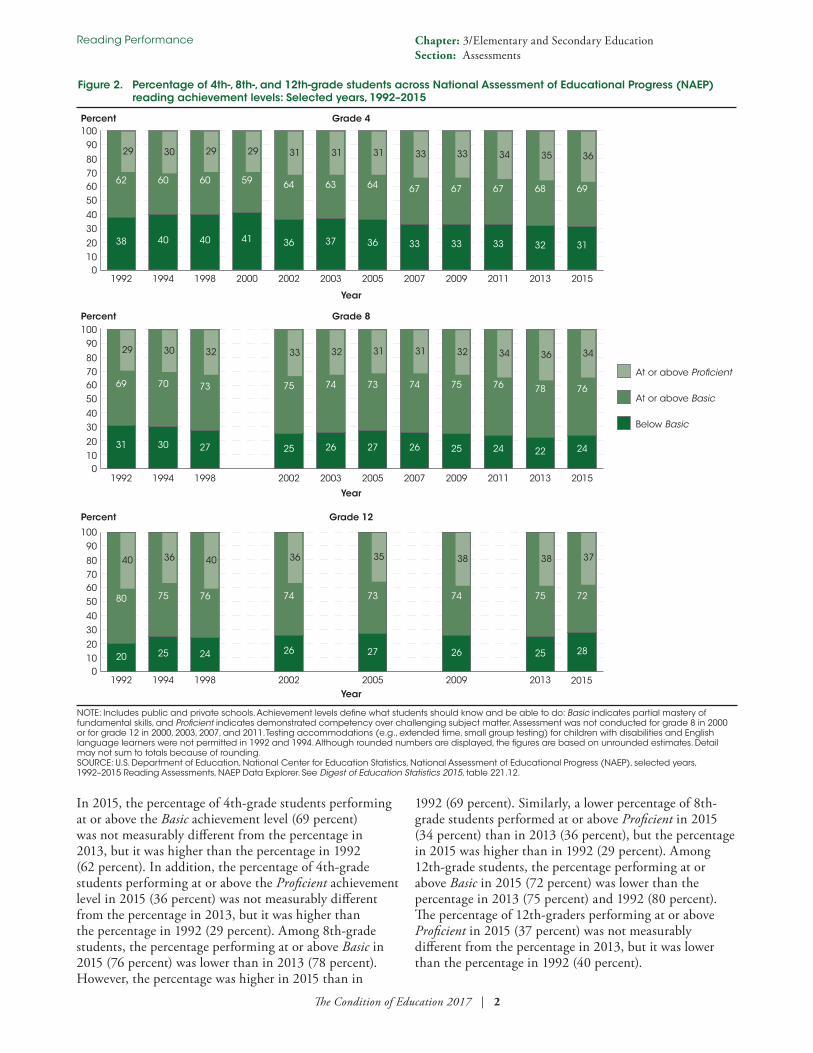
In 2015, the percentage of 4th-grade students performing at or above the Basic achievement level (69 percent) was not measurably different from the percentage in 2013, but it was higher than the percentage in 1992 (62 percent). In addition, the percentage of 4th-grade students performing at or above the Proficient achievement level in 2015 (36 percent) was not measurably different from the percentage in 2013, but it was higher than the percentage in 1992 (29 percent). Among 8th-grade students, the percentage performing at or above Basic in 2015 (76 percent) was lower than in 2013 (78 percent). However, the percentage was higher in 2015 than in
1992 (69 percent). Similarly, a lower percentage of 8th-grade students performed at or above Proficient in 2015 (34 percent) than in 2013 (36 percent), but the percentage in 2015 was higher than in 1992 (29 percent). Among 12th-grade students, the percentage performing at or above Basic in 2015 (72 percent) was lower than the percentage in 2013 (75 percent) and 1992 (80 percent). The percentage of 12th-graders performing at or above Proficient in 2015 (37 percent) was not measurably different from the percentage in 2013, but it was lower than the percentage in 1992 (40 percent).

The Condition of Education 2017 | 3
Chapter: 3/Elementary and Secondary Education Section: Assessments
Reading Performance
Figure 3. Average National Assessment of Educational Progress (NAEP) reading scale scores of 4th- and 8th-grade students, by race/ethnicity: 1992, 2013, and 2015
20131992 2015
White Black Hispanic Asian/Pacific Islander American Indian/Alaska Native
0
150
200
250
300
500
224 232 232
192206 206
197207 208 216
235 239
205
‡
‡
205
White Black Hispanic Asian/Pacific Islander American Indian/Alaska Native
0
Scale score
Scale score
150
200
250
300
500
267276 274
237250 248 241
256 253268
280 280
251 252
Grade 8
Grade 4
Race/ethnicity
Race/ethnicity
‡ Reporting standards not met (too few cases for a reliable estimate). NOTE: Includes public and private schools. The reading scale scores range from 0 to 500. Testing accommodations (e.g., extended time, small group testing) for children with disabilities and English language learners were not permitted in 1992. Race categories exclude persons of Hispanic ethnicity. Although rounded numbers are displayed, the figures are based on unrounded estimates. SOURCE: U.S. Department of Education, National Center for Education Statistics, National Assessment of Educational Progress (NAEP), 1992, 2013, and 2015 Reading Assessments, NAEP Data Explorer. See Digest of Education Statistics 2015, table 221.10.
At grade 4, the average 2015 reading scores for White (232), Black (206), Hispanic (208), and Asian/Pacific Islander students (239) were not measurably different from the corresponding scores in 2013, but their average scores were all higher in 2015 than in 1992. At grade 8, average 2015 reading scores for White (274), Black (248), and Hispanic (253) students were lower than the scores in 2013 (276, 250, and 256, respectively), while the average 2015 reading score for Asian/Pacific Islander (280) students was not measurably different from the score in 2013. Consistent with the findings at grade 4, the average reading scores for White, Black, Hispanic, and Asian/Pacific Islander 8th-grade students were higher in 2015 than in 1992. In 2015, the average scores for American Indian/Alaska Native 4th-graders (205) and 8th-graders (252) were not measurably different from the scores in 2013 and 1994, the first year that data were available for American Indian/Alaska Native students at both
grades. Starting in 2011, separate data for Asian students, Pacific Islander students, and students of Two or more races were collected. At both grades 4 and 8, the 2015 average reading scores for Asian students, Pacific Islander students, and students of Two or more races were not measurably different from the scores in 2013 and 2011.
Closing achievement gaps is a goal of both national and state education policies. From 1992 through 2015, the average reading scores for White 4th- and 8th-graders were higher than those of their Black and Hispanic peers. Although the White-Black and White-Hispanic achievement gaps did not change measurably from 2013 to 2015 at either grade 4 or 8, some of the racial/ethnic achievement gaps have narrowed since 1992. At grade 4, the White-Black gap narrowed from 32 points in 1992 to 26 points in 2015; at grade 8, the White-Hispanic gap narrowed from 26 points in 1992 to 21 points in 2015.
The Condition of Education 2017 | 4
Chapter: 3/Elementary and Secondary Education Section: Assessments
Reading Performance
Figure 4. Average National Assessment of Educational Progress (NAEP) reading scale scores of 4th- and 8th-grade students, by sex: 1992, 2013, and 2015
20131992 2015
0
150
200
250
300
500
0
150
200
250
300
500
Male Female
254263 261 267 273 270
Scale score
Scale score
Sex
Male Female
213 219 219 221 225 226
Sex
Grade 8
Grade 4
NOTE: Includes public and private schools. The reading scale scores range from 0 to 500. Testing accommodations (e.g., extended time, small group testing) for children with disabilities and English language learners were not permitted in 1992. Although rounded numbers are displayed, the figures are based on unrounded estimates. SOURCE: U.S. Department of Education, National Center for Education Statistics, National Assessment of Educational Progress (NAEP), 1992, 2013, and 2015 Reading Assessments, NAEP Data Explorer. See Digest of Education Statistics 2015, table 221.10.
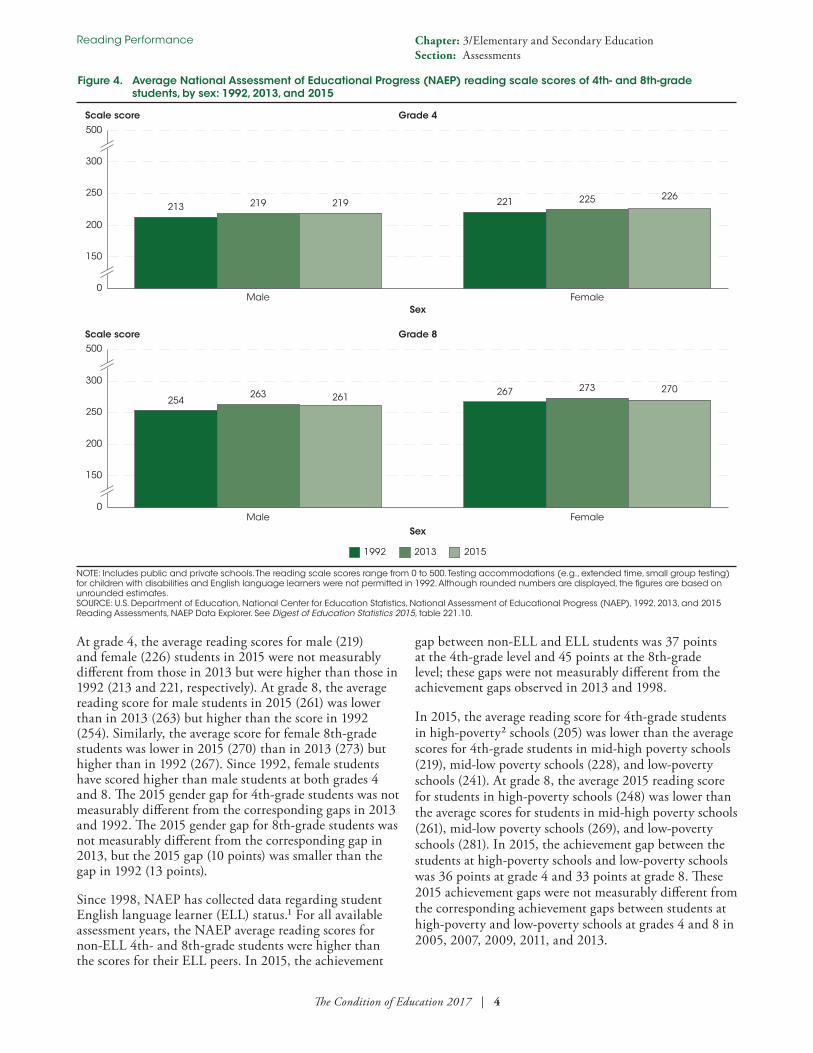
At grade 4, the average reading scores for male (219) and female (226) students in 2015 were not measurably different from those in 2013 but were higher than those in 1992 (213 and 221, respectively). At grade 8, the average reading score for male students in 2015 (261) was lower than in 2013 (263) but higher than the score in 1992 (254). Similarly, the average score for female 8th-grade students was lower in 2015 (270) than in 2013 (273) but higher than in 1992 (267). Since 1992, female students have scored higher than male students at both grades 4 and 8. The 2015 gender gap for 4th-grade students was not measurably different from the corresponding gaps in 2013 and 1992. The 2015 gender gap for 8th-grade students was not measurably different from the corresponding gap in 2013, but the 2015 gap (10 points) was smaller than the gap in 1992 (13 points).
Since 1998, NAEP has collected data regarding student English language learner (ELL) status.1 For all available assessment years, the NAEP average reading scores for non-ELL 4th- and 8th-grade students were higher than the scores for their ELL peers. In 2015, the achievement
gap between non-ELL and ELL students was 37 points at the 4th-grade level and 45 points at the 8th-grade level; these gaps were not measurably different from the achievement gaps observed in 2013 and 1998.
In 2015, the average reading score for 4th-grade students in high-poverty2 schools (205) was lower than the average scores for 4th-grade students in mid-high poverty schools (219), mid-low poverty schools (228), and low-poverty schools (241). At grade 8, the average 2015 reading score for students in high-poverty schools (248) was lower than the average scores for students in mid-high poverty schools (261), mid-low poverty schools (269), and low-poverty schools (281). In 2015, the achievement gap between the students at high-poverty schools and low-poverty schools was 36 points at grade 4 and 33 points at grade 8. These 2015 achievement gaps were not measurably different from the corresponding achievement gaps between students at high-poverty and low-poverty schools at grades 4 and 8 in 2005, 2007, 2009, 2011, and 2013.

The Condition of Education 2017 | 5
Chapter: 3/Elementary and Secondary Education Section: Assessments
Reading Performance
Figure 5. Average National Assessment of Educational Progress (NAEP) reading scale scores of 12th-grade students, by race/ethnicity and sex: 1992, 2013, and 2015
Male Female
287 282284297 292293
White Black Hispanic Asian/Pacific Islander American Indian/Alaska Native
297 295297
273 266268279 276 276
290 297296
‡
279277
0
150
200
250
300
500
0
150
200
250
300
500
Scale score
Scale score
20131992 2015
Sex
Race/ethnicity
‡ Reporting standards not met (too few cases for a reliable estimate). NOTE: Includes public and private schools. The reading scale scores range from 0 to 500. Testing accommodations (e.g., extended time, small group testing) for children with disabilities and English language learners were not permitted in 1992. Race categories exclude persons of Hispanic ethnicity. Although rounded numbers are displayed, the figures are based on unrounded estimates. SOURCE: U.S. Department of Education, National Center for Education Statistics, National Assessment of Educational Progress (NAEP), 1992, 2013, and 2015 Reading Assessments, NAEP Data Explorer. See Digest of Education Statistics 2015, table 221.10.
At grade 12, the average 2015 reading scores for White (295), Hispanic (276), and Asian/Pacific Islander students (297) were not measurably different from the scores in 2013 and 1992. For Black students, the 2015 average score (266) was lower than the 1992 score (273) but was not measurably different from the 2013 score. The average score for American Indian/Alaska Native students in 2015 (279) was not measurably different from the 2013 score. Starting in 2011, separate data for Asian students, Pacific Islander students, and students of Two or more races were collected. The 2015 average scores for Asian students and students of Two or more races were not measurably different from the scores in 2013.3 Achievement gaps in reading were also evident for 12th-grade students. The White-Black gap was wider in 2015 (30 points) than in 1992 (24 points), while the White-Hispanic gap in 2015 (20 points) was not measurably different from the gap in any previous assessment year.
The 2015 average reading scores for male (282) and female (292) 12th-grade students were not measurably different from the scores in 2013 but were lower than the scores in 1992 (287 and 297, respectively). The achievement gap between male and female students at grade 12 in 2015 (10 points) was not measurably different from the corresponding gaps in 2013 and 1992. In 2015, non-ELL 12th-grade students scored higher than their ELL peers by 49 points. The achievement gap between non-ELL and ELL students in 2015 was not measurably different from the gaps in both 2013 and 1998.1
In 2015, the average reading score for 12th-grade students in high-poverty schools (266) was lower than the average scores for 12th-grade students in mid-high poverty schools (282), mid-low poverty schools (289), and low-poverty schools (298). The achievement gap between the students at high-poverty schools and low-poverty schools was 32 points in 2015, which was not measurably different from the gap in previous assessment years.

The Condition of Education 2017 | 6
Chapter: 3/Elementary and Secondary Education Section: Assessments
Reading Performance
NAEP results also permit state-level comparisons of the reading abilities of 4th- and 8th-grade students in public schools. In 2015, the average reading scores across the states varied for public school students in both grades. At grade 4, the national public school average score was 221 and scores across states ranged from 207 to 235. In 21 states, average scores for public school students were higher than the national public school average score.
Average scores for public school students in 16 states were not measurably different from the national public school average. However, average scores in the District of Columbia and the remaining 13 states were lower than the national public school average. At grade 8, the national public school average score was 264 and scores across states ranged from 248 to 275. In 2015, 8th-grade average scores for public school students in 27 states were
Figure 6. Change in average National Assessment of Educational Progress (NAEP) reading scale scores of 4th- and 8th-grade public school students, by state: 2013 and 2015
Score loss (2)
No significant change (36)
Score gain (13)
Score loss (8)
No significant change (42)
Score gain (1)
Grade 4
Grade 8
AZ
UTNV
CA
NM
CO
WY
IDOR
WAMT ND
SD
TX
TX
OKAR
LAMS AL
TN
IL
MI
INOH
KYVAWV
PA
NY
MOKS
NE IA
MNWI
GA
SC
NC
FL
VTNH
MA
DC
RI
MD
NJDE
CT
ME
AK
AK
HI
AZ
UTNV
CA
NM
CO
WYID
OR
WAMT ND
SD
OK
KS
NE
AK
HI
AR
LAMS AL
TN
IL
MI
INOH
KYVAWV
PA
NY
MO
IA
MNWI
GA
SC
NC
FL
ME
DCMD
NJDE
MARICT
VTNH
NOTE: The reading scale scores range from 0 to 500. “Gain” is defined as a significant increase from 2013 to 2015, “no change” is defined as no significant change from 2013 to 2015, and “loss” is defined as a significant decrease from 2013 to 2015. SOURCE: U.S. Department of Education, National Center for Education Statistics, National Assessment of Educational Progress (NAEP), 2013 and 2015 Reading Assessments, NAEP Data Explorer. See Digest of Education Statistics 2015, tables 221.40 and 221.60.

The Condition of Education 2017 | 7
Chapter: 3/Elementary and Secondary Education Section: Assessments
Reading Performance
higher than the national public school average, and public school students in 10 states had average scores that were not measurably different from the national public school average. However, 8th-grade public school students in the District of Columbia and 13 states had average scores that were lower than the national public school average.
While there was no measurable change from 2013 to 2015 in the average reading score for 4th-grade public school students nationally, average scores were higher in 2015 than in 2013 in the District of Columbia and 12 states. Average 4th-grade scores were lower in 2015 than in 2013 in Maryland and Minnesota, while scores in all remaining states did not change measurably from 2013 to 2015. The
average reading score for 8th-grade public school students was lower in 2015 than in 2013 nationally and in 8 states. However, 8th-grade students in West Virginia scored higher in 2015 than in 2013. In the remaining states, scores did not change measurably from 2013 to 2015.
NAEP also collects public school data from urban districts at grades 4 and 8 based on the same reading assessment used to report national and state results. Twenty-one urban districts participated in 2015. The Trial Urban District Assessment (TUDA) is intended to focus attention on urban education and to measure the educational progress of participating large urban districts.
Figure 7. Average National Assessment of Educational Progress (NAEP) reading scale scores of 4th- and 8th-grade public school students, by jurisdiction: 2015
Jurisdiction Grade 4 Grade 8
221
214
207
212
220
199
219
226
213
197
204
186
214
225
199
230
210
222
204
226
214
201
216
�
�
�
�
�
�
�
�
�
�
�
�
�
�
�
�
�
�
�
�
�
�
�
�
�
�
�
�
�
�
�
�
�
�
�
�
�
�
�
�
�
�
�
�
264
257
251
252
261
243
258
263
257
240
250
237
245
264
242
261
252
261
251
265
258
248
262
Nation (public)
Large city
Albuquerque (NM)
Atlanta (GA)
Austin (TX)
Baltimore City (MD)
Boston (MA)
Charlotte (NC)
Chicago (IL)
Cleveland (OH)
Dallas (TX)
Detroit (MI)
District of Columbia (DC)
Duval County (FL)
Fresno (CA)
Hillsborough County (FL)
Houston (TX)
Jefferson County (KY)
Los Angeles (CA)
Miami-Dade (FL)
New York City (NY)
Philadelphia (PA)
San Diego (CA)
� Higher average scorethan nationalaverage score
Lower average scorethan nationalaverage score
� No significant difference between urban district and national average score
�
NOTE: The reading scale scores range from 0 to 500. “Large city” includes students from all cities in the nation with populations of 250,000 or more, including the participating districts. SOURCE: U.S. Department of Education, National Center for Education Statistics, National Assessment of Educational Progress (NAEP), 2015 Reading Assessments, NAEP Data Explorer. See Digest of Education Statistics 2015, table 221.80.

The Condition of Education 2017 | 8
Chapter: 3/Elementary and Secondary Education Section: Assessments
Reading Performance
In 2015, the average reading score for 4th-grade public school students in large cities4 (214) was lower than the national public school average reading score (221). Additionally, at grade 4, average scores for public school students in urban districts participating in TUDA ranged from 186 to 230. Public school 4th-grade students in 4 urban districts (Charlotte, Duval County, Hillsborough County, and Miami-Dade) had average scores higher than the national public school average, while students in 3 urban districts (Austin, Boston, and Jefferson County) had scores that were not measurably different from the national public school average. However, public school 4th-grade students in 14 urban districts had scores lower than the national public school average. Similarly, the average reading score for 8th-grade public school students in large cities (257) was lower than the national public school average score (264). At grade 8, average scores for public school students in urban districts participating in TUDA in 2015 ranged from 237 to 265. None of the urban districts had average 8th-grade scores higher than the national public school average. Eighth-grade public school students in 7 urban districts had average scores that
were not measurably different from the national public school average. Eighth-grade public school students in the remaining 14 districts had average scores lower than the national public school average.
Of the 20 urban districts that participated in the Trial Urban District Assessment in both 2013 and 2015, average 4th- and 8th-grade reading scores in some districts changed over time. Fourth-grade public school students in 4 urban districts (Boston, Chicago, Cleveland, and the District of Columbia) performed better in reading in 2015 than in 2013. While there was a decline in 4th-grade public school students’ average scores in Baltimore City, the average scores for students in the remaining 15 urban districts showed no measurable change between 2013 and 2015. Eighth-grade public school students in Miami-Dade scored higher in 2015 than in 2013 while 8th-grade students in 3 urban districts (Albuquerque, Baltimore City, and Hillsborough County) had lower average scores in 2015 than in 2013. Average scores for 8th-grade students in all other participating urban districts did not change measurably.
Endnotes:1 In the mid- to late-1990s, NAEP began a transition to include accommodations for ELL students and other students with special needs. Thus, 2015 data for ELL students are compared with data for 1998 instead of 1992 as in the remainder of the indicator.2 High-poverty schools are defined as schools where 76 to 100 percent of the students are eligible for free or reduced-price lunch (FRPL). Mid-high poverty schools are those schools where 51 to 75 percent of the students are eligible for FRPL, and mid-low poverty schools are those schools where 26 to 50 percent
of the students are eligible for FRPL. Low-poverty schools are defined as schools where 25 percent or less of the students are eligible for FRPL.3 A comparison between the two most recent assessment periods is not possible for Pacific Islander students because reporting standards were not met for these students in 2015.4 Large cities include students from all cities in the nation with populations of 250,000 or more, including the participating urban districts.
Reference tables: Digest of Education Statistics 2015, tables 221.10, 221.12, 221.40, 221.60, and 221.80Related indicators and resources: Mathematics Performance; Science Performance; Technology and Engineering Literacy; International Comparisons: Reading Literacy at Grade 4; International Comparisons: Science, Reading, and Mathematics Literacy of 15-Year-Old Students; Reading and Mathematics Score Trends [web-only]
Glossary: Achievement gap; Achievement levels, NAEP; English language learner (ELL); Public school or institution; Racial/ethnic group