Embed Size (px)
Citation preview
CAPTAIN JACK MILL BOULDER COUNTY, COLORADO
EPA FACILITY ID: COD981551427 APRIL 14, 2006
THE ATSDR PUBLIC HEALTH ASSESSMENT: A NOTE OF EXPLANATION
This Public Health Assessment was prepared by ATSDR pursuant to the Comprehensive Environmental Response, Compensation, and Liability Act (CERCLA or Superfund) section 104 (i)(6) (42 U.S.C. 9604 (i)(6)), and in accordance with our implementing regulations (42 C.F.R. Part 90). In preparing this document, ATSDR has collected relevant health data, environmental data, and community health concerns from the Environmental Protection Agency (EPA), state and local health and environmental agencies, the community, and potentially responsible parties, where appropriate.
In addition, this document has previously been provided to EPA and the affected states in an initial release, as required by CERCLA section 104 (i)(6)(H) for their information and review. The revised document was released for a 30-day public comment period. Subsequent to the public comment period, ATSDR addressed all public comments and revised or appended the document as appropriate. The public health assessment has now been reissued. This concludes the public health assessment process for this site, unless additional information is obtained by ATSDR which, in the agency’s opinion, indicates a need to revise or append the conclusions previously issued.
Agency for Toxic Substances & Disease Registry.................................................... Julie L. Gerberding, M.D., M.P.H., Administrator Howard Frumkin, M.D., Dr.P.H., Director
Division of Health Assessment and Consultation…. ..................................................................... William Cibulas, Jr., Ph.D., Director Sharon Williams-Fleetwood, Ph.D., Deputy Director
Health Promotion and Community Involvement Branch ........................................................................Susan J. Robinson, M.S., Chief
Exposure Investigations and Consultation Branch.................................................................................. Susan M. Moore, Ph.D., Chief
Federal Facilities Assessment Branch ........................................................................................................ Sandra G. Isaacs, B.S., Chief
Superfund and Program Assessment Branch ........................................................................................Richard E. Gillig, M.C.P., Chief
Use of trade names is for identification only and does not constitute endorsement by the Public Health Service or the U.S. Department of Health and Human Services.
Additional copies of this report are available from: National Technical Information Service, Springfield, Virginia
(703) 605-6000
You May Contact ATSDR TOLL FREE at 1-888-42ATSDR
or Visit our Home Page at: http://www.atsdr.cdc.gov
Captain Jack Mill Final Release
PUBLIC HEALTH ASSESSMENT
CAPTAIN JACK MILL
BOULDER COUNTY, COLORADO
EPA FACILITY ID: COD981551427
Prepared by:
Colorado Department of Public Health and Environment Under Cooperative Agreement with the
U.S. Department of Health and Human Services Agency for Toxic Substances and Disease Registry
Public Health Assessment Captain Jack Mill
Table of Contents Table of Contents............................................................................................................................. i I. Summary...................................................................................................................................... 1 II. Purpose ....................................................................................................................................... 3 III. Background ............................................................................................................................... 3
A. Site Description...................................................................................................................... 3 B. Site Operations and History ................................................................................................... 5 C. Regulatory History and Activities.......................................................................................... 6D. Demographics ...................................................................................................................... 10
1. California Gulch Road...................................................................................................... 10 2. Town of Ward.................................................................................................................... 11 3. Rowena/Jamestown........................................................................................................... 11
E. Land Use and Natural History.............................................................................................. 11IV. Discussion............................................................................................................................... 12
A. Evaluation Process ............................................................................................................... 12 B. Data Used ............................................................................................................................. 12
1. Sources of Environmental Contamination ........................................................................ 13 2. URS Operating Services Expanded Site Inspection (1997) .............................................. 15
C. Exposure Pathways and Contaminants of Concern.............................................................. 15 1a. Groundwater (Ingestion) ................................................................................................ 16 1b. Groundwater Exposure Dose Calculations .................................................................... 18 1c. Toxicological Evaluation ................................................................................................ 19 2a. Surface Water (Ingestion) ............................................................................................... 19 2b. Surface Water Exposure Dose Calculations (Ingestion) ................................................ 20 2c. Toxicological Evaluation (Surface Water Ingestion)...................................................... 23 3a. Soil (Ingestion)................................................................................................................ 24 3b. Soil Ingestion Calculations ............................................................................................. 25 3c. Toxicological Evaluation (Soil Ingestion) ...................................................................... 25 4a. Surface Water (Dermal).................................................................................................. 25 4b. Surface Water (Dermal) Exposure Calculations ............................................................ 25
D. Potential Exposure Paths...................................................................................................... 26 1. Fish (Ingestion) ................................................................................................................. 26 2. Plants (Ingestion).............................................................................................................. 26 3. Air (Inhalation) ................................................................................................................. 27
E. Physical Hazards .................................................................................................................. 27 F. Health Outcome Data ........................................................................................................... 27 G. Child Health Considerations ................................................................................................ 27 H. Community Health Concerns............................................................................................... 28
1. California Gulch Road...................................................................................................... 28 2. The Town of Ward............................................................................................................. 28 3. Rowena/Jamestown........................................................................................................... 29 4. The City of Boulder ........................................................................................................... 29 5. Lefthand Watershed Task Force and the Community Advisory Group for the Environment (CAGE), currently Lefthand Watershed Oversight Group (LWOG) ................................... 29
V. Conclusions.............................................................................................................................. 30 VI. Recommendations................................................................................................................... 30
i
Public Health Assessment Captain Jack Mill
VII. Public Health Action Plan ..................................................................................................... 32 VIII. Preparers of Report .............................................................................................................. 33 IX. References............................................................................................................................... 34 X. Appendices............................................................................................................................... 36
Appendix A. ATSDR Plain Language Glossary of Environmental Health Terms................... 36 Appendix B. Explanation of Evaluation Process ...................................................................... 42
B.1 Screening Process .......................................................................................................... 42 B.2. Determination of Exposure Pathways ........................................................................... 43 B.3. Evaluation of Public Health Implications ..................................................................... 43 B.4. Noncancer Health Effects.............................................................................................. 46
Appendix C. ATSDR Public Health Hazard Classification Categories ................................... 49 Appendix D. Selected Materials from Previous Sampling Events ........................................... 48 Appendix E. Response to Public Comments ............................................................................ 66
Certification……………………………………………………………………………………...67
ii

Public Health Assessment Captain Jack Mill
I. Summary
The Captain Jack Mill Superfund site, located in Boulder County Colorado, was listed on the National Priorities List (NPL) in September 2003. The site is an abandoned mining and milling area that initially began operations in the 1860s and continued intermittently through the mid- 1990s. Acid Mine Drainage (AMD) and numerous waste rock piles found at the site are the major sources of contamination resulting from the former mining operations. As part of the Superfund process, the Colorado Department of Public Health and Environment (CDPHE), under a cooperative agreement with the federal Agency for Toxic Substances and Disease Registry (ATSDR), is reviewing the available data to determine what, if any, public health hazards exist. Currently, the site is classified as an indeterminate public health hazard due to a lack of environmental data that can completely characterize the contamination and associated hazards present. However, certain physical hazards such as unsecured mine tunnels, open pits, and sinkholes, are present at the site that are dangerous. In this regard, the site is classified as a public health hazard.
The purpose of a public health assessment (PHA) is to evaluate the environmental data regarding the release of hazardous substances into the environment to determine if any past, current, or future public health hazards may exist. If public health hazards are identified, a PHA is designed to make the appropriate recommendations to limit the public health impacts from the site. A PHA is not used for the purpose of guiding remedial actions at a Superfund site.
The majority of the available data that was utilized for this public health assessment is derived from the U.S. Environmental Protection Agency’s (EPA) Expanded Site Investigation, which occurred on July 25, and 26, 1997 and was conducted by URS Operational Services Inc (UOS). Twenty-six samples were collected from a combination of groundwater, soil/source, and surface water/sediment matrices. Overall, the data is insufficient to determine the complete public health implications of the site. The recommendations within are based upon conservative, health-based conclusions that were derived from the available data. However, data gaps exist, and more data is needed to fully characterize the public health hazards at the site. Therefore, the site has been classified as an indeterminate public health hazard. An EPA Remedial Investigation and Feasibility Study (RI/FS) is now underway that will help to fill some of the critical data gaps. Once this data is available for review, CDPHE will review the new information for potential public health hazards.
Based upon the data that are currently available, CDPHE makes the following conclusions: • The only public health hazard known at this time is the presence of physical hazards at
the Captain Jack Mill Superfund site. There are no restrictions on access to the site. • The groundwater supply in a domestic well showed evidence of cadmium contamination.
It is unknown if this well is in use because of the property being vacant at the time this document was produced. More investigation is needed to determine the potential public health implications of the residential well.
• Surface water from Lefthand Creek in the area adjacent to the Captain Jack Mill contains elevated levels of inorganic contamination and should not be consumed until the safety of this pathway can be verified.
1
Public Health Assessment Captain Jack Mill
• Some data, which is needed to fully assess the public health hazards present at the site (e.g. air and biota data), is not available.
• The adit (tunnel) drainage from the Big Five Mine and the numerous waste rock piles are the major sources of environmental contamination at the site.
These conclusions have resulted in the following recommendations: � Restrictions should be put in place to limit public access to the site due to numerous
physical hazards. � Community members, residents, visitors, and on-site workers should limit direct contact
with waste rock, mill tailings, acid mine drainage, and sediments from mine excavations at the Captain Jack Mill Superfund site.
� The domestic well that exceeded health-based standards should not be used for consumption until additional data can verify the safety of this well.
� The consumption of fish from Lefthand Creek in the area adjacent to the Captain Jack Mill Superfund site should be minimized until additional data is collected to determine potential health risks.
� People who collect and consume plants should avoid harvesting from locations near the identified waste sources.
� Plants should be washed with non-contaminated water before consumption to remove potentially contaminated dust and dirt.
� More data needs to be collected by the appropriate agencies (i.e. fish, air, and additional source data).
� Agencies conducting on-site activities should use dust suppression techniques to limit the production of dust whenever possible.
2
Public Health Assessment Captain Jack Mill
II. Purpose On September 29, 2003, the Captain Jack Mill Superfund site (CJM), located in Boulder County, Colorado, was added to the National Priorities List (NPL). NPL designation enables the site to receive federal funds for clean up and remediation under the Comprehensive Environmental Response, Compensation and Liability Act (CERCLA) as amended by the Superfund Amendments and Reauthorization Act (SARA). As part of this legislation, the federal Agency for Toxic Substances and Disease Registry (ATSDR) produces public health assessments or public health consultations, which identify potential adverse human health implications for the population surrounding the site. This PHA considers any previous, existing, and potential health impacts resulting from on-site contamination based upon the data that is currently available. Environmental data is screened for contaminants of concern and then compared to health-based standards. The findings of this PHA conclude with the appropriate recommendations, which are designed to prevent or reduce site-related adverse health effects.
III. Background
A. Site Description The CJM site is located approximately 1.5 miles south of the small community of Ward, Colorado in the eastern foothills of the Rocky Mountains. The site is positioned in a narrow valley, known locally as the California Gulch, at a mean elevation of approximately 8,800 feet above sea level (USGS 1978a). The area surrounding the site is relatively rugged with an approximate gradient of 11% to the southeast (USGS 1978a). The mines and mill that compose the CJM site are positioned along the banks of Lefthand Creek, a perennial stream that serves as a source of drinking water and agricultural irrigation for the downstream population. Vegetation surrounding the site is somewhat sparse and consists of Lodgepole and Ponderosa Pines, Aspen, various wildflowers, and other native plants and grasses. The climate zone is semi-arid with a mean annual precipitation of 15 inches (URS 1994).
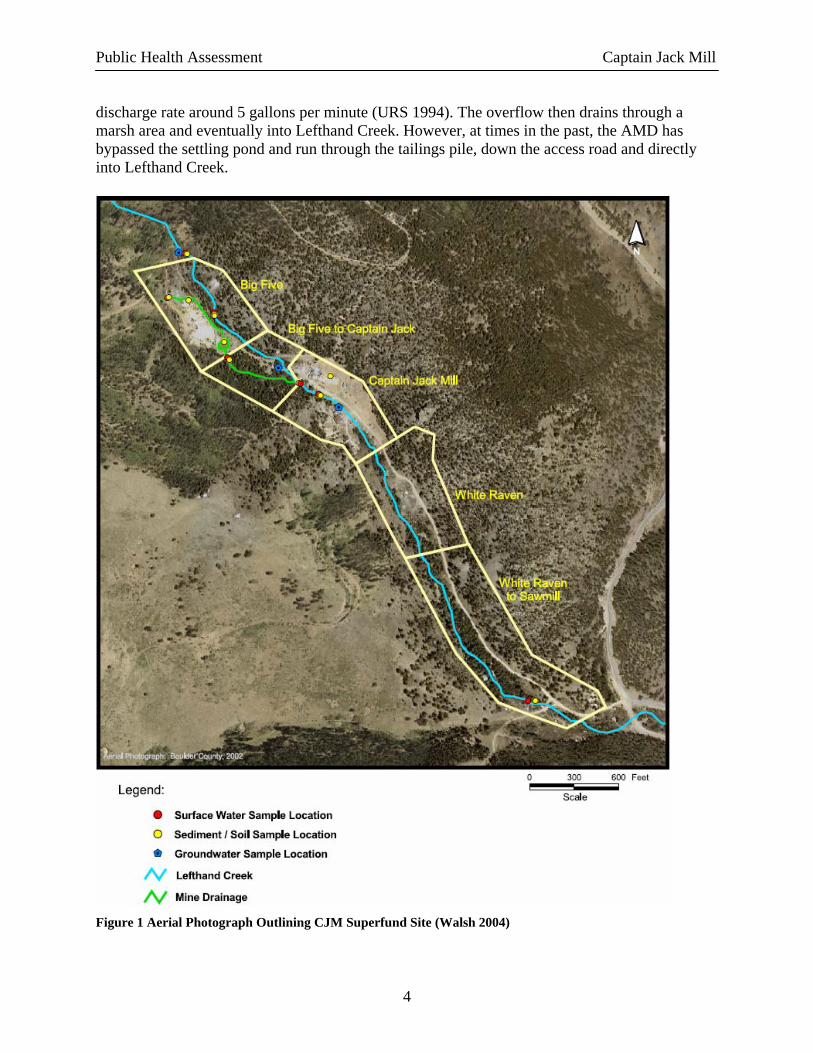
The site itself consists of 3 major components: the Big Five Mine area (upper portion); the Captain Jack mill works area (middle portion) and the White Raven Mine area (lower portion) (UOS 1997). The Big Five Mine is located approximately 500 feet up gradient from the mill and is composed of an adit, or tunnel; a large tailings pile, and a settling pond. The Captain Jack mill works area includes a filled-in unlined lagoon that was used for settling tailings from the mill; a filled-in lined lagoon with a plastic membrane liner, the Black Jack adit, an abandoned residence, mill buildings, and miscellaneous equipment and chemicals that were used to process and store the ores and/or wastes. The lower portion of the site consists of the White Raven Mine, a tailings pile, and a waste rock pile adjacent to Lefthand Creek (URS 1992). Figure 1 below is an aerial photograph of the CJM Superfund site with the major components outlined.
There are many sources of environmental contamination at the CJM Superfund site. The major source is the adit drainage from the Big Five Mine. This drainage has been characterized as acid mine drainage, or AMD, due to the low pH of the solution. The AMD leaches metals from rock and soil and transports the contaminants through the environment. Normally, the AMD from the Big Five Adit runs across the tailings pile, down the access road and into the settling pond at a
3
Public Health Assessment Captain Jack Mill
discharge rate around 5 gallons per minute (URS 1994). The overflow then drains through a marsh area and eventually into Lefthand Creek. However, at times in the past, the AMD has bypassed the settling pond and run through the tailings pile, down the access road and directly into Lefthand Creek.
Figure 1 Aerial Photograph Outlining CJM Superfund Site (Walsh 2004)
4
Public Health Assessment Captain Jack Mill
5
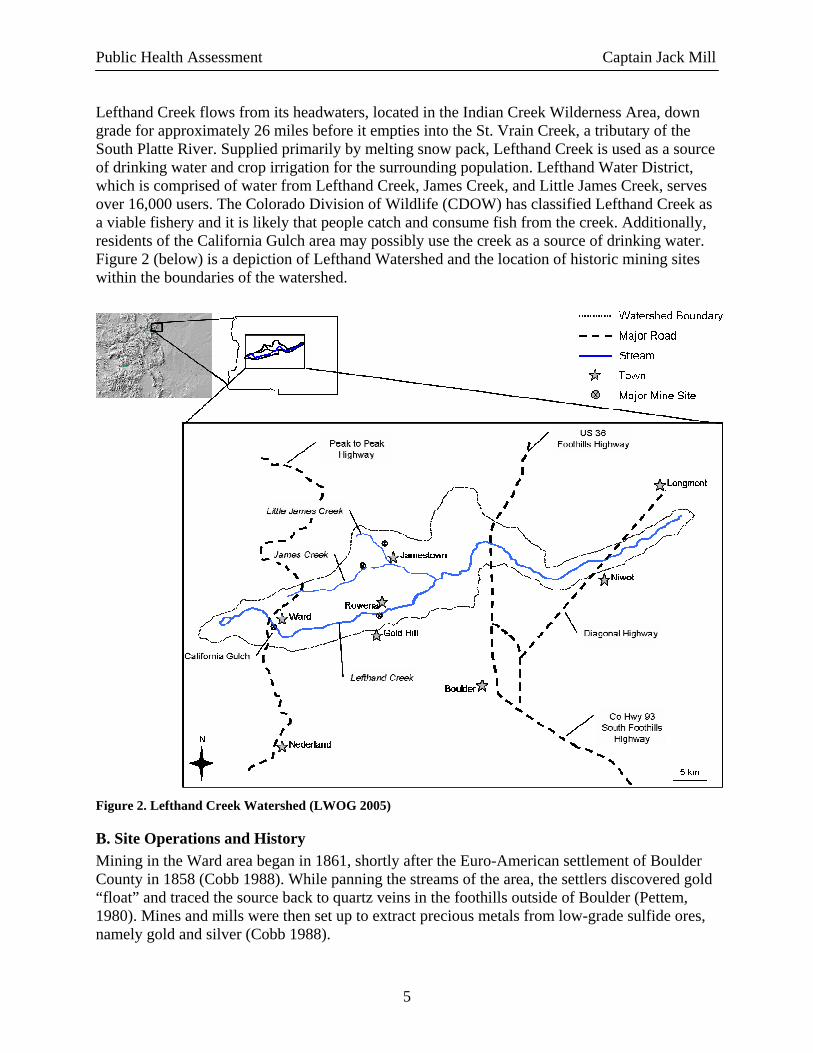
Lefthand Creek flows from its headwaters, located in the Indian Creek Wilderness Area, down grade for approximately 26 miles before it empties into the St. Vrain Creek, a tributary of the South Platte River. Supplied primarily by melting snow pack, Lefthand Creek is used as a source of drinking water and crop irrigation for the surrounding population. Lefthand Water District, which is comprised of water from Lefthand Creek, James Creek, and Little James Creek, serves over 16,000 users. The Colorado Division of Wildlife (CDOW) has classified Lefthand Creek as a viable fishery and it is likely that people catch and consume fish from the creek. Additionally, residents of the California Gulch area may possibly use the creek as a source of drinking water. Figure 2 (below) is a depiction of Lefthand Watershed and the location of historic mining sites within the boundaries of the watershed.
Figure 2. Lefthand Creek Watershed (LWOG 2005)
B. Site Operations and History Mining in the Ward area began in 1861, shortly after the Euro-American settlement of Boulder County in 1858 (Cobb 1988). While panning the streams of the area, the settlers discovered gold “float” and traced the source back to quartz veins in the foothills outside of Boulder (Pettem, 1980). Mines and mills were then set up to extract precious metals from low-grade sulfide ores, namely gold and silver (Cobb 1988).
Public Health Assessment Captain Jack Mill
In 1891, a small mining community named Camp Frances was established. The North American Mining Company set up operations in the area and developed the Big Five mining group under the management of H.S. Sanderson. Some 200 mine openings were registered in the camp around 1920, with the Big Five Company owning and operating some of the largest and most profitable shares (CGS 1911). The Big Five Consolidated Company consisted of the Dew Drop Mining Company, Adit Mining Company, Niwot Mining Company, Columbia Mines Company, and the Timberline Mines Company (Walsh 2004). The mines produced primarily gold and silver, and the combined ores came down to the mills by way of the Adit Tunnel. Milling took place at either the Dew Drop Mill or the larger Big Five Mill, located below the camp near the Big Five Mine.
Various milling and ore processing strategies were employed to extract the precious metals from the sulfide ores. The earliest milling strategies consisted of simply stamping and crushing the raw ores, washing the powdered material over amalgamation plates and capturing the gold with quicksilver or mercury (CGS 1911). As the ores near the surface dissipated and mining extended to greater depths, the ores that were encountered could no longer be processed using the aforementioned method because of the combined state of the gold and sulfide ores. Smelting became a common practice, but the ores had to be shipped, which was expensive and time consuming. Therefore, local milling processes developed alternative strategies with improving technologies that could concentrate the low-grade ores to turn a profit. The Big Five concentration mill is one such example. The Big Five Mill consisted of crushers, a roll mill, and Wilfley tables that were capable of processing around 50 tons of ore per day (EPA 2002). It is believed that this mill was standing until around 1927. And today it exists only as a remnant of what once was (Cobb 1988).
The complete histories of the Big Five and Black Jack Mine are not well defined. The Black Jack Mine operated intermittently as an underground mine following its patent approval in 1917. The Big Five Mine operated without a permit so there is no official documentation regarding the early history and operations of this mine (CMLRD 1992b). Bernard Teets and Associates reopened the Big Five Company’s operation in the 1940s, but it is not clear what the exact intentions of this company were. Captain Jack Ltd. later gained control of the mill works area in March of 1974 and acquired a permit for a captive mill operation (no imported ore could be processed). Captain Jack personnel then installed a 30-ton per day concentrating mill that utilized a flotation process and by May of 1981, the mill was processing ores from the surrounding mines. At some point during the following year, Captain Jack Ltd. cleaned out the Big Five Adit tunnel and covered the proximal tailings pile with hundreds of tons of waste sludge (Cobb 1988).
From this time on, the area has been the focus of numerous citations and investigations spurred by complaints and concerns of the local population. Federal, state and local agencies have all been involved in activities at the site and the following section is a compilation of these activities.
C. Regulatory History and Activities Concerns of the local population are on record from the very early stages of the mining community. Most of these complaints came from farmers downstream of the site on Lefthand or St. Vrain Creeks in the dry, high plains of eastern Colorado. The complaints mainly consisted of
6
Public Health Assessment Captain Jack Mill
water rights issues and the water diversions that mining companies had made to suit their needs (CGS 1911). During the mid-late 1980s, specific concerns began to arise regarding the environmental hazards posed by the mining operations at the site and regulatory authorities subsequently became involved. Officials from local, state, and federal agencies have all played a role in the regulatory history of the site including the Boulder County Health Department (BCHD), the Colorado Mined Land Reclamation Division (now the Colorado Division of Minerals and Geology, CDMG), the Mine Safety and Health Administration (MSHA), CDPHE, and the U.S. Environmental Protection Agency (EPA).
In January of 1984, Captain Jack Ltd. sold the operation to Consolidated Metals Corporation, but retained the operating permit. By 1985, the mill was granted inactive status and was later sold to Vandyke Minerals, Inc. in 1986 (URS 1994). A Cease and Desist order was issued by the Colorado Mined Land Reclamation Division (CMLRD) for non-compliance and negligence on filing yearly fees on May 21, 1986. In June of the same year, CDPHE conducted a water investigation and found that the Big Five adit drainage had a pH of 3.3, which is similar to the acidity of cola or vinegar. In addition, the adit drainage contained relatively high levels of heavy metals. However, drainage sampled from the settling pond below the mill did not show metal concentrations above Resource Conservation and Recovery Act action levels. No further regulatory activities occurred at this time (CMLRD 1992a).
On September 16, 1986, a representative of the Mine Safety and Health Administration (MSHA) reported the site to the EPA Region VIII office. MSHA noted that various concentrated chemicals were being stored on site including vats and drums of cyanide, acids, and Aerofix, a chemical used to fix black and white photographs (UOS 1998). Later that year, reports indicated that the former operations manager for Colorado Consolidated Metals Company had processed several tons of ore from the Idaho Springs area through the mill in November. There were also complaints from neighbors, supported by evidence found at the site, that a cyanide circuit was being used to work the ores. Cyanide is one of the alternative milling strategies that was mentioned earlier, which is used to isolate gold from the tight grip of the lower sulfide ores. Both of these actions are specifically prohibited under the CMLRD permit that the mill held at that time (UOS 1998).
VanDyke Minerals Inc. filed for bankruptcy in 1987. The EPA then began preliminary sampling at the site shortly thereafter. Samples were collected from drummed material that was abandoned on-site as well as the stained soil around the drums. They discovered that the samples contained semi-volatile organic compounds (SVOC’s), and the drums were then removed from the site by the EPA’s Emergency Response Branch (ERB), Emergency Response Cleanup Services (ECRS) team. The ECRS team also moved ceramic tubs filled with concentrated waste sludge from along the north bank of Lefthand Creek into the Black Jack shed, where rusted drums containing a similar material were also being stored.
The former operations manager for Colorado Consolidated Metals purchased the mill works area in August 1992, and began his own operations. Around this same time, the EPA began their initial Screening Site Inspection (SSI). Sampling consisted of 44 total samples including 11 source, 1 groundwater, 4 surface water, 3 sediment, 16 soil/source, and 9 QA/QC samples. The sampling activities were conducted by URS Consultants, Inc. (URS) for the purpose of gathering
7
Public Health Assessment Captain Jack Mill
data for the Hazard Ranking System (HRS), which is used to evaluate the hazards posed by a particular site for Superfund documentation. The complete environmental data tables from the SSI are included in Appendix D1. All relevant samples for this public health assessment will be discussed in the remaining text. Overall, the SSI indicated the presence of several inorganic and organic compounds particularly around the mill works area where several drums of contaminants remained.
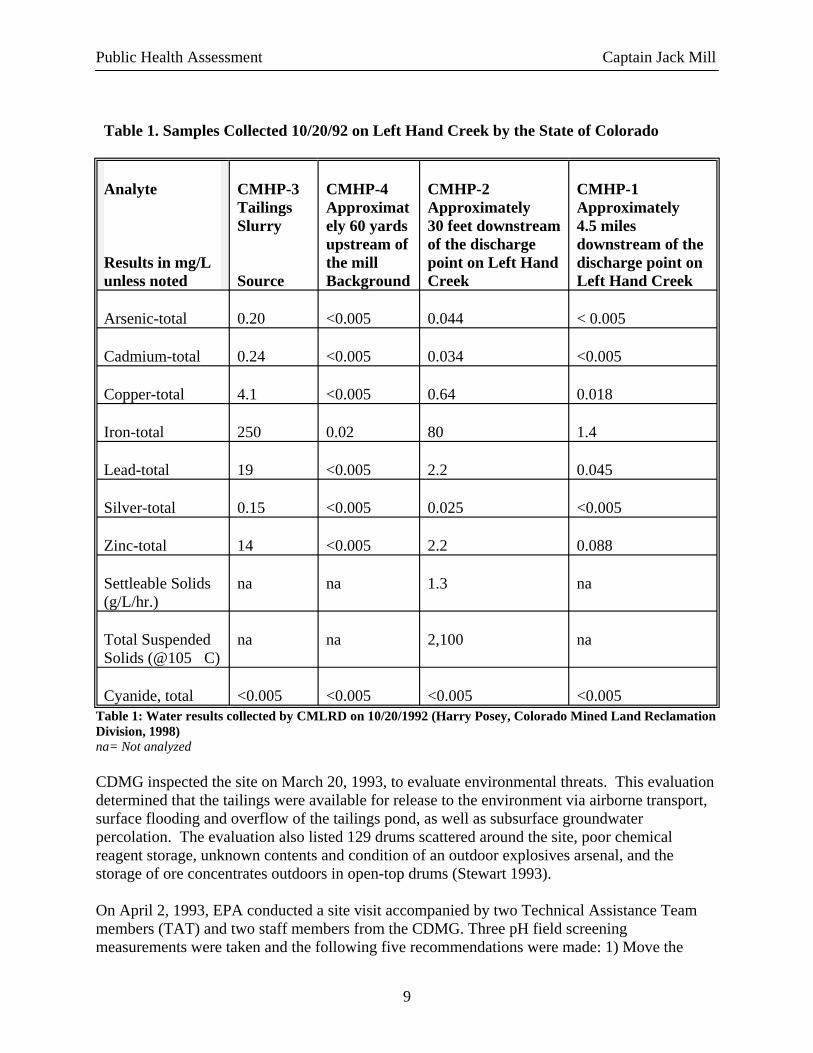
On October 20, 1992 Boulder County Health Department informed the EPA of a milky-white substance in Lefthand Creek. The following day, the Colorado Division of Minerals and Geology (CDMG) inspected the site and found tailings flowing out of a pipe from the mill building into the unlined tailings pond and then into what appeared to be a decant tower. Tailings-like material was bubbling out of the bank into Lefthand Creek, which turned the entire creek a milky-gray color for nearly six miles below the mill site. Four aqueous samples were collected from the surface water at this time: from 4.5 miles below the inflow point; from 30 feet below the inflow point; from 180 feet above the inflow point; and from the tailings pond solution. These samples documented a release of tailings with elevated levels of zinc, cadmium, copper, and lead into Lefthand Creek immediately downstream of the site (see Table 1 below) (CMLRD 1998). However, these analytical results were not validated, and no quality control samples were taken in conjunction with these samples.
CDPHE and CDMG then shut the mill down on October 21, 1992.
8
Public Health Assessment Captain Jack Mill
Table 1. Samples Collected 10/20/92 on Left Hand Creek by the State of Colorado
Analyte
Results in mg/L unless noted
CMHP-3 Tailings Slurry
Source
CMHP-4 Approximat ely 60 yards upstream of the mill Background
CMHP-2 Approximately 30 feet downstream of the discharge point on Left Hand Creek
CMHP-1 Approximately 4.5 miles downstream of the discharge point on Left Hand Creek
Arsenic-total 0.20 <0.005 0.044 < 0.005
Cadmium-total 0.24 <0.005 0.034 <0.005
Copper-total 4.1 <0.005 0.64 0.018
Iron-total 250 0.02 80 1.4
Lead-total 19 <0.005 2.2 0.045
Silver-total 0.15 <0.005 0.025 <0.005
Zinc-total 14 <0.005 2.2 0.088
Settleable Solids (g/L/hr.)
na na 1.3 na
Total Suspended Solids (@105�C)
na na 2,100 na
Cyanide, total <0.005 <0.005 <0.005 <0.005 Table 1: Water results collected by CMLRD on 10/20/1992 (Harry Posey, Colorado Mined Land Reclamation Division, 1998) na= Not analyzed
CDMG inspected the site on March 20, 1993, to evaluate environmental threats. This evaluation determined that the tailings were available for release to the environment via airborne transport, surface flooding and overflow of the tailings pond, as well as subsurface groundwater percolation. The evaluation also listed 129 drums scattered around the site, poor chemical reagent storage, unknown contents and condition of an outdoor explosives arsenal, and the storage of ore concentrates outdoors in open-top drums (Stewart 1993).
On April 2, 1993, EPA conducted a site visit accompanied by two Technical Assistance Team members (TAT) and two staff members from the CDMG. Three pH field screening measurements were taken and the following five recommendations were made: 1) Move the
9
Public Health Assessment Captain Jack Mill
open-top ore concentrate drums into the tailings pond; 2) Over pack corroding drums and leaking bags, and relocate to a secured area; 3) Separate laboratory chemicals by compatibility, place in over pack drums, and place drums in a secured area; 4) Investigate the contents of the explosive magazine and stabilize; and 5) Implement control of surface water runoff into and out of the tailings ponds.
On April 27, 1993, a TAT chemist visited the site and segregated the chemicals found scattered in the mill office. These chemicals were then locked in a cabinet in the mill building and the key placed in the EPA's care (E&E 1993). On January 6, 1994, the former managing operator of Colorado Consolidated Metals returned to the Boulder/Ward area and tried to reopen the mill. Up until this time, he was working in the Idaho Springs area and had reportedly purchased the Big Five Mine (URS 1994). In 1995, CDMG signed a settlement agreement with the new owner. The agreement stated that the owner would stabilize and reclaim the mill area. However, conversations with CDMG officials indicate that there had been little reclamation activity at the site (CDMG 1997).
The EPA then began an Expanded Site Inspection (ESI) on June 25, 1997 to gain additional data for Superfund documentation purposes. The ESI consisted of 26 samples from a combination of groundwater, surface water, soil, source, and sediment matrices and has been used as the basis of the exposure calculations in this PHA. A HRS score of 50.52 was calculated by the EPA in 2002. This value was sufficient to merit Superfund status and the CJM site was listed on the EPA’s National Priorities List (NPL) on September 29, 2003. Currently, the Remedial Investigation and Feasibility Study (RI/FS) is underway and the final data are expected to be released in the spring of 2006.
D. Demographics The population surrounding the CJM Superfund site can be divided into three distinct communities of California Gulch Road, Ward, and Rowena/Jamestown. In relation to these communities, the site is located on California Gulch Road with the town of Ward to the north (~1.5 mi.). Rowena and Jamestown are separate communities, which both share a Jamestown mailing address. They are located roughly 7.5 miles (straight line distance) from the CJM site. Rowena is located downstream and east of the site on Lefthand Creek. Jamestown is located east-northeast of the CJM site near the confluence of the James and Little James Creeks (See Figure 2). The largest proximal city, Boulder, Colorado, lies approximately 14 miles to the east-southeast of the site. The following section is a demographic overview of the communities located near the CJM site.
1. California Gulch Road Census data for the California Gulch Road community is not available. Therefore, all of the demographic information described in this section is derived from site visits conducted during October and November 2003. There are approximately 24 people living on the three branches of California Gulch Road. This number fluctuates seasonally, with a slight increase in population during the warmer months of the year. Most of the population in the California Gulch area resides in temporary dwellings. At the time of the initial site visits, there were eight children under the age of twelve years that live in the area with other family members.
10
Public Health Assessment Captain Jack Mill
2. Town of Ward The CJM Superfund site is located 1 ½ miles south of the town of Ward, Colorado. Due to the close proximity of the site to the town of Ward, residents frequently visit the area. The town of Ward’s water supply does not appear to be affected by contamination from the site, as their source of water is collected from 3 springs located approximately 5 miles west of the town and up gradient of the Captain Jack site. However, the proximity of the town to the site and the fact that residents commonly frequent the area makes Ward significant in terms of the public health implications from the Captain Jack Mill Superfund site.
Ward has a population of 169 individuals according to Census 2000 statistics. There are approximately equal numbers of males (50.9%) and females (49.1%) with a median age of 34.7 years. Approximately 12% of the total population is under the age of 10 years with only 4 individuals over the age of 60. The population is largely white (98.8%) and English speaking (US Census 2000).
3. Rowena/Jamestown Rowena and Jamestown Colorado are small mountain communities that are located approximately 7.5 miles to the east-northeast of the CJM site. The two communities have a combined population of approximately 205 individuals and almost equal numbers of males and females. The median age is 38.8 years with 18 children under the age of 10 years and 12 people over the age of 65 years. The population is largely white (97.6%) and English speaking (US Census 2000).
E. Land Use and Natural History The CJM Superfund site is located within a historic mining community that dates back to the late 1850s. Mining activity began to dissipate in the early 1900s and eventually came to a complete halt in the mid-1990s. The area surrounding the site is currently owned by a combination of entities with the U.S. Forest Service (USFS) claiming the major share of the property (~ 65%) and the remainder being divided amongst private owners, indeterminate ownership and the State of Colorado (LWOG 2005). A few houses and other makeshift dwellings are scattered throughout the site.
The local population uses the site for fishing, as a food source from native plants/herbs and gardens, as well as recreating. Community interviews indicate that individuals proximal to the site often wade in Lefthand Creek and, at times, also enter into the AMD from the Big Five adit. The mine openings and associated buildings are accessible to anyone who wishes to enter.
In addition, the site is a popular destination for other individuals from the surrounding communities for recreation. Hiking, biking, fishing, and off-road vehicle use in the area is extremely common. Limited information is available regarding actual statistics, but it is known that the activity increases during the summer months and continues to a lesser degree throughout the year.
11
Public Health Assessment Captain Jack Mill
IV. Discussion
A. Evaluation Process The process used to make the conclusions and recommendations contained within this Public Health Assessment is summarized here and explained in further detail in Appendix B. The initial steps of the assessment process involve screening the available environmental data for contaminants and then comparing this information to health-based screening values called comparison values (CVs). If the concentration of a particular contaminant is above the respective CV, then the contaminant of concern (COC) is evaluated in greater detail. Exceeding the CV does not necessarily mean that the COC poses a public health risk; only that further evaluation is needed. ATSDR and CDPHE’s Disease Control and Environmental Epidemiology Division also considers sampling location, data quality; exposure probability, frequency and duration; and community health concerns in determining which contaminants to evaluate further.
If the COC is selected for extended evaluation, the next step is to identify pathways of probable exposure that could pose a hazard. Simply having the substance present in the environment does not necessarily mean that people will come into contact with it and subsequently experience adverse health effects. An exposure pathway consists of five elements: � a source of contamination, � a contaminated environmental medium and transport mechanism (e.g. soil, water, air), � a point of exposure (e.g. where contact with the contaminant occurs), � a route of exposure (e.g. inhalation, ingestion, skin), and � a receptor population (e.g. people who are exposed).
Exposure pathways are classified as either complete, potential, or eliminated. Only complete exposure pathways can be fully evaluated and characterized to determine the public health implications of the COC. Potential exposure pathways are also noted within this PHA with the intent of identifying potential hazards and data gaps that may currently exist.
Contaminants with completed or potential exposure pathways are then analyzed by calculating adult and child exposure doses in the contaminated environmental media present on-site. Exposure doses are estimates of the concentration of contaminants that people may come into contact with or be exposed to under specified exposure conditions. These exposure doses are compared to the appropriate health guidelines for the COC. Health guideline values are considered safe doses; that is, health effects are not likely below this level. If the exposure dose for a COC is greater than the health guideline, then the exposure is compared to known health effect levels contained within ATSDR’s Toxicological Profiles. If the COC is a carcinogen, the cancer risk is also estimated.
B. Data Used A variety of data has been utilized to compose this public health assessment including environmental sampling data, historical references, demographic data, and information derived from on-site inspections. The screening for contaminants of concern (COC) and the associated public health implications are based upon data that was collected during the 1997 Expanded Site Investigation conducted by URS Operating Services Inc (UOS 1997). This data consisted of 26 samples gathered from surface water, sediment, soil, and groundwater surrounding the Captain
12
Public Health Assessment Captain Jack Mill
Jack Mill Superfund site. An Analytical Results Review was conducted by URS and has been utilized for the preparation of this document (UOS 1998). Other sources of data including sampling that was collected during the EPA’s Screening Site Inspection (1992) and information derived from recent site visits have helped to characterize the site and surrounding conditions. For further information on these data sources, see Appendix D.
It should be noted that the sampling efforts conducted by URS Operating Services, Inc. were geared toward identifying waste sources and the environmental contamination present at the CJM site. Their objective was not to perform sampling for the specific purpose of this public health assessment. As such, some of the information needed to completely characterize the contaminants identified in this PHA is lacking. For example, the sampling was conducted over a two-day period and is not highly representative of the actual contamination during other times of the year. Surface and Ground water flow rates, charged primarily by melting snow pack, change dramatically over the course of a typical year at this site. Changing flow rates affect the concentration of contaminants with lower concentration in the spring and summer (high water) and higher concentrations in the fall and winter months (low water). A Remedial Investigation and Feasibility Study (RI/FS) is currently underway that will provide some of the necessary environmental data needed to better characterize the public health implications of the site. This data will be reviewed, once available, to determine the potential public health hazards.
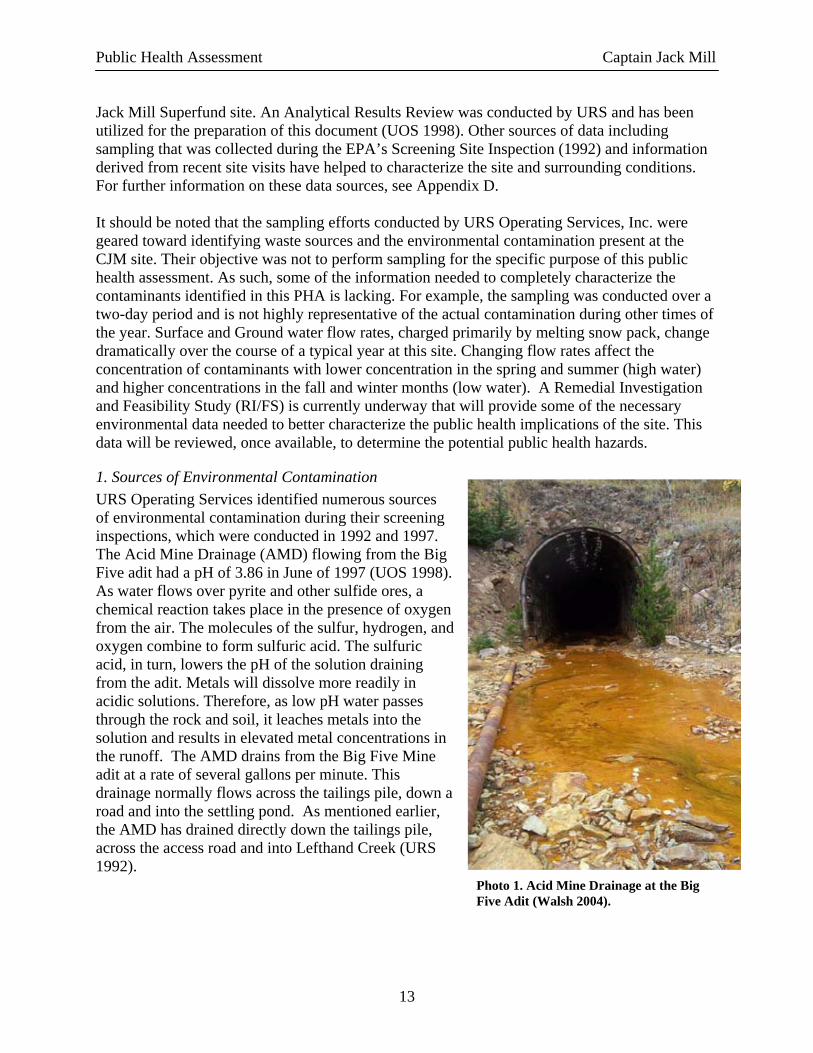
1. Sources of Environmental Contamination URS Operating Services identified numerous sources of environmental contamination during their screening inspections, which were conducted in 1992 and 1997. The Acid Mine Drainage (AMD) flowing from the Big Five adit had a pH of 3.86 in June of 1997 (UOS 1998). As water flows over pyrite and other sulfide ores, a chemical reaction takes place in the presence of oxygen from the air. The molecules of the sulfur, hydrogen, and oxygen combine to form sulfuric acid. The sulfuric acid, in turn, lowers the pH of the solution draining from the adit. Metals will dissolve more readily in acidic solutions. Therefore, as low pH water passes through the rock and soil, it leaches metals into the solution and results in elevated metal concentrations in the runoff. The AMD drains from the Big Five Mine adit at a rate of several gallons per minute. This drainage normally flows across the tailings pile, down a road and into the settling pond. As mentioned earlier, the AMD has drained directly down the tailings pile, across the access road and into Lefthand Creek (URS 1992).
Photo 1. Acid Mine Drainage at the Big Five Adit (Walsh 2004).
13
Public Health Assessment Captain Jack Mill
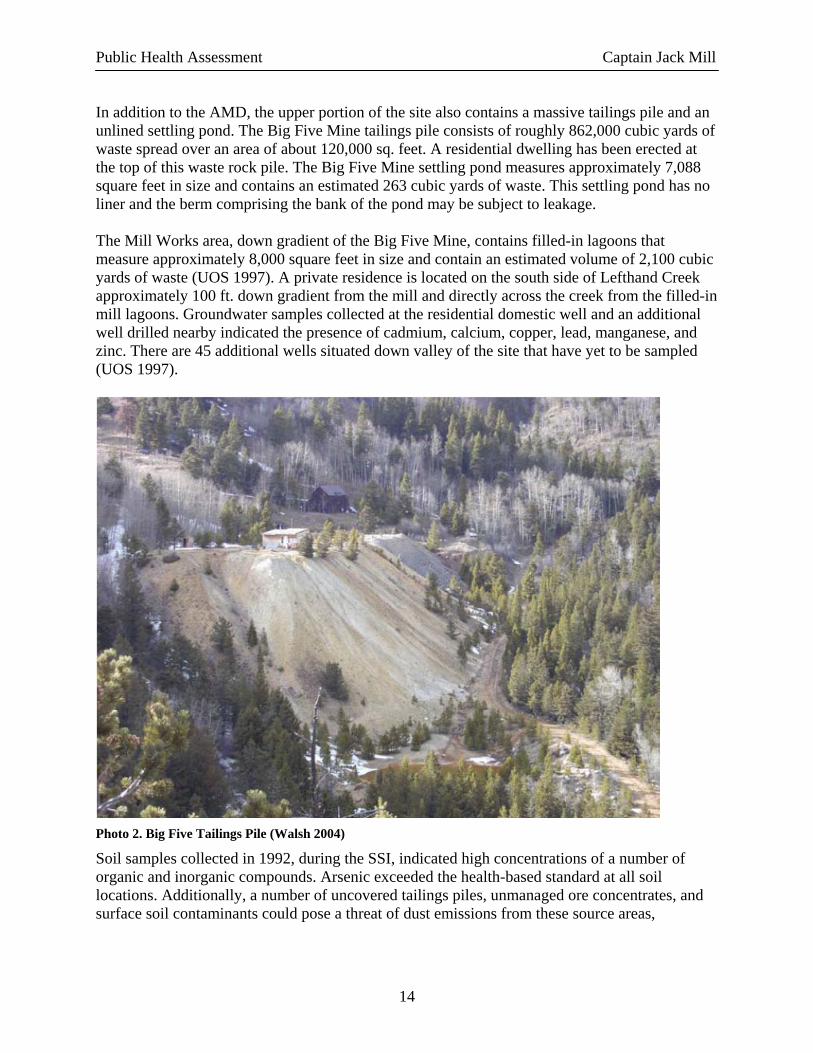
In addition to the AMD, the upper portion of the site also contains a massive tailings pile and an unlined settling pond. The Big Five Mine tailings pile consists of roughly 862,000 cubic yards of waste spread over an area of about 120,000 sq. feet. A residential dwelling has been erected at the top of this waste rock pile. The Big Five Mine settling pond measures approximately 7,088 square feet in size and contains an estimated 263 cubic yards of waste. This settling pond has no liner and the berm comprising the bank of the pond may be subject to leakage.
The Mill Works area, down gradient of the Big Five Mine, contains filled-in lagoons that measure approximately 8,000 square feet in size and contain an estimated volume of 2,100 cubic yards of waste (UOS 1997). A private residence is located on the south side of Lefthand Creek approximately 100 ft. down gradient from the mill and directly across the creek from the filled-in mill lagoons. Groundwater samples collected at the residential domestic well and an additional well drilled nearby indicated the presence of cadmium, calcium, copper, lead, manganese, and zinc. There are 45 additional wells situated down valley of the site that have yet to be sampled (UOS 1997).
Photo 2. Big Five Tailings Pile (Walsh 2004)
Soil samples collected in 1992, during the SSI, indicated high concentrations of a number of organic and inorganic compounds. Arsenic exceeded the health-based standard at all soil locations. Additionally, a number of uncovered tailings piles, unmanaged ore concentrates, and surface soil contaminants could pose a threat of dust emissions from these source areas,
14
Public Health Assessment Captain Jack Mill
particularly to the nearby residents. However, no air sampling data has been collected to date, and widespread contaminant movement cannot be documented (UOS 1997).
Public exposure to contaminants may also occur through recreational activities on Lefthand Creek. A Boulder County park/picnic area is present approximately 12 miles down gradient of the site along Lefthand Creek (UOS 1997).
2. URS Operating Services Expanded Site Inspection (1997) URS Operating Services, Inc (UOS) has prepared an Analytical Results Report (ARR) for the sampling that was conducted on June 26 and 27, 1997 (UOS 1998). This report is the basis of the screening and exposure dose calculations for COCs that were outlined earlier in this document. Field activities followed the standard site inspection format and met the requirements of the URS Operating Service’s “Generic Quality Assurance Project Plan” (EPA 1992, 1993; UOS 1995a). All of the samples were analyzed through the EPA’s Contract Laboratories Program, Routine Analytical Services for the Target Analyte List (TAL). This includes analysis of total and dissolved metals; cyanide, Total Organic Carbon (TOC), and hardness.
The twenty-six samples that were collected during the 1997 Expanded Site Inspection (ESI) were composed of groundwater, surface water, sediment, and waste source/tailings matrices. The sampling included grab, or short-term samples, which characterize the contamination at a specific time period. The sampling data is used to determine the overall sources of contamination and potential routes of exposure to the COCs. Non-sampling data was also collected during the ESI to determine the flow rate of the Big Five mine adit discharge, gather evidence on contaminant releases, and provide documentation/observation of fishery and wetland habitats.
A summary of the relevant sampling activities used in the preparation of this document will be presented in the following section. Additional materials from the ARR have been selected and included in Appendix D2 for further information. The complete report is available in the information repositories established at the Colorado Department of Public Health and Environment Records Center, the U.S. EPA Region 8 Records Center, the Ward Public Library and the Boulder Public Library.
C. Exposure Pathways and Contaminants of Concern The following section describes the possible ways that people could come into contact with contaminants at the Captain Jack Mill Superfund Site. Completed exposure pathways are examined for potential public health implications. Potential exposure pathways, which could require additional data to be fully characterized, are discussed along with the additional data needed to fully describe these pathways. Eliminated exposure pathways are dismissed from further examination since people are not likely to come into contact with these contaminants.
The three major routes of exposure that are considered in public health assessments are ingestion, inhalation, and dermal (skin) contact. For a contaminant to cause adverse health effects, it must enter into the body by one of these routes. As previously mentioned, a viable route of exposure coupled with a source of contamination, a contaminated medium (e.g. water), a point of exposure, and a receptor population are all necessary components of a completed exposure pathway. The completed exposure pathways are presented below.
15
Public Health Assessment Captain Jack Mill
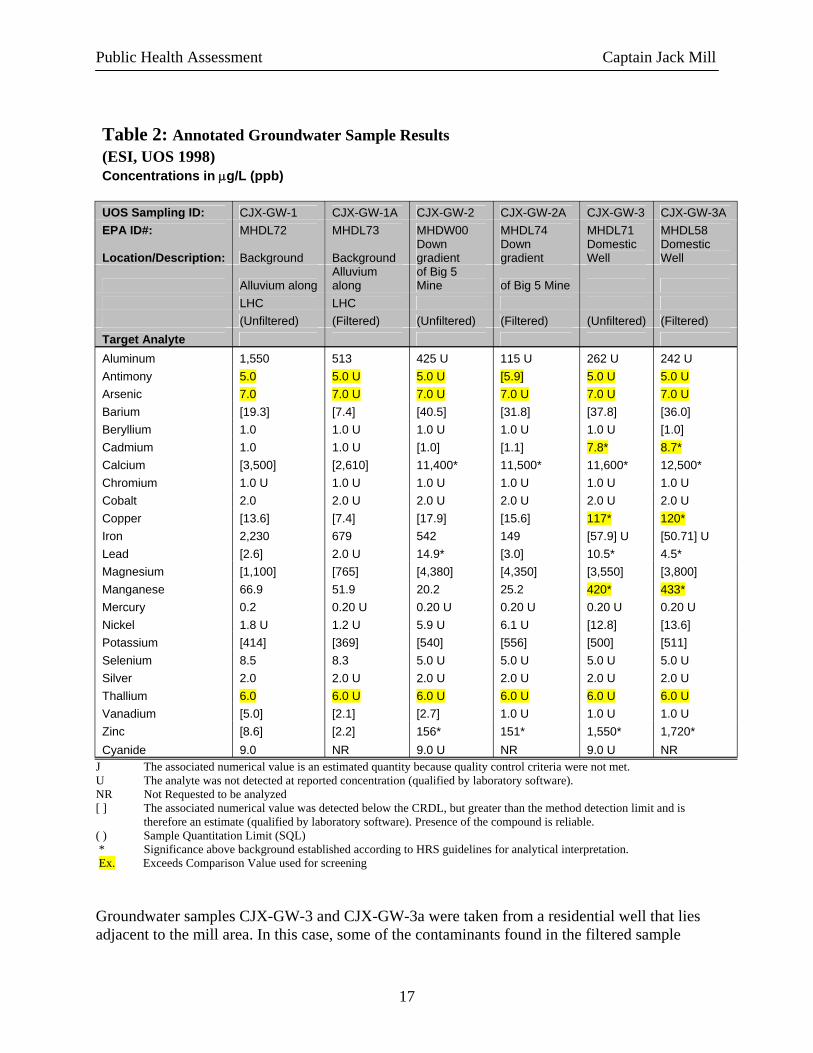
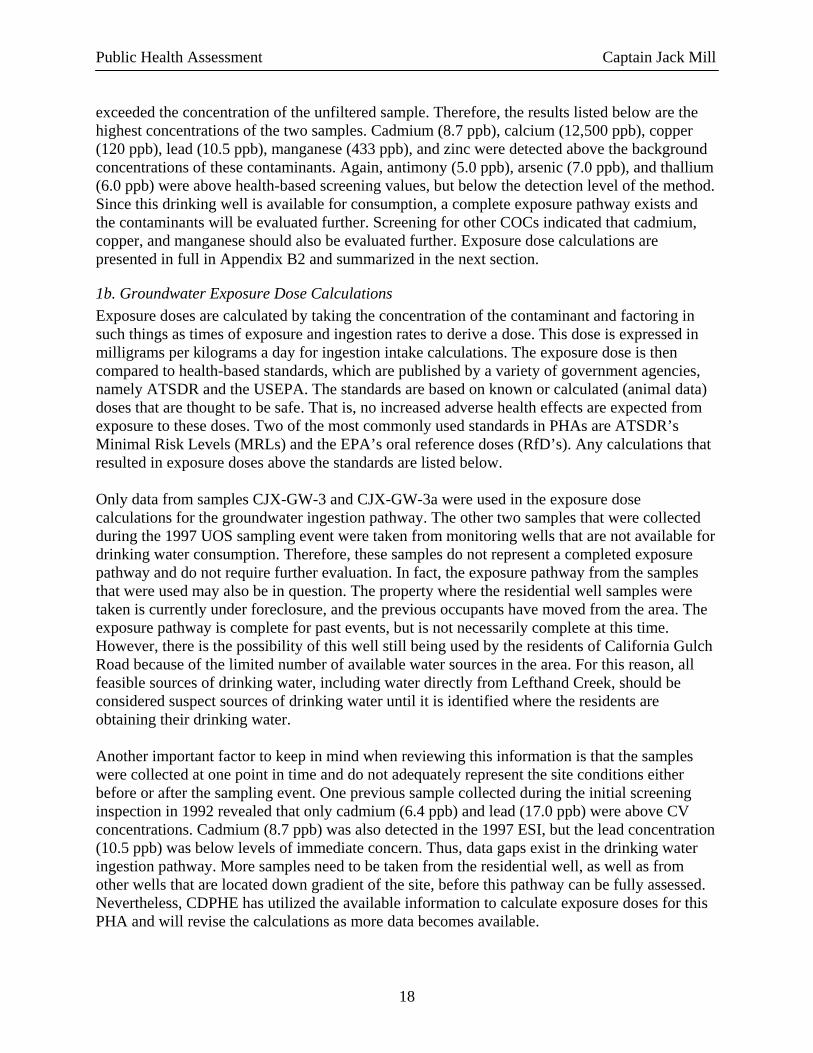
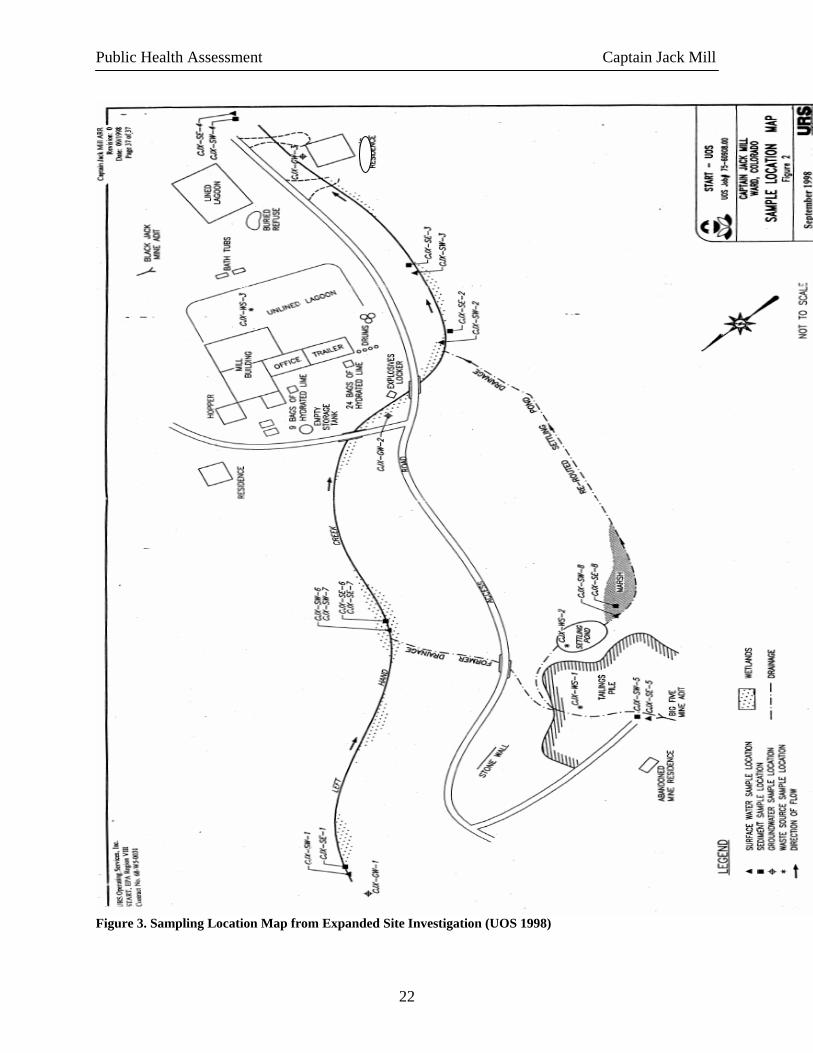
1a. Groundwater (Ingestion) UOS collected groundwater samples at three locations during the ESI activities conducted on July 25 and 26, 1997. An unfiltered sample and a filtered sample were collected at each location producing a total of 6 groundwater samples. The first sample set was collected up gradient of any known contamination from the Big Five Mine. The second sample set was collected down gradient of the Big Five Mine adit and up gradient from the residential well. The third sample set was collected from a residential domestic well adjacent to the mill. Figure 3 displays the locations of the samples from the 1997 ESI.
The groundwater samples were analyzed for Target Analyte List (TAL) inorganic contaminants. Field parameters of temperature, pH, and conductivity were also measured. Table 2 is an annotated version of the groundwater data. Highlighted results exceeded the initial screening comparison values. The complete sampling results and information on data qualifiers may be found in Appendix D. Unfiltered samples end in whole numbers and the filtered samples end with an “a” (i.e. CJX-GW-3a). Only unfiltered samples are normally used for PHAs as they likely represent the worst-case scenario. In the situation where the filtered sample exceeds the concentration of the unfiltered sample, the higher concentration is used for screening.
Samples CJX-GW-1 and CJX-GW-1a were taken up gradient of the Big Five Mine adit. This sample set serves as a background due to the fact that there are no known influences or documented release of contaminants to this area from the site. Groundwater sample set CJX-GW-2 was collected down gradient of the Big Five Mine adit and up gradient of any influences of the mill. The results are presented in concentrations of parts per billion or ppb. This sample (CJX-GW-2) contained the following contaminants above background levels: calcium (11,400 ppb), lead (14.9 ppb), and zinc (156 ppb) as total metals concentrations. Screening for contaminants of concern (COCs) also indicated elevated levels of antimony (5.0 ppb), arsenic (7.0 ppb), and thallium (6.0 ppb). However, the last three contaminants were not detected above background concentrations and the reported concentrations are below the laboratory detection level for the contaminants. This well is also not available for drinking water consumption, and exposure to these contaminants is not likely. Therefore, no COCs from this sample will be evaluated further.
16
Public Health Assessment Captain Jack Mill
Table 2: Annotated Groundwater Sample Results (ESI, UOS 1998) Concentrations in µg/L (ppb)
CJX-GW-1 CJX-GW-1A CJX-GW-2 CJX-GW-2A CJX-GW-3 CJX-GW-3A MHDW00
/Domestic Well
Domestic Well
of Big 5 Mine of Big 5 Mine
LHC LHC ) ) )
1,550 513 425 U 115 U 262 U 242 U Antimony 5.0 5.0 U 5.0 U [5.9] 5.0 U 5.0 U Arsenic 7.0 7.0 U 7.0 U 7.0 U 7.0 U 7.0 U Barium [19.3] [7.4] [40.5] [31.8] [36.0]
1.0 1.0 U 1.0 U 1.0 U 1.0 U [1.0] Cadmium 1.0 [1.0] [1.1] 7.8* 8.7*
[3,500] [2,610] 1.0 U 1.0 U 1.0 U 1.0 U 1.0 U 2.0 2.0 U 2.0 U 2.0 U [13.6] [7.4] [17.9] [15.6]
Iron 2,230 679 542 149 [50.71] U [2.6] 14.9* [3.0] 10.5* 4.5* [1,100] [765] [4,350] [3,800] 66.9 51.9 20.2 25.2 0.2 0.20 U 0.20 U 0.20 U
Nickel 1.8 U 1.2 U 5.9 U 6.1 U [12.8] [13.6] Potassium [414] [369] [540] [556] [500] [511]
8.5 8.3 5.0 U 5.0 U 5.0 U Silver 2.0 2.0 U 2.0 U 2.0 U
6.0 6.0 U 6.0 U 6.0 U 6.0 U 6.0 U [5.0] [2.1] [2.7] 1.0 U 1.0 U 1.0 U
Zinc [8.6] [2.2] 9.0 NR 9.0 U NR 9.0 U NR
UOS Sampling ID: EPA ID#: MHDL72 MHDL73 MHDL74 MHDL71 MHDL58
Location Description: Background Background Down gradient
Down gradient
Alluvium along Alluvium along
(Unfiltered (Filtered) (Unfiltered (Filtered) (Unfiltered (Filtered) Target Analyte Aluminum
[37.8] Beryllium
1.0 U Calcium 11,400* 11,500* 11,600* 12,500* Chromium 1.0 U Cobalt 2.0 U 2.0 U Copper 117* 120*
[57.9] U Lead 2.0 U Magnesium [4,380] [3,550] Manganese 420* 433* Mercury 0.20 U 0.20 U
Selenium 5.0 U 2.0 U 2.0 U
Thallium Vanadium
156* 151* 1,550* 1,720* Cyanide
J The associated numerical value is an estimated quantity because quality control criteria were not met. U The analyte was not detected at reported concentration (qualified by laboratory software).NR Not Requested to be analyzed [ ] The associated numerical value was detected below the CRDL, but greater than the method detection limit and is
therefore an estimate (qualified by laboratory software). Presence of the compound is reliable. ( ) Sample Quantitation Limit (SQL) * Significance above background established according to HRS guidelines for analytical interpretation.
Ex. Exceeds Comparison Value used for screening
Groundwater samples CJX-GW-3 and CJX-GW-3a were taken from a residential well that lies adjacent to the mill area. In this case, some of the contaminants found in the filtered sample
17
Public Health Assessment Captain Jack Mill
exceeded the concentration of the unfiltered sample. Therefore, the results listed below are the highest concentrations of the two samples. Cadmium (8.7 ppb), calcium (12,500 ppb), copper (120 ppb), lead (10.5 ppb), manganese (433 ppb), and zinc were detected above the background concentrations of these contaminants. Again, antimony (5.0 ppb), arsenic (7.0 ppb), and thallium (6.0 ppb) were above health-based screening values, but below the detection level of the method. Since this drinking well is available for consumption, a complete exposure pathway exists and the contaminants will be evaluated further. Screening for other COCs indicated that cadmium, copper, and manganese should also be evaluated further. Exposure dose calculations are presented in full in Appendix B2 and summarized in the next section.
1b. Groundwater Exposure Dose Calculations Exposure doses are calculated by taking the concentration of the contaminant and factoring in such things as times of exposure and ingestion rates to derive a dose. This dose is expressed in milligrams per kilograms a day for ingestion intake calculations. The exposure dose is then compared to health-based standards, which are published by a variety of government agencies, namely ATSDR and the USEPA. The standards are based on known or calculated (animal data) doses that are thought to be safe. That is, no increased adverse health effects are expected from exposure to these doses. Two of the most commonly used standards in PHAs are ATSDR’s Minimal Risk Levels (MRLs) and the EPA’s oral reference doses (RfD’s). Any calculations that resulted in exposure doses above the standards are listed below.
Only data from samples CJX-GW-3 and CJX-GW-3a were used in the exposure dose calculations for the groundwater ingestion pathway. The other two samples that were collected during the 1997 UOS sampling event were taken from monitoring wells that are not available for drinking water consumption. Therefore, these samples do not represent a completed exposure pathway and do not require further evaluation. In fact, the exposure pathway from the samples that were used may also be in question. The property where the residential well samples were taken is currently under foreclosure, and the previous occupants have moved from the area. The exposure pathway is complete for past events, but is not necessarily complete at this time. However, there is the possibility of this well still being used by the residents of California Gulch Road because of the limited number of available water sources in the area. For this reason, all feasible sources of drinking water, including water directly from Lefthand Creek, should be considered suspect sources of drinking water until it is identified where the residents are obtaining their drinking water.
Another important factor to keep in mind when reviewing this information is that the samples were collected at one point in time and do not adequately represent the site conditions either before or after the sampling event. One previous sample collected during the initial screening inspection in 1992 revealed that only cadmium (6.4 ppb) and lead (17.0 ppb) were above CV concentrations. Cadmium (8.7 ppb) was also detected in the 1997 ESI, but the lead concentration (10.5 ppb) was below levels of immediate concern. Thus, data gaps exist in the drinking water ingestion pathway. More samples need to be taken from the residential well, as well as from other wells that are located down gradient of the site, before this pathway can be fully assessed. Nevertheless, CDPHE has utilized the available information to calculate exposure doses for this PHA and will revise the calculations as more data becomes available.
18
Public Health Assessment Captain Jack Mill
Based on the exposure assumptions, the only COC dose that exceeded the health-based guidelines (MRLs or RfDs) for groundwater ingestion was cadmium. This contaminant exceeded the minimal risk level dose for both children and adults under the assumed conditions. The cadmium exposure dose estimate for children also exceeded EPA’s oral reference dose (RfD). However, these standards are based upon experimental tiers called the no observed adverse effect level (NOAEL) and the lowest observed adverse effect level (LOAEL). Protective factors are then added into the NOAEL and LOAEL to derive the conservative health-based guidelines. In this case, the Minimal Risk Level was derived from the NOAEL from a human case study. The concentration that produced no observable adverse health effects in humans was 0.0021 mg/kg-day, which is well above the exposure doses calculated for groundwater ingestion.
1c. Toxicological Evaluation The levels of cadmium in the residential well do not appear to represent a public health hazard. The NOAEL in humans is 0.0021 mg/kg-day and the estimated exposure doses of groundwater ingestion of cadmium are 0.00054 mg/kg-day (child) and 0.00025 mg/kg-day (adult). Cadmium exposure doses below the NOAEL are not likely to produce adverse health effects. The assumptions used to calculate exposure dose estimates are designed to be protective. That is, they are based on ingestion rates that overestimate the likely real-world exposures. In this case, the children’s exposure dose (for those 6 and under) is based on the consumption of 1L of water per day from the well, 365 days a year, for a 6 year time period. The adult dose is based on 2L per day, 365 days a year, for a period of 30 years. In essence, the assumptions reflect a higher dose than that which is likely to be ingested so that public health measures are sufficiently protective.
Multiple routes of exposure could increase the overall exposure dose of cadmium and increase the risk of adverse health effects. Furthermore, individuals in poor health may be more sensitive to cadmium than those in the study, upon which the NOAEL is based. These factors are currently under consideration and until more information is made available for review, water consumption from the well should be limited.
2a. Surface Water (Ingestion) Due to the limited number of drinking water sources in the California Gulch, it is possible that some of the local population uses areas of Lefthand Creek for water consumption. This assumption has not been verified, but until further information is available that suggests otherwise, this is considered a potential pathway and will be evaluated.
Nine co-located surface water and sediment samples were collected around the site during the 1997 ESI conducted by UOS. Of these nine, 2 (CJX-SW-7 and CJX-SW-10) were gathered for quality control purposes leaving 7 samples for review. Sample CJX-SW-1 was taken from Lefthand Creek up gradient of any known site influences; this sample serves as background. Samples CJX-SW-(2), (3), (4), and (6) were strategically taken from areas along Lefthand Creek in relation to the Probable Points of Entry (PPE) of site contaminants (See Figure 3). These samples were selected for further analysis, while the remaining samples [CJX-SW-(5) and (8)] were dismissed from further evaluation. CJX-SW-5 was taken from the Big Five adit drainage and CJX-SW-8 was taken from a marsh area below the mine’s settling pond. These areas are unsuitable for water consumption and will not be evaluated in this pathway. See Section 4 for further information on these samples.
19
Public Health Assessment Captain Jack Mill
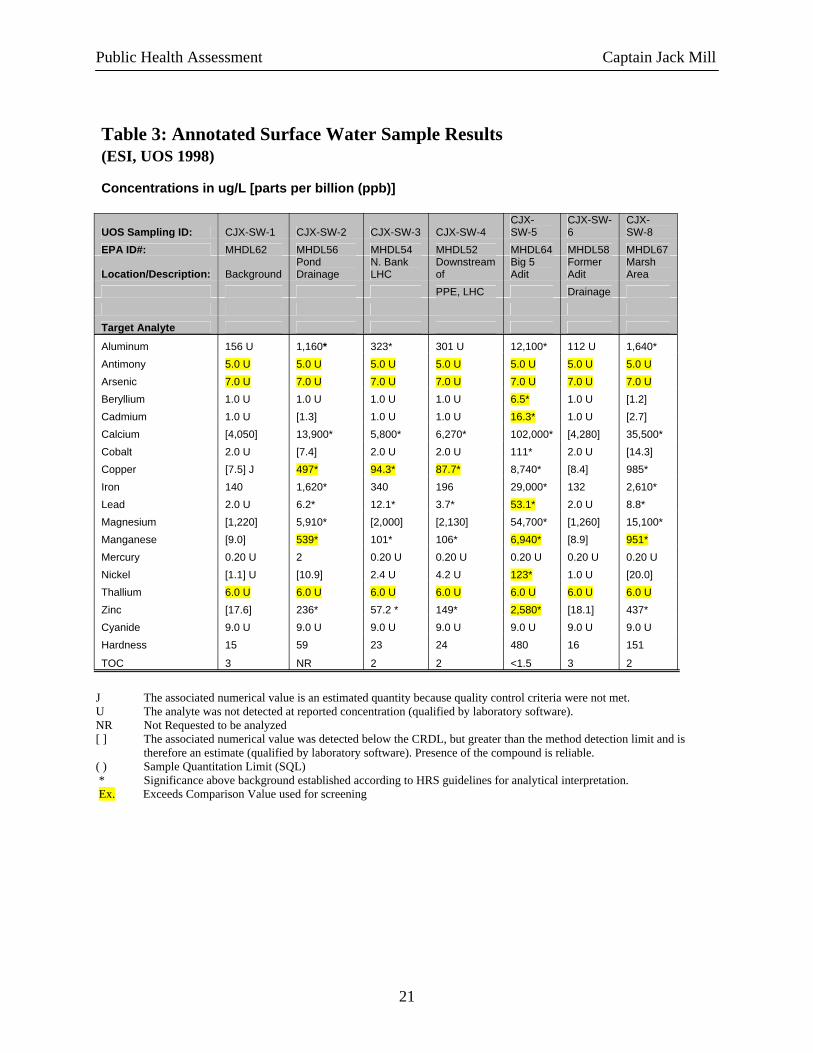
Of the samples that were selected for CV screening (CJX-SW-2,3,4,6), antimony, arsenic, copper, manganese, and thallium were selected for further evaluation. The highest reported concentrations from all of the selected samples were: antimony (5.0 ppb), arsenic (7.0 ppb), copper (497 ppb), manganese (539 ppb), and thallium (6.0 ppb). Antimony, arsenic, and thallium exceeded the comparison values for drinking water, but the chemicals were below the detection limit of the analytical method. The assumptions made for the surface water ingestion exposure were modified from those of the groundwater calculations because it is unreasonable to believe that individuals will be exposed under the same conditions. Table 3 is an annotated version of the surface water results that were collected during the ESI. The highlighted values are discussed in the following section. The complete results for surface water can be found in Appendix D.
2b. Surface Water Exposure Dose Calculations (Ingestion) Exposure dose estimates for surface water ingestion were calculated for antimony, arsenic, copper, manganese, and thallium. The calculations were based upon the concentrations of the contaminants in samples CJX-SW-(2),(3),(4), and (6). The highest reported concentrations from these samples were used in the initial exposure dose calculations. If this exposure estimate warranted further evaluation, the concentrations of the other samples were taken into consideration (i.e. copper, manganese).
Under the assumed conditions of exposure, only copper dose estimates exceeded health-based standards for drinking water from Lefthand Creek. Sample CJX-SW-2, which was taken from the confluence of the Big Five Mine settling pond drainage and Lefthand Creek, exceeded the MRL and Oral RfD for copper exposure. The reported concentration from this sample was 497 ppb copper, and the exposure dose estimates for children and adults are 0.026 mg/kg-day and 0.012 mg/kg-day, respectively. The minimal risk level and oral reference dose are both 0.01 mg/kg-day. Two other samples that were taken downstream of CJX-SW-2 were also analyzed. CJX-SW-3 and CJX-SW-4 exposure dose estimates for copper intake do not exceed the MRL or the Oral RfD.
Manganese and thallium were selected for further evaluation due to a lack of health-based guidelines for comparison. The exposure dose estimates will be compared to doses derived from available scientific literature for the toxicological evaluation of these contaminants.
20
Public Health Assessment Captain Jack Mill
Table 3: Annotated Surface Water Sample Results (ESI, UOS 1998)
Concentrations in ug/L [parts per billion (ppb)]
CJX-SW-1 CJX-SW-2 CJX-SW-3 CJX-SW-4 CJX-SW-5
CJX-SW-6
CJX-SW-8
MHDL62 MHDL56 MHDL54 MHDL52 MHDL64 MHDL58 MHDL67
Background Pond Drainage
N. Bank LHC of
Big 5 Adit Adit
Marsh Area
PPE, LHC Drainage
Aluminum 1,160* 323* 301 U 12,100* 112 U 1,640* 5.0 U 5.0 U 5.0 U 5.0 U 5.0 U 5.0 U 5.0 U
Arsenic 7.0 U 7.0 U 7.0 U 7.0 U 7.0 U 7.0 U 7.0 U 1.0 U 1.0 U 1.0 U 1.0 U 6.5* [1.2]
Cadmium 1.0 U [1.3] 1.0 U 1.0 U 16.3* [2.7] Calcium [4,050] 13,900* 5,800* 6,270* 102,000* [4,280] 35,500* Cobalt 2.0 U [7.4] 2.0 U 2.0 U 111* 2.0 U [14.3] Copper 497* 94.3* 87.7* 8,740* [8.4] 985* Iron 140 1,620* 340 196 29,000* 132 2,610* Lead 6.2* 12.1* 3.7* 53.1* 8.8* Magnesium [1,220] 5,910* [2,000] [2,130] 54,700* [1,260] 15,100* Manganese [9.0] 539* 101* 106* 6,940* [8.9] 951*
0.20 U 2 0.20 U 0.20 U 0.20 U 0.20 U 0.20 U Nickel [1.1] U [10.9] 2.4 U 4.2 U 123* [20.0]
6.0 U 6.0 U 6.0 U 6.0 U 6.0 U 6.0 U 6.0 U Zinc [17.6] 236* 149* 2,580* [18.1] 437*
9.0 U 9.0 U 9.0 U 9.0 U 9.0 U 9.0 U 9.0 U Hardness 15 59 23 24 480 16 151
TOC 3 NR 2 2 <1.5 3 2
UOS Sampling ID: EPA ID#:
Location/Description: Downstream Former
Target Analyte
156 U Antimony
Beryllium 1.0 U 1.0 U
[7.5] J
2.0 U 2.0 U
Mercury 1.0 U
Thallium 57.2 *
Cyanide
J The associated numerical value is an estimated quantity because quality control criteria were not met. U The analyte was not detected at reported concentration (qualified by laboratory software).NR Not Requested to be analyzed [ ] The associated numerical value was detected below the CRDL, but greater than the method detection limit and is
therefore an estimate (qualified by laboratory software). Presence of the compound is reliable. ( ) Sample Quantitation Limit (SQL) * Significance above background established according to HRS guidelines for analytical interpretation.
Ex. Exceeds Comparison Value used for screening
21
Public Health Assessment Captain Jack Mill
Figure 3. Sampling Location Map from Expanded Site Investigation (UOS 1998)
22
Public Health Assessment Captain Jack Mill
2c. Toxicological Evaluation (Surface Water Ingestion) Copper: The initial exposure dose estimates for copper intake were based upon the concentration of copper in the surface water sample (CJX-SW-2), which was collected near the confluence of the Big Five settling pond drainage and Lefthand Creek. These estimates exceeded the intermediate exposure MRL (15-365 days) of 0.01 mg/kg-day for both children and adults. No scientific literature was available for review on chronic exposures (more than 365 days) to copper. Two other surface water samples were also taken from Lefthand Creek down gradient of sample CJX-SW-2. These samples were analyzed and exposure doses were calculated under the same conditions as the other surface water ingestion calculations.
The analysis revealed that estimated copper exposures downstream of the settling pond drainage into Lefthand Creek did not exceed the Intermediate MRL or EPA’s Oral RfD. In light of these estimates, it is believed that copper exposures are only above health-based guidelines at the point of confluence between the Big Five settling pond drainage and Lefthand Creek. Metals loading into Lefthand Creek from the drainage are diluted upon entry by the normal water flow of the creek. The resultant copper dilution at this point in time was below levels of immediate concern from a public health perspective. However, the flow rates of the creek fluctuate throughout the year and can affect the concentration levels of contaminants. Sampling for the ESI was conducted over a two-day time period and cannot accurately account for the actual copper concentration throughout the year. As such, water consumption from Lefthand Creek should be limited until further data can verify the safety of this exposure route.
Manganese: Similar to the oral copper exposure described above, manganese ingestion exposures appear to be greatest near the confluence of the Big Five Mine settling pond drainage and Lefthand Creek. Sample CJX-SW-2 contained 0.539 mg/L of manganese at the entry point of the drainage (PPE) while the down gradient samples, CJX-SW-3 and CJX-SW-4, contained 0.101 mg/L and 0.106 mg/L respectively. Exposure dose calculations for children range from 0.0075 mg/kg-day at the PPE to 0.005 mg/kg-day at the downstream samples. Adult exposure dose estimates ranged from 0.0034 mg/kg-day to 0.0024 mg/kg-day.
In the absence of health-based guidelines for comparison, CDPHE utilized the provisional guidance value for oral intake of 0.07 mg/kg-day to determine the potential for adverse health effects. None of the exposure estimates, including the dose based on the concentration at the PPE, exceeded this guideline. In addition, exposure dose estimates were also below the human LOAEL of 0.059 mg/kg (ATSDR 2000). Therefore, oral exposure to manganese from Lefthand Creek does not appear to represent a significant public health hazard at this time and will not be evaluated further. Additional toxicity information on manganese can be found in the complete toxicological profile at http://www.atsdr.cdc.gov/toxprofiles/tp151.html.
Thallium: Thallium concentrations in Lefthand Creek were above environmental CVs, but were below the detection limit of the analytical method. As such, the actual concentration is somewhere in the range of 0-6 ppb. For exposure dose calculations, the median value of 3.0 ppb was used. At this concentration, the exposure dose estimate was 0.00015 mg/kg-day for children and 0.00007
23
Public Health Assessment Captain Jack Mill
mg/kg-day for adults. No MRL or Oral RfD currently exists for thallium ingestion due to a lack of animal and human data. In fact, only limited animal and human data exists, making the public health evaluation of this contaminant extremely difficult.
The available experimental data regarding thallium toxicity was reviewed and was found to be insufficient for the purposes of this PHA. Oral thallium intake in humans has been associated with axonal degeneration of the cranial and peripheral nerves. However, either the exposure levels of the studies were not provided or if available, the levels far exceeded those expected to occur in the environment. Structural and functional changes of peripheral nerves in animals following oral exposure seem to confirm the findings in humans. Since these studies evaluated only one dose level and one additional study using multiple doses did not demonstrate neurological effects, data gaps exist relative to dose-response relationships for this target tissue (ATSDR 1992).
Exposure dose calculations resulted in an extremely low dose level and it cannot accurately be determined what the potential health effects of this contaminant may be. Based on this data, thallium intake does not appear to represent a public health hazard. However, this contaminant will be kept for further evaluation as additional data becomes available to verify this conclusion.
3a. Soil (Ingestion) The sampling data from the initial Site Investigation (SSI 1992) was screened first for potential soil ingestion contaminants. Sixteen soil samples were collected from the site during the SSI. One sample (CJM-SO-1) was collected up gradient of the site and serves as the background sample for this event. Soil samples CJM-SO-3 through CJM-SO-14 were all taken in the vicinity of the mill works area and three residential samples were collected from the property across from the mill (CJM-SO-15 – CJM-SO-17). The most important samples, in terms of public health, from the SSI are the residential samples.
Soil samples CJM-SO-15, CJM-SO-16, and CJM-SO-17 were all taken within 200 feet of the residential property across from the mill building. Arsenic and manganese exceeded ATSDR Comparison Values (CVs). Lead was detected at 4,110 parts per million (ppm) in CJM-SO-16 and 1,220 ppm in CJM-SO-17 (URS 1994). The 7 residents that occupied the property at the time of the SSI have since moved from the area, and the house is currently under the ownership of a bank. Therefore, a completed exposure pathway does not appear to exist at this time. However, the exposure pathway is complete for past exposures and will be discussed in greater detail in the following sections.
Three soil samples were collected during the 1997 Expanded Site Inspection (ESI). These samples were taken to further document contamination of waste source areas, not to identify soil contamination. As such, the samples have been dismissed from further evaluation due to lack of a completed pathway.
24
Public Health Assessment Captain Jack Mill
3b. Soil Ingestion Calculations No exposure dose calculations were performed for soil ingestion because the pathway is not complete at the current time. Furthermore, there are numerous uncertainties associated with the samples, which are discussed in the next section.
3c. Toxicological Evaluation (Soil Ingestion) The soil samples in question (CJM-SO-15 – CJM-SO-17) were collected in August of 1992 during the SSI. No other samples have been collected since that date, making the available data over 12 years old at the time of review for this PHA. The 3 samples were collected at one time from a reported sampling depth of less than 2 feet below ground surface, which raises questions as to the actual contamination level that is available for ingestion. Furthermore, the lead concentration on the residential property sample CJM-SO-16 (4,110 ppm) was greater than any of the other soil samples collected throughout the site during the SSI. This could indicate that the source of the contamination is not site-related.
The combination of a number of uncertainties makes it extremely difficult to draw the correct conclusions from this data. As such, more data is required before a final conclusion can be made on this pathway. CDPHE will retain these contaminants from the soil ingestion pathway for future analysis and review. All future data for this pathway will be reviewed for public health concerns. At this time, small children should be kept from the area until it is deemed safe. Children generally ingest more soil than adults from playing, eating, etc. and are likely to be impacted the greatest from this pathway’s contaminants.
4a. Surface Water (Dermal) Information gathered from community interviews indicates that individuals and children wade or enter surface waters within the area of the CJM site. Some contaminants from surface water have the ability to cross the protective barrier of the skin and enter into the bloodstream or tissues. Dermal permeability refers to this ability of contaminants to penetrate through the skin. The dermal permeability property is chemical-specific and generally occurs at a higher rate for organic compounds. At the CJM site, inorganic contaminants are most prevalent.
Assessing the absorbed dose from dermal contact with surface water can be complicated. Dermal permeability constants are not defined for all contaminants. In this case, default values for dermal permeability of water are used. The value is protective in that most contaminants do not pass through the skin at as high of a rate as water. However, this also introduces a degree of uncertainty; meaning that the actual absorbed dose could be either higher or lower than the exposure dose estimate for dermal contact. Furthermore, chemicals and compounds are absorbed more readily in certain areas of the body, which may also be chemical specific. These are important factors to consider when reviewing any dermal dose calculations. Overall, the dose derived from dermal exposures is considered to be relatively unimportant in comparison to ingestion and inhalation routes of exposure.
4b. Surface Water (Dermal) Exposure Calculations Dermal exposure dose estimates were calculated by taking the concentration of the contaminant in the surface water and factoring in such things as exposure duration, frequency, and averaging time; chemical permeability constants, and body weight. Drinking water comparison values were
25
Public Health Assessment Captain Jack Mill
used for the initial screening of COCs. Some contaminants that were flagged during this screening were automatically excluded because of the fact that they were individually unimportant in the ingestion exposures for surface water and are also not expected to be of concern for dermal exposures (antimony, beryllium, thallium, and zinc). The contaminants that did meet the following criteria and will be used for dermal exposure dose calculations are arsenic, copper, and lead. The Big Five adit drainage and the marsh area, which the drainage has created were also included in the exposure dose calculations. These areas are completely accessible and information gathered from site visits suggests that people may wade in the waters.
The exposure dose calculations indicate that there is no significant risk of adverse human health effects from dermal contact with surface waters within the Captain Jack Mill site. Technically, sediment contaminant concentrations should also be factored into the dermal exposure scenario. However, these calculations require data that is not currently available including: soil type and the soil-skin adherence factor. If this data becomes available, dermal exposure should be reassessed. At the current time, dermal exposure to surface water does not appear to represent a health hazard.
D. Potential Exposure Paths
1. Fish (Ingestion)Fish have the potential to accumulate some of the contaminants found at the site in their tissue. Therefore, it is possible that contaminants from Acid Mine Drainage (AMD) could enter fish tissue from the surface water (Lefthand Creek), be consumed by humans, and potentially cause adverse health effects. This pathway is of particular significance for those metals which might bioaccumulate (e.g., cadmium, mercury as methyl mercury). The Colorado Division of Wildlife (CDOW) describes the creek as a viable fishery and information derived from community interviews indicates that people fish in Lefthand Creek and consume the fish caught.
However, there are currently no fish tissue samples pertaining to the CJM Superfund site. Fish tissue data is required to make any assessment about possible health effects from AMD impacts on fish and fish consumption by humans. This is a potential exposure pathway, since information on one or more of the elements of the pathway is (are) missing.
2. Plants (Ingestion)Some California Gulch residents consume plants that could potentially be contaminated by AMD from the Big Five Mine adit. There is currently insufficient information to determine if plants collected in the area accumulate metals from AMD. Information in the scientific literature indicates that some plants accumulate certain metals. Further complicating this picture is the fact that the uptake of metals is very dependent on soil pH. As the soil becomes more acidic, the potential for metals to be absorbed by the roots of the plant increases.
Information about plant use in the area is very limited. The way the plants are used or consumed will affect the exposure dose that an individual receives from metals that might be in or on the plants. In addition, exposure to contamination from the site can result in soil or dust accumulation on the plants. In some instances the highest potential risk at sites contaminated with heavy metals is from eating soil or dust remaining on plants. Eliminating carryover soil
26
Public Health Assessment Captain Jack Mill
from plant materials as well as from clothing and hands (especially after petting a domestic dog that has played in contaminated soil or swam in AMD) is an important step in preventing exposure to these contaminants.
Based on the limited information available, CDPHE cannot currently assess the potential health risks from consuming or otherwise using plants collected from impacted areas. No plant tissue samples in the California Gulch were taken during the 1997 URS analysis. This is a potential exposure pathway, since information on one or more of the elements of the pathway are missing.
3. Air (Inhalation)No air sampling has been conducted at the site. Therefore, there is insufficient information to determine if the air contains contaminants at levels that could be a health concern. Contaminants can enter into the air through a variety of methods such as wind, evaporation, and movement. The site is located in a narrow valley, which may limit the overall ability of contaminants to migrate beyond the area adjacent to the site. However, variable high winds do persist in the eastern foothills and may contribute to sporadic increases of contaminant migration from waste piles into the air. This is a potential exposure pathway, since information on one or more of the elements of the pathway are missing.
E. Physical Hazards There are numerous mine openings and sinkholes scattered throughout the CJM site, which present physical hazards. Many of the openings are uncovered and completely accessible. Small children and adults could possibly injure themselves by falling or entering unstable areas. Access to these areas needs to be limited to protect human health.
F. Health Outcome Data Superfund law requires that health outcome data be considered in a public health assessment. Health outcome data can include mortality and morbidity information. To thoroughly evaluate health outcome data as it relates to a hazardous waste site, four elements are necessary: 1) The presence of a completed human exposure pathway, 2) sufficiently high contaminant levels to result in measurable health effects, 3) a sufficient number of exposed individuals for health effects to be measured, and 4) a health outcome database in which disease rates for populations of concern can be identified.
The Captain Jack Mill Superfund site does not meet all of the requirements necessary for a complete health outcome data review. Although completed exposure pathways do exist at the site, the contaminant levels, exposures, and exposed population are not great enough to result in a meaningful interpretation of health outcome data. As such, health outcome data will not be evaluated further at this time.
G. Child Health Considerations ATSDR recognizes that infants and children may be more vulnerable to exposures than adults when faced with contamination of air, water, soil, or food. This vulnerability is a result of the following factors:
• Children are more likely to play outdoors and bring food into contaminated areas.
27
Public Health Assessment Captain Jack Mill
• Children are shorter and their breathing zone is closer to the ground, resulting in a greater likelihood to breathe dust, soil, and heavy vapors.
• Children are smaller and receive higher doses of chemical exposure per body weight.
• Children’s developing body systems are more vulnerable to toxic exposures, especially during critical growth stages in which permanent damage may be incurred.
CDPHE and ATSDR have taken these child health considerations into account throughout this PHA while assessing exposures to children.
H. Community Health Concerns Community concerns were solicited from four distinct community groups: residents of California Gulch Road; residents of the Town of Ward; residents of the communities of Rowena and Jamestown; and residents of the City of Boulder.
1. California Gulch Road Individuals and families living along one of three branches of California Gulch Road will be impacted the greatest by remediation activities including dust, noise, and traffic. Residents here expressed a great deal of concern, primarily dealing with the direct impact associated with the clean-up process. Some residents were concerned that they may be moved out of the Gulch. Questions concerning contaminated dust, truck traffic, and noise also arose. They wanted the clean up to occur quickly with minimal disruption to their lifestyle. Additionally, due to a lack of interaction with government officials, these residents may be somewhat distrustful of the Superfund process and those involved.
One property owner said that the mine negatively impacted her property. The acid mine drainage from the tunnel is of great concern to her and her family. They have frequently shoveled soil in an attempt to prevent the orange-colored water from flowing into Lefthand Creek. No other residents felt they had experienced any problems on the property in which they are living. Everyone stated they want to be kept informed. The kinds of information they desire include: progress reports and timelines; what chemicals were used in the mining process, what raw minerals are leaching from the adit, and how the watershed as a whole will be addressed.
2. The Town of Ward Ward is a small, independent mountain community, located just a mile and a half north of the site. Although it is close to the site, to date it has not been significantly impacted. If the Superfund boundaries do not extend into the town limits, the impact to Ward will be primarily from the construction and traffic affiliated with a remedial action effort, and possibly, from any stigma attached to being located near a Superfund site.
Residents in the town of Ward, have many issues and concerns. They would like to see the cleanup done in an environmentally sound manner, completely finished and funded. They want to know the cleanup processes and timelines. The residents are concerned about the dust, noise and traffic that may be associated with the cleanup. They hope the historic aspects of the area,
28
Public Health Assessment Captain Jack Mill
including the mill, will be valued. Ward residents also worry that there may be a lack of true community input in the decisions EPA and the state make concerning the cleanup.
3. Rowena/Jamestown A third sub-community, also located within the Lefthand Watershed, includes Rowena, located in unincorporated Boulder County (shares Jamestown mailing address) and the town of Jamestown. This community is highly interested in the Superfund process and greatly influenced by its outcome. Many of the homes, including all homes along the Lefthand Creek corridor (Rowena) have private drinking water wells. The town of Jamestown, however, is served by a municipal surface water treatment and distribution system that derives its water from James Creek.
The residents of Rowena and Jamestown are concerned that the cleanup be completed cost effectively and in a timely manner. They worry that Superfund dollars may dry up before the cleanup is complete, or that additional contaminants could be released downstream during the cleanup process. Residents are concerned about the watershed as a whole and want all agencies and funding sources to work together to address the problem. They want knowledgeable, experienced contractors to do the work. Finally, they are concerned about the people living in the Gulch and the equipment and truck traffic traveling to and from the site.
4. The City of Boulder Boulder residents are concerned for the people living in the gulch. They would like the bureaucracy to be aware of community concerns and issues and work strongly and closely with all components of the various communities.
Boulder residents fear that the cleanup could release contaminants that could move downstream. They hope to see other mines in the watershed addressed as well, and they desire all factors and perimeters outside the targeted site be carefully considered.
5. Lefthand Watershed Task Force and the Community Advisory Group for the Environment (CAGE), currently Lefthand Watershed Oversight Group (LWOG)
Additionally, a review of comments from the Lefthand Watershed Task Force and the Community Advisory Group for the Environment (CAGE) were reviewed. Although they created a list of both “positive experiences” and “negative experiences”, only the negative experiences are summarized here in order to better address communication concerns (LWTF 2002).
Comments • Residents were frustrated by the tendency of EPA and CDPHE personnel to be
“vague and imprecise” when it did not appear to be necessary. • “Contradictory” messages were sent to the community. EPA and CDPHE personnel
have contradicted each other. • The EPA and CDPHE have “created confusion about the immediate health risks”.
They have created the public perception for many that there is an immediate health
29
Public Health Assessment Captain Jack Mill
risk. However, when asked directly, they say that there is not an immediate health risk and there is no data that indicates there is a risk.
V. Conclusions The environmental data collected to date from the Captain Jack site is not sufficient to completely determine the public health impacts associated with the site. Therefore, exposures to site-related contaminants pose an indeterminate public health hazard. The hazard ranking system for consideration to the National Priorities List (NPL) scored the site as significant enough for a listing, but that score is based primarily on impacts to wetlands and aquatic habitat (NACCHO 2001). The human health concerns at this time are primarily related to the presence of physical hazards at the site.
Waste rock and acid mine drainage appear to be the major sources of contamination. Additionally, numerous uncovered tailings impoundments, uncontained ore concentrates, and surface soil contaminants are present. The tailings piles from the various abandoned mine sites are not geologically stable and are therefore vulnerable to being displaced by floods. In addition, wind blown contaminants in the soil and tailings piles could be significant in terms of public health.
The specific conclusions drawn within this PHA are: • Physical hazards, such as open mine shafts and sinkholes, are present at the CJM site that
could be dangerous • The residential groundwater well across from the mill works area contained increased
levels of cadmium. However, the estimated exposure dose did not exceed the human No Observable Adverse Effects Level (NOAEL). Additional data should be collected to verify the safety of this well.
• Estimated surface water ingestion doses exceeded the health-based guidelines for some contaminants. Additional water sample data needs to be collected from Lefthand Creek, as well as information regarding the drinking water habits of the residents in the California Gulch before an accurate public health conclusion can be made for this pathway.
• High levels of lead contamination were found within 200 feet of the residential property across from the mill works area. An accurate public health conclusion cannot be made regarding the soil ingestion pathway because of uncertainties with the available data. Additional soil sampling should be performed on this property to verify the safety of this pathway.
• Additional information also needs to be gathered for potential pathways listed within this PHA, namely air and fish samples, to determine the potential public health impacts of these pathways.
VI. Recommendations CDPHE recommends that the following actions be taken to reduce exposure to contaminants found at the CJM site. The recommendations in this section were based upon the findings of this Public Health Assessment and are designed to protect the community and visitors from the
30
Public Health Assessment Captain Jack Mill
increased possibility of adverse health effects from site-related contaminants. Although many data gaps were identified within this document, specific additional sampling is not recommended at this time because of the Remedial Investigation and Feasibility Study now underway. This data will be reviewed before recommending any additional sampling events. The recommendations are as follows:
� Community members, residents, visitors, and on-site workers avoid unnecessary contact with mine tailings, acid mine drainage, and sediments from mine excavations in the California Gulch
� Users of the area should minimize consumption of area well water until data indicate exposures to these media do not represent a health risk.
� Community members, residents, and visitors should avoid the consumption of water from Lefthand Creek in the immediate vicinity of the CJM site until this pathway is deemed safe.
� Community members, residents, and visitors should consider not eating fish caught in Lefthand Creek in the immediate vicinity of the California Gulch until it can be determined if these fish contain elevated levels of metals associated with site-related contamination, which could present health risks.
� The EPA or other appropriate agencies should collect fish tissue (edible portion) data from Lefthand Creek downstream of the site to determine if fish in the area have accumulated concentrations of contaminants at levels that could present health risks.
� If acid mine drainage contaminants from the CJM Superfund site are found to be accumulating in fish collected from the impacted creek, CDPHE recommends that EPA or other appropriate agency investigate other wildlife for the potential to be accumulating contaminants from the site.
� People who collect plants in the vicinity of California Gulch for consumptive or other purposes should select harvest locations as far from the mine sites as possible. It is also recommended that these plants be washed with non-contaminated water to remove dust and dirt from the plants to help minimize potential risks from consuming or using plants from the area.
� EPA, or another appropriate agency should take actions to assure dust minimization at the site during remedial operations. Perimeter dust sampling should also take place to reduce any potential future acid mine drainage-contaminated dust exposures.
� EPA or other appropriate agencies need to restrict public access to the mines in the CJM site and isolate sink holes and other pits that may pose a hazard.
31
Public Health Assessment Captain Jack Mill
VII. Public Health Action Plan The Public Health Action Plan is an outline of the actions that are to be taken at the CJM site after the completion of this Public Health Assessment. The purpose of a Public Health Action Plan is to ensure that the public health hazards identified within this document are reduced or prevented so that human health effects are not expected from the environmental contamination or physical hazards present at the site. CDPHE is committed to follow up on this plan to ensure that the appropriate actions have or will be implemented. The specific public health actions to be taken are as follows:
¾ This PHA was released for public comment for a 45 day period. During this time, the affected community was encouraged to provide feedback on the PHA to enhance the usefulness of the document. These comments were considered in this final draft of the PHA.
¾ A fact sheet that discusses the findings of this public health assessment has been developed and distributed to citizens living on or near the Superfund site.
¾ CDPHE will reevaluate this public health assessment for the Captain Jack Mill Superfund site as new information and data become available.
¾ The Public Health Action Plan will be revised as new information becomes available from the RI/FS or other data.
32
Public Health Assessment Captain Jack Mill
VIII. Preparers of Report
Thomas Simmons Physical Scientist
Environmental Health Studies Colorado Dept. of Public Health and Environment
Phone: 303-692-2961 Fax: 303-782-0904
E-mail: [email protected]
Margaret Schonbeck Physical Scientist Research Scientist
Program Manager, Environmental Health Studies/Colorado Responds to Children with Special Needs (CRCSN)
Colorado Dept. of Public Health and Environment Phone: 303-692-2636 Fax: 303-782-0904
E-mail: [email protected]
Beth Ann Williams Health Educator/Community Involvement Specialist
Environmental Health Studies Colorado Dept. of Public Health and Environment
Phone: 303-692-2704 Fax: 303-782-0904
E-mail: [email protected]
ATSDR DESIGNATED REVIEWER
Jennifer Freed Technical Project Officer
Division of Health Assessment and Consultation Agency for Toxic Substances and Disease Registry
33
Public Health Assessment Captain Jack Mill
IX. References
Agency for Toxic Substances and Disease Registry (ATSDR), 1992. “Toxicological Profile for Thallium, July 1992. http://www.atsdr.cdc.gov/toxprofiles/tp54.html.
Agency for Toxic Substances and Disease Registry (ATSDR), 2000. “Toxicological Profile for Manganese, September 2000. http://www.atsdr.cdc.gov/toxprofiles/tp151.html.
Cobb, Harrison S. 1988. “Prospecting Our Past: Gold, Silver and Tungsten Mills of Boulder County.” The Book Lode, Boulder, Colorado.
Colorado Department of Public Health and Environment (CDPHE), 2003. “Recent History of EPA and CDPHE Involvement in the Lefthand Creek Watershed”.
Colorado Division of Minerals and Geology (CDMG). 1993. Memorandum from Harry Posey to Carl Mount and Bruce Humphries regarding metals contamination in Left Hand Creek, Boulder County, Blackjack Mine and Mill, January 26, 1993.
Colorado Division of Minerals and Geology (CDMG). 1997. Conversation on February 20, 1997, with Carl Mount regarding Paul Danio's compliance with the 1995 settlement agreement.
Colorado Geological Survey (CGS), 1911. “The Geology of the Ward Region, Boulder County, Colorado,” Bulletin 21. P. G. Worcester.
Colorado Mined Land Reclamation Division (CMLRD). 1992a. Captain Jack Mill site files.
Colorado Mined Land Reclamation Division (CMLRD), 1992b. Personal communication of URS Consultants, Inc. with Jim Stevens, CMLRD official, February 10, 1992.
Colorado Mined Land Reclamation Division (CMLRD), 1992c. Minerals Program Inspection Report prepared by Carl Mount, October 21, 1992.
Ecology & Environment, Inc. (E&E), 1993. “Site Assessment Report, Captain Jack Mill Site,” Ward, Colorado. Prepared by Jerry Goedert of E&E Technical Assistance Team (TAT), April 20, 1993.
Lefthand Watershed Task Force (LWTF). March 11, 2002. “Lefthand Watershed Task Force Final Report to the Boulder County Board of Health”.
National Association of County and City Health Officials (NACCHO), Environmental Health, Community Needs Assessment Report, Captain Jack Mill & Burlington Mine Sites, Boulder County, Colorado. Revised June, 2001.
Pettem, Silvia. Red Rocks to Riches: Gold Mining in Boulder County, Then and Now, 1980.
34
Public Health Assessment Captain Jack Mill
Stewart, Maxine F., 1993. Memorandum to Carl Mount of CDMG, “Inspection of Black Jack Mill, Boulder County, To Evaluate the Environmental Stability of the Tailings Pond, Chemical Storage, and Concentrate Storage Areas, and to Determine if an Emergency Response by EPA is Warranted,” prepared by Maxine F. Stewart, Environmental Consultant to the Mined Land Reclamation Board, March 20, 1993.
U.S. Department of Commerce, Census Bureau, 2000. Summary of Population and Housing Characteristics, Boulder County.
U.S. Environmental Protection Agency (EPA), 1989. Risk Assessment Guidance for Superfund Human Health Evaluation Manual Volume I. December 1989.
U.S. Environmental Protection Agency (EPA), 1992. “Guidance for Performing Site Inspections Under CERCLA,” Interim Final. September 1992.
U.S. Environmental Protection Agency (EPA), 1993. “Region VIII Supplement to Guidance for Performing Site Inspections under CERCLA.” January 1993.
U.S. Environmental Protection Agency (EPA), 2002. “Hazard Ranking System Documentation Record, Captain Jack Mill.” August 1, 2002.
U.S. Geological Survey (USGS), 1978a. 7½ Minute Topographic Quadrangle, Ward, Colorado.
URS Consultants, Inc. (URS), 1992. SSI Field activities, August 24-28, 1992.
URS Consultants, Inc. (URS), 1994. Analytical Results Report for the Captain Jack Mill site, March 3, 1994, and records from site visit to Foster residence on January 6, 1994.
URS Operating Services, Inc. (UOS), 1995a. “Generic Quality Assurance Project Plan.” December 1995.
URS Operating Services, Inc. (UOS), 1995b. “Technical Standard Operating Procedures for the Superfund Technical Assessment and Response Team (START), EPA Region VIII.” December 1995.
URS Operating Services, Inc. (UOS), 1997. Personal communication between Mr. Dean Havens and Kevin Mackey (CDPHE). February 20, 1997.
URS Operating Services, Inc. (UOS). 1998. Analytical Results Report from June, 1997 Expanded Screening Investigation: Captain Jack Mill Site, Ward, Colorado.
Walsh Environmental Scientists and Engineers, LLC. (Walsh), 2004. Remedial Investigation and Feasibility Study Work Plan. August 16, 2004.
35
Public Health Assessment Captain Jack Mill
X. Appendices
Appendix A. ATSDR Plain Language Glossary of Environmental Health Terms
Absorption: How a chemical enters a person's blood after the chemical has been swallowed, has come into contact with the skin, or has been breathed in.
Acute Exposure: Contact with a chemical that happens once or only for a limited period of time. ATSDR defines acute exposures as those that might last up to 14 days.
Additive Effect: A response to a chemical mixture, or combination of substances, that might be expected if the known effects of individual chemicals, seen at specific doses, were added together.
Adverse Health Effect: A change in body function or the structures of cells that can lead to disease or health problems.
Antagonistic Effect: A response to a mixture of chemicals or combination of substances that is less than might be expected if the known effects of individual chemicals, seen at specific doses, were added together.
ATSDR: The Agency for Toxic Substances and Disease Registry. ATSDR is a federal health agency in Atlanta, Georgia that deals with hazardous substance and waste site issues. ATSDR gives people information about harmful chemicals in their environment and tells people how to protect themselves from coming into contact with chemicals.
Background Level: An average or expected amount of a chemical in a specific environment. Or, amounts of chemicals that occur naturally in a specific environment.
Bioavailability: See Relative Bioavailability.
Biota: Used in public health, things that humans would eat - including animals, fish and plants.
CAP: See Community Assistance Panel.
Cancer: A group of diseases which occur when cells in the body become abnormal and grow, or multiply, out of control
Carcinogen: Any substance shown to cause tumors or cancer in experimental studies.
CERCLA: See Comprehensive Environmental Response, Compensation, and Liability Act.
Chronic Exposure: A contact with a substance or chemical that happens over a long period of time. ATSDR considers exposures of more than one year to be chronic.
36
Public Health Assessment Captain Jack Mill
Completed Exposure Pathway: See Exposure Pathway.
Community Assistance Panel (CAP): A group of people from the community and health and environmental agencies who work together on issues and problems at hazardous waste sites.
Comparison Value (CVs): Concentrations or the amount of substances in air, water, food, and soil that are unlikely, upon exposure, to cause adverse health effects. Comparison values are used by health assessors to select which substances and environmental media (air, water, food and soil) need additional evaluation while health concerns or effects are investigated.
Comprehensive Environmental Response, Compensation, and Liability Act (CERCLA): CERCLA was put into place in 1980. It is also known as Superfund. This act concerns releases of hazardous substances into the environment, and the cleanup of these substances and hazardous waste sites. ATSDR was created by this act and is responsible for looking into the health issues related to hazardous waste sites.
Concern: A belief or worry that chemicals in the environment might cause harm to people.
Concentration: How much or the amount of a substance present in a certain amount of soil, water, air, or food.
Contaminant: See Environmental Contaminant.
Delayed Health Effect: A disease or injury that happens as a result of exposures that may have occurred far in the past.
Dermal Contact: A chemical getting onto your skin. (see Route of Exposure).
Dose: The amount of a substance to which a person may be exposed, usually on a daily basis. Dose is often explained as "amount of substance(s) per body weight per day".
Dose / Response: The relationship between the amount of exposure (dose) and the change in body function or health that result.
Duration: The amount of time (days, months, years) that a person is exposed to a chemical.
Environmental Contaminant: A substance (chemical) that gets into a system (person, animal, or the environment) in amounts higher than that found in Background Level, or what would be expected.
Environmental Media: Usually refers to the air, water, and soil in which chemical of interest are found. Sometimes refers to the plants and animals that are eaten by humans. Environmental Media is the second part of an Exposure Pathway.
U.S. Environmental Protection Agency (EPA): The federal agency that develops and enforces environmental laws to protect the environment and the public's health.
37
Public Health Assessment Captain Jack Mill
Epidemiology: The study of the different factors that determine how often, in how many people, and in which people disease will occur.
Exposure: Coming into contact with a chemical substance.(For the three ways people can come in contact with substances, see Route of Exposure.)
Exposure Assessment: The process of finding the ways people come in contact with chemicals, how often and how long they come in contact with chemicals, and the amounts of chemicals with which they come in contact.
Exposure Pathway: A description of the way that a chemical moves from its source (where it began) to where and how people can come into contact with (or get exposed to) the chemical.
ATSDR defines an exposure pathway as having 5 parts: o Source of Contamination, o Environmental Media and Transport Mechanism, o Point of Exposure, o Route of Exposure; and, o Receptor Population.
When all 5 parts of an exposure pathway are present, it is called a Completed Exposure Pathway. Each of these 5 terms is defined in this Glossary.
Frequency: How often a person is exposed to a chemical over time; for example, every day, once a week, and twice a month.
Hazardous Waste: Substances that have been released or thrown away into the environment and, under certain conditions, could be harmful to people who come into contact with them.
Health Effect: ATSDR deals only with Adverse Health Effects (see definition in this Glossary).
Indeterminate Public Health Hazard: The category is used in Public Health Assessment documents for sites where important information is lacking (missing or has not yet been gathered) about site-related chemical exposures.
Ingestion: Swallowing something, as in eating or drinking. It is a way a chemical can enter your body (See Route of Exposure).
Inhalation: Breathing. It is a way a chemical can enter your body (See Route of Exposure).
LOAEL: Lowest Observed Adverse Effect Level. The lowest dose of a chemical in a study, or group of studies, that has caused harmful health effects in people or animals.
Malignancy: See Cancer.
38
Public Health Assessment Captain Jack Mill
MRL: Minimal Risk Level. An estimate of daily human exposure - by a specified route and length of time -- to a dose of chemical that is likely to be without a measurable risk of adverse, noncancerous effects. An MRL should not be used as a predictor of adverse health effects.
NPL: The National Priorities List. (Which is part of Superfund.) A list kept by the U.S. Environmental Protection Agency (EPA) of the most serious, uncontrolled or abandoned hazardous waste sites in the country. An NPL site needs to be cleaned up or is being looked at to see if people can be exposed to chemicals from the site.
NOAEL: No Observed Adverse Effect Level. The highest dose of a chemical in a study, or group of studies, that did not cause harmful health effects in people or animals.
No Apparent Public Health Hazard: The category is used in ATSDR's Public Health Assessment documents for sites where exposure to site-related chemicals may have occurred in the past or is still occurring but the exposures are not at levels expected to cause adverse health effects.
No Public Health Hazard: The category is used in ATSDR's Public Health Assessment documents for sites where there is evidence of an absence of exposure to site-related chemicals.
PHA: Public Health Assessment. A report or document that looks at chemicals at a hazardous waste site and tells if people could be harmed from coming into contact with those chemicals. The PHA also tells if possible further public health actions are needed.
Plume: A line or column of air or water containing chemicals moving from the source to areas further away. A plume can be a column or clouds of smoke from a chimney or contaminated underground water sources or contaminated surface water (such as lakes, ponds and streams).
Point of Exposure: The place where someone can come into contact with a contaminated environmental medium (air, water, food or soil). Some examples include: the area of a playground that has contaminated dirt, a contaminated spring used for drinking water, the location where fruits or vegetables are grown in contaminated soil, or the backyard area where someone might breathe contaminated air.
Population: A group of people living in a certain area; or the number of people in a certain area.
PRP: Potentially Responsible Party. A company, government or person that is responsible for causing the pollution at a hazardous waste site. PRP's are expected to help pay for the clean up of a site.
Public Health Assessment(s): See PHA.
Public Health Hazard: The category is used in PHAs for sites that have certain physical features or evidence of chronic, site-related chemical exposure that could result in adverse health effects.
39
Public Health Assessment Captain Jack Mill
Public Health Hazard Criteria: PHA categories given to a site which tell whether people could be harmed by conditions present at the site. Each is defined in the Glossary. The categories are:
o Urgent Public Health Hazard o Public Health Hazard o Indeterminate Public Health Hazard o No Apparent Public Health Hazard o No Public Health Hazard
Receptor Population: People who live or work in the path of one or more chemicals, and who could come into contact with them (See Exposure Pathway).
Reference Dose (RfD): An estimate, with safety factors (see safety factor) built in, of the daily, life-time exposure of human populations to a possible hazard that is not likely to cause harm to the person.
Relative Bioavailability: The amount of a compound that can be absorbed from a particular medium (such as soil) compared to the amount absorbed from a reference material (such as water). Expressed in percentage form.
Route of Exposure: The way a chemical can get into a person's body. There are three exposure routes:
o breathing (also called inhalation), o eating or drinking (also called ingestion), and/or o getting something on the skin (also called dermal contact).
Safety Factor: Also called Uncertainty Factor. When scientists don't have enough information to decide if an exposure will cause harm to people, they use "safety factors" and formulas in place of the information that is not known. These factors and formulas can help determine the amount of a chemical that is not likely to cause harm to people.
SARA: The Superfund Amendments and Reauthorization Act in 1986 amended CERCLA and expanded the health-related responsibilities of ATSDR. CERCLA and SARA direct ATSDR to look into the health effects from chemical exposures at hazardous waste sites.
Sample Size: The number of people that are needed for a health study.
Sample: A small number of people chosen from a larger population (See Population).
Source (of Contamination): The place where a chemical comes from, such as a landfill, pond, creek, incinerator, tank, or drum. Contaminant source is the first part of an Exposure Pathway.
Special Populations: People who may be more sensitive to chemical exposures because of certain factors such as age, a disease they already have, occupation, sex, or certain behaviors (like cigarette smoking). Children, pregnant women, and older people are often considered special populations.
40
Public Health Assessment Captain Jack Mill
Statistics: A branch of the math process of collecting, looking at, and summarizing data or information.
Superfund Site: See NPL.
Survey: A way to collect information or data from a group of people (population). Surveys can be done by phone, mail, or in person. ATSDR cannot do surveys of more than nine people without approval from the U.S. Department of Health and Human Services.
Synergistic effect: A health effect from an exposure to more than one chemical, where one of the chemicals worsens the effect of another chemical. The combined effect of the chemicals acting together is greater than the effects of the chemicals acting by themselves.
Toxic: Harmful. Any substance or chemical can be toxic at a certain dose (amount). The dose is what determines the potential harm of a chemical and whether it would cause someone to get sick.
Toxicology: The study of the harmful effects of chemicals on humans or animals.
Tumor: Abnormal growth of tissue or cells that have formed a lump or mass.
Uncertainty Factor: See Safety Factor.
Urgent Public Health Hazard: This category is used in ATSDR's Public Health Assessment documents for sites that have certain physical features or evidence of short-term (less than 1 year), site-related chemical exposure that could result in adverse health effects and require quick intervention to stop people from being exposed.
41
Public Health Assessment Captain Jack Mill
Appendix B. Explanation of Evaluation Process
B.1 Screening Process In evaluating the available environmental data, CDPHE used comparison values (CVs) to determine which chemicals to examine in greater detail. CVs are the contaminant concentrations found in specific media (air, soil, or water) and are used to select contaminants for further evaluation. CVs incorporate assumptions of daily exposure to the chemical and a standard amount of air, water, or soil that someone might inhale or ingest each day.
As health-based thresholds, CVs are set at a concentration below which no known or anticipated adverse health effects are likely to occur. Different CVs are developed for cancer and noncancer health effects. Noncancer levels are based on valid toxicology studies for a chemical, with appropriate safety factors included, and the assumption that small children (22 pounds) and adults are exposed every day. Cancer levels are based on a one-in-a-million excess cancer risk for an adult eating contaminated soil or drinking contaminated every day for a period of 70 years. For chemicals with both cancer and noncancer health effects, the lower level is used in order to be protective. Exceeding a CV at this point does not indicate that adverse health effects will occur, only that further evaluation is necessary.
The CVs used within this document are listed below:
Environmental Media Evaluation Guide (EMEG): EMEGs are estimated contaminant concentrations in a specific media where noncarcinogenic health effects are unlikely. EMEGs are derived from the Agency for Toxic Substances and Disease Registry’s minimal risk level (MRL).
Cancer Risk Evaluation Guides (CREG): CREGs are estimated contaminant concentrations that would be expected to cause no more than one additional excess cancer in one million people exposed over a lifetime. CREGs are calculated from the U.S. Environmental Protection Agency’s cancer slope factors (CSF).
Reference Media Evaluation Guide (RMEG): RMEGs are estimated contaminant concentrations in a media where noncarcinogenic health effects are unlikely. RMEGs are derived from EPA’s reference dose (RfD).
EPA Soil Screening Levels (SSL): SSLs are estimated contaminant concentrations in soil at which additional evaluation is needed to determine if action is required to eliminate or reduce exposure.
Some CVs may be based on different durations of exposure. Acute duration is defined as exposure lasting up to 14 days. Intermediate duration exposure lasts between 15 and 365 days, and chronic duration exposures last more than 1 year. Comparison values based on chronic exposure studies are used whenever possible.
42

Public Health Assessment Captain Jack Mill
B.2. Determination of Exposure Pathways Human exposure pathways are identified by examining environmental and human components that might lead to contact with contaminants of concern (COCs). A pathway analysis considers five principal elements: a source of contamination, transport through an environmental medium, a point of exposure, a route of human exposure, and an exposed population. Completed exposure pathways are those for which all five of the elements are evident and indicate that exposure to a contaminant has occurred in the past, is now occurring, or will occur in the future. Potential exposure pathways are those which exposure seems possible, but one or more of the elements is not clearly defined. Potential pathways indicate that exposure to a contaminant could have occurred in the past, could be occurring now, or could occur in the future. The identification of an exposure pathway does not imply that health effects will always occur.
B.3. Evaluation of Public Health Implications The next step in the process is to take the contaminants at levels above the CVs and further identify which chemicals and exposure situations are likely to be a health hazard. Child and adult exposure doses are calculated for the site-specific exposure scenario, which is based upon assumptions of who goes on site and how often they contact the site contaminants. The exposure dose is the estimated amount of contaminant that enters a person’s body. The following information is a brief explanation of how exposure doses were calculated for this PHA.
Groundwater Ingestion Pathway The exposure doses for the groundwater ingestion pathway were calculated under the following assumptions:
o Average Intake Rate for children: 1L per day o Average Intake Rate for adults: 2L per day o Exposure frequency of 365 days per year o Exposure duration for children (6 and under): 6 years o Exposure duration for adults: 30 years o Average body weight of children: 16 kg or approximately 35 lbs. o Average body weight of adults: 70 kg or about 154 lbs. o Average time of exposure for children: 2,190 days (6 yrs.) o Average time of exposure for adults: 10,950 days (30 yrs.)
43
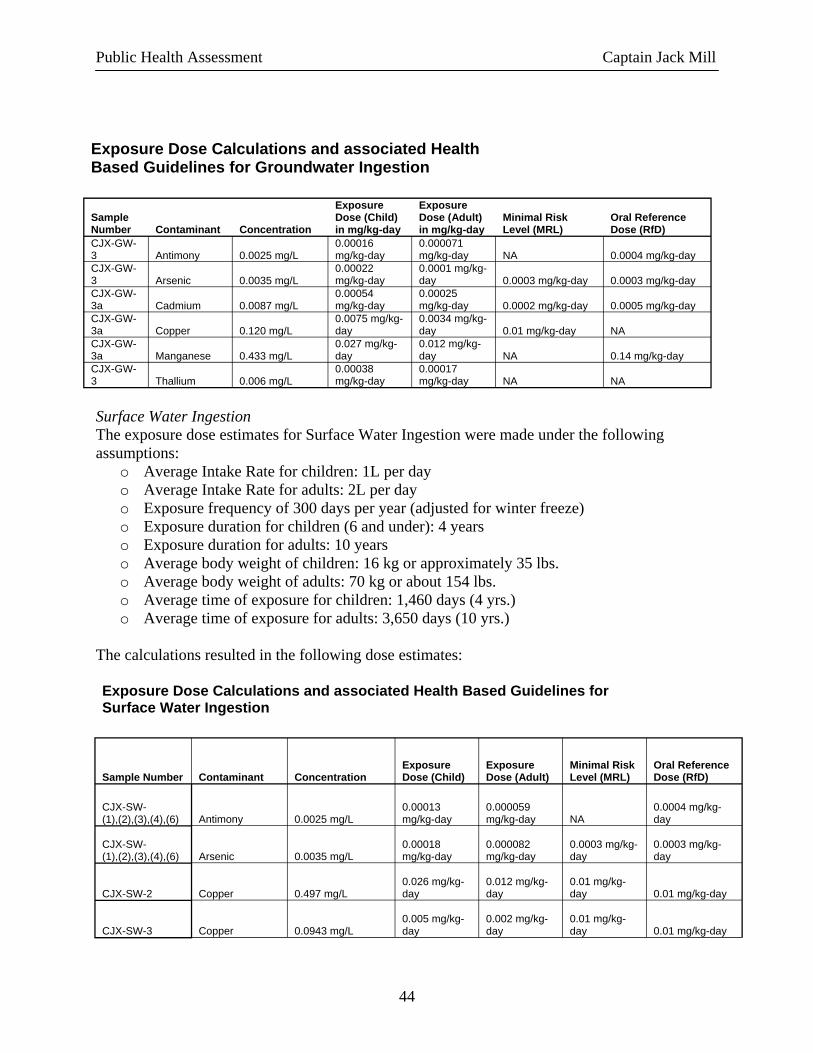
Public Health Assessment Captain Jack Mill
Exposure Dose Calculations and associated Health Based Guidelines for Groundwater Ingestion
Sample Number Contaminant Concentration
Exposure Dose (Child) in mg/kg-day
Exposure Dose (Adult) in mg/kg-day
Minimal Risk Level (MRL)
Oral Reference Dose (RfD)
CJX-GW- 0.00016 0.000071 3 Antimony 0.0025 mg/L mg/kg-day mg/kg-day NA 0.0004 mg/kg-day CJX-GW- 0.00022 0.0001 mg/kg-3 Arsenic 0.0035 mg/L mg/kg-day day 0.0003 mg/kg-day 0.0003 mg/kg-day CJX-GW- 0.00054 0.00025 3a Cadmium 0.0087 mg/L mg/kg-day mg/kg-day 0.0002 mg/kg-day 0.0005 mg/kg-day CJX-GW- 0.0075 mg/kg- 0.0034 mg/kg-3a Copper 0.120 mg/L day day 0.01 mg/kg-day NA CJX-GW- 0.027 mg/kg- 0.012 mg/kg-3a Manganese 0.433 mg/L day day NA 0.14 mg/kg-day CJX-GW- 0.00038 0.00017 3 Thallium 0.006 mg/L mg/kg-day mg/kg-day NA NA
Surface Water Ingestion The exposure dose estimates for Surface Water Ingestion were made under the following assumptions:
o Average Intake Rate for children: 1L per day o Average Intake Rate for adults: 2L per day o Exposure frequency of 300 days per year (adjusted for winter freeze) o Exposure duration for children (6 and under): 4 years o Exposure duration for adults: 10 years o Average body weight of children: 16 kg or approximately 35 lbs. o Average body weight of adults: 70 kg or about 154 lbs. o Average time of exposure for children: 1,460 days (4 yrs.) o Average time of exposure for adults: 3,650 days (10 yrs.)
The calculations resulted in the following dose estimates:
Exposure Dose Calculations and associated Health Based Guidelines for Surface Water Ingestion
Sample Number Contaminant Concentration Exposure Dose (Child)
Exposure Dose (Adult)
Minimal Risk Level (MRL)
Oral Reference Dose (RfD)
CJX-SW- 0.00013 0.000059 0.0004 mg/kg-(1),(2),(3),(4),(6) Antimony 0.0025 mg/L mg/kg-day mg/kg-day NA day
CJX-SW- 0.00018 0.000082 0.0003 mg/kg- 0.0003 mg/kg-(1),(2),(3),(4),(6) Arsenic 0.0035 mg/L mg/kg-day mg/kg-day day day
0.026 mg/kg- 0.012 mg/kg- 0.01 mg/kg-CJX-SW-2 Copper 0.497 mg/L day day day 0.01 mg/kg-day
0.005 mg/kg- 0.002 mg/kg- 0.01 mg/kg-CJX-SW-3 Copper 0.0943 mg/L day day day 0.01 mg/kg-day
44
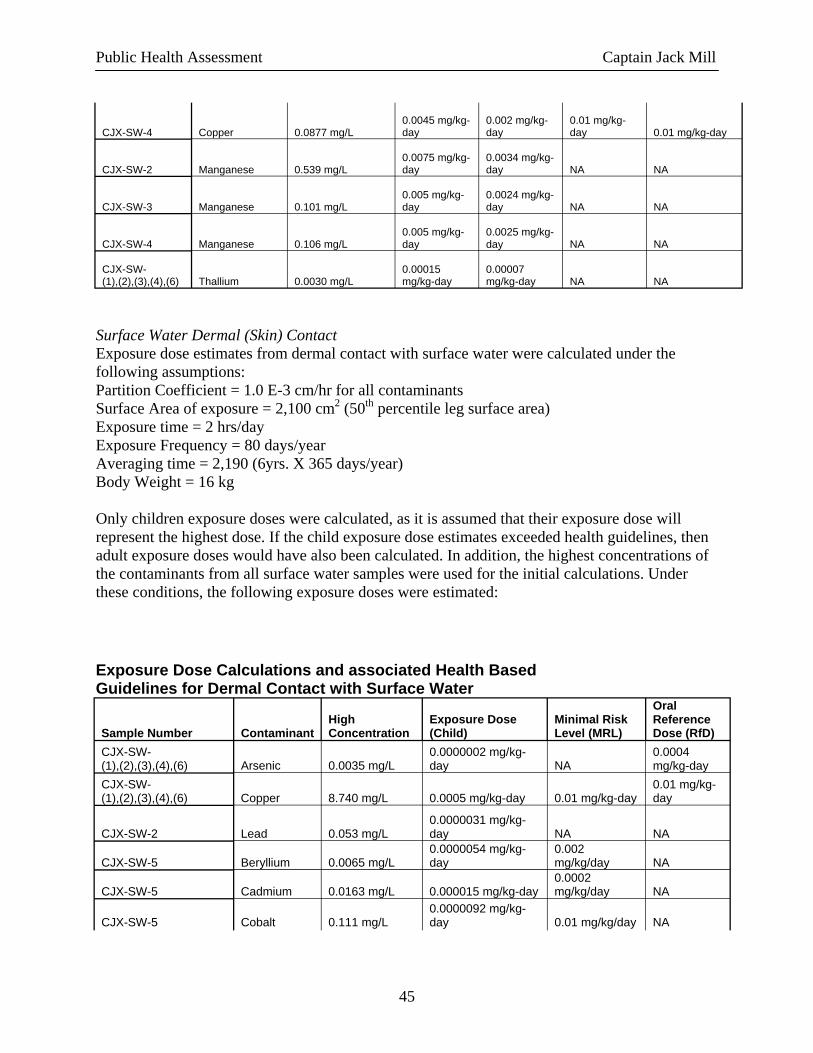
Public Health Assessment Captain Jack Mill
CJX-SW-4 Copper 0.0877 mg/L 0.0045 mg/kg-day
0.002 mg/kg-day
0.01 mg/kg-day 0.01 mg/kg-day
0.0075 mg/kg- 0.0034 mg/kg-CJX-SW-2 Manganese 0.539 mg/L day day NA NA
0.005 mg/kg- 0.0024 mg/kg-CJX-SW-3 Manganese 0.101 mg/L day day NA NA
0.005 mg/kg- 0.0025 mg/kg-CJX-SW-4 Manganese 0.106 mg/L day day NA NA
CJX-SW- 0.00015 0.00007 (1),(2),(3),(4),(6) Thallium 0.0030 mg/L mg/kg-day mg/kg-day NA NA
Surface Water Dermal (Skin) Contact Exposure dose estimates from dermal contact with surface water were calculated under the following assumptions: Partition Coefficient = 1.0 E-3 cm/hr for all contaminants Surface Area of exposure = 2,100 cm2 (50th percentile leg surface area) Exposure time = 2 hrs/day Exposure Frequency = 80 days/year Averaging time = 2,190 (6yrs. X 365 days/year) Body Weight = 16 kg
Only children exposure doses were calculated, as it is assumed that their exposure dose will represent the highest dose. If the child exposure dose estimates exceeded health guidelines, then adult exposure doses would have also been calculated. In addition, the highest concentrations of the contaminants from all surface water samples were used for the initial calculations. Under these conditions, the following exposure doses were estimated:
Exposure Dose Calculations and associated Health Based Guidelines for Dermal Contact with Surface Water
Oral High Exposure Dose Minimal Risk Reference
Sample Number Contaminant Concentration (Child) Level (MRL) Dose (RfD) CJX-SW- 0.0000002 mg/kg- 0.0004 (1),(2),(3),(4),(6) Arsenic 0.0035 mg/L day NA mg/kg-day CJX-SW- 0.01 mg/kg-(1),(2),(3),(4),(6) Copper 8.740 mg/L 0.0005 mg/kg-day 0.01 mg/kg-day day
0.0000031 mg/kg-CJX-SW-2 Lead 0.053 mg/L day NA NA
0.0000054 mg/kg- 0.002 CJX-SW-5 Beryllium 0.0065 mg/L day mg/kg/day NA
0.0002 CJX-SW-5 Cadmium 0.0163 mg/L 0.000015 mg/kg-day mg/kg/day NA
0.0000092 mg/kg-CJX-SW-5 Cobalt 0.111 mg/L day 0.01 mg/kg/day NA
45
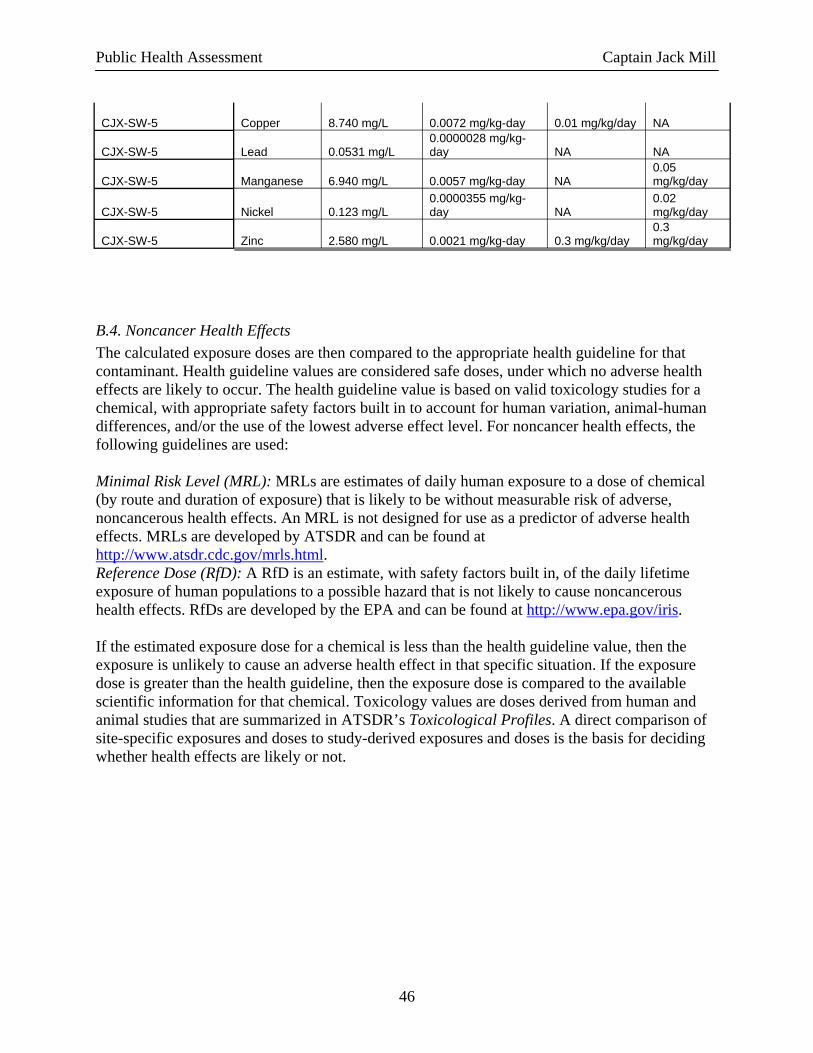
Public Health Assessment Captain Jack Mill
CJX-SW-5 Copper 8.740 mg/L 0.0072 mg/kg-day 0.01 mg/kg/day NA
CJX-SW-5 Lead 0.0531 mg/L 0.0000028 mg/kg-day NA NA
CJX-SW-5 Manganese 6.940 mg/L 0.0057 mg/kg-day NA 0.05 mg/kg/day
CJX-SW-5 Nickel 0.123 mg/L 0.0000355 mg/kg-day NA
0.02 mg/kg/day
CJX-SW-5 Zinc 2.580 mg/L 0.0021 mg/kg-day 0.3 mg/kg/day 0.3 mg/kg/day
B.4. Noncancer Health Effects The calculated exposure doses are then compared to the appropriate health guideline for that contaminant. Health guideline values are considered safe doses, under which no adverse health effects are likely to occur. The health guideline value is based on valid toxicology studies for a chemical, with appropriate safety factors built in to account for human variation, animal-human differences, and/or the use of the lowest adverse effect level. For noncancer health effects, the following guidelines are used:
Minimal Risk Level (MRL): MRLs are estimates of daily human exposure to a dose of chemical (by route and duration of exposure) that is likely to be without measurable risk of adverse, noncancerous health effects. An MRL is not designed for use as a predictor of adverse health effects. MRLs are developed by ATSDR and can be found at http://www.atsdr.cdc.gov/mrls.html. Reference Dose (RfD): A RfD is an estimate, with safety factors built in, of the daily lifetime exposure of human populations to a possible hazard that is not likely to cause noncancerous health effects. RfDs are developed by the EPA and can be found at http://www.epa.gov/iris.
If the estimated exposure dose for a chemical is less than the health guideline value, then the exposure is unlikely to cause an adverse health effect in that specific situation. If the exposure dose is greater than the health guideline, then the exposure dose is compared to the available scientific information for that chemical. Toxicology values are doses derived from human and animal studies that are summarized in ATSDR’s Toxicological Profiles. A direct comparison of site-specific exposures and doses to study-derived exposures and doses is the basis for deciding whether health effects are likely or not.
46
Public Health Assessment Captain Jack Mill
Appendix C. ATSDR Public Health Hazard Classification Categories ATSDR’s Public Health Hazard Categories
Category / Definition Data Sufficiency Criteria
A. Urgent Public Health Hazard This determination represents a professional judgment based on Evaluation of available relevant information* indicates that site-specific critical data which ATSDR has judged sufficient to support a decision. conditions or likely exposures have had, are having, or are likely to have in
This category is used for sites where short-term exposures (< 1 This does not necessarily imply that the available data are complete; in the future, an adverse impact on human health that requires immediate yr) to hazardous substances or conditions could result in adverse some cases additional data may be required to confirm or further action or intervention. Such site-specific conditions or exposures may health effects that require rapid intervention. support the decision made. include the presence of serious physical or safety hazards.
B. Public Health Hazard This determination represents a professional judgment based on Evaluation of available relevant information* suggests that, under site-critical data which ATSDR has judged sufficient to support a decision. specific conditions of exposure, long-term exposures to site-specific
This category is used for sites that pose a public health hazard due to the existence of long-term exposures (> 1 yr) to hazardous
This does not necessarily imply that the available data are complete; in some cases additional data may be required to confirm or further
contaminants (including radionuclides) have had, are having, or are likely to have in the future, an adverse impact on human health that
substance or conditions that could result in adverse health effects. support the decision made. requires one or more public health interventions. Such site-specific exposures may include the presence of serious physical or safety hazards.
C. Indeterminate Public Health Hazard
This category is used for sites in which “critical” data are insufficient with regard to extent of exposure and/or toxicologic properties at estimated exposure levels.
This determination represents a professional judgment that critical data are missing and ATSDR has judged the data are insufficient to support a decision. This does not necessarily imply all data are incomplete; but that some additional data are required to support a decision.
The health assessor must determine, using professional judgment, the “criticality” of such data and the likelihood that the data can be obtained and will be obtained in a timely manner. Where some data are available, even limited data, the health assessor is encouraged to the extent possible to select other hazard categories and to support their decision with clear narrative that explains the limits of the data and the rationale for the decision.
D. No Apparent Public Health Hazard This determination represents a professional judgment based on Evaluation of available relevant information* indicates that, under site-This category is used for sites where human exposure to critical data which ATSDR considers sufficient to support a decision. specific conditions of exposure, exposures to site-specific contaminants in contaminated media may be occurring, may have occurred in the This does not necessarily imply that the available data are complete; in the past, present, or future are not likely to result in any adverse impact on past, and/or may occur in the future, but the exposure is not some cases additional data may be required to confirm or further human health. expected to cause any adverse health effects. support the decision made.
E: No Public Health Hazard Sufficient evidence indicates that no human exposures to This category is used for sites that, because of the absence of contaminated media have occurred, none are now occurring, and exposure, do NOT pose a public health hazard. none are likely to occur in the future
*Such as environmental and demographic data; health outcome data; exposure data; community health concerns information; toxicologic, medical, and epidemiologic data; monitoring and management plans.
47
Public Health Assessment Captain Jack Mill
Appendix D. Selected Materials from Previous Sampling Events
48
Public Health Assessment Captain Jack Mill
49
Public Health Assessment Captain Jack Mill
50
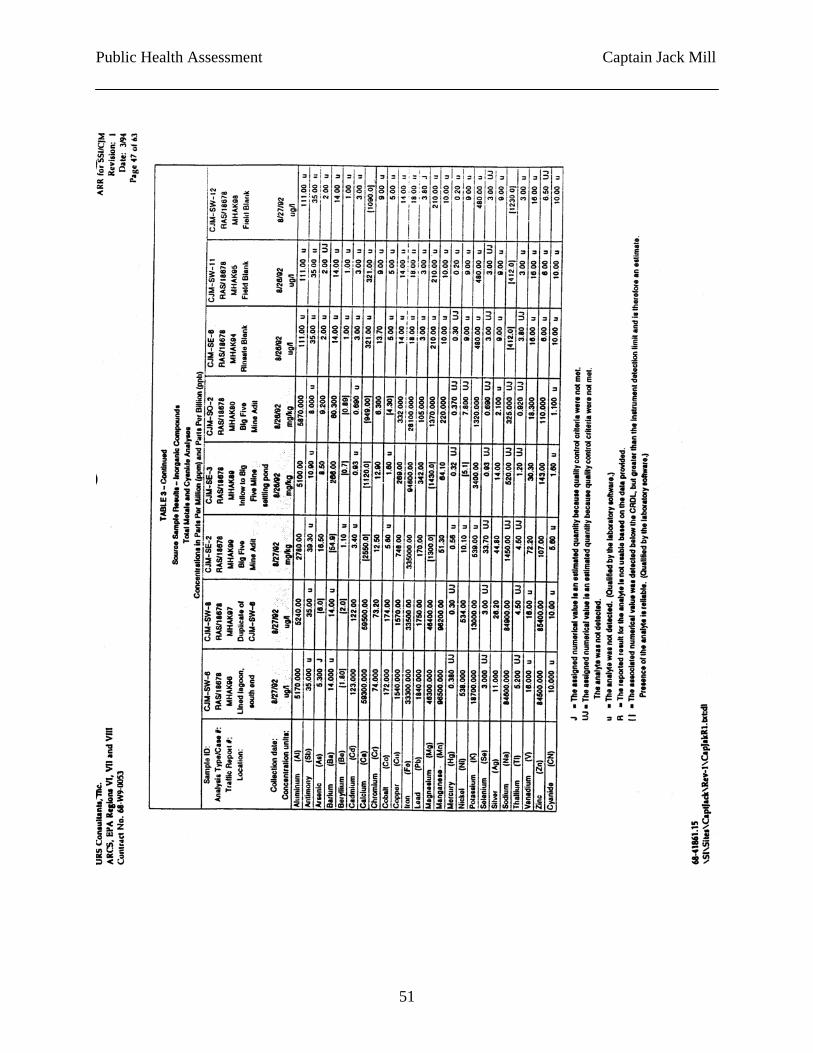
Public Health Assessment Captain Jack Mill
51
Public Health Assessment Captain Jack Mill
52
Public Health Assessment Captain Jack Mill
53
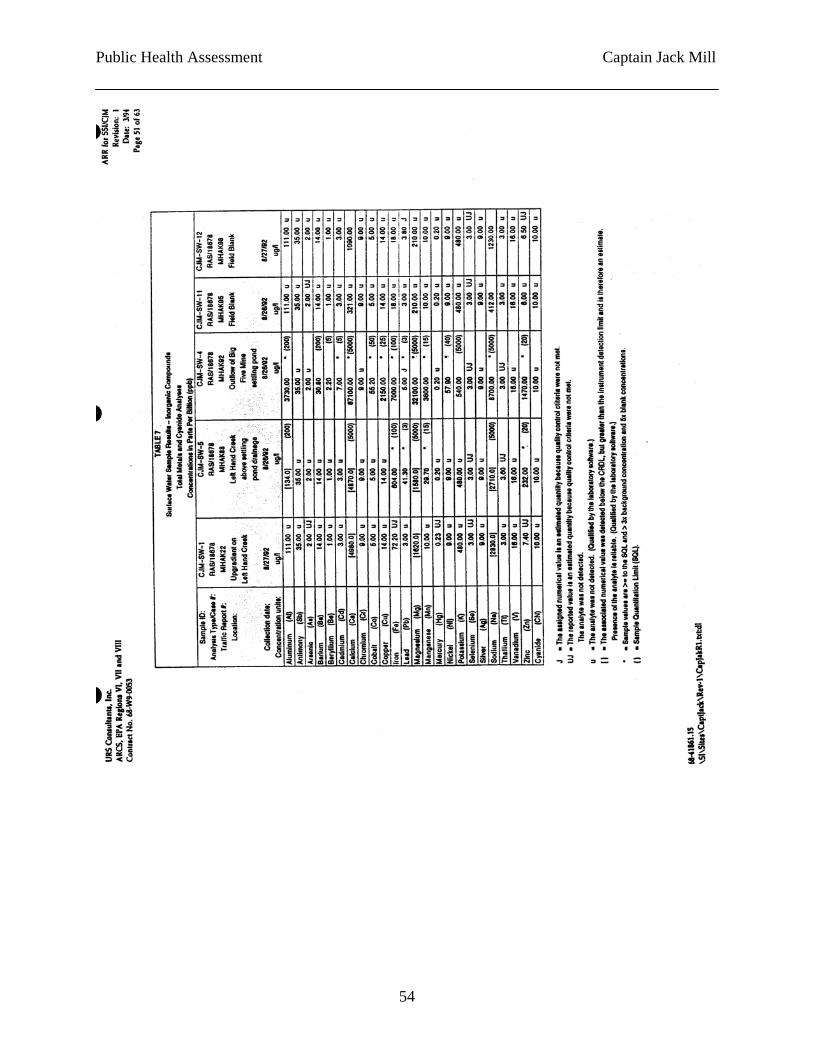
Public Health Assessment Captain Jack Mill
54
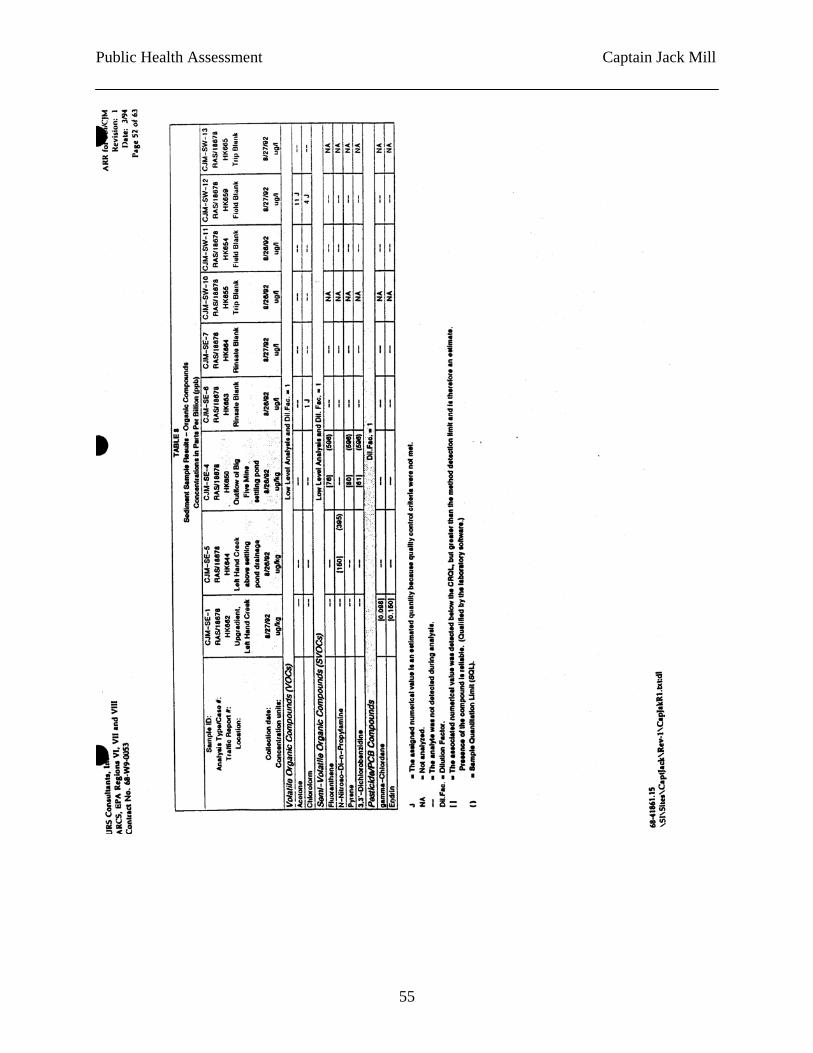
Public Health Assessment Captain Jack Mill
55
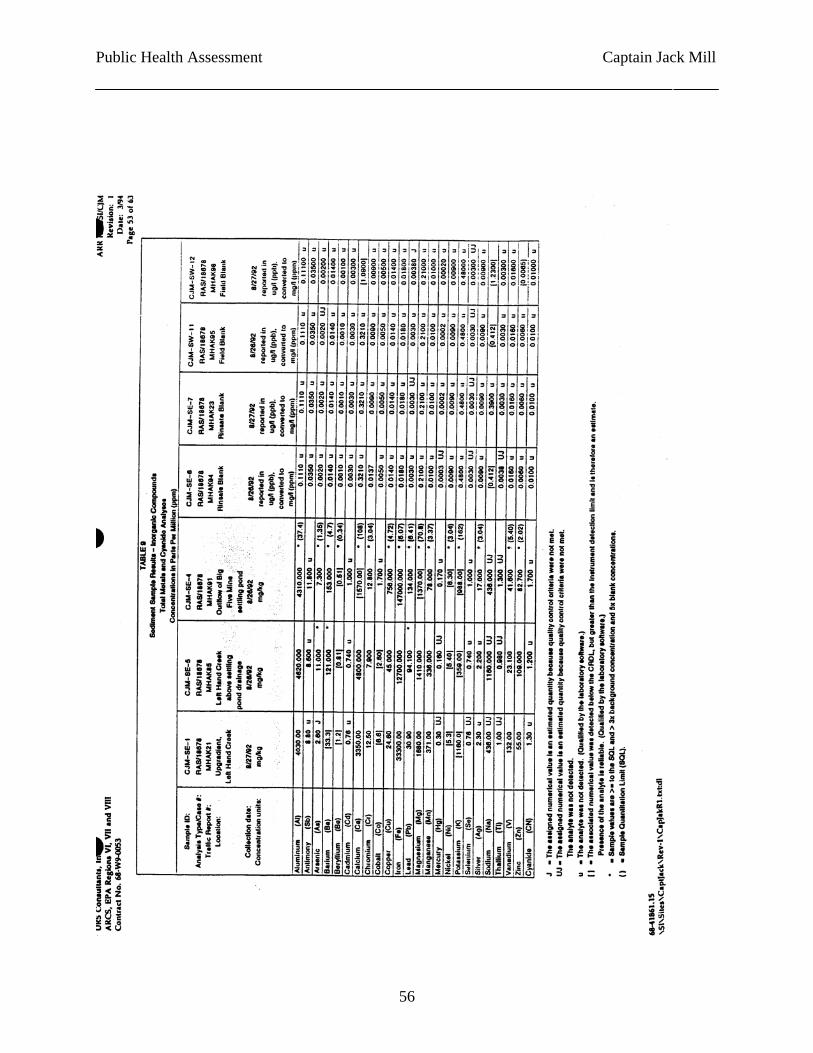
Public Health Assessment Captain Jack Mill
56
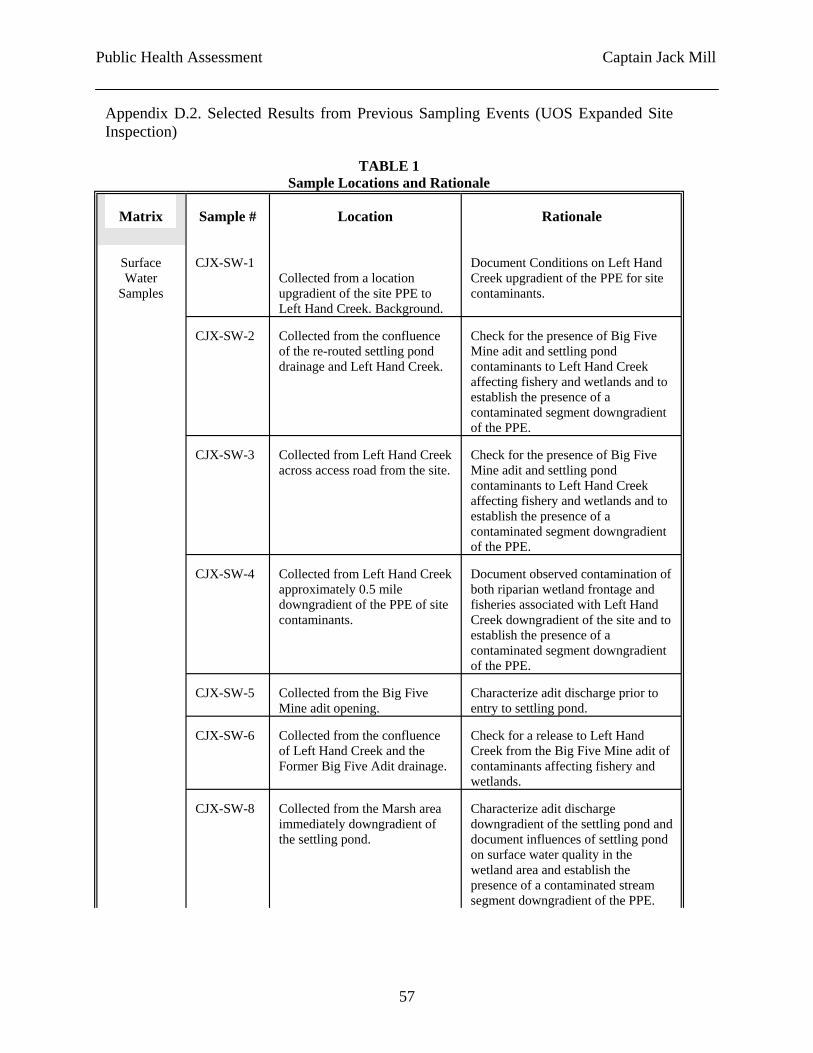
Public Health Assessment Captain Jack Mill
Appendix D.2. Selected Results from Previous Sampling Events (UOS Expanded Site Inspection)
TABLE 1 Sample Locations and Rationale
Matrix Sample # Location Rationale
Surface CJX-SW-1 Document Conditions on Left Hand Water Collected from a location Creek upgradient of the PPE for site
Samples upgradient of the site PPE to contaminants. Left Hand Creek. Background.
CJX-SW-2 Collected from the confluence of the re-routed settling pond drainage and Left Hand Creek.
Check for the presence of Big Five Mine adit and settling pond contaminants to Left Hand Creek affecting fishery and wetlands and to establish the presence of a contaminated segment downgradient of the PPE.
CJX-SW-3 Collected from Left Hand Creek across access road from the site.
Check for the presence of Big Five Mine adit and settling pond contaminants to Left Hand Creek affecting fishery and wetlands and to establish the presence of a contaminated segment downgradient of the PPE.
CJX-SW-4 Collected from Left Hand Creek Document observed contamination of approximately 0.5 mile downgradient of the PPE of site contaminants.
both riparian wetland frontage and fisheries associated with Left Hand Creek downgradient of the site and to establish the presence of a contaminated segment downgradient of the PPE.
CJX-SW-5 Collected from the Big Five Characterize adit discharge prior to Mine adit opening. entry to settling pond.
CJX-SW-6 Collected from the confluence Check for a release to Left Hand of Left Hand Creek and the Former Big Five Adit drainage.
Creek from the Big Five Mine adit of contaminants affecting fishery and wetlands.
CJX-SW-8 Collected from the Marsh area immediately downgradient of the settling pond.
Characterize adit discharge downgradient of the settling pond and document influences of settling pond on surface water quality in the wetland area and establish the presence of a contaminated stream segment downgradient of the PPE.
57
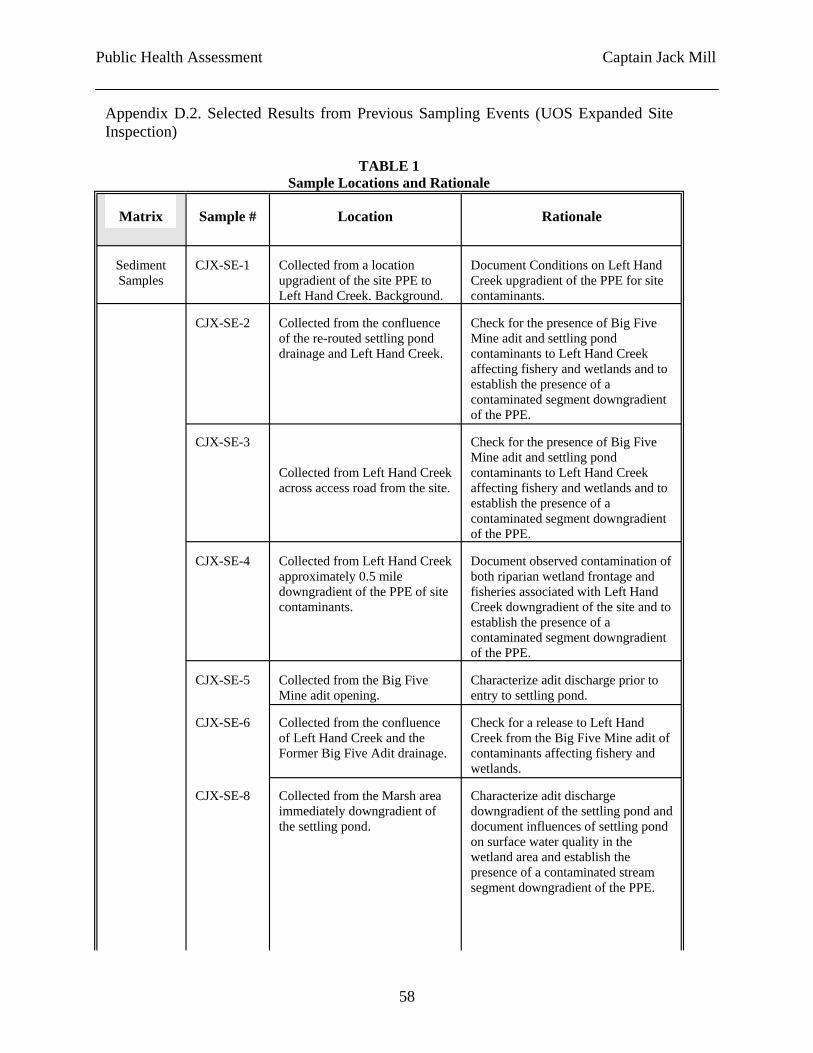
Public Health Assessment Captain Jack Mill
Appendix D.2. Selected Results from Previous Sampling Events (UOS Expanded Site Inspection)
TABLE 1 Sample Locations and Rationale
Matrix Sample # Location Rationale
Sediment CJX-SE-1 Collected from a location Document Conditions on Left Hand Samples upgradient of the site PPE to Creek upgradient of the PPE for site
Left Hand Creek. Background. contaminants.
CJX-SE-2 Collected from the confluence of the re-routed settling pond drainage and Left Hand Creek.
Check for the presence of Big Five Mine adit and settling pond contaminants to Left Hand Creek affecting fishery and wetlands and to establish the presence of a contaminated segment downgradient of the PPE.
CJX-SE-3
Collected from Left Hand Creek
Check for the presence of Big Five Mine adit and settling pond contaminants to Left Hand Creek
across access road from the site. affecting fishery and wetlands and to establish the presence of a contaminated segment downgradient of the PPE.
CJX-SE-4 Collected from Left Hand Creek Document observed contamination of approximately 0.5 mile downgradient of the PPE of site contaminants.
both riparian wetland frontage and fisheries associated with Left Hand Creek downgradient of the site and to establish the presence of a contaminated segment downgradient of the PPE.
CJX-SE-5 Collected from the Big Five Characterize adit discharge prior to
CJX-SE-6
Mine adit opening. entry to settling pond.
Collected from the confluence Check for a release to Left Hand
CJX-SE-8
of Left Hand Creek and the Former Big Five Adit drainage.
Creek from the Big Five Mine adit of contaminants affecting fishery and wetlands.
Collected from the Marsh area immediately downgradient of the settling pond.
Characterize adit discharge downgradient of the settling pond and document influences of settling pond on surface water quality in the wetland area and establish the presence of a contaminated stream segment downgradient of the PPE.
58
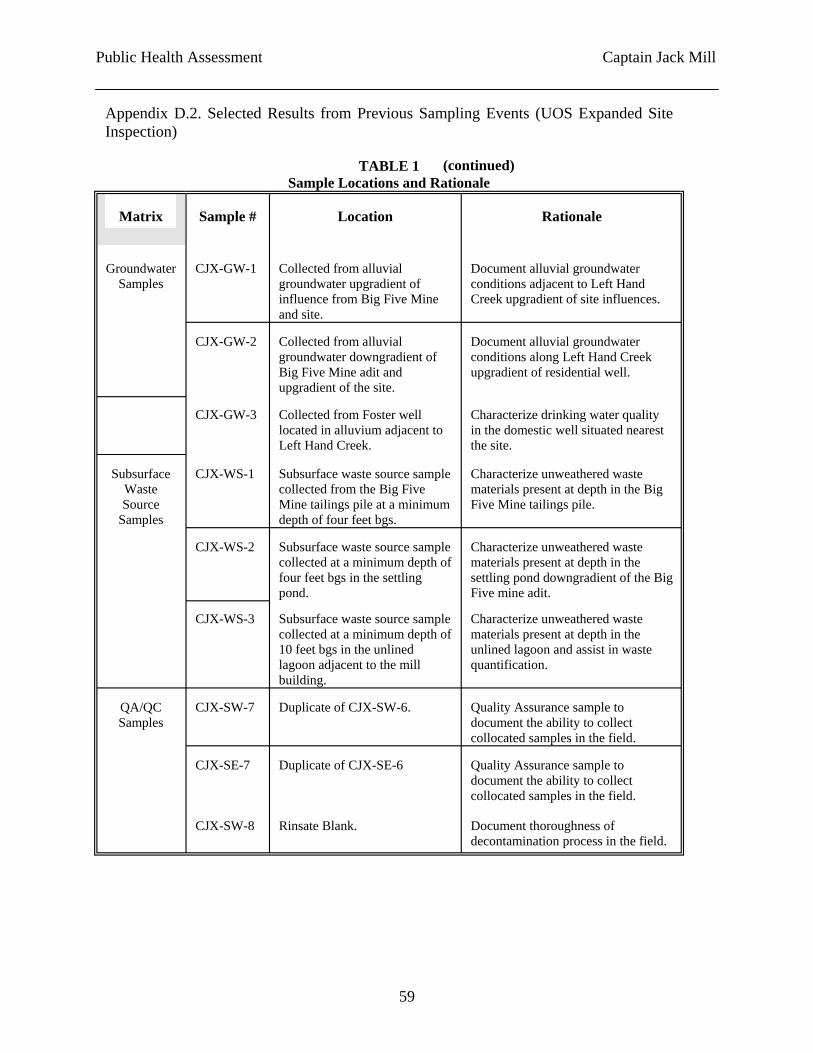
Public Health Assessment Captain Jack Mill
Appendix D.2. Selected Results from Previous Sampling Events (UOS Expanded Site Inspection)
TABLE 1 (continued) Sample Locations and Rationale
Matrix
Groundwater Samples
Sample #
CJX-GW-1
Location
Collected from alluvial groundwater upgradient of influence from Big Five Mine and site.
Rationale
Document alluvial groundwater conditions adjacent to Left Hand Creek upgradient of site influences.
CJX-GW-2
CJX-GW-3
CJX-WS-1
Collected from alluvial groundwater downgradient of Big Five Mine adit and upgradient of the site.
Collected from Foster well located in alluvium adjacent to Left Hand Creek.
Subsurface waste source sample collected from the Big Five Mine tailings pile at a minimum depth of four feet bgs.
Document alluvial groundwater conditions along Left Hand Creek upgradient of residential well.
Characterize drinking water quality in the domestic well situated nearest the site.
Characterize unweathered waste materials present at depth in the Big Five Mine tailings pile.
Subsurface Waste Source
Samples
CJX-WS-2 Subsurface waste source sample collected at a minimum depth of four feet bgs in the settling pond.
Subsurface waste source sample collected at a minimum depth of 10 feet bgs in the unlined lagoon adjacent to the mill building.
Characterize unweathered waste materials present at depth in the settling pond downgradient of the Big Five mine adit.
Characterize unweathered waste materials present at depth in the unlined lagoon and assist in waste quantification.
CJX-WS-3
QA/QC Samples
CJX-SW-7 Duplicate of CJX-SW-6. Quality Assurance sample to document the ability to collect collocated samples in the field.
CJX-SE-7
CJX-SW-8
Duplicate of CJX-SE-6
Rinsate Blank.
Quality Assurance sample to document the ability to collect collocated samples in the field.
Document thoroughness of decontamination process in the field.
59
Public Health Assessment Captain Jack Mill
TABLE 2 Non-Sampling Data Collection Rationale
Data Element Data Collection Strategy and Rationale
Sensitive Environments Locate, assess and photograph any wetlands observed, meeting the 40 CFR 230.3 definition along Left Hand Creek. Observe drainages for indicators or evidence of use as a fishery and for sensitive environments utilized by threatened or endangered species.
Surface Water Pathway Locate and identify by direct observation any indications of an observed release to Left Hand Creek and collect flow measurements from both the Big Five Mine Adit and Left Hand Creek.
Groundwater Pathway Locate additional groundwater users situated along Left Hand Creek downgradient of the site.
60
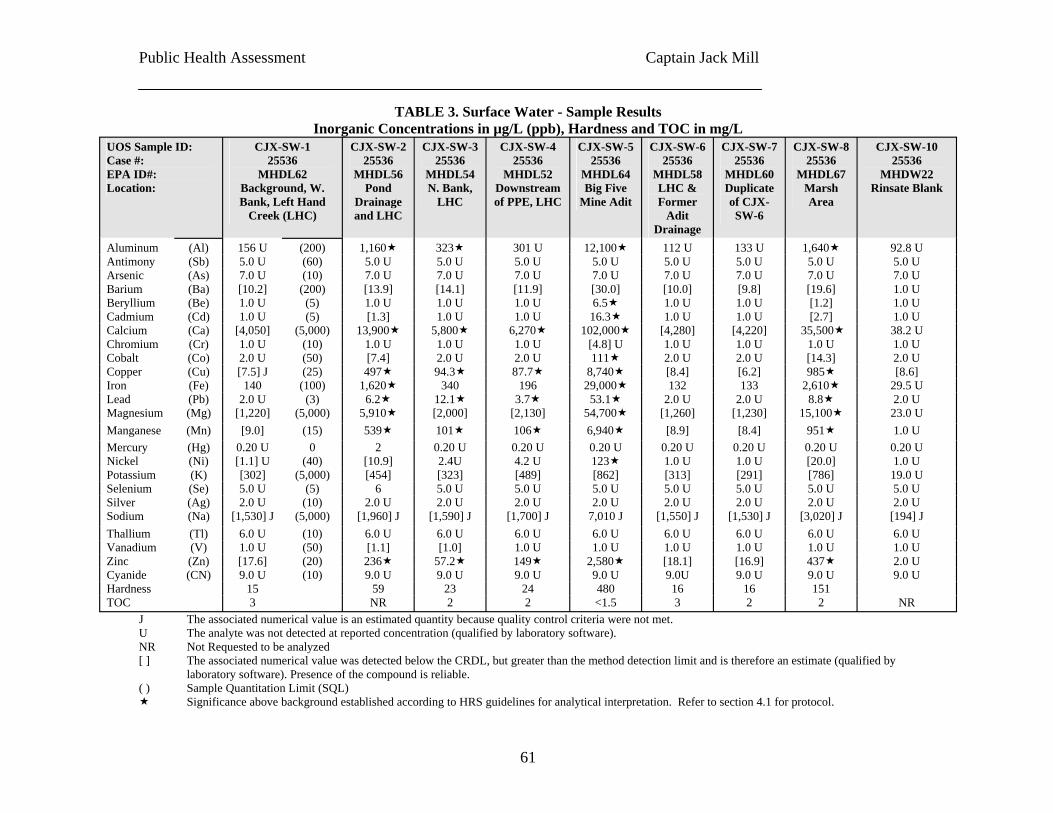
Public Health Assessment Captain Jack Mill
TABLE 3. Surface Water - Sample Results Inorganic Concentrations in µg/L (ppb), Hardness and TOC in mg/L
Case #: EPA ID#: Location:
25536 MHDL62
25536 MHDL56
Drainage and LHC
25536 MHDL54
LHC
25536 MHDL52
25536 MHDL64
25536 MHDL58 LHC &
Adit Drainage
25536 MHDL60 Duplicate
SW-6
25536 MHDL67
Area
25536 MHDW22
Aluminum (Al) 156 U (200) 1,160� 323� 301 U 12,100� 112 U 133 U 1,640� 92.8 U (Sb) 5.0 U (60) 5.0 U 5.0 U 5.0 U 5.0 U 5.0 U 5.0 U 5.0 U 5.0 U
Arsenic (As) 7.0 U (10) 7.0 U 7.0 U 7.0 U 7.0 U 7.0 U 7.0 U 7.0 U Barium (Ba) [10.2] (200) [13.9] [14.1] [11.9] [30.0] [10.0] [9.8] [19.6]
(Be) 1.0 U (5) 1.0 U 1.0 U 1.0 U 6.5� 1.0 U 1.0 U [1.2] 1.0 U Cadmium (Cd) 1.0 U (5) [1.3] 1.0 U 1.0 U 16.3� 1.0 U 1.0 U [2.7] 1.0 U Calcium (Ca) [4,050] (5,000) 13,900� 5,800� 6,270� 102,000� [4,280] [4,220] 35,500�Chromium (Cr) 1.0 U (10) 1.0 U 1.0 U 1.0 U 1.0 U 1.0 U 1.0 U 1.0 U Cobalt (Co) 2.0 U (50) [7.4] 2.0 U 2.0 U 111� 2.0 U 2.0 U [14.3] 2.0 U Copper (Cu) (25) 497� 94.3� 87.7� 8,740� [8.4] [6.2] 985� [8.6] Iron (Fe) 140 (100) 1,620� 340 196 29,000� 132 133 2,610�Lead (Pb) (3) 6.2� 12.1� 3.7� 53.1� 2.0 U 2.0 U 8.8�Magnesium (Mg) [1,220] (5,000) 5,910� [2,000] [2,130] 54,700� [1,260] [1,230] 15,100�Manganese (Mn) [9.0] (15) 539� 101� 106� 6,940� [8.9] [8.4] 951�
(Hg) 0.20 U 0 2 0.20 U 0.20 U 0.20 U 0.20 U 0.20 U 0.20 U Nickel (Ni) (40) [10.9] 2.4U 4.2 U 123� 1.0 U 1.0 U [20.0] 1.0 U Potassium (K) [302] (5,000) [454] [323] [489] [862] [313] [291] [786] Selenium (Se) 5.0 U (5) 6 5.0 U 5.0 U 5.0 U 5.0 U 5.0 U 5.0 U Silver (Ag) 2.0 U (10) 2.0 U 2.0 U 2.0 U 2.0 U 2.0 U 2.0 U 2.0 U 2.0 U Sodium (Na) (5,000) 7,010 J Thallium (Tl) 6.0 U (10) 6.0 U 6.0 U 6.0 U 6.0 U 6.0 U 6.0 U 6.0 U Vanadium (V) (50) [1.1] [1.0] 1.0 U 1.0 U 1.0 U 1.0 U 1.0 U 1.0 U Zinc (Zn) [17.6] (20) 236� 57.2� 149� 2,580� [18.1] [16.9] 437�
(CN) 9.0 U (10) 9.0 U 9.0 U 9.0 U 9.0 U 9.0U 9.0 U 9.0 U 9.0 U Hardness 15 59 23 24 480 16 16 151 TOC 3 NR 2 2 <1.5 3 2 2 NR
UOS Sample ID: CJX-SW-1
Background, W. Bank, Left Hand
Creek (LHC)
CJX-SW-2
Pond
CJX-SW-3
N. Bank,
CJX-SW-4
Downstream of PPE, LHC
CJX-SW-5
Big Five Mine Adit
CJX-SW-6
Former
CJX-SW-7
of CJX-
CJX-SW-8
Marsh
CJX-SW-10
Rinsate Blank
Antimony 7.0 U
1.0 U Beryllium
38.2 U [4.8] U
[7.5] J 29.5 U
2.0 U 2.0 U 23.0 U
1.0 U Mercury 0.20 U
[1.1] U 19.0 U
5.0 U
[1,530] J [1,960] J [1,590] J [1,700] J [1,550] J [1,530] J [3,020] J [194] J 6.0 U
1.0 U 2.0 U
Cyanide
J The associated numerical value is an estimated quantity because quality control criteria were not met. U The analyte was not detected at reported concentration (qualified by laboratory software).NR Not Requested to be analyzed [ ] The associated numerical value was detected below the CRDL, but greater than the method detection limit and is therefore an estimate (qualified by
laboratory software). Presence of the compound is reliable. ( ) Sample Quantitation Limit (SQL) � Significance above background established according to HRS guidelines for analytical interpretation. Refer to section 4.1 for protocol.
61
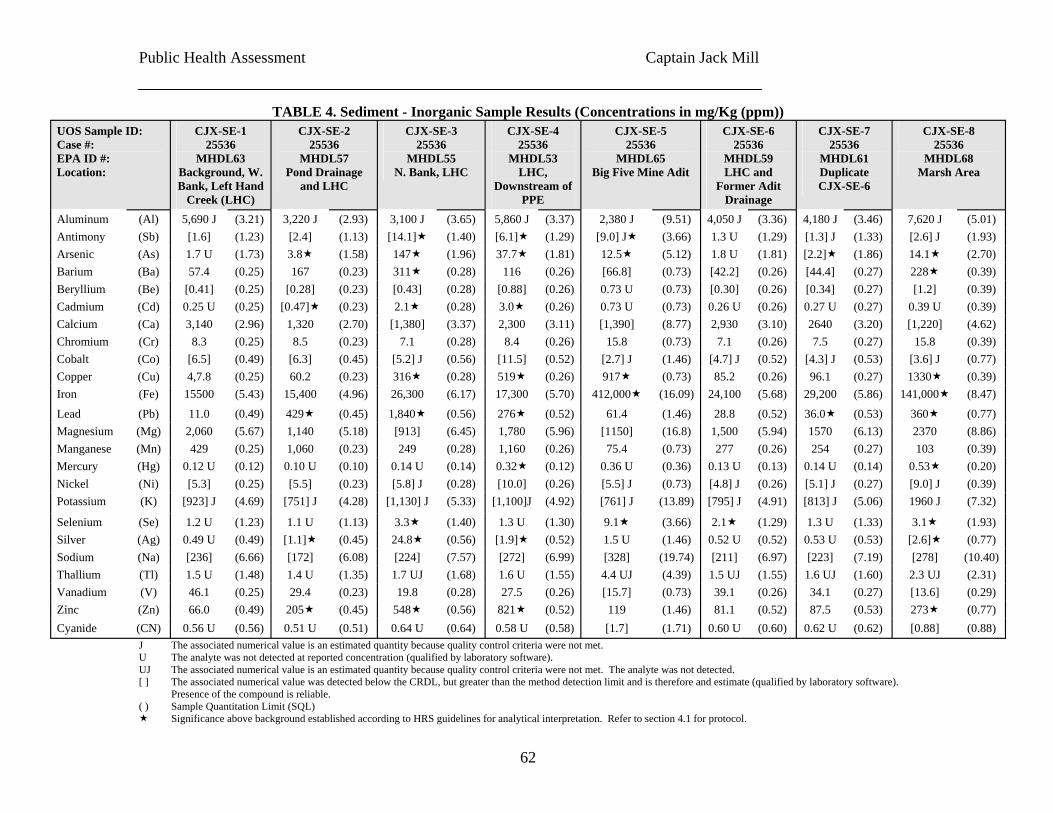
Public Health Assessment Captain Jack Mill
Case #: EPA ID #: Location:
25536 MHDL63
25536 MHDL57
Pond Drainage and LHC
25536 MHDL55
N. Bank, LHC
25536 MHDL53
LHC,
PPE
25536 MHDL65
25536 MHDL59 LHC and
Drainage
25536 MHDL61 Duplicate
25536 MHDL68
Aluminum (Al) 5,690 J (3.21) 3,220 J (2.93) 3,100 J (3.65) 5,860 J (3.37) 2,380 J (9.51) 4,050 J (3.36) 4,180 J (3.46) 7,620 J (5.01) (Sb) [1.6] (1.23) [2.4] (1.13) [14.1]� (1.40) [6.1]� (1.29) � (3.66) 1.3 U (1.29) (1.33) (1.93)
Arsenic (As) 1.7 U (1.73) 3.8� (1.58) 147� (1.96) 37.7� (1.81) 12.5� (5.12) 1.8 U (1.81) [2.2]� (1.86) 14.1� (2.70) Barium (Ba) 57.4 (0.25) 167 (0.23) 311� (0.28) 116 (0.26) [66.8] (0.73) [42.2] (0.26) [44.4] (0.27) 228� (0.39)
(Be) [0.41] (0.25) [0.28] (0.23) [0.43] (0.28) [0.88] (0.26) 0.73 U (0.73) [0.30] (0.26) [0.34] (0.27) [1.2] (0.39) Cadmium (Cd) 0.25 U (0.25) [0.47]� (0.23) 2.1� (0.28) 3.0� (0.26) 0.73 U (0.73) 0.26 U (0.26) 0.27 U (0.27) 0.39 U (0.39) Calcium (Ca) 3,140 (2.96) 1,320 (2.70) [1,380] (3.37) 2,300 (3.11) [1,390] (8.77) 2,930 (3.10) 2640 (3.20) [1,220] (4.62) Chromium (Cr) 8.3 (0.25) 8.5 (0.23) 7.1 (0.28) 8.4 (0.26) 15.8 (0.73) 7.1 (0.26) 7.5 (0.27) 15.8 (0.39) Cobalt (Co) [6.5] (0.49) [6.3] (0.45) (0.56) [11.5] (0.52) (1.46) (0.52) (0.53) (0.77) Copper (Cu) 4,7.8 (0.25) 60.2 (0.23) 316� (0.28) 519� (0.26) 917� (0.73) 85.2 (0.26) 96.1 (0.27) 1330� (0.39) Iron (Fe) 15500 (5.43) 15,400 (4.96) 26,300 (6.17) 17,300 (5.70) 412,000� (16.09) 24,100 (5.68) 29,200 (5.86) 141,000� (8.47)
Lead (Pb) 11.0 (0.49) 429� (0.45) 1,840� (0.56) 276� (0.52) 61.4 (1.46) 28.8 (0.52) 36.0� (0.53) 360� (0.77) Magnesium (Mg) 2,060 (5.67) 1,140 (5.18) [913] (6.45) 1,780 (5.96) [1150] (16.8) 1,500 (5.94) 1570 (6.13) 2370 (8.86) Manganese (Mn) 429 (0.25) 1,060 (0.23) 249 (0.28) 1,160 (0.26) 75.4 (0.73) 277 (0.26) 254 (0.27) 103 (0.39)
(Hg) 0.12 U (0.12) 0.10 U (0.10) 0.14 U (0.14) 0.32� (0.12) 0.36 U (0.36) 0.13 U (0.13) 0.14 U (0.14) 0.53� (0.20) Nickel (Ni) [5.3] (0.25) [5.5] (0.23) (0.28) [10.0] (0.26) (0.73) (0.26) (0.27) (0.39)
(K) (4.69) (4.28) (5.33) (4.92) (13.89) (4.91) (5.06) 1960 J (7.32)
Selenium (Se) 1.2 U (1.23) 1.1 U (1.13) 3.3� (1.40) 1.3 U (1.30) 9.1� (3.66) 2.1� (1.29) 1.3 U (1.33) 3.1� (1.93) Silver (Ag) 0.49 U (0.49) [1.1]� (0.45) 24.8� (0.56) [1.9]� (0.52) 1.5 U (1.46) 0.52 U (0.52) 0.53 U (0.53) [2.6]� (0.77) Sodium (Na) [236] (6.66) [172] (6.08) [224] (7.57) [272] (6.99) [328] (19.74) [211] (6.97) [223] (7.19) [278] (10.40) Thallium (Tl) 1.5 U (1.48) 1.4 U (1.35) 1.7 UJ (1.68) 1.6 U (1.55) 4.4 UJ (4.39) 1.5 UJ (1.55) 1.6 UJ (1.60) 2.3 UJ (2.31) Vanadium (V) 46.1 (0.25) 29.4 (0.23) 19.8 (0.28) 27.5 (0.26) [15.7] (0.73) 39.1 (0.26) 34.1 (0.27) [13.6] (0.29) Zinc (Zn) 66.0 (0.49) 205� (0.45) 548� (0.56) 821� (0.52) 119 (1.46) 81.1 (0.52) 87.5 (0.53) 273� (0.77)
(CN) 0.56 U (0.56) 0.51 U (0.51) 0.64 U (0.64) 0.58 U (0.58) [1.7] (1.71) 0.60 U (0.60) 0.62 U (0.62) [0.88] (0.88)
TABLE 4. Sediment - Inorganic Sample Results (Concentrations in mg/Kg (ppm)) UOS Sample ID: CJX-SE-1
Background, W. Bank, Left Hand
Creek (LHC)
CJX-SE-2 CJX-SE-3 CJX-SE-4
Downstream of
CJX-SE-5
Big Five Mine Adit
CJX-SE-6
Former Adit
CJX-SE-7
CJX-SE-6
CJX-SE-8
Marsh Area
Antimony [9.0] J [1.3] J [2.6] J
Beryllium
[5.2] J [2.7] J [4.7] J [4.3] J [3.6] J
Mercury [5.8] J [5.5] J [4.8] J [5.1] J [9.0] J
Potassium [923] J [751] J [1,130] J [1,100]J [761] J [795] J [813] J
Cyanide J The associated numerical value is an estimated quantity because quality control criteria were not met. U The analyte was not detected at reported concentration (qualified by laboratory software).UJ The associated numerical value is an estimated quantity because quality control criteria were not met. The analyte was not detected. [ ] The associated numerical value was detected below the CRDL, but greater than the method detection limit and is therefore and estimate (qualified by laboratory software).
Presence of the compound is reliable. ( ) Sample Quantitation Limit (SQL) � Significance above background established according to HRS guidelines for analytical interpretation. Refer to section 4.1 for protocol.
62
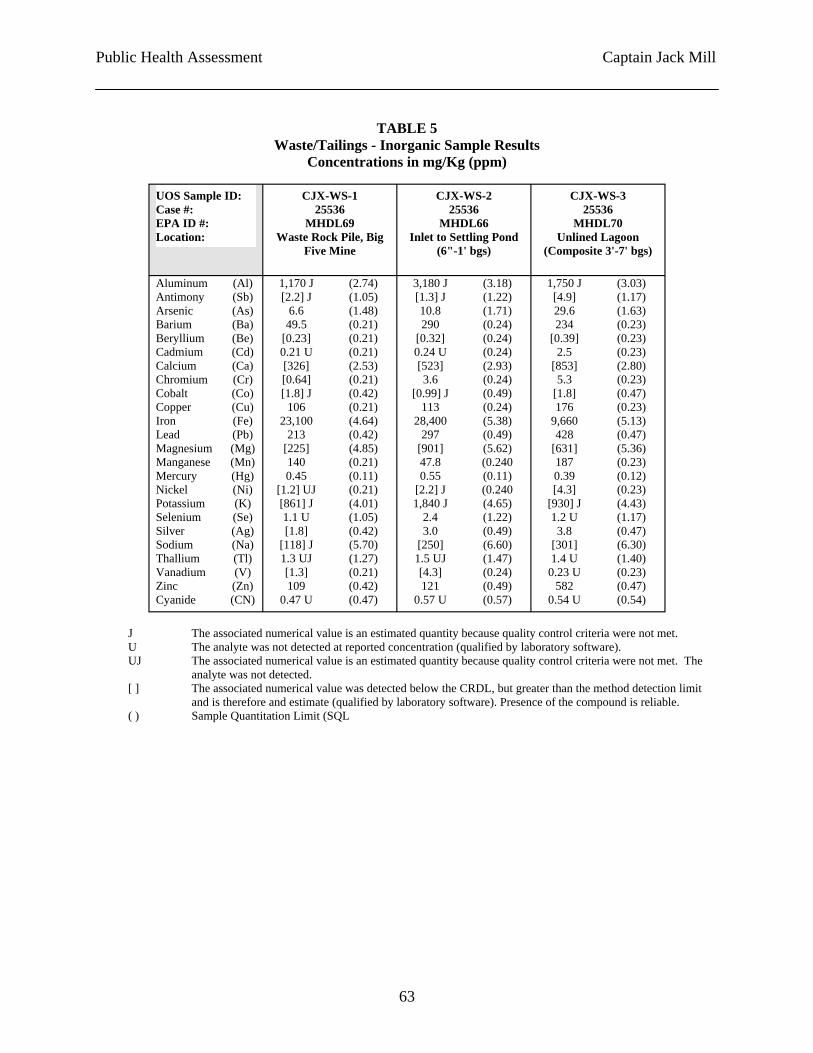
Public Health Assessment Captain Jack Mill
TABLE 5 Waste/Tailings - Inorganic Sample Results
Concentrations in mg/Kg (ppm)
UOS Sample ID: CJX-WS-1 CJX-WS-2 CJX-WS-3 Case #: 25536 25536 25536 EPA ID #: MHDL69 MHDL66 MHDL70 Location: Waste Rock Pile, Big Inlet to Settling Pond Unlined Lagoon
Five Mine (6"-1' bgs) (Composite 3'-7' bgs)
Aluminum (Al) 1,170 J (2.74) 3,180 J (3.18) 1,750 J (3.03) Antimony (Sb) [2.2] J (1.05) [1.3] J (1.22) [4.9] (1.17) Arsenic (As) 6.6 (1.48) 10.8 (1.71) 29.6 (1.63) Barium (Ba) 49.5 (0.21) 290 (0.24) 234 (0.23) Beryllium (Be) [0.23] (0.21) [0.32] (0.24) [0.39] (0.23) Cadmium (Cd) 0.21 U (0.21) 0.24 U (0.24) 2.5 (0.23) Calcium (Ca) [326] (2.53) [523] (2.93) [853] (2.80) Chromium (Cr) [0.64] (0.21) 3.6 (0.24) 5.3 (0.23) Cobalt (Co) [1.8] J (0.42) [0.99] J (0.49) [1.8] (0.47) Copper (Cu) 106 (0.21) 113 (0.24) 176 (0.23) Iron (Fe) 23,100 (4.64) 28,400 (5.38) 9,660 (5.13) Lead (Pb) 213 (0.42) 297 (0.49) 428 (0.47) Magnesium (Mg) [225] (4.85) [901] (5.62) [631] (5.36) Manganese (Mn) 140 (0.21) 47.8 (0.240 187 (0.23) Mercury (Hg) 0.45 (0.11) 0.55 (0.11) 0.39 (0.12) Nickel (Ni) [1.2] UJ (0.21) [2.2] J (0.240 [4.3] (0.23) Potassium (K) [861] J (4.01) 1,840 J (4.65) [930] J (4.43) Selenium (Se) 1.1 U (1.05) 2.4 (1.22) 1.2 U (1.17) Silver (Ag) [1.8] (0.42) 3.0 (0.49) 3.8 (0.47) Sodium (Na) [118] J (5.70) [250] (6.60) [301] (6.30) Thallium (Tl) 1.3 UJ (1.27) 1.5 UJ (1.47) 1.4 U (1.40) Vanadium (V) [1.3] (0.21) [4.3] (0.24) 0.23 U (0.23) Zinc (Zn) 109 (0.42) 121 (0.49) 582 (0.47) Cyanide (CN) 0.47 U (0.47) 0.57 U (0.57) 0.54 U (0.54)
J The associated numerical value is an estimated quantity because quality control criteria were not met. U The analyte was not detected at reported concentration (qualified by laboratory software). UJ The associated numerical value is an estimated quantity because quality control criteria were not met. The
analyte was not detected. [ ] The associated numerical value was detected below the CRDL, but greater than the method detection limit
and is therefore and estimate (qualified by laboratory software). Presence of the compound is reliable. ( ) Sample Quantitation Limit (SQL
63
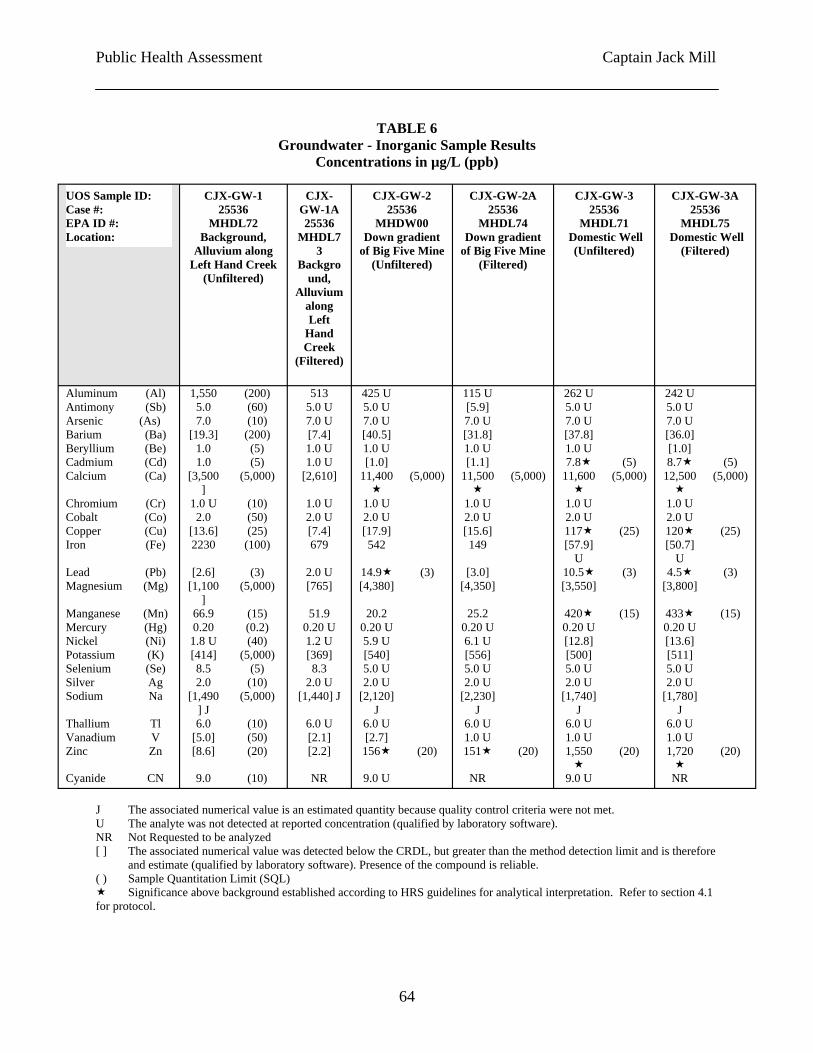
Public Health Assessment Captain Jack Mill
TABLE 6 Groundwater - Inorganic Sample Results
Concentrations in µg/L (ppb)
UOS Sample ID: Case #:
CJX-GW-1 25536
CJX-GW-1A
CJX-GW-2 25536
CJX-GW-2A 25536
CJX-GW-3 25536
CJX-GW-3A 25536
EPA ID #: MHDL72 25536 MHDW00 MHDL74 MHDL71 MHDL75 Location: Background,
Alluvium along Left Hand Creek
(Unfiltered)
MHDL7 3
Backgro und,
Alluvium
Down gradient of Big Five Mine
(Unfiltered)
Down gradient of Big Five Mine
(Filtered)
Domestic Well (Unfiltered)
Domestic Well (Filtered)
along Left
Hand Creek
(Filtered)
Aluminum (Al) 1,550 (200) 513 425 U 115 U 262 U 242 U Antimony (Sb) 5.0 (60) 5.0 U 5.0 U [5.9] 5.0 U 5.0 U Arsenic (As) 7.0 (10) 7.0 U 7.0 U 7.0 U 7.0 U 7.0 U Barium (Ba) [19.3] (200) [7.4] [40.5] [31.8] [37.8] [36.0] Beryllium (Be) 1.0 (5) 1.0 U 1.0 U 1.0 U 1.0 U [1.0] Cadmium (Cd) 1.0 (5) 1.0 U [1.0] [1.1] 7.8� (5) 8.7� (5) Calcium (Ca) [3,500 (5,000) [2,610] 11,400 (5,000) 11,500 (5,000) 11,600 (5,000) 12,500 (5,000)
] � � � � Chromium (Cr) 1.0 U (10) 1.0 U 1.0 U 1.0 U 1.0 U 1.0 U Cobalt (Co) 2.0 (50) 2.0 U 2.0 U 2.0 U 2.0 U 2.0 U Copper (Cu) [13.6] (25) [7.4] [17.9] [15.6] 117� (25) 120� (25) Iron (Fe) 2230 (100) 679 542 149 [57.9] [50.7]
U U Lead (Pb) [2.6] (3) 2.0 U 14.9� (3) [3.0] 10.5� (3) 4.5� (3) Magnesium (Mg) [1,100 (5,000) [765] [4,380] [4,350] [3,550] [3,800]
] Manganese (Mn) 66.9 (15) 51.9 20.2 25.2 420� (15) 433� (15) Mercury (Hg) 0.20 (0.2) 0.20 U 0.20 U 0.20 U 0.20 U 0.20 U Nickel (Ni) 1.8 U (40) 1.2 U 5.9 U 6.1 U [12.8] [13.6] Potassium (K) [414] (5,000) [369] [540] [556] [500] [511] Selenium (Se) 8.5 (5) 8.3 5.0 U 5.0 U 5.0 U 5.0 U Silver Ag 2.0 (10) 2.0 U 2.0 U 2.0 U 2.0 U 2.0 U Sodium Na [1,490 (5,000) [1,440] J [2,120] [2,230] [1,740] [1,780]
] J J J J J Thallium Tl 6.0 (10) 6.0 U 6.0 U 6.0 U 6.0 U 6.0 U Vanadium V [5.0] (50) [2.1] [2.7] 1.0 U 1.0 U 1.0 U Zinc Zn [8.6] (20) [2.2] 156� (20) 151� (20) 1,550 (20) 1,720 (20)
� � Cyanide CN 9.0 (10) NR 9.0 U NR 9.0 U NR
J The associated numerical value is an estimated quantity because quality control criteria were not met. U The analyte was not detected at reported concentration (qualified by laboratory software).NR Not Requested to be analyzed [ ] The associated numerical value was detected below the CRDL, but greater than the method detection limit and is therefore
and estimate (qualified by laboratory software). Presence of the compound is reliable. ( ) Sample Quantitation Limit (SQL) � Significance above background established according to HRS guidelines for analytical interpretation. Refer to section 4.1 for protocol.
64
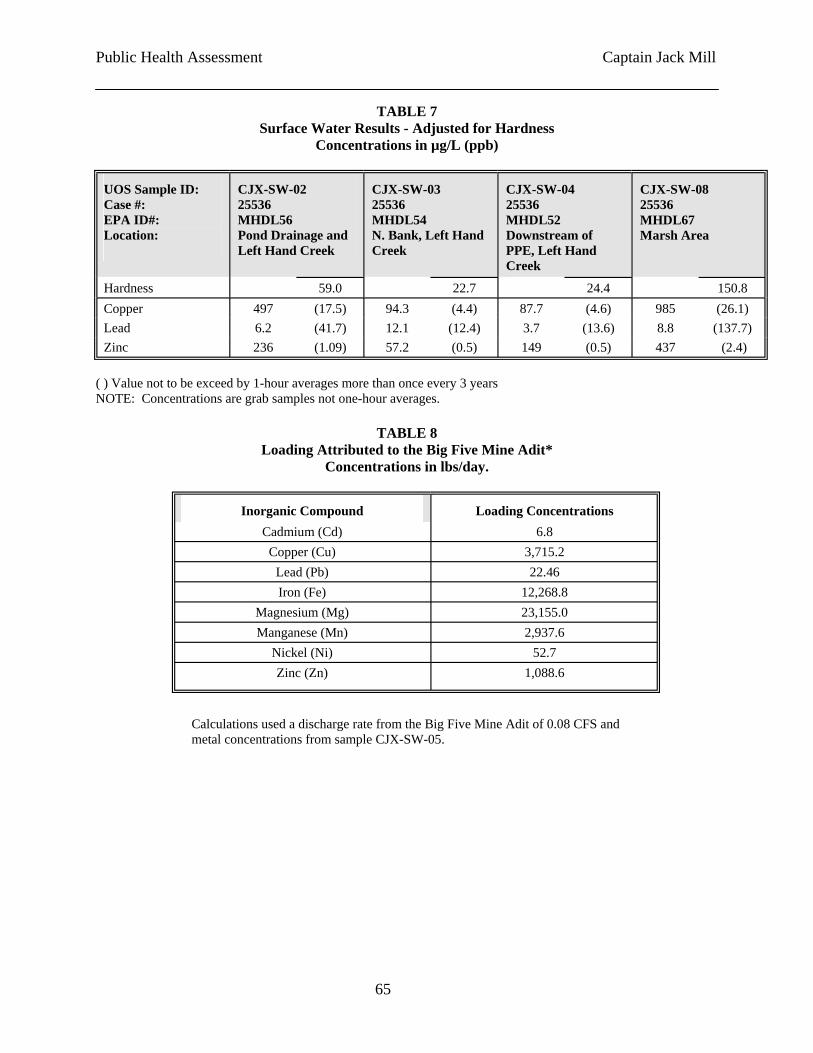
Public Health Assessment Captain Jack Mill
TABLE 7 Surface Water Results - Adjusted for Hardness
Concentrations in µg/L (ppb)
EPA ID#:
Creek Creek
Hardness ) )
Lead ( ) Zinc ) ) )
UOS Sample ID: Case #:
Location:
CJX-SW-02 25536 MHDL56 Pond Drainage and Left Hand Creek
CJX-SW-03 25536 MHDL54 N. Bank, Left Hand
CJX-SW-04 25536 MHDL52 Downstream of PPE, Left Hand
CJX-SW-08 25536 MHDL67 Marsh Area
59.0 22.7 24.4 150.8 Copper 497 (17.5) 94.3 (4.4 87.7 (4.6 985 (26.1)
6.2 (41.7) 12.1 (12.4) 3.7 (13.6) 8.8 137.7236 (1.09) 57.2 (0.5 149 (0.5 437 (2.4
( ) Value not to be exceed by 1-hour averages more than once every 3 years NOTE: Concentrations are grab samples not one-hour averages.
TABLE 8 Loading Attributed to the Big Five Mine Adit*
Concentrations in lbs/day.
Inorganic Compound Loading Concentrations Cadmium (Cd) 6.8 Copper (Cu) 3,715.2
Lead (Pb) 22.46 Iron (Fe) 12,268.8
Magnesium (Mg) 23,155.0 Manganese (Mn) 2,937.6
Nickel (Ni) 52.7 Zinc (Zn) 1,088.6
Calculations used a discharge rate from the Big Five Mine Adit of 0.08 CFS and metal concentrations from sample CJX-SW-05.
65
Public Health Assessment Captain Jack Mill
Appendix E. Response to Public Comments One public comment was received during the public comment period of this document, which occurred during August 15-September 30 2005. The comment was in regards to the clarification of the portion of Lefthand Creek, of which water should not be consumed. The recommendation to avoid consumption of water from Lefthand Creek only applies to the portion of the creek contained within the Captain Jack Superfund site. Excessive levels of contamination in portion of the creek downstream of the site have not been documented. To address this comment, the recommendation was clarified in the final document.
Any further comments or questions on this document should be addressed to:
Thomas Simmons Colorado Department of Public Health and Environment Environmental Health Studies Program Ph: 303.692.2961 Fax: 303.782.0904 [email protected]
66