Embed Size (px)
Citation preview
Capnogram
Dr.C.N.Chandra Sekhar M.D

Definitions
Capnometry: Measurement and numerical display of CO2 level during resp.cycleCapnometer: Device that performs the measurement and displays the readings.Capnography: Graphic record with display on a screen or paper of carbondioxide concentration.Capnograph: the machine that generates the waveformCapnogram: the actual waveform.
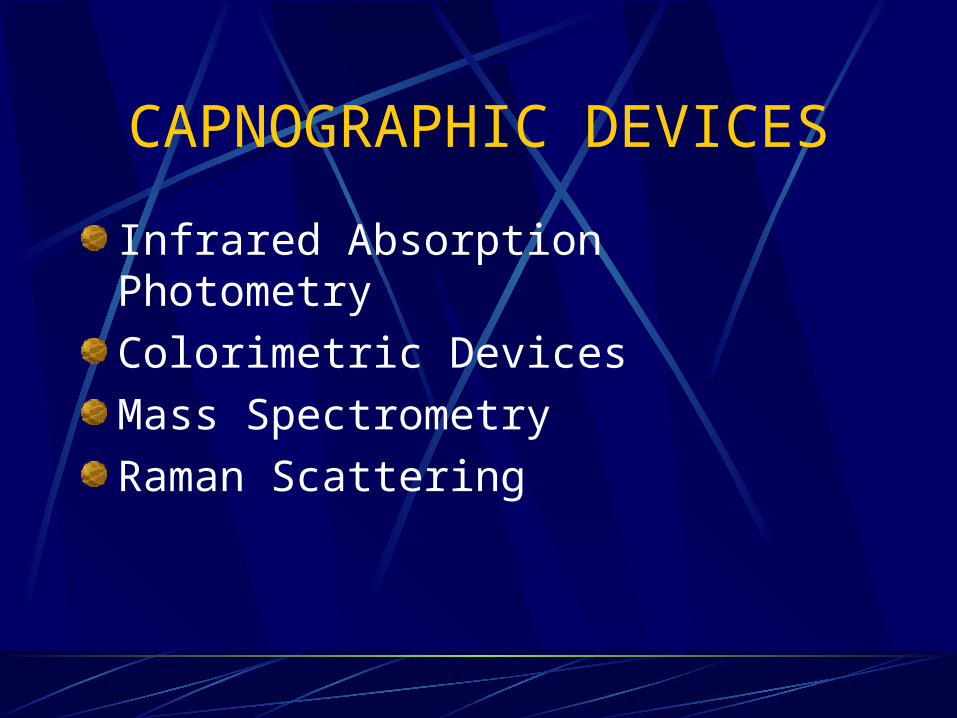
CAPNOGRAPHIC DEVICES
Infrared Absorption Photometry
Colorimetric Devices
Mass Spectrometry
Raman Scattering

INFRAREDFirst developed in 1859.Based on Beer-Lambert law: Pa = 1 - e- DC
Pa is fraction of light absorbed is absorption coefficientD is distance light travels though the gasC is molar gas concentration
The higher the CO2 concentration, the higher the absorption.
CO2 absorption takes place at 4.28 µm
N2O, H2O, and CO can also absorb at this wavelengthTwo types: side port and mainstream

ABSORPTION BANDS

SIDE PORT
Gas is sampled through a small tube
Analysis is performed in a separate chamber
Very reliable
Time delay of 1-60 seconds
Less accurate at higher respiratory rates
Prone to plugging by water and secretions
Ambient air leaks

MAINSTREAMSensor is located in the airwayResponse time as little as 40msecVery accurateDifficult to calibrate without disconnecting (makes it hard to detect rebreathing)More prone to the reading being affected by moistureLarger, can kink the tube.Adds dead space to the airwayBigger chance of being damaged by mishandling
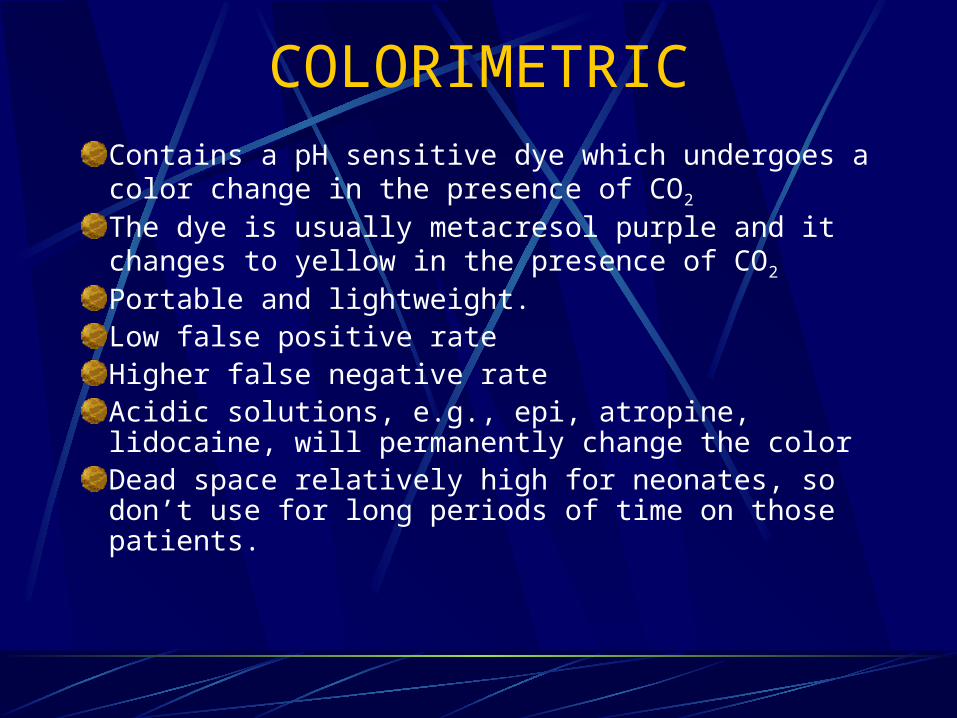
COLORIMETRICContains a pH sensitive dye which undergoes a color change in the presence of CO2
The dye is usually metacresol purple and it changes to yellow in the presence of CO2
Portable and lightweight.Low false positive rateHigher false negative rateAcidic solutions, e.g., epi, atropine, lidocaine, will permanently change the colorDead space relatively high for neonates, so don’t use for long periods of time on those patients.

Physiology
Just after inhalation, the lungs are rapidly filled with oxygen and other gases (negligable CO2)
CO2 diffuses across capillaries and into the alveoli as O2 moves from alveoli to capillaries
As exhalation begins, CO2 rich air is expelled from first the upper and then the lower airways
The capnogram represents the movement of CO2 over timeAll normal, healthy patients should ideally produce identical capnograms

Physiology (continued)
Any deviation from a normal wave is due to an altered physiological state, a pathological state, or equipment malfunctionAny factor that affects the production, diffusion, elimination or partial pressure of CO2 will affect the capnogramThe anesthetist must be able to distinguish between abnormal waveforms due to equipment failure/malfunction from those due to physiological conditions
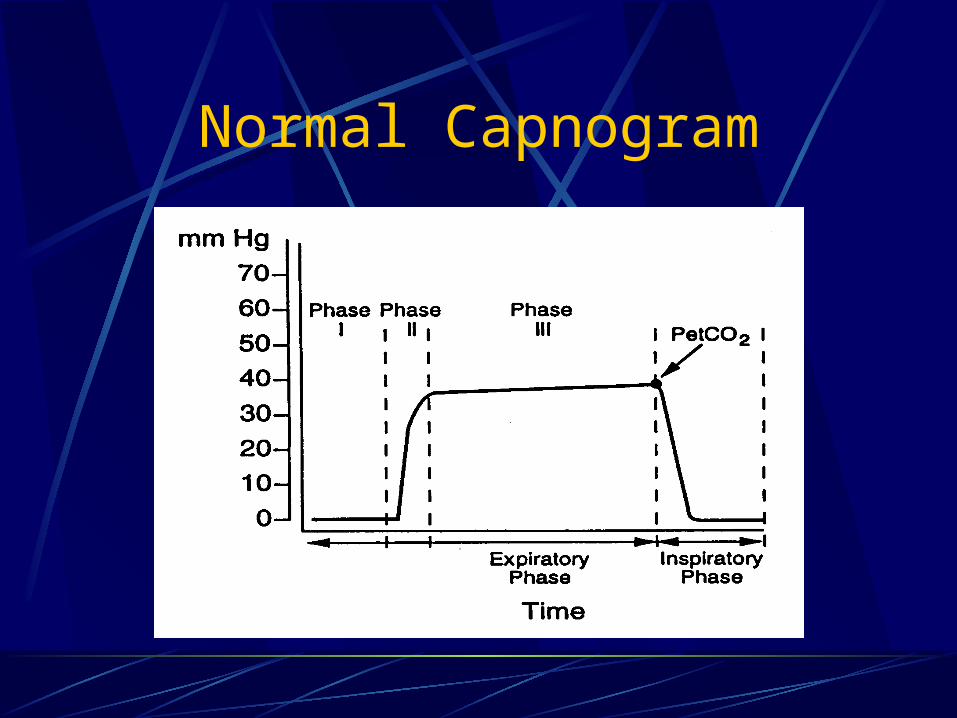
Normal Capnogram

Normal Capnogram
Phase I is the beginning of exhalationPhase I represents most of the anatomical dead spacePhase II is where the alveolar gas begins to mix with the dead space gas and the CO2 begins to rapidly riseThe anatomic dead space can be calculated using Phase I and IIAlveolar dead space can be calculated on the basis of : VD = VDanat + VDalv
Significant increase in the alveolar dead space signifies V/Q mismatch

Normal Capnogram
Phase III corresponds to the elimination of CO2 from the alveoliPhase III usually has a slight increase in the slope as “slow” alveoli emptyThe “slow” alveoli have a lower V/Q ratio and therefore have higher CO2 concentrations
In addition, diffusion of CO2 into the alveoli is greater during expiration. More pronounced in infants
ET CO2 is measured at the maximal point of Phase III.Phase IV is the inspirational phase

PaCO2-PetCO2 gradientUsually <6mm Hg
PetCO2 is usually lessDifference depends on the number of underperfused alveoliTend to mirror each other if the slope of Phase III is horizontal or has a minimal slopeDecreased cardiac output will increase the gradientThe gradient can be negative when healthy lungs are ventilated with high TV and low rateDecreased FRC also gives a negative gradient by increasing the number of slow alveoli

Uses
MetabolicAssess energy expenditure
CardiovascularMonitor trend in cardiac outputCan use as an indirect Fick method, but
actual numbers are hard to quantifyMeasure of effectiveness in CPRDiagnosis of pulmonary embolism:
measure gradient
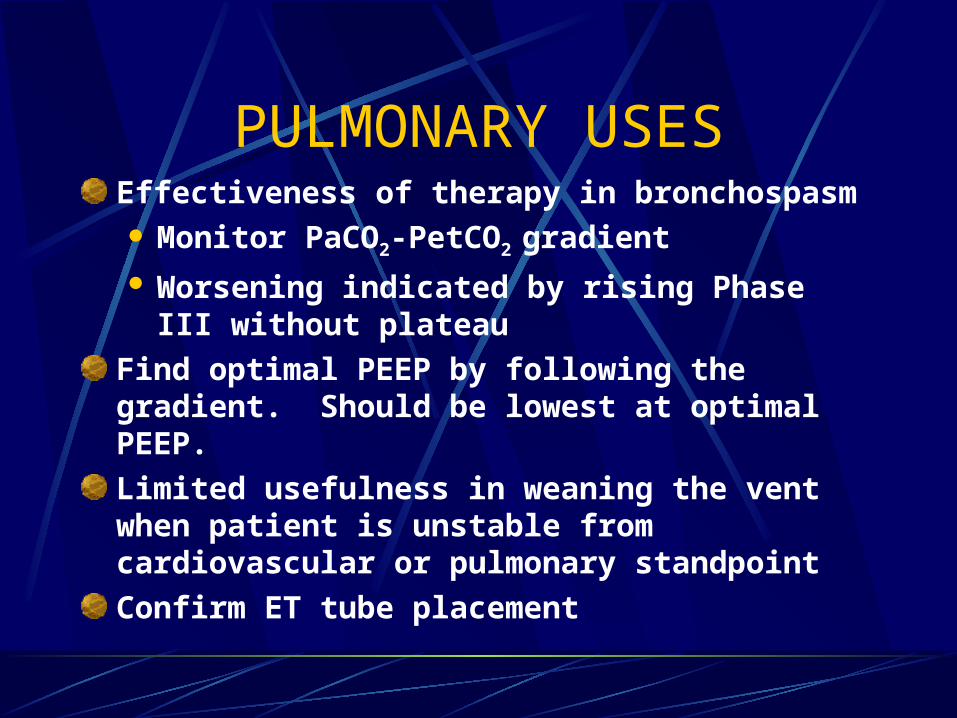
PULMONARY USESEffectiveness of therapy in bronchospasm Monitor PaCO2-PetCO2 gradient Worsening indicated by rising Phase III without
plateau
Find optimal PEEP by following the gradient. Should be lowest at optimal PEEP.
Limited usefulness in weaning the vent when patient is unstable from cardiovascular or pulmonary standpoint
Confirm ET tube placement

LIMITATIONS
Critically ill patients often have rapidly changing dead space and V/Q mismatch
Higher rates and smaller TV can increase the amount of dead space ventilation
High mean airway pressures and PEEP restrict alveolar perfusion, leading to falsely decreased readings
Low cardiac output will decrease the reading

ABNORMALITIES
Increased Phase III slope Obstructive lung
diseasePhase III dip Spontaneous resp
Horizontal Phase III with large ET-art CO2 change Pulmonary embolism cardiac output Hypovolemia
Sudden in ETCO2 to 0 Dislodged tube Vent malfunction ET obstruction
Sudden in ETCO2 Partial obstruction Air leak
Exponential Severe hyperventilation Cardiopulmonary event

ABNORMALITIESGradual Hyperventilation Decreasing temp Gradual in
volumeSudden increase in ETCO2 Malignant Hyperthermia Increased Metabolic
states Sodium bicarb
administration Release of limb
tourniquet
Gradual increase Fever Hypoventilation
Increased baseline Rebreathing Exhausted CO2
absorber

HyperventilationProgressively lower plateau (phase II) segment
Baseline remains at zero
Decreasing CO2 levels

HypoventilationSteady increase in height of Phase IIBaseline remains constant

Spontaneous Ventilation
Short Alveolar plateau
Increased frequency of waveforms

Cardiogenic OscillationsRipples during Phase III and Phase IV
Due to changes in pulmonary blood volume and ultimately CO2 pressure as a result of cardiac contractions

Curare CleftShallow dips in phase III plateauCan occur when patient is in a light plane of anesthesia
Represent patient attempts to breathe independent of mechanical ventilation

Inspiratory Valve Malfunction
Increasing elevation of baseline
Increasing elevation of Phase II
Smaller waveform represents rebreathing of CO2

BronchospasmAirway Obstruction
COPDSloping of inspiratory and expiratory segments
Prolonged Phase II and Phase III

Rebreathing of Soda LimeContamination with CO2
Elevation of Phase II segment and baseline
Elevation of baseline and Phase II, smaller inspiratory efforts
Progressive elevation of Phase II and baseline

Bain System
Smaller wave form represents rebreathing of CO2

Slow ventilationIncompetent inspiratory
valveProlongation of Phase IV

Images reprinted from Capnography.com homepage
Designed by Bhavani Shankar Kodali

Thank You