Embed Size (px)
Citation preview
Università degli Studi di Salerno Centro di Economia del Lavoro e di Politica Economica
Francesco Busato*, Bruno Chiarini^, Pasquale de Angelis^, Elisabetta Marzano^ * Dept. of Economics, School of Economics and Management, University of Aarhus,
Denmark; ^Università di Napoli Parthenope
Capital Subsidies and Underground Production
Discussion Paper n. 96

1
CELPE Centro di Economia del Lavoro e di Politica Economica Università degli Studi di Salerno Via Ponte Don Mellillo, 84084 Fisciano, I- Italy Web Page:http://www.celpe.unisa.it/ E-mail: [email protected] Scientific Commitee: Adalgiso Amendola, Guido Cella, Ugo Colombino, Cesare Imbriani, Giancarlo Marini, Pasquale Persico, Nicola Postiglione, Enrico Pugliese, Salvatore Vinci

2
Indice Introduction ................................................................................................................... 4 1. Motivations and Stylized Facts................................................................................. 5
1.1 The underground economy ................................................................................ 5 1.2 Capital incentives................................................................................................ 5
2. The Model ................................................................................................................. 6 2.1 The Technology .................................................................................................. 7 2.2 Value of the Firm ................................................................................................ 9 2.3 The Steady State .............................................................................................. 12 2.4 The scale of the regular technology (A) ........................................................... 14
3. Policy Experiments ................................................................................................. 15 3.1 Case # 1: low taxation. ..................................................................................... 15 3.2 Case # 2: high enforcement. ............................................................................ 16 3.3 Case # 3: high incentives. ................................................................................ 17 3.4 Case # 4: Moonlighting effect........................................................................... 19
4. Policy Implications .................................................................................................. 20 5. Conclusions ............................................................................................................ 23 6. References.............................................................................................................. 24 Appendix ..................................................................................................................... 26

3
Capital subsidies and underground production
Francesco Busato Bruno Chiarini, Pasquale de Angelis, Elisabetta Marzano* CELPE
October, 2004
Abstract In this paper we investigate the effects of different fiscal policies on the
firm choice to produce underground. We consider a tax evading firm operating simultaneously both in the regular and in the underground economy. We suggest that such a kind of firm, referred to as moonlighting firm, is able to offset the specific costs usually stressed by literature on underground production, such as those suggested by Loayza (1994) and Anderberg et alii (2003). Investigating the effects of different fiscal policy interventions, we find that taxation is a critical parameter to define the size of capital allocation in the underground production. In fact, a strong and inverse relationship is found, and tax reduction is the best policy to reduce the convenience to produce underground. We also confirm the depressing effect on investment of taxation (see, for instance, Summers, 1981), so that tax reduction has no cost in terms of investment. By contrast, the model states that while enforcement is an effective tool to reduce capital allocation in the underground production, it also reduce the total capital stock. Moreover, we also suggest that the allowance of incentives to capital accumulation may generate, in this specific typology of firm, some unexpected effects, causing, together with a positive investment process, also an increase in the share of irregularity. This finding could explain, in a microeconomic framework, the evidence of Italian southern regions, where high incentives are combined with high irregularity ratios. Keywords: tax evasion, moonlighting, capital subsidies, underground production. JEL classification: E26, E22, H25, H26.
* e-mail: [email protected]
4
Introduction∗
This paper analyzes an apparently conflicting empirical evidence, i.e. the positive correlation between incentives to capital accumulation and the size of underground activities.1 We investigate whether the allowance of incentives to capital accumulation affects tax evasion, from a macroeconomic perspective. We study the moonlighting firm, which operates simultaneously in two sectors, the regular and the irregular one, using the same stock of capital and evading taxation in the irregular sector. Such a kind of firm, besides tax evasion, can exploit a peculiar and additional technological benefit compared to a firm operating only in one of the two sectors.2 The analysis is developed in the context of investment theory (partial equilibrium); a representative firm maximizes the expected cash flow, choosing simultaneously the optimal combination of the stock of capital (dimension) and its allocation between the two possible technologies: regular and irregular, conditional on a set of fiscal policy as well as technological parameters. Here is an overview of our results. Investigating the effects of different fiscal policy interventions, we find that taxation is a critical parameter to define the size of capital allocation in the underground production. In fact, a strong and inverse relationship is found, and tax reduction is the best policy to reduce the convenience to produce underground. We also confirm the depressing effect on investment of taxation (see, for instance, Summers, 1981), so that tax reduction has no cost in terms of investment. By contrast, the model states that while enforcement is an effective tool to reduce capital allocation in the underground production, it also reduce the total capital stock. When considering the main fiscal policy question addressed in the paper, that is whether capital subsidies incentivates tax evasion, our results provide strong implications for policy analysis: we suggest that the allowance of incentives to capital accumulation may generate, in this specific typology of firm, unexpected effects, causing, together with a positive investment process, also an increase in the share of irregularity. The structure of the paper is as follow. Section 2 provides some stylized facts and defines the motivations of the paper. Section 3 explains the firm maximizing problem and characterizes the long run equilibrium. In Section 4 the main results of policy analysis are reported and commented. Finally, Section 5 concludes.
∗ We thank Maria Rosaria Carillo, Piero Cipollone and Giuseppe Freni for useful comments and discussion. We also thank participants to the II Workshop “Le cifre dell’economia sommersa e il loro utilizzo”, and participants to the Workshop “Mercato del lavoro e Mezzogiorno: nuove prospettive e vecchi paradigmi”, both held at University of Naples “Parthenope”. 1There are several interpretation for this form of investment incentive: an investment allowance, an easy credit market, a tax credit. 2In this way moonlighting firm is able to offset the specific costs stressed by standard literature, coming either from the high capital cost, as suggested by Loayza (1994), or from the less than perfect information availability, as argued by Anderberg et alt. (2003).

5
1. Motivations and Stylized Facts
1.1 The underground economy Underground activities are a fact in many countries, and there are significant indications that this phenomenon is large and increasing.3 The estimated average size of the underground sector (as a percentage of total GDP) over 1996-97 in developing countries is 39 percent, in transition countries 23 percent, and in OECD countries about 17 percent.4 The size of underground economy accounts for approximately 16% of the Italian Value Added;5 the largest amount of irregular Value Added is registered in the services sector, followed by industry and finally by agriculture. Regional composition of irregular economy, proxied by irregularity in labor utilization, is registered mostly in southern regions. In addition, in the services sector there is some homogeneity of irregularity ratios among regions, while the industrial sector is the one where territorial differences are the most relevant.6 A recent survey (i.e. Di Nicola and Santoro, 2000), based on tax audits on a representative sample of 450 Italian companies, points out the main characteristics of Italian firms which evade levied taxation. In particular, tax evasion is more widespread among small size firms and new firms, especially when located in the south of Italy; moreover, tax audits show that evasion is more common in firms with a weak property structure.
1.2 Capital incentives The Institute for the Industrial Promotion (IPI) estimates that during the period 1998-2001 there are 95 different kind of possible channel to obtain public incentives for firms operating in the non agricultural sector; the most of them give a direct or indirect contribution to capital accumulation, while only a residual part give a contribution to operating costs (3 of the existing 95 incentives laws). Looking at the financial size of these incentives laws, in the whole period 1998-2001 the total amount of incentives allowed was 30700 million of euro, while in the same period firms applied for a total amount of 66500 million of euro.7
3 There is no universal agreement on what defines the underground economy. Most recent studies use one of more of the following definitions: (a) unrecorded economy (failing to fully or properly record economic activity, such as hiring workers off-the-book); (b) unreported economy (legal activity meant to evade the tax code); (c) illegal economy (trading in illegal goods and services). Obviously, the difficulty in defining the sector extends to the estimation of its size. We are concerned with the size of the underground economy as encompassing activities which are otherwise legal but go unreported or unrecorded. 4 Estimates of the underground economy are particularly difficult, as the phenomenon is, by definition, not directly measurable. Several methods have been used to the scope, some based on theoretical models, some based econometrics and others on micro analysis of agent answers in particular surveys (Schneider and Enste, 2002, for a survey). In Italy the National Statistical Office (ISTAT) produces, since 1992, some estimations on the size of the underground economy, disaggregated at regional level since 1995. 5 These estimations are based on a complex procedure, accepted at international level by Eurostat and OECD, and can be considered a good approximation, even though not exhaustive, of the real size of the underground economy. For a comment to the estimates of the Italian underground economy see also Chiarini and Marzano, 2004. 6 The ratio between the size of irregular jobs in the South of Italy compared to the North East is 2.0, when considering the economy as a whole, and peaks to 6.2 for the industrial sector (see Marzano, 2004). 7This amount corresponds to a 2.7% of the yearly average (of the period 1998-2001) GDP.

6
Geographically, applications from southern regions were 68% of total applications, mainly among small firms, while in the north of Italy a major role was played by big firms (41% of total incentives allowed). Figure 1 reports investment incentives (source Ministero Attività Produttive) and irregular workers' sizes (source ISTAT) for each of the 20 Italian regions. A casual inspection suggests that there emerges a positive correlation between the two measures, particularly relevant when considering irregular workers in the industrial sector (the coefficient of correlation is 0.88 ).
Figure 1: Irregular Labour and Average Incentives in Italian Regions. On the left axes it is measured the size of the irregularity ratio (irregular workers / total workers) while in the left axes it is measured the amount of the average incentive for each region.
2. The Model This paper suggests a microeconomic explanation of this positive correlation, considering a particular model of underground production.8 The definition of the irregular production needs some specifications. Irregular production can be ruled either by a completely irregular firm (hereinafter defined as ghost firm), or by a firm which acts only partially in the underground sector (hereinafter defined as moonlighting firm). Capital allocating decision would be different in the two cases: the share of capital invested in the irregular sectors would be µ =1 for a ghost firm, while it belongs in ( )1,0∈µ for a moonlighting firm. Literature usually assumes that underground firms are less productive than regular firms; some typical explanations are: lower entrepreneurial ability; difficulty in getting financial support; high
8 The origin of the positive correlation between the two index can also be traced back to the common factor ``underdevelopment''; actually, underground economy and economic underdevelopment are often analyzed together (Loayza, 1996; Carillo and Pugno, 2002; Johnson and alt., 1997).

7
transaction costs due to the necessity to locate ``trustworthy'' trading partners.9 However, we are not dealing with a ghost firm, where all the production is hidden. In this paper we consider a representative firm which operates ``above'' as well as ``under'' the ground, the so called moonlighting firm, producing an identical homogenous good and using a unique stock of capital, but declaring to Internal Revenue Service only a share of its production. We argue that the ``moonlighting technology'' may dampen the limits usually assessed for the underground firms, generating a specific economy of scale, which cannot be exploited by ghost firms. Irregular production is a complex task which is addressed to obtaining one of the following alternatives, aiming at:
• ``extra-profit '': this is the situation of medium size productive units, largely regular, with their own brand, which exploit the underground production to gain extra profits (but also the partial decentralization by a regular firm toward smaller and irregular productive units referred to as faç onismo or ``local underground district'' by Censis, 2003);
• ``surviving '': this situation applies for small firms producing largely underground, which use the regular production as a convenient screen to avoid fiscal controls.
The technology of the moonlighting firm is able to cope with these motivations.
2.1 The Technology Suppose there exists an homogenous good which can be produced using two different technologies, the regular technology and the underground one; regular production is taxed while underground production is not declared to Internal Revenue Service. Each firm can decide to specialize into regular production, underground production or both. Denote with K the capital stock, and with µ or (1-µ) the share of capital allocated to the regular or underground sector; the output of the two specialized firms are such that:10
( )aU
aR KBYKAY ))1( ;)( µµ −==
where α represents the elasticity of capital stocks in the two sectors.11 The two sectors use identical technologies with the exception of the two scaling factors A and B . Similarly to what occurs in a two sector model with sector specific externalities, we assume that from the prospective of a firm operating in a single sector the two parameters are taken as positive constants, while for a firm operating simultaneously in the two sectors (moonlighting) B is a function of the total use of capital:
σaKB = and it represents the moonlighting effect. The parameter σ measures the entity of the scale economies generated by the simultaneous implementation of the regular and underground technology. In the sequel of the paper we refer to this as to the moonlighting effect. Condition 1 below suggests that the size of scale
9See Anderberg and alt. (2003); Loayza (1994). 10To simplify the analysis we are considering a single factor technology which employs only capital; this is tantamount to a constant returns of scale technology, with capital and labor inputs: in this case, output as well as capital would be measured per unit of employee. 11Since both sector produces the same commodity, the capital elasticities are assumed to be identical.

8
economies should be sufficiently low to ensures that returns to scale are not increasing at the firm level: Condition 1 a
a−<< 10 σ The restriction on the size of the moonlighting effect σ , and, consequently, the exclusion of any sort of increasing returns of scale, is a necessary assumption to allow the moonlighting firm choosing an optimal size of capital dimension, capturing the positive interaction between regular and irregular production.12 Given these assumptions, total production value is computed by linearly aggregating regular and underground produced outputs. Incorporating the scale effect B , total production reads:
.)1()( )1( σµµ +−+=+= aaaUR KKAYYY (1)
The firm behaves as a partial tax-evader, because it complies with fiscal law only for the regular production. The institutional side of the model is defined by the triplet { }s,,τρ , where τ defines a proportional tax rate levied on output, s represents a surcharge factor (s>1) levied on the tax rate if a firm is detected evading; finally, ρ is the probability that a firm is detected and convicted of tax evasion.13 Firm's revenues equal:
Detected REVD= ( ) UR YsY ττ −+− 1)1( (ρ)
REV: Not Detected REVND= UR YY +− )1( τ (1- ρ)
and the ex-ante expected revenues are:
( ).)1()1(
1)()(
UR
NDD
YsYREVEREVERE
ρττρρ
−+−==−+=
(2)
12 In the appendix it is shown that a sufficient condition to allow saddle path stability
is: ( ) ( ) aaaa /1/1 2 −<−<σ . 13Literature, either empirical and theoretical, usually considers taxation and regulations as the main causes of the existence of the underground sector (see Thomas,1992; Tanzi, 1980; Schneider and Enste,2002; Dallago,1990) devoting much attention to analysis of the entrepreneurial choice between regular and irregular production and concentrating attention either on the tax evasion decision or on the labor market. The analysis of tax evasion, starting from Allingham and Sandmo (1972) and Yitzhaki, (1974) focuses on the structure of marginal taxation, and/or on the consequences for private/social welfare, without investigating the link between tax evasion and technology (see Cowell, 1990; Trandel and Snow, 1999, for surveys on tax evasion, and Alm, (1985), for the welfare effects of evasion). On the other side, when focusing on the technology of underground activities, literature very often concentrate the analysis on the labor input, neglecting capital utilization (see Portes, Castells and Benton, 1989; Boeri and Garibaldi, 2001; Busato and Chiarini, 2004; Busato, Chiarini and Rey, 2005).

9
It can be shown that the following condition ensures the existence of both productions: Condition 2 1≥s and ( ).1 ρρ −≤s Condition 2 states that the surcharge must be higher than unity, and that the expected surcharge must be lower than the threshold (1-ρ) , otherwise the expected return to a unit of evaded production, (1-ρ)τ-ρτs, would be negative, so that the firm would have no convenience to operate in the underground sector. Given all parametric condition, Lemma 1 below shows that there exists a well behaved Production Possibility Frontier. Lemma 1 (Production Possibility Frontier) There exists a negatively sloped and concave PPF such that:
( ) σaa
gIrreg KYKY a
⎥⎦⎤
⎢⎣⎡ −=
1Re .
Proof APPENDIX.
2.2 Value of the Firm At time zero the firm is endowed with a given positive amount of capital ( )0K , and with an
intertemporally fixed flow of a non-capital resource (labor, land, 0NK ), which are normalized
to unity ( 10 =NK ). Each instant a firm maximizes the intertemporal cash-flow function, choosing how many resources to allocate to the regular production, µ, and how much revenue to invest, I. Investing is a costly process for firms; the assumption here adopted is that the adjustment costs are a convex function of the rate of change of the capital stock (no learning by doing):
.1;)( >= bIIC b In addition, we assume that investments are encouraged by the government, which provides a capital contribution proportional to total investment, α, to firms which are willing to increase their capital stock. We assume that government neither is able to know whether new capital will be employed in regular or in the irregular production, nor dispose of accountability tools enforcing the firm to declare only the capital regularly employed.14 The value of the firm is the expected present value of its revenues net of expenditures on capital input. The representative firm maximizes expected cash flow V subject to a constraint set:
14This assumption, merged with Condition 2 in the main text, is a strong incentive toward underground production. A different situation would occur whether fiscal authorities would be more effective in allowing incentives to capital than in detecting tax evasion. In this case the rational agent would choose to produce irregularly, YU >0, but asking for incentives only on the regular share of its investment, αµI. This hypothesis complicates considerably the analysis, generating unstable and oscillating equilibria.

10
{ }
( ) ( ) .10;10;1;1;1,0:
0lim:
0:10:
':)1)(1()()1(:.
max
0
0
)1(
0,
aass
Ke
K
KIKIIIKsKAtos
dte
rt
t
baaa
rt
tI
−<<≤≤−≤≥∈
=
>
≤≤−=
+−−−−+−=Π
Π=
−
∞→
+
−∞
=∫
στρρα
φ
µδ
αµρτµτ σ
µV
(3-6)
The quantity )1()1)(1()()1( σµρτµτ +−−+− aaa KsKA represents firm's revenues, net of taxation, I is the amount of gross investment, and δ is the physical depreciation rate of capital. The amount αI denotes an investment allowance, where α belongs to the (0,1) interval; it could account for several different typologies of financial support to investment, such as equipment grants to firms investing in less developed areas, financial facilities to small and medium sized enterprisers, financial facilities for specific investment programs eligible by the ``Local Business Development'' National Operational Program (NOP). Defining 0φ , 1φ and 2φ Lagrange multipliers, the current value Hamiltonian H reads:
( ),
)1()1)(1()()1(
210
)1(
0dt
KIIIIKsKA
e b
aaart
t ⎭⎬⎫
⎩⎨⎧
−−+−+−−++−−+−
=+
−∞
=∫ µφµφδφαµρτµτ σ
H
where r is the exogenous discount rate. The first order conditions obtain:15
15The optimization problem is well defined,e.g. the objective function is concave. Actually:
0/,/,/ 222222 <∂Π∂∂Π∂∂Π∂ IKµ
11
[ ]
.'0;10;0
)1()1)(1()1('
:'
0)1()1()1(:0
01:0
2
1
01)1(1
00
00
21)1(11
01
KIK
KasKaAr
rKH
KasKaAH
bIIH
aaaa
aaaa
b
δφµφµ
δφσµρτµτφφ
φφ
φφµρτµτµ
φα
σ
σ
−=≥≥−≥≥
−+−−+−−=
−=∂∂
−
=−+−−−−=∂∂
=+−−=∂∂
−+−
+−−
−
(7-12)
Proposition 1 below proves that the model has a an interior solution. Proposition1 A firm opting for moonlighting )10( << µ has no convenience neither to become completely regular )1( =µ nor to turn into a ghost firm )0( =µ . Proof APPENDIX. Manipulation of the first order conditions leads to the following conditions characterizing optimal capital accumulation and tax evasion:
( )[ ] ( )
( ).'
)1()1)(1()1('0)1()1()1(
/1
1)1(100
)1(11
1/10
KIKKasKaAr
KasKaA
Ib
aaaa
aaaa
b
δσµρτµτφδφ
µρτµτ
αφ
σ
σ
−=+−−−−−+=
=−−−−
=+−
−+−
+−−
−
(13-16)
The investment function (Equation 13) has standard characteristics: for a given level of fiscal allowances, investment is increasing in 0φ , and gross investment is zero when the marginal value of capital is just equal to the market price of capital, normalized to 1, net of fiscal allowance α. The allowance of fiscal incentives to capital accumulation clearly increases investment. Equation 14 ensures the optimal allocation of capital between the regular and underground production: the marginal effect of a capital reallocation on its net-of-tax productivity in the two sectors must be equal. It implicitly defines the equilibrium level of regularity as a negative function of the total capital:16
16This result is a consequence of the endogenous TFP in the underground technology.

12
( )( )( )( )( )( )
.11
)(1
11
11
1
11
11
d
d
aAas
aAas
CKCK
K
KK
aaa
aaa
+≡
+==
−−
−−
−−
−−
∗
τρτ
τρτ
σ
σ
µµ (14’)
Combining the first two equations of the system (13)-(16), ( )0φI and )(Kµ , in the last ones, we obtain a dynamical system such that:
( ) ( ) [ ]( ) .'
)1(1)1()1('
0
1)1(100
KIKKasKaAr aaaa
δφσµρτµτφδφ σ
−=+−−−−−+= −+∗−∗
(17-18)
The first condition states that the marginal revenue of capital equals its user cost, ( ) '00 φφδ −+r ; the second condition implies that K is increasing when 0φ is so higher than the marginal cost of capital, 1-α, to achieve a level of net investment larger than physical depreciation of capital, δK.
2.3 The Steady State
2.3.1 Qualitative Analysis
The Steady state ( 0''0 == Kφ ) is characterized by the two equations:
( ) ( )[ ]( )⎪⎩
⎪⎨⎧
=+−−+−= −+∗−∗
+
KIKasKaA aaaa
r
δφσµρτµτφ σ
δ
0
1)1(110 )1()1)(1()1( (19)
The first equation tell us that in equilibrium (long run) the shadow price of capital is the discounted value of the net-of-tax marginal productivity of capital; the second condition states that the stock of capital is stable when investment is just equal to physical depreciation of capital. The two steady state relations can be geometrically represented in the space ),( 0φK . For our parametrization (see next section) the first one describes a negatively shaped and convex curve: larger amount of capital reduce its marginal productivity, so that in equilibrium a lower value for the shadow price for capital is commanded (see the 0'0 =φ locus in the left
panel of Figure 2). The locus 0'=K (see the left panel of Figure 2) is displayed as an increasing relationship in the space ),( 0φK , consistently with standard literature on investment function; as investment must be equal to the depreciation in the capital stock, then, in order to maintain an higher stock of capital an higher shadow price is commanded. In the right panel of Figure 2 it is represented, in the space ),( Kµ , the relationship ( )K∗µ defined by Equation 14': for each level of K identified by the solution of the system 19, a unique cash-flow maximizing value of µ is identified. The locus ( )K∗µ is monotone and decreasing; in fact, given the nature of the moonlighting effect, the larger is the amount of

13
total capital, the more convenient is to shift it in the underground production (e.g. to decrease µ). Proposition 2 In the long run, the dynamical system of Eqs. 17-18 admits a unique steady state. Proof APPENDIX Proposition 3 The steady state of the dynamical system of Eqs. 17-18 is always a saddle path. Proof APPENDIX
Figure 2: Points upper the locus 0'0 =φ are characterized, for each level of K, by a 0φ higher than the equilibrium level; given the dynamic expressed in eq. 17 it implies a growth of the shadow price of capital (arrows point up). Similarly, when considering points upper to the 0'=K we register for each K
a 0φ higher than the equilibrium level; given the investment function, Eq. 13, and the dynamic expressed in Eq. 18, it implies a growth of the capital stock (arrows point right).
2.3.2 Parametrization The model depends on five parameters: the capital elasticity, a, which, coherently with standard literature, is set at the value 0.3; the exogenous discount rate, r, set to the value 0.025; the rate of physical depreciation of capital, δ, calibrated to 0.125. The technological parameters A and σ, are set, respectively to the value 10 and 0.5. Next, the taxation rate, τ , is set to 0.4 to match the average high level of direct taxation in Italy in recent years; the surcharge applied to tax evaders, s , following the Italian civil law, is set to 1.3; the probability to be catched when cheating the government, ρ, is set to a very low value, 0.05, to give an idea of low enforcement, which can be assimilated to the Italian actual conditions; finally, the size of incentives to capital accumulation, α, is set to 14% in the

14
baseline calibration.17
125.03.03.105.0025.05.040.01014.0δρστα asrA
Given this set of parameters, the solution of the dynamical system identifies a single long run equilibrium, given by the triplet:
( ).8818.0;0354.2;5242.15 0 === ∗∗∗ µφK The graphic analysis of the long run equilibrium is shown in Figure 2. The left panel displays, in the space ),( 0φK , the two steady state relationships (system 19) and the local dynamics: the stability arrows show that there is a single stable arm which brings the firm toward the long run equilibrium. Looking at the local dynamics (left panel), the upper left side of the stable arm is characterized by a stock of capital lower than the equilibrium and a shadow price of the capital higher than the equilibrium level, so that the rational firm increases the stock of capital (net investment are larger than capital depreciation) until the shadow price reach its equilibrium level, at the steady state. When the capital stock dimension is lower than optimal, given equation 14, the regularity share is higher than optimal (see also the right panel of Figure 2); during the process of capital accumulation, the firm also shifts capital into the underground technology, until marginal productivities are leveled across sectors (see. eq. 14). A symmetric process applies when capital dimension is higher than optimal and the firm operates on the lower and right side of the stable arm.18
2.4 The scale of the regular technology (A) The parameter A can be considered the scale of production in the regular technology, and it provides important implications for the relationship between firm's dimension and underground activity:
( ) aaREGR KAKAY )(µ≡= (20)
Changes in this technological parameter generates notably differences with the baseline calibration, both in terms of optimal capital dimension and in terms of share of regularity. In fact, using a unitary productive scale, and leaving all the other parameters unchanged, we get a new long run equilibrium for the optimal capital dimension and its allocation between the two sectors: )28.0;92.2( == ∗∗ µK . By contrast, a larger productive scale, say A=20, generates the equilibrium
17The calibration of the fiscal parameters τ and α has been chosen starting from the recent analysis of the Italian firm fiscal regimes addressed in Bontempi and alt. (2001). In particular, incentives to investment identified as Credito di Imposta ranges from an average level of 0.14 for the Center-North regions, to a 0.65 for the less developed region (Calabria). As to corporate taxation, the figure reported in KPMG (2004) for Italy is 37.25%. See also Busato and Chiarini (2004) for calibration of a macroeconomic model with tax evasion. 18 Every other path different from the saddle path brings the firm far from the long run equilibrium in areas in which transversality condition (Eq. 6) no longer applies.

15
)94.0;94.34( == ∗∗ µK . These experiments leave to foresight a strong and direct relationship between the scale of regular production, which can be considered a proxy for the dimension of the firm, and the choice to operate regularly. Literature usually agree on the importance of firm dimension in affecting the propensity to operate in the underground economy, as already pointed out in Section 1 and 2. This result is essentially derived by equation 14, which guarantees the optimal allocation of capital between the two productions.
3. Policy Experiments This section presents selected fiscal policy experiments, to evaluate their impact on the long run equilibrium as well as on the investment policy of the moonlighting firm.
3.1 Case # 1: low taxation. The first exercise is about the effects of changes in the taxation rate, τ:
( )40.0125.03.03.105.0025.05.020.01014.0
* δρστα asrA
Lowering taxation by 50% causes an increase in the long run level of the capital stock as well as the share of regularity: the new steady state equilibrium is given by the triplet ( )9114.0;0749.2;6026.21 0 === ∗∗∗ µφK , causing a 40% increase of the capital stock, and a 3.4% increase in the size of regular use of capital. In fact, tax reduction increases the net-of-tax marginal revenue of capital, and it occurs in a relatively stronger way in the regular technology (due to Condition 2). Figure 3 presents the graphical analysis of this shock; the change in the taxation rate identifies a new steady state at an higher level of both capital and its shadow price. There is an initial overshooting of the shadow price of capital, generating an investment process, which lasts until the new long run equilibrium is reached.19
19This analysis is coherent with standard literature on investment (see Summers, 1981; Abel, 1982).

16
F Figure 3: The new tax rate causes an upward shift, due to the increase in the marginal revenue of capital, in the curve 0'0 =φ , while the 0'=K is unchanged. In the right panel there is an upward translation of the curve µ (K) due to the fall in the taxation ratio. Given the initial stock of total capital, the share of its regular use, µ, jumps on the new µ(K) curve (the cross one), so that an initial overshooting occurs (see the dashed arrows). It is, then, interesting investigating the dynamics of the capital allocation, µ. The fall in the taxation ratio, )1/()1( τρτ −− s , consequent the fall in the tax rate, alters the equilibrium relationship between K and µ which level marginal productivity of capital in the two productions (Eq. 14), changing their relative convenience.20 Actually, for each level of the total capital stock, and all the other relevant parameters being equal, a tax cut induces the moonlighting firm to be more regular, experiencing an initial overshooting in its regular size. As long as the capital stock increases toward its steady state level, the firm will also reduce the share of regularity adjusting toward its coherent equilibrium level of µ .
3.2 Case # 2: high enforcement. The second policy experiment carried out considers the effects of the enforcement policy, doubling up, alternatively, either the detection probability, ρ, or the penalty s :
20Given Condition 2 in the main text, a fall in the tax rate necessarily causes a fall in the taxation ratio
).1/()1( τρτ −− s

17
( ) ( )3.105.0125.03.06.21.0025.05.040.01014.0
** δρστα asrA
Improving the level of enforcement causes an increase in the equilibrium level of the share of regularity, but also a reduction of the capital stock, in fact the new steady state equilibrium is given by the triplet:
( ).8859.0;0346.2;4179.15 0 === ∗∗∗ µφK This produces an 0.7% reduction of the capital stock, and a 0.5% increase in the size of regular use of capital. The dynamical analysis of this shock can be seen in Figure 4; starting from the baseline equilibrium, the shadow price of capital shows a downward jump on the new saddle path, lowering the capital stock until the new steady state is reached. As concern the share of regularity, the qualitative effect are similar to those achieved for the tax cut: for each level of the total capital stock, a rise in enforcement is equivalent to a fall in the taxation ratio, inducing the moonlighting firm to be more regular.
3.3 Case # 3: high incentives. The third policy experiment is the change (a doubling up) in the size of fiscal allowances to capital accumulation:
( )14.0125.03.03.105.0025.05.040.01028.0
* δρστα asrA
Increasing the size of fiscal incentives to capital accumulation pushes the equilibrium level of the capital stock up, as we would intuitively expect, but also generates a marginal reduction of the share of regularity. The new equilibrium is given by the triplet:
( )8796.0;9069.1;1079.17 0 === ∗∗∗ µφK these figures represent a 10% increase of the capital stock, and a 0.2% reduction in the regular use of capital.21 The negative impact of incentives to capital accumulation on regularity introduces a micro-founded explanation of the observed positive correlation between capital accumulation incentives and the size of the underground economy observed in Italy. The increase in fiscal incentive to capital accumulation reduces the cost of capital, so that 21The first order conditions suggest that the critical parameters for capital allocation in the underground production are the size of the moonlighting effect, σ; the scale of regular production, A; and the taxation ratio
)1/()1( τρτ −− s . In particular, if we calibrate the TFP in the regular technology, A, to a value lower than the baseline, the marginal effect of a rise in incentives on the irregular share of capital is more sharp. For instance, setting A=5, the fall in the regular use of capital is about 0.5%; for A=2 the fall is about 1%. A similar effect occurs when calibrating higher values for the moonlighting effect σ.

18
there is an immediate effect on investment. In the left panel of Figure 5 the locus 0'=K moves downward, and the shadow price of capital jumps on the new saddle path at a level higher than the new equilibrium, inducing a flow of new investment. The rise of capital stock alters the equilibrium marginal productivity (Eq. 14), so that as long as net investment are positive, the firm also reallocates capital between sectors. Since the moonlighting effect implies that the capital increase affects the TFP in the irregular technology (σ>0), it is optimal to reduce µ until the new equilibrium of capital is reached (right panel of Figure 5).
Figure 4: the change in enforcement causes an downward shift in the curve 0'0 =φ , due to the fall in the after-tax marginal revenue of capital in the underground technology. The right panel shows the immediate increase in the allocation of capital into the regular sector, e.g. a jump on the new (cross) curve µ (K), followed by a gradual increase as long as capital adjusts toward its long run level.

19
Figure 5: rising subsidies to investment generates capital accumulation, but it also spoors the allocation of capital into the underground production.
3.4 Case # 4: Moonlighting effect Finally, we consider a different value for the technological parameter σ, which can be considered only indirectly a policy instrument, in the sense that the possibility for the moonlighting firm to exploit the external effect of the aggregate capital is supposed to be a function of the institutional and social framework in which firms operate. A larger value for σ implies that the moonlighting firm strongly benefits from the simultaneity of its two productions.
( )5.0125.03.03.105.0025.0140.01014.0
* δρστα asrA
Doubling the size of the moonlighting effect causes a noticeable increase in the equilibrium level of the capital stock as well as a strong reduction in the share of regularity; the new equilibrium triplet is: ( )7857.0;0696.2;6855.20 0 === ∗∗∗ µφK , these figures account for a 33% increase in the size of the capital stock, and quite large increase in its irregular use, as µ is downsized by a 10%. To better appreciate the intuition, here it is useful to reconsider Condition 1 (the restriction a
a−< 1σ aims at avoiding the occurrence of increasing returns of scale). Without this assumption, there would be no

20
equilibrium, and the concavity of the objective function would be no longer ensured. Even more interestingly, under increasing returns of scale due to the moonlighting effect, there is no convenience to keep moonlighting, and the solution converges toward a ghost firm, e.g. µ→0, while dimension is no longer determinate.22
Figure 6: the rise in σ immediately rises the marginal productivity of capital in the irregular technology, so that the shadow price of capital rises, and the curve 0'0 =φ moves upward; simultaneously, the firm reallocates capital into the irregular production, and the curve µ (K), in the right panel, also moves downward.
4. Policy Implications To discuss the implications of policy incentives under underground economy, it is useful to give a qualitative synthesis of the experiments reported in the previous sections. Table 1 shows that both enforcement and tax reduction are effective in contrasting underground production, while their consequences on capital accumulation are contrasting: whilst tax reduction is also an incentive to capital accumulation, enforcement has a depressing effect on the stock of capital. Therefore, a trade-off arises when strengthening enforcement between regularity and investment. A similar but opposite trade-off arises when using
22Graphically, the locus 0'=K would have the usual increasing shape, but we would observe also an increasing
locus 0'0 =φ , situated above the 0'=K so that no equilibrium could be found.

21
subsidies to raise investment, because this policy also incentives firms to engage in underground production.
Table 1: Qualitative effects of different fiscal policies on the long run equilibrium.
Fiscal Policy ∗K ∗µ ∗0φ
Tax Reduction + + + Incentives Rise + - - Enforcement Rise - + - Welfare effects are more clearly shown in Table 2, considering the total production as an indicator of total welfare.
Table 2: Quantitative effects of different fiscal policies on the long run equilibrium. Baseline long run equilibrium is set to 100.
Welfare Effects of Fiscal Policy TOTY Baseline 100 Tax Reduction 110,7 Incentives Rise 103 Enforcement Rise 99,8 Two interesting issues arise when looking at the welfare effects. First, tax reduction generate a considerable positive effect on total production; by contrast, strengthening enforcement is welfare-depressing. Second, incentives are positive for total welfare, but not as much as tax reduction. Further useful insights may be drawn from the analysis of the reaction function, which expresses the long run values of total capital and its regular share as function of the different size of each single fiscal policy parameter. In the right panel of Figure 7 are shown the effects of the variation of a single parameter (taxation rate, enforcement, incentives and moonlighting effect) on the size of regular capital, µ, while in the left panel the reaction functions for the total capital stock are displayed. The Figure 7 shows that reaction functions are always monotone, but they are also non linear. The figure highlights the deep impact of taxation both on the capital stock and on the size of its irregular use; no one of the other parameters have a quantitatively similar impact. Tax policies are the only ones causing a co-movement in the two objective variables total capital and regular share: starting from the baseline value of taxation, 0,4, a fall in tax rate generates a capital as well as a regular share increase, and a welfare gain.
22
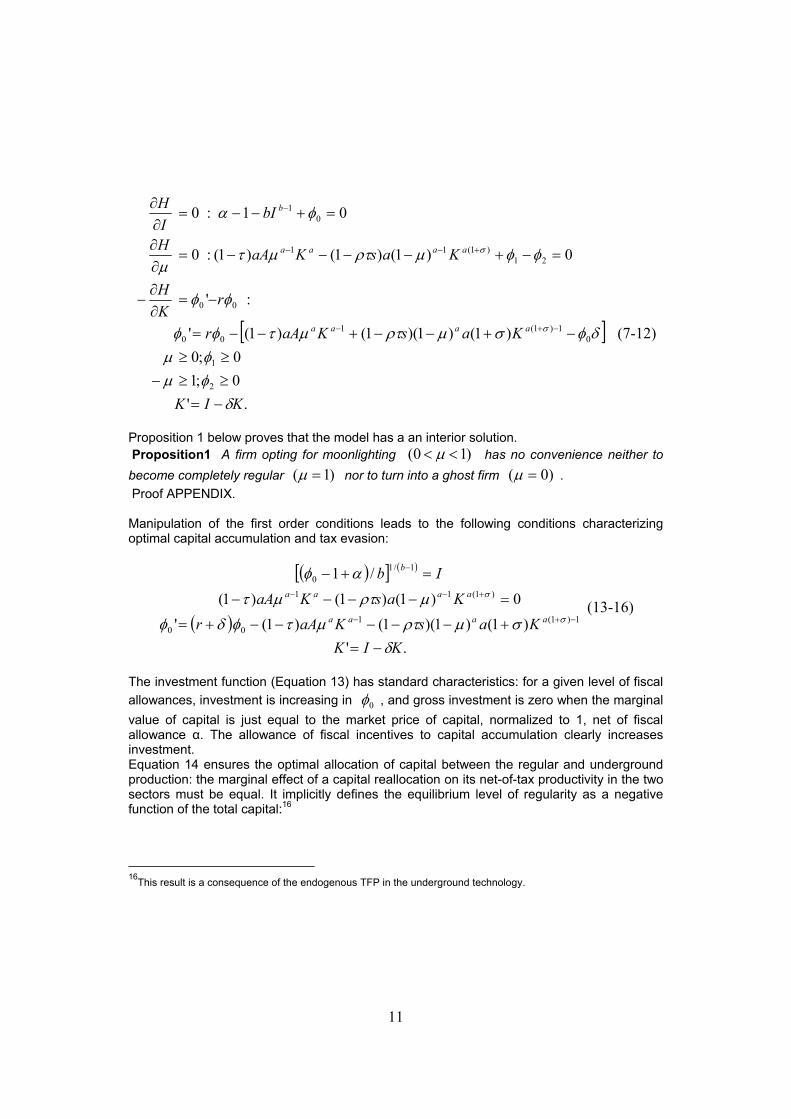
Figure 7: reaction to taxation (cross); incentives (dotted); enforcement (dash-dot); and moonlighting effect (dash). The range of variation of each parameter is (0.1-0.9). The horizontal line represents the equilibrium level of total capital (left panel) and its regular use (right panel) in the baseline calibration. Each reaction function crosses the horizontal line when the relevant fiscal policy parameter reach its baseline value. As to enforcement, its impact on underground production is relatively stronger than its depressing effect on capital accumulation. This evidence, associated to the strong and positive effects of a tax cut, and to the welfare effect stressed in Table 2, seriously depreciates the role of enforcement in fighting underground economy. Looking at Figure 7, we should also conclude that fiscal authorities should be very careful when planning policies directed to support investment, especially in areas where underground economy is sizeable. The Figure 7 shows that incentives impact deeply on capital accumulation, but they also produce an increase of the irregular use of capital. In designing policy incentives to the stock of capital, it should be taken into account the ``nature'' of the firm, and, in particular, whether in the sector, and also in the area where the firm operates there exists a large part of output that is unreported. As incentives to investment always produce incentives to go underground, it is possible to argue there exist the risk that they tend, via underground activities, to be an inconsistent policy. If government policies support moonlighting firms, firms will have a lower incentive to increase their reported capital, because doing so could imply a reduction in the level of incentives they enjoy. Therefore, the government would face the spur to provide incentives to capital accumulation for a longer time than expected.
23
5. Conclusions Tax evasion, far from being an academic hypothesis, is a widespread reality in the Italian economy. In this paper we have investigated the effects of several different fiscal policies on tax-evading firms. The innovation of the paper lies in the representation of a technological advantage (scale economies) specific of moonlighting firms compared to ghost firms. The model is able to catch some quite standard results in the literature about the underground economy, such as the relationship between the scale of production and the size of the underground economy: the larger is the scale of regular production the lower is the share of capital allocated in the underground economy. Moreover, there are several striking policy implications that we can draw from our analysis. First of all the troubling aspects of the fiscal allowances. In the context depicted by our moonlighting firm, government's incentives to the capital stock accumulation turn to be an incentive not only to capital accumulation but also to its underground use. A second issue is the effectiveness of the different policies aiming at reducing underground production. Even though tax reduction and enforcement both cause a lower convenience to operate irregularly, their effects on total welfare are basically different. In fact, while a tax reduction is also welfare improving, a trade-off arises between regularity and capital accumulation if the contrast to irregular production is pursued through enforcement.

24
6. References Abel (1982), Dynamic effect of a permanent and temporary tax policies in a q model
of investment, Journal of Monetary Economics, 9, pp. 353-373. Allingham, M.G., Sandmo A., (1972), Income tax evasion: a theoretical analysis,
Journal of Public Economics, 1, pp. 323-338. Alm J., (1985), The Welfare Cost of the Underground Economy, Economic Inquiry,
32, pp.243-63. Anderberg D., Balestrino A. and Galmarini U., (2003), Search and taxation in a
model of underground economic activities, Economic Inquiry, 41, pp.647-659. Boeri T., Garibaldi P., (2001), Shadow activity and unemployment in a depressed
labour market, CEPR Discussion Papers, 3433. Bontempi M.E., Giannini S., Guerra M.C., Tiraferri A., (2001), Incentivi agli
investimenti e tassazione dei profitti: l'impatto delle recenti riforme fiscali sul cash low delle società di capitali, Politica Economica, 3, pp 249-284.
Busato F., Chiarini B., (2004), Market and Underground Activities in a two Sector Dynamic Equilibrium Model, Economic Theory, 23, pp.831-861.
Busato F., Chiarini B., and Rey G.M., (2005), Equilibrium Implications of Fiscal Policy with Tax Evasion, Aarhus University Department of Economics Working Paper, 2005-04, available on the web: ftp://ftp.econ.au.dk/afn/wp/05/wp05_04.pdf.
Carillo M.R., Pugno M., (2002), The underground economy and the underdevelopment trap, Università degli Studi di Trento Discussion Paper, 1.
Chiarini B, Marzano E., (2004), Dimensione e dinamica dell'economia sommersa. Un approfondimento del Currency Demand Approach, Politica Economica, 3, pp. 303-334.
Cowell F.A., (1990), Cheating the Government, The MIT Press, Cambridge, Massachusetts, London, England.
Dallago B., (1990), The Irregular Economy, Dartmouth Publishing Company, Gower House, Croft Road, England.
Di Nicola F., Santoro A., (2000), Determinanti dell'evasione dell'IRPEG, Relazioni SECIT, available on the web: http://www.secit.finanze.it/file.pdf/relazioni/r251000.pdf
Johnson S., Kaufmann D., Shleifer A. (1997), The Unofficial Economy in Transition, Brooking Papers on Economic Activity, 2, pp. 159-221.
KPMG (2004), Corporate tax rate survey, January 2004, available on the web:http://www.us.kpmg.com/microsite/global_tax/ctr_survey/.
Loayza N.V., (1994), Labor Regulations and the Informal Economy, World Bank

25
Policy Research Working Paper, 1335. Loayza N.V., (1996), The economics of the informal sector: a simple model and
some empirical evidence from Latin America, Carnegie- Rochester Conference Series on Public Policy, 45, pp. 129-162.
Marzano E., (2004), Dual labour markets theories and irregular jobs: is there a dualism even in the irregular sector?, Università degli Studi di Salerno, Celpe Discussion Papers n.81.
Portes A., Castells M., and Benton L., (1989), World Underneath: the Origins, Dynamics, and Effects of the Informal Economy, in The Informal Economy: Studies in Advanced and Less Developed Countries, ed. Portes A., Castells M., and Benton L., Johns Hopkins, Baltimore.
Summers L.H., (1981), Taxation and Corporate Investment: A q-Theory Approach, Brooking Papers on Economic Activity, 1, pp 67-140.
Schneider F., Enste D.H., (2002), The shadow economy. An international survey, Cambridge University Press, Cambridge.
Tanzi V., (1980), Underground economy and tax evasion in the US: estimates and implications, Banca Nazionale del Lavoro Quarterly Review, 32, pp. 427-453.
Thomas J., (1992), Informal economic activity, LSE Handbooks in Economics, London: Harvester Wheatsheaf.
Trandel G., and Snow A., (1999), Progressive income taxation and the underground economy, Economic Letters, 62, pp. 217-222.
Yitzhaki S., (1974), A note on `Income tax evasion: A theoretical analysis', Journal of Public Economics, 3, pp.201-202.

26
Appendix Lemma 1 There exists a negatively sloped and concave production PPF such that:
( )[ ] ./1 σaaaRU KYKY −=
Proof We consider the identity: ( ) 11 =−+ µµ Using the production functions, we get: ( ) ( ) ;1/ 1/11/1 =+ −−− σKYKAY a
Ua
R and, after some algebra: ( )[ ] ./ /1 σaaa
RU KAYKY −= The Marginal Rate of Transformation is: ( )[ ] ( ) .10/// 1/111/1 <∀<−−=∂∂ −−
µσ aRAa
aaaRRU AYKAYKaYY
The first derivative of the MRT is: ( )( ) ( )[ ] ( ) +−−=∂∂ −−− 1/12/11/122 ///1/ a
R
aaR
aRA
KRU AYAYKAYaYY aσ
( ) ( )[ ] .10//1/12/11
2 <∀<−−−−− aAYKAY
aaR
aRa
aA
K aσ Proposition 1 A firm opting for moonlighting has no convenience neither to become completely regular )1( =µ nor to turn into a ghost firm )0( =µ . Proof µ as well as ( )µ−1 are the basis of a negative power in Eq. 8, so that to have a finite solution they necessarily must lie in the open interval ( ).1,0 Proposition 2 In the long run, the dynamical system of Eqs. 17-18 admits a unique stady state. Proof System 19 can be written as follows:
( ) ( )[ ] ( )[ ][ ]( )⎪⎩
⎪⎨⎧
+−=+−−+−=
−
−+∗−∗+
10
1)1(110
1)1(1)1()1(
b
aaaar
KbKaKsKKaA
δαφσµρτµτφ σ
δ
First Step: To show that the first equation expresses 0φ as a monotone and decreasing function of the stock of capital K . ( ) ( ) ( )[ ] ( ) ( )[ ][ ]++−= −−∗′∗−∗ 11210 aaaa
dKKd KKKaKKa µµµϕφ
( )( ) ( )( ) ( )[ ] ( )[ ]′∗−+−∗−+∗ −−−−++ KKKaKKa aaaaµµµσχ σσ 1)1(12)1( 1111
( ) .0;0 )1()1()1( >=>= ++−
+−
δσρτ
δτ χϕ r
asr
aA The expression derived from equation 14 in the main text:

27
d
d
CKCKK+
∗ =1
)(µ ; ( )( )( ) 0;0 1
1
11
1 >=<= −
−−
−a
aAas
aa Cd τ
ρτσ is a strictly decreasing and monotone function of K: ( ) [ ] ( )
[ ] [ ] 02
1
2
11
11
1 <==++
−+ −−−∗
d
d
d
dddd
CKCdK
CK
CKCdKCKCdKdK
Kdµ 1<∀a
It implies that the first term of ( )dK
Kd 0φ is always negative, so that we need to demonstrate that the second one is negative too: ( )[ ] ( )[ ] ( )[ ] ( ) 01111 1)1(12)1( <−−−−+ ′∗−+−∗−+∗ KKKaKKa aaaa
µµµσ σσ
Using again the definition of )(K∗µ as well as ( )dK
Kd ∗µ we get:
( )[ ][ ] [ ] [ ] 011 2
1
1
1)1(11
12)1(1
1 <−−++
−+−
+−+
+
−
d
d
ddCK
CdKaaCK
aaCK
KaKa σσσ
( )[ ][ ] [ ] 011 11
2)1(2)1(1
1 <−−+ ++
−+−++ ad
d
dCKCdKaaa
CKaKKa σσσ
( )[ ][ ] [ ] 011 111
1 <−−+ +++ ad
d
dCKCdKa
CKaa σ
( )[ ] [ ] 0111
<−−++ d
d
CKCdKaa σ
( )[ ] .011 <−−+ µσ ada As µ is a majorant of this last expression, we consider the case 1=µ to get: ( ) ( ) aaaa /1/1 2 −<−<σ This condition can be considered a sufficient condition to get the requested monotony of the relation .0'0 =φ
Second Step The second equation expresses 0φ a monotone and increasing function of the stock
of capital K , in fact ( )( ) 01 20 >−= −bdKd Kbb δφ for each 1>b .
Given that the codomain of the first equation is ( )+∞;0 while the second equation has codomain ( )+∞− ;1 α , it follows that there exists a single value of K such that the two equations simultaneously applies. Proposition 3 The steady state of the dynamical system of Eqs. 17-18 is always a saddle path. Proof The Jacobian of the system of Eqs. 17 and 18 evaluated at the steady state is:
⎥⎦
⎤⎢⎣
⎡
−∂∂∂Π∂−+
δφδ
0
22
//
IKr

28
and it has a trace and a determinant given by: ( ) ( );//; 22
0 KIrDETrTR ∂Π∂∂∂++−== φδδ where ( )[ ] dKKasKaAdK aaaa /)1()1)(1()1(/ 1)1(122 −+∗−∗ +−−+−=∂Π∂ σσµρτµτ Local stability, and in particular saddle path stability, requires that the the trace should be positive, while the determinant should be negative, when evaluated at the steady state. Under our parametrization it implies that the condition 0/ 22 <∂Π∂ K , which is the necessary condition to get a concave objective function, is also a sufficient condition to get saddle path stability. Given the demonstration of the first step of proposition 2, it follows that 0/ 22 <∂Π∂ K . This result implies that the Determinant of Jacobian matrix of linearized system of Equations 17 and 18 is negative, and it underlies that the equilibrium is a saddle path.
29
Discussion Papers
2005, 95 Lucio Valerio SPAGNOLO, Mario CERRATO No euro please, We’re British!
2005, 94 Roberto BASILE, Mauro COSTANTINI, Sergio DESTEFANIS Unit root and cointegration tests for cross-sectionally correlated panels. Estimating regional production functions
2005, 93 Sergio DESTEFANIS, Raquel FONSECA Matching Efficiency and Labour Market Reform in Italy. A Macroeconometric Assessment
2005, 92 Cesare IMBRIANI, Antonio LOPES Banking System Efficiency and the Dualistic Development of the Italian Economy in the Nineties
2005, 91 Carlo ALTAVILLA, Antonio GAROFALO, Concett Paolo VINCI Designing the Optimal Lenght of Working Time
2005, 90 Marco MANACORDA, Barbara PETRONGOLO Regional Mismatch and Unemployment: Theory and Evidence from Italy, 1977-1998
2004, 89 Roberta TROISI Teoria dell’impresa e responsabilità parapenale:le implicazioni organizzativo-gestionali
2004, 88 Roberta TROISI Enti non profit: tipologie ed opzioni organizzative
2004, 87 Lavinia PARISI La povertà: una rassegna sul confronto tra due approcci. Capability vs. Unidimensionalità
2004, 86 Giuseppe CELI Quality Differentiation, Vertical Disintegration and The Labour Market Effects of Intra-Industry Trade
2004, 85 Niall O’HIGGINS Recent Trends in Youth Labour Markets and Youth Employment Policy in Europe and Central Asia
2004, 84 Carlo ALTAVILLA, Floro Ernesto CAROLEO Evaluating Asimmetries in Active Labour Policies: The Case of Italy
2004, 83 Floro Ernesto CAROLEO, Francesco PASTORE

30
La disoccupazione giovanile in Italia. La riforma dei sistemi d'istruzione e di formazione professionale come alternativa alla flessibilità numerica per accrescere l'occupabilità
2004, 82 Francesco PASTORE, Izabela MARCINKOWSKA The Gender Wage Gap among Young People in Italy
2004, 81 Elisabetta MARZANO Dual Labour Market Theories And Irregular Jobs: IsThere a Dualism Even in The Irregular Sector?
2004, 80 Corrado ANDINI Unemployment and Welfare Partecipation in a Structural VAR: Rethinking the 1990s in the United States
2004, 79 Floro Ernesto CAROLEO Fondamenti teorici della rigidità salariale nell'ambito dei "Non Market clearing Models"
2004, 78 Adalgiso AMENDOLA, Floro Ernesto CAROLEO, Gianluigi COPPOLA Regional Disparities in Europe
2003, 77 Fernanda MAZZOTTA Flessibilità, povertà e istruzione: un approccio Sen – istituzionale
2003, 76 Adalgiso AMENDOLA., Annamaria NESE Mobilità intergenerale nel livello d'istruzione nella società femminile italiana ed endogenità de titolo di studio in un modello di partecipazione alla Forza Lavoro.
2003, 74 Antonio LOPES Innovazione nel Sistema Creditizio del Mezzogiorno negli Anni Novanta
2003, 73 Sergio DESTEFANIS - Vania SENA Public Capital and Total Factor Productivity New Evidence from the Italian Regions
2003, 72 Giuseppina AUTIERO - Bruna BRUNO Social Preferences in Wage Bargaining: a Neocorporatist Approach
2003, 71 Gianluigi COPPOLA - Maria Rosaria GAROFALO - Fernanda MAZZOTTA Industrial Localisation and Economic Development. A Case Study
2002, 70 Francesco Giordano - Fernanda Mazzotta Salario di Riserva, Probabilità di Occupazione ed Efficacia dell’Istruzione Universitaria: un’Analisi sugli Studenti dell’Università di Salerno
2002, 69 Giuseppe Russo Istituzioni del Mercato del Lavoro e Occupazione: dai Costi di Aggiustamento all’Appropriabilità
2002, 68 Floro Ernesto Caroleo - Francesco Pastore Training Policy for Youth Unemployed in a Sample of European Countries

31
2002, 67 Maria Rosaria GAROFALO - Maria Rosaria SUPINO Il Disegno Normativo del Welfare Municipale in Italia come Strumento per lo Sviluppo Economico e l’Allargamento delle Opportunità Occupazionali. Una Lettura Neoistituzionale della L. 328/00
2002, 65 Pietro SENESI Cyclical dynamics under continuous time equilibrium
2001, 64 Marcello D'AMATO - Vincenzo GALASSO E' la Riforma Dini Politicamente Sostenibile?
2001, 63 Sergio DESTEFANIS - Ornella Wanda MAIETTA "Assessing the Productive Efficiency of Non-Profit Organisations: a Comparative Analysis"
2001, 62 Floro Ernesto CAROLEO - Francesco PASTORE How fine targeted is ALMP to the youth long term unemployed in Italy?
2001, 61 Paolo COCCORESE Strategic Advertising for Entry Deterrence Purposes
2001, 60 Alessandra AMENDOLA Modelling Asymmetries in Unemployment Rate
2001, 59 Sergio DESTEFANIS Differenziali Territoriali di Produttività ed Efficienza negli Anni '90: i Livelli e l'Andamento
2001, 58 Giuseppina AUTIERO - Fernanda MAZZOTTA Job Search Methods: the Choice between the Public and the Private Sector
2001, 57 Giuseppina AUTIERO - Bruna BRUNO - Fernanda MAZZOTTA A Correspondence Analysis of Labour Market Institutions
2000, 56 Giuseppina AUTIERO Governmental Organized Learning and Coordination Problems: The case of Japan in 1950s
2000, 55 Giuseppina AUTIERO - Fernanda MAZZOTTA The Choice of Search Methods: Some Empirical Evidence from Italy
2000, 54 Giuseppe CELI The Impact of International Trade on Labour Markets. The Case of Outward Processing Traffic between the European Union and Central Eastern European Countries.
2000, 53 Giuseppe RUSSO - David VEREDAS

32
Institutional Rigidities and Employment on the Italian Labour Market: the Dynamic of the Employment in the Large Industrial Firms.
2000, 52 Floro Ernesto CAROLEO Le Politiche per l'Occupazione in Europa: una Tassonomia Istituzionale
2000, 51 Andrew NEWELL - Francesco PASTORE Regional Unemployment and Industrial Restructuring in Poland
1999, 50 Giuseppe CELI - Alasdair SMITH Quality Differentiation and the Labour Market Effects of International Trade.
1999, 49 Giuseppe CELI Vertical and Horizontal Intra-Industry Trade: What is the Empirical Evidence for the UK?
1999, 48 Cesare IMBRIANI - Filippo REGANATI Productivity spillovers and regional differences: some evidence on the italian manufacturing sector.
1999, 47 Adalgiso AMENDOLA, Annamaria NESE L’impatto del background familiare sul livello d’istruzione dei figli.
1998, 46 Adalgiso AMENDOLA, Annamaria NESE Mobilità intergenerazionale nella società femminile italiana.
1998, 45 Floro Ernesto CAROLEO, Fernanda MAZZOTTA Youth Unemployment and youth employment policies in Italy.
1997, 44 Annamaria NESE Mobilità intergenerazionale in Italia
1997, 43 Adriana BARONE, Concetto Paolo VINCI Fairness: un concetto relativo nell’analisi del mercato del lavoro
1997, 42 Adriana BARONE, Concetto Paolo VINCI Wage differentials and factor intensity reversals
1997, 41 Rosa CAPOLUPO L’ipotesi di convergenza nel recente dibattito sulle teorie della crescitaI
1997, 40 Rosa CAPOLUPO Endogenous Vs exogenous models of growth: the convergenze debate
1997, 39 Fernanda MAZZOTTA, Annamaria NESE Transizioni "In and Out" il mercato del lavoro in Italia: un’analisi microeconometrica

33
1997, 38 Fernanda MAZZOTTA Disoccupazione e probabilità di occupazione in Italia: un’analisi su microdati
1997, 37 Maria Rosaria GAROFALO, Bruna BRUNO Equivalenza istituzionale" dei modelli di contrattazione sul salario: oltre il dibattito tra centralizzazione e decentramento
1997, 36 Adalgiso AMENDOLA, Floro Ernesto CAROLEO, Gianluigi COPPOLA Differenziali territoriali nel mercato del lavoro e sviluppo in Italia
1996, 35 Adalgiso AMENDOLA Istituzioni e mercato del lavoro. Deregolazione, occupazione e paradigma istituzionale
1996, 33 Annamaria NESE Modelli microeconometrci per l'analisi della domanda abitativa
1996, 32 Annamaria NESE Test semiparametrici per modelli parametrici
1996, 31 Giuseppe CELI Vertical intra-industry trade and skill intensity in Europe: a cross sector analysis
1996, 30 Sergio DESTEFANIS Nominal rigidities and real activity. A cross-industry analysis for Italy, 1951-93
1996, 29 Cesare IMBRIANI, Filippo REGANATI International technology transfer into the italian manufacturing sector
1996, 28 Stefania di SERAFINO, Alberto GANDOLFI The choice of the Government optimal procurement mechanism: the first-price sealed bid auction with one and/or two winners.
1996, 27 Raul de LUZENBERGER Redistribution, and public debt with liquidity constraints
1996, 26 Bruno CHIARINI Un modello VAR per la domanda di lavoro
1995, 25 Maria Rosaria CARILLO, Alberto ZAZZARO Innovazione tecnologica e distruzione di capitale umano in un modello neo-shumpeteriano di crescita.
1995, 24 Raul de LUZENBERGER Macroeconomia e politiche redistributive: il caso di vincoli di liquidità
1995, 23 Annamaria NESE
34
Tenure choice and demand for housing in Italy
1995, 22 Filippo REGANATI La struttura delle preferenze per prodotti orizzontalmente differenziati.
1995, 21 Sergio DESTEFANIS, Michele LA ROCCA, Cosimo VITALE Forecasting train ticket sales with linear model-based approaches and with edats
1995, 20 Stefania di SERAFINO Bounded rationality and incomplete contracts
1995, 19 Adalgiso AMENDOLA, Floro Ernesto CAROLEO, Maria Rosaria GAROFALO Istituzioni, mercato del lavoro e decentramento delle decisioni.
1995, 18 Niall O’HIGGINS Why did the youth training scheme reduce reduce the wages of young people? A story of human capital formation, reservation wages and job offers.
1994, 17 Antonio CARDONE Misure di efficienza: alcuni aspetti teorici
1994, 16 Maria Rosaria GAROFALO, Luisa ZANCHI Neo-corporativismo, centralizzazione e dispersione inter-settoriale dei salari.
1994, 15 Sergio DESTEFANIS Allowing for frequency of negotiation in the aggregate wage equation. A study for italian manufacturing, 1973/92.
1994, 14 Marcello D'AMATO Tariffs for a foreign industry with market power under incomplete information on demand
1994, 13 Raul DE LUZENBERGER, Cesare IMBRIANI, Giancarlo MARINI Sustainability Issues in the process of European Integration
1994, 12 Riccardo MARSELLI, Antonio CARDONE Interdipendenza tra regioni: un'analisi su dati di Panel
1993, 11 Adriana BARONE, Concetto Paolo VINCI Dilemma del prigioniero e persistenza della disoccupazione involontaria
1993, 10 Maria Rosaria CARILLO Mutamenti strutturali ed offerta di lavoro.
1993, 9 Niall O'HIGGINS The effectiveness of YTS in Britain: an analysis of sample selection in the determination of employment and earnings

35
1993, 8 Giuseppe CELI Politiche valutarie ed integrazione commerciale: l'esperienza dello SME negli anni '80
1992, 7 Paolo COCCORESE Attività innovativa e configurazione industriale
1992, 6 Maria Rosaria GAROFALO, Gian Luigi CORINTO La Razionalità dell'Allocazione del Tempo di Lavoro in Agricoltura. Con un'Applicazione Empirica ad un Sistema Locale attraverso la PL..
1992, 5 Adalgiso AMENDOLA, Maria SCATTAGLIA Disoccupazione e Tassi di Attività nel Mezzogiorno
1992, 4 Floro Ernesto CAROLEO La Disoccupazione Strutturale
1991, 3 Giovanni URGA Dynamic Models of Labour Demand in the Italian Industrial Sector: Theories and Evidence from Panel Data
1991, 2 Adalgiso AMENDOLA Teoria dei Contratti Impliciti. Rigidità del Salario e Disoccupazione
1991, 1 Guido CELLA Sulla Integrazione Produttiva Interregionale: il Caso del Mezzogiorno

36
CELPE- Centro di Economia del Lavoro e di Politica Economica Università degli Studi di Salerno Depositato ai sensi di Legge.