Embed Size (px)
Citation preview

Capital Structure in Saudi Arabian Listed and Unlisted Companies
Mohammed S Al-Dohaiman
Capital Structure in Saudi Arabian Listed and Unlisted Companies.
A thesis submitted for the degree of Doctor of Philosophy
By
Mohammed S Al-Dohaiman
Department of Accounting and Finance University of Stirling
Stirling Scotland
April 2008

Declaration This work has been conducted exclusively by my own research. Work in this thesis
has neither been accepted nor is being submitted for any other degree. Work and
analysis in this thesis has been conducted independently unless otherwise
acknowledged.
Candidate:………………………..
Supervisor:……………………….
Date :………………………..

i
Acknowledgement
My gratitude first goes to the Almighty Allah, with His word: Qun Fa Yaqun
(Qur’an 19: 35). I would like to express my sincere recognition to my
principal supervisor Professor Alan Goodacre without whose high quality and
friendly supervision, this work would not have come to completion. Sincere
regards are also due to Dr. Kevin Campbell, who provided efficient
supervision and academic advice during my study.
My sincere thanks go to my family for their support: my parents and my
mother in-law who supported me emotionally; my wife and my kids Saleh,
Norah, Sarah and Nowf for their love, encouragement and sacrifice, especially
whenever I need their strength to move forward. I am also deeply grateful to
my brothers, in particular Professor Ali and my sisters for their
encouragement especially on difficult days. I am also deeply grateful to
Engineer Abdullaziz Al-Namlah for his full support and courage before and
during my study. I would like to thank most sincerely former minister of
labour and social work Professor Ali Al-Namlah, governor of the technical
and vocational training corporation Dr. Ali Al-Ghafis and vice governor Dr.
Saleh Al-Amr for granting me the opportunity to make my study possible here
in the UK. Special thanks go to Mr. Fallaj Al-Mansour, the former general
manager of Companies General Department at the ministry of commerce and
the current general manager Mr. Waleed Al-Rwaished and Mr. Abdulrahman
Al-Hujab the joint companies and limited liability director for their help and
full cooperation during the data collection process in Saudi Arabia.

ii
Abstract
Although there have been many prior studies of the determinants of capital
structure, most have investigated listed companies in countries with well-
developed markets and institutions. The main objective of the present study is
to extend prior research by investigating both listed and unlisted companies in
Saudi Arabia where many cultural and institutional features may have an
impact on financing decisions in a different manner to ‘developed’ countries.
A further contribution is the application of a systematic statistical approach,
using meta-analysis, to summarise the many prior empirical studies.
The empirical part of the study investigates 60 listed and 403 unlisted firms
over the period 2000-2004 using several regression-based archival techniques
including panel data analysis. Robustness checks are carried out to investigate
the potential impact of the different methods and alternative measurement
proxies.
The results show that, in general, companies in Saudi Arabia have
substantially lower levels of debt than in many other countries. This finding is
related to the very low tax regime and other environmental characteristics.
Unlisted firms have more short-term debt but less long-term debt than listed
firms, as found in other countries.
Despite the profound institutional differences, several firm-specific factors
(such as firm size, asset tangibility, profitability, and liquidity) are found to
have similar impacts on capital structure decisions in Saudi Arabia as they
have in prior research. However, the impact of some factors is different, most

iii
likely reflecting lower levels of agency costs in the Saudi Arabian institutional
environment.

iv
Table of content Acknowledgement......................................................................................................i Abstract......................................................................................................................ii Chapter 1: Introduction....................................................................................4
1.1 Statement of the Problems ..................................................................6 1.2 Objective of the Research ...................................................................7 1.3 Research Method ................................................................................9 1.4 Expected Contributions and significances of the research ...............10 1.5 The Structure of the Thesis...............................................................10
Chapter 2: Literature review .........................................................................13 2.1 Introduction: .....................................................................................14 2.2 Theoretical literature review:............................................................14
2.2.1 Modigliani and Miller propositions: ..............................................14 2.2.2 Models based on trade-off theory ..................................................15
2.2.2.1 The impact of tax on capital structure ...........................................15 2.2.2.2 The impact of conflicts among the agent groups on capital
structure: ........................................................................................18 2.2.2.2.1 Conflicts of interest between managers and shareholders:.....19 2.2.2.2.2 Conflicts of interest between shareholders and debt-holders: 21
2.2.2.3 Dynamic trade-off theory: .............................................................22 2.2.3 Models based on asymmetric information:....................................23
2.2.3.1 Pecking order and modified pecking order hypothesis:.................24 2.2.3.2 Signalling with proportion of debt:................................................26
2.2.4 Models based on the market for corporate control: .......................27 2.2.5 Models based on industrial organization theory:...........................29
2.2.5.1 Capital structure and the firm's competitive strategy: ...................30 2.2.5.2 Capital structure and the characteristics of firm's products or
inputs: ............................................................................................30 2.3 Theoretical Prediction.......................................................................31
2.3.1 Size.................................................................................................32 2.3.2 Tangibility......................................................................................32 2.3.3 Profitability ....................................................................................33 2.3.4 Risk ................................................................................................34 2.3.5 Tax .................................................................................................34 2.3.6 Growth ...........................................................................................35 2.3.7 Uniqueness.....................................................................................36 2.3.8 Dividends .......................................................................................36 2.3.9 Free cash flow................................................................................37 2.3.10 Liquidity.........................................................................................37 2.3.11 Age.................................................................................................37 2.3.12 Government ...................................................................................38
2.4 Review of prior empirical studies:....................................................38 2.4.1 Prior empirical studies survey-based analysis: ..............................39 2.4.2 Empirical results concentrated on the testing of specific theories.41 2.4.3 Empirical results on general capital structure themes ...................44 2.4.4 Prior studies related to the context of Saudi Arabia ......................45 2.4.5 Prior empirical studies in the context of small and medium firms 47
2.5 Conclusion ........................................................................................50 Chapter 3: Meta-Analysis Techniques ..........................................................56
v
3.1 Introduction.......................................................................................57 3.2 Meta analysis technique....................................................................57
3.2.1 Combine significance test..............................................................58 3.2.2 Moderating effects .........................................................................62 3.2.3 Data collection procedure ..............................................................64
3.2.3.1 Determining the research issue and the scope of the literature......64 3.2.3.2 Searching process ..........................................................................65 3.2.3.3 Sample selection ............................................................................65
3.3 Results...............................................................................................69 3.3.1 Size.................................................................................................70 3.3.2 Tangibility......................................................................................73 3.3.3 Profitability ....................................................................................75 3.3.4 Risk ................................................................................................77 3.3.5 Tax .................................................................................................80
3.3.5.1 Effective tax rate............................................................................80 3.3.6 NDTS.............................................................................................81 3.3.7 Growth ...........................................................................................83 3.3.8 Uniqueness.....................................................................................86 3.3.9 Dividend.........................................................................................88 3.3.10 Free cash flow................................................................................90 3.3.11 Liquidity.........................................................................................92 3.3.12 Age.................................................................................................93 3.3.13 Government ...................................................................................94
3.4 Conclusion ........................................................................................96 Chapter 4: The Environment within Saudi Framework .............................97
4.1 Introduction.......................................................................................98 4.2 Central bank......................................................................................99 4.3 Banking system...............................................................................101 4.4 Capital Market ................................................................................110
4.4.1.1 Saudi Stock Market (SSM)..........................................................110 4.5 Bond market....................................................................................116 4.6 Legal system ...................................................................................118 4.7 Tax system ......................................................................................119 4.8 Ownership pattern...........................................................................120 4.9 The privatisation program...............................................................123 4.10 Conclusion ......................................................................................124
Chapter 5: Hypotheses Development ..........................................................126 5.1 Introduction.....................................................................................127 5.2 Hypotheses development ................................................................127
5.2.1 Size...............................................................................................127 5.2.2 Profitability ..................................................................................128 5.2.3 Tangibility....................................................................................129 5.2.4 Free cash flow..............................................................................131 5.2.5 Liquidity.......................................................................................131 5.2.6 Uniqueness...................................................................................132 5.2.7 Growth .........................................................................................133 5.2.8 Dividends .....................................................................................134 5.2.9 Age...............................................................................................135 5.2.10 Business risk ................................................................................136 5.2.11 Government ownership................................................................136

vi
5.2.12 Industry classification..................................................................137 5.3 Leverage definitions .......................................................................138 5.4 Explanatory Variables definitions ..................................................140
5.4.1 Size...............................................................................................140 5.4.2 Tangibility....................................................................................141 5.4.3 Profitability ..................................................................................141 5.4.4 Free cash flow..............................................................................142 5.4.5 Liquidity.......................................................................................142 5.4.6 Uniqueness...................................................................................143 5.4.7 Growth .........................................................................................143 5.4.8 Dividends .....................................................................................144 5.4.9 Age...............................................................................................144 5.4.10 Risk ..............................................................................................145 5.4.11 Government ownership:...............................................................145 5.4.12 Industry classifications: ...............................................................146
5.5 Conclusion ......................................................................................146 Chapter 6: : Research Methods ...................................................................149
6.1 Introduction.....................................................................................150 6.2 Sample ............................................................................................150
6.2.1 Sources of data.............................................................................152 6.2.1.1 Capital Market Authority.............................................................153 6.2.1.2 Companies General Department..................................................154
6.2.2 Accounting standards and data reliability....................................156 6.3 Data collection procedure ...............................................................158
6.3.1 Initial sample................................................................................158 6.3.2 Industry classification process .....................................................158 6.3.3 Collecting process........................................................................159 6.3.4 Difficulties faced during data collection process.........................160
6.4 Guidelines in sample selection .......................................................160 6.5 Variables calculation.......................................................................163 6.6 Data issues ......................................................................................165 6.7 Testing procedure ...........................................................................167
6.7.1 Data testing ..................................................................................167 6.7.2 Hypotheses test ............................................................................168
6.7.2.1 Pooled time-series and cross-sectional analysis ..........................169 6.7.2.2 Cross-sectional data analysis .......................................................170 6.7.2.3 Yearly cross-sectional estimation ................................................171 6.7.2.4 Panel data analysis .......................................................................172
6.7.3 Estimation technique....................................................................173 6.8 Conclusion ......................................................................................174
Chapter 7: RESULTS ...................................................................................175 7.1 Introduction.....................................................................................176 7.2 Debt Analysis..................................................................................176
7.2.1 International comparison .............................................................181 7.3 Determinants of capital structure analysis ......................................182
7.3.1 Descriptive statistics ....................................................................182 7.3.2 Data testing ..................................................................................186 7.3.3 Result analysis .............................................................................188 7.3.4 Pooled analysis ............................................................................189
7.3.4.1 Size...............................................................................................190

vii
7.3.4.2 Tangibility....................................................................................193 7.3.4.3 Free cash flow..............................................................................195 7.3.4.4 Liquidity.......................................................................................196 7.3.4.5 Uniqueness...................................................................................197 7.3.4.6 Growth .........................................................................................198 7.3.4.7 Dividends .....................................................................................200 7.3.4.8 Age...............................................................................................201 7.3.4.9 Risk ..............................................................................................202 7.3.4.10 Government .................................................................................203 7.3.4.11 Industry ........................................................................................204
7.3.5 Average cross-sectional analysis based on 2004 debt ratios .......205 7.3.6 Yearly cross-sectional analysis....................................................208 7.3.7 Fixed effects panel analysis .........................................................209
7.3.7.2 Profitability ..................................................................................212 7.3.7.3 Tangibility....................................................................................213 7.3.7.4 Free cash flow..............................................................................214 7.3.7.5 Liquidity.......................................................................................215 7.3.7.6 Uniqueness...................................................................................216 7.3.7.7 Growth .........................................................................................217 7.3.7.8 Dividends .....................................................................................218 7.3.7.9 Age...............................................................................................219
7.4 Alternative proxies analysis............................................................220 7.4.1.1 Size...............................................................................................221 7.4.1.2 Profitability ..................................................................................222 7.4.1.3 Tangibility....................................................................................223 7.4.1.4 Liquidity.......................................................................................223 7.4.1.5 Uniqueness...................................................................................224 7.4.1.6 Growth .........................................................................................224 7.4.1.7 Dividends .....................................................................................226 7.4.1.8 Age...............................................................................................226
7.5 Regression diagnostics....................................................................227 7.6 Chapter summary............................................................................229
Chapter 8: Conclusion ..................................................................................231 8.1 Introduction.....................................................................................232 8.2 Summary of the major results.........................................................233
8.2.1 Meta-analysis findings.................................................................233 8.2.2 Limitation of meta-analysis .........................................................234
8.3 Saudi firm’s capital structure determinants ....................................235 8.3.1 Limitation of the determinants analysis.......................................243
8.4 Suggestion for future research ........................................................243 References 246 Appendices 267

ii
Table of figures Figure 1.1: The Structure of the Thesis .................................................................12 Figure 2.1: The traditional static trade-off theory................................................16 Figure 7.1: Financial preferences .........................................................................179 Figure 7.2: Debt components comparison between Saudi listed and UK firms
........................................................................................................................181 Figure -1: The organizational chart of the Companies General Department ..275 Figure -2: Normal Probability Plot for Short-term debt (Listed) .....................291 Figure -3: Normal Probability Plot for Long-term debt (Listed)......................291 Figure -4: Normal Probability Plot for Total debt (Listed) ...............................291 Figure -5: Normal Probability Plot for Short-term debt (Unlisted)..................292 Figure -6: Normal Probability Plot for Long-term debt (Unlisted) ..................292 Figure -7: Normal Probability Plot for Total debt (Unlisted) ...........................292 List of tables Table 2.1: Studies found support to trade-off theory. ..........................................53 Table 2.2: Studies found support to Pecking order hypothesis. ..........................54 Table 3.1: Illustrate of meta-analysis applied to size variable using Weighted
Stouffer test ...........................................................................................61 Table 3.2: Summary of number of papers included in meta-analysis study and
reasons for paper exclusion..................................................................68 Table 3.3: Format of results presentation for each panel of the tables ..............70 Table 3.4: Meta-analysis results of Size attribute.................................................71 Table 3.5: Meta-analysis results of Tangibility attribute.....................................73 Table 3.6: Meta-analysis results of Profitability attribute...................................76 Table 3.7: Meta-analysis results of risk attribute. ................................................78 Table 3.8: Meta-analysis results of Effective tax rate. .........................................81 Table 3.9: Meta-analysis results of NDTS. ............................................................82 Table 3.10: Meta-analysis results of growth attribute. ........................................84 Table 3.11: Meta-analysis results of uniqueness attribute...................................87 Table 3.12: Meta-analysis results of dividends attribute. ....................................89 Table 3.13: Meta-analysis results of free cash flow attribute. .............................91 Table 3.14: Meta-analysis results of liquidity attribute. ......................................92 Table 3.15: Meta-analysis results of age attribute. ...............................................93 Table 3.16: Meta-analysis results of government attribute. ................................95 Table 4.1: Total Assets of Saudi Banks (in billion SAR)....................................102 Table 4.2: Equity stakes and total assets & equity of banks as end of 2006 ....103 Table 4.3: Bank claims on the private sector ......................................................108 Table 4.4: size of the Saudi stock market as end of 2004 ...................................114 Table 4.5: Stock market indicators ......................................................................115 Table 4.6: Equity stakes (percent share) .............................................................121 Table 5.1: Summary of the variables definition and hypothesised sign ...........148 Table 6.1: Differences and similarities of listed and unlisted companies. .......152 Table 6.2: Saudi Stock Market industry classification codes assigned.............159 Table 6.3: Sample selection process .....................................................................162 Table 6.4: Summary of the variables calculation ...............................................164 Table 6.5: summary number of dependent variable with zero value ...............173

iii
Table 7.1: Summary statistics of financial ratios for listed and unlisted firms.........................................................................................................................177
Table 7.2: Summary statistics of explanatory variables of listed and unlisted companies ............................................................................................184
Table 7.3: Summary of outliers ............................................................................186 Table 7.4: Pooled regression results of listed & unlisted sample based on Tobit
estimation technique ...........................................................................191 Table 7.5: Average cross-sectional analysis results of listed & unlisted sample
based on Tobit technique ...................................................................207 Table 7.6: fixed effects Panel data results ...........................................................211 Table 8.1: Results of the factors affecting capital structure. .............................234 Table 8.2: Comparison of pooled Tobit with averaged Tobit and fixed effects
estimation results ................................................................................242 Appendices Table-1: Summary of the studies included in the meta-analysis………… 265-69 Table-2: Top 100 Saudi Companies in 2003………………………………. 270-71 Table-3: The Initial list of Saudi listed companies as of at 31 January
2006…………………………………………………………………..... 273-74 Table-4: Pure cross-sectional regression (Short-term debt)……………… 275 Table-5: Pure cross-sectional regression (Long-term debt)………………. 276 Table-6: Pure cross-sectional regression (Total debt)………………….…. 277 Table-7: Alternative proxies (short-term debt) Listed sample…………… 278 Table-8: Alternative proxies (Long-term debt) Listed sample…………… 279 Table-9: Alternative proxies (Total debt) Listed sample……………….…. 280 Table-10: Alternative proxies (Short-term debt) Unlisted sample……….. 281 Table-11: Alternative proxies (Long-term debt) Unlisted sample………... 282 Table-12: Alternative proxies (Total debt) Unlisted sample……………… 283 Table-13: Estimation robustness (Listed and Unlisted samples)………… 284 Table-14: Pair-wise correlation for listed sample………………………… 285 Table-15: Pair-wise correlation for Unlisted sample……………………… 286 Table-16: DFIT regression results…………………………………………. 287

4
Chapter 1: Introduction

5
The determination of capital structure has been one of the most contentious
issues in the finance literature since Modigliani and Miller introduced their
capital structure irrelevance prepositions in their seminal article in 1958. Since
then, several theories have been developed suggesting a number of factors that
might determine a firm’s capital structure decision. However, out of these
theories of capital structure, two models appear to come across strongly. One
of them is the trade-off theory, which assumes that there are benefits and costs
associated with the use of debt. In the beginning, the theory was limited to the
trade off between the tax advantages of debt and bankruptcy costs. Then, it
was extended to include benefits and costs of debt associated with agency
conflicts. The other main theory is the pecking order hypothesis which
assumes that, under information asymmetry between insiders and outsider,
firms will resort to internally generated funds first to finance their growth, but
when external financing is needed, firms prefer to raise debt before equity.
Empirically, numerous studies have been conducted to investigate the
determinants of capital structure on the basis of these two theories. However,
neither trade-off theory nor the pecking order hypothesis has found to provide
robust and exclusive explanatory power. Nevertheless, Harris and Raviv
(1991) conclude that it is necessary that empirical research be directed to test
determinants of capital structure in various contexts. Motivated by their
conclusion, this dissertation investigates the determinants of capital structure
in the quite different context of Saudi Arabia.
This chapter is presented as follow: Section 1.1 introduces the statement of
problems. Section 1.2 presents the research objectives, with Section 1.3

6
outlining the research methods while Section 1.4 establishes the expected
contribution of the research. Finally, Section 1.5 demonstrates the structure of
the dissertation.
1.1 Statement of the Problems
The question of what determines firms’ choice of capital structure has been a
major field in the corporate finance literature. A number of factors have been
suggested to have an influence on a firm’s capital structure decision.
However, while there is a wide and growing body of empirical studies
investigating the influence of these factors on the firms’ capital structure, the
findings of these studies are not always consistent in terms of the direction
and strength of the relationship between leverage and its determinants. Given
the large number of studies, it is perhaps surprising that no one has yet
undertaken the important test of summarising the empirical evidence in a
systematic manner. This would enable a much clearer understanding of the
current state of knowledge.
Another issue is that the capital structure theories have very little to say about
inter-country differences in corporate financing patterns. No existing theory
explains how country-specific factors affect firm’s capital structure. Cross-
countries empirical studies (e.g. Rajan and Zingales, 1995; Booth et al., 2001;
Giannetti, 2003; Fan et al., 2004; Hall et al., 2004; De Jong et al., 2007) assert
that the influence of institutional characteristics is as important as the
influence of firm’s characteristics on corporate leverage level. However, our
knowledge of capital structure has mostly been derived from a large volume
of research conducted in developed countries with very little from developing

7
countries. Therefore, it is important to know how capital structure theories
work in different countries, especially those with different traditions and
institutional factors.
Moreover, a significant gap in the research has been in the determinants of
capital structure for unlisted companies, probably due to the lack of data for
those companies (Hall et al., 2004). It is quite likely that capital structures of
unlisted companies will differ from listed companies since the former cannot
gain stock market access. Accordingly, conducting analysis of both listed and
unlisted companies and comparing the results may be particularly fruitful.
Finally, another issue in prior research is the robustness of results under
different estimation techniques and different measures for both the dependent
and the explanatory variables. Limiting the analysis to certain estimation
techniques or to certain proxies for dependent or explanatory variables may
lead the researcher to be subject to the significant results bias. Therefore, it is
important to conduct a comprehensive analysis that considers these issues in
order to avoid such bias.
1.2 Objective of the Research
The dissertation has several objectives. The first is to provide a systematic and
comprehensive review of the empirical literature on the determinants of
capital structure. This will provide a sound basis from which to proceed to
address the other objectives.

8
The second objective of this dissertation is to test empirically the determinants
of capital structure in Saudi Arabia. In order to achieve this objective, the
following questions are formulated:
Do the tradition and institutional factors in Saudi Arabia have an influence on
firms’ capital choice decisions?
Do the determinants of capital structure identified in western settings have the
same influence in Saudi Arabia?
Furthermore, given that unlisted companies are constrained from stock market
access, the third objective is to answer the following questions:
Do unlisted firms’ capital choice decisions differ from the decisions of listed
firms?
Do the influences of firm-specific factors on capital structure identified for
listed firms differ in unlisted firms?
Some prior research (e.g. Titman and Wassel, 1988; Bevan and Danbolt,
2002, 2004) identifies that differences in the measurement of both dependent
and independent variables, as well as differences in estimation techniques can
significantly affect the influences of a firm’s capital structure determinants.
Accordingly, the final objective of this dissertation is to provide a
comprehensive analysis that investigates the robustness of the results under
different estimation techniques and for different proxies. In the analyses,
therefore, the findings will be compared to determine whether these issues are
significantly affecting the results.

9
1.3 Research Method
A research method is a set of means used to collect and /or analyse data to
fulfil the research objectives. There are various analysis methods, for
example, analyses based on secondary data, interview, questionnaire, survey,
and case study. The exploratory nature of this research suggests that the most
appropriate approach is to undertake analysis based on secondary data.
However, though the analysis is based in secondary data, there are two
analysis phases.
Informed by the first aim, phase one involves synthesis using the meta-
analysis technique. In accordance with literature in this area, the first step is to
determine the scope of the literature, which is the topic of capital structure
determinants in this dissertation. The next step is searching for prior studies.
Then, identify the appropriate studies and extract the statistical data needed.
The final step conducts the analysis and reports the finding.
Phase two, on the other hand, involves regression analysis techniques.
Informed by the general literature and the other aims of this dissertation, this
requires first extracting the data from the financial statements of listed and
unlisted companies. However, due to no readily available computerised
database in Saudi Arabia such as DataStream or Compustat, a field trip is
required to collect the needed data1, followed by manual data extraction. The
final step involves regression analysis employing different techniques and
different measures for both the dependent and explanatory variables.
1 Datastream has data for just one Saudi Arabian company (SABIC).

10
1.4 Expected Contributions and significances of the research
Bearing in mind the above issues, the contribution of this study to the
literature is therefore fourfold. First, to my knowledge, this is the first
empirical work that statistically synthesises the finding of previous studies
using meta-analysis to summarise and clarify the findings of prior studies.
This analysis provides an insightful and useful framework for studying the
variation in the findings of prior studies of capital structure determinants.
Second, the study adds fresh empirical evidence to the determinants of capital
structure in developing countries where there are relatively few studies. Third,
in addition to listed companies, the study contributes to the literature by
investigating also the capital structure determinants of unlisted companies,
unlike most studies in this area, which exclusively focus on the listed
companies. The study derives its importance also from its comprehensive
analysis nature. Therefore, it is hoped to contribute to the literature where
there are few studies investigating the sensitivity of the results under different
estimation technique and different proxies.
In addition to the contribution to the literature, the researcher anticipates the
findings of this research will develop recommendations that may be useful in
particular to the regulator body in Saudi Arabia as well as to academics and
other researchers in general.
1.5 The Structure of the Thesis
The structure of the thesis is shown in Figure 1.1; the thesis is organized into
eight Chapters. Following this introductory Chapter, Chapter 2 provides a
literature review of capital structure. Chapter 3 presents the meta-analysis of

11
prior empirical studies. Chapter 4 explains the Saudi Arabia environment,
with particular reference to the financing environment. Chapter 5 deals with
the research hypotheses development, Chapter 6 deals with research methods
and Chapter 7 presents the findings of the determinants of capital structure in
the context of Saudi Arabia. Finally, Chapter 8 is the conclusion and presents
the main findings arising from the empirical works, the limitations of the
study and suggestions for future research.

12
Figure 1.1: The Structure of the Thesis
Chapter (2) The Literature Review
Chapter (3)
Meta-analysis (Prior empirical studies)
Chapter (4) The Environment within
Saudi Framework
Chapter (5) Hypotheses development
Chapter (1) Introduction
Introduction & Outline of the Thesis
Chapter (8) Conclusion
Chapter (7) Results
Chapter (6) Research Methods

13
Chapter 2: Literature review

14
2.1 Introduction:
Over the past four decades, much of the corporate finance literature has
rotated around different theories that try to fully explain factors behind
financing policy and capital structure. These theories cover various aspects of
the firm that can explain how firms choose their capital structure.
The current chapter presents a comprehensive theoretical and empirical
literature review over the capital structure theme. Section 2.2 covers
theoretical literature review. Section 2.3 covers theoretical prediction of
variables that have been found by a large number of studies. Section 2.4
reviews prior empirical studies. Finally, section 0 provides chapter
conclusion. Detailed analysis of the large number of empirical studies of the
determinants of capital structure is deferred to chapter 3.
2.2 Theoretical literature review:
2.2.1 Modigliani and Miller propositions:
When reviewing the theoretical literature related to capital structure, one must
start with the paper of Modigliani and Miller (1958). The authors assume a
perfect capital market to derive their very well known propositions2.
The Proposition I states that the firm’s average cost of capital and hence the
value of the firm (V) are independent of its capital structure. Therefore, there
is no optimal capital structure that maximises the value of the firm (i.e. any
2 Perfect market assumptions include: 1. Firms with the same degree of business risk are in homogenous risk class, 2. Investors have homogenous expectations about future corporate earnings and their levels of riskiness, 3. Securities are traded in perfect capital markets, 4. Interest rate on debt is the risk-free rate and 5. All cash flows are perpetuities.

15
level of leverage is as good as any other). Accordingly, in a perfect world, the
value of the levered firm is equal to the value of un-levered firm. Proposition
II states that the rate of return required by shareholders increases as more debt
is used. In another word, any benefits from using debt would be offset by the
corresponding higher cost of equity.
However, in reality, a perfect world clearly does not exist. Issues such as
taxes, financial distress, asymmetric information, and conflicts between
economic agents associated with the firm have an effect on the firm’s capital
structure. Subsequent theoretical works, thus, focus on these factors
associated with market imperfections and their effects on the capital structure.
2.2.2 Models based on trade-off theory
Trade off-theory assumes that there are benefits and costs associated with the
use of debt as against equity and firms thus chose an optimal capital structure
that trades off the marginal benefits and costs of debt. In the beginning, the
theory was limited to the trade off between the tax advantages of debt against
the bankruptcy costs. Then it was extended to include benefits and costs
associated with the use of debt in mitigating the conflicts among the agent
groups associated firm (i.e. managers, equity-holders and debt-holders).
2.2.2.1 The impact of tax on capital structure
In the first form of the static trade-off theory of capital structure, the trade-off
between the tax advantage of debt and the costs of financial distress is
expected to yield the optimal level of debt that maximizes the value of the
firm (Myers, 1984).

16
Figure 2.1 shows a graphical representation of this theory. Here, the value of
the firm rises as the firm uses more debt up to an optimum, where the benefits
of additional debt through the increase in the present value of tax shield are
offset by the costs due to the increased in the present value of costs of
financial distress.
Figure 2.1: The traditional static trade-off theory
Source: Myers (1984)
The first paper take into account the corporate tax was the Modigliani and
Miller (1963) tax correction article. The authors recognised that their perfect
capital markets assumptions need modifying to allow for corporate tax in their
propositions. They argue that debt typically offers a tax shelter, because
interest is deducted before taxable profit is calculated. Thus, in the presence of
corporate taxes, the value of the firm increases by an amount equal to the debt

17
tax shield. Modigliani and Miller (1963) demonstrate this argument
mathematically in following equation.
VL = VU + TC* D Where
VL = the value of levered firm,
VU = the value of un-levered firm,
TC = the corporate tax and
D = the value of used debt.
The main implication of Modigliani and Miller (1963) paper is that debt
financing is highly advantageous and, in the extreme, a firm's optimal capital
structure is 100 percent debt.
However, debt-holders and shareholders are also subject to tax on their
security income, and this affects their after-tax returns. Miller (1977) suggests
that, when the personal income tax on corporate share and interest is taken
into account together with corporate income tax, the gain from corporate
leverage (GL) can be expressed in following equation.
GL = {1 – [(1 - TC) * (1 – TPS)] / (1 – TPB)} * BL Where
TC = the corporate tax,
TPS = personal tax rate on income from corporate shares,
TPB = personal tax rate on income from bonds and
BL = the market value of the firm’s debt.

18
Miller (1977) shows that the tax gains from issuing debt at the corporate level
will be exhausted at the personal tax level and, thus, the value of the firm, at
equilibrium, is irrelevant to its capital structure. If markets are perfect (i.e. no
taxes) then the gain from debt is equal to zero and as Modigliani and Miller
(1958), indicating capital structure is irrelevant. In the special case where the
two personal tax rates are equal, the gain from leverage reduced to TC* BL
gives exactly the expression in the Modigliani and Miller (1963) tax model.
However, when the tax rate on income from corporate shares (TPS) less than
the tax rate on income from bonds (TPB), the gain from leverage will be less
than (TC* BL). Moreover, when the rate satisfy that (1 - TC) * (1 – TPS) = (1
– TPB), the gain from leverage vanishes entirely.
DeAngelo and Masulis (1980) further argue that firms usually have pre-
existing non-debt tax shields such as depreciation and investment tax credits
will face an increasing probability of financial distress as debt increases. Thus,
firms with large non-debt tax-shields will have less debt in their capital
structure, because the non-debt tax-shields are substitutes for the tax benefits
of debt financing.
However, the trade-off theory was extended to include benefits and costs
associated with the use of debt in mitigating the conflicts among the agent
groups associated with the firm (i.e. managers and equity-holders and debt-
holders).
2.2.2.2 The impact of conflicts among the agent groups on capital structure:
The seminal work on agency theory and capital structure is Jensen and
Meckling (1976). They identified two types of conflicts that are a major

19
source of agency costs and these are: agency costs that arise due to the
conflicts of interest between managers and shareholders and agency costs that
arise as a result of the conflicts of interest between shareholders and debt-
holders.
2.2.2.2.1 Conflicts of interest between managers and shareholders:
According to Jensen and Meckling (1976), conflicts arise between managers
and shareholders when managers hold less than 100% of the residual claim.
Consequently, managers capture only a fraction of the gain from their profit
enhancement activities, while they bear the entire cost when they refrain from
investing in such activities. Hence, managers are expected to pursue excessive
perquisite consumption and not invest in activities that would maximise the
value of the firm.
To mitigate this kind of conflict, different analysing approaches have been
proposed. Jensen and Meckling (1976) argue that the larger is the fraction of
equity held by managers, the more they concentrate their energies on
enhancing firm value. They also argue that if the absolute investment by
managers is held constant, the use of debt provides a vehicle for increasing
managers’ share-holdings and, thus, mitigate the conflicts of interest between
managers and shareholders. Jensen (1986) further argues that managers will
attempt to avoid shareholder control by using internal funds (i.e. free cash
flow) to expand the firm size beyond the optimal size and to accept projects
with a negative net present value (i.e. over-investment). Shareholders can
prevent management from undertaking such action by reducing the free cash
flow through increasing the firm’s debt. The presence of debt causes the

20
manager to pay out the cash flow as an interest and repayments. Moreover,
debt-holders will have the firm declared bankrupt if the firm cannot meet its
obligations to them. Grossman and Hart (1982) argue that if bankruptcy is
costly for the managers because they lose benefits of control and reputation,
then an increase in leverage can commit managers to generate the necessary
cash flows to meet debt repayments and consequently reducing the possibility
of management engaging in excessive perquisites.
Another form of conflict between managers and shareholders is that managers
and shareholders may also disagree over a firm’s operating decisions. Harris
and Raviv (1990) and Stulz (1990) formalise this conflict and the role of debt
to mitigate this disagreement. In Harris and Raviv (1990), because of
managers’ personal loss of control and reputation, they will in general wish to
continue operating the firm even when shareholders desire liquidation. They
argue that debt mitigates this conflict through the debt-holders’ option to
liquidate the firm in the event of default, which would also benefit
shareholders if liquidation was the best strategy. Therefore, high leverage is
likely to be associated with higher firm’s liquidation value, and lower
probability of reorganisation following the default. In Stulz (1990), on the
other hand, managers may prefer to invest all available funds even if
shareholders want to be paid dividends. He argues that increasing debt level
can mitigate this divergence since debt payment reduces the amount of free
cash available to managers. Therefore, as in Jensen (1986), firms with high
free cash flow and with low growth opportunities are expected to have high
debt levels.

21
2.2.2.2.2 Conflicts of interest between shareholders and debt-holders:
Different fundamental sources of equity-holders and debt-holders conflicts
have been identified in the agency cost literature. Jensen and Meckling (1976)
identify the asset substitution problem that arises in the case when
shareholders may seize wealth from debt-holders by switching from safer to
riskier and value-decreasing investments (i.e. asset substitutions). Myers
(1977) points to the under-investment problem that arises in the case where a
firm in financial difficulties has an incentive to sacrifice low positive net
present value projects whose benefits accrue mainly to debt-holders. He
further argues that the greater the investment opportunity in a firm, the greater
is the potential conflict of interest between shareholders and debt-holders.
To mitigate such conflicts, Smith and Warner (1979) suggest using restrictive
covenants on debt such as include interest coverage requirements or
prohibitions against investing in new unrelated lines of business. However,
restrictive covenants themselves also involve costs in which they reduce
management flexibility by restricting the firm’s investment and financing
opportunities. Smith and Warner (1979) also suggest that secured debt may
provide the issuer with a means to mitigate agency costs of debt.
Alternatively, firms may use convertibility option, where debt-holders have
the option to convert to shareholders, to mitigate the agency costs of debt.
Jensen and Meckling (1976) argue that conversion rights enable debt-holders
to recapture any positive wealth transfers to shareholders and to gain from any
increase in risk. Maturity of debt is another option that firms can use to
mitigate agency costs. The use of short-term debt may mitigate the agency
problems. Myers (1977) observes that if debt matures before growth options

22
are exercised, the firm’s incentive to deviate from a firm-value-maximizing
exercise policy is eliminated. Billett et al (2007) argue further that short-term
debt can mitigate both under- and over-investment incentives by making the
debt less sensitive to changes in firm value and by allowing for more frequent
re-pricing of debt.
In an alternative approach, Diamond (1989) argues that managerial reputation
plays an important role in mitigating the conflicts between shareholder and
debt-holder, mainly asset substitution problem. He suggests that the longer the
period of non-default, the better is a firm's reputation as a safe firm, and the
lower will be its borrowing costs. This suggests that older firms will choose
the safe project to maintain reputation. Younger firms with a lesser reputation
may choose risky projects with higher prospective returns, but, if they survive,
they will eventually choose the safe project.
In sum, the extended static trade-off theory suggests that benefits of issuing
debt can be traded against their costs to determine the optimal level of debt
that will maximise the value of the firm.
2.2.2.3 Dynamic trade-off theory:
One of the main criticism directed to the static form of trade-off theory is that
the firm is always at an optimal point, where the observed debt level is
assumed to be equal to the optimal one. In reality, the decisions are often
dynamic and adjustments to firm-specific optimal debt levels are costly and,
thus, firms usually restructure their capital structure over time. Myers (1984)
emphasises this point and argues that there must be costs and time lags
involved in adjusting to the optimal capital structure when events cause a firm

23
to deviate from the optimal level. He further concludes that if adjustment costs
are large then we ought to give less attention to refining our static trade-off
stories and put relatively more emphasis on understanding what adjustment
costs are, why they are so important and how rational managers would
respond to them. Fischer et al. (1989) argue that fixed costs of adjustment
imply that firms allow debt level to fluctuate until it becomes too extreme, and
then they restructure it.
In sum, the dynamic form of trade-off theory assumes that the actual capital
structure of a particular firm at a particular moment in time does not
necessarily equal the target capital structure of that firm but firm dynamically
adjusts its capital structure to a moving target. Therefore, the dynamic form in
which both taxes and agency concerns are present provides more
comprehensive picture than the static form about the mechanism of the capital
structure decision over time.
2.2.3 Models based on asymmetric information:
Asymmetric information is another dimension of the capital structure theories.
It is generally thought there is asymmetric information between firm
managers (or insiders) and outside investors. There are two main approaches
that have been developed in the literature of asymmetric information. In the
first approach, Myers and Majluf (1984) and Myers (1984) argue that the
capital structure is designed to mitigate inefficiencies in the firm’s investment
decisions that are caused by information asymmetry. In the second approach,
Ross (1977) and Leland and Pyle (1977) assert that firm’s capital structure

24
choice is used as a means to signal to outside investors the information held
by insiders.
2.2.3.1 Pecking order and modified pecking order hypothesis:
Myers (1984), Myers and Majluf (1984) works are the seminal contribution to
this literature. They provided a theoretical justification for Donaldson’s
(1961) findings that firms prefer to use internally generated funds as a
financing source and resort to externals funds only if the need for funds was
unavoidable. In their prospective, the nature of the asymmetric information is
that managers or insiders are assumed to possess more information about their
firms’ prospects, risks and values than outside investors.
Myers and Majluf (1984) argue that the capital structure can help to mitigate
inefficiencies in a firm’s investment decision that are caused by information
asymmetries. They demonstrate that if there is an asymmetry of information
between investors and firm insiders, then the firm’s equity may be under-
priced by the market. As a result, new equity, which is used to finance new
investment projects, will be also under-priced. Therefore, if management has
favourable inside information and acts in the best interest of the existing
shareholders, then management will refuse to issue equity even if it means
passing up positive NPV projects because the net loss to existing shareholders
(due to under-pricing problem) might outweigh the project’s NPV. On the
other hand, passing up NPV projects is contrary to the wealth maximization.
Using financial sources that may not be undervalued by the market,
particularly internally generated funds could solve this under-investment
problem.

25
Accordingly, the existence of sufficient internal finance allows firms to accept
desirable investments without relying on costly external finance. Myers and
Majluf (1984), argue that firms are most likely to generate financial slack (i.e.
liquid assets such as cash and marketable securities) to be used for internal
funding. Thus, in order to protect present shareholders, firms with financial
slack and in the presence of asymmetric information, will not issue equity,
even though it may involve passing up a good investment opportunity. If
investors realize this point, then the market will take the decision not to issue
shares as good news. On the other hand, if management does offer a new
share issue, it will be interpreted as a bad news, and the firm’s share issue will
be under-priced.
This adverse selection problem has an influence on the choice between
internal and external financing. This choice lead to the Pecking Order
Hypothesis, which Myers (1984) summarised as following:
Firms prefer internal finance.
Firms adjust their target dividend payout ratios to their investment
opportunities, although dividends are sticky and target payout ratios are
gradually adjusted to shifts in available investment opportunities.
Sticky dividend policies as well as unpredictable fluctuations in both
profitability and investment opportunities mean that internally generated
funds are more or less than investment outlays. If internally generated cash
flow is less than investment outlays, the firm first exhausts its cash balances
or marketable securities portfolio.

26
If external financing is required, firms will resort to the safest security first.
They start with debt, then hybrid securities such as convertible bonds and
finally equity as a last resort.
A single optimal or target debt-equity ratio does not exist in the pecking order
theory since financing decision does not rely on the trade off between
marginal benefits and costs of debt. Moreover, there are two types of equity,
internal and external; one is at the top of the pecking order and one at the
bottom. A firm’s leverage ratio thus changes when there is an imbalance
between internal funds and real investment opportunities.
Moreover, Myers (1984) introduced implication similar to the pecking order
theory known as the modified pecking order theory. In this framework, both
asymmetric information and costs of financial distress are incorporated.
Myers argues that as firm climbs up the pecking order it faces higher
probability of both incurring costs of financial distress and passing up future
positive-NPV projects. Thus, firm may rationally decide to reduce these costs
by issuing stock now though new equity is not needed immediately to finance
real investment, just to obtain financial slack and move the firm down the
pecking order.
2.2.3.2 Signalling with proportion of debt:
In this approach, it is assumed that the investment opportunity is fixed and the
choice of capital structure signals to outside investors the private information
of insiders. The seminal contribution in this area of literature is due to Ross
(1977). In his model, Ross assumes two types of firms (high quality with high
leverage and low quality with low leverage) that have different prospects and

27
that these are known by managers but not by investors. Moreover, managers
benefit if the company’s securities are more highly valued by the market but
are penalized if the firm goes bankrupt. Under such circumstances, the level
of debt the company managers choose serves as a signal about the quality of
the company, a signal sent from the managers as possessors of private insider
information towards outside investors. Since lower quality firms have higher
marginal expected bankruptcy costs for any debt level, managers of low
quality firms do not imitate higher quality firms by issuing more debt.
Therefore, higher leverage is a “good signal” in this model.
The Ross’s model has two main empirical implications. First, the probability
of bankruptcy rises as the amount of debt issued by the firm increases.
Second, the value of the firm is positively related to its leverage ratio. Thus,
the firm value, leverage, and bankruptcy are all positively related.
Leland and Pyle (1977) develop a model of capital structure and financial
equilibrium where an entrepreneur who wants to undertake an investment
project and plans to hold a certain fraction of the firm’s equity and the
remaining is raised from outside lenders. Since entrepreneur is known to be a
risk-averse, he will choose a high fraction in a risky project only if he
confident about its success. Thus, in the signalling equilibrium, the market
inferred the amount of equity retained by the entrepreneur as a signal of the
firm quality.
2.2.4 Models based on the market for corporate control:
This literature explains the firm’s choice of capital structure by utilizing the
fact that common stockholder carries voting rights while debt-holder does not.

28
Here, the capital structure has indirect influence on the result of the takeover
contests through its effect on the distribution of votes particularly the portion
that held by the manager. Several models have been proposed in the literature
regarding this concept.
Harris and Raviv (1988) develop a model where the incumbent manager
changes his ownership in the firm’s equity by altering firm’s capital structure
to direct the outcome of takeover contests. The manager chooses his optimal
ownership by trading off capital gains on his stake against the loss of any
personal benefits derived from being in control. Since manager can increase
his stake by issuing debt to repurchase equity from the passive investors, he
well chooses the debt level that determines his optimal stake and, thus,
maximizes his payoff. The main predictions of Harris and Raviv (1988) model
are: first, that takeover targets will raise their debt on average. Second, debt
issues on average are accompanied by stock price increase.
Stulz (1988) shows that the shareholders could have influence on the outcome
of a takeover attempt by changing stake of incumbent manager. He argues that
increasing the fraction of manager’s ownership (which is financed by issuing
debt) reduces the probability of a successful tender offer but increases the
takeover premium paid by rival and the value of investors’ equities if a tender
offer is made. Therefore, the optimal debt level is that maximizes the value of
investor’s equity.
The main predictions of Stulz’s model are: first, that takeover targets will
have more debt than firms that are not targets; second, that changing of debt
for equity are accompanied by stock price increase; and third, that there is a

29
negative relationship between the probability of a successful tender offer and
target’s leverage ratio; finally, that there is a positive relationship between the
takeover premium and target’s leverage ratio.
Israel (1992) uses another model where capital structure has an effect on the
distribution of cash flow between shareholders and nonvoting debt-holders
such as debt and preferred stocks. Here, the optimal debt level involves
trading off the increase in the gain to target’s shareholders against the
decrease in the probability of the acquisition. The main implications of
Israel’s model are: first, there is a negative relationship between the
probability of firms becoming takeover targets and their leverage ratio;
second, there is a positive relationship between the gain to target’s
shareholders and leverage ratio; third, target’s debt value, target’s stock price
and acquirers’ firm value increase when acquisitions are initiated.
2.2.5 Models based on industrial organization theory:
This section of literature presents the models that establish the link between
capital structure and industrial organization theory. The connections between
the firm's capital structure and industrial organization theory could be
explained through two approaches: First, models that concern the relationship
between firm's capital structure and its competitive strategy. Second, models
that consider the relationship between firm's capital structure and the
characteristics of its products or inputs.

30
2.2.5.1 Capital structure and the firm's competitive strategy:
This approach of literature starts from industrial organization and firm's
strategic management in order to determine capital structure. In particular, it
considers the relationship between the firm's capital structure and its strategy
when competing in the product market.
Brander and Lewis (1986) develop a model where two firms are engaged in a
competition and face uncertainty demand. They argue that financial decisions
affect output market strategies because of the limited liability of equity
holders (i.e. levered equity holders receive payoffs only in good states).
Therefore, debt financing creates an incentive for the firm to adopt an
aggressive output policy.
Maksimovic (1988) studies the interaction between the financing choice and
product market decisions by modelling profits in terms of demand and cost
functions and number of firms. He shows that debt capacity rises with
elasticity of demand and declines with the discount rate.
2.2.5.2 Capital structure and the characteristics of firm's products or inputs:
This approach concerns identifying product (input) or product market (input
market) characteristics that interact in a significant way with the debt level.
The basic idea here is that debt influences interaction with firm's non-financial
stakeholders (i.e. customers, workers and suppliers). According to Titman
(1984), customers might incur costs such as inability to obtain the product,
parts, and/or related services following a firm’s liquidation. These costs are
transferred to the shareholders in the form of lower prices for the firm's
product. Titman (1984) shows that the cost imposed on customers when a

31
producer goes out business (bankrupt) is higher for unique and/or durable
companies, than for non-durable products or those made by more producers.
This in turn leads to the result that firms that produce unique products use less
debt to avoid the possibility of bankruptcy.
Leverage may also have an effect on the shareholders’ bargaining position in
relation to their input suppliers. Sarig (1998) argues that employees of highly
leveraged firms can negotiate better contract terms than can employees of less
leveraged firms since highly leveraged firms are more susceptible to
employees' threats to seek alternative employment than less leveraged firms.
Consequently, firms that require skilled employees might be expected to have
lower debt to protect themselves against employees’ negotiating threat.
Moreover, this effect of leverage is not limited to negotiations with employees
but also may affects negotiations with any supplier of specialized production
factors.
2.3 Theoretical Prediction
Harris and Raviv (1991) argue that theories of capital structure have identified
a large number of potential factors that might have an impact on debt levels.
Among these factors which have been found by a large number of studies to
influence the firm’s capital structure are size, tangibility, profitability, risk,
tax, growth, uniqueness, dividends, free cash flow, liquidity, age and
percentage of outstanding shares held by the government. However, there is
significant disagreement among the capital structure theories, in particular,
between the trade-off and the pecking order theories about the influence of
some factors on the firm’s capital structure. In this section, therefore the

32
discussion involves the viewpoints of the capital structure theories about the
effect of these attributes on leverage ratios.
2.3.1 Size
It seems there is an agreement between theories about the positive effect of
size on firm’s capital structure though their explanation differs. From the
point view of the trade-off theory, firms trade-off between the benefits of
leverage such as tax savings or mitigation of agency problems against the
costs of leverage such as the costs of bankruptcy. Rajan and Zingales (1995),
however, argue that large firms tend to be more diversified and so suffer
bankruptcy less often. Accordingly, an observed positive dependence is
expected between leverage and firm size. Alternatively, because of
information asymmetries, smaller firms are likely to face higher costs for
obtaining external funds. Moreover, Bevan and Danbolt (2002) argue that due
to credit rating, large companies are more likely to have access to non-bank
debt financing. In turn, this too would suggest a positive relationship between
size and debt.
2.3.2 Tangibility
Titman and Wessels (1988) and Harris and Raviv (1991) argue that tangibility
might be the major factor in determining the firm’s debt levels. Theoretically,
Jensen and Meckling (1976) argue that issuing debt increases the shareholders
motivation to invest sub-optimally in high-risk projects, taking advantage of
the possibility of increasing their benefits at the expense of increasing the risk,
which is passed on to the debt-holders, who are the ones that would suffer the
possible losses. However, if debt is secured against assets, the borrower is

33
restricted to using loaned funds for a specific project, and creditors have an
improved guarantee of repayment. Thus, firms with high level of fixed assets
would have higher level of debt. Bevan and Danbolt (2002), however, argue
that if the tangibility provides a reasonable proxy for the availability of
depreciation tax shields, the tax-based hypothesis of DeAngelo and Masulis
(1980) would expect a negative rather than a positive association between
leverage and tangibility.
2.3.3 Profitability
There are no consistent theoretical predictions on the influence of profitability
on firm’s capital structure. From the point view of the trade-off theory, the
more is the firm profitable, the higher the leverage should be due to debt tax
deductibility of interest payment. Rajan and Zingales (1995), further, argue
that debt suppliers should be more willing to lend to profitable firms.
Accordingly, a positive dependence is expected to be observed between
leverage and profitability. On the other hand, the main argument supporting a
negative relationship between leverage and profitability comes from the
pecking order theory. Myers (1984) and Myers and Majluf (1984) argue that,
as a result of information asymmetry between corporate insiders and the
market, investors may under price firm’s equity. If firms finance new projects
by issuing equity, the net effect is that new investors obtain a higher gain from
this investment than pre-existing shareholders, which may cause the project
not to be accepted on these grounds even when it has a positive NPV (under
investment problem). To avoid such problems, internal funds and even debt
that is not too risky will be preferred to equity. Accordingly, firms will prefer

34
to finance from retained earnings first, then from debt and finally from issuing
new equity. This, in turn, suggests a negative relationship between
profitability and debt ratios.
2.3.4 Risk
The theoretical literature argues that firms with high variability in earnings
have a greater risk not to meet their debt obligations, so increasing the
probability of default. Thus, lenders will be less willing to lend or will charge
a higher risk premium since they will have a greater probability of losing their
money. DeAngelo and Masulis (1980) argue that the cost of debt will increase
for firms that have variability in their earnings since investors will not be able
to accurately predict future earnings based on publicly available information.
Bradley et al. (1984) argue further that the variability of the firm value
expected to show negative influence on the debt ratio when the costs of
financial distress are significant. Consequently, this suggests an inverse
relationship between risk and leverage.
2.3.5 Tax
Modigliani and Miller (1963) argue that firms with high tax liabilities are
expected to utilize greater amounts of debt to take advantage of the
deductibility of interest payments. Accordingly, a positive association
between debt and tax is expected. However, Graham et al (1998) argue that
corporate tax is endogenous to financing decisions, which induces a spurious
negative association between debt ratios and marginal tax rate (MTR). They
demonstrate that including the interest expense in the tax rate computation
would cause a decline in the MTR. In this case, firms with high level of debt

35
will associated with a low observed MTR and, thus, a negative relationship
will be observed between debt level and tax proxy. Accordingly, they suggest
using before financing marginal tax rate (i.e. after removing the effect of
interest tax shield from MTR calculation).
Alternatively, DeAngelo and Masulis (1980) incorporate the effect of
corporate taxes, personal taxes, and non-debt tax shields in their model of
optimal capital structure. Their argument is that tax deductions for
depreciation, losses, and investment tax credits are substitutes for the tax
benefits of debt financing. Accordingly, this suggests that firms with greater
non-debt tax shields expected to have lower levels of debt.
2.3.6 Growth
Myers (1977) argues that the under-investment and asset substitution issues
are likely to be more severe for firms with great growth opportunities and,
thus, such firms should use less debt in order to mitigate these agency
problems. Titman and Wessels (1988) further argue that since growth
opportunities are capital assets that add value to the firm but cannot be
collateralised, the costs associated with agency conflicts between equity and
debt holders is expected to be higher for firms in growing industries.
Accordingly, a negative relationship between debt and growth opportunities
suggested. Pecking-order hypothesis also suggests a negative relationship
between leverage and growth opportunity. According to Myers and Majluf
(1984), information asymmetry demands an extra premium for firms to raise
external funds irrespective of the true quality of their investment project. In
the case of issuing debt, the extra premium is reflected in the higher required

36
yield. Therefore, firms with growth opportunities may find it too costly to rely
on debt to finance its growth. Myers (1977), however, argues that these
agency problems can be mitigated if the firm issues short-term debt rather
than long-term debt. This would suggest that growth to have a negative
relationship with long-term debt and a positive relationship with short-term
debt.
2.3.7 Uniqueness
Titman (1984) argues that firms, which produce unique or specialised
products, use less debt to avoid the possibility of going out of business since
the costs imposed on their customers, workers and suppliers are relatively
high in the event of liquidation. Accordingly, an inverse relationship between
uniqueness and debt ratios is expected.
2.3.8 Dividends
According to the pecking order hypothesis, firms prefer to use internally
generated funds and if external funds are needed, firms prefer to raise debt
before equity. One of the main predictions of the pecking order hypothesis is
that there is a negative interaction between dividend payout and investment
opportunity because higher dividend payout lower the retained earning and
that increase the need for the use of external source of fund (i.e. debt) to
finance growth opportunity (Baskin 1989; Allen, 1993 and Adedeji, 1998).
Therefore, a positive relationship is expected between dividends and debt
ratios. On the other hand, dividends and debt are substitutes for controlling the
free cash flow agency problem (Stulz, 1990), which would suggest a negative
relationship between dividends and debt ratios.

37
2.3.9 Free cash flow
Agency theory argues that debt reduces the amount of the free cash flow
available to managers to involve in personal benefit activities since debt
commits the firm to serve its debt payments (Grossman and Hart, 1982;
Jensen, 1986 and Stulz, 1990). Accordingly, this would suggest a direct
relationship between free cash flow and leverage. On the other hand, if the
free cash flow represents the capacity of the firm’s internal generated
resources, the pecking order theory would suggest an inverse association
between free cash flow and leverage.
2.3.10 Liquidity
According to pecking order hypothesis, in the presence of asymmetric
information, firms with financial slack (i.e. liquid assets such as cash and
marketable securities) will prefer internal sources to finance future
investments. Accordingly, firms with higher liquidity ratio are expected to
have lower leverage.
2.3.11 Age
Diamond (1989) argues that aged firms with a long history of credits will have
relatively low default probability and lower agency costs using debt financing
than newly established firms. Accordingly, a positive relationship is expected
between age and debt ratio. On the other hand, according to pecking order
hypothesis, firms prefer raising funds first from retained earnings and resort to
external funds only if the former is insufficient, in which issuing debt is
preferred over issuing equity. Therefore, young firms are more likely to

38
depend on debt instruments since they do not have sufficient funds internally
to finance new investment. Hall et al. (2004) argue that new firms will not
have had time to cumulate funds and may be forced to borrow. This suggests
an inverse relationship between age and debt ratio.
2.3.12 Government
Theoretically, the impact of the government as large shareholders on leverage
is ambiguous. On one hand, Jensen (1986) argues that the use of debt can
minimize the conflicts between management and shareholders. Accordingly,
the presence of shareholders owning large percentages of equity shares (in this
case government) in a firm may have incentives to use debt to reduce the
ability of the management from engaging in the consumption of excessive
perquisites. Moreover, Leland and Pyle (1977) argue that the market inferred
the amount of equity retained by the entrepreneur as a signal of the firm
quality. The government ownership, therefore, will signal to the lenders the
firm’s guaranteed solvency. Accordingly, these arguments would suggest a
positive relationship between government ownership and debt ratio. On the
other hand, the presence of the government as large external shareholders may
also force managers to engage in activities that benefit shareholders at the
expense of debt-holders such as asset substitution (Myers, 1977). This would
suggest an inverse relationship between debt and government attribute.
2.4 Review of prior empirical studies:
The purpose of this section of the literature review is to provide a wide range
of the relevant empirical studies related to the area of capital structure. Prior
empirical studies in this area can be divided into two main approaches of

39
which the first approach involves a survey-based analysis while the second
involves regression analysis using company’s accounting data.
This section proceeds as follow: Section 2.4.1 goes over the prior survey
based studies. Section 2.4.2 reviews prior regression based studies examining
specific theory. Section 2.4.3 reviews prior regression based studies
examining general capital structure themes.
2.4.1 Prior empirical studies survey-based analysis:
As an attempt to narrow the gap between theory and the behaviour of financial
managers in practice, some studies adopted survey methodology. In this
approach, company or financial managers have been asked about their views
and behaviour regarding capital structure decisions, in particular, their views
on issues related to the two dominant theories (i.e. pecking order and trade-off
theories). Following are the studies that have been carried out adopting survey
approach.
Donaldson (1961) conducted an interview survey on 25 large US firms.
Consistent with pecking order hypothesis, he found that management strongly
prefer to use internal generation as a source of new funds and resort to
external funds only if the need for funds was unavoidable. With a response
rate of 21% of the 468 industrial firms surveyed from the 1984 fortune 500,
Norton (1989) found that financial managers preferred to use internal
resources first and in the case where external financing is needed, debt is used
more than equity due to the tax deductibility of interest payments. However,
factors dealing with bankruptcy costs, agency costs and information

40
asymmetries were found to have little effect on financial decision makers’
behaviour.
Graham and Harvey (2001) carried out a survey on 392 CFOs of US firms,
which represents a response rate of 8.5%. In their analysis of capital structure
responses, they found financial flexibility and credit ratings were the most
important debt policy determinants whereas earnings per share dilution and
recent stock price appreciation were the most important determinants
influencing equity issuance. Moreover, while a moderate support was found
for both the pecking order and trade-off theories, issues related to asset
substitution, asymmetric information, transactions costs, free cash flows and
personal taxes were found to have little effect on executives’ financial
decisions.
In countries other than US, Allen (1991) interviewed senior financial
personnel of 48 listed Australian companies. He found that 93 % of the
respondents were found to pursue a policy of maintaining spare debt capacity.
Relatively consistent with pecking order prediction, 52.1 % of the respondents
preferred to fund their business by internal funding sources. Moreover, some
evidence on target debt ratios and tax considerations of debt is found.
More recently, Beattie et al (2006) conducted survey on 192 financing
directors of UK listed companies, which represents a response rate of 23%.
The main finding is heterogeneity among companies regarding capital
structure policies, in which about 50% respondents seek to maintain a target
debt level (i.e. consistent with trade-off theory) and 60% claim to follow a
financing hierarchy, (i.e. consistent with pecking order hypothesis). The

41
respondents, however, did not view these two theories as either mutually
exclusive or comprehensive. Moreover, company size is found to have an
important influence on corporate financing decisions. Broadly, theoretical
arguments related to interest tax shield, financial distress, agency costs and
information asymmetry were found to be acceptable by respondents.
In international comparisons, Bancel, and Mittoo (2004) carried out a survey
on CFOs of 87 firms in 16 European countries with a response rate of 12%3.
In comparison to Graham and Harvey (2001) study, they found that European
managers use factors similar to those used by their U.S. counterparts for their
financing decisions. However, there were differences among European
countries on several dimensions, particularly between Scandinavian and non-
Scandinavian countries. Country’s institutional structure, especially the
quality of its legal system was found an important determinant of debt policy.
Financial flexibility and earnings per share dilution were the managers’
primary concerns in issuing debt and common stock respectively. Most firms
determined their optimal capital structure by trading-off factors such as tax
advantage of debt, or bankruptcy costs, agency costs, and accessibility to
external financing.
2.4.2 Empirical results concentrated on the testing of specific theories
Many studies have investigated the process of how firms chose their
debt/equity level in the framework of the two leading theories, namely, the 3 Countries are Austria, Belgium, Denmark, Finland, France, Germany, Greece, Holland, Ireland, Italy, Norway, Portugal, Spain, Sweden, Switzerland and United Kingdom.

42
pecking order hypothesis and trade-off theory. This subsection, thus,
organised based on either study tests pecking order hypothesis or it examines
trade-off theory or both.
A limited number of studies directly test the pecking order theory using
specific econometric models. Baskin (1989) examined the pecking order
hypothesis directly by using structural model. The key finding is that the
payments of high levels of past dividends reduce the amount of the retained
earnings and, thus, increases the demand for debt. Studies carried out by Klein
and Belt (1993); Allen (1993) and Adedeji (1998) also have directly tested the
pecking order theory and find support for it. On the other hand, Frank and
Goyal (2003) tested the pecking order theory using system equations.
Inconsistent with the prediction of the pecking order theory, their results show
that external funding is largely used, and debt financing does not dominate
equity financing in magnitude. Moreover, net equity issues track the financing
deficit more closely than do net debt.
On the other hand, much of the empirical work in this area has focused on the
static and dynamic trade-off theories. An early study that tested trade-off
theory adopting a static approach is Taggart (1977). The author found that
movements in the market values of long-term debt offset by movements in the
market of equity and, thus, firms adjust toward a target debt/equity ratio.
Marsh (1982), Opler and Titman (1994), Hovakimian et al (2001) also found
evidence that firms appear to adjust toward debt targets which is consistent
with the prediction of the trade-off theory. However, these studies have been

43
conducted using static approach in which they assume that observed ratios
equal optimal ratios and the adjustment to the target is costless.
Recently, studies have extended traditional static models by introducing
dynamics into the capital structure choice in which firms dynamically adjust
their capital structure to target and the adjustment is costly. Jalilvand and
Harris (1984) used system equations to estimate their target-adjustment
model. They found that firms adjust gradually toward long-run financial
targets. Firm size, interest rate conditions, and stock price level were found to
be the main factors affecting the cost and the speed of adjustment. Large firms
appeared to adjust to the long-term debt target faster than small firms do.
Fischer et al. (1989), Gatward and Sharpe (1996), DeMiguel and Pindado
(2001), Ozkan (2001), Bhaduri (2002), Mayer and Sussman (2004), Gaud et
al. (2005) and Kayhan and Titman (2007) also provide evidence that firms
have target ratios and adjust dynamically to the target ratio with different
costs and different speeds.
Finally, a few studies have sought to distinguish which of the two main
theories (the pecking order hypothesis and trade-off theory) best explains
capital structure practice. Shyam-Sunder and Myers (1999) perform a
simulation test for the two models and conclude that the pecking order
hypothesis is an excellent first-order approximation of actual corporate
financing behaviour. Chirinko and Singha (2000), however, criticize Shyam-
Sunder and Myers’s test and show that their “elegantly simple” test generates
misleading inferences when evaluating plausible patterns of external
financing. They argue further that their empirical evidence can evaluate

44
neither the pecking order nor static trade-off models. Fama and French (2002)
use system equations to test for the two models. In line with the predictions of
both models, the results show that more profitable firms and firms with fewer
investments have higher dividend payouts. In support of the pecking order
model, the results show that firms that are more profitable are less levered and
short-term variation in investment and earnings is mostly absorbed by debt.
2.4.3 Empirical results on general capital structure themes
Since the pioneering work of Modigliani and Miller (1958), the question of
what determines firms’ choices of capital structure has been a major field in
the corporate finance literature. Since then, numerous studies have attempted
to identify those factors that have an effect on firms’ choice of capital
structure. A previous narrative review conducted by Harris and Raviv (1991)
showed that the direction of the relationship between leverage and its
determinants across studies shows some inconsistent findings. Accordingly,
they conclude that understanding and analysing these mixed results across
research studies is filled with difficulty in the capital structure literature.
Moreover, cross-study comparisons in traditional literature review are usually
undertaken with ignoring any differences in measurement and sample sizes.
Wolf (1986), however, suggests that contemporary research reviewing should
be more scientific and statistical than it is narrative. One way to do a statistical
synthesis technique is employing a meta-analysis procedure. Rosenthal (1991)
argues that meta-analysis is a useful methodology in summarizing
relationships, determining moderating variables and establishing relationships
across studies that are addressing the same research issue. Accordingly, the

45
meta-analysis technique is used in the next chapter (chapter 3) to determine
the significance level of the hypothesised relationship between capital
structure and its determinants and investigate the underlying factors that
moderate the apparent variation observed in the previous studies. The
technique does not appear to have been applied previously within the capital
structure literature.
However, before proceeding further it is necessary in the next section to
consider prior studies that are very important to the current study as they deal
specifically with determinants of capital structure in Saudi Arabia. Since the
current study investigates the determinants of capital structure of Saudi
unlisted companies, studies relating to capital structure in unlisted sample will
be summarised in section
2.4.4 Prior studies related to the context of Saudi Arabia
Our knowledge of capital structure has mostly been derived from a large
volume of research conducted in developed countries but very little is known
about Arab countries, in particular Saudi Arabia. Following are the studies
found in the literature to investigate directly or indirectly the capital structure
determinants of listed Saudi Arabian companies.
Omet and Mashharawe (2001) examined the determinants of the capital
structure choice of Jordanian, Kuwaiti, Omani and Saudi non-financial listed
companies. Pooled ordinary least squares, fixed effects and random effects
models were applied using data of 51, 30, 38 and 29 Jordanian, Kuwaiti,
Omani and Saudi Arabian companies respectively over the period 1996 to
2001. They found that in general the companies of these countries employ

46
relatively low leverage ratios. The mean values of long-term debt to total
assets were found to be 5.4%, 8%, 13% and 9% for Jordan, Kuwait, Oman
and Saudi Arabia respectively. Contrary to tax theory, while Jordanian
companies are subject to 35% tax rate, they did not have significantly higher
leverage than their counterparts in the other countries that are subject to lower
or even zero percent tax rates. In the context of the determinants of capital
structure the authors found that the coefficients of profitability and liquidity
are significantly negatively in all countries and the coefficients of size are
significantly positive in all countries, except for Oman. The coefficients of
tangibility, on the other hand, were positively significant only in the case of
Jordanian companies.
Barakat and Roa (2004) investigated the influence of tax on the choice of
capital structure in 12 tax and non-tax Arab countries (Bahrain, Egypt, Jordan,
Kuwait, Lebanon, Morocco, Oman, Palestine, Qatar, Saudi Arabia, Tunisia
and United Arab Emirates). They employed pooled Tobit regression
techniques to estimate their models using the consolidated data of these
countries over the period 1996 to 2001. Unlike Omet and Mashharawe's
(2001) findings, they found that taxed countries use more debt than non-tax
countries. Non-debt tax shields are also found to be positively and
significantly correlated with leverage in non-tax countries but negatively and
significantly correlated in tax countries. Further, they found that the
coefficients for dividends, family ownership, growth, collateral, size are
positive and significant while the coefficients for profitability and earnings
volatility are negative and significant. However, the authors failed to find
significant relationship between government ownership and leverage.

47
Although the above papers have begun to explain the Saudi Arabia
environment, there is scope to investigate this much more thoroughly. In
particular, for listed companies it would be useful to consider how robust the
results are to timeframe consideration, alternative model specifications and
different variable proxies. Also, little is presently known about capital
structure in unlisted companies in Saudi Arabia. The current thesis will
address these issues.
2.4.5 Prior empirical studies in the context of small and medium firms
It is quite likely that capital structures of unlisted companies will differ from
listed companies since the former cannot gain stock market access. However,
a significant gap in the research has been in the determinants of capital
structure for unlisted companies, probably due to the lack of data for those
companies (Hall et al., 2004). Following are the studies that have been carried
out to investigate the determinants of capital structure in the context of small
and medium firms.
Petersen and Ragan (1994) conducted a comprehensive investigation about
how ties between a firm and its creditors affect the availability and cost of
funds to the firm in the context of small firms. In the examination of the
firm’s debt ratio determinants, a Tobit technique is employed to estimate their
model using a sample of 3233 firms over the period 1988 to 1989. They
found that firm’s size is significantly positively correlated to its total debt
ratio. They also found that factors such as profitability, age, length of longest
relationship and risk have negative and significant influence on the total debt
ratio.

48
Jordan et al. (1998) investigated the link between capital structure and both
competitive and corporate strategies in UK small and medium firms by
adopting both questionnaire and regression based analysis4. In relation to the
corporate strategy, insignificant relationship was found between capital
structure and the level of diversification adopted by SME’s. However,
competitive strategy was found to influence capital structure: innovation
strategies differed from cost leadership and differentiation strategies with
negative rather than positive correlations with debt levels. Furthermore,
inconsistent with trade-off theory, they found that leverage was positively
correlated with earnings variability and negatively correlated with effective
tax rate. Jordan et al. concluded that the pecking order hypothesis is very
important in the determination of capital structure in small firms.
Cassar and Holmes (2003) investigated the influence of size, tangibility,
profitability, growth and risk on capital structure for Australian small and
medium enterprises using the data of 1555 firms over the period of 1995 to
1998. They found that all debt ratios are significantly positively correlated
with size and growth while significantly negatively correlated with
profitability. They also found that tangibility is significantly positively
correlated with long-term debt and significantly negatively correlated with
short-term and total debt ratios. The authors, however, failed to find
significant results for risk attribute. They concluded that their results in
general provide support for both static trade-off and pecking order hypothesis
arguments. 4 A total of 275 completed questionnaires representing a response rate of 45% and a financial data on 219 small and medium UK firms over the period 1989 to 1993 were used in the analysis.

49
Esperanca and Gulamhussen (2003) investigated the determinants of capital
structure of Portuguese small firms using the data of 995 firms over the period
of 1992 to 1996. Consistent with DeAngelo and Masulis's (1980) tax theory,
they found that the coefficients of non-debt tax shields are negative and
significant in long-term and total debt models but insignificant in short-term
model. Consistent with the pecking order hypothesis, they found a negative
and significant relationship between profitability and all debt ratios. Size was
found to be significantly positively correlated with long-term debt while
significantly negatively correlated with short-term and total debt ratios. The
authors also found that tangibility is significantly negatively correlated with
short-term and total debt ratios and it is significantly positively with long-term
debt. This finding in turns supports the asset maturity principle. However,
they found that risk and growth variables are significantly positively
correlated with short-term and total debt ratios but are insignificantly
correlated with long-term debt, while age is significantly negatively correlated
only with long-term debt.
Hall, et al. (2004) investigated the differences in capital structure for
European small and medium enterprises by examining whether any
differences were due to country-specific factors or to differences between
countries in firm-specific factors. Short-term debt to total assets and long-term
debt to total assets were regressed on a wide set of firm’s characteristics using
data for 4,000 Small and Medium Enterprises in eight countries (Belgium,
German, Spain, Ireland, Italy, Netherlands, Portugal and UK). They found
that differences in SME capital structures between countries were due to firm-
specific variations not country-specific ones. With regard to determinants of

50
SME capital structure, they found that while asset structure was consistent
across countries and had the expected sign, other variables such as growth,
size, profitability and age exhibited different insignificant influence across
countries. They argue that since there were variations in the effects of the
determinants of capital structure between countries, their hypotheses did not
explain everything in term of SME capital structure.
While information about SME capital structure in developed countries is
somewhat limited, in developing countries there is virtually no knowledge.
The present study seeks to contribute by addressing this issue through an
investigation of unlisted companies in Saudi Arabia.
2.5 Conclusion
The history of the theoretical research in capital structure has started with the
famous irrelevance theory of Modigliani and Miller (1958). However, by
relaxing Modigliani and Miller’s assumptions of perfect capital markets,
several theoretical frameworks have been developed to explain the firm’s
capital structure.
Trade off-theory assumes that there are benefits and costs associated with the
use of debt as against equity and firms thus chose an optimal capital structure
that trade-off between benefits and costs of debt. The theory comes in several
forms. The first distinction is that in the beginning the theory was limited to
the trade off between the tax advantages of debt against the bankruptcy costs.
Then it was extended to include benefits and costs associated with the use of
debt in mitigating the conflicts among the agent groups associated with the
firm. A second distinction is between the static trade-off model in which a

51
firm is always at an optimal point, and the dynamic model in which a firm
dynamically adjusts its capital structure to a moving target and the adjustment
is costly.
Asymmetric information is another dimension of the capital structure theories.
It is generally thought there is asymmetric information between firm
managers (or insiders) and outside investors. In the pecking order theory,
there are three sources of funding available to firms: retained earnings, debt,
and equity. Equity is subject to serious adverse selection, debt has only minor
adverse selection problems, and retained earnings avoid the problem.
Therefore, due to asymmetric information, firms prefer internal over external
financing and if external financing is needed debt is preferred over equity.
Under this theory, a single target debt ratio does not exist; instead the debt
ratio reflects the residual of retained earnings, dividend payout and investment
decisions over time. In signalling theory, however, firm’s capital structure
choice is used as a means to signal to outside investors the information held
by insiders.
Finally, models based on industrial organization and corporate control
considerations provide explanations of how the characteristics of a firm’s
inputs/products and firm’s control and strategy affect its capital structure.
Although the theories presented in this chapter identified many potential
determinants of capital structure, the question of which of these theories best
explains capital structure practice remains unanswered.
Seeking to provide an answer to this question, many empirical studies have
been carried out concerning the main two theories (i.e. trade-off and pecking

52
order theories) and using survey and regression methods. The finding of both
method show overall mixed results. Table 2.1 and Table 2.2 provide a
summary of the main findings of the survey and the regression approaches
concerning the two main theories.

53
Table 2.1: Studies found support to trade-off theory.
Survey based studies
Regression based studies
Static studies
Dynamic studies Study Finding
Study Finding Study Finding
Graham& Harvey (01)
37%, 34% and 10% of respondents followed flexible target, somewhat tight target and tight target respectively.
Taggart (77).
Movements in the market values of long-term debt offset by movements in the market of equity
Jalilvand & Harris (84)
Firm size, interest rate and stock price affect the speed of adjustment.
Brounen et al. (04)
More than two third of the surveyed have some target debt ratio.
Marsh (82), Hovakimian et al (01), Opler&Titman (94) and Shyam-Sunder and Myers (99)
Changes in debt demonstrate firm's adjustment toward target debt ratio.
Fischer et al (89)
Re-capitalisation costs lead to a wide swing in a firm's debt ratio over time.
Bancel& Mittoo (04)
59 % of managers rank maintaining a target debt-to-equity ratio as important.
Ozkan (01)
UK firms adjust to the target ratio relatively fast.
Beattie et al. (06)
51% of the firms surveyed did maintain a target capital structure.
Gatward & Sharpe (96), DeMiguel & Pindado (01) and Gaud et al. (05)
Australian, Spain, Swiss firms adjust to the target ratio relatively slow.
Bhaduri (02)
The costs and the speed of adjustment towards optimal capital structure are higher for short-term debt than for long-term debt.
Kayhan & Titman (07)
Cash flows, investment expenditures and stock price lead to deviations from target.
Mayer & Sussman (04)
In the long-term, firms revert to previous levels of leverage.

54
Table 2.2: Studies found support to Pecking order hypothesis.
Survey based studies
Regression based studies
Study Finding Study Finding
Donaldson (61) and Norton (89)
Surveyed firms prefer to use internal to external financing and debt is preferred over equity as external financing.
Mayers (1989)
Corporate growth is financed mainly from internal resources and if external finance is needed bank loans were the main source in both market-base and bank-base countries
Allen (91)
52 % of the respondents preferred internal funding sources and 93 % pursue a policy of maintaining spare debt capacity.
Allen (93)
Investment growth found negatively correlated with previous dividend levels.
Graham & Harvey (01), Bancel, & Mittoo (04)
Managers view financial flexibility is an important determinant of the company's debt policy.
Klein and Belt (94)
Debt being the primary choice for the most efficient firms.
Beattie et al. (06)
60% of the respondents claimed to follow a financing hierarchy.
Adedeji (98)
Negative relationship was found between dividend payout and investment. Leverage found positively correlated with dividend payment and negatively correlated with profitability.
Shyam-Sunder & Myers (99)
Changes in debt ratios are explained by the need for external funds due to the internal financing deficit.
Fama & French (02)
Firms that are more profitable found to have less leverage. Firms with more investment found to have lower long-term dividend payouts and the short-term variation in investment and earning is mostly absorbed by debt.
Mayer and Sussman (04)
The pecking orders hold in the short-term in which profitable, large firms issue debt and increase their debt corresponding to their financing requirements.

55
As it can be seen from the tables, while some studies support the trade-off
theory, some others provide support to the pecking order hypothesis and some
others show mixed evidence. This would suggest neither of the two theories
independently provide sufficient descriptions for the process of how firms
chose their debt/equity levels.
The chapter addresses also a brief discussion about the inconsistency of
previous empirical results on general capital structure themes. The discussion
highlights the importance of studies’ measurement differences and sample
sizes issues in the cross-study comparisons that are generally ignored in
traditional literature review. Since meta-analysis technique has been proven in
different areas as useful methodology that considers such issues, it will be
used in chapter 3 to summarise and clarify inconsistencies in the cross-study
comparisons. The next chapter describes the technique and summarises the
findings of prior empirical studies. This chapter ends with a reviewed of the
prior empirical studies related to capital structure in the context of Saudi
Arabia and in the context of unlisted firms.

56
Chapter 3: Meta-Analysis Techniques

57
3.1 Introduction
The vast majority of empirical studies in the capital structure area are
concentrated on testing variables that have been suggested by theories to have
an influence on debt ratio. One drawback of the previous narrative reviews is
that they usually done with the results mostly taken at face value, ignoring any
differences in measurement of the explanatory and the dependent variables
and studies sample sizes. Harris and Raviv (1991) and Bevan and Danbolt
(2002) assert on the importance of measurement differences as a source of
variation in the previous finding. In light of this assertion, a meta-analysis
technique, which statistically synthesises the finding of previous studies, is
used in this dissertation to summarise and clarify inconsistency in the findings
of prior studies.
The chapter is presented as follow: section 3.2 presents the meta-analysis
technique. Section 3.3 summarises the finding of prior empirical studies.
Finally, section 3.4 provides chapter conclusion.
3.2 Meta analysis technique
Glass (1976) describes meta-analysis as a statistical synthesis technique,
which integrates the statistical results across individual studies investigating
the same research question. Previously, vote counting was the procedure
primarily employed for summarising statistical results. In this method,
findings are categorised as significantly positive, significantly negative, or
insignificant and the category with the most entries is considered the best
representation of research in this area. The main drawback of this method is
that the process does not take into account the differences between studies in

58
terms of the statistical significances and sample sizes. Cooper (1998),
therefore, concludes that vote counting will produce very imprecise results.
Recently, two common methods of quantitative procedures, namely, the
combined significance test and the effect size index are developed to
overcome the shortcoming of vote counts. In the combined significance
technique, the exact probability associated with the finding of the previous
studies is statistically combined to arrive at an overall significance level
regarding the research issue of interest. On the other hand, the effect size
method involves an accumulation of the correlation coefficients across studies
in order to estimate the size of the relationship related to the research issue of
interest. Wolf (1986), Greenberg (1992) and Cooper (1998) pointed to the
importance of these two meta-analysis techniques in the synthesis of previous
findings. Greenberg (1992) argues that when past results conflict or some
results are significant and other are not significant, combined significance test
can be useful in determining the overall significance level. Moreover, most of
the studies included in the sample do not report the statistical data (i.e.
Pearson correlation coefficient) required to apply the effect size technique.
Accordingly, the combined significance test is applied here.
3.2.1 Combine significance test
The combined significance technique statistically combines the finding of the
previous studies that address the same question. The major advantage of this
procedure is that it combines the exact probabilities associated with the results
of each estimate of a relation to arrive at an overall significance level (Cooper,
1998). Accordingly, it is essential to know or estimate the P-value associated

59
with each of the studies included in the meta-analysis. On the other hand, the
major disadvantage of this procedure is that all studies synthesized in a meta-
analysis are given equal weight. Wolf (1986) argues that this could lead to the
less representative studies with small sample size contributing just as much
weight to the results of the meta-analysis as the studies with large sample size.
Generally, a study with a large number of observations is more precise, or
more reliable, and thus more influential than a study with a small number of
observations. Therefore, a large study should have more weight and should
contribute proportionately more to the overall results.
To overcome this problem, the combined test should give weights to the
studies with larger samples. Cooper (1998), Greenberg (1992) and Wolf
(1986) argue that the Stouffer test can be modified to overcome this issue.
Generally, this is performed using the degrees of freedom associated with
each statistical test as weights in the meta-analysis. Accordingly, the formula
for the weighted Stouffer test applied in this dissertation is as follow:
Weighted Stouffer test (Zc) = ∑ df Z √ ∑ df 2
Where Z is the standard normal deviate associated with the one tailed P-value
and df is the degree of freedom associated with each statistical test included in
the meta-analysis. Then after, the probability associated with Zc can be
obtained from the normal distribution table. The steps to carry out the analysis
are as follow:
Each study, which reports a t-test, a Z-test, p-value, or standard error, is
included in the meta-analysis.

60
Tests reporting standard errors are converted to a t-statistic by dividing the
coefficient by its standard errors.
The t-statistic is transformed to a p-value using the Excel function (TDIST (t-
value), n, 1).
The p-value is transformed to a Z value by using the Excel function
(NORMSINV (p-value)).
Table 3.1 illustrates the meta-analysis process used to synthesise the findings
of prior empirical studies. The illustration derives from the analysis of size
(see Table 3.4, p.70) with just a smaller sub-sample of the data being used.

61
Error! Reference source not found.Table 3.1: Illustrate of meta-analysis applied to size variable
using Weighted Stouffer test
Study Sample size t-test p-value Zc Df** Zc*Df Df2
Frank & Goyal (03), TD (MV) (Sales) 82613 25.0 1.9894E-137 24.95 82609 2061329 6824246881
Bevan & Danpolt*(04), LTD ( BV) (Sales) 6001 5.39 7.43E-08 5.38 5997 32263.86 35964009
DE JONG A. (02)
LTD (BV) (Assets) 665 2.43 0.0153624 2.42 647 1568.1474 418609
Akhtar& Oliver (06), TD (MV) (Assets) 2942 7.97 2.249E-15 7.93 2930 23225.534 8584900
Heshmati (01), TD (BV) (# of employee)
6783 -4.25 2.145E-05 -4.24922 6763 -28722.6 45738169
Mueller E. (05), TD (BV) (# of employee)
26522 15.82 4.14352E-56 15.78 26514
418442 702992196
Weighted Stouffer
test ∑ df Z
√ ∑ df 2 ∑ df* Z SQRT ∑ df 2
Overall =2508105.94 / 87280.84 = 28.74 and p-value= 0.0000 2508105.94 87280.84
Sales =2093592.86 / 82826.39 = 25.28 and p-value= 0.0000 2093592.86 82826.39
Assets = 24793.68 / 3000.58 = 8.26 and p-value= 0.0000 24793.68 3000.58
# of employee =389719.40 / 27362.94 = 14.24 and p-value= 0.0000 389719.40 27362.94
Leverage based on MV = 2084554.53 /82660.94 = 25.22 and p-value= 0.0000 2084554.53 82660.94
Leverage based on BV = 423551.41 / 28019.87= 15.12 and p-value= 0.0000 423551.41 28019.87
Total debt = 2474273.93 / 87072.17= 28.42 and p-value= 0.0000 2474273.93 87072.17
Long-term debt = 33832.01 / 6031.801 = 5.61 and p-value= 0.0000 33832.01 6031.8
* The authors report the standards error, thus, t-test= β / (SE)= 0.0167/0.0031= 5.39 ** Degree of freedom (df) = sample size - # of included independent variables in the model.

62
Moreover, the percentages of the total significant observations to the total
number of observations, as well as the percentage of the significant positive
and negative observations to the total significant observations, are calculated.
Such steps provide information about the driving forces behind the obtained
results associated with Zc in more detail. It is noteworthy that the number of
observations rather than the number of studies is used, to maintain the
consistency of the results with the results obtained by using the weighted
Stouffer test.
3.2.2 Moderating effects
Harris and Raviv (1991) argue that the interpretation of research findings
should be tempered by taking into account differences in the measurement of
both leverage and the explanatory variables of interest. This means that the
relationship between leverage and the corporate characteristics might be
moderated by the differences in the measurement of leverage and its
determinants. Cooper (1998), Greenberg (1992) and Wolf (1986), amongst
others, define a moderating variable as a third variable that causes differences
in the association between two other variables. Greenberg (1992) stated that
further investigation might reveal a moderating variable masking a
relationship. Previous meta-analysis studies suggest sub-grouping studies
according to differences in the measurement of the dependent and the
independent variables (Ahmed and Courtis 1999). Accordingly, to capture
moderator effect, studies are sub-grouped based on the differences in the
definition of the debt ratios and in the differences in the proxies used to

63
measure firm’s attributes. Moreover, the weighted Stouffer test is performed
for each sub-group.
Bevan and Danbolt (2002) argue that the different financial ratios used in
prior literature to measure leverage may cause the determinants of leverage to
differ considerably. Since most of the studies measure debt by total or long-
term debt, the sub-groupings of debt ratios are according to these definitions.
Further, these two debt ratios are usually scaled by either total assets or
equity. Total assets are necessarily based on book value recorded in the
financial statements. However, equity can be measured either at book value
(i.e. shareholders funds in the financial statements) or at market value (as
quoted in the stock exchange). Both equity measures have been used in prior
studies. Throughout this dissertation, these will be described as debt “based on
book value” or “based on market value”. These phrases represent an
abbreviated from of ‘debt scaled by total assets (or equity), measured at book
value’ and ‘debt scaled by total assets (or equity), measured at market value’
respectively. Scaling by total assets or equity is not distinguished in this study;
this represents a limitation of the analysis.
Titman and Wessels (1988) and Bevan and Danbolt (2002) point out that
proxy variables might be selected by the goodness-of-fit criteria and, thus,
bias may arise in interpretation of the significance level tests. Consequently,
corporate attributes are sub-grouped according to the major differences in the
proxies used to capture the effect of these attributes. For example, the attribute
of uniqueness is sub-grouped into research & Development (R&D) and selling
& administration (S&A) expenses which are usually employed as proxies for

64
uniqueness. However, either these proxies scaled by sales or assets is not
considered in this study for the same reason above. Therefore, this becomes
also a limitation inherent in this study.
3.2.3 Data collection procedure
The data collection process went through a systematic method as described
below.
3.2.3.1 Determining the research issue and the scope of the literature
The first step in meta-analysis is to determine the research issue to be
investigated. It was pointed out earlier in chapter one that though the literature
is rich in empirical studies examining the determinants of capital structure,
their findings are not always consistent in terms of the direction and strength
of the relationship. After determining the research issue, the second step in
meta-analysis is to determine the scope of the literature appropriate to
examining the research issue. Greenberg (1992) argues that it is important to
expand the scope of the search to include more than one area. Accordingly,
the literature search was expanded to covers publications in different areas
such as accounting, business, economic, finance and management.
Commonly, meta-analytic data are obtained only from published research in
order to ensure quality (Schmidt, 1985 and Ahmed and Courtis, 1999).
However, this has potential to bias the results as it is likely that only
significant findings will be published. To reduce this bias, the literature search
included working papers as well as published studies in journals.

65
3.2.3.2 Searching process
Before the search process began, it was essential to set up an empty database
that will include the references of the studies under investigation. Utilizing the
reference manager application provided by the university, an empty reference
manager database was established. The next step is to search studies for
review and transform their references into the database. A combination of
manual scanning of the previous studies’ references and on-line searching of
the related websites such as Blackwell Synergy, Business Source Elite,
Econlit, Emerald, IngentaConnect, JSTOR and Science Direct (for published
studies) and Social Science Research Network (SSRN) and Google (for
working papers) was carried out. Since all of these websites other than
Google provide an option to export references electronically to the reference
manager database, most of the references were transformed into the database
electronically and some references were entered manually.
3.2.3.3 Sample selection
The reference manager database reveals that the above search process
produced an initial sample of 403 studies' references related to capital
structure subjects. However, it is most likely that this process involve a
repetition issue (i.e. one study's reference were entered into the database more
than once). Indeed, utilising the check for duplicates function provided by
reference manager showed that 47 references were duplicated. Moreover, 79
Non-empirical studies are excluded from the meta-analysis. Similarly
excluded are 12 empirical studies based on survey method and 2 case studies.
Also, excluded are 14 non-English language studies.

66
The reduced sample, thus, limited to studies based on regression analysis.
These studies employed different estimation techniques such as time-series,
cross-sectional, pooled and Panel data regressions. However, estimation
techniques are not distinguished in this study although prior empirical studies
assert on the importance of the estimation differences as a source of
inconsistency (Bevan and Danbolt, 2004). Therefore, this becomes also a
limitation inherent in this study and represents a potential expansion for this
analysis.
Including the regression-based studies in the meta-analysis review required
further the presence of: (1) a dependent variable measuring debt ratios and (2)
explanatory variables. The dependent variables include total debt and long-
term debt scaled by either total assets or total equity and defined by book or
market value. The explanatory variables include attributes widely-used to
investigate the capital structure determinates. These include size, tangibility,
profitability, risk, tax, growth, uniqueness, dividend, free cash flow, liquidity,
age and government ownership. Some studies (24) did not relate to capital
structure determinants at all, but had leverage as one of a number of
explanatory variables, so these studies were picked up in key word (leverage)
searches. A further 39 studies (including some from management, economic
and accounting) were identified of a similar nature, but where leverage was
not even included as an explanatory variable. Excluded are 29 studies which
did not report the required statistical data. Also, excluded are 17 studies
investigating only a particular capital structure aspect or, for example, banks
capital structure (Yu, 2000), incremental capital structure decisions (De Jong
and Veld, 2001) and event study (Givoly, 1992).

67
Accordingly, the final sample of 140 [see footnote 6 next page] related studies
was included in the analysis of which 105 published studies were obtained
from 46 journals and 35 working papers were obtained mainly from SSRN
and a few from Google websites5. Table in Appendix 1 summarises these
studies by author name, year, data source, country and years covered in the
study.
Table 3.2 summarises the sample selection process.
5 Some of these studies involve cross-countries analysis. Since countries’ samples are drawn from different population, each country is considered as individual study.

68
Table 3.2: Summary of number of papers included in meta-analysis study and reasons for paper exclusion
No No
Initial identification of possible capital structure papers 403
Reasons for exclusion from meta-analysis study
Duplicated papers 48
Non-empirical studies 79
Survey studies 12
Case studies 2
Specific investigations rather than general capital structure
determinants
(eg study of banks, incremental capital structure decisions; event
studies
17
Leverage as explanatory variable in non-capital structure studies 24

69
Other non-capital structure studies but leverage not even as
explanatory variable
39
Total excluded because different methods applied (221)
Non-English language studies 14
Insufficient statistical measures reported in paper for meta-analysis 29 (43)
Total number of papers included in meta-analysis study 6 139
Published papers 102
Working papers 37
Total number of papers included in meta-analysis study 6 139
3.3 Results
The discussion, here, is according to the main attributes discussed earlier,
which are assumed theoretically to determine capital structure. First, an
aggregate meta-analysis is conducted. Next, the main sample is disaggregated
6 After completion of the dissertation, it was identified that the number of papers used in the meta-analysis actually 139 rather than the 140 reported elsewhere in the dissertation.

70
based on proxies used in prior studies to capture attribute effect and based on
debt’s measurement and definition. An independent meta-analysis is further
carried out for each sample. Tables 3-2 to Table 3.16 summarise the results of
meta-analysis of the relationship between debt levels and these variables.
Table 3.3 provides guidelines for the format of results presentation for each
panel of the tables. In the results tables, the column labelled W.S.T is the p-
value (and sign) of the Weighted Stouffer Test.
Table 3.3: Format of results presentation for each panel of the tables
Row Proxy Shading Font Dependent variables
1 Un-shaded Normal Total debt based on book value
2 Un-shaded Italic Long-term debt based on book value
3 Shaded Normal Total debt based on market value
4 Shaded Italic Long-term debt based on market value
5
Proxy name
Un-shaded Bold italic Summary of aggregated results for the particular proxy across
both dependent variables and book value and market value measures
Last row Un-shaded Bold
normal Summary of aggregated results across all proxies and all
measures
3.3.1 Size
Theoretically, the impact of size on debt levels is positive. Empirically, the
total asset, the total sales, or the number of employees typically measures
firm’s size. These proxies are usually transformed to the natural logarithm of
the raw data in order to improve the linear relationship with debt ratios.

71
The overall percentage of significance demonstrates that a strong relationship
exists between size and leverage. Consistent with the theory, the weighted
Stouffer test further shows that the overall direction of this relation appears to
be significantly positive. Table 3.4 (final row) shows that 92.61% of the total
observations are significant of which 96.39% are positive and significant at
1% level.
Table 3.4: Meta-analysis results of Size attribute. Significant
Positive Negative M.V. N of studies Total Obs. Obs. %
Obs. % Obs. % W. S. T. Dir.
78 1012363 962333 95.06 941552 97.84 20781 2.16 0.0000 P 59 120455 69939 58.06 52416 74.95 17523 25.05 0.0000 P 83 736585 714594 97.01 713862 99.90 732 0.10 0.0000 P 46 145793 137935 94.61 137935 100 0 0.00 0.0000 P
Assets
266 2015196 1884801 93.53 1845765 97.93 39036 2.07 0.0000 P 40 217355 211282 97.21 211282 100 0 0.00 0.0000 P 52 27506 24456 88.91 17987 73.55 6469 26.45 0.0000 P 72 414332 362533 87.50 354619 97.82 7914 2.18 0.0000 P 46 14005 10577 75.52 10577 100 0 0.00 0.0000 P
Sales
210 673198 608848 90.44 594465 97.64 14383 2.36 0.0000 P # Employees 12 109483 97549 89.10 57324 58.76 40225 41.24 0.0429 P
Market 247 1310715 1225639 93.51 1216993 99.29 8646 0.71 0.0000 P Book 241 1487162 1365559 91.82 1280561 93.78 84998 6.22 0.0000 P TD 297 2599601 2445840 94.09 2335963 95.51 109877 4.49 0.0000 P
LTD 203 307759 242907 78.93 218915 90.12 23992 9.88 0.0000 P
Overall 488 2797877 2591198 92.61 2497554 96.39 93644 3.61 0.0000 P
M.V., Obs., W.S.T., and Dir. refer to moderating variables, observations, Weighted Stouffer Test and direction of the relationship.
Further analysis suggests that differences in size measurement moderate the
results, as hypothesised. The meta- analysis results suggest that studies using
total assets and total sales have higher significant levels (significant at the 1%
level) than studies using the number of employees (significant at the 5% level)
in explaining the positive relationship between size and debt levels. A careful

72
study of the table indicates that the split in the significant results between
positive and negative direction in the number of employees proxy lessen the
strength of this relationship. The other two hypothesised moderator variables
(i.e. measurement and definition of debt ratios) show slight differences in the
percentage of the significant observations though the meta-analysis results are
significant at the 1% level.
The result show that studies using debt based on market value compared to
those using debt based on book value have more power in explaining
hypothesised positive relationship between size and debt with 99.29%
compared to 93.78% as a percentage of the total significant results. It is also
observed that studies using total debt ratio compared to those using long-term
debt ratio have more power in explaining hypothesised positive relationship
with 95.51% compared to 90.12% as a percentage of the total significant
results. However, the observed relationship between long-term debt defined
by book value and assets proxy (row 2) appears to drive the observed
differences in the results. In this relationship, only 58.06% of the total
observations are significant of which 74.95% of the significant observations
are positive and 25.05% are negative. However, this result worth to be
discussed in more details, as it is demonstrates the advantage of using
weighted Stouffer procedure. It is important to note that weighted Stouffer test
reveals strong significant level (1%) though 58.06% of the total observations
are significant. The observed highly significant results arise due to the
majority of the studies (i.e. 46 studies with total 84138 observations), which in
turn constitutes about 70% of the total sample observations, show positive

73
direction regardless to significant level7. To avoid biasness toward significant
results, weighted Stouffer procedure includes both significant and
insignificant results in the calculation process to draw an overall relationship
and, thus the observed result is not surprising.
In sum, the overall and the moderator variables support the theoretical
hypothesised positive relationship between size and debt levels as the
weighted Stouffer procedures produce significant positive relationships for all
samples.
3.3.2 Tangibility
Generally, tangibility is defined as the ratio of fixed assets to total assets. The
overall percentage of significance demonstrates that a moderate relationship
exists between tangibility and leverage. However, weighted Stouffer test
shows that the overall direction of this relation is significantly positive. Table
3.5 (final row) shows that 79.76% of the total results are significant of which
94.33% are positive and significant at 1% level under weighted Stouffer test.
7 Not reported due to table’s space limitation.
Table 3.5: Meta-analysis results of Tangibility attribute.
Significant Positive Negative M. V. N of studies Total
Obs. Obs. % Obs. % Obs. %
W. S. T. Dir.
78 1212517 786886 64.90 709875 90.21 77011 9.79 0.0000 P 59 147802 112886 76.38 110082 97.52 2804 2.48 0.0000 P 83 1053707 1005647 95.44 969573 96.41 36074 3.59 0.0000 P 46 148755 138729 93.26 138693 99.97 36 0.03 0.0000 P
F.A./T.A.
266 2562781 2044148 79.76 1928223 94.33 115925 5.67 0.0000 P Market 129 1202462 1144376 95.17 1108266 96.84 36110 3.16 0.0000 P Book 137 1360319 899772 66.14 819957 91.13 79815 8.87 0.0000 P TD 161 2266224 1792533 79.10 1679448 93.69 113085 6.31 0.0000 P
LTD 105 296557 251615 84.85 248775 98.87 2840 1.13 0.0000 P Overall 266 2562781 2044148 79.76 1928223 94.33 115925 5.67 0.0000 P

74
Further, the results suggest that the measures and the definitions of debt ratio
used in the studies have a moderating effect on tangibility and leverage
relationship. As observed in size, it seems that studies using debt based on
market value compared to those using debt based on book value have more
power in explaining the hypothesised positive relationship between tangibility
and debt. The debt based on market value with 95.17% of the total results are
significant of which 96.84% are positive compared to 66.14% and 91.13%
respectively observed in the debt based on book value.
Contrary to observed in size, studies using long-term debt ratio compared to
those using total debt ratio have more power in explaining the hypothesised
positive relationship with 98.87% compared to 93.69% as a percentage of the
total significant results. However, this is not surprising as long-term debt is
usually secured against fixed assets. It seems that the differences in the results
are driven by the observed relationship between total (row 1) and long-term
debt (row 2) defined by book value and tangibility ratio as they show the
lowest percentage of overall significant results with 64.90% and 76.38%
respectively. Nevertheless, weighted Stouffer test show that all results are
significant at 1% level though variation in term of percentage is observed.
This leads one to conclude that the overall and the moderator variables
support the positive relationship between tangibility and debt levels. This in
turn lends strong support to Jensen and Meckling’s (1976) argument that firms
with high level of fixed assets would have higher level of debt as fixed assets
improved guarantee of repayment to the lenders but contradict the tax-based
hypothesis of DeAngelo and Masulis (1980) that suggests negative influence.

75
3.3.3 Profitability
It has been seen earlier that there are no consistent theoretical predictions on
the influence of profitability on firm’s capital structure. Generally, earnings
before interest, tax, and depreciation (EBITD) scaled by either total assets
(Return on Assets: ROA) or by total sales (Return on Sales: ROS) are used to
capture the effect of profitability on leverage ratios.
The overall percentage of significance demonstrates that a strong relationship
exists between profitability and leverage. Consistent with pecking order
hypothesis, weighted Stouffer test further shows that the overall direction of
this relation is significantly negative. Table 3.6 (final row) shows that 85.64%
of the total results are significant of which 99.81% is negative and only 0.19%
are positive. Moreover, the results of the weighted Stouffer test produce
significance negative association between debt ratio and the profitability
attribute at the 1% level in all samples. The observed negative relationship,
however, varies due to the influence of the suggested moderator variables.
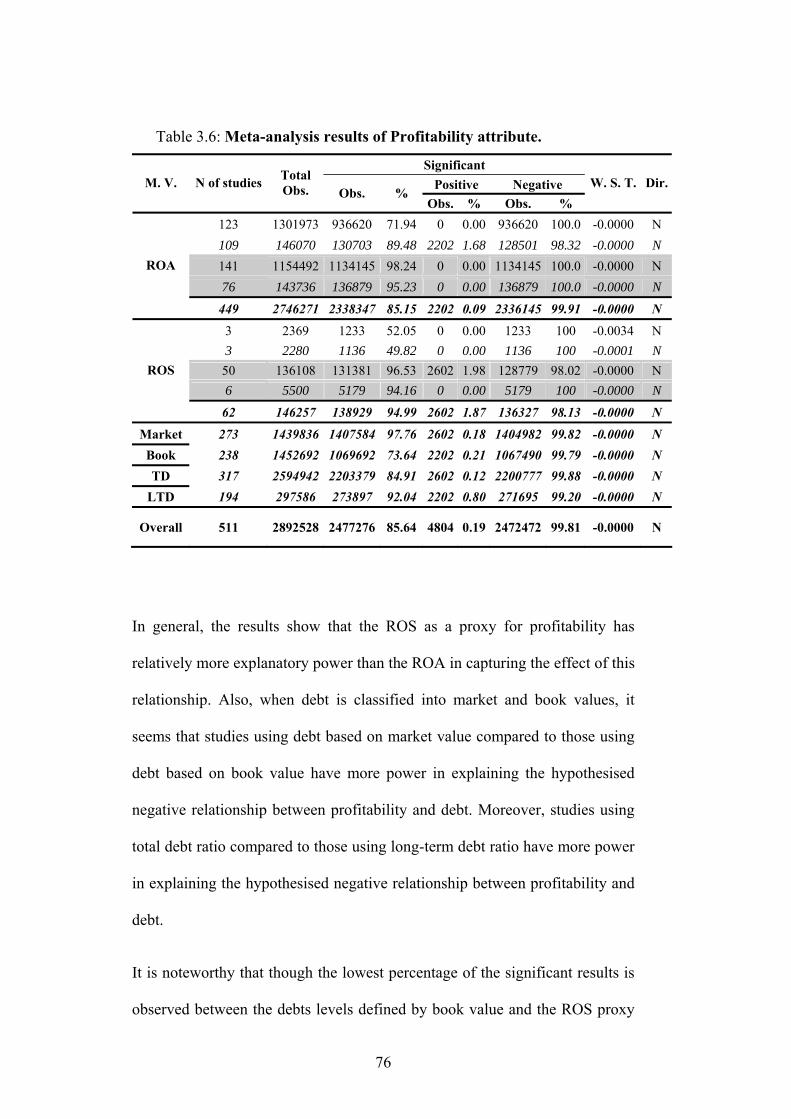
76
In general, the results show that the ROS as a proxy for profitability has
relatively more explanatory power than the ROA in capturing the effect of this
relationship. Also, when debt is classified into market and book values, it
seems that studies using debt based on market value compared to those using
debt based on book value have more power in explaining the hypothesised
negative relationship between profitability and debt. Moreover, studies using
total debt ratio compared to those using long-term debt ratio have more power
in explaining the hypothesised negative relationship between profitability and
debt.
It is noteworthy that though the lowest percentage of the significant results is
observed between the debts levels defined by book value and the ROS proxy
Table 3.6: Meta-analysis results of Profitability attribute.
Significant Positive Negative M. V. N of studies Total
Obs. Obs. % Obs. % Obs. %
W. S. T. Dir.
123 1301973 936620 71.94 0 0.00 936620 100.0 -0.0000 N 109 146070 130703 89.48 2202 1.68 128501 98.32 -0.0000 N 141 1154492 1134145 98.24 0 0.00 1134145 100.0 -0.0000 N 76 143736 136879 95.23 0 0.00 136879 100.0 -0.0000 N
ROA
449 2746271 2338347 85.15 2202 0.09 2336145 99.91 -0.0000 N 3 2369 1233 52.05 0 0.00 1233 100 -0.0034 N 3 2280 1136 49.82 0 0.00 1136 100 -0.0001 N
50 136108 131381 96.53 2602 1.98 128779 98.02 -0.0000 N 6 5500 5179 94.16 0 0.00 5179 100 -0.0000 N
ROS
62 146257 138929 94.99 2602 1.87 136327 98.13 -0.0000 N
Market 273 1439836 1407584 97.76 2602 0.18 1404982 99.82 -0.0000 N Book 238 1452692 1069692 73.64 2202 0.21 1067490 99.79 -0.0000 N TD 317 2594942 2203379 84.91 2602 0.12 2200777 99.88 -0.0000 N
LTD 194 297586 273897 92.04 2202 0.80 271695 99.20 -0.0000 N
Overall 511 2892528 2477276 85.64 4804 0.19 2472472 99.81 -0.0000 N
77
(about half), the weighted Stouffer test still produces a significant negative
relationship at 1% level of significance. For total debt (row 6), the observed
highly significant result is due to two of the three studies with sample sizes of
558 and 675 observations showing significant negative relationship with Z
values (–3.28) and (-4.77) respectively. The third study, with sample size of
1136, shows an insignificant positive relationship with Z value (1.02). Since
the weighted Stouffer procedure includes associated Z values in the
calculation process, multiplying the Z value by the degree of freedom
associated with each study produce overall negative results and highly
significant (-0.0034). In the long-term debt ratio (row 7), however, the
observed highly significant results seems to be driven by the results of all the
three studies included in the sample as they all show negative direction.
However, the study with the largest sample (1136 observations) is found
highly significant with Z value (-3.29) and the other two studies with samples
of (469 and 675 observations) are insignificant with Z values (-0.90 and –1.42
respectively).
In summary, consistent with the pecking order hypothesis, both the overall
and the moderator variables results reveal that profitability has strong negative
influence on leverage. This in turn provides strong support to the pecking
order hypothesis but contradicts trade off theory.
3.3.4 Risk
The theoretical literature suggests an inverse relationship between debt ratios
and risk. To capture the influence of risk on debt levels, most empirical
studies use firm’s earnings volatility but a few uses the systematic risk of the

78
firms (β). Table 3.7 (final row) shows that 67.08% of the total results are
significant of which 85.27% is negative and significant at 1%. This suggests
that the overall relationship between risk and debt levels seems to be a
moderate negative relationship but the weighted Stouffer test shows that the
overall direction of this relation is significantly negative.
It seems that the relatively low percentage of significant results observed in
earnings volatility proxies (66.53%) reduce the overall explanatory power of
risk attribute. However, conclusion about the low percentage of significance
results observed in this proxy is ambiguous. The table shows that the
influence of the moderator variables is very strong in this particular
relationship. While only 10 studies employed firm’s β as a proxy for risk, the
explanatory power of this proxy in capturing the influence of risk on leverage
is apparently higher than earnings variability proxy.
Table 3.7: Meta-analysis results of risk attribute.
Significant Positive Negative M. V. N of studies Total
Obs. Obs. % Obs. % Obs. %
W. S. T. Dir.
54 217096 125812 57.95 11734 9.33 114078 90.67 -0.0000 N 85 48829 17624 36.09 7158 40.62 10466 59.38 -0.0254 N 36 296709 235248 79.29 37453 15.92 197795 84.08 -0.0000 N 78 35064 18986 54.15 3035 15.99 15951 84.01 -0.0000 N
Earnings Volatility
253 597698 397670 66.53 59380 14.93 338290 85.07 -0.0000 N 3 2177 1932 88.75 0 0.00 1932 100 -0.0000 N 3 2560 1449 56.60 0 0.00 1449 100.00 -0.0001 N 2 2691 2691 100 0 0.00 2691 100.00 -0.0000 N 2 6654 6654 100 1056 15.87 5598 84.13 -0.0000 N
β
10 14082 12726 90.37 1056 8.30 11670 91.70 -0.0000 N
Market 118 341118 263579 77.27 41544 15.76 222035 84.24 -0.0000 N Book 145 270662 146817 54.24 18892 12.87 127925 87.13 -0.0000 N TD 95 518673 365683 70.50 49187 13.45 316496 86.55 -0.0000 N
LTD 168 93107 44713 48.02 11249 25.16 33464 74.84 -0.0000 N
Overall 262 611780 410396 67.08 60436 14.73 349960 85.27 -0.0000 N

79
Moreover, though both of them have high weighted Stouffer test significant
level (1%), the results show that debt based on book value (row 12) with
87.13% percentage of significance and total debt ratio (row 13) with 86.55%
percentage of significance has more power in explaining the hypothesised
negative relationship than debt based on market value (row 11) with 84.24%
and long-term debt ratio (row 14) with 74.84% respectively. Apparently, these
results are mainly driven by the results of total debt ratio based on book value
in earnings variability proxy. The percentage of significance observed in long-
term debt ratio based on book value in earnings variability proxy (row 2) with
only 36.09% also seem to drive overall of the percentage of significance
(48.02%) of long-term debt ratio (row 14).
As observed in assets proxy as measure of size, it seems the observed
moderate significant weighted Stouffer test (0.0245) that is associated with
low percentage of significance (36.09%) in long-term debt ratio based on
book value is driven by that more than half of the studies (i.e. 49 studies with
total 30347 observations), which in turn constitutes about 60% of the total
sample observations, show negative direction regardless to significant level.
In summary, consistent with theory, the weighted Stouffer tests show that risk
is significantly inversely correlated with debt ratios. However, it is found that
the strength of this inverse relationship is varying among the hypothesised
moderator variables in which firm’s (β) as proxy for risk has the highest
power in explaining this relationship.

80
3.3.5 Tax
Since there are two main arguments regarding tax issue, the finding of
previous work associated with each argument is investigated separately.
3.3.5.1 Effective tax rate
Theoretically, a positive relationship between effective tax rate and debt ratio
is expected due to interest deductibility. Generally, the effective tax rate (tax
charge / profit before tax) is used to capture this relationship. The overall
percentage of significance demonstrates that the relationship between tax rate
and debt levels seems to be an undetermined relationship mainly due to the
split in the significant results between the positive and the negative direction
as will as the relatively high percentage of insignificant results observed.
Moreover, weighted Stouffer test show that the overall direction of this
relation is positive but insignificant. Error! Reference source not found.
(final row) shows that 66.33% of the total observations are significant of
which is 45.22% positive and 54.78% is negative. This result combined with
associated insignificant meta-analysis results provides support to Graham et al
(1998) argument that corporate tax is endogenous to financing decisions,
which induce a spurious association between debt ratios and MTR. According
to Graham et al’s argument, studies that found positive relationship suggests
that these studies use after financing ‘ marginal tax rate while studies that
found negative relationship suggests that these studies include the interest
expense in the marginal tax rate computation.

81
The moderator variables also show conflicting results. The suggested positive
relationship is only found significantly with debt based on market value and
insignificantly with total debt. On the other hand, the debt based on book
value and long-term debt results both show significantly an inverse
relationship.
In summary, both the weighted Stouffer tests and the percentage of
significance of overall and the moderator variables results show insignificant
and conflicting results. These, in turn, raise the concern about the importance
of the tax benefits of debt as determinant of capital structure.
3.3.6 NDTS
Theoretically, non-debt tax shields substitute for the tax benefits of debt and,
thus, an inverse relationship is expected between NDTS and leverage.
Empirically, the overall association between NDTS and leverage seems to be
a moderate negative relationship. Table 3.9 (final row) shows that about
Table 3.8: Meta-analysis results of Effective tax rate.
Significant Positive Negative M.V. N of
studies Total Obs. Obs. %
Obs. % Obs. % W. S. T. Dir.
38 343629 244917 71.27 18706 7.64 226211 92.36 -0.0000 N 68 102610 58049 56.57 3049 5.25 55000 94.75 -0.0000 N 23 307009 224682 73.18 214851 95.62 9831 4.37 0.0000 P 61 64094 14704 22.94 8662 58.91 6042 41.09 0.2494 Ins. P
Effective Tax rate
190 817342 542352 66.33 245268 45.22 297084 54.78 0.4951 Ins. P
Market 84 371103 239386 64.51 223513 93.37 15873 6.63 0.0000 P Book 106 446239 302966 67.89 21755 7.18 281211 92.82 -0.0000 N TD 61 650638 469599 72.18 233557 49.74 236042 50.26 0.1495 Ins. P
LTD 129 166704 72753 43.64 11711 16.10 61042 83.90 -0.0000 N Overall 190 817342 542352 66.33 245268 45.22 297084 54.78 0.4951 Ins. P

82
86.71% of the total results are significant of which is 75.71% negative and
24.29% is positive. Moreover, the weighted Stouffer test shows that the
overall direction of this relation is significantly negative.
Table 3.9: Meta-analysis results of NDTS.
Significant Positive Negative M.V. N of
studies Total Obs. Obs. %
Obs. % Obs. % W. S. T. Dir.
46 360453 285922 79.32 175832 61.50 110090 38.50 0.0146 P 28 47627 39037 81.96 2032 5.21 37005 94.79 -0.0000 N 38 438305 405542 92.53 20251 4.99 385291 92.53 -0.0000 N 38 141250 125907 89.14 9942 7.90 115965 92.10 -0.0000 N
NDTS
150 987635 856408 86.71 208057 24.29 648351 75.71 -0.0000 N
Market 76 579555 531449 91.70 30193 5.68 501256 94.32 -0.0000 N Book 74 408080 324959 79.63 177864 54.73 147095 45.27 0.2474 Ins. PTD 84 798758 691464 86.57 196083 28.36 495381 71.64 -0.0000 N
LTD 66 188877 164944 87.33 11974 7.26 152970 92.74 -0.0000 N
Overall 150 987635 856408 86.71 208057 24.29 648351 75.71 -0.0000 N
The moderator variables, however, show conflicting results, in particular, the
debt’s based value definition. While the suggested negative relationship is
significantly observed with market based-value debt (row 6), an insignificant
positive relationship is found when debt is defined based on book value (row
7). This results is mainly driven by the significant positive relationship exists
between NDTS and book based total debt. On the other hand, the second

83
moderator variable results, measurement of debt ratio, show that both total
debt and long-term have significant negative association with NDTS.
In summary, the overall results of weighted Stouffer tests reveal that NDTS is
significantly negatively correlated with debt ratio. However, driven by the
variation and sometimes conflicting results observed in the hypothesised
moderating variables, the percentage of significance results show that the
strength of this relationship is moderate negative.
3.3.7 Growth
Both the trade-off and the pecking order hypothesis suggest a negative
relationship between growth and debt. Commonly, the market to book ratio is
used to proxy for growth opportunities. To a lesser extent, growth in sales and
growth in assets are also used to capture the effect of growth on leverage.
However, as observed in earnings volatility, the time period used in these two
proxies to capture the effect of growth vary among studies included in the
sample, which is not considered here. Accordingly, the conflicting results
obtained by these proxies also should be interpreted with caution.
Consistent with agency theory, the overall association between growth and
leverage seems to be strong negative relationship. Table 3.10 (final row)
shows that about 80% of the total results are significant of which is 92.82%
negative and 7.18% is positive. Moreover, weighted Stouffer test show that
the overall direction of this relation is significantly negative. However, the
result suggests that the type of proxy used has a moderating effect on growth
and leverage relationship. Indeed, the overall results of the relationship
between market-to-book ratio and debt (row 15) show strong significant

84
negative relationship. However, the variation in the strength of this negative
relationship is observed among the hypothesised moderating variables in
which the relationship is found negative but insignificant in book-based long-
term debt. The split in the significant results between positive and negative
directions seems to be the reason of obtaining insignificant weighted Stouffer
test.
For growth in assets and growth in sales proxies, the table shows conflicting
results. It is found that growth in assets (row 10) demonstrates overall
Table 3.10: Meta-analysis results of growth attribute.
Significant Positive Negative M. V. N of
studies Total Obs. Obs. %
Obs. % Obs. % W. S. T. Dir.
34 128742 47121 36.60 30808 65.38 16313 34.62 0.0262 P 25 45475 11753 25.84 10268 87.36 1485 12.64 0.0000 P 3 1563 951 60.84 764 80.34 187 19.66 0.0006 P 1 5598 5598 100 0 0.00 5598 100.00 Na N
Sales
63 181378 65423 36.07 41840 63.95 23583 36.05 0.0001 P 20 58836 46068 78.30 13546 29.40 32522 70.60 -0.0019 N 15 15600 8564 54.90 7889 92.12 675 7.88 0.0000 P 15 20964 12631 60.25 3009 23.82 9622 76.18 -0.0432 N 10 7032 5632 80.09 3443 61.13 2189 38.87 0.0768 P
Assets
60 102432 72895 71.16 27887 38.26 45008 61.74 -0.0000 N 72 733660 610793 83.25 52848 8.65 557945 91.35 -0.0000 N 71 70675 23497 33.25 11008 46.85 12489 53.15 -0.3246 Ins. N
133 1088911 961268 88.28 0 0.00 961268 100 -0.0000 N 74 140358 127208 90.63 0 0.00 127208 100 -0.0000 N
M/B
350 2033604 1722766 84.71 63856 3.71 1658910 96.29 -0.0000 N
Market 236 1264426 1113288 88.05 7216 0.65 1106072 99.35 -0.0000 N Book 237 1052988 7477778 71.01 126367 16.90 621429 83.10 -0.0000 N TD 277 2032676 1678832 82.59 100975 6.01 1577857 93.99 -0.0000 N
LTD 196 284738 182234 64.00 32608 17.89 149644 82.12 -0.0352 N
Overall 473 2317414 1861066 80.31 133583 7.18 1727501 92.82 -0.0000 N

85
moderate percentage of significance (71.16%) with relatively weak negative
percentage of significance (61.74%) relationship but high significant weighted
Stouffer test (1%). The significant positive relationship observed with long-
term debt ratios, which contradict the negative association between growth
and long term-debt hypothesised by agency theory, appears to be the reason of
observing such semi weak negative results. On the other hand, it is found that
growth in sales (row 5) demonstrates a relatively weak positive percentage of
significance (63.97%) and significant weighted Stouffer test at 1% level
though overall very weak percentage of significance (36.06%) relationship is
observed. It seems the observed high significant weighted Stouffer test
(0.0001) that is associated with low percentage of significance (36.06%) in
overall relationship between growth in sales and debt is driven by that more
than half of the studies (i.e. 36 studies with total 130009 observations), which
in turn constitutes about 72% of the total sample observations, show positive
direction regardless to significant level.
Moreover, the other suggested moderator variables provide support to the
hypothesised inverse relationship but with variation in strength of which the
explanatory power of market based-value debt is better than of book based-
value debt and total debt is out perform long-term debt. Clearly, these findings
are mainly driven by the significant positive relationship observed in the
growth of sales and assets and to less extent by the insignificant negative
relationship found between book-based long-term debt and market-to-book
ratio.

86
In summary, overall relationship reveals a strong negative relationship exists
between growth and leverage, which is consistent with the prediction of
agency theory. However, the differences in growth proxies used seem to have
a moderating effect on this relationship in which conflicting results among
these proxies were observed. The other moderator variables, on the other
hand, show constantly the expected negative relationship but with variation in
the strength.
3.3.8 Uniqueness
According to Titman’s (1984) argument, firms producing unique products
would use less debt. Generally, Research & Development (R&D) and Selling
& Administration (S&A) expenses are used as proxies for uniqueness.
Empirically, the overall percentage of significance demonstrates that a strong
relationship exists between uniqueness and leverage. Table 3.11 (final row)
shows that weighted Stouffer test show the overall direction of this relation is
significantly negative which is consistent with the prediction of Titman’s
arguments.

87
Table 3.11: Meta-analysis results of uniqueness attribute.
Significant Positive Negative M. V. N of studies Total
Obs. Obs. % Obs. % Obs. %
W. S. T. Dir.
27 390417 368812 94.47 10800 2.93 358012 97.07 -0.0000 N 14 24676 14449 58.55 10800 74.75 3649 25.25 0.0280 P 9 339575 339349 99.93 0 0.00 339349 100.0 -0.0000 N
16 123687 118900 96.13 968 0.81 117932 99.19 -0.0000 N R&D
66 878355 841510 95.81 22568 2.68 818942 97.32 -0.0000 N
8 342963 314065 91.57 1747 0.56 312318 99.44 -0.0000 N 6 7082 7082 100 3075 43.42 4007 56.58 -0.0895 N
14 365219 362397 99.23 1021 0.28 361376 99.72 -0.0000 N Na Na Na Na Na Na Na Na Na Na
S&A Exp.
28 715264 683544 95.57 5843 0.85 677701 99.15 -0.0000 N
Market 39 828481 820646 99.05 1989 0.24 818657 99.76 -0.0000 N Book 55 765138 704408 92.06 26422 3.75 677986 96.25 -0.0000 N TD 58 1438174 1384623 96.28 13568 0.98 1371055 99.02 -0.0000 N
LTD 36 155445 140431 90.34 14843 10.57 125588 89.43 -0.0000 N
Overall 94 1593619 1525054 95.70 28411 1.86 1496643 98.14 -0.0000 N

88
The moderator variables results also provide support to the negative influence
of uniqueness on leverage though both significant positive and weak
significant negative relationship are observed in the relationship of book
based-value long-term debt with R&D and S&A proxies respectively.
It is noteworthy these results also provide support to the hypothesised
negative relationship between debt and both NDTS and growth opportunities
attributes that are discussed earlier. On one hand, the above observed negative
relationship is consistent with NDTS argument since R&D and S&A are
considered other tax shields like depreciation. On the other hand, if R&D and
S&A are considered as intangible assets that add value to the firm but cannot
be collateralised, then the above negative relationship is also lending support
to growth opportunities argument.
In summary, both the overall and the moderator variables results reveal that
uniqueness has a strong negative influence on leverage, which is consistent
with Titman’s (1984) argument. Moreover, this finding also lends support to
the hypothesised negative relationship between debt and both NDTS and
growth opportunities attributes.
3.3.9 Dividend
There is no consistent theoretical prediction on the influence of dividends on
firm’s capital structure. Dividend payout and to less extent dividend yield are
used in prior studies to capture the impact of dividends on the firm’s capital
structure. The overall percentage of significance demonstrates that a strong
relationship exists between dividends and leverage. However, contradictory to

89
the prediction of pecking order hypothesis, weighted Stouffer test show the
overall direction of this relation is significantly negative. Table 3.12 (final
row) shows that about 98% of the total results are significant of which is
93.13% negative and 6.87% is positive.
Table 3.12: Meta-analysis results of dividends attribute.
Significant Positive Negative M. V. N of studies Total
Obs. Obs. % Obs. % Obs. %
W. S. T. Dir.
18 382822 379306 99.08 45175 11.91 334131 88.09 -0.0000 N 10 15992 14265 89.20 371 2.60 13894 97.40 -0.0000 N 11 368068 364559 99.05 1243 0.34 363316 99.66 -0.0000 N 6 14255 9196 64.51 2490 27.08 6706 72.92 -0.0006 N
Dividends payout
45 781137 767326 98.23 49279 6.42 718047 93.58 -0.0000 N
1 245 245 100 245 100 0 0.00 Na P 1 55 55 100 0 0.00 55 100 Na N
Na Na Na Na Na Na Na Na Na Na 6 7128 3476 48.77 3476 100 0 0.00 0.0000 P
Dividends yield
8 7428 3776 50.83 3721 98.54 55 1.46 0.0000 P
Market 23 389451 377231 96.86 7209 1.91 370022 98.09 -0.0000 N Book 30 399114 393871 98.69 45791 11.63 348080 88.37 -0.0000 N TD 30 751135 744110 99.06 46663 6.27 697447 93.73 -0.0000 N
LTD 23 37430 26992 72.11 6337 23.48 20655 76.52 -0.0000 N Overall 53 788565 771102 97.79 53000 6.87 718102 93.13 -0.0000 N
As the number of studies that are employing dividend yield as proxy for
dividends attribute is limited (8 studies), it is unreliable to compare its results
with dividend payout ratio results and draw a fair conclusion. However, the
overall results of the dividend yield proxy suggest a positive influence on debt
ratio, which is consistent with pecking order hypothesis. On the other hand,
the dividend payout proxy results show overall strong significant negative

90
correlation debt but with some variation in the strength of the relationship
among debt measures and definitions with the relationship in the market-
based long-term debt being the lowest.
The suggested moderator variables based on debt measurements and
definitions provide support to the hypothesised inverse relationship but with
some variation in the strength of which the explanatory power of book based-
value debt is relatively better market based-value debt and total debt is
considerably out perform long-term debt.
In summary, the overall relationship reveals a strong negative relationship
exists between dividends and leverage. However, the moderator variables
based on debt measurements and definitions show constantly the expected
negative relationship but with variation in the strength. These results,
therefore, are inconsistent with pecking order hypothesis. Although limited
numbers of studies are using it, dividend yield, as proxy for dividends, seems
to be positively correlated with debt ratio, which in turn lends some support to
pecking order hypothesis.
3.3.10 Free cash flow
Again, there is no consistent theoretical prediction on the influence of free
cash flow on firm’s capital structure. Empirically, the overall percentage of
significance demonstrates a strong relationship exists between free cash flow
and leverage. However, weighted Stouffer test show that the overall direction
of this relationship is significant negative relationship. Table 3.13 (final row)
shows that about 85.4% of the total sample is significant. However, 78.5% of
the significant results are negative and significant at the 1% level.

91
Table 3.13: Meta-analysis results of free cash flow attribute.
Significant Positive Negative M. V. N of studies Total
Obs. Obs. % Obs. % Obs. %
W. S. T. Dir.
7 21633 21465 99.22 6325 29.47 15140 70.53 -0.0097 N 5 8340 6821 81.79 6231 91.35 590 8.65 0.0017 P
16 37252 34405 92.36 92 0.27 34313 99.73 -0.0000 N 9 10333 3568 34.53 1584 44.39 1984 55.61 -0.0861 N
Free cash flow
37 77558 66259 85.43 14232 21.48 52027 78.52 -0.0000 N
Market 25 47585 37973 79.80 1676 4.41 36297 95.59 -0.0000 N Book 12 29973 28286 94.37 12556 44.39 15730 55.61 -0.0159 N TD 23 58885 55870 94.88 6417 11.49 49453 88.51 -0.0000 N
LTD 14 18673 10389 55.64 7815 75.22 2574 24.78 0.0286 P
Overall 37 77558 66259 85.43 14232 21.48 52027 78.52 -0.0000 N
The moderator variable analysis shows conflicting results. Based on
measurement of debt, a significant negative relationship is obtained by using
total debt while a significant positive association is observed by employing
long-tem debt. On the other hand, the results of based-value moderator
variable reveals an inverse relationship but with variation in strength. The
explanatory power of the debt market based-value appears to be higher than of
the debt book based-value due to the split in the significant results between
positive and negative direction in the debt book based-value.
In summary, the overall relationship reveals a moderate negative relationship,
which lends a moderate support to pecking order hypothesis. However, the
findings of the moderator variables show conflicting results in specific debt-
measurement moderator variable.

92
3.3.11 Liquidity
Theoretically, the influence of liquidity on firm’s capital structure is expected
to be negative. The current ratio is commonly used to capture the effect of
liquidity on leverage. Empirically, Table 3.14 (column 5) weighted Stouffer
test produces high significant negative relationship between liquidity and
leverage though the overall percentage of significant results associated with
this relationship seems to be relatively weak.
Table 3.14: Meta-analysis results of liquidity attribute. Significant
Positive Negative M. V. N of studies TotalObs. Obs. %
Obs. % Obs. % W. S. T. Dir.
13 58400 37189 63.68 0 0.00 37189 100.0 -0.0000 N 51 17066 12168 71.30 423 3.48 11745 96.52 -0.0000 N Na Na Na Na Na Na Na Na Na Na 55 15253 9540 62.55 97 1.02 9443 98.98 -0.0000 N
Current ratio
119 90719 58897 64.92 520 0.88 58377 99.12 -0.0000 N Market 55 15253 9540 62.55 97 1.02 9443 98.98 -0.0000 N Book 64 75466 49357 65.40 423 0.86 48934 99.14 -0.0000 N TD 13 58400 37189 63.68 0 0.00 37189 100 -0.0000 N
LTD 106 32319 21708 67.17 520 2.40 21188 97.60 -0.0000 N Overall 119 90719 58897 64.92 520 0.88 58377 99.12 -0.0000 N
The final row shows that about 65% of the total sample is significant.
However, 99.12% of the significant results are negative and only 0.88% is
positive.
Moreover, meta-analysis results show that this negative relationship is
significant at the 1% level. Similarly, the moderator variable analysis shows
consistent negative direction and significant at the 1% level.

93
In summary, both the overall and the moderator variables results show a
relatively weak negative relationship exists between liquidity and leverage.
This, in turn, lends support to the pecking order hypothesis.
3.3.12 Age
Theoretically, the influence of age on firm’s capital structure is also
ambiguous. Usually, the number of years since the firm’s foundation is the
proxy used to capture the effect of age on leverage. Empirically, the overall
percentage of significance demonstrates a strong relationship. Moreover,
weighted Stouffer test produce overall high significant positive relationship
between age and leverage. Table 3.15 (final row) shows that about 94% of the
total sample is significant of which 76.84% of the significant results are
positive and significant at the 1% level.
Table 3.15: Meta-analysis results of age attribute.
Significant Positive Negative M. V. N of
studies Total Obs. Obs. %
Obs. % Obs. % W. S. T. Dir.
19 477232 448876 94.06 357809 79.71 91067 20.29 0.0000 P 12 22902 19190 85.98 500 2.54 18690 97.46 -0.0000 N 5 6045 5775 95.53 5775 100.0 0 0.00 0.0000 P
Na Na Na Na Na Na Na Na Na Na
# Of years since
established
36 506179 473841 93.61 364084 76.84 109757 23.16 0.0000 P
Market 5 6045 5775 95.53 5775 100.0 0 0.00 0.0000 P Book 31 500134 468066 93.59 358309 76.55 109757 23.45 0.0000 P TD 24 483277 454651 94.08 363584 79.97 91067 20.03 0.0000 P
LTD 12 22902 19190 85.98 500 2.54 18690 97.46 -0.0000 N
Overall 36 506179 473841 93.61 364084 76.84 109757 23.16 0.0000 P

94
However, the moderator variable analysis shows conflicting results. Based on
measurement of debt, a significant positive relationship is obtained with total
debt (row 8) while a significant negative association is observed with long-
tem debt (row 9). On the other hand, the results of based-value moderator
variable reveals a positive relationship with the explanatory power of the debt
market based-value being higher than of that of debt book based-value.
In summary, overall relationship reveals a moderate positive relationship
exists between age and leverage. However, the findings of the moderator
variables show conflicting results in specific debt-measurement moderator
variable.
3.3.13 Government
Similar to some of the above determinants, there is no consistent theoretical
prediction on the impact of the government as a large shareholder on leverage.
Studies included in the sample are mostly using dummy variable to capture
the effect of the existence of government as a shareholder on firm’s capital
structure. However, one study uses the actual percentage of outstanding shares
held by the government as proxy of this attribute. Therefore, such differences
are not considered in this analysis as both proxies are potentially using the
same data as well as only one study is using the actual percentage.
Empirically, the weighted Stouffer test produces high significant negative
relationship between government and leverage though the overall percentage
of significance associated with this relationship seems to be relatively weak.
Table 3.16 (final row) shows that about 64.88% of the total sample is
significant of which 89.34% are negative and significant at the 1% level.

95
Table 3.16: Meta-analysis results of government attribute.
Significant Positive Negative M. V. N of studies Total
Obs. Obs. % Obs. % Obs. %
W. S. T. Dir.
10 23254 19486 83.80 2570 13.19 16916 86.81 -0.0000 N 7 10483 6985 66.63 0 0.00 6985 100.0 -0.0000 N 6 4024 281 6.98 281 100 0 0.00 -0.4554 N 4 3473 0 0.00 0 0.00 0 0.00 -0.2295 N
Shares held by
Government
27 41234 26752 64.88 2851 10.66 23901 89.34 -0.0000 N
Market 10 7497 281 3.75 281 100 0 0.00 -0.2784 N Book 17 33737 26471 78.46 2570 9.71 23901 90.29 -0.0000 N TD 16 27278 19767 72.46 2851 14.42 16916 85.58 -0.0000 N
LTD 11 13956 6985 50.05 0 0.00 6985 100.0 -0.0000 N Overall 27 41234 26752 64.88 2851 10.66 23901 89.34 -0.0000 N
The analysis reveals that the results of both long-term and total debt ratios
based on market value appears to be responsible of observing the weak
percentage of significance as they show considerably low percentage of
significance and insignificant weighted Stouffer results. Moreover, it seems
that studies using total debt ratio compared to those using long-term debt ratio
have higher percentage of significance but lower negative percentage level.
Nevertheless, this observed negative results contradict signalling theory
argued by Leland and Pyle (1977) and part of agency theory, in particular,
conflicts between management and shareholders (debt benefits) argued by
Jensen (1986). The results, however, are lending support to the other part of
agency theory, in particular, conflicts between shareholders and lenders (debt
costs) argued by Myers (1977).
In summary, both the overall and the moderator variables results confirm a
weak negative relationship exists between government attribute and leverage.

96
3.4 Conclusion
This chapter presented an alternative methodology that overcomes the
deficiency of the traditional narrative reviews. Given the large number of
empirical studies, a meta-analysis procedure seems to be an appropriate
technique for synthesising scientifically the finding of these studies since it
has proved its value in other areas. It is found that tax, growth, uniqueness,
dividends, risk, free cash flow, liquidity, government and age attributes appear
to be very sensitive to measurement of both leverage and the explanatory
variables. On the other hand, the analysis shows that size, tangibility, and
profitability have consistent direction and strong relationship regardless to the
measurement issue
Based on the theoretical and empirical evidence discussed in the previous and
current chapters, this dissertation is intended to extend previous research by
providing fresh evidence about the determinant of listed and unlisted
companies in Saudi Arabia, a country in which culture and institutional
factors are different from those in which the theories were developed. This, in
turn, will provide further evidence on the significance of institutional
differences that are argued to have an impact on capital structure
determinants.

97
Chapter 4: The Environment within Saudi Framework

98
4.1 Introduction
Previous cross-country studies have asserted that institutional arrangements
are significant determinants of capital structure. Rajan and Zingales (1995)
examined whether the capital structure in the G-7 countries is related to
factors similar to those that influence the capital structure of US firms. They
found that although firms have a fairly similar capital structure across the G-7
countries, there were several institutional characteristics that affect capital
structure choice. Booth et al. (2001) investigated whether capital structure
theory is portable across the developing countries with different institutional
structures. They found that although debt ratios appeared to be affected by the
same variables as in developed countries, there were systematic differences in
way these ratios were affected by country factors. Barakat and Rao (2004)
investigated the role of taxes in the capital structure of 12 Arab countries.
They obtained empirical results that support the significance of the
institutional differences on capital structure decisions. Recently, De Jong et al.
(2007) investigate the importance of firm-specific and country-specific factors
in explaining the leverage choice of firms from 42 countries around the world.
They found that legal environment and economic conditions affect directly
and indirectly the country’s firm financing choice.
In summary, all these studies have demonstrated the significant influence of
the institutional characteristics on financing decision of the firm. Saudi Arabia
is an Arab Islamic country. Officially, it is governed by the Islamic Law
(Shari’ah), which is derived from the holy book of Islam (Qur’an) and the
prophetic guidance (Sunnah). Therefore, the country has some socio-cultural

99
and economic implications that may affect capital structure choice. The aim of
this chapter is to describe in details the institutional characteristics and socio-
cultural factors that are expected to have influence on the determinants of the
capital structure of Saudi companies.
4.2 Central bank
According to Saudi Arabia Monetary Agency (SAMA) official web sit
(www.sama.gov.sa), the top of Saudi Arabia’s financial system is SAMA, the
central bank of the Kingdom of Saudi Arabia. Since Its establishment in 1952,
SAMA’s functions as defined by its charter issued in 1952 and amended in
1957 include the following:
Issuing and strengthening the Saudi currency and stabilising its internal and
external value;
Dealing with the banking affairs of the government; and
Regulating commercial banks.
The monetary policy in Saudi Arabia is set to maintain a stable financial
environment in terms of low inflation and a fixed exchange rate. To this end
the Saudi Riyal (SAR) has been effectively pegged to the American Dollar at
SAR 3.75 per U.S. Dollar since 1986. Beside vast state revenues from oil,
SAMA’s close monitoring of the exchange rate of Riyal has contributed to
maintaining the stability of this rate. Exchange rate stability constitutes an
intermediate target of the monetary policy of the Kingdom for achieving the
ultimate goal of preserving domestic price stability.

100
In order to achieve the ultimate goal for its monetary policy, SAMA uses a
range of traditional and modern monetary instruments. These include the
statutory reserve requirement on bank deposits, liquidity ratio, and deposit
limits, prudent restrictions on advances and loans, government development
bonds, treasury bills and floating rate notes and foreign exchange swap
transactions. The Kingdom’s monetary policy has succeeded remarkably in
maintaining the stability of the Riyal’s exchange rate and domestic prices over
a prolonged period of time. As mentioned earlier, Riyal’s parity with the U.S.
dollar has remained unchanged since 1986, and the inflation has recorded an
average rise of only 0.1 percent over the last 20 years (Al-Sayari, 2003).
As set out in its charter, SAMA’s main objectives include supervision of
commercial banks. The Banking Control Law was issued in 1966 under a
royal decree. This legislation has vested SAMA with large powers to carry out
actions believed appropriate to maintain the consistency of commercial banks
and ensure their financial solvency. According to SAMA Governor, SAMA
supervises commercial banks in accordance with the latest internationally
applied standards and practices, such as the Basel Committee’s Core
Principles of Effective Banking Supervision, International Accounting
Standards (IAS), the best practices of disclosure, and recommendations of the
Financial Action Task Force (FATF).
To facilitate its monitoring and supervision procedures, SAMA, in
cooperation with commercial banks, has introduced advanced and
comprehensive electronic payment systems. These include the Automated
Check Clearing Houses, the Saudi Payments Network (SPAN), Points of Sale

101
(POS) terminals, the Saudi Arabian Riyal Interbank Express (SARIE).
Moreover, SAMA introduced the Electronic Share Information System (ESIS)
that has been replaced by a more comprehensive and modern system, called
(TADAWUL), to supervise and monitor the Saudi Stock Market (SSM).
4.3 Banking system
According to Saudi British Bank (2003), the history of banks in Saudi Arabia
backs to 1926 when the Dutch Trading Company (presently the foreign
partner of the Saudi Hollani Bank) was established as the first bank to operate
in the Kingdom. The Company operated through a representative office in
Jeddah to serve pilgrims arriving from Indonesia. The bank, as the only
financial institution operating in the Kingdom, played the role of a Central
Bank and acted as depository for the Kingdom’s gold reserves. The first oil
related operations were conducted through the bank. The second entry to the
banking sector came in 1948 with the French Indochine Bank setting up a
branch in Jeddah. The bank later merged with Suez Company to form the
Indo-Suez Bank, which is presently the foreign partner of Banque Saudi
Fransi.
Established in 1950, the National Commercial Bank (NCB) was the first
entirely Saudi bank in the kingdom. The bank operated as a partnership until
1997 when it was converted to a joint stock company. In 1999, the Public
Investment Fund (PIF) acquired a 70% stake in NCB and the General
Organization of Social Insurance (“GOSI”) acquired 10 percent, while a rich
family (Bin Mahfuze that is the founder of the bank) holds the remaining
shares. However, the shares of NCB are expected to be listed soon on the

102
Saudi stock market. The first bank to be established as a joint stock company
was Riyad Bank in 1957 with 43% of its shares being held by the government
through (PIF).
Mergers in the sector began in 1997 with the Saudi-Cairo Bank merger with
the Saudi United Bank. Later in 1999, the Saudi United Bank merged with the
SAMBA financial group8. Moreover, year 2005 witnessed the listed new
commercial Islamic bank (Bank Al Belad) as a result of the merger between
currency exchangers (owned by families) operating in the country.
The Saudi banks have significant weight in the Gulf and Middle East regions
in terms of their total assets. Table 4.1 shows that total assets of banks, on
average, constitutes 68.5% of the country GDP.
As can be seen from the table, the banks have been able to achieve excellent
growth rate in their assets over the period, with aggregate assets of the sector
reaching SAR 655.4 billions at the end of year 2004, which represents an
increase of 44.6% compared with 1999.
8 SAMBA is formerly Saudi American Bank, which is a joint venture between city bank (20%) and some Saudis rich families. However, in med of 2004, city bank sold its share to Saudi government represented by Saudi pension fund.
Table 4.1: Total Assets of Saudi Banks (in billion SAR) Year 2000 2001 2002 2003 2004
Total assets 453.3 472.4 508.2 545.2 655.4
As % Of GDP 64.1% 68.8% 71.9% 67.8% 69.8%
Source: Saudi Arabian Monetary Agency (www.SAMA.co.sa)

103
Currently, there are eleven banks in the Kingdom, of which ten are publicly
listed. Table 4.2 shows the equity stakes (percent share) and the size of Saudi
banks based on their total assets and total equities.
Based on total assets, the Saudi banks can be classified into three categories:
Large Banks: This group consists of all banks that have total assets and
equity greater than 10% of the total sector. This includes the National
Commercial Bank, SAMBA Financial Group, Riyad Bank and Al Rajhi
Banking & Investment Corp.
Medium Banks: This group consists of all banks that have total assets and
equity range from 5-10% of the total sector. This includes Bank Al Saudi Al
Table 4.2: Equity stakes and total assets & equity of banks as end of 2006
Bank Total Assets
(Millions SAR)
% Equity
(Millions SAR)
% GOV. J. S. Foreign Others
National Commercial Bank
(unlisted) 188,464 22% 23,999 21% 79.3% 0% 0% 20.7%
SAMBA Financial Group 124,015 14% 15,300 13% 43.9% 0% 0% 56.1%
Al Rajhi Banking & Investment Corp. 105,209 12% 20,179 17% 9.7% 0% 0% 90.3%
Riyad Bank 94,016 11% 11,992 10% 48.9% 0% 0% 51.1%
Banque Saudi Fransi 79,581 9% 9,405 8% 11.3% 0% 31.1% 57.6%
Arab National Bank 78,035 9% 7,980 7% 8.7% 0% 40% 51.3%
Saudi British Bank 77,189 9% 9,405 8% 8.6% 0% 40% 51.4%Saudi Hollandi
Bank 46,740 5% 4,258 4% 7.3% 0% 40% 52.7%
Saudi Investment Bank 40,845 5% 6,001 5% 35.9% 10% 7.5% 46.6%
Bank Al Jazira 15,713 2% 4,194 4% 0% 9% 5.8% 85.2%Bank Al Belad 11,281 1% 3,024 3% 0% 0% 0% 100%
Banking Sector 861,088 100% 115,737 100% 23% 2% 15% 60%
Source: Bakheet Investment Group (www.bakheetgroup.com)

104
Fransi, the Saudi British Bank, Arab National Bank, the Saudi Hollandi Bank
and Saudi Investment Bank.
Small Banks: This group consists of all banks that have total assets and
equity less than 5% of the total sector. This includes and Bank Al Jazira and
Bank Al Belad.
In general, the banking system appears to be concentrated. The top four banks
hold a significant share of the total banks assets with 59%. Moreover,
government ownership is relatively extensive, exceeding 30% in four banks
and reaching 79% in one bank. Foreign bank participation is mainly through
substantial equity positions as opposed to majority shareholdings. Four banks
have foreign equity stakes of 31% or more.
In Saudi Arabia, the banking system consists of both Islamic and conventional
banking systems. In general, all Saudi banks are involved in Shari’ah-
compliant finance, but with different strategies. Al-Rajhi Banking and
Investment Corporation and Bank Al Belad offer only Shari’ah-compliant
products with the first being the worlds largest in that sector (IMF Country
Report, 2006). In other banks, non-interest-bearing deposits are isolated from
interest-bearing deposits and are intermediated through Shari’ah-compliant
investments9. Moreover, all banks submit all new Shari’ah-compliant types of
transactions to internal Shari’ah advisory boards in order to check their
conformity with Islamic principles.
9 About 40 percent of deposits are non-interest-bearing, a key structural factor supporting the profitability of the banking sector (IMF Country Report, 2006).

105
The underlying principle of Islamic banks is that there can be no interest
charged on any transaction or service, as interest is considered usury and is
condemned by the Quran. The glorious Quran states: Those who devour usury
will not stand except as stands one whom the devil by his touch has driven to
madness. That is because they say: Trade is like usury: but Allah has
permitted trade and forbidden usury.... Allah will deprive usury of all
blessing, but will give increase for deeds of charity, for He loves not any
ungrateful sinner.... of your demand for usury, if you are indeed believers. If
you do it not, take notice of war from Allah and His messenger, but if you
repent you shall have your capital sums; deal not unjustly, and you shall not
be dealt with unjustly. And if the debtor is in difficulty, grant him time till it is
easy for him to repay. But if you remit it by way of charity, that is best for you
if you only knew. [Surah al Baqarah, verse 275-280].
However, interest is replaced by a share-out key determined in advance for a
share of risks and profits among the borrower, the bank, and the productive
capital (Barakat and Rao, 2004). There are a number of traditional shari’ah-
compliant financing products, which can be classified into two categories.
Following provides very brief review of these instruments.
A. Partnership Contracts
In tolerating profits as opposed to interest, Islamic finance allows partnership
contracts. There are two principal forms of partnership contracts in Islamic
finance that also employ the principles of profit/loss sharing. These are:
Mudaraba: This form of a contract is structured between the Rabb’ulmal (i.e.
supplier of capital) and the entrepreneur who services it. One party supplies

106
the capital to a second entrepreneurial party (mudarib) for the procession of
some trade on the condition that the resulting profits are distributed in
mutually agreed proportions while all capital loss is borne on the provider of
the capital. In case of loss, the entrepreneur bears the brunt of the opportunity
cost of time and labour.
Musharaka: The meaning of the Arabic word musharakah is derived from the
word sharikah meaning partnership. A musharakah contract is very similar to
the conventional sense of a partnership arrangement where the partners or
shareholders use their capital through a joint venture, Limited Partnership, to
generate a profit. However, profits or losses are split between the shareholders
according to some agreed-on pre-determined formula depending on the
investment ratio.
B. Exchange Contracts
Working capital financing is a keystone of every financial system. According
to shari’ah, extended lines of credit that bear interest are not allowed.
Consequently, other avenues of working capital financing are required and
these are found in exchange contracts. Unlike partnership contracts, these
types of contract do not entail partnership engagements.
Price deferred sale: there are two type of price differed sale contract, namely,
Murabaha and Bai’muajjal. In a Murabaha contracts, the buyer can seek for
Rabb’ulmal or money provider (e.g. bank) that finances the purchase of an
asset by buying it on behalf of her/him. Rabb’ulmal then adds a mark-up in its
sale price to its client who pays for it on a deferred basis. It is deemed
acceptable for good’s supplier to charge higher prices for deferred payments.

107
Such transactions are regarded as trades and not loans. Financing on such a
deferred payment basis is called Bai’muajjal.
Goods Deferred Sale (Bai’salam): A manufacturer seeks Bai’salam when
he/she seeks to finance the production of goods he is financing. This involves
the buyer to pay price in advance at a discount to the producer before the
delivery time. This form of contract is very similar to the Bankers’
Acceptance financing in the conventional banking system (Barakat and Rao,
2004).
Ijara: The meaning of the Arabic word Ijarah is rent. It is an Islamic form of
leasing. Here, the Rabb’ulmal (e.g. leasing company or bank) buys land,
machinery or equipment such as aircrafts and ships and leases it out under
instalment plans to end-users. As in Western leasing, there may be an option
to buy the goods built into the contracts. The rental rates of returns on the
contract can be both fixed and floating depending on the particular originator.
The share of Shari’ah-compliant banking services and products has grown
rapidly in recent years. To fill the gap, all Saudi commercial banks have
engaged in two main Sharia-compliant products namely, Bai’salam and
murabaha. At end-2003, Bai’salam constituted 46% of total Sharia-compliant
banking sector assets while murabaha transactions accounted for 31% (IMF
Country Report, 2006). However, most of the Shari’ah-compliant products are
at the individual level. According to Barakat and Rao (2004), the National
Commercial Bank of Saudi Arabia reported in 2002 that 95% of their business
was done with individuals to buy durable goods.

108
Generally, the banking sector in the Saudi Arabia is quite advanced and
supported by a modern and efficient payment and settlement infrastructure.
The capacity of sector to respond to macroeconomic shocks has been
considerably strengthened over the past decade. According to an IMF Country
Report (2006), the banking sector is robust to various credit, liquidity, and
interest rate events. However, despite the overall robustness of the banking
sector and its supporting infrastructure, the role of the banking sector in
financing the private sector and meeting its credit needs remains relatively
limited. Rajan and Zingales (1995) argue that a good measure to determine the
importance of the banking sector in financing firms is the ratio of bank claims
on the private sector to the gross domestic product (GDP). Table 4.3 shows
the total bank claims on the private sector from 2000 to 2004. On average,
bank claims on the private sector amount to only 28.5% of GDP, exceeding
30% in year 2004.
If compared to the international data found in Rajan and Zingales (1995), the
28.5% ratio is far below the 104.22%, 86.58%, 80.03%, 70.9%, 53.85%, and
44.21% for Japan, Germany, France, United States, United Kingdom, and
Canada respectively but close to 33.04% for Italy10.
10 The data extracted from table VII (page, 1448).
Table 4.3: Bank claims on the private sector Year 2000 2001 2002 2003 2004
Bank Claims on the Private Sector 172.2 187.1 205.8 228.5 313.9
As % Of GDP 24.4% 27.3% 29.1% 28.4% 33.4%
Source: Saudi Arabian Monetary Agency (www.SAMA.co.sa)

109
Such weak role of the banking sector may reflect most banks’ conservative
banking lending policy represented by the costly requirements. Indeed, for
example, SAMBA Financial Group requirements for long-term debt are as
follow:
Partial financing of the project by the firm.
Sufficient collateral assets at least to cover 100% of the value of the loan.
Comprehensive study of the feasibility of the project showing the expected
cash flow.
The history of the firm including sales, other loans, tangible assets, past and
expected growth, profitability and fixed costs the firm usually faces
Such requirement would increase the cost of long-term debt and, thus, one
would expect to observe low level of debt in general and long-term of debt in
specific. Moreover, the conservative policy of banking is expected to be more
in lending to small-middle enterprises (SMEs). Bevan and Danbolt (2002)
argue that small companies are found to use the various short-term elements
rather than long-term debt, which may indicate that they have difficulty
accessing long-term borrowing. Therefore, such companies in turn would rely
more on short-term debt as this term of debt does not require collateral assets.
They may also rely more on trade credit, especially when such debt
instrument is compliant with Shari’ah (Bai’muajjal).
In light of these facts, one would expect a low level of interest-bearing debt in
Saudi Arabia compared to other countries. Moreover, when firms use debt as

110
a source of funds, firms would employ more short-term than long-term debt
due to costly requirements asked by banks.
4.4 Capital Market
In Saudi Arabia, the specialized financial institutes and brokerage houses do
not exist. The capital market in Saudi Arabia consists of the bond and the
stock markets.
4.4.1.1 Saudi Stock Market (SSM)
According to TADAWUL official web (www.tadawul.com.sa), during the
1930’s, an official stock market began in the kingdom of Saudi Arabia when
the first joint stock company- the Arab Automobile Company- issued shares.
By the middle of the 1970’s, the total number of joint stock companies had
risen to only fourteen, mainly concentrated in the cement and electricity
sectors. In the late 1970s, the Saudi government decided to be more pro-active
in developing the primary stock market by participating in the formation of
many joint stock companies through the various secondary investment
agencies that it had established- e.g. the Retirement Pensions Agency and the
General Organization for Social Insurance. These agencies helped found
several companies by supplying start-up capital (Basheikh A, 2002). Also, the
Public Investment Fund invested a sizable portion of its capital in the
formation of new joint companies. In the late 1970’s, the primary market
witnessed tremendous growth when 19 new companies were offered to the
public; this included a number of publicly held joint ventures banks that were
owned by the public and major foreign institutions. They included Citibank
(presently SAMBA Financial Group), British Bank of the Middle East

111
(presently Saudi British Bank), ABN-Amro (presently Saudi Holandi Bank),
and Banque Indosuez (presently Saudi Faranci Bank). However, due to the
lack of trading regulation at that time, stock trading was fairly limited.
According to Basheikh A. (2002), in the early 1980’s, another jump in the
development of the primary market took place in terms of the number of
transaction and the marketability of securities when oil prices were increasing
which in turn increased the government ability to finance many long-term
development projects that were carried out by joint stock companies.
Moreover, in 1984, the government decided to privatise 30 percent of the
Saudi Basic Industrial Corporations (SABIC), which was valued at SAR 3
billions. Therefore, the essential factor in the basic development the primary
stock market in the kingdom has been government support.
However, until the early of 1980’s, the market remained informally organized.
In 1984, Royal Decree No. 1320/8 was approved and a combined ministerial
committee including the Minister of Finance, the Minister of Commerce and
the Governor of SAMA was formed to regulate and develop the Saudi Stock
Market (SSM). The committee aimed to improve and develop the market by
(i) encouraging Saudi investors to invest in the domestic economy in order to
contribute to its growth, (ii) providing Saudi companies with a source of
finance through the issue of securities, (iii) concentrating equity trading in a
single market in which buy orders are matched so as to establish a fair price,
(iv) providing an efficient market for the execution of all orders, supported by
the latest electronics facilities, (vi) supplying efficient settlement and
registration procedures which ensure the timely delivery of and payment for

112
security transactions and (vii) protecting investors and companies by the
enforcement of effective equity market rules and procedures (SAMA, 1995).
In order to accomplish these objectives, in April 1984, the ministerial
committee issued new rules and regulations that included the following: (i)
establishing of a share trading system through commercial banks; (ii) setting
up a supervisory body for all securities trading; (iii) establishing a share
control department (SCD) under the authority of SAMA and (iv) establishing
a Saudi Share Registration Company (SSARC).
In December 1984, SAMA established a share trading system to control and
supervise the stock market. Commercial banks were to act as intermediaries in
the purchase or sale shares on behalf of their clients; they were not allowed to
buy or sell shares for their own interest. Each commercial bank was required
to form a central trading unit (CTU) in the capital city Riyadh that would
receive orders form branches. In carrying out these transactions, the
commercial banks earn a commission based on the transaction value (up to a
maximum of one percent) to be paid by both the seller and the buyer (SAMA,
1985).
According to SAMA (1995), in the second half of 1990, SAMA introduced
the Electronic Securities Information System (ESIS). The system was
introduced gradually starting with Riyadh, the capital city, and eventually
covered the kingdom by the end of 1990. The system basically created a
floorless, computer-based stock market covering the kingdom; it allowed buy
(sell) orders that were entered at one bank’s share trading terminal to be
matched instantaneously with corresponding sell (buy) orders entered in to the

113
system by any other bank. Advance developments to this system have seen the
introduction of ESISLINE in 1992 and ESISNET in 1993. With these
developments, it is now possible for a buyer or a seller to enter any connected
Saudi bank branch, observe the price for the company in question, and place
an order that can be executed in seconds if it is within the market price range.
The order can be then be settled within 24 hours complete with the exchange
of (i) transaction proceeds and (ii) the documentary evidence of the new title.
The latest development for the system occurred in October 2001 when SAMA
introduced a new service (TADAWUAL) for the trading and the settlement of
shares in Saudi Arabia. This new system provides a continuous, order driven
market, with up to the minute price, volume and the company information; it
facilities an efficient and short trading cycle (www.tadawul.com).
In 1985, the National Centre for Financial and Economics Information
(NCFEI) produced the first indices of the Saudi Stock Market. Other indices
were prepared by a number of commercial banks at that time. In March 1987,
SAMA considered the NCFEI indices to be the official indices of the Saudi
Stock Market. The NCFEI indices have a base value of 100 and change
according to the share price data supplied by the share control department in
SAMA. The indices published include a general index of the market and six
sub-indices for the various sectors (Banking, Industrial, Services,
Agricultural, Electricity, and Cement). These indices and daily trading
information for all shares are published in the daily newspapers (Basheikh A,
2002).

114
The SSM is considered as one of the largest stock market in the Arab world in
terms of market capitalisation, with SAR 1,148.6 billions (about ₤164.1
billions) as at the end 2004. Table 4.4 shows that there are 73 joint stock
companies listed in the stock market, belonging to seven major sectors. This
figure is projected to increase with the expected listing of additional
companies over the next few years11.
As Table 4.4 shows, the dominant sectors are the manufacturing and banking
sectors with above 30% of total market capitalisation of the market followed
by Telecom sector with about 20%. Other sectors are the Electrical Company
with 9.7% and cement with 5.1% while the services sector represents nearly
4% and agriculture is only 0.5%.
It is believed that the degree of development of stock market influences
financial decisions from stock split, to dividends, to stock issuance and to
capital structure. To show the importance of the Saudi stock market in a
firm’s financial decisions, Table 4.5 shows a time series indicators and ratios
on the stock market over the period 2000 to 2004.
11 As the end of 2006, the number has increased to 86 companies.
Table 4.4: size of the Saudi stock market as end of 2004
Sector Number of companies Market
Capitalization (SAR billions)
%
Banking 9 355 30.3% Manufacturing 26 228 30.9%
Telecom 2 111 19.9% Electrical 1 59 9.7% Cement 8 42 5.1% Services 18 5 3.7%
Agricultural 9 355 0.5% Total 73 1,149 100
Source: Saudi Arabian Monetary Agency (www.SAMA.co.sa)
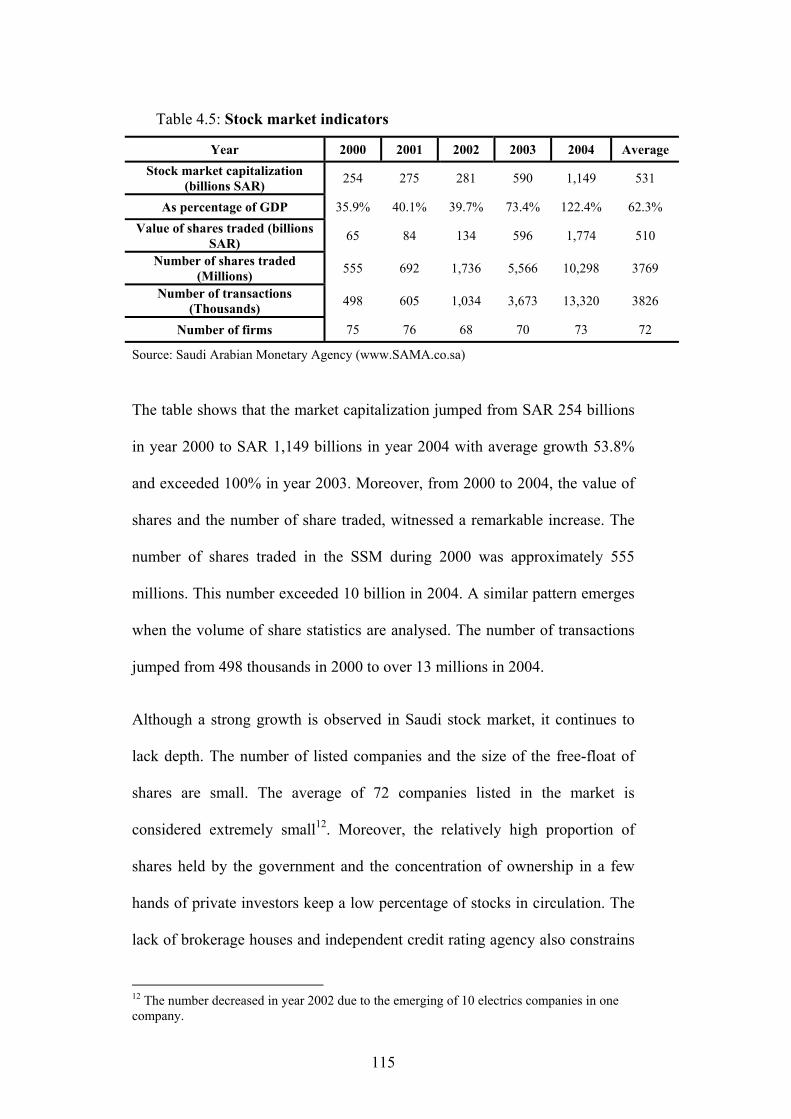
115
The table shows that the market capitalization jumped from SAR 254 billions
in year 2000 to SAR 1,149 billions in year 2004 with average growth 53.8%
and exceeded 100% in year 2003. Moreover, from 2000 to 2004, the value of
shares and the number of share traded, witnessed a remarkable increase. The
number of shares traded in the SSM during 2000 was approximately 555
millions. This number exceeded 10 billion in 2004. A similar pattern emerges
when the volume of share statistics are analysed. The number of transactions
jumped from 498 thousands in 2000 to over 13 millions in 2004.
Although a strong growth is observed in Saudi stock market, it continues to
lack depth. The number of listed companies and the size of the free-float of
shares are small. The average of 72 companies listed in the market is
considered extremely small12. Moreover, the relatively high proportion of
shares held by the government and the concentration of ownership in a few
hands of private investors keep a low percentage of stocks in circulation. The
lack of brokerage houses and independent credit rating agency also constrains
12 The number decreased in year 2002 due to the emerging of 10 electrics companies in one company.
Table 4.5: Stock market indicators
Year 2000 2001 2002 2003 2004 Average Stock market capitalization
(billions SAR) 254 275 281 590 1,149 531
As percentage of GDP 35.9% 40.1% 39.7% 73.4% 122.4% 62.3% Value of shares traded (billions
SAR) 65 84 134 596 1,774 510
Number of shares traded (Millions) 555 692 1,736 5,566 10,298 3769
Number of transactions (Thousands) 498 605 1,034 3,673 13,320 3826
Number of firms 75 76 68 70 73 72
Source: Saudi Arabian Monetary Agency (www.SAMA.co.sa)

116
intermediation of information, which in turn would expose the investors to act
based on rumours rather than on the basis of real fundamentals. The existence
of such agencies is considered as one of the key elements to attracting national
savings for investment in productive projects that would then create the
potential for establishing more joint stock companies (Bakheet, 1999).
In summary, despite the lack of market depth, stocks remain the first choice
financing among listed companies. Rajan and Zingales (1995) suggest that a
good measure to determine the importance of the stock market is the ratio of
stock market capitalisation to the gross domestic product (GDP). Table 4.5
shows the market capitalisation from 2000 to 2004. On average, market
capitalisation compromises 62.3% of GDP and exceeds 120 % in year 2004.
Comparing this ratio to those of the G-7 studied by Rajan and Zingales
(1995), we find the 62.3% is higher than United States (49.85%), Germany
(25.79%), France (19.54%), Italy (21.17%) and Canada (50.56%) but less
than Japan (85.31%) and United Kingdom (83.70%). Moreover, this ratio is
higher than those of 10 developing countries studied by Booth et al. (2001)
except Malaysia (68%). Moreover, comparing the ratio of market
capitalisation to GDP (62.3%) with the ratio of bank claims on the private
sector to GDP (28.5%), would suggest that public (equity) is more important
than private financing (bank debt).
4.5 Bond market
The debt market consists of government bond market and corporate bond
market. Since 1988, Saudi authorities have been relying on internal financing
through issuing government bonds to finance their activities and borrowed

117
from banking sector to cover the budgetary deficit. SAMA through its
investment department is the fiscal agent and debt manager by conducting
monthly auctions and cites the volume of bond offered. Bonds include
treasury bills, which range from one week to one month in maturity; floating
rate notes with maturities at five years and seven years; and government
development bonds (GDB) with maturities at two, three, five, seven, and ten
years. However, the holdings of government debt securities are concentrated
in government financial institutions, namely, the Pension Fund and the
General Organization for Social Insurance (GOSI) and domestic commercial
banks. The Pension Fund and the GOSI, however, own about 75% of the
central government debt stock (IMF country report, 2006). During the last 15
years, the government debt market went through evolutionary changes in
terms of issuance procedure, pricing, maturity spectrum, and settlement (Al-
Sayari, 2003). In March 2004 the SAMA introduced a “Dutch” auction system
for pricing GDB’s, replacing the previous system of predetermined prices.
On the other hand, the corporate bond market has a short history although the
requirements of issuing corporate bonds are formulated under articles 116 to
119 of the Companies Act since 1965. According to the International
Monetary Fund (IMF) country report (2006), the Saudi ORIX Leasing
Company offered the first corporate bond issue in March 2003, amounting to
SAR 45 million. The report described the Saudi’s corporate bond market as
fledgling. However, the report argues that the condition under Article 117 of
the Companies Law, which constrains the total amount of bonds that a
company may issue to not exceed paid up capital may inhibit corporate bond
market development. The IMF recommended this statutory constraint on

118
issuance should be removed since it keeps the issuing cost of short- and
medium-term debt securities, such as commercial paper or medium-term notes
expensive.
In sum, the Saudi bond market, in particular, corporate bond market is
negligible in the primary market. Moreover, bonds are not liquid due to the
non-existence of secondary bond markets. This in turn would suggest that
bank loans are the main debt-financing instrument.
4.6 Legal system
According to Ministry of Commerce and Industry (1999), article 218 of the
corporate law gives management the right to run the firm during the
proceedings. Moreover, on January 2, 1996, the Council of Ministers
approved the Code of the Settlement Preventing Bankruptcy. The Code,
which came into effect on June 1, 1996, provides a framework in which the
debtor may reach a settlement with his creditors to avoid bankruptcy. The
Code allows debtors to seek agreement with their creditors through
committees to be set up at various local Chambers of Commerce in the
Kingdom. If a settlement cannot be reached, or if the debtor so wishes, he may
apply to the Sharia court, which reportedly does not allow repossession on
grounds of compassion, and request that it call his creditors to offer them a
settlement to avoid bankruptcy. When settlement proceedings begin, claims
against the debtor are to be dropped.
In sum, one can conclude that the Saudi legal system suffers from weak law
and from weak enforcement of this law. These weaknesses in turn would

119
make the debt an expensive source of finance as the banks’ requirements
become more restrictive in lending to firms in such legal system.
4.7 Tax system
One of the features in Saudi’s economy is the absence of income tax on
citizens. Instead, there is one form of tax that is called Zakat, which is
generally based on a payers’ net worth. Zakat is known as the third pillar of
Islam, which indicates its importance and fundamental character in the
religion. It can be defined as a system that organizes the transfer of wealth
from the rich to the poor and needy. Literally, the word Zakat means purity or
purification. Moreover, the payment of Zakat is regarded primarily as an act
of worship of God. In the Holy Qur'an great stress is laid on the Zakat. The
glorious Qur′ận states: Take of their wealth a portion (as charity) to purify
them by it. [Surah AL Taw’bah, verse 103].
It is believed that one of the reasons for the imposition of the Zakat is the fact
that Islam calls for the purity of both the soul and the body. Since it is
required from the rich to satisfy the needs of the poor, the paying of the Zakat,
no doubt enhances caring within society and strengthens the relationship
between the wealthy and the poor and needy. It reflects fulfilment of an early
concept of social justice, as it is taken from each person according to his
capacity.
In Saudi Arabia, the government department of Zakat and Income Tax (DZIT)
is responsible to manage the religious obligation of Zakat and tax. The Zakat
on the individual's annual income from any legal source amounts to 2.5%. A
Saudi company also pays 2.5% of the Zakat base. According to the

120
department of Zakat and Income Tax, Zakat base includes the share capital,
retained earnings or accumulated deficit, long-term loans, notes payable and
advances if they are used to finance fixed assets. Furthermore, the adjusted net
income for Saudi Income Tax and Zakat purposes is added to the Zaka base.
Deduction from the zakat base include net fixed assets and properties under
construction, dividends distributed during the year not to exceed retained
earnings at the beginning of the year, investment in other Saudi companies
and Saudi government bonds, and adjusted deficits. If the Zakat base is
negative or lower than the adjusted net income for the year, Zakat is imposed
on the adjusted net income. If both are negative, no Zakat is due.
Barakat and Rao (2004), argue that, in the non-tax Arab countries, the use of
debt is no different from the use of equity as the payout on both is treated the
same in the absence of tax advantages of debt for the corporation or tax
advantage of equity for the investor. Consequently, the tax advantages of debt
suggested by the trade off theory are expected to be minimal among Saudi
firms.
4.8 Ownership pattern
La Porta et al. (1999) find a relationship between legal protection and
ownership concentration in which countries with weak protection for investors
tend to have higher ownership concentration and firms are typically controlled
by families or the State. Therefore, it is not surprising to find that company
ownership is highly concentrated and mainly controlled by families or the
government in Saudi Arabia. Table 4.6 shows the percentage of the equity
stake held by groups, namely, government, joint stock, foreign and others.

121
Table 4.6: Equity stakes (percent share) Sector
Gov.
Joint Stock
Foreign
Others Banking 23% 2% 15% 60%
Manufacturing 49% 4% 1% 46% Telecom 70% 0% 0% 30% Electrical 76% 7% 0% 17% Cement 19% 2% 2% 77%
Services 19% 1% 0% 80% Agricultural 10% 0% 0% 90%
Total 38% 2% 3% 57% Source: Bakheet Financial Advisors (www.bakheetgroup.com)
The largest share is held by others (founder of the firms who are mostly rich
families and individual investors) with 57% of the total market capitalisation
and reaches 90%, 80%, and 77% in agricultural, services and cement sectors
respectively. It is estimated that up to 90% of the companies are wholly
family-owned, compared to 70% in the European Union of which at least 500
of them can be classified as large in terms of volume of business
(Washingtonpost.com). This means that 90% of 57% (or 51%) owned by
family. Furthermore, as being the founder, wealthy families are the major
shareholders of banks and, thus, they occupy the board of directors of these
banks. For example, three out of the ten listed Saudi banks are founded by
single family such as Bank Al-Jazira, Al Rajhi Banking & Investment Corp or
by a small number of allied families such as bank Al Belad.
As will be discussed shortly in the next section, the government have
privatised some public enterprises in key industries but have maintained a
majority. The table shows that government ownership is relatively extensive
with overall 37% of the total market and reaches 76% and 70% in electrical
and communication sectors respectively. Foreign share constitutes only 3% of
the total market and reaches 19% in banking sector while cross ownership of
joint stock companies’ comprise only 2% of the total market.

122
Although the Saudi Stock market is closed for trading to non-Saudis with the
exception of the Gulf Cooperation Council (GCC) nationals, there are foreign
partners who hold shares mainly in the banking sector13. However, foreign
shareholding constitutes only 3% of the total market and reaches 19% in
banking sector. Moreover, Saudi joint stock companies have cross ownership
in which one company can own shares in other companies. For example,
Saudi Basic Industries Corporation is the second largest shareholder of Saudi
Arabian Fertilizer Company with 43% of the company's total outstanding
shares. Some banks have ownership in other companies, in particular large
companies. There are 30 cross ownerships among companies but with overall
shareholding of just 2% of the total market.
As pointed out earlier, 500 of the family-owned companies in Saudi Arabia
can be classified as large. Indeed, the table in Appendix 2 shows that 62
companies out of the large 100 Saudi companies are privately held
corporations. These large corporations are the outcome of investments by a
single family or a small number of allied families. The structure of most of
these corporations is that each one has a business group that is organized
around a holding company. For example, Olayan Group is a single family-
owned corporation comprising 50 companies and affiliated businesses
engaged in distribution, manufacturing, services, and investment
(www.olayan.com). In order to keep the control of business activity within the
family, family members usually manage and control the firm.
13 GCC countries are Bahrain, Kwait, Qatar, Oman, Saudi Arabia and the United Arab Emirates

123
4.9 The privatisation program
Following two gulf wars and continued fluctuations in oil prices, Saudi Arabia
started to experience budgetary deficits. Because of these crises, the Saudi
authorities realized the importance of restructuring their economy in order to
overcome these difficulties. Consequently, during the 1990s, Saudi Arabia
underwent privatisation programs aimed at reducing government expenditure
and inviting the private sector to take a more effective part in shaping the
national economy (Naser, 1998).
According to the Ministry of Planning, (2000), the successful implementation
of the government's privatisation policy will be guided by consideration of all
social and economic conditions prevailing in the Kingdom. The privatisation
policy concentrates on the following four themes:
Financing: mobilizing private funds for investment in ongoing public sector
projects which experience financing difficulties due to budgetary constraints;
Privatising Management: granting the private sector more opportunities to
manage and operate public sector projects;
Divestment: The gradual sale to the private sector of government shares in
joint stock companies, following in-depth studies of each individual case, so
that the social and economic costs and benefits can be properly evaluated and
timing can be determined when appropriate conditions prevail; and
Deregulation and promotion a positive climate for private investment through
extending and increasing the effectiveness of the market mechanism.

124
It can be inferred from these themes that the state-owned companies are facing
financial difficulties and the feasible solutions is equity financing via offering
to the public part of its shares but with the government remaining a large
shareholder. In light of this evidence, one can conclude that state-ownership
of companies is likely to have a negative effect on debt levels.
4.10 Conclusion
This chapter presents the cultural and institutional aspects that are expected to
affect the firm’s capital structure in Saudi Arabia. Though the Islamic law
provides a variety of shari’ah-compliant financing products, banks limit the
use of such products to individual customers. Such a limited role for banks
reflects most likely the weak legal system and weak enforcement of this law
in the country. The role of bond market is also very small due mainly to the
requirements imposed on firms under the company’s law and due to the non-
existence of a secondary market.
The growth observed in the stock market over the period of study would also
suggest a negative effect on the level of debt of those listed companies.
Falling costs of equity due to the high increase in the stock prices would
motivate listed companies to rely more on equity to finance their growth.
Moreover, the country has a unique tax system, which imposes a tiny
percentage of zakat (tax) on Saudi firms. In such a system, the tax advantages
of debt are expected to be minimal.
The chapter also shows that the pattern of company ownership is highly
concentrated in which rich families and government are the major
shareholders of both the banks and the companies. This in turn would reduce

125
the agency costs of debt and would have a positive impact on firms’ debt
levels in particular those large firms who have link with banks.
However, the effect of socio-cultural and institutional factors on the
determinants of capital structure will be discussed in the next chapter when
the hypotheses will be developed in the context of such factors.

Chapter 5: Hypotheses Development

127
5.1 Introduction
Capital structure theories have very little to say about inter-country
differences in corporate financing patterns. No existing theory explains how
country-specific factors affect firm’s capital structure. However, empirical
studies, in specific, cross-country studies (e.g. Rajan and Zingales, 1995;
Booth et al., 2001; Giannetti, 2003; Fan et al., 2004; Hall et al., 2004; De Jong
et al., 2007) demonstrate that inter-country variation in corporate leverage
depends on institutional differences. Rajan and Zingales (1995) argue that the
institutional characteristics that affect capital structure are: tax code,
bankruptcy laws, state of development of bond markets and patterns of
ownership. Moreover, De Jong et al. (2007) find that institutional and legal
environment and economic development affect not only the level of corporate
leverage, but also firm-level determinants of leverage.
Accordingly, the purpose of this chapter is to develop testable hypotheses
about those variables found in prior empirical studies to potentially determine
a firm’s debt ratio in the context of the unique institutional characteristics of
Saudi Arabia addressed in the previous chapter. Section 5.2 presents
hypotheses development. Section 5.3 demonstrates the leverage
measurements. Section 5.4 presents the measurement of explanatory variables.
Finally, Section 5.5 provides a conclusion for the chapter.
5.2 Hypotheses development
5.2.1 Size
Theoretically, it has been argued that large firms are more likely to have
higher debt level than their smaller counterparts. Rajan and Zingales (1995)

128
and Graham et al. (1998) argue that large firms tend to be more diversified
and have more stable cash flow and, thus they have less probability of going
bankrupt. Accordingly, a positive relation between leverage and firm size
would be observed. The main empirical research in general supports the
positive influence of size on firm leverage. The empirical finding of previous
studies analysed in chapter three reveals that 95.51% and 90.12% of the
significant results are positively correlated with total and long-term debt ratios
respectively. As total debt includes short-term debt elements, the higher
percentage associated with it (i.e. 95.51% compared to 90.12%) implies that
also short-term debt is positively related with size.
It has been established that most of the large Saudi firms are business groups
that are organized around a holding company. This indicates that they are
diversified and, thus, are less likely to be exposed to financial distress and
default. As a result, Saudi larger firms are expected to have higher level of
interest-bearing debt than their smaller counterparts. Thus, the following
hypothesis is proposed:
H1 a positive relationship will exist between size of the firm and debt ratios.
5.2.2 Profitability
One of the main theoretical controversies concerns the relationship between
leverage and profitability. While trade off theory suggests a positive
association between profitability of the firm and leverage due to the tax
deductibility of corporate interest payments, the pecking order hypothesis
suggests negative relationship due to information asymmetric consideration.
Empirically, the overall results reveal that profitability has strong negative

129
influence on leverage which in turn provides strong support to the pecking
order hypothesis but contradicts trade off theory.
It has been pointed out earlier that Saudi firms are subject to low tax (Zakat)
rate as well as having concentrated ownership patterns. Therefore, the positive
relationship between profitability and leverage suggested by tax and agency
theories is not expected. The following hypothesis, consequently, is proposed:
H2 consistent with pecking order hypothesis, a negative relationship will exist
between profitability and debt ratios.
5.2.3 Tangibility
It has been argue that tangibility might be the major factor in determining the
firm’s debt level (Titman and Wessels, 1988; Harris and Raviv, 1990 and
Rajan and Zingales, 1995). It represents the effect of the collateral value of
assets on the firm’s leverage level. Jensen and Meckling (1976) argue that due
to the conflicts between debt-holders and shareholders, debt-holders face the
risk of asset substitution problem. However, if debt can be secured against
assets, the borrower is restricted to using loaned funds for a specific project,
and creditors have an improved guarantee of repayment. Therefore, this
argument suggests a positive relationship between debt level and tangible
fixed assets. However, the length of loans is likely to be matched to the length
of life of assets used as collateral (matching principle). Therefore, a negative
relationship between tangibility and short-term debt would be expected.
Empirically, the overall direction of this relationship supports the positive
influence of tangibility on firm's leverage. However, studies using long-term

130
debt ratio compared to those using total debt ratio have more power in
explaining the hypothesised positive relationship with 98.87% compared to
93.69% as a percentage of the total significant results. This in turn imply that
the negative correlation between short-term and tangibility reducing the
strength of the overall positive relationship with total debt. This is consistent
with Booth et al. (2001) argument that due to conventional matching
argument, the more the tangible the asset, the more the long-term debt, and
the smaller the short-term debt. Moreover, Bevan and Danbolt (2002) found
that tangibility is positively correlated with long-term debt but negatively
correlated with short-term debt elements.
Antoniou et al. (2002) argue that importance of collateral is more significant
in traditional bank lending than in borrowings from capital markets. Since
banks are the debt-holder in Saudi Arabia, the importance of fixed assets
expected to be more significant. Indeed, it has been stated the one of the
requirement of bank to consider lending long-term debt sufficient collateral
assets at least to cover 100% of the value of the loan. Accordingly, the
following hypothesis is proposed:
H3a a positive relationship will exist between tangibility and long-term and
total debt ratios.
H3b due to matching principle, a negative relationship will exist between
tangibility and short-term debt.

131
5.2.4 Free cash flow
It has been pointed out earlier that agency theory argues that debt reduces the
amount of free cash flow available to managers to undertake personally
beneficial activities since it commits the firm to pay out cash (Jensen, 1986).
This theory, therefore, suggests a direct relationship between free cash flow
and leverage. However, if free cash flow is representing the capacity of the
firm to generate internal resources, then a negative relationship between free
cash flow and debt levels is expected (pecking order theory).
However, the empirical finding of previous studies analysed in chapter three
reveals that the relationship between free cash flow and leverage depend on
the measure of debt used. While these studies find free cash flow to be
negatively correlated with total debt, a positive association is observed for
long-tem debt with weak significance percentage.
It has been outlined earlier that the ownership of the Saudi firms is highly
concentrated, so, the costs associated with the free cash flow suggested by
agency theory will be at minimum. Accordingly, the following hypothesis is
proposed:
H4 a negative relationship will exist between free cash flow and debt ratios.
5.2.5 Liquidity
It has been argued that liquidity of the firm may have an influence on the
choice between internal and external financing. According to the pecking
order hypothesis, firms with financial slack (i.e. liquid assets such as cash and
marketable securities) will prefer internal sources to finance future

132
investments. Accordingly, firms with higher liquidity ratio are expected to
have lower debt ratio. Empirical, studies that have examined the affect of
liquidity on firm's leverage seem to support the existence of the negative
relationship between liquidity and debt in which 99.12% of the significant
results are negative. Accordingly, the following hypothesis is proposed:
H5 a negative relationship will exist between liquidity and debt ratios.
5.2.6 Uniqueness
Titman (1984) argues that firms characterized by unique products impose
potential costs on their customers, input suppliers, and workers when facing
liquidation and so they should be financed with relatively less debt. These
firms also find it difficult to borrow because their specific use of capital
reduces the probability of an alternative use in the event of bankruptcy. Such
firms are expected to spend more on R&D since their products are less likely
to be duplicated by other firms. Furthermore, firms with relatively unique
products are expected to advertise more and, in general, spend more in
promoting and selling their products.
The main empirical research that has examined the influence of uniqueness on
firm leverage indicates that the overall direction support the existence of the
negative relationship between uniqueness and leverage. Accordingly, the
following hypothesis is proposed:
H6 a negative relationship will exist between uniqueness and debt ratios.

133
5.2.7 Growth
Myers (1977) argues that due to the potential for under-investment, firms with
great growth opportunities should not be financed with long-term debt. Myers
further argues that shortening the maturity of the firm’s debt obligations (i.e.
increasing the use of short-term debt) can mitigate the incentive to under-
investment. Empirically, it has been found that the relationship between
growth and leverage to depend on how the growth is measured. While the
hypothesised negative relationship between growth and debt ratios is
strengthen when growth is measured by market-to-book ratio, the strength of
the negative correlation decreased with growth in assets and turn into positive
with growth in sales.
Antoniou et al. (2002), argue that in bank-oriented countries banks are
frequently represented on the supervisory board of the companies and
coordinate with the management of the firm and, thus, they are likely to be
fully aware of the quality of future investment of the firm. This reduces the
agency costs of debt, which in turn increases the borrowing ability of the
firms. As discussed earlier, there is a multiple and strong relationship between
banks and large listed Saudi firms. This relationship is reflected in the
presence of the large shareholders on the banks' boards. Moreover, some
banks have shares in some companies. Therefore, banks work closely with
firm and know about the quality of the firm's future investment. The presence
of such relationship reduces the agency cost of debt. However, companies
with high growth opportunities are generally small in term of size. Therefore,

134
the conflicts between banks as lender and small listed and unlisted firms
expected to be severe. Accordingly, the following hypothesis is proposed:
H7-a there will be a negative relationship between growth opportunity proxies
and long-term and total debt ratios in both listed and unlisted samples.
H7-b there will be a positive relationship between growth opportunity proxies
and short-term debt in both listed and unlisted samples.
5.2.8 Dividends
One of the main predictions of the pecking order hypothesis is that higher
dividend payouts lower retained earnings and that increases the need for debt
to finance growth opportunities. This in turn suggests a direct relationship
between dividends and debt ratios. On the other hand, dividends can control
the free cash flow agency problem as higher dividends lower the amount of
free cash flow (Stulz, 1990). This in turn suggests a negative relationship
between dividends and debt ratios.
As with growth, the analysis of prior empirical studies reveals that the
relationship between dividends and leverage depends on how the dividends is
measured. While a negative relationship between dividends and debt ratios is
found with the dividend payout ratio, a positive correlation is observed when
dividends are measured by dividend yield.
However, La Porta et al. (1999) argue that paying dividends in the developing
countries is a sign of commitment to the shareholders rather than to the debt
holders and firms pay dividends to build the reputation to market future stock
issues. This in turn suggests negative relationship between dividends and debt

135
ratios. In previous chapter we observed that the Saudi stock market plays an
important role in financing listed firms via equity. Accordingly, listed firm
will pay dividends to build the reputation for future external equity financing.
On the other hand, since unlisted firms are constrained from stock market,
unlisted firm that pay dividends will reduce the amount of retained earning and,
thus increase the need for debt. Accordingly, the following hypothesises are
proposed:
H8-a due to reputation considerations, a negative relationship will exist
between the dividend payout ratio and debt ratios in listed sample.
H8-b a positive relationship will exist between the dividend payout ratio and
debt ratios in unlisted sample.
5.2.9 Age
It has been argued that young firms are more likely to depend on debt
instruments since they do not have sufficient internally funds to finance new
investment. This in turn suggests negative correlation between age and
leverage. On the other hand, aged firms have established a good relation with
banks and form good reputation through time. Accordingly, they have better
conditions and easier access to debt market than those new established.
The analysis of prior empirical studies shows that the relationship between
age and debt ratios to depend on how debt is measured. While age is found
positively correlated with total debt ratio, it is found negatively associated
with long-term debt ratio. This in turn implies that age is positively correlated

136
with short-term debt. In line with the prior studies findings, the following
hypotheses are proposed:
H9 -a a positive relationship will exist between age and short-term debt and
total debt.
H9 -b a negative relationship will exist between age and long-term debt.
5.2.10 Business risk
It has been commonly argued in the literature that as debt involves
commitment of periodic payments, firms with high variability in earnings
have a greater risk not to meet their debt obligations, so increasing the
probability of default. Thus, lenders will be less willing to lend or will charge
a higher risk premium since they will have a greater probability of losing their
money. Empirically, the analysis of prior studies shows that risk is
significantly inversely correlated with debt ratios.
Since Saudi banks are conservative in their lending policy, one would expect
that banks are unwilling to lend to firm with high volatility in earnings.
Therefore, the following hypothesis is proposed:
H10 a negative relationship will exist between volatility in earnings as proxy
for risk and debt ratios.
5.2.11 Government ownership
In light of agency theory associated with debt benefits, shareholders owning
large percentages of equity shares (particularly institutions) could prevent
management from engaging in self-interest activities by reducing the free cash

137
flow through increasing the firm’s debt. Moreover, government-linked firms
have several advantages such as easier access to alternative source of finance
and guaranteed solvency (Deesomsak, Paudyal and Pescetto, 2004). These
arguments suggest a positive relationship between share held by government
and leverage. On the other hand, agency theory associated with debt benefits
argues that government as large external shareholders may also force
managers to engage in activities that benefit shareholders at the expense of
debt-holders such as asset substitution (Myers, 1977). This in turn suggests
negative relationship between shares held by government and leverage.
Empirically, the analysis of prior studies reveals that government is negatively
correlated with debt ratios based on book value, but insignificantly correlated
with debt ratios based on market value.
However, it has pointed out in previous chapter that the government has the
majority ownership in several key companies in the Saudi stock market,
which in turn make it the second largest shareholders in terms of market
capitalisation. Also, it was also stated that one of the privatisation themes is
equity financing for state companies due to government budgetary deficits.
This in turn implies that government-link firms will rely on equity rather than
on debt. Accordingly, the following hypothesis is proposed:
H11 a negative relationship will exist between the government ownership and
debt ratios.
5.2.12 Industry classification
The industry in which a firm operates will have a significant effect on its
capital structure. Bradley et al (1984) found that firms belonging to the same

138
industry generally have similar financial structures whereas firms from
different industry classes generally have different financial structures.
Moreover, Harris and Raviv (1991) noted that Drugs, Instruments, Electronics
and Food have low leverage whilst Paper, Textiles, Mill Products, Steel,
Airlines and Cement have high leverage. The authors also note that utilities
firms are more leveraged than non-utilities firms.
It has been pointed out earlier that Saudi companies are belonging to seven
sectors. Besides the banking sector, industrial, telecommunication, electricity,
cement, services and agriculture are the major sectors as defined by Saudi
Stock Market. Manufacturing and cement firms, expected to have intensive
fixed assets, are likely to use more debt than farming and the service sector.
This in turn leads to the following hypothesis:
H12 firms operating in the manufacturing and cement industries will show
higher debt levels than those operating in farming and service industries.
5.3 Leverage definitions
In the literature of capital structure, there is no clear-cut definition of leverage.
Rajan and Zingales (1995) apply four different measures for leverage. The
first definition of leverage is the ratio of total (non-equity) liabilities to total
assets. A second one is the ratio of debt (both short-term and long-term) to
total assets. Third is the ratio of total debt to net assets, where net assets are
total assets less accounts payable and other current liabilities. The final
definition is the ratio of total debt to capital, where capital is defined as total
debt plus equity.

139
Three debt ratios will be used as dependent variables to test the determinants
of capital structure of Saudi firms. These are: total debt, short-term debt and
long-term debt all scaled by book value of total assets. There are several
reasons for selecting these measures. First, it is necessary to find out the
determinants of the use of the firms’ general level of leverage (i.e. total debt).
Second, if any leverage is used, we need to know what determines the mix of
long-term debt and short-term debt for financing asset growth. Our
understanding goes first to the matching principle where long-term debt is
used to finance fixed assets and short-term debt is used to finance working
capital. However, prior empirical studies demonstrated that other factors
determine the choice of debt maturity such as barriers to access to capital
market, the development of bond market, size and profitability of the firms.
Bevan and Danbolt (2002) find significant differences in the determinants of
long-term and short-term debt ratios.
Moreover, Titman and Wessels (1988) argue that the coefficients’ signs,
magnitudes and even levels of significance of the explanatory variables will
differ according to whether the debt ratios are defined in terms of book or
market values. However, the book values of debt are used in this dissertation
for the following reasons:
Taking into account the scarcity of data, book values of debt data are usually
available.
Titman and Wessels (1988) argue that the correlation between book and
market of debt is very large, thus, the misspecification due to using book
value measures is probably fairly small.

140
Due to the weakness of the primary bond market and the non-existence of
secondary bond market in Saudi Arabia, bonds are never tradable in
secondary market, which means there is no market value of debt.
Since bank loans are the dominant source of corporate debt, banks require
fixed assets as collateral, which usually priced at book value.
Managers consider the book value of their firm when making debt decisions.
Zakat (tax) department considers book values in its regulations and
proceedings.
5.4 Explanatory Variables definitions
5.4.1 Size
Generally, logarithm of sales, logarithm of assets and number of employees
are the variables that have been used in empirical studies to capture the affect
of size on leverage. Based on prior studies included in the synthesis analysis
conducted in chapter three, logarithm of assets appears to come first with 266
out of 488 using the three proxies to capture the effect of size followed by
logarithm of sales with 210 and only 12 uses the number of employees.
Although all the three proxies show the expected positive influence of size on
leverage, they have different explanatory power. While using logarithm of
assets and logarithm of sales has demonstrated about the same strong results,
using number of employees shows relatively moderate results.
Accordingly, the logarithm of assets will be employed as the main proxy for
size in this dissertation to capture the influence of size on leverage and
logarithm of sales as an alternative proxy.

141
5.4.2 Tangibility
Fixed assets to total assets is the common proxy most studies used to capture
the effect of tangibility on leverage. However, different authors have used
different measures for the concept of collateral value of assets. Most studies
(e.g. Marsh, 1982; Friend and Lang, 1988; Rajan and Zingales, 1995; Bevan
and Danbolt, 2002 and 2004) employ the ratio of fixed assets to total assets.
Titman and Wessels (1988), however, add inventory to the fixed assets. The
main argument behind adding inventory is that debts are used partly to finance
inventories, and in most cases inventories maintain some value when the firm
is liquidated.
In line with the majority, the ratio of fixed assets to total asset will be the main
proxy for tangibility in this dissertation and the fixed assets and inventories to
total assets will be the alternative proxy.
5.4.3 Profitability
Generally, there are two proxies employed in prior empirical studies to serve
as bases for the measure of profitability. These are return on assets (ROA) and
return on sales (ROS). The most common proxy found in the synthesis
analysis of prior studies is return on assets with 449 compared to 62 using
return on sales. However, the results of both proxies provide strong support to
pecking order hypothesis as both proxies show strong negative influence on
debt ratios.
In lines with most studies, return on assets defined, as the ratio of earnings
before interest, tax and depreciation (EBITDA) over total assets will be used

142
as the main proxy to capture the influence of profitability on leverage. The
return on sales, on the other hand, will be used as an alternative proxy.
5.4.4 Free cash flow
To capture the effects of free cash flow most studies (e.g. Opler and Titman
1993; Lasfer; 1995 and DeMiguel and Pindado, 2001) define free cash flow as
interaction between cash flow expressed as the earnings before interest and
tax plus depreciation normalised by total assets and Tobin’s q which is the
market value of the firm to the replacement cost of its capital.
However, due to the lack of market value data for unlisted firms, the free cash
flow defined as the earnings before interest and tax plus depreciation less
capital expenditure (i.e. positive growth in fixed assets) normalised by total
assets will be the proxy used to capture the free cash flow’s influence on
leverage.
5.4.5 Liquidity
The ratio of current assets over current liabilities is the common proxy that
has been used by previous empirical studies to capture the influence of
liquidity on leverage. In this dissertation, however, the quick ratio (current
assets less inventory over current liabilities) will be used as the main proxy for
liquidity since it focuses on the firm’s more liquid assets. The current ratio, on
the other hand, will be used as an alternative proxy.

143
5.4.6 Uniqueness
In order to capture the influence of uniqueness on capital structure, two
measures have been employed in the empirical studies, namely, the ratio of
R&D to sales and the ratio of selling expenses to sales. The most common
proxy found in the synthesis analysis of prior studies is the ratio of R&D to
sales with 66 compared to 28 using the ratio of selling expenses to sales.
However, the results of both proxies provide strong support to Titman’s
argument as both measures show strong negative influence on debt ratios.
However, due to the lack of R&D data, the ratio of selling expenses to sales
will be used as the main proxy for uniqueness. Moreover, dummy variable
equal to one for firms reporting selling expenses and zero other wise will be
used as an alternative proxy14.
5.4.7 Growth
Different proxies have been employed to capture the influence of growth
opportunities on leverage. These are the ratio of market value of assets to
book value of assets (market-to-book ratio), past growth in sales and past
growth in assets. The most common used proxy found in the synthesis
analysis of prior studies is market-to-book ratio with 350 compared to 63 and
60 using past growth in sales and past growth in assets respectively.
Generally, the market-to-book ratio defines as the ratio of book value of total
assets less the book value of equity plus the market value of equity to the book
value of total assets.
14 This proxy for uniqueness is less than ideal since it is not possible to distinguish between firms that have zero selling expenses and those that have non-zero selling expenses but fail to report them separately.

144
Since the study involves listed and unlisted samples, two different measures
will be employed in this dissertation to capture effect of growth opportunities
on leverage. The market-to-book ratio value of assets (only for listed firm)
and the growth in assets (unlisted sample) will be used as the main proxies for
growth opportunities. Moreover, growth in sales (for unlisted sample) and
both growth in assets and in sales (for listed sample) will be used as
alternative proxies.
5.4.8 Dividends
Dividend payout ratio and to a lesser extent dividend yield are used in prior
studies to capture the impact of dividends on the firm’s capital structure.
However, the results of meta-analysis reveal that the two measures produce
differing directions. While dividend payout ratio shows overall negative affect
on leverage, dividend yield proxy reveals overall positive influence.
Nevertheless, to investigate the influence of dividends on debt ratio, only
dividend payout ratio will be employed here due to the lack of data
concerning dividend yields. Additionally, a dummy variable equal to one for
firms paying dividends and zero otherwise will be used as an alternative
proxy.
5.4.9 Age
The number of years since the year of the firm’s establishment is the common
proxy used to capture the influence of age on leverage. The overall results of
this proxy show a positive impact on leverage. However, to improve the linear
relationship with debt ratios, the natural log of the number of years since

145
company’s establishment will be used as the main proxy for age in this
dissertation and the number of years as alternative proxy.
5.4.10 Risk
Two proxies have been used to capture the influence of risk on leverage,
namely, earnings volatility measured as the standard deviation of the first
difference in annual earnings over mean of annual earnings and systematic
risk (β). However, the most common used proxy found in the synthesis
analysis of prior studies is earnings volatility with 253 compared to only 10
using systematic risk. In general, the results of both measures reveal the desire
negative impact of risk on leverage that indicates riskier firms have lower debt
ratios.
Due to the lack of data related to systematic risk, the ratio of the standard
deviation of first difference in annual earnings to the mean of annual earnings
over the study period will be employed in this dissertation as a proxy variable
for business risk.
5.4.11 Government ownership:
To capture the effect of the existence of government as a shareholder on
firm’s capital structure, most of the studies included in the meta-analysis use a
dummy variable equal to one for firms having shares held by government and
zero other wise. One study, however, uses the actual percentage of
outstanding shares held by the government. The major issue of using a
dummy variable is that it ignores the high variation between the companies
that report a positive data of the variable of interest. For example, company

146
with 70% of ownership held by the government is treated equally as the
company with 2% of ownership.
In this dissertation, since this issue is observed in the sample, the actual
percentage of shares held by the government will be use to measure the effect
of the presence of government on leverage.
5.4.12 Industry classifications:
Titman and Wessels (1988) employed a dummy variable equal to one for
firms producing machines and equipment and zero otherwise to measure the
influence of industry classification on leverage. Other researchers, however,
included more than one dummy variable to capture the differences in the
leverage ratios among different industries class.
To investigate if capital structure varies among industry sectors, this
dissertation will employ three dummy variables representing manufacture,
cement and farming sectors in listed sample and two dummy variables
representing manufacture and farming sectors in unlisted sample with the
service sector being the base in both samples. Banking sector, however, is
excluded since their balance sheets have a significantly different structure
from those of non-financial companies as well as they are the major source of
debt in the country.
5.5 Conclusion
Size, profitability, tangibility, free cash flow, liquidity, uniqueness, growth
opportunity, dividends, age risk, government and industry classifications are
the attributes that have been identified by prior empirical studies to potentially

147
determine firm’s debt ratio. However, De Jong et al. (2007) conclude that
country-specific factors do matter in determining and affecting the leverage
choice around the world and these factors should not be neglected in the
analysis of a country’s capital structure. Accordingly, the hypotheses about
the effect of identified attributes on the firm’s leverage are developed in the
context of the unique institutional characteristics of Saudi Arabia. Moreover,
the definition and the main proxies for these attributes as well as some
alternative proxy are demonstrated in this chapter. Table 5.1 provides
summary for the variables definition and hypothesised sign.

148
Table 5.1: Summary of the variables definition and hypothesised sign
Hypothesised sign
Listed Unlisted Attribute Main proxy Alternative proxy
STD LTD TD STD LTD TD
Size log of assets Log of sales + + + + + +
Profitability EBITDA over total assets
EBITDA over total sales - - - - - -
Tangibility Fixed assets over total assets
Fixed assets & inventory over
total assets - + + - + +
Free cash flow
(EBIT + depreciation -
capital expenditure) over total assets
- - - - - -
Liquidity Quick ratio Current ratio - - - - - -
Uniqueness Ratio of selling expenses to assets Dummy variables - + - - + -
Growth opportunities
Market-to-book ratio of equity
(listed), growth in total assets (unlisted)
Growth in total sales (unlisted) and
sales & assets (listed)
+ - - + - +
Dividend Dividends payout ratio Dividend yield + + + - - -
Age Log of number of
years since establishment
Number of years since
establishment - - - + + +
Risk Earnings volatility - - - - - -
Government ownership
Percentage of shares held by government
- - -

149
Chapter 6: : Research Methods

150
6.1 Introduction
As discussed in chapter one, the aim of this research is to investigate the
determinants of capital structure of Saudi companies. This requires that the
sample selected should properly represent the population of Saudi companies.
To meet this requirement, the decision was taken to extend the scope of the
sample to include data for both publicly and privately limited companies
(hereafter listed and unlisted companies).
Section 6.2 involves general information about the sample. Section 6.3
provides information about data collection procedure. Section 6.4 presents
information about the guidelines in sample selection. Section 6.5 summarises
variable calculation. Finally, sections 6.6 and 6.7 provide information about
the data issues and testing procedures respectively.
6.2 Sample
Investigating both listed and unlisted companies ensured that different size
companies are embodied in the sample and the companies represent the
different industrial sectors in the Saudi market. The sample provides a good
opportunity to investigate the effects and constraints of stock market listing
(comparison of listed and unlisted companies). The data is likely to be
reliable: it comes from reliable sources (i.e. ministry of commerce & industry
and capital market authority) and high quality accounting standards are used
for reporting.
Merely selecting firms listed on the Saudi stock market would have biased the
sample towards large firms. It would also have severely reduced the sample

151
size. At 31 January 2006, there were eighty public listed companies15 listed on
the Saudi stock market, of which ten are banks, one is an insurance company
and several companies are recent additions. The inclusion of unlisted
companies enables both small and middle size firms to be investigated.
According to the classification of the Ministry of Commerce in Saudi Arabia,
listed companies in Saudi Arabia are the Public Limited Companies (i.e. Joint
Stock Companies) that are traded on TADAWUL, the Saudi Arabia stock
market. In order to be listed, each company needs to go through a two-stage
admission process. First, the company has to apply to the “companies’ general
department” at the ministry of commerce & industry for an initial public
offering. If approved then the next step is to apply to the capital market
authority to be admitted for offering securities to the public and trading. Once
both processes are completed, the securities are officially listed on
TADAWUL. On the other hand, unlisted companies are private limited
liability companies. According to the ministry of commerce & industry, the
limited liability company is a company that consists of two or more
shareholders liable for the company's debts to the extent of their shares in the
corporate capital. However, the number of shareholders in this company shall
not exceed 50 and the corporate capital of this company shall not be less than
five hundred thousand Saudi Riyals. Table 6.1 summarises the differences and
similarities between the listed and unlisted companies.
15 Recently, four new companies, of which one belongs to the manufacturing sector and three are from the service sector, were listed increasing the total number to 84 listed companies.

152
6.2.1 Sources of data
Unlike developed countries, for Saudi Arabia there is no readily available
computerised database such as Datastream or Compustat. Datastream has data
for just one Saudi Arabian company (SABIC). However, there are three
governmental sources that maintain financial statements of Saudi companies
as hard copies. The Capital Market Authority has financial statements of all
publicly listed Saudi companies and these statements are available to the
public. The other two governmental sources are the Ministry of Commerce
and the Ministry of Finance represented by the “companies’ general
department” and the “department of zakat and income tax” respectively.
While the “department of zakat and income tax” maintains all the financial
statements of all types of companies, the “companies’ general department”
maintains only the financial statements of the publicly listed and privately
unlisted companies16. However, accesses to these data are not available
publicly. When requested, access to the “department of zakat and income tax”
data was refused. Access to the “companies’ general department” data was
16 Since both are limited liability companies, they are required by the Companies’ Act to submit their financial statements to the “companies’ general department” annually.
Table 6.1: Differences and similarities of listed and unlisted companies.
Form Number of partners/shareholders
Minimum capital Liability
Registration fee for five
years
Listed Company
Joint-stock Minimum 5 partners. SR 10 million.
Limited to the amount contributed.
SR 8000
Unlisted Company
Limited liability
Minimum 2 partners. Maximum 50 partners. SR 500,000
Limited to the amount contributed.
SR 6000
Source of data: The Ministry of Commerce and Industry web site (www.commerce.gov.sa)

153
granted subject to the receipt of letters from my supervisor and my sponsor in
Saudi Arabia explaining the nature and the purpose of the study. Given the
now stated sources of data, the next section provides general information
about the sources and their credibility.
6.2.1.1 Capital Market Authority
The history of the official Saudi stock market dates back only to 1985, which
means that it is still in its early stage of development. However, its growth in
recent years has led the Saudi government to release new legislation
governing the stock market. In 2003, Royal Decree M30 (the Capital Market
Law) approved the establishment of the Capital Market Authority (CMA).
This newly established authority is a government organization with financial,
legal and administrative independence, which reports directly to the Prime
Minister.
The authority has broad responsibilities for organizing and developing the
stock market. Since its establishment, CMA has been keen to create an
appropriate investment environment. It has issued a number of implementing
regulations to improve transparency and discipline levels. CMA sets specific
and defined criteria for approving listed companies' requests to raise capital.
In particular, it requires that firms issue a prospectus containing detailed
information on the new issuance, a directors’ report, fully audited financial
statements, and other related issues. Moreover, publicly listed firms are
required to announce any material events that take place such as the
acquisition or the disposition of significant amounts of assets. It is also
noteworthy that CMA requires listed firms to submit to the authority quarterly

154
and annual reports on a timely basis; annual reports must be audited as
required by the rules of the authority.
To implement its regulations, the authority imposes strict punishments and
monetary fines on companies that do not follow the disclosure regulations.
For example, according to the CMA official site, the authority stopped the
trading of "Al Baha Investment & Development Co." from April 6, 2005
through July 14, 2005 because the company had not released its financial
statements for the year 2003.
6.2.1.2 Companies General Department
Although the Companies Act was issued by Royal Decree M6 in 1965, the
history of the Companies General Department starts in 1982 when the Royal
Decree M23 amended the Companies’ Act and approved the establishment of
this department. It operates under the supervision of the deputy minister of
internal trade as the figure demonstrates in Appendix 3. According to the
ministry of commerce and industry official web site, the department is
responsible for the implementation of the provisions of the Companies Act
including administrations of:
1. Joint stock companies.
2. Limited liabilities companies.
3. Sole proprietorship companies.
4. Foreign companies’ admission.
5. Companies’ follow-up.

155
6. Professional companies.
7. Communication.
8. Archives.
As can be inferred from the above, the department has wide responsibilities.
One of its main duties is to ensure companies’ compliance with the
Companies Act. Article 89 of the act covers disclosure and states that the
Chairman of the Board of a public limited company is required to release to
the public in the newspaper the financial statements audited in accordance
with the accounting and auditing standards released by the Saudi Organization
for Certified Public Accountants (SOCPA). In addition, the issue of the
newspaper that has the publication of the financial statements combined with
copies of the management report and the report of the independent licensed
auditor must be submitted to the companies’ general department, at least, 25
days before the shareholders’ general meeting. Article 175, on the other hand,
requires the managers of a private limited company to submit to the
companies’ general department copies of financial statements audited in
accordance with the accounting and auditing standards released by SOCPA.
The management report and the report of the independent licensed auditor
copies, however, should be submitted to the department within six months of
the ending of the accounting year.
Overall, the fact that the capital market authority imposes strict disclosure and
transparency regulations on publicly listed firms and that publicly and
privately limited liability companies are legally required to submit audited

156
financial statements to the companies’ general department enhances the
credibility of these sources and the reliability of the data.
6.2.2 Accounting standards and data reliability
The accounting profession in Saudi Arabia has two main characteristics. First,
the government has been supporting a policy of continuous improvement.
According to the SOCPA official site, before the discovery of oil in 1938
there was little demand for auditing in the Kingdom and indeed it was not
until 1965 that the Companies Act introduced specific requirements for
company audit. However, the first law that regulated the auditing profession
in Saudi Arabia was the Law of Certified Accountants, promulgated in 1974
by Royal Decree 43. In 1986, Ministerial Resolution 692 approved the
objectives and concepts of financial reporting and the standards of
presentation and disclosure as guidelines for all CPAs.
The professional accounting body that is responsible for the development of
the accounting and auditing profession in Saudi Arabia, SOCPA, was
established in 1991 under Royal Decree M12. It operates under the
supervision of the Ministry of Commerce. Since its establishment, SOCPA
has been seeking to develop the accounting profession through its objectives
that include:
1. Review, develop and approve accounting and auditing standards.
2. Monitoring the performance of certified public accountants to ensure
their compliance with accounting and auditing standards and with the
provisions of CPA Regulations.

157
3. Establish SOCPA fellowship examination.
4. Conduct research and studies; publish periodicals, books and bulletins
covering accounting and auditing subjects; and participating in local
and international committees and conferences relating to the
profession of accounting and auditing.
The second characteristic of the accounting profession in Saudi Arabia is its
compatibility with the Saudi economic environment. According to the
SOCPA official site, Saudi accounting standards are in general consistent with
international accounting standards except for certain differences to adopt the
economic and legal developments in the country. The five-year Saudi
Development Plans (Ministry of Planning, 1990, 1995, 2000) concentrated on
the government’s intention to privatise the state-owned enterprises, coupled
with the release of the capital market law, recognising the need to improve the
audit profession. Since, its beginning, SOCPA has been actively issuing a
series of accounting and auditing standards through its specialised
committees. As of November 2006, SOCPA has released 17 accounting and
14 auditing standards (According to the SOCPA official site). As recognition
of its works and its credibility, recently SOCPA has become a member of the
International Federation of Accountants (IFAC).
Overall, the establishment of SOCPA combined with the release of the Capital
Market Law have enhanced the quality and the credibility of the accounting
profession in Saudi Arabia. Moreover, the fact that firms included in the
sample are legally required to use accounting standards released by SOCPA
for reporting and auditing give the data the required reliability.

158
6.3 Data collection procedure
6.3.1 Initial sample
The fieldwork took place from the end of September of 2005 to the end of
January of 2006 with another visit in March 2006 to check for those
companies with incomplete records. The first step was constructing the list of
the initial sample that should include information about all listed and unlisted
companies. The initial list of listed companies was constructed based on the
information maintained in TADAWUL web site. This particular web site
provides updated information about the companies’ symbol, long name, short
name and acronym. This procedure identified 80 companies that represent all
companies listed on Saudi stock market at the end of January 2006 (as the
table demonstrates in Appendix 3). Eleven financial companies were dropped
from the initial list of listed firms (10 are banks and one is insurance
company) as their balance sheets have a significantly different structure from
those of non-financial companies.
For unlisted companies, the initial list of 8143 companies was constructed
based on the information provided in the commercial registration directory
run by the archive division at the companies’ general department. This
directory provides information about companies’ names, addresses,
commercial record, and file numbers in the archive for all the companies in
the country.
6.3.2 Industry classification process
Listed companies were classified into eight sectors using the Saudi Stock
Market industry classification codes in TADAWUL. Table 6.2 shows the

159
manufacturing sector to be largest with 37.5%, followed by the service sector
with 23.8%. The electricity and insurance sectors are small with just one
company in each.
Unlike the classification of listed firms, there are no specific codes identifying
the industry sectors of unlisted firms. The archive division classifies
companies into three industrial sectors; namely, manufacturing, service and
agriculture sectors, so the Saudi Stock Market industry classification codes for
manufacturing, service and agriculture sectors were used. As Table 6.2 shows,
the service sector is by for the largest at 65.0%, followed by the
manufacturing sector at 34.7%, and only with 0.3% for agriculture.
Table 6.2: Saudi Stock Market industry classification codes assigned. Listed Unlisted
Sector Sector
classification code
Number of companies % Number of
companies %
Banking 10s 10 12.5 Manufacturing 20s 30 37.5 2824 34.7
Cement 30s 8 10.0 Service 40s 19 23.8 5298 65. 0
Electricity 51 1 1.2 Agriculture 60s 9 11.3 21 0. 3
Telecommunication 70s 2 2.5 Insurance 80s 1 1.2
Total 80 100 8143 100 Source: TADAWUL web site (www.tadawul.com.sa) and the Companies General Department.
6.3.3 Collecting process
Hard copies of the financial statements were collected from the Capital
Market Authority. Three missing sets of financial statements were obtained
from the “companies’ general department” (2 sets) and directly from the
company (one set). For unlisted companies, all the financial statements were
obtained from the “companies’ general department” at the ministry of

160
commerce. This task was very time-consuming, given the large number of
companies the archive maintained and the extensive need for hand searching
for data. The financial statements for companies having a complete set of data
were scanned at the rate of approximately seven companies per day on
average. The data was finally entered manually into an Excel spreadsheet at a
later stage.
6.3.4 Difficulties faced during data collection process
While the people at the companies’ general department were very helpful, the
task of data collection proved difficult:
1. Two files are maintained for each company (financial statements and
contracts and official letters) but documents were sometimes
incorrectly filed.
2. Files for companies with missing data (e.g. closed companies) were
shelved together with other files.
3. The company directory was out of date, since many firms that had
closed down had not informed the department.
6.4 Guidelines in sample selection
Companies without complete data for the whole period under study (i.e. 2000
to 2004) were excluded. For listed companies, the new eight companies were
excluded as well as the Saudi electric company, which resulted from the
merger in 2002 between the ten electricity companies working in the country.

161
For unlisted companies, it was found that data for the majority of companies
was incomplete mainly because of the following:
1. Companies had missing data in a particular year (3045 companies).
2. Companies were new companies (2912 companies).
3. Companies had closed down (1783 companies).
Unfortunately, this drastically reduced the sample available for analysis. To
summarise, the guidelines for selection of the sample of firms were as
follows:
1. Only listed and unlisted companies with limited liabilities were
included.
2. Only non-financial companies were included.
3. Only companies with complete financial information over the whole
period under study were included.
Table 6.3 summaries the sample decomposition of the companies selected for
this study.

162
The following items were hand-collected from the financial statements for
each company for each 5 years 2000-2004:
a. 13 items from the balance sheet.
b. 7 items from the income statements.
c. 2 from the cash flow statements.
d. 2 general items
e. Two further items were collected for listed companies.
Table 6.3: Sample selection process
Sector Banking Manuf. Service Cement Elect. Agric. Telec. Insu. Total
Listed companies Initial sample 10 30 20 8 1 9 1 1 80
Less Bank& Insurance (10) (1) 11
Less new (5) (3) 8 Less
incomplete data
(1) 1
Final dataset 0 25 17 8 0 9 1 0 60
Unlisted companies Initial sample 2824 5298 21 8143
Less incomplete
data (1326) (1716) (3) (3045)
Less new (1077) (1835) (2912)
Less closed down
(302) (1479) (2) (1783)
Final dataset
119 268 16 403

163
Overall, 7,800 (48,360) observations were collected for listed (unlisted)
companies making 56,160 in total.
6.5 Variables calculation
The variables calculation was based on the variable definitions provided in
previous chapter. The short-term, long-term and total debt dependent variables
are used in the present study. The dependent variables use the book value of
the firm’s debt because they are in the form of bank loans. There are 13 (11)
explanatory variables for listed (unlisted) firms that have been identified as
potential determinants of capital structure. Moreover, some of these variables
have alternative proxies.
Table 6.4 summaries the calculation process of the selected dependents and
independents variables including alternative proxies.

164
Table 6.4: Summary of the variables calculation
Variable Proxies
Dependent variables
STD (Bank borrowing repayable in less than one year) / Total assets
LTD (Bank borrowing repayable in more than one year) / Total assets
TD ((STD) + (LTD)) / Total assets
Independent variables
SIZE Log (total sales)
SIZE Log (total assets)
PROFT EBITDA / Total assets
PROFT EBITDA / Total sales
TANG Fixed assets / Total assets
TANG (Fixed assets + inventory) / Total assets
M / B (Total assets - Book Value of Equity + Market value of Equity at the end of each accounting year) / Total assets
G. SALES (Total salest – Total salest-1) / Total salest-1
G.ASSETS (Total assetst – Total assetst-1) / Total assetst-1
RISK SD (Net incomet - Net incomet-1) / Mean of Net income
DIV Dividends paid / Net income
DIVDUM Dummy variables, 1 if company paid dividends and zero otherwise
FCF (EBIT + depreciation - capital expenditure)/TA
CR Current ratio = current assets / current liabilities
QR Quick ratio = (current assets – inventory) / current liabilities
UNIQ Sales & marketing expenses / Total assets
UNIQDUM Dummy variables, 1 if company report Sales & marketing expenses and zero otherwise
AGE Number of years since the company was founded
LOGAGE Log (age)
GOV % of outstanding shares owned by government
GOVDUM Dummy variables, 1 if government hold shares in company and zero otherwise
MINDUM Dummy variables, 1 if the company is belong to manufacturing sector and zero otherwise
FARMDUM Dummy variables, 1 if the company is belong to agriculture sector and zero otherwise
CEMEDUM Dummy variables, 1 if the company is belong to cement sector and zero otherwise

165
6.6 Data issues
The fact that the data, in this dissertation, is a cross-section of firms raises
concerns about the existence of heteroscedasticity. Pindyck and Rubinfeld
(1998) state that “There are occasions in econometric modeling when the
assumption of constant error variance, or homoscedasticity, is unreasonable.
For example if one is examining a cross section of firms in one industry, error
terms associated with large firms might have larger variance than those error
terms associated with smaller firms…”(p. 146). Moreover, it probably arises
when there is a wide range to the X variables, and when using grouped data, in
which each observation is an average for a group and the groups are of
different sizes (Greene, 2000). In the presence of such problem, the OLS
parameter estimators are still unbiased and consistent, but are inefficient (not
BLUE). This means that the variances of the estimated parameters are not the
minimum variances. Further, the estimated variances of the estimated
parameters will be biased estimators of the true variance of the estimated
parameters.
Another issue concerns the limited dependent variable in which the dependent
variable (the level of debt) can take values between zero and one. Maddala
(1983) argues that this problem occurs when dependent variables are limited
in their range because of some choice mechanism. In this dissertation, the
dependent variable is defined as the book value of debt (total, long or short
term) divided by the book value of total assets. Thus, the values of the

166
dependent variable are generally constrained within the range of zero to one
though this value can exceed one in extreme cases17.
The existence of the lower limit (i.e. zero) and the upper limit (i.e. one) means
that any results obtained from a regression model that are outside these limits
are illogical. Maddala (1983) demonstrates that if an OLS estimator is used
with a limited dependent variable, the residual will be correlated with the
explanatory variables and, thus, the estimated parameters will be inconsistent
and downward-biased (i.e. underestimate the true effect). Greene (2000)
argues that such limits may cause the error term in an OLS regression to be
heteroscedastic and the estimate will be biased toward zero. Generally, studies
have dealt with this issue by using the estimation technique known as Tobit
model. This model excludes the lower range of values (left truncation), upper
range of values (right truncation), or both from the sample and, thus, it will
produce slopes and standard errors that are less biased and more efficient than
those obtained from OLS regression. In the framework of capital structure
empirical studies, however, Rajan and Zingales (1995) and Bevan and
Danbolt (2002) found that censored Tobit results are extremely similar to
those obtained by employing OLS technique.
Another common issue is when the data contain outlier observations. The
outliers are the data points that are more than an arbitrary distance from the
regression line (Pindyck and Rubinfeld, 1998). In another words, they are the
data points that deviate from the rest of the data. In the presence of outliers,
17 This occurs when the company’s cumulative loss exceeds its capital. In this study, three unlisted companies reached this circumstance. However, according to article (180) of companies Act, the shareholders must provide financial guarantee letter that includes the shareholders commitment to pay the company’s debt if they decide to continue the business.

167
OLS estimation is inefficient and can be biased because its estimates are
dragged towards the outliers, and because the variance of the estimates is
artificially inflated. As is the case in most data, some outliers will be expected
in the present study.
6.7 Testing procedure
This section outlines testing procedures designed to test the data and the
hypotheses using techniques that take the above issues into account.
6.7.1 Data testing
The data testing is divided into two parts. The first pre-estimation procedure
seeks to ensure the data is clean from outliers. The box plot based on 5 (inter-
quartile range) will be used to identify outliers in this dissertation due to the
wide variation in the samples.
The second part is post-estimation procedure, the objective of which is to
ensure the estimation robustness. One instance in which robust estimation
should be considered is when there is a strong suspicion of heteroscedasticity.
To test for heteroscedasticity, The Breusch-Pagan/Godfrey test was used. In
the presences of the heteroscedasticity, the White’s (1980) correction for
heteroscedasticity was followed. Moreover, beside the correlation matrix,
Variance Inflation Factor was used to test for multicollinearity. DFITS was
employed to identify influential observations.

168
6.7.2 Hypotheses test
The aim of this part is to investigate the theory and empirically suggested
determinates of capital structure for both listed and unlisted companies.
Although the capital structure literature provides information about the
variables that influence capital structure and the nature of the influence, there
is no certain model that can appropriately formulate the relationship.
However, the majority of empirical analyses use a model in which debt ratio
is regressed on a list of explanatory variables.
Moreover, empirical analysis has traditionally used different types of data
analysis, namely, pure time-series, pure cross-sectional, pooled and panel.
However, few studies have been found in the literature to implement more
than one type of analysis. In their work, Bevan and Danbolt (2004) found
significant differences in the results obtained by employing pooled OLS from
those obtained by using panel analysis, in particular, fixed effects estimation.
Therefore, it is worth to investigate to what extent the results are sensitive to
the changes in the estimation based on data types. To extend Bevan and
Danbolt’s (2004) work, the analysis will be extended to involve also pure
time-series and pure cross-sectional data regression analyses.
Moreover, to test the hypotheses that previously developed in chapter 4, there
are two general estimated models. The first one is examining the relationship
between the debt ratios and capital structure determinants for listed firms. The
second is examining the relationship between the debt ratios and capital
structure determinants for unlisted firms.

169
6.7.2.1 Pooled time-series and cross-sectional analysis
Generally, comparison studies start first with pooled regression. This model
has a single overall intercept term (α) and coefficient estimates are based on
variation between firms and over time. Accordingly, the estimated equations
are as follow:
Listed
Leverage i, t = α + β1 SIZE i, t + β2 PROFT i, t + β3 TANG i, t + β4 M/Bi,t + β5
RISK i,04 + β6 DIV i, t + β7 FCF i, t + β8 CR i, t + β9 UNIQ i, t + β10 AGE i, t + β11
GOV. i, t+ β12 MINDUM + β13 FARMDUM + β14 CEMEDUM+ ε i, t
Unlisted Leverage i, t = α + β1 SIZE i, t + β2 PROFT i, t + β3 TANG i, t + β4 G.
Sales i, t + β5 RISK i, 04 + β6 DIV i, t + β7 FCF i, t + β8 CR i, t + β9 UNIQ i, t + β10
AGE i, t + β11 MINDUM + β12 FARMDUM + εi,t
Where i denote the individual firms, t refers to the time period (i.e. from 2000
to 2004). Moreover, leverage refers to each of the leverage measures (i.e. total
debt to total assets, short-term debt to total assets, and long-term debt to total
assets). Due to its construction, risk proxy refers to year 2004.
It is important to note that there is only one company from the
telecommunication sector in the listed sample. Due to the nature of its
business, it is included with the service sector. In both samples, the service
sector is selected as the base because it constitutes the largest sector in the
unlisted sample and the second largest in listed sample; it is also expected to
be the one with lower levels of debt. Moreover, in unlisted sample regression

170
GOV and CEMEDUM variables are excluded since there were no unlisted
government-linked and cement companies included in the sample.
However, one issue associated with pooled analysis is that firms in the sample
are included more than once over study period. This in turn may potentially
overstate t-statistics (Barclay et al, 1995 and Bevan and Danbolt, 2004).
6.7.2.2 Cross-sectional data analysis
In pure average cross-sectional estimation, the two equations of the listed and
the unlisted sample will be also estimated for the three debt elements. The
regression estimation includes the 2004 debt level as dependent variable and
the explanatory variables are four year average (2000-2003) except risk proxy.
This process will produce more robust estimation since lagging will reduce
the potential reverse causality between dependent and explanatory variables
while averaging will reduce the effect of fluctuation in the explanatory
variables (Titman and Wessels, 1988, Rajan and Zingales, 1995 and Bevan
and Danbolt, 2002). Accordingly, the estimated equations are as follow:
Listed
Leveragei, 04 = α + β1 SIZEi, t-4 + β2 PROFTi, t-4 + β3 TANGi, t-4 + β4 M/Bi, t-4
+ β5 RISKi, 04 + β6 DIVi, t-4 + β7 FCF i, t-4 + β8 CR i, t-4 + β9 UNIQ i, t-4 + β10
AGE i, t-4 + β11 GOV. i, t-4 + β12 MINDUM + β13 FARMDUM + β14
CEMEDUM+ εi
Unlisted

171
Leverage i, 04 = α + β1 SIZE i, t-4 + β2 PROFT i, t-4 + β3 TANG i, t-4 + β4 G.
Sales i, t-4 + β5 RISK i, 04 + β6 DIV i, t-4 + β7 FCF i, t-4 + β8 CR i, t-4 + β9 UNIQ
i, t-4 + β10 AGE i, t-4 + β11 MINDUM + β12 FARMDUM + εi
Where i denote the individual firms, t-4 refers to the average for the previous
four years (i.e. from 2000 to 2003). Moreover, leverage refers to each of the
leverage measures (i.e. total debt to total assets, short-term debt to total assets,
and long-term debt to total assets) at year 2004.
Though it reduces the effects of the dispersion across firms, averaging the
sample over the period of study ignores the time effects that should be
considered in the analysis. Accordingly, it is important to investigate the
association between debt elements and company characteristics using panel
model since it incorporates both time-series as well as cross-sectional effects.
6.7.2.3 Yearly cross-sectional estimation
To illustrate the importance of the issues associated with pooled and cross-
sectional data analyses and to show the advantage of using panel data over
these two analyses, it is important to run yearly cross-sectional estimation. In
this analysis, the two equations of the listed and the unlisted sample are
estimated for the three debt elements (i.e. short and long-term and total debts)
for every year covered in this study (2000 through 2004). This process will
result in estimating a total of 30 models of which 10 models are estimated for
each debt element.

172
6.7.2.4 Panel data analysis
Two approaches may be used in panel data analysis: fixed effects or random
effects. The fixed effects model includes an intercept for each firm to capture
firm-specific effects and coefficient estimates reflect within-firm variation. On
the other hand, the random effects model assumes firm-specific effects are
random variables and models them as part of the error term and coefficient
estimates are based on average variation between firms and within firms.
Generally, the choice between the two approaches depends on the Hausman
specification test for the random and fixed effects.
However, the panel data model, in particular the fixed effects model, has more
improvements in estimation than time-series, cross-sectional and pooled
models by controlling for firms heterogeneity bias. Baltagi (1995) argue that
if omitted explanatory variables are correlated with explanatory variables
included in the model, time-series, and cross-sectional studies not controlling
for such heterogeneity run the risk of obtaining biased and inconsistent
resulting estimates. Barclay et al. (1995) and Bevan and Danbolt, (2004)
argue further that failure to control for time-invariant firm-specific factors
may cause to observe over-estimate bias in the significance of coefficient
under pooled OLS. Since fixed effects model assumes that omitted variables
are constant over the time frame of study (time-invariant variables) and focus
on within-firm variation, the heterogeneity bias is avoided.
Accordingly, given the potential importance for time-invariant firm-specific
heterogeneity, fixed effects approach will be used in the analysis. Moreover,
three explanatory variables, namely, industries dummies, government

173
ownership, and Risk are excluded from the estimated models. While
industries dummies and government ownership variables are excluded from
the estimation because they do not vary over time; the risk measure is omitted
due to its construction issue.
6.7.3 Estimation technique
A number of previous studies have employed different regression techniques
to estimate models: linear structural equation modelling technique (Titman
and Wessels, 1988); Logit estimation procedure (Jordan et al., 1998); Tobit
estimator model (Rajan and Zingales, 1995 and Bevan and Danbolt, 2002);
panel-data estimation procedure (Antoniou et al., 2002 and Bevan and
Danbolt, 2004) In the present study, a large number of companies had zero
debt as Table 6.5 demonstrates.
Moreover, Greene (2000, p. 924) states that the “Tobit model remains the
standard approach to modelling a dependent variable that display a large
cluster of limit values, usually zeros”. In order to overcome the truncation
issue and to retain all the desired regression properties, the Tobit estimation
technique will be employed in this dissertation but not for fixed effects model.
Table 6.5: summary number of dependent variable with zero value
STD LTD TD No. Of cases with 0 % No. Of cases with 0 % No. Of cases with 0 %
Listed 90 30 131 44 87 29 Unlisted 789 39 1626 81 752 37

174
6.8 Conclusion
This chapter presented the research method followed in this study. The sample
involves data from both listed and unlisted companies. Unlike developed
countries, for Saudi Arabia there is no readily available computerised database
such as Datastream or Compustat. Accordingly, the data collection has been a
major task in this study. The data has been hand-collected from reliable
sources (i.e. ministry of commerce& industry and capital market authority).
The final sample includes data for 463 companies of which 60 companies are
listed and 403 companies are unlisted over the period of 2000 to 2004.
Furthermore, this chapter discussed testing procedures designed to test both
the data and the hypotheses under investigation. Pre-estimation and post-
estimation test procedures are followed in this study to ensure the data is clean
from outliers and ensure the estimation robustness. To test the hypotheses and
the sensitivity of the results, various model and estimation techniques are
proposed. Cross-sectional (yearly and average), pooled and panel models will
be employed in this study. To estimate these models, Tobit, OLS and fixed
effects estimation techniques will be undertaken.

175
Chapter 7: RESULTS

176
7.1 Introduction
This chapter present the results of capital structure determinants in Saudi
Arabia. Specifically, this chapter seeks to provide answers to the research
questions in the context of the culture and institutional aspects of Saudi
Arabia. The chapter starts with a detailed debt analysis. Such analysis will
provide the basis for the interpretation of determinates of the capital structure
of the listed and unlisted companies in Saudi Arabia.
This chapter is organised as follows: section 7.2 presents debt analysis.
Section 7.3 presents the analysis of the determinants of the capital structure
that includes pooled, average, yearly panel data analyses. Section 7.4 presents
the alternative pro xies analysis. Section 7.5 presents robustness check.
Finally, the chapter end with section 7.6 which presents the chapter
conclusion.
7.2 Debt Analysis
Previous cross-country studies emphasis the importance of institutional
characteristics in determining the choice between debt and equity financing.
Rajan and Zingales (1995), argue that the difference between the so-called
bank-oriented countries Japan, Germany, France and Italy and in the so-called
market-oriented countries US, UK and Canada is reflected in the level of
leverage. This part of analysis focus on debt level of listed and unlisted
companies in light of the socio-cultural and institutional characteristics
provided in chapter four.

177
In order for us to have a clear vision about the capital structure determinants
in Saudi Arabia, it is very important to have a close look at the debt elements
of the listed and unlisted companies. Bevan and Danbolt (2002) suggest that
analyses of gearing based only upon long-term debt provide only one piece of
the picture, and a fuller understanding of capital structure and its determinants
requires a detailed analysis of all forms of corporate debt. Table 7.1 provides a
descriptive summary of the short-term debt (STD), long-term debt (LTD),
total debt (TD), and total liabilities (TL) ratios (all scaled by total assets) for
listed and unlisted companies.
From this table, it can be seen that Saudi listed firms generally have a lower
level of total debt than unlisted firms do (10.9% for listed compared 16.3% for
unlisted). However, at the disaggregate level, unlisted firms rely more havely
on short-term debt (12.9% for unlisted compared to 5.3% for listed) but on
substantially lower amounts of long-term debt than listed firms (5.7% for
Table 7.1: Summary statistics of financial ratios for listed and unlisted firms.
Debt Type STD LTD TD TL
Panel A: Listed companies
Mean 5.3% 5.7% 10.9% 27.2% Median 1.5% 0.8% 4.0% 24.0%
SD 8.3% 9.5% 13.8% 16.7 Min 0.0% 0.0% 0.0% 0.05% Max 54.4% 45.0% 57.9% 83.1%
N 60 60 60 60
Panel B: Unlisted companies
Mean 12.9% 3.5% 16.3% 51.51% Median 4.2% 0.0% 7% 53.24%
SD 18% 11% 21% 24% Min 0.0% 0.0% 0.0% 0.1% Max 102.3% 124.1% 124.1% 159.8%
N 403 403 403 403

178
listed compared to 3.5% for unlisted). This may reflect the fact that unlisted
firms are more likely to be small firms; thus, they do not have access to the
capital markets and nor do they have easy access to long-term bank debt;
hence, they rely on short-term debt and on their profit to finance growth.
The table further shows that total liabilities on average accounted for 27.2%
and 57.5% of the total assets for listed and unlisted companies respectively.
This highlights the striking differences between listed and unlisted firms in
term of financing choice. The table shows that, in general, listed firm are less
dependent on debt elements compared to unlisted firms. This in turn indicates
that listed firm are using alternative financing instruments. Accordingly,
further analysis has been carried out to determine firm’s financing preference.
Figure 7.1 shows that both groups rely heavily on external rather than internal
financing18. However, listed companies seem to finance their growth mainly
by using equity with about 57%, followed by liability with about 27% and
finally internally generated funds with about 16%. However, Table 7.1 shows
that total debt constitutes about 11% of total assets (about 40% of total
liability).
18 The calculation method is as follow: Internal finance = (retained earning+ provisions)/ assets External finance (liability) = total liability/assets External finance (equity) = 1- Internal finance - External finance (debt)

179
Figure 7.1: Financial preferences
Nevertheless, the high level of equity financing and the low level of debt
financing may reflect the institutional characteristics of Saudi Arabia. It has
been observed in chapter four that market capitalization has an average
growth of 53.8% over the period 2000 to 2004 with the number of companies
listed in the market remaining relatively constant. This implies that the market
has witnessed increase in both the price and the number of shares of existing
listed companies over the period. According to equity market timing
consideration, firms tend to raise substantial amounts of equity capital when
the equity market is perceived to be more favourable (Baker and Wurgler,
2002). Therefore, the increase in the share price reduces the cost of equity, in
particular when firms perceive their shares valuations are high and, thus
motivate the existing companies to raise equity, which is reflected in the high
level of equity observed in the above figure.
The low level of observed debt in the listed sample can be explained also by
the weak legal system and weak enforcement of the law in Saudi Arabia
compared to developed countries (assuming well-developed legal systems). It
Internal vs External Financial preferences (Listed & Unlisted)
0.0%
10.0%
20.0%
30.0%
40.0%
50.0%
60.0%
INTERNAL TLIABS EQUITY
Internal - Liability -Equity
Rat
ios (
%)
LISTEDUNLISTED

180
has been pointed out earlier in chapter four that bankruptcy law is more
friendly to creditors, thus, banks impose costly requirements in their long-
term lending policy (e.g. sufficient collateral assets at least to cover 100% of
the value of the loan). This in turns increase the cost of debt. On the other
hand, the lacks of enforcement of company law, individual shareholders do
not have sufficient investment protection. Share capital has become somewhat
a ‘‘free’’ source of finance. Moreover, it has been pointed in chapter four that
corporate bond market virtually does not exist in Saudi arabia due to the
constrain imposed by the company Law on the issuance of bond, which states
that the total amount of bonds a company may issue to not exceed paid up
capital. Such constrain keeps the issuing cost of corporate bond expensive
and, thus, inhibited the popularity of such debt instrument among Saudi firms.
Saudi companies are also subject to pay annually zakat that is 2.5 % of the
zakat base. This trivial level of tax (Zakat) makes the tax advantage of debt
suggested by trade-off theory negligible. Barakat and Rao (2004) argue that,
in the non-tax Arab countries (included is Saudi Arabia), the use of debt is no
different from the use of equity as the payout on both is treated the same in
the absence of tax advantages of debt for the corporation or tax advantage of
equity for the investor. Therefore, in the absence of tax advantages of debt,
Saudi firms prefer to issue the cheap equity rather than costly debt.
On the other hand, Figure 7.1 shows that unlisted companies use external
finance other than equity, which is mainly total liability with about 52%,
followed by internally generated funds with about 25% and finally equity with
about 23%.

181
7.2.1 International comparison
In general, the indebtedness of Saudi companies is very low compared to the
level of debt of the companies in other countries found in previous studies. If
compared to the international data found in Rajan and Zingales (1995), the
Saudi listed firms can be regarded as significantly under levered in term of
total debt. Indeed, the 10.9% of total debt is far below the 37%, 52%, 39%,
46%, 46%, 29%, and 39% for United States, Japan Germany, France, Italy,
United Kingdom, and Canada respectively. To further confirm this fact,
Figure 7.2 provides a comparison between the debt level components of the
Saudi listed firms and their UK counterparts based on 1997 data found in
Bevan and Danbolt (2004)19.
Figure 7.2: Debt components comparison between Saudi listed and UK firms
Debt level comporaison between Listed Saudi & UK companies
0.00%10.00%20.00%30.00%40.00%50.00%60.00%
TLIABS BBGT1 BBLT1 BBGT1+BBLT1Debt type
Rat
ios (
%)
UKSA
From this figure, it appears that there is a significant difference in financing
preferences between Saudi and UK companies in terms of total liabilities ratio
(TLIABS). While this ratio constitutes 48.94% of the total assets of UK
companies, it forms 27.2% of the total assets of Saudi companies. On the 19 These data extracted from table A1 (page, 65). BBLT1 refers to the average of bank borrowing repayable in less than one year and BBGT1 refers to the average of bank borrowing repayable in more than one year.

182
other hand, it can be seen that there are insignificant differences between
average total bank debt (TD) of Saudi companies and the total bank barrowing
(BBLT1+BBGT1) of UK companies (10.9% versus 10.5%). In term of short-
term and long-term bank debt, also there are insignificant differences
observed as the figure demonstrate. However, securitized debt is found to
forms about 44% of the long-term debt in Bevan and Danbolt’s data.
Therefore, it is not surprise to observe lower long-term debt among Saudi
companies since there is very weak existence for bond debt.
Since European SMEs studied by Hall et al. (2004) demonstrates almost the
same average size of unlisted companies, a comparison between them is
conducted. The mean of the size of Saudi unlisted firms as measured by the
total assets is £19.3m, as we will see shortly in descriptive statistics, compared
to the average size £19.4m of the European SMEs found in Hall et al. (2004).
This implies that the majority of unlisted firms are SMEs. In terms of short-
term debt, the 12.9% ratio of total assets is far below the 62.9%, 49.8%,
48.3%, 48.0%, 47.5%, 46.4%, 44.8%, and 38.2% for Italy, Spain, UK,
Portugal, Ireland, Netherlands, Belgium, and Germany respectively. On the
other hand, in terms of long-term debt, Saudi companies with 3.9% are second
largest before Dutch companies with 2.1%, and far below German firms, the
most heavily reliant on long-term debt with 28.5%.
7.3 Determinants of capital structure analysis
7.3.1 Descriptive statistics
In the previous chapter, there are 11 variables for listed firms and 10
variables for unlisted firms identified as potential determinants of capital

183
structure; some of these variables have alternative proxies. Table 7.2 provides
summary statistics for the variables for the unlisted and listed companies
respectively. All explanatory variables are detailed in terms of mean, median,
maximum, and standard deviation values.
From this table, it can be seen that the original scale of the measures of size
are reported to provide meaningful information. Generally, the mean value of
total sales of listed firms is greater than unlisted firms by about 16 times with
SAR1510.7m and SAR97.2m (about £232m and £15m) for listed and unlisted
companies respectively. Similarly, the listed firms’ mean value of total assets
is far greater than unlisted firms by about 2700% with SAR3389.9m and
SAR125.4m (about £521m and £19.3m) for listed and unlisted companies
respectively. These observed information confirm the fact that listed firms are
greater than unlisted firms in term of size.
Contrary to the findings for size, it seems that unlisted firms are more
profitable than listed firms. On average, the EBITDA accounted for only 9.8%
of the total assets of listed firms and 28.3% of the total assets of unlisted
firms. However, the mean of return on sales (ROS) for unlisted companies
with 26.9% is slightly higher than 26.5% for listed firms. This finding reflects
the fact that the profitability measure is very sensitive to which size variables
(i.e. total assets or total sales) is used as the denominator of the profitability
proxy at least in this study.

184
20 ₤1 is approximately equal to about 6.5 SAR.
Table 7.2: Summary statistics of explanatory variables of listed and unlisted companies Sales and total assets represent the original value in Saudi Riyal, ROA and ROS refer to EBITDA/Total assets and net income /Sales respectively, TANG1 and TANG2 are fixed assets / Total assets and fixed assets & inventory / Total assets respectively, FCF refers to the ratio of (operating cash flow- capital expenditure) to total assets, CR and QR refer to current ratio and Quick ratio respectively, UNIQ represents the ratio of marketing & selling expenses to sales, M/B is the market to book ratio, G. Sale and G. Assets refer to percentage change in total sales and percentage change in total assets over the period of study respectively, DIV is the ratio of dividend paid to annual income, RISK is the standard deviation of the first difference in annual earnings over mean earnings over the period of study, , Age is the number of years since the company was founded, GOV is the percentage of shares held by the government MIN, FAR, CEM and SER refer to manufacturing, farming, cement and service sectors dummy variables respectively.
SIZE
(Sales in m SAR20)
SIZE (Assets in m
SAR) ROA ROS
TANG 1
TANG 2
M/B G. Sale G. Assets RISK DIV FCF CR QR UNIQ AGE GOV MIN FAR SER CEM
Panel A: Listed companies
Mean 1,510.7 3,389.9 9.8% 26.5% 44.7% 53.6% 1.6 20.5% 8.9% 0.24 38.1% 4.8% 2 1.5 6% 20.4 9.8% 41.7% 15.0% 30% 13.3%
Median 185.2 739.5 8% 26% 48.6% 58.5% 1.3 4.6% 0.0% 0.11 28.8% 4% 1.4 1 3% 19 0
Max 68,539.1 124,944.6 42% 111% 92.5% 92.8% 6.1 1165.3% 483.8% 12.98 340% 32% 13 13 57.5% 52 73%
S. D 6,354.5 13,986.7 8.7% 29.9% 24.7% 25.2% 1.04 95.5% 39.3% 1.69 116.7% 10.1% 1.9 1.7 8.1% 10.5 18.4%
Panel B: Unlisted companies
Mean 97.2 125.4 28.3% 26.9% 25% 43% na 53.5% 11.6% 1.2 50.3% 6.5% 2.28 1.7 5.1% 14.2 na 29.5% 4.0% 66.5% na
Median 28.8 28.2 23.6% 25% 17.7% 43.8% na 1% 0% 0.23 0.0% 4.4% 1.4 1.05 0% 13 na
Max 7,153.9 13,507.7 373.2% 124.6% 95% 99.4% na 30785% 1754.5% 721.5 3393.6% 776.9% 52.5 40 116.7% 50 na
S. D 305.6 668.4 23.4% 16% 23% 26.9% na 929.2% 67.7% 31.12 190.1% 28.3 3.4 2.8 9.2% 7.4 na

185
The means of the asset structure proxies of listed firms (i.e. the ratio of fixed
assets & inventory and the ratio of net fixed assets both scaled by total assets)
accounted for 53.6% and 44.7% of total assets respectively. These levels are
higher than those observed in the unlisted firm sample, which are 43.1% and
25.1% of total assets respectively. Beside the fact that listed firms are larger
than unlisted firms in term of assets, it is reflect the fact that the majority of
companies in the unlisted sample operate in the service sector, which is
characterized by less intensity of fixed assets. With regard to the free cash
flow, liquidity, and uniqueness variables, the table illustrates that, on average,
unlisted companies have slightly higher ratios than those listed companies,
excluding the uniqueness ratio.
In terms of growth, the mean of the market to book ratio for listed firms is 1.6.
This may reflect that the sharp increase in stock prices during the study period
made the market value of equity higher than its book value. However, in terms
of growth in sales and assets, the table demonstrates that unlisted firms are
witnessing much higher growth than listed firms.
The table also shows that, on average, 38% of the earnings of listed firms are
paid out as dividends, which is considered relatively high. This implies that
listed firms are paying dividends for future external equity financing since
equity is the main source of finance (figure 6.1). This is consistent with (La
Porta, et al., 1999) argument that, in developing countries, firms pay dividends
to build the reputation to market future stock issues. For unlisted companies,
about 50% of the earnings are paid out as dividends. This implies that the
shareholders of unlisted firms want to enjoy half of the company’s earnings

186
and retained the other half for the future growth. The volatility in annual
earnings as a measure of risk indicates that unlisted firms are more risky than
those listed firms. Also, it can be seen from the table that listed firm are older
than unlisted firms. Finally, it can be observed that firms operating in the
service sector form the majority (66.5%) of unlisted sample, while the
majority (41.7%) of listed firms are in manufacturing.
7.3.2 Data testing
It has pointed out in the previous chapter that box plot procedure based on 5
(inter-quartile range) is used to identify outliers in this dissertation due to the
wide variation in the samples. Table 7.3 summarises the number of outliers
identified for each variable and their percentage for the listed and unlisted
samples.
Table 7.3: Summary of outliers Outliers
Variables Listed Unlisted No. (%) No. (%)
STD 2 0.7 0 0.0 LTD 3 1.0 98 4.9 TD 0 0.0 0 0.0
SIZE (sales) 0 0.0 0 0.0 SIZE (assets) 0 0.0 0 0.0
ROA 0 0.0 102 5.1 ROS 2 0. 7 49 2.4
TANG1 0 0.0 0 0.0 TANG2 0 0.0 0 0.0
M/B 0 0.0 G. Sales 13 4.3 62 3.1
G. Assets 13 4.3 43 2.1 RISK 32 10.7 114 5.7 DIV 1 0.3 38 1.9 FCF 0 0.0 16 0.8 CR 4 1.3 100 5.0 QR 11 3.7 82 4.1
UNIQ 1 0.3 9 0.4

187
After outlier observations were detected, the next step is cleaning the sample
from outliers. There are several approaches to dealing with outliers. A simple
method and the one used in this study is to winsorise the data by replacing the
extreme observations with the nearest un-outlier neighbours.
Moreover, investigation of the present of the influential observations is also
carried out in the present study using DFFITS process. As the table in the
appendix 8 shows, numbers of influential observations (in both samples, less
than 1% of the total observations) are identified in all models. Accordingly,
influential observations are excluded from the models and reduced sample
models are estimated. The unbalanced panel date fixed effect estimation
technique results reveal that the effect of influential observation is marginal in
unlisted sample and somewhat more important in listed sample. This most
likely is due to sample size considerations.
In the listed sample, with 4 out of the 300 appear to be influential
observations, the major changes are observed in total debt model. The
insignificant positive relationship with size and uniqueness observed under
unreduced regression turn into significant at 1% and 5% levels respectively
while the insignificant negative relationship with liquidity and age turn into
significant at 1% and 5% levels respectively. Apparently, these changes
reflect the changes observed at disaggregate levels. In short-term debt model,
with 5 observations appear to be influential observations, the insignificant
negative relationships with size turns into positively significant at 5% level
and the insignificant negative relationships with age turns into significant at
10% level. With only 2 observations seem to be influential observations, there
188
is no major change observed in long-term debt model except the increases in
the significant level of the relationships with ROA and uniqueness proxies.
Accordingly, these specifics relationships should be interpreted with caution
in the analysis section. In unlisted sample, though 13, 17 and 13 out of 2015
are identified as influential observations in short-term, long-term and total
debt respectively, the significant and the direction of the relationships of
variables remain unchanged other than the positively significant at 1%
relationship between tangibility and long-term debt decreased into 5%
significance level. In light of these evidences, one would conclude that, the
influence of the influential observations is minimal at least in unlisted sample.
7.3.3 Result analysis
Prior empirical studies have traditionally used different estimation methods
based on the types of data to investigate the determinants of firm’s capital
structure. The most common methods are pooled, pure average cross-
sectional, pure yearly cross-sectional and panel data analyses. Therefore, it is
worth to investigate to what extent the obtained results are sensitive to the
changes in the estimation methods. In their work, Bevan and Danbolt (2004)
found significant differences in the results obtained by employing pooled OLS
from those obtained by using panel analysis, in particular, fixed effects
estimation. Accordingly, pooled, pure average cross-sectional, pure yearly
cross-sectional and panel data analyses are curried out in this dissertation to
provide a comprehensive analysis about the determinants of firm’s capital
structure of listed and unlisted Saudi companies. The STATA application
version (9) was used here to run the regressions. Moreover, Harris and Raviv

189
(1991) emphasise that the interpretation of the results must consider the
differences in measuring both debt ratios and the dependent variables of
interest. Indeed, the results of the meta-analysis procedure (chapter three)
show that the debt and the attributes measurements are sensitive cases in
determining the observed relationship with leverage. Therefore, different debt
elements and alternative proxies have been employed in this dissertation to
draw a general conclusion about the real determinants of listed and unlisted
Saudi companies’ capital structure.
7.3.4 Pooled analysis
Using Tobit procedure, the debt ratios were censored at one, as there was
several observations found above one. Table 7.4 presents the results for both
listed and unlisted firms respectively. The table shows that all models report
significant χ2 indicating the rejection of the null hypothesis of joint
insignificance of the coefficients at less than 1% level. In addition, adjusted
R2 is reported instead of the default output associated with TOBIT technique
pseudo-R2. According to STATA Corp, the pseudo-R2 has no real meaning in
terms of goodness-of-fit and, thus, it is better to calculate the R2 between the
predicted and observed values21. The calculated R2 is similar to the one found
in the OLS regression (www.stata.com/support/faqs/stat/pseudor2.html).
Moreover, Graham et al. (1998) also report R2 with TOBIT estimation.
Nevertheless, the table shows that the adjusted R2s’ differ among all models in
both samples. The Breusch-Pagan/Cook-Weisberg test and the variance
21 To calculate the R2 in Stata, the following commands were used after each regression: predict p, quietly correlate p dependent variable and then display r^2. Then, adjusted R2 is calculated as follow = 1- ((1 - R2)((N-1) / (N - K))) Pindyck and Rubinfeld (1998, p. 90)

190
inflation factor (VIF) are also reported and they will be discussed later in
robustness check section.
7.3.4.1 Size
The proxy for size attribute is the natural log of assets. Table 7.4 shows that
the regression coefficients of both samples for the effect of size on all debt
ratios are systematically positive and statistically significant at the 1% level
other than the relationship with short-term debt in listed sample. The results of
the correlation with total debt reveals positive and significant at 1% with the
highest magnitude observed among debt ratios in both samples. This finding
is also consistent with the finding of previous empirical researchers using log
of assets as proxy for size, which show that about 98% of the significant
results are positively correlated with total debt. Moreover, these results appear
to be driven by the results observed at disaggregate level. In listed sample, it
seems that the obtained positively significant at 1% level relationship with
long-term is the driving force since the relationship with short-term is
insignificant. This implies that large firms rely more on long-term debt when
they chose debt to finance their growth. In unlisted sample, on the other hand,
the obtained positively significant at 1% level relationship with both short-
term and long-term debt ratios appears to be responsible for the results with
total debt. This in turn implies that small-unlisted firms face difficulties in
accessing both short-term and long-term banks debt.

191
Table 7.4: Pooled regression results of listed & unlisted sample based on Tobit estimation
technique STD, LTD and TD refer to short-term, long-term, and total debt respectively. Size is the log of total assets. ROA refers to the return on assets. TANG1 is the ratio of fixed assets to total assets. FCF refers to the earnings before interest and tax plus depreciation less capital expenditure normalised by total assets. QR refers to the quick ratio. UNIQ is the ratio of selling & marketing expenses to total sales. M/B refers to the market to book ratio and G.ASSETS is the growth in assets for listed and unlisted companies. DIV refers to dividends paid divided by net income. LOGAGE is the log number of years since firm founded. RISK is the standard deviation of the first difference in annual earnings over mean of annual earnings. GOV is the percentage of shares held by the government. MINDUM, CEMEDUM, and FARMDUM refer to manufacturing, cement, and farming sectors dummy variables respectively. White’s heteroskedastic-consistent covariance matrix estimation is used to adjust for heteroskedasticity. Probability of (Z) is in parentheses. Notes: *, **, and *** denote significant at the 10, 5, and 1% respectively (two tails).
Listed (n = 300) Unlisted (n = 2015) Exp.
Sign STD LTD TD VIF STD LTD TD VIF
0.016 0.033*** 0.050*** 1.82 0.059*** 0.019*** 0.092*** 1.4 LOGASSETS + (0.101) (0.003) (0.001) (0.000) (0.000) (0.000)
0.224*** -0.227***
0.003 1.77 -0.046** -0.040*** -0.118*** 1.4 ROA - (0.000) (0.000) (0.966) (0.037) (0.000) (0.000) 0.001 0.086*** 0.086** 1.32 -0.115*** 0.092*** 0.035 1.3 TANG1 +/- (0.936) (0.000) (0.011) (0.000) (0.000) (0.110)
-0.248*** -0.054 -0.339*** 1.74 -0.124*** -0.011** -0.144*** 1.3 FCF - (0.001) (0.450) (0.002) (0.000) (0.020) (0.000) -0.010** -0.005 -0.016*** 1.32 -0.032*** 0.002* -0.028*** 1.2 QR - (0.020) (0.122) (0.004) (0.000) (0.052) (0.000) -0.014 -0.027 -0.055 1.73 0.001 0.049*** 0.078 1.2 UNIQ - (0.801) (0.661) (0.531) (0.982) (0.005) (0.158) -0.003 -0.006 -0.008 1.81 M/B Ins (0.402) (0.157) (0.192)
-0.044*** -0.011*** -0.067*** 1.1 G. ASSETS Ins (0.001) (0.004) (0.000) -0.009 -0.024** -0.034** 1.19 -0.002 -0.002 -0.005 1.1 DIV -/+ (0.173) (0.016) (0.012) (0.609) (0.237) (0.223)
-0.048** -0.026 -0.074** 1.32 0.081*** -0.020*** 0.055*** 1.1 LOGAGE -/+ (0.033) (0.228) (0.020) (0.000) (0.000) (0.004) -0.001 0.003 0.002 1.07 0.0001** 0.0001 0.0001* 1.0 RISK - (0.757) (0.280) (0.649) (0.039) (0.571) (0.084)
-0.085*** -0.020 -0.103*** 1.73 GOV + (0.000) (0.445) (0.004) 0.040*** 0.067*** 0.109*** 1.79 0.005 0.016*** 0.019* 1.3 MINDUM + (0.000) (0.000) (0.000) (0.534) (0.000) (0.068) 0.032** 0.044** 0.081*** 2.35 CEMEDUM + (0.013) (0.037) (0.002) -0.008 -0.016 -0.023 1.94 -0.028 -0.001 -0.052** 1.1 FARMDUM - (0.432) (0.263) (0.230) (0.220) (0.908) (0.040) -0.030 -0.222** -0.249* -0.309*** -0.114*** -0.511*** INTERCEPT (0.745) (0.025) (0.075) (0.000) (0.000) (0.000)
Wald χ2 -test 117.14*** 96.84*** 153.06*** 625.30*** 377.39*** 803.43*** Adjusted R2 0.2589 0.2395 0.3094 0.1878 0.2565 0.2330
Breusch - Pagan /Cook-Weisberg
Hetero test 87.04*** 82.45*** 54.16*** 257.81*** 751.55*** 237.28***
192
Moreover, the table shows that short-term debt has higher magnitude than
long-term debt while these magnitudes are opposite in listed sample. This may
suggest that while large listed firms rely more on long-term debt, large
unlisted firms rely more on short-term debt than on long-term debt.
Accordingly, one is unable to reject the hypothesis that size has a positive
influence on debt ratios in both samples other than the relationship with short-
term debt in listed sample where it is found insignificant.
6.4.2.2 Profitability
The return on assets (ROA) is used as the proxy for profitability. The results
for listed sample reveal insignificant positive relationship between
profitability and total debt. The strong positive and negative association with
short-term and long-term debt ratios most likely drives this result.
Accordingly, the observed negative relationship with long-term debt is
consistent with pecking order hypothesis. On the other hand, the positive
relationship with short-term debt is consistent with trade-off theory that
suggests a positive relationship between debt and profitability due to tax
considerations. However, it has been pointed out earlier that Saudi companies
pay small level of tax (Zakat), which makes the tax advantage of debt for
firms negligible. Nevertheless, this positive relationship may suggest that
profitable firms resort to short-term debt to finance their current assets.
On the other hand, the results of unlisted sample show that profitability has
systematically significant (1%) negative influence on all debt ratios other than
short-term debt where the significant level is 5%. This is interpreted as

193
meaning that a firm with higher profitability has lower debt ratios. These
results, thus, lend strong support to the pecking order hypothesis.
Moreover, the meta-analysis conducted in chapter three reveals that 100% and
98.32% of the significant results finds a negative relationship between ROA
and total and long-term debt ratios respectively. Therefore, the negative
results observed in long-term in listed sample and all debt elements in unlisted
sample are consistent with the prediction and with previous studies' findings
using ROA as proxy for profitability.
In sum, one is unable to reject hypotheses that profitability is negatively
correlated with debt levels other than total and short-term debt ratios in listed
sample, which are found insignificant with the first and positive with the
second.
7.3.4.2 Tangibility
The ratio of fixed assets to total assets is used as proxy for tangibility. In listed
sample, the relationship between tangibility and total debt is positive and
significant at 5% level. At the disaggregate level, however, the strong positive
relationship observed with long-term debt is the key element of the observed
result in total debt since the relationship with short-term debt seems to be
insignificant. In unlisted sample, on the other hand, the relationship between
tangibility and total debt is insignificant. The strong negative and positive
association with short-term and long-term debt ratios most likely drives this
result.

194
In general, the positive relationship with long-term debt found in both samples
implies that firms with sufficient collateral asset have easier access to long-
term bank loans. Recall that one of the requirements of Saudi banks to lend
long-term debt is a sufficient collateral asset at least to cover 100% of the
value of the loan. Moreover, it is consistent with meta-analysis finding that
97.52% of significant results find positive relationship between tangibility and
book based long-term debt. The insignificant result observed with total debt in
unlisted sample appears to be common since only about 65% of total sample
in meta-analysis find significant results of which 90.21% finds positive
direction. This indicates that the significant results most likely to be positive
which also provide support to the relationship with total debt observed in
listed sample. The insignificant relationship with short-term debt is also not
surprising since comparing the significant results observed with total debt
(65%) with those with long-term debt (76%) may suggest that the
insignificant of the correlation with short-term debt is the key element of the
observed differences. Moreover, the higher positive significant results
observed with long-term debt (98%) compared to (90%) in total debt may
suggest that the negative correlation between short-term and tangibility reduce
the strength of the overall positive relationship with total debt.
With exception of the insignificant positive relationship observed with short-
term debt in listed, the results are generally consistent with prediction and
assumption that the length of loan is likely to be matched to the life of assets
used as collateral. Accordingly, one fails to reject the hypotheses that
tangibility is positively correlated with total and long-term debt ratio other

195
than the relationship with total debt in unlisted sample where it is found
insignificant. One also is unable to reject the negative relationship between
tangibility and short-term debt in unlisted sample but not for short-term debt
in listed sample.
7.3.4.3 Free cash flow
The ratio of the earnings before interest and tax plus depreciation less capital
expenditure to total assets is used to capture the influence of free cash flow on
debt levels. The table shows that free cash flow variable in both samples is
negatively correlated with total debt at 1% level of significant. At
disaggregate level, however, a difference is observed between the two
samples. In listed sample, the observed result in total debt seems to be driven
by the strong significant (1%) negative association with short-term debt as the
relationship with long-term debt is insignificant. On the other hand, the strong
and moderate negative relationship observed with short-term and long-term
debt ratios respectively seems to be both the driving forces of the total debt
result.
The results in both samples, however, most likely reflect the fact that the
conflicts between managers and shareholders suggested by the free cash flow
theory of Jensen (1986) are not an issue among Saudi companies. Indeed, the
high concentrated ownership in the case of listed companies and the family
ownership in the case of unlisted companies reduce such conflicts.
Alternatively, if the free cash flow can be seen as the capacity of the firm’s
internal generated resources, then the observed negative relationship provide
strong support to the pecking order hypothesis. Moreover, the observed

196
significant negative relationship is consistent with the overall finding of
previous empirical researchers, which shows that 78.52% of the significant
results are negative. This in turn implies that the pecking order prediction
outweigh the prediction of the free cash flow agency theory.
In sum, one is unable to reject hypotheses that free cash flow is negatively
correlated debt elements other than the relationship with long-term debt in
listed sample, which is found insignificant.
7.3.4.4 Liquidity
The quick ratio, which is current assets less inventory to current liabilities, is
used as a proxy for liquidity. At aggregate level, the relationship between
liquidity and total debt in both samples appear to be negative and significant
at 1% level. This is consistent with the finding of previous empirical
researchers, which shows that 100% of the significant results reveal negative
correlation between liquidity and total debt defined by book value. However,
this result appears to be driven by the strong significant (1%) negative
association with short-term debt. The result indicates that firms with
insufficient liquidity use more short-term debt. This in turn lends support to
the hypothesised negative relationship between liquidity and short-term debt
and to Bevan and Danbolt’s (2004) argument that liquidity is an important
determinant of short-term bank borrowing.
On the other hand, the relationship with long-term debt is mixed. In listed
sample, it is found that liquidity negatively but insignificantly correlated with
long-term debt. Antoniuo et al. (2002) explain the low level of significance by

197
the fact that firms’ close relationship with banks mitigates asymmetric
information problems, which in turn reduces the need for internal liquidity.
The fact that Saudi listed firms have strong relationship with banks gives
more credibility to this explanation. Moreover, the insignificant correlation
with long-term debt is not surprising since about 30% of total sample in meta-
analysis find insignificant results. In unlisted sample, on the other hand, it is
found that liquidity is positively correlated with long-term debt at 10% level
of significance. This indicates that unlisted firms with sufficient liquidity have
easier access to long-term bank loans. This result, however, are inconsistent
with the finding of previous empirical researchers, which shows that 96.5% of
the significant results reveal negative correlation between liquidity and long-
term debt defined by book value. It is also contradict the pecking order
hypothesis, which suggests negative relationship. In summary, in both
samples, while one is unable to reject the hypotheses that liquidity is
negatively correlated with both total and short-term debt ratios, one is able to
reject the hypothesised negative association with long-term debt. This in turn
lends partial support to pecking order hypothesis.
7.3.4.5 Uniqueness
The proxy used to measure the impact of uniqueness is marketing and selling
expenses. The results also reveal conflicting evidences. In listed sample,
insignificant negative associations are observed between uniqueness and all
debt elements. In unlisted sample, however, while a strong significant (1%)
positive relationship with long-term, insignificant positive relationship with
total debt and short-term debt ratios are obtained. Nevertheless, both results

198
are inconsistent with the prediction and with the Titman’s (1984) arguments
that firms characterized by unique products should be financed with relatively
less debt. The results also contradict the overall finding of previous empirical
researchers, which shows that 99.15% of the significant results are negative.
However, it is important to note that the significant positive relationship
between book-based long-term debt and uniqueness as measured by marketing
and selling expenses observed in unlisted sample is not surprising since
42.43% of the previous empirical researchers’ findings show a significant
positive relationship. This in turn raises the doubt about this proxy in
capturing the suggested negative effect of uniqueness on leverage.
In sum, one fails to accept the hypotheses that uniqueness as measured by
marketing and selling expenses is negatively correlated with debt ratios at
least in this study.
7.3.4.6 Growth
Due to the availability of data, two proxies for growth are employed to
capture the impact on leverage. The market-to-book ratio and the growth in
assets are used here to measure the growth variable for listed and unlisted
firms respectively. The results show that insignificant negative relationship
between market to book ratio and all debt levels is obtained in listed sample.
These results in particular the relationship with long-term debt are not
surprising since meta-analysis finding shows insignificant negative
relationship exists between market to book ratio and long-term debt defined
by book value. However, the relatively high significant correlation (0.46)
observed in the correlation matrix in the appendix 7 between market-to-book

199
ratio and profitability as measured by ROA raises the concern about this
result. Such high correlation might be responsible for observing insignificant
result. Therefore, the result of this relationship should be interpreted with
some caution.
In unlisted sample, on the other hand, the strong significant (1%) negative
association between growth in assets and total debt indicates the presence of
the agency conflict between shareholders and lenders. it is consistent with the
result obtained by meta-analysis that found 70.60% of the significant results
of growth in assets are negatively correlated with total debt defined by book
value. However, this result seems to be driven by the strong significant
negative association observed with both short-term long-term debt ratios.
Though the strong negative relationship with long-term lend support to the
agency costs theory, it contradicts the meta-analysis finding where about 92%
of the significant results find positive relationship between growth as
measured by growth in assets and book based long-term debt. Moreover, the
strong negative relationship with short-term debt contradicts the argument that
the agency problem may be mitigated if the firm issue more short-term-debt.
However, Bevan and Danbolt (2004) argue that banks are unwilling to
provide short-term debt to growing firms before proven assets in place. This
explanation, thus, is hold here due to the fact that Saudi banks adopt
conservative lending policy.
Accordingly, one is able to reject the hypothesised positive (negative)
relationships between growth and short-term and (long-term and total) debt
ratios in listed sample. In unlisted sample, on the other hand, while one is

200
unable to reject the negative relationships with long-term and total debt ratios,
one is able to reject the positive relationship with short-term debt.
7.3.4.7 Dividends
The ratio of dividends paid to net income is used as a proxy for dividends
payout. The results reveal that dividend coefficients are significantly
negatively correlated with all the debt ratios other than short-term debt in
listed sample but insignificantly correlated with all the debt ratios in the
unlisted sample. However, the significant negative relationship provides
support to La Porta et al.’s (1999) argument that paying dividends in the
developing countries is a sign of commitment to build the reputation for future
stock issues. Therefore, this argument can explain the significant negative
relation observed in listed companies since the equity is the main source of
funds among listed companies. These results are also consistent with meta-
analysis finding that 88% and 97% of the significant results finds negative
relationship between dividends payout ratio and total and long-term debt
ratios based on book value. On the other hand, the small magnitudes
combined with the insignificant levels of the results observed in unlisted
sample indicate that dividends are not determinant of the firm’s capital
structure in unlisted sample.
In sum, while one is unable to reject the hypothesised negative association
between dividends and debt ratios other than association with short-term debt
where it is found insignificant in listed sample, one reject the hypothesised
positive association between dividends and debt ratios in unlisted sample.

201
7.3.4.8 Age
The natural log of the number of years since company’s establishment is used
as proxy for age. The analysis provides mixed results for the relation between
age and debt ratios. In listed sample, a significant negative relationship
observed between age and total debt ratio. This implies that new firms use
more debt than older ones. At disaggregate level, however, the results reveal
that the negative association observed with short-term debt mainly drives this
result since insignificant results observed with long-term debt. These results in
turn indicate that new listed firms rely more on short-term debt, as they are
constrained from long-term debt. Accordingly, these results contradict the
meta-analysis finding where about 80% (97%) of the significant results find
positive (negative) relationship between age and total and (long-term) debt
ratios.
On the other hand, a significantly positive relationship between age and total
debt ratios is observed in unlisted sample. This result most likely reflects the
significant positive relationship observed between age and short-term debt
ratio. This implies that these firms have a good reputation of credit and build a
good relation with banks; thus, they have better conditions to obtain short-
term debt than younger firms. The negative association observed with long-
term debt ratio indicates that these firms are young and do not have sufficient
internally funds to finance new investment. However, knowing the bank’s
conservative long-tem lending policy suggests that the reputation and the
strong relation with banks are the key issues. This result most likely suggests
that the owners of these new firms are belonging to rich families who usually

202
occupy the board directors of the banks and, thus they have easy access to
long-term debt. Moreover, these results are also consistent with the meta-
analysis findings mentioned above where age is found positively and
negatively correlated with book based total and long-term debt ratios
respectively.
Accordingly, while one is able to reject the hypothesis that age positively
correlated with total and short-term debt ratios and negative correlated with
long-term debt ratio in listed sample, one is unable to reject in unlisted
sample.
7.3.4.9 Risk
The standard deviation of the first difference in annual earnings over mean of
the earning is applied as a proxy for risk. The table shows that the risk
coefficients are insignificantly correlated with all debt ratios in the listed
sample. In unlisted sample, however, a weak significant positive relationship
observed between risk and total debt ratio, which is mainly driven by the
moderate significant positive correlation observed with short-term debt. The
results are inconsistent with the hypothesis that firms with high variability in
earnings have a greater risk not to meet their debt obligations and, thus, they
should have lower debt ratio. However, the small sizes of the coefficients
observed in both samples raise the concerns about the risk measure since the
length of the period employed in this study (i.e. five years). Such period may
be too short to capture the effect of risk measure on debt ratios adequately.
Accordingly, it is hard to draw a conclusion regarding this attribute.

203
7.3.4.10 Government
The percentage of equity owned by the government is used as a proxy to
measure the impact of government ownership on the capital structure of listed
firms. The reported results show that the estimated coefficients of government
with debt ratios are significantly negatively correlated with short-term and
total debt, but statistically insignificantly correlated with long-term debt. This
implies that companies with government ownership are using less debt. This
is consistent with the argument that government chose to privatise some of its
companies due to government budgetary deficits. This means that state
companies will use more equity and less debt to finance their growth.
Moreover, if La Porta et al.’s (1999) argument that firms in developing
countries pay dividends to build the reputation to market future stock issues
holds, then the significant positive correlation between government ownership
and dividends observed in the correlation matrix in the appendix 7 supports
the above argument. Furthermore, the observed significant negative
relationship between government ownership and total debt is consistent with
the finding of the previous studies that found 86.81% of the significant results
are negatively correlated with total debt.
However, though the observed results lend some support to the hypothesises,
the relatively high correlation (0.57) between government and log assets as
measure of size observed in the correlation matrix in the appendix 7 raise the
concerns about this relationship. This high correlation may have some impact
on the insignificant negative relationship observed with long-term debt since

204
size is found positively correlated with long-term debt. Accordingly, the
previous interpretation of this relationship should be taken with caution.
In short, one unable to reject hypothesises that government ownership is
negatively associated with debt elements but not for the relationship with
long-term debt where it is found insignificant.
7.3.4.11 Industry
Dummy variables are used to investigate if capital structure varies among
industry sectors. MINDUM, CEMEDUM, and FARMDUM refer to
manufacturing, cement, and farming sectors dummy variables respectively
(with the service sector used as the base in both samples). The results show
that companies in the manufacturing sector have a statistically positive
correlation with all debt ratios in listed and with long-term and total debt
ratios in unlisted sample. The results also show that cement sector has a
significant positive relationship with all debt ratios in listed sample. These
results, therefore, indicate that firms in these two sectors, in general, have
higher debt level than those of firms in the service sector, which is the base
sector in the analysis. For the farming sector, while an insignificant
association with all debt ratios is observed in listed sample, only moderate
significant (5%) negative relationship is obtained with total debt ratio in
unlisted sample. Accordingly, the hypothesis that firms operate in
manufacturing and cement industries will show higher debt levels than those
operate in farming and service industries is unable to be rejected.

205
7.3.5 Average cross-sectional analysis based on 2004 debt ratios
In pure average cross-sectional estimation, the results may be more robust
since lagging the explanatory variables will reduce the potential reverse
causality between dependent and explanatory variables and averaging will
reduce the effect of fluctuation in the explanatory variables. However, sample
size is considerably reduced with only one observation per company rather
than five. For the average-based analysis, the two equations of the listed and
the unlisted sample are also estimated for the three debt elements. The
regression includes the 2004 leverage level as dependent variable and the
explanatory variables are four year average (2000-2003).
Table 7.5 presents the results for both listed and unlisted firms respectively.
This shows that the explanatory power of the averaging regressions is
generally slightly lower than the pooled regressions, as indicated by the lower
adjusted R2s. However, the models report significant χ2 indicating the
rejection of the null hypothesis of joint insignificance of the coefficients, at
the 1% level in all models except short-term debt for listed companies (5%
level).
In the short-term debt models for listed companies, profitability, free cash
flow, liquidity, manufacturing and cement dummies show results consistent
with the pooled analysis, but with lower significance levels. However, the
positive association with size now becomes significant (5% level) while the
negative impact of age becomes insignificant. By contrast, for unlisted
companies the results are consistently significant for size, tangibility, free

206
cash flow, liquidity and risk but the negative relationships with profitability
and growth in assets become insignificant.
For long-term debt in listed companies, size and the manufacturing dummy
are the only variables that remain significant albeit at lower significance
levels. In unlisted companies, the results are consistently significant for size,
tangibility, free cash flow and uniqueness but the latter at a lower (10%)
significance level. For total debt in listed companies, size and the
manufacturing dummy continue to be highly significant; free cash flow,
government and the cement dummy remain significant but at lower levels of
significance than in the pooled regressions. For total debt in unlisted
companies, the results for size, free cash flow, liquidity and risk variables are
broadly consistent with the pooled regressions but profitability, growth in
assets, age and the two industry dummies cease to be significant.
Overall, it would appear that the broad thrust of the results remains unchanged
in the average cross-sectional regressions. However, the results are less
significant, probably partly as a result of the much-reduced sample size and
partly because the pooled regression may overstate significance.

207
Table 7.5: Average cross-sectional analysis results of listed & unlisted sample based on Tobit technique
STD, LTD and TD refer to short-term, long-term, and total debt respectively. Size is the log of total assets. ROA refers to the return on assets. TANG1 is the ratio of fixed assets to total assets. FCF refers to the earnings before interest and tax plus depreciation less capital expenditure normalised by total assets. QR refers to the quick ratio. UNIQ is the ratio of selling & marketing expenses to total sales. M/B refers to the market to book ratio and G.ASSETS is the growth in assets for listed and unlisted companies. DIV refers to dividends paid divided by net income. LOGAGE is the log number of years since firm founded. RISK is the standard deviation of the first difference in annual earnings over mean of annual earnings. GOV is the percentage of shares held by the government. MINDUM, CEMEDUM, and FARMDUM refer to manufacturing, cement, and farming sectors dummy variables respectively. White’s heteroskedastic-consistent covariance matrix estimation is used to adjust for heteroskedasticity. Probability of (Z) is in parentheses. Notes: *, **, and *** denote significant at the 10, 5, and 1% respectively (two tails).
Listed (n = 60) Unlisted (n = 403) Exp.
Sign STD LTD TD VIF STD LTD TD VIF
0.035** 0.051** 0.087*** 0.062*** 0.016*** 0.090*** LOGASSETS + (0.033) (0.016) (0.002)
1.94 (0.000) (0.009) (0.000)
1.48
0.314* -0.086 0.228 -0.032 -0.030 -0.068 ROA - (0.067) (0.408) (0.227) 2.23
(0.605) (0.132) (0.340) 1.68
-0.036 0.026 -0.010 -0.136*** 0.078*** -0.009 TANG1 +/- (0.302) (0.548) (0.872) 1.45
(0.000) (0.000) (0.870) 1.29
-0.512* -0.145 -0.657** -0.274*** -0.064*** -0.366*** FCF - (0.058) (0.529) (0.049) 3.73
(0.003) (0.004) (0.000) 1.64
-0.018* -0.009 -0.027 -0.031*** 0.003 -0.023** QR - (0.086) (0.505) (0.134) 1.92
(0.000) (0.153) (0.011) 1.24
-0.005 -0.197 -0.202 0.058 0.079* 0.140 UNIQ - (0.974) (0.152) (0.367) 2.60
(0.649) (0.090) (0.363) 1.33
0.008 -0.011 -0.003 M/B Ins (0.595) (0.494) (0.903) 3.76
-0.004 -0.002 -0.043 G. ASSETS Ins (0.954) (0.925) (0.571) 1.19
-0.014 -0.031 -0.045 0.003 -0.001 -0.003 DIV -/+ (0.432) (0.266) (0.237) 1.75
(0.846) (0.887) (0.878) 1.27
-0.012 0.016 0.004 0.071 -0.011 0.068 LOGAGE -/+ (0.705) (0.700) (0.950) 1.45
(0.116) (0.327) (0.159) 1.17
-0.003 0.006 0.003 0.0001** 0.0001 0.0001* RISK - (0.479) (0.156) (0.540) 1.56
(0.030) (0.329) (0.060) 1.02
-0.087** -0.034 -0.121* GOV + (0.020) (0.474) (0.054) 1.80
0.031* 0.053** 0.084*** -0.001 0.009 0.001 MINDUM + (0.054) (0.044) (0.009) 2.05
(0.941) (0.188) (0.975) 1.31
0.053* 0.034 0.087* CEMEDUM + (0.058) (0.413) (0.070) 4.07
0.017 0.011 0.028 -0.023 0.007 -0.031 FARMDUM - (0.531) (0.689) (0.520) 2.39 (0.732) (0.670) (0.663) 1.11
-0.241 -0.401** -0.643** -0.304*** -0.101** -0.506*** INTERCEPT (0.128) (0.037) (0.014) (0.006) (0.039) (0.002) Wald χ2 -test 26.87** 29.42*** 36.42*** 145.58*** 61.07*** 156.67*** Adjusted R2 0.2528 0.1178 0.2642 0.1623 0.2073 0.1902
25.59*** 19.93*** 6.70*** 32.89*** 224.50*** 42.78***

208
7.3.6 Yearly cross-sectional analysis
To illustrate the disadvantages of pooled and average cross-sectional analysis,
the two equations of the listed and the unlisted sample are estimated for the
three debt elements (i.e. short-term, long-term, and total debts) for every year
covered in this study (2000 through 2004). This process results in estimating a
total of 30 models of which 10 models are estimated for each debit ratio.
Tables in appendix 4 present the results of these models. As it can be seen, all
models report significant χ2 indicating the rejection of the null hypothesis of
joint insignificance of the coefficients but vary in the significance level.
In short-term models, the results for listed companies show considerable
variation in size and significance over the period. By contrast, the results for
unlisted companies show consistent significant results for size, tangibility and
liquidity; free cash flow and age are also consistent across 4 of the 5 years. In
the long-term models, all the explanatory variables in listed sample have
shown changes either in the significant levels or in the direction. In unlisted,
size, profitability, and tangibility are the only variables that remains
systematically significant but with variation in the significant level over the
study period. In total debt models, as seen in short-term and long-term
regressions, all the explanatory variables in listed sample have shown changes
either in the significant levels or in the direction. In unlisted sample, on the
other hand, size, free cash flow, liquidity and growth in assets remain
systematically significant but with variation in the significant level over the
study period.

209
As apparent in this illustration, the results interpretations and conclusions of
pure cross-sectional analysis are dependent on the timing of the observation.
Bevan and Danbolt (2004) conclude that failure to control for time effects
may incur a serious bias into the analysis of corporate capital structure and
raise question about some of the conclusions obtained under more traditional
analyses. Indeed, comparing the results of pure cross-sectional regressions,
average cross-sectional regressions and those of pooled regressions illustrate
that the obtained results by pooled regression have the highest level of
significance. The significance of estimated coefficients under pooled
regression may be over estimated, as firms in the sample are included more
than once over study period (Barclay et al., 1995 and Bevan and Danbolt,
2004). Moreover, though it reduces the effects of the fluctuation in the
explanatory variables, averaging the sample over the period of study ignores
the time effects that should be considered in the analysis. This in turn may
lead to under estimation bias. Accordingly, it is important to investigate the
association between debt elements and company characteristics using
estimation technique that overcome the disadvantages of pooled and average
estimation techniques. One appropriate technique that incorporates both time-
series and cross-sectional effects and controls also for time-invariant firm-
specific factors is fixed effects panel data analysis.
7.3.7 Fixed effects panel analysis
Given the potential importance for time-invariant firm-specific heterogeneity,
fixed effects approach is used in the analysis. Moreover, as pointed out earlier
in methods chapter, industries dummies, government ownership, and Risk are

210
excluded from the estimated models due to either time-invariant or
measurement issues associated with these variables. Table 7.6 presents the
results of the panel data estimations. Over all, the fixed effects models are all
report significant F-test indicating the rejection of the null hypothesis of joint
insignificance of the coefficients at less than 1% level.
7.3.7.1 Size
It seems the impact of controlling for time-invariant heterogeneity on the
relationship between size and debt elements is considerable in listed sample
while it is trivial in unlisted sample. In listed sample, the strong significant
(1%) positive relationship with total debt observed in pooled and average
estimation techniques becomes positively insignificant. However, it has been
seen earlier in testing data section that this result turns into a significant level
(1%) under the reduced sample. At long-term debt level, the strong (moderate)
significant positive relationship observed in pooled and (average) estimation
techniques respectively becomes positively significant at 10% level.
On the other hand, at the short-term debt level, the insignificant positive
observed under pooled estimation technique and the significant at 5% positive
relationship observed under average estimation technique respectively
becomes negatively insignificant. However, this result seems to be driven by
the some influential observations because turns into negative and significant
5% level under the reduced sample. This in turns implies that large listed
firms use more long-term debt and less short-term debt.

211
Table 7.6: fixed effects Panel data results STD, LTD and TD refer to short-term, long-term, and total debt respectively. Size is the log of total assets. ROA refers to the return on assets. TANG is the ratio of fixed assets to total assets. FCF refers to the earnings before interest and tax plus depreciation less capital expenditure normalised by total assets. QR refers to the quick ratio. UNIQ is the ratio of selling & marketing expenses to total sales. M/B refers to the market to book ratio and G.ASSETS is the growth in assets for listed and unlisted companies. DIV refers to dividends paid divided by net income. LOGAGE is the log number of years since firm founded. Note: White’s heteroskedastic-consistent covariance matrix estimation is used to adjust for heteroskedasticity. Probability of (t) is in parentheses for. *, ** and *** denote significant at the 10, 5, and 1% respectively (two tails).
Listed Unlisted Panel
STD LTD TD STD LTD TD
-0.047 0.050* 0.004 0.066*** 0.024*** 0.097*** SIZE (0.469) (0.058) (0.964) (0.003) (0.000) (0.000) -0.006 -0.189** -0.183 -0.082*** -0.014* -0.119***
ROA (0.939) (0.013) (0.102) (0.003) (0.072) (0.000) 0.004 0.104** 0.092 -0.030 0.048*** 0.051
TANG (0.935) (0.018) (0.234) (0.426) (0.007) (0.212) -0.130*** -0.011 -0.183** -0.110*** -0.002 -0.119***
FCF (0.003) (0.776) (0.010) (0.000) (0.415) (0.000) -0.007* -0.001 -0.008 -0.020*** 0.001 -0.019***
QR (0.079) (0.820) (0.149) (0.000) (0.292) (0.000) -0.016 0.213* 0.187 -0.053 0.007 0.103
UNIQ (0.844) (0.052) (0.267) (0.572) (0.830) (0.239) 0.003 -0.007 -0.005
M/B (0.449) (0.126) (0.431) -0.025** -0.005** -0.034***
G. Assets (0.023) (0.034) (0.004)
-0.001 -0.003 -0.003 0.003 0.001 0.005** DIV (0.818) (0.448) (0.603) (0.125) (0.270) (0.031)
-0.126 0.032 -0.087 0.095*** -0.044*** 0.006 LOGAGE
(0.185) (0.626) (0.455) (0.006) (0.000) (0.865) 0.636 -0.456* 0.183 -0.401** -0.118*** -0.519***
INTERCEPT (0.216) (0.064) (0.776) (0.013) (0.005) (0.002)
F -test 3.98*** 4.04*** 5.15*** 13.87*** 3.33*** 14.70*** R2 within 0.1448 0.2023 0.2216 0.1218 0.0278 0.1311
R2 between 0.0313 0.0729 0.0473 0.1838 0.2315 0.2448 R2 overall 0.0389 0.0852 0.0680 0.1722 0.1949 0.2267
Corr (ui, x) -0.4221 -0.2442 -0.1376 -0.0104 0.1217 0.0331 N 300 300 300 2015 2015 2015

212
Accordingly, under fixed effects regression and under the full sample at least,
the hypothesised positive relationship between size and debt elements is
rejected but not for the correlation with long-term debt where it is found
positively significant.
In unlisted sample, on the other hand, the relationship with all debt elements
remains positively significant at 1% level with increases in coefficients’
magnitude. Accordingly, once is controlled for time-invariant heterogeneity,
one remains to be unable to reject the hypothesised positive relationship
between firm’s size and debt elements in unlisted sample.
7.3.7.2 Profitability
In listed sample, though the relationship with total debt continues to be
insignificant as observed in previous estimation techniques, it becomes
negative under fixed effect estimation. Moreover, The positively significant at
1% and 10% levels relationship with short-term debt observed under pooled
and average regressions respectively turns into insignificantly negative
relationship. On the other hand, the significant at 1% and insignificant
negative relationship observed under pooled and under average estimation
techniques respectively becomes negatively significant at 5% level.
Accordingly, while one is unable to reject the negative relationship between
profitability and long-term debt, one is able to reject the negative relationship
with both short-term and total debt in listed sample, once firm effects are
controlled for. This in turn provides supports to the pecking order hypothesis
only at the level of long-term debt.

213
In unlisted sample, however, the influence of profitability on all debt elements
remains significantly negative. These results relatively are consistent with the
results obtained under pooled with slight changes in the significant levels in
particular at short-term and long-term debt ratios. On the other hand, the
results contradict the insignificant results observed under average estimation
techniques.
In short, under fixed effects regression, one fails to reject the hypothesised
negative relationship between profitability and debt elements in unlisted
sample. This in turn provides strong support to the pecking order hypothesis.
7.3.7.3 Tangibility
In listed sample, the result of the relationship between tangibility and total
debt reveals insignificant positive relationship, which is consistent with the
result observed under average regression but with reverse sign. Both results,
however, contradict the strong significant relationship observed under pooled
regression. At disaggregate level, the relationship with short-term debt
continues to be insignificant positive relationship which is consistent with the
insignificant positive relationship observed under pooled regression and with
the insignificant level but with reverse sign observed under average
regression. Moreover, the strong significant (insignificant) positive
relationship with long-term debt observed under pooled (average) regressions
becomes positively significant at 5%, once one control for time-invariant
heterogeneity.

214
In unlisted sample, under fixed effects technique, the relationship between
tangibility and total debt continues to be insignificant as observed in other two
previous estimation techniques. Moreover, while the positively significant at
1% level observed under pooled and average techniques is also obtained once
firm effects are controlled for, the strong significant negative relationship
observed with short-term debt observed under pooled and average regressions
turns into insignificant level.
In brief, the results support the collateral explanation at long-term models in
both samples but contradict the matching principle at short-term models.
Accordingly, one is unable to reject the hypothesis that tangibility is
positively correlated with long-term debt but is able to rejects the
hypothesised positive (negative) association with total (short-term) debt in
both samples once is controlled for time-invariant heterogeneity.
7.3.7.4 Free cash flow
It appears that the estimation technique has marginal impact concerning the
relationship between free cash flow and debt elements at least in listed
sample. Indeed, the significant negative relationship with short-term and total
debt and insignificant negative results with long-term debt observed in other
estimation techniques continues to be observed under fixed effects estimation
technique. In unlisted sample, however, while the significant negative
relationship with short-term and total debt continues to be obtained, the
association with long-term debt turns into insignificant level once controlled
for time-invariant heterogeneity.

215
In short, under fixed effects analysis, the results lend support to pecking order
hypothesis at short-term and total debt models in both samples but are
undetermined at long-term models as insignificant relationships are observed
in both samples. Nevertheless, the results contradict agency theory, which in
turn imply that the free cash flow problem is not an issue among Saudi
companies.
Accordingly, one is unable to reject the hypothesised negative relationship
between free cash flow and debt elements other than the relationship with
long-term debt where it is found insignificant in both samples.
7.3.7.5 Liquidity
In listed, as seen in average regressions, the strong significant (1%) negative
relationship between liquidity and total debt obtained in pooled regression
turns into insignificant level under fixed effects technique. As observed with
size, this result seems to be driven by the some influential observations
because it turns into significant at 1% level under the reduced sample. The
relationship with long-term debt remains insignificant while the relationship
with short-term debt remains negative but with decrease in the significant
level from 5% under pooled to 10 % as under average model. In unlisted
sample, the significant negative relationships with short-term and total debt
ratios found in pooled and average regressions are also found to be negative
and significant at 1% level once controlled for time-invariant heterogeneity.
On the other hand, as seen in average regression, the weak significant positive
relationship observed under pooled regression turns into insignificant level. In
general, these results provide strong evidence to Bevan and Danbolt’s (2004)

216
suggestion that liquidity is an important of short-term bank borrowing since
the negative relationship with total debt is mainly driven by the negative
relationship with short-term debt in both sample and regardless to estimation
techniques.
Accordingly, one rejects the hypothesised negative relationship between
liquidity and debt elements other than the relationship with short-term debt
where it is found significant at 10% level in listed sample at least under the
full sample. In unlisted sample, on the other hand, one failed to reject the
hypothesised negative association with debt elements other than the
relationship with long-term debt where it is found insignificant.
7.3.7.6 Uniqueness
In listed sample, the insignificant negative association with total debt
observed in prior estimation techniques continues to be insignificant but with
reverse sign (positive). However, this result seems also to be driven by the
some influential observations because the insignificant positive relationship
turns into significant at 5% level under the reduced sample.
The relationship with long-term debt where the insignificant negative
relationship observed in prior estimation techniques turns into positive and
significant at 10% level. This result and the result observed with total debt
under reduce sample, thus, contradict Titman’s (1984) argument that suggest
negative association between uniquness and leverage. Also, if the selling
expense used to capture the effects of uniqueness on leverage represent the
capacity of pre-existing non-debt tax shields firms have, then these results

217
contradict tax theory, in particular, DeAngelo and Masulis (1980) argument
that suggest negative relationship. Barakat and Rao (2004) also found that
non-debt tax shields significantly positively correlated with leverage in non-
tax arab countries while significantly negatively correlated in tax-Arab
countries. Nevertheless, the correlation with short-term debt, however,
continues to be insignificant and negative as seen in prior estimation
techniques.
In the unlisted sample, the association with total debt continues to be
positively insignificant as observed in prior estimation techniques. At
disaggregate level, the insignificant negative correlation with short-term debt
observed in prior estimation techniques continue to be insignificant but with
reverse in sign. However, the strong (weak) significant positive relationship
with long-term debt found in pooled and average regressions respectively
turns into insignificant once is controlled for time-invariant heterogeneity.
In summary, the obtained results continue to contradict Titman’s (1984)
arguments that suggest that uniqueness has negative influence on debt level.
Accordingly, one continues to reject the hypothesised negative relationship
between debt and uniqueness.
7.3.7.7 Growth
As observed in average regression, the analysis show that the insignificant
negative relationship between market-to-book ratio and all debt levels
observed in pooled regression remains insignificant with reverse sign in short-
term debt in listed sample. These results in turns contradict the hypothesised

218
positive (negative) relationships between growth and short-term and (long-
term and total) debt ratios. In unlisted sample, the negatively significant at 1%
level relationship between growth in assets and all debt ratios observed under
pooled regression continues to be negatively significant at 1% level with total
debt but with 5% level with both short-term and long-term debt. This in turns
contradicts the insignificant results obtain under average regression.
Nevertheless, the results indicate that growing unlisted firms face difficulties
accessing to both long-term and short-term banking loans.
In short, while one is able to reject the hypothesised positive (negative)
relationships between growth and short-term and (long-term and total) debt
ratios in listed sample, one is unable to reject the negative relationships with
long-term and total debt ratios in unlisted sample but not for the positive
relationship with short-term debt.
7.3.7.8 Dividends
It appears that the influence of dividends on the capital structure of Saudi
firms is insignificant other than the weak positive relationship with once is
controlled for time-invariant heterogeneity. In listed sample, as seen in
average regression, while the insignificant negative relationship between
dividends and short-term debt remains insignificantly negative observed in
pooled regression, the significant negative relationship with long-term and
total debt levels turns into insignificant level once firm effects are controlled
for. In unlisted sample, however, the insignificant negative relationship
between dividends and total debt observed under pervious regressions turns
into positive and significant at 5% level. This in turn is consistent with the

219
prediction of pecking order hypothesis. At disaggregate level, however, the
associations with short-term and long-term debt ratios continue to be
insignificant.
Accordingly, one is able to reject the hypothesised negative association
between dividend payout ratio and debt in listed sample. In unlisted sample,
on the other hand, one is able to reject the hypothesised positive association
with debt elements other than the relationship with total debt where a
significant positive relationship is observed.
7.3.7.9 Age
As seen in average regression, while the relationship between age and long-
term debt continues to be significant, the negative significant at 5%
relationships with short-term and total debt ratio observed under pooled
regression turns into insignificant level in listed sample. As seen in size,
liquidity and uniqueness variables, these results seem also to be driven by the
some influential observations because the insignificant negative correlation
with total and short-term debt turns into significant at 5% and 10% levels
respectively under the reduced sample. In unlisted sample, the strong
significant positive and negative relationships with short-term and long-term
debt ratios respectively observed under pooled regressions are also obtained
once firm effects are controlled for. However, the strong significant positive
relationship between age and total debt seen under pooled regression turns
into insignificant level. These results contradict those observed in average
regression where the results show insignificant level of confidence.

220
In summary, under fixed effects regression where time-invariant heterogeneity
is controlled for, one is able to reject the hypothesised relationship with debt
elements in listed sample but fails to reject in unlisted sample other than the
relationship with total debt where it is found insignificant.
7.4 Alternative proxies analysis
Previous analyses suggest that the interpretation and conclusions of the results
is dependent on the estimation techniques being used. Moreover, it has also
found in chapter three that attributes measurements are sensitive cases in
determining the observed relationship. Accordingly, to investigate the
sensitivity of the obtained results in the original models to the proxies
employed, and to draw a general conclusion about the determinants of the
capital structure, alternative proxies have been used. For the purpose of
testing, only one alternative proxy is added at once in the original models and
the other variables are not replaced. For example, when alternative proxy is
used to measure size (i.e. log of total sales) in the models for both samples, all
other variables are as originally stated. The importance of this process is that
it allows capturing the influence not only on the relation between leverage and
the alternative proxy but, also, capturing the impact on other variables in the
model as the alternative proxy introduced to the model.
Moreover, since the results obtained by pooled and average techniques most
likely are subject to over and under estimation bias respectively, the fixed
effects technique where firm effects are controlled for is used in this analysis.
As result, this process produces 27 models in listed sample and 24 models in

221
unlisted sample as tables illustrate in appendix 5. In general, the analysis
reveals that all the models report significant F-test indicating the rejection of
the null hypothesis of joint insignificance of the coefficients at less than 1%
level.
7.4.1.1 Size
As the tables show, measuring size by natural logarithm of total sales has
strong effect on the relationship between size and debt elements in listed
sample. The insignificant positive relationship with total debt obtained under
log of total assets proxy turns into positive and significant at 5% level under
log of total sales proxy. Apparently, the results obtained at disaggregate level
are the key issues. Indeed, the insignificant negative correlation with short-
term debt observed under log of total assets proxy turns into positively
significant at 1% level. Moreover, the positively significant at 10% level
relationship with long-term debt becomes insignificant. In light of these
evidences, one would infer that large companies in term of sales are not
necessary large in term of assets at least in Saudi listed sample. Knowing that
bank’s long-term lending policy is linked to the assets companies have, the
significant and insignificant positive relationship between log of sales and
short-term and long-term debt ratios respectively may suggest that banks see
these companies are small in term of assets. Therefore, these companies rely
more on short-term bank borrowing to compensate for their restricted access
to long-term bank loan.
Furthermore, measuring size by log of sales leads also to some changes in
other variables. In short-term debt, while the weak negative association with

222
liquidity becomes insignificant, the insignificant association with age turns
into significant at 5%. Moreover, driven by the increase in significant level of
the negative relationship between ROA and long-term debt, the previous
insignificant negative relationship between ROA and total debt becomes
significant at 5%. In unlisted sample, on the other hand, there is no major
change occurred on the relationship between size as measured by log sales
and debt elements other than the decrease in the significant level to 5% with
the relationship with short-term and total debt ratios. Some changes
concerning the relationship between growth in assets and both short-term and
long-term debt ratios as well as the relationship between uniqueness and total
debt. However, the relationships in the former turn into insignificant while in
the later the relationship becomes positive at 10% level.
7.4.1.2 Profitability
The alternative proxy of profitability is the return on sales (ROS). In listed
sample, there is no major change observed in the relationship between
profitability and debt elements other than the reverse sign of the insignificant
relationship with short-term debt. Noteworthy, the insignificant negative
relationship between market-to-book ratio and long-term debt observed under
return on assets (ROA) turns into significant at 5% once return on sales (ROS)
is used as a proxy for profitability. This result combined with the positive
relationship with long-term debt indicates that these growing firms are small.
However, the correlation matrix of listed sample in the appendix 7 reveals that
the correlation between market-to-book ratio and ROA is considered
relatively high (0.46) compared to the correlation with ROS (0.20). This most

223
likely indicates that the insignificant result observed under ROA is driven by
this high correlation. Accordingly, the result observed under ROS concerning
the relationship between market-to-book ratio and long-term debt lends
support to the agency costs of debt as well as to the hypothesised relationship
between growth opportunity and long-term debt.
In unlisted sample, on the other hand, employing ROS to measure
profitability has significant impact on the relationship between profitability
and debt elements. Under this proxy, no major change observed in the
relationship between profitability and debt elements other than the reverse
sign of the relationship with long-term debt. The relationships continue to be
insignificantly negative with short-term and total debt ratios and
insignificantly positive with long-term debt.
7.4.1.3 Tangibility
The ratio of fixed assets and inventory scaled by total assets is used as
alternative measure of tangibility. In both samples, the relationship between
tangibility and debt elements remains unchanged. However, the relationship
between liquidity and short-term debt becomes insignificant in listed sample.
7.4.1.4 Liquidity
Current ratio that is the ratio of current assets to current liabilities is used as
alternative proxy for liquidity. In both samples, the relationship between
liquidity and debt elements remains unchanged. However, using current ratio
as proxy for liquidity leads to a change in the relationship between ROA and

224
total debt in listed sample where the insignificant negative relationship
becomes significant at 10% level.
7.4.1.5 Uniqueness
A dummy variable is used as alternative proxy for uniqueness. As the results
show the only changes are observed in listed sample in particular with total
debt ratio. The previous insignificant positive relationship between uniqueness
and total debt becomes significant at 5% under unique dummy variable.
However, the result remains inconsistent with Titman’s (1984) argument that
suggests uniqueness is negatively correlated with debt. As seen with size and
liquidity, the increase in significant level of the negative relationship between
ROA and long-term debt turns the previous insignificant negative relationship
between ROA and total debt into significant at 5%.
7.4.1.6 Growth
While both growth in sales and the growth in assets are employed as
alternative proxies (to M/B ratio) of growth opportunities in the listed sample,
growth in sales is used as an alternative proxy (to growth in assets) in unlisted
sample. In listed sample, while using growth in sales does not change the
results in short-term debt model, it does cause significant changes in long-
term and total debt models. In long-term debt, the relationship with growth in
sales turns into positively significant at 5% and the significant level of the
relationship with ROA increase into 1% level of significance while the
positive relationship with size becomes insignificant. These changes lead to
observed positive and significant at 10% and negative and significant at 5%
and reverse sign in the relationships between (growth in sales, ROA and size

225
respectively) and total debt. However, the significant weak and moderate
positive relationship between growth in sales and total and long-term debt
ratios respectively are consistent with meta-analysis findings. About 65% and
87% of the significant results show positive relationship between growth in
sales and total and long-term debt ratios respectively. In unlisted sample, the
relationships between growth in sales and debt elements turn into insignificant
levels with reverse sign observed with long-term debt.
On the other hand, it seems the effect of the growth in assets, as second
alternative proxy in listed sample on the relationship between growth and debt
elements is marginal. The results remain insignificant but with reverse signs
observed in the relationship with total and long-term debt ratios. However,
some major changes are observed in some other variables. The 10%
significant level of the negative relationship between liquidity and short-term
debt becomes significant at 5% level. This in turn leads to turn the
insignificant negative relationship between liquidity and total debt into
significant at 10% level. As observed with size, liquidity and growth in sales,
the increase in the significant (from 5% to 1% level) of the negative
relationship between ROA and long-term debt turns the previous insignificant
negative relationship between ROA and total debt into significant at 5%.
However, the relationship between size and long-term debt turns into
insignificant which in turn leads to a reverse sign in the insignificant
relationship with total debt.
Using the growth in sales as an alternative measures of growth in unlisted
sample, however, turnover the relationship with long-term debt from

226
significant negative into significant positive and with total debt from
significant negative into insignificant. This, however, is consistent with
previous study findings, which found positive relationship between long-term
debt and growth in sales. The overall direction implies that while growth
appears to have insignificant impact on debt ratios in listed sample, it has
strong negative association with short-term and total debt and moderate
negative relationship with long-term debt in unlisted sample.
7.4.1.7 Dividends
The dummy variable is used as alternative proxy to measure to capture the
impact of the dividends on debt levels of which company that report dividends
is given one and zero other wise. In listed sample, the impact of the alternative
proxy on the relationship between dividends and debt elements is
insignificant. However, the insignificant negative relationship between ROA
and total debt becomes significant at 10% level. In unlisted sample, on the
other hand, the positively significant at 5% relationship between dividends
and total debt turns into insignificant level under the alternative proxy.
7.4.1.8 Age
The number of year since establishment is used as alternative proxy to capture
the effect of age on debt ratios. While the effect of this alternative proxy
seems to be insignificant on the results in listed sample, it dose effect the
results in unlisted sample. Under this proxy, the positively significant at 1%
level relationship between age and short-term debt observed under log age
remains significant but at 5%, which in turn leads us to continue observing
insignificant relationship between age and total debt but with reverse sign.

227
Moreover, under this proxy, the insignificant positive relationship between
dividends and short-term debt becomes significant at 10% level.
7.5 Regression diagnostics
Rajan and Zingales (1995) and Bevan and Danbolt (2002) find that the
ordinary least squares (OLS) results are very similar to those obtained by
employing TOBIT technique. Consistent with the finding of these two studies,
the table in the appendix 6 shows that the results are extremely robust to those
obtained by employing Tobit techniques. Accordingly, Pooled regression, in
particular, OLS estimation technique is used in this section due to the fact that
it provides more options than TOBIT technique to test for issues such as
heteroskedasticity and influential observations.
The fact the data is a cross-section raises the issue of the heteroskedasticity.
The Breusch-Pagan/Cook-Weisberg test is used in the present study to test for
heteroskedasticity. The probability associated with this test is reported in the
bottom row at the result’s table. The results show the presence of
heteroskedasticity at 1% level of significance in all models and in both
samples. Accordingly, the reported significant levels for the regression
coefficients are corrected from heteroskedasticity using White’s
heteroskedastic-consistent covariance matrix estimation, which is a default
procedure to obtain robust standard errors in STATA.
Moreover, since the data involves cross section and time-series, it raises the
suspicion about the existent of both heteroskedasticity and autocorrelation
issues. Accordingly, it is worth to check for the robustness of the results using

228
the appropriate technique that is consistent in the presence of such
disturbances. Since Newey-West estimator with a lag length of zero is
equivalent to a White’s heteroscedastic covariance estimator, it is consistent in
the presence of both heteroskedasticity and autocorrelation with a lag length
greater than zero. Greene (2000) suggests that the Newey-West estimator is
consistent in the presence of both heteroskedasticity and autocorrelation
disturbances. Accordingly, Newey-West estimator with one lag is employed
here and the results are shown in the table at appendix 6. As it can be seen
from the table, while the coefficient sizes remain unchanged the change
occurred only to the standard errors, which cause the level of significance to
change. While eight changes are observed in listed sample, three are observed
in unlisted sample. The shaded area highlights these changes. However, two
out of the three changes observed in unlisted sample in particular the
relationship between both manufacturing and farming dummies with total debt
turns into insignificant level. Despite of the changes observed in other
variables, the relationships of these variables with debt elements remain
significant. Accordingly, it seems that the influence of the autocorrelation is
minimal.
Furthermore, testing for multicollinearity is also carried out through the
variance inflation factor (VIF) and the pair-wise correlation matrix. Table 7.4
reports the VIF values for both listed and unlisted firms. Under this test, VIF
value greater than 10 indicates multicollinearity problem (Gujarati, 2003).
From this table it can be confirmed that multicollinearity is not an issue since
the VIF values are far below the cut-off point. However, the alternative

229
proxies’ analysis reveals that the multicollinearity issue most likely exists
among some variables in particular in listed sample. A good example for the
presence of multicollinearity is the changed in the significant level of the
relationship between market-to-book and long-term debt ratios observed in
listed sample once ROS is employed as alternative proxy to ROA.
Accordingly, the interpretations and conclusions of the results should be taken
with caution. The pair-wise correlation matrixes for listed and unlisted
samples are presented in the tables respectively in the appendix 7.
Finally, the normality assumption of the regressions residuals is checked using
the normal Probability plot (NPP) of the residuals. The figures in the appendix
9 show that the plots derived from the regression models’ residuals are almost
straight line. Gujarati, (2003) argues that, in general, if the fitted line in the
NPP is approximately a straight line, one can conclude that the residuals are
normally distributed. Accordingly, in to a large extent, the normality
assumption holds in the present study.
7.6 Chapter summary
This chapter show that the surrounding socio-culture and institutional
characteristics in Saudi Arabia have significant impact on the firms’ financing
choices. Generally, issues such as growth in stock market, weak legal system,
zakat and barriers imposed on bond issuance combined with banks’ borrowing
being the only source for debt play an important role in the preference of
equity over debt among Saudi listed firms compared to firms in developed
countries. Moreover, a remarkable difference between the capital choices of

230
listed firms and unlisted firms is also observed. Surprisingly, the data shows
that listed firms generally have a lower level of total debt than unlisted firms
do. However, at the disaggregate level, the data shows that unlisted firms have
higher short-term debt but substantially lower amounts of long-term debt than
listed firms.
Moreover, the analyses show that the robustness of the results is limited due
to reasons other than ones asserted by theory. Issues such as the choice of
estimation technique or the choice of proxy are found to have an impact on
the results. Indeed, the analysis shows that failing to control for time-invariant
heterogeneity most likely lead to inherent biases such as overestimation bias
in case of pooled regression or underestimation bias in case of average
regression. The analysis reveals also that the relationships between some
attributes and debt elements are dependent on the proxy being employed to
capture the effect of certain attribute.
Nevertheless, the analysis shows that some factors affecting firms’ capital
structure in western countries’ environments also have similar effects on
firms’ capital structure in Saudi Arabia despite the profound institutional
differences between the two environments.

231
Chapter 8: Conclusion

232
8.1 Introduction
Since the seminal work of Modigliani and Miller (1958), the search for
understanding capital structure choice continues to be an important area of
research. In their efforts to understand the incentives for a firm to use debt,
finance scholars have developed various theories and models. Each theory has
explained facts about one or more factors that might determine a firm’s capital
structure. However, the findings of prior empirical studies have provided
confusing evidence related to the impact of these factors on capital structure.
Moreover, the majority of these studies have been conducted in western
economies that have many institutional similarities. However, our knowledge
of capital structure within developing countries that often have different
institutional characteristics remains limited due to the lack of work that has
been done in these countries. Also, a major gap in the empirical research of
firms’ capital structure determinants is the lack of research using unlisted
firms data.
This dissertation explores these issues, firstly through conducting a meta-
analysis of prior studies, and secondly by investigating firms’ capital structure
determinants in Saudi Arabia using listed and unlisted firms’ data, as well as
employing different estimation techniques and proxies.
Section 8.2 summarises the main findings of the meta-analysis of prior studies
and some potential limitations. Section 8.3 summarises the main results from
the empirical analysis of the determinants of firm’s capital structure in Saudi
Arabia. Section 8.4 outlines suggestions for future research.

233
8.2 Summary of the major results
8.2.1 Meta-analysis findings
In order to open the way for new ideas to identify the driving forces
responsible for the apparent variation in the findings of prior capital structure
studies, meta-analysis procedure is conducted in this dissertation. In general, it
is found that issues such as measurement of both leverage and the explanatory
variables have a significant impact on the variation in the findings of prior
empirical studies. The analysis shows that size, tangibility, and profitability
have consistent direction and strong relationship regardless of the
measurement issue. However, the results reveal that the direction of the
relationship between leverage and attributes such as effective tax rate, non-
debt tax shields (NDTS), growth, uniqueness, dividends and age is sensitive to
measurement of both leverage and the explanatory variables. For some
attributes (risk, free cash flow, liquidity, and government ownership), the
measurement differences influence the strength of relationship but not the
direction. The overall impact of the factors considered important by many
studies on leverage is summarised in Table 8.1.
As the table shows, prior empirical evidence for the two main capital structure
theories is mixed. While factors such as risk, NDTS, uniqueness, dividends,
age, and government lend support to the trade-off theory, factors such as
profitability, free cash flow, and liquidity are found to provide strong support
to the pecking order hypothesis. Expectations from both theories are the same
for size, tangibility and growth and these are strongly evidenced in prior
studies.

234
Table 8.1: Results of the factors affecting capital structure.
Prediction Attribute TOT POH
Number of studies Finding Significant
Size + + 488 + 0.0000 Tangibility + + 266 + 0.0000
Profitability + - 511 - -0.0000 Risk - 262 - -0.0000
Effective tax rate + 190 Insignificant 0.4951 NDTS - 150 - -0.0000
Growth - - 473 - -0.0000 Uniqueness - 94 - -0.0000 Dividends - + 53 - -0.0000
Free cash flow + - 37 - -0.0000 Liquidity - 119 - -0.0000
Age + - 36 + 0.0000 Government + / - 27 - -0.0000
Note: TOT and POH refer to trade off theory and pecking order hypothesis respectively.
8.2.2 Limitation of meta-analysis
While the overall consistency of results is impressive the findings need to be
interpreted with an element of caution. The analysis ignores the different
definitions used in measuring the dependent variable (such as scaling debt
either by assets or equity) and some explanatory variables (such as time length
in measuring earnings variability and growth in both assets and sales) as well
as differences in research methods (such as pooled, cross-sectional and panel
data methods). Also, the sample includes working papers to avoid bias, so it is
possible that large studies, in terms of sample size, with poor quality /
reliability may have impacted the overall results. However, the stability of the
results of meta-analysis depends on the number of studies being included in
the sample. Since the number of studies included in the present meta-analysis
is relatively large (140 studies), the majority of which are retrieved from

235
published journals (103 studies compared to 37 working paper studies), the
concern is limited. Indeed, eliminating the working paper studies, in
particular, those with large sample size does not affect the overall conclusion.
Such issues are shared by many studies employing the meta-analysis
technique (e.g. Borkowski, 1996 and Ahmed and Courtis, 1999), and the
limitations must be weighed against the benefits of the meta-analysis
technique (Ahmed and Courtis, 1999).
Despite these limitations and concerns, the meta-analysis technique has
considerable benefits over the traditional literature review when seeking to
aggregate and clarify conclusions from prior studies.
8.3 Saudi firm’s capital structure determinants
The limited number of cross-country studies (e.g. Rajan and Zingales, 1995;
Booth et al., 2001; Giannetti, 2003; Hall et al., 2004; De Jong et al, 2007)
confirms the importance of institutional factors in explaining cross-country
capital structure differences. The present study identifies a significant
difference between the capital choices of Saudi firms and firms in developed
economies, in that Saudi firms have substantially lower amounts of debt. The
10.9% total book-debt level observed in listed companies is far below the
figure in most developed countries. For example, in 1991, the mean of total
book-debt level in the G-7 countries was 41% (37% and 29% in the United
States and United Kingdom respectively) (Rajan and Zingales, 1995). It is
also below to the average total book-debt level of 32% in Arab countries
(Barakat and Rao, 2004). The substantially low amount of debt reflects the

236
fact that the Saudi listed companies are mainly financed by share capital rather
than debt. The data of listed companies shows that equity constitutes 57% of
their assets.
The main reasons that Saudi listed firms prefer equity to debt most likely
reflect the institutional characteristics of Saudi Arabia and can be summarised
as follows:
1. The sharp increase in the stock market (53.8%) over the period 2000 to
2004 encourages firms to use equity finance as much as possible. Baker and
Wurgler (2002) argue that firms tend to raise substantial amounts of equity
capital when the equity market is perceived to be more favourable.
2. Saudi Arabia has relatively weak legal protection for lenders/creditors and
poor enforcement of the law compared to developed countries (assuming
well-developed legal systems). This encourages banks, the major source of
debt in Saudi Arabia, to impose costly conditions in their lending policy. On
the other hand, individual shareholder protection is also quite weak in Saudi
Arabia. Overall, however, it would appear that ordinary share capital is a
relatively cheap source of finance in Saudi Arabia.
3. The corporate bond market is virtually non-existent due to the constraint
imposed by company law on bond issuance; this states that the total amount
of bonds issued by a company may not exceed paid up capital. Such a
constraint inhibits the use of such debt instruments among Saudi firms.

237
4. The tax advantage of debt, crucial to trade-off theory, is very limited since
the tax rate (zakat) imposed on firms is very low. Barakat and Rao (2004)
argue that, in the non-tax Arab countries (including Saudi Arabia), the use
of debt is no different from the use of equity. The payout on both is treated
the same in the absence of tax advantages of debt for the corporation or tax
advantage of equity for the investor. The authors found tax-Arab countries
use more debt than non-tax-Arab countries.
A remarkable difference between the capital choices of listed and unlisted
firms is also observed. The data shows that Saudi unlisted firms generally
have a higher level of total debt than listed firms, comprised of relatively
higher short-term debt but substantially lower amounts of long-term debt. This
may reflect the fact that unlisted firms do not have access to the capital
markets or easy access to long-term bank debt; hence, they have to rely on
short-term debt to finance growth. This evidence is consistent with Titman
and Wessels’ (1988) argument that small firms can be more leveraged than
large firms and may prefer to borrow short-term rather than long-term due to
the lower costs with this alternative.
In investigating to what extent institutional characteristics influence capital
structure determinants in Saudi Arabia, the results of the robust fixed effects
model reveal that certain firm-specific factors, relevant to explaining capital
structure in Western countries, are also relevant in Saudi despite its profound
institutional differences. As suggested by the two leading theories (i.e. trade-
off and pecking order), size and tangibility show a positive influence on
leverage, in particular, long-term debt in both samples. These results are also

238
consistent with the previous findings (e.g. US: Friend and Lang, 1988; Frank
and Goyal 2003; UK: Bennett and Donnelly, 1993; Bevan and Danbolt, 2002,
2004; Arab countries: Omet and Mashharawe, 2001; Barakat and Rao, 2004;
Australia SMEs: Cassar and Holmes, 2003).
An interesting difference between listed and unlisted companies is the
strength of the relationship with the size predictor variable. It is strongly
significant (1%) for all debt measures for unlisted, but quite weakly
significant (10%) and only for long-term debt for listed sample. This may
reflect the fact that listed firms have lower financial distress than unlisted
firms (1783 unlisted firms close down during the sample period compared to
no listed firms). Rajan and Zingales (1995) state that size can be considered a
proxy for the inverse probability of default and should be weak when the costs
of financial distress are low. The weak relationship may also reflect the fact
that listed firms prefer equity to debt finance because of the relatively lower
costs associated with equity issuance as stated earlier. Titman and Wessels
(1988) argue that the cost of issuing debt and equity is related to firm size.
The results also provide evidence consistent with pecking order theory.
Profitability is found to be significantly negatively correlated with long-term
debt in listed sample and with all debt levels in unlisted sample. This finding
is consistent with findings of the vast majority of prior empirical studies (e.g.
US: Baskin, 1989; Chang and Rhee, 1990; UK: Ozkan, 2001; Bevan and
Danbolt, 2002, 2004; cross-country developed countries: Booth et al, 2001;
Arab countries: Barakat and Rao, 2004; Omet and Mashharawe, 2001;
unlisted and SMEs: Petersen and Rajan, 1994; Cassar and Holmes, 2003; Hall

239
et al, 2004). However, as indicated earlier, Saudi listed firms prefer finance
their growth by equity rather than by debt argued to be due to market timing
consideration and other Saudi institutional characteristics. Thus, Saudi listed
firms seem to follow what might be called a “modified” pecking order in
which retained profit is the first preferred source of funds, followed by equity,
and lastly by debt.
Another support for the pecking order model is that liquidity is found to be
significantly negatively correlated with both short-term and total debt in
unlisted sample but only with short-term debt in listed sample. This finding is
also consistent with Omet and Mashharawe (2001) and Ozkan (2001), as well
as Bevan and Danbolt (2004), who argue that liquidity is an important
determinant of short-term bank financing. Partial support for pecking order
theory is also observed in the unlisted sample where dividends are found to be
significantly positively correlated with total debt, consistent with Baskin
(1989) and Adedeji (1998).
On the other hand, the trade-off model seems to have limited explanatory
power in Saudi Arabia. Agency theory (an argument for the trade-off model)
predicts that free cash flow should be positively related to debt levels.
However, the results show a significant negative relationship between free
cash flow and short-term and total debt as well as an insignificant relationship
with long-term debt in both samples. These results are inconsistent with the
use of debt to reduce the free cash flow (per agency theory) and, therefore,
also inconsistent with trade-off theory. These results most likely reflect lower

240
agency costs related to government ownership in the listed firm sample and
family ownership in the unlisted sample.
Some support for trade-off theory is observed in the significant negative
relationship between growth and long-term debt in unlisted sample, consistent
with agency costs of debt. On the other hand, the significant negative
relationship between growth and short-term debt observed in the unlisted
sample contradicts the positive relationship suggested by Myers (1977) and
found by Hall et al (2004) for Italy, Portugal and UK samples and by Cassar
and Holmes (2003) for Australian SMEs. In the listed sample, however, the
relationship between market-to-book ratio (as a proxy for growth
opportunities) and all debt ratios is insignificant. This suggests that the agency
costs of debt in Saudi Arabia may be low due to directors’ membership on
both the board of directors of listed firms and of banks. Bevan and Danbolt
(2004) also found, in their fixed effects analysis, insignificant associations
between market-to-book ratio and both long-term and short-term debt ratios.
In regard to testing the sensitivity of the results to the estimation techniques
used, pooled, average cross-sectional, yearly cross-sectional and panel data
estimation techniques were conducted on the listed and unlisted data over the
period 2000 to 2004. As shown in Table 8.2, the analyses of pooled and
average TOBIT estimation techniques reveal that while pooled regressions
have most likely suffered from overestimation bias, average regressions have
probably suffered from underestimation bias.

241
Indeed, the analyses of pure yearly cross-sectional regressions show that the
magnitude and significance of the coefficients vary from year to year
indicating that the interpretations and conclusions are dependent on the timing
of the observation. Accordingly, fixed effects panel data techniques are used,
in which time-invariant heterogeneity is controlled. The table shows that
controlling for time-invariant firm-specific heterogeneity bias (fixed effects
models) overturns several of the results obtained under pooled and average
techniques. Also, results using pooled estimation have relatively more
explanatory power than those obtained by average or fixed effects estimation.

242
Table 8.2: Comparison of pooled Tobit with averaged Tobit and fixed effects estimation results
Hypothesised signs Pooled data Average Cross-sectional Fixed effects
STD LTD TD STD LTD TD STD LTD TD STD LTD TD Panel A: Listed sample
LOGASSETS + + + 0.016 0.033*** 0.050*** 0.035** 0.051** 0.087*** -0.047 0.050* 0.004 ROA - - - 0.224*** -0.227*** 0.003 0.314* -0.086 0.228 -0.006 -0.189** -0.183
TANG - + + 0.001 0.086*** 0.086** -0.036 0.026 -0.010 0.004 0.104** 0.092 FCF - - - -0.248*** -0.054 -0.339*** -0.512* -0.145 -0.657** -0.130*** -0.011 -0.183** QR - - - -0.010** -0.005 -0.016*** -0.018* -0.009 -0.027 -0.007* -0.001 -0.008
UNIQ - - - -0.014 -0.027 -0.055 -0.005 -0.197 -0.202 -0.016 0.213* 0.187 M/B Ins. Ins. Ins. -0.003 -0.006 -0.008 0.008 -0.011 -0.003 0.003 -0.007 -0.005 DIV - - - -0.009 -0.024** -0.034** -0.014 -0.031 -0.045 -0.001 -0.003 -0.003
LOGAGE + - + -0.048** -0.026 -0.074** -0.012 0.016 0.004 -0.126 0.032 -0.087 Risk - - - -0.001 0.003 0.002 -0.003 0.006 0.003 na na na GOV - - - -0.085*** -0.020 -0.103*** -0.087** -0.034 -0.121* na na na
MINDUM + + + 0.040*** 0.067*** 0.109*** 0.031* 0.053** 0.084*** na na na CEMEDUM + + + 0.032** 0.044** 0.081*** 0.053* 0.034 0.087* na na na FARMDUM ? ? ? -0.008 -0.016 -0.023 0.017 0.011 0.028 na na na
Panel B: Unlisted sample LOGASSETS + + + 0.059*** 0.019*** 0.092*** 0.062*** 0.016*** 0.090*** 0.066*** 0.024*** 0.097***
ROA - - - -0.046** -0.040*** -0.118*** -0.032 -0.030 -0.068 -0.082*** -0.014* -0.119*** TANG - + + -0.115*** 0.092*** 0.035 -0.136*** 0.078*** -0.009 -0.030 0.048*** 0.051 FCF - - - -0.124*** -0.011** -0.144*** -0.274*** -0.064*** -0.366*** -0.110*** -0.002 -0.119*** QR - - - -0.032*** 0.002* -0.028*** -0.031*** 0.003 -0.023** -0.020*** 0.001 -0.019***
UNIQ - - - 0.001 0.049*** 0.078 0.058 0.079* 0.140 -0.053 0.007 0.103 G. ASSETS Ins. Ins. Ins. -0.044*** -0.011*** -0.067*** -0.004 -0.002 -0.043 -0.025** -0.005** -0.034***
DIV + + + -0.002 -0.002 -0.005 0.003 -0.001 -0.003 0.003 0.001 0.005** LOGAGE + - + 0.081*** -0.020*** 0.055*** 0.071 -0.011 0.068 0.095*** -0.044*** 0.006
Risk - - - 0.0001** 0.0001 0.0001* 0.0001** 0.0001 0.0001* na na na MINDUM + + + 0.005 0.016*** 0.019* -0.001 0.009 0.001 na na na
FARMDUM ? ? ? -0.028 -0.001 -0.052** -0.023 0.007 -0.031 na na na

243
It is also found that the influence of alternative proxies on the results can be as
important as the influence of differences in estimation techniques. For
example, although the relationship between profitability and debt elements
remains unchanged, using return on sales (ROS) as an alternative proxy for
profitability changes the insignificant negative relationship between market-
to-book and long-term debt into significant for listed firms. This result
combined with the negative relationship already observed between growth in
assets and debt elements for unlisted firms provides strong support to costs of
debt agency theory.
8.3.1 Limitation of the determinants analysis
The relatively small size of the listed sample may have limited the
explanatory power of the regression models. Also, as with all research
studies, care has to be exercised when seeking to generalise. The results
depend upon the time period of investigation and its specific environmental
characteristics. Notably, Saudi Arabia has been undergoing a period of rapid
expansion in its stock market but bond markets are not yet developed.
Despite these limitations, the results have provided valuable information
about the determinants of capital structure of listed and unlisted companies in
Saudi Arabia.
8.4 Suggestion for future research
This dissertation has triggered some topics for future research, referred to in
limitation subsections. The following is a summary of the important issues
that should be considered in future research:

244
The ignored different definitions in measuring both dependent and
independent variables due time consideration or lack of data should be
considered in future meta-analysis studies.
Factors such as differences in estimation techniques, the country of the study,
period of the study are potential factors that need to be also tested.
Conducting different meta-analysis method such as effect size meta-analysis
is recommended to check the robustness of the finding.
It would be useful to investigate behaviours more directly by conducting
studies based on interviews, questionnaire surveys and case studies.
The percentage held by large shareholder other than government will be of
great benefit when the data is available.
Though the finding provides some evidence supporting pecking order
hypothesis, an appropriate test similar to Shyam Sunder and Myers (1999) is
recommended.
Volatility, growth in assets and growth in sales need to be retested under
longer-term period when the data is available.
Finally, it was hoped that the findings of this study might inform regulator
bodies, academics and other researchers in general in Saudi Arabia. The
analysis reveals that Saudi companies are missing an important debt
instrument, bond debt. This absence limits the financing choice for
companies, which in turn may inhibit their growth. Accordingly, it is strongly
recommended that constraints related to bond issuance imposed on firms by

245
company law should be considered for removal. The potential success for
such instruments is very promising since Islamic law provides alternative
corporate bonds such as Sukuk Al Ijarah that are gaining popularity in other
Muslim countries (e.g. Malaysia, Qatar and United Arab emirates)22.
The other recommendation is the establishment of a database containing data
about Saudi companies. The existence of such a database will encourage
academics and other researchers to conduct research not only in finance but in
the business area in general. Accordingly, it is hoped that the database
assembled by the author may form the foundation for such a database.
22 According to Tariq (2004), Ijarah Sukuk is a certificate that is issued on stand-alone assets identified on the balance sheet. The assets can be parcels of land to be leased or leased equipment such as aircrafts and ships. The rental rates of returns on these Sukuk can be both fixed and floating depending on the particular originator.

246
References Adedeji, A. (1998), “Does the Pecking Order Hypothesis Explain The Dividend
Payout Ratios Of Firms In The UK?”, Journal of Business Finance and Accounting,
Vol. 25, No. 9/10, pp. 1127-1155.
Ahmed, K. and Courtis, J. (1999), “Associations between Corporate Characteristics
and Disclosure Levels in Annual Reports: A Meta-Analysis”, British Accounting
Review, Vol. 31, No. 1, pp. 35-61.
Aivazian, V., Ge, Y., and Qiu, J. (2005), “The Impact of Leverage on Firm
Investment: Canadian Evidence”, Journal of Corporate Finance, Vol. 11, No. 1-2,
pp. 277-291.
Akhtar, S. (2005), “The Determinants of Capital Structure for Australian
Multinational and Domestic Corporations”, Australian Journal of Management,
Vol. 30, No. 2, pp. 321-341.
Akhtar, S. and Oliver, B. (2006), “The Determinants of Capital Structure for
Japanese Multinational and Domestic Corporations”, Australian National University,
Working Paper.
Allayannis, G., Brown, G., and Klapper, L. (2003), “Capital Structure and Financial
Risk: Evidence from Foreign Debt Use in East Asia”, Journal of Finance, Vol. 58,
No. 6, pp. 2667-2710.
Allen, D. E. (1993), “The Pecking Order Hypothesis: Australian Evidence”, Applied
Financial Economics, Vol. 3, No. 2, pp. 101-112.
Allen, D. and Mizunot, H. (1989), “The Determinants of Corporate Capital
Structures: Japanese Evidence”, Applied Economics, Vol. 21, No. 5, p. 569.
Allen, D. (1991), “The Determinants of the Capital Structure of Listed Australian
Companies: the Financial Manager’s Perspective”, Australian Journal of
Management, Vol. 16, No. 2, pp. 103-28.
Allen, M. (1995), “Capital Structure Determinants in Real Estate Limited
Partnerships”, Financial Review, Vol. 30, No. 3, pp. 399-426.

247
Almazan, A. and Molina, C. A. (2005), “Intra-Industry Capital Structure
Dispersion”, Journal of Economics and Management Strategy, Vol. 14, No. 2, pp.
263-297.
Al-Sayari, H. (2003) “Saudi Arabian Banking System and Capital Markets”, Saudi
British forum, London.
Alti, A. (2006), “How Persistent Is the Impact of Market Timing on Capital
Structure? ”, Journal of Finance, Vol. 61, No. 4, pp. 1681-1710.
Alves, P. F. and Ferreira, M. A. (2007), “Capital Structure and Law around the
World”, SSRN, ID: 870845.
Antoniou, A., Guney, Y., and Paudyal, K. N. (2008), “Determinants of Capital
Structure: Capital Market-Oriented versus Bank-Oriented Institutions”, Journal of
Financial and Quantitative Analysis, Vol. 43, No.1, pp. 59-92..
Baker, M. and J. Wurgler (2002), “Market Timing and Capital Structure”, Journal
of Finance, Vol. 57, No. 1, pp. 1-30.
Bakheet, B. (1999) “Developing GCC Stock Markets: The Private Sector Role”,
Middle East Policy, February, Vol. 6, No.3, pp. 72-77.
Balakrishnan, S. and Fox, I. (1993), “Asset Specificity, Firm Heterogeneity and
Capital Structure”, Strategic Management Journal, Vol. 14, pp. 3-16.
Baltagi, B. H. (1995), “Econometric Analysis of Panel Data”, Chichester, New
York, Wiley.
Bancel, F. and Mittoo, U. (2004), “Cross Country Determinants of Capital Structure
Choice: A Survey of European Firms”, Financial Management, Vol.33, No. 4, pp.
103-132.
Barakat, M and Rao, R. (2004), “The Role of Taxes in Capital Structure: Evidence
from Taxed and Non-Taxed Arab Economies”, FMA, New Orleans meeting,
working paper.

248
Barclay, M. J., Smith C. W. and Watts, R. (1995), “The Determinants of Corporate
Leverage and Dividend Policies”, Journal of Applied Corporate Finance, Vol. 7,
No. 4, pp. 4–19.
Barclay, M., Marx, L. and Smith C. (2003), “The Joint Determination of Leverage
and Maturity”, Journal of Corporate Finance, Vol. 9, No. 2, pp. 149– 167.
Barry, P., Sotomayor, N., and Bierlen, R. W. (2000), “Financial Structure of Farm
Businesses Under Imperfect Capital Markets”, American Journal of Agricultural
Economics, Vol. 82, No. 4, pp. 920-933.
Basheikh A, (2002), “Financial reporting in Saudi Arabia and bank lending
decision”, University of Portsmouth, Phd theses.
Baskin, J. (1989), “An Empirical Investigation of the Pecking Order Hypothesis”,
Financial Management, Vol. 18, No. 1, pp. 26-35.
Beattie, V., Goodacre, A., and Thomson, S. (2006), “Corporate Financing
Decisions: UK Survey Evidence”, Journal of Business Finance and Accounting,
Vol. 33, No. 9/10, pp. 1402-1434.
Bennett, M. and Donnelly, R. (1993), “The Determinants of Capital Structure: Some
UK Evidence”, British Accounting Review, Vol. 25, No. 1, pp. 43–59.
Berger, P., Ofek, E., and Yermack, D. (1997), “Managerial Entrenchment and
Capital Structure Decisions”, Journal of Finance, Vol. 52, No. 4, pp. 1411-1438.
Bevan, A. and Danbolt, J. (2002), “Capital Structure and its Determinants in the
UK: A Decompositional Analysis”, Applied Financial Economics, Vol. 12, No. 3,
pp. 159-170.
Bevan, A., and J. Danbolt (2004), “Testing for Inconsistencies in the Estimation of
UK Capital Structure Determinants”, Applied Financial Economics, Vol. 14, No. 1
(January), pp. 55-66.
Bhaduri, S. (2002), “Determinants of Capital Structure Choice: A Study of the
Indian Corporate Sector”, Applied Financial Economics, Vol. 12, No. 9, pp. 655-
665.

249
Billett, M., King, T., and Mauer, D. (2007), “Growth Opportunities and the Choice
of Leverage, Debt Maturity, and Covenants”, Journal of Finance, Vol. 62, No. 2,
pp. 697-730.
Booth, L., Aivazian, V., Demirguc-Kunt, A., and Maksimovic, V. (2001), “Capital
Structures in Developing Countries”, Journal of Finance, Vol. 56, No. 1, pp. 87-
130.
Borkowski, S. (1996), “An Analysis (Meta-and Otherwise) of Multinational
Transfer Pricing Research”, International Journal of Accounting, Vol. 31, No. 1, pp.
39-53.
Boyle, G. and Eckhold, K. (1997), “Capital Structure Choice and Financial Market
Liberalisation: Evidence from New Zealand”, Applied Financial Economics, Vol. 7,
pp. 427- 437.
Bradley, M., Jarrell, G., and Kim, E. (1984), “On the Existence of an Optimal
Capital Structure: Theory and Evidence”, Journal of Finance, Vol. 39, No. 3, p.
857.
Brailsford, T., Oliver, B., and Pua, S. (2002), “On the Relation between Ownership
Structure and Capital Structure”, Accounting and Finance, Vol. 42, No. 1, pp. 1-26.
Brander, J. and Lewis, T. (1986), “Oligopoly and Financial Structure: The Limited
Liability Effect”, American Economic Review, Vol. 76, No. 5, pp. 965-970.
Bulan L. and Sanyal P. (2006), “Is There Room for Growth? Debt, Growth
Opportunities and the Deregulation of U.S. Electric Utilities”, Brandeis University,
Working Paper.
Burgman, T. A. (1996), “An Empirical Examination of Multinational Corporate
Capital Structure”, Journal of International Business Studies, Vol. 27, No. 3, pp.
553-570.
Cassar, G. and Holmes, S. (2003), “Capital Structure and Financing of SMEs:
Australian Evidence”, Accounting and Finance, Vol. 43, No. 2, pp. 123-147.

250
Chang, R. and Rhee, S. (1993), “The Impact of Personal Taxes on Corporate
Dividend Policy and Capital Structure Decisions”, Financial Management, Vol. 19,
No.2, pp.21-31.
Chen, J. J. (2004), “Determinants of Capital Structure of Chinese-Listed
Companies”, Journal of Business Research, Vol. 57, No.12, pp. 1341-1351.
Chen, L. and Zhao, X. (2006), “On the Relation between the Market-to-Book Ratio,
Growth Opportunity, and Leverage Ratio”, Finance Research Letters, Vol. 3, No. 4
pp. 253-66.
Chen, L., Lensink, R. and Sterken, E. (1998), “The Determinants of Capital
Structure: Evidence from Dutch Panel Data”, European Economic Association
Annual Congress, Working Paper.
Chen, Y., and Hammes, K. “Capital Structure Theories and Empirical Results: A
Panel Data Analysis”, SSRN, ID: 535782.
Chirinko, R. S. and Singha, A. R. (2000), “Testing Static Tradeoff against Pecking
Order Models of Capital Structure: A Critical Comment”, Journal of Financial
Economics, Vol. 58, No. 3, pp. 417-425.
Chung, K. H. (1993), “Asset Characteristic and Corporate Debt Policy: An
Empirical Test”, Journal of Business Finance and Accounting, Vol. 20, No. 1, pp.
83-98.
Chun-Hung T. and Jang S. (2007), “Revisit to the Determinants of Capital
Structure: A Comparison between Lodging Firms and Software Firms”,
International Journal of Hospitality Management, Vol. 26, No. 1, pp. 175–187.
Colombo, E. (2001), “Determinants of Corporate Capital Structure: Evidence from
Hungarian Firms”, Applied Economics, Vol. 33, No. 13, pp. 1689-1701.
Cooper, H. (1998), “Synthesizing Research: a Guide for Literature Reviews”, 3rd
ed. Sage.

251
Crutchley, C. E. and Hansen, R. S. (1989), “A Test of the Agency Theory of
Managerial Ownership, Corporate Leverage, and Corporate Dividends”, Financial
Management, Vol. 18, No. 4, pp. 36-46.
De Jong, A. (2002), “The Disciplining Role of Leverage in Dutch Firms”, European
Finance Review, Vol. 6, No. 1, pp. 31-62.
De Jong, A. and Veld, C. (2001), “An Empirical Analysis of Incremental Capital
Structure Decisions Under Managerial Entrenchment”, Journal of Banking and
Finance, Vol. 25, No. 10, pp. 1857-1895.
De Jong, A., Kabir, R., and Nguyen, T. T. (2007), “Capital Structure around the
World: The Roles of Firm- and Country-Specific Determinants”, Journal of
Banking & Finance, forthcoming. .
De Medeiros, O. R. and Daher, C. E. (2004), “Testing Static Trade-off against
Pecking Order Models of Capital Structure in Brazilian Firms”, SSRN, ID: 631563.
De DeMiguel, A. and Pindado, J. (2001), “Determinants of Capital Structure: New
Evidence from Spanish Panel Data”, Journal of Corporate Finance, Vol. 7, No. 1,
pp. 77-99.
DeAngelo, H. and Masulis, R. W. (1980), “Optimal Capital Structure under
Corporate and Personal Taxation”, Journal of Financial Economics, Vol. 8, No. 1,
pp. 3-29.
Deesomsak, R., Paudyal, K., and Pescetto, G. (2004), “The Determinants of Capital
Structure: Evidence from the Asia Pacific Region”, Journal of Multinational
Financial Management, Vol. 14, No. 4-5, pp. 387-405.
Desai, M. A., Foley, C., and Hines, J. R. (2004), “A Multinational Perspective on
Capital Structure Choice and Internal Capital Markets”, Journal of Finance, Vol.
59, No. 6, pp. 2451-2487.
Dessi, R. and Robertson, D. (2003), “Debt, Incentives and Performance: Evidence
from UK Panel Data”, Economic Journal, Vol. 113, No. 490, pp. 903-919.

252
Diamond, D.W., (1989), “Reputation Acquisition in Debt Markets”, Journal of
Political Economy, Vol. 97, pp.828-862.
Donaldson, G. (1961), “Corporate Debt Capacity: A Study of Corporate Debt
Capacity”, Boston, Division of Research, Harvard School of Business
Administration.
Doukas, J. A. and Pantzalis, C. (2003), “Geographic Diversification and Agency
Costs of Debt of Multinational Firms”, Journal of Corporate Finance, Vol. 9, No.
1, pp. 59-92.
Downs, T. W. (1993), “Corporate Leverage and Non-Debt Tax Shields: Evidence
on Crowding-Out”, Financial Review, Vol. 28, No. 4, p. 549.
Drobetz, D. and fix, R. (2005), “What Are the Determinants of the Capital
Structure? Evidence from Switzerland”, Schweizerische Zeitschrift furkswirtschaft
und Statistik, Vol. 141, No.1, pp. 71–113.
Du, J. and Dai, Y. (2005), “Ultimate Corporate Ownership Structures and Capital
Structures: evidence from East Asian economies”, Corporate Governance: An
International Review, Vol. 13, No. 1, pp. 60-71.
Dzolkarnaini, N. (2006), “Capital Control Regime and Capital Structure
Determinants: A Malaysian Case”, Malaysian Accounting Review, Vol. 5, No. 1, pp.
1-41.
Eriotis N. (2007), “How Firm Characteristics Affect Capital Structure: an Empirical
Study”, Managerial Finance, Vol. 33, No. 5, pp. 321-331.
Esperança, J., Gama, P. and Gulamhussen, M. (2003), “Corporate Debt Policy of
Small Firms: An Empirical (Re) Examination”, Journal of Small Business and
Enterprise Development, Vol. 10, No. 1, pp. 62-80.
Fama, E. F. and French, K. R. (2002), “Testing Trade-Off and Pecking Order
Predictions about Dividends and Debt”, Review of Financial Studies, Vol. 15, No. 1,
pp. 1-33.

253
Fan, P. H. J., Titman, S., and Twite, G. J. (2006), “An International Comparison of
Capital Structure and Debt Maturity Choices”, SSRN, ID: 423483.
Fattouh, B., Harris, L., and Scaramozzino, P. (2005), “Non-Linearity in the
Determinants of Capital Structure: Evidence from UK Firms”, SSRN, ID: 789304.
Fischer, E. O., Heinkel, R., and Zechner, J. (1989), “Dynamic Capital Structure
Choice: Theory and Tests”, Journal of Finance, Vol. 44, No. 1, pp. 19-40.
Flannery, M. J. and Rangan, K. P. (2006), “Partial Adjustment toward Target
Capital Structures”, Journal of Financial Economics, Vol. 79, No. 3, pp. 469-506.
Frank, M. Z. and Goyal, V. K. (2003), “Testing the Pecking Order Theory of
Capital Structure”, Journal of Financial Economics, Vol. 67, No. 2, pp. 217-248.
Frank, M. Z. and Goyal, V. K. (2004), “Capital Structure Decisions: Which Factors
are Reliably Important? “, SSRN, ID: 567650.
Fraser, D. R., Zhang, H., and Derashid, C. (2006), “Capital Structure and Political
Patronage: The Case of Malaysia”, Journal of Banking and Finance, Vol. 30, No. 4,
pp. 1291-1308.
Frieder, L. and Martell, R. (2006), “On Capital Structure and the Liquidity of a
Firm's Stock”, SSRN, ID: 880421.
Friend, I. and Lang, L. H. P. (1988), “An Empirical Test of the Impact of
Managerial Self-Interest on Corporate Capital Structure”, Journal of Finance, Vol.
43, No. 2, pp. 271-281.
Frydenberg, S. (2003), “A Dynamic Model of Corporate Capital Structure”, SSRN,
ID: 394989.
Gatward, P. and Sharpe, I. G. (1996), “Capital Structure Dynamics with Interrelated
Adjustment: Australian Evidence”, Australian Journal of Management, Vol. 21, No.
2, pp. 89-112.
Gaud, P., Hoesli, M., and Bender, A. (2007), “Debt-Equity Choice in Europe”,
International Review of Financial Analysis, Vol. 16, No. 3, pp. 201-222.

254
Gaud, P., Jani, E., Hoesli, M., and Bender, A. (2005), “The Capital Structure of
Swiss Companies: an Empirical Analysis Using Dynamic Panel Data”, European
Financial Management, Vol. 11, No. 1, pp. 51-69.
Giannetti, M. (2003), “Do Better Institutions Mitigate Agency Problems? Evidence
from Corporate Finance Choices”, Journal of Financial and Quantitative Analysis,
Vol. 38, pp.185-212.
Glass, G. (1976), “Primary, Secondary, and Meta-Analysis of Results”, Educational
Researcher, Vol. 5, pp. 3-8.
Givoly, D. (1992), “Taxes and Capital Structure: Evidence from Firms' Response to
the Tax Reform Act of 1986”, Review of Financial Studies, Vol. 5, No. 2, pp. 331-
355.
Graham, J. R. and Harvey, C. R. (2001), “The Theory and Practice of Corporate
Finance: Evidence from the Field”, Journal of Financial Economics, Vol. 60, No. 2-
3, pp. 187-243.
Graham, J. R., Lemmon, M. L., and Schallheim, J. S. (1998), “Debt, Leases, Taxes,
and the Endogeneity of Corporate Tax Status”, Journal of Finance, Vol. 53, No. 1,
pp. 131-162.
Greenberg, P. S. (1992), “The Use of Meta-Analysis Techniques in Developing
Dissertation Proposals: Guidelines to Aid Supervising Faculty”, Issues in
Accounting Education, Vol. 7, No. 2, pp. 145-163.
Greene, W. H. (2000), “Econometric Analysis”, Prentice Hall, Fourth Edition.
Grossman, S. and Hart, O. (1982), “Corporate Financial Structure and Managerial
Incentives”, in: McCall, J. (ed.), Economics of Information and Uncertainty,
University of Chicago Press.
Gujarati, D. N. (2003), “Basic Econometrics”, Irwin, Fourth Edition.
Gul, F. A. (1999), “Government Share Ownership, Investment Opportunity Set and
Corporate Policy Choices in China”, Pacific-Basin Finance Journal, Vol. 7, No. 2,
pp. 157-172.

255
Hall, G., Hutchinson, P and Michaelas, N. (2004), “Determinants of the Capital
Structures of European SMEs”, Journal of Business Finance and Accounting, Vol.
31, No. 5&6, pp. 711-728.
Harris M. and Raviv, A. (1988), “Corporate Control Contests and Capital
Structure”, Journal of Financial Economics, Vol. 20, pp. 55-86.
Harris, M. and Raviv, A. (1990), “Capital Structure and the Informational Role of
Debt”, Journal of Finance, Vol. 45, No. 2, pp. 321–349.
Harris, M. and Raviv, A. (1991), “The Theory of Capital Structure”, Journal of
Finance, Vol. 46, No. 1, pp. 297-355.
Harvey, C. R., Lins, K. V., and Roper, A. H. (2004), “The Effect of Capital
Structure When Expected Agency Costs Are Extreme”, Journal of Financial
Economics, Vol. 74, No. 1, pp. 3-30.
Heshmati, A. (2001), “The Dynamics of Capital Structure: Evidence from Swedish
Micro and Small Firms”, Stockholm School of Economics, Working Paper Series in
Economics and Finance No. 440.
Hirota, S. (1999), “Are Corporate Financing Decisions Different in Japan? An
Empirical Study on Capital Structure”, Journal of the Japanese and International
Economies, Vol. 13, No. 3, pp. 201-229.
Hogfeldt, P. and Oborenko, A. (2005), “Does Market Timing or Enhanced Pecking
Order Determine Capital Structure?”, SSRN, ID: 592501.
Homaifar, G., Zietz, J., and Benkato, O. (1994), “An Empirical Model of Capital
Structure: Some New Evidence”, Journal of Business Finance and Accounting, Vol.
21, No. 1, pp. 1-14.
Hovakimian, A. (2006), “Are Observed Capital Structures Determined by Equity
Market Timing?”, Journal of Financial and Quantitative Analysis, Vol. 41, No. 1,
pp. 221-243.

256
Hovakimian, A., Opler, T., and Titman, S. (2001), “The Debt-Equity Choice”,
Journal of Financial and Quantitative Analysis, Vol. 36, No. 1, pp. 1-24.
Huang, G. and Song, F. M. (2006), “The Determinants of Capital Structure:
Evidence from China”, China Economic Review, Vol. 17, No. 1, pp. 14-36.
Hung, C., Albert, C. and Eddie H. (2002), “Capital Structure and Profitability of the
Property and Construction Sectors in Hong Kong”, Journal of Property Investment
and Finance, Vol. 20, No. 6, pp. 434-453.
Hussain, Q. and Nivorozhkin, E. (1997), “The Capital Structure of Listed
Companies in Poland”, SSRN, ID: 883923.
International Monetary Fund (2006), “Saudi Arabia country report”, Washington
D.C, USA.
Israel, R. (1992), “Capital and Ownership Structures, and the Market for Corporate
Control”, Review of Financial Studies, Vol. 5, No. 2, pp 181-198.
Jalilvand, A. and Harris, R. S. (1984), “Corporate Behavior in Adjusting to Capital
Structure and Dividend Targets: An Econometric Study”, Journal of Finance, Vol.
39, No. 1, p. 127-145.
Jensen, G. R., Solberg, D. P., and Zorn, T. S. (1992), “Simultaneous Determination
of Insider Ownership, Debt, and Dividend Policies”, Journal of Financial and
Quantitative Analysis, Vol. 27, No. 2, pp. 247-263.
Jensen, M. (1986), “Agency Cost of Free Cash Flows, Corporate Finance and
Takeovers”, American Economic Review, Vol. 76, No. 2, pp. 323–339.
Jensen, M. and Meckling, W. (1976), “Theory of the Firm: Managerial Behaviour,
Agency Costs and Capital Structure”, Journal of Financial Economics, Vol. 3, No.
4, pp. 305-360.
Jiraporn, P. and Gleason, K. C. (2007), “Capital Structure, Shareholder Rights, and
Corporate Governance”, Journal of Financial Research, Vol. 30, No. 1, pp. 21-33.

257
Joeveer, K. (2006), “Sources of capital structure: evidence from transition
countries”, Bank of Estonia, Working Papers No 2006-02.
Jordan, J., Lowe, J., and Taylor, P. (1998), “Strategy and Financial Policy in UK
Small Firms”, Journal of Business Finance and Accounting, Vol. 25, No. 1&2, pp.
1-27.
Kahle, K. M. and Shastri, K. (2005), “Firm Performance, Capital Structure, and the
Tax Benefits of Employee Stock Options”, Journal of Financial and Quantitative
Analysis, Vol. 40, No. 1, pp. 135-160.
Kale, J. R. and Shahrur, H. K. (2007), “Corporate Capital Structure and the
Characteristics of Suppliers and Customers”, Journal of Financial Economics,
Vol.83, No. 2, pp. 321-365.
Kayhan, A. and Titman, S. (2007), “Firms' Histories and Their Capital Structures”,
Journal of Financial Economics, Vol. 83, No. 1, pp. 1-32.
Kester, C.W. (1986), “Capital and Ownership Structure: A Comparison of United
Studies and Japanese Manufacturing Corporations”, Financial Management, Vol.
15, No. 1, pp. 5- 16.
Kim, H., Heshmati, A., and Aoun, D. (2006), “Dynamics of Capital Structure: The
Case of Korean Listed Manufacturing Companies”, Asian Economic Journal, Vol.
20, No. 3, pp. 275-302.
Klapper, L., Sarria-Allende, V. and Zaidi, R. (2006), “A Firm-Level Analysis of
Small and Medium Size Enterprise Financing in Poland”, World Bank Policy
Research, Working Paper No. 3984.
Klein, D. P. and Belt, B. (1993), “Sustainable Growth and Choice of Financing: A
Test of the Pecking Order Hypothesis”, Review of Financial Economics, Vol. 3, No.
1-2, pp. 141-154.
Kyereboah, A. and Biekpe, N. (2006), “Corporate Governance and Financing
Choices of Firms: A Panel Data Analysis”, South African Journal of Economics,
Vol. 74, No. 4, pp. 670-681.

258
La Porta, R., Florencio L. and Shleifer, A.(1999), “Corporate Ownership around the
World”, Journal of Finance, Vol. 54, No. 2, pp. 471-517.
Lasfer, M. A. (1995), “Agency Costs, Taxes and Debt: The UK Evidence”,
European Financial Management, Vol. 1, No. 3, pp. 265-285.
Lee, J. W., Lee, Y. S., and Lee, B. S. (2000), “The Determination of Corporate Debt
in Korea”, Asian Economic Journal, Vol. 14, No. 4, p. 333.
Leland, H. and Pyle, D. (1977), “Informational Asymmetries, Financial Structure
and Financing Intermediation”, Journal of Finance, Vol. 32, No. 2, pp. 371- 388.
Lemmon, M. L., Roberts, M. R., and Zender, J. F. (2006), “Back to the Beginning:
Persistence and the Cross-Section of Corporate Capital Structure”, SSRN, ID:
881899.
Lord, R. A. and McIntyre, J. E. (2003), “Leverage, Imports, Profitability, Exchange
Rates, and Capital Investment: A Panel Data Study of the Textile and Apparel
Industries (1974)-(1987)”, International Review of Financial Analysis, Vol. 12, No.
3, pp. 287-310.
Lowe, J., Naughton, T. and Taylor, P. (1994), “The Impact of Corporate Strategy on
the Capital Structure of Australian Companies”, Managerial and Decision
Economics, Vol. 15, No. 3, pp. 245- 257.
MacKay, P. and Phillips, G. M. (2005), “How Does Industry Affect Firm Financial
Structure?”, Review of Financial Studies, Vol. 18, No. 4, pp. 1433-1466.
MacKie-Mason, J. (1990), “Do Taxes Effect Corporate Financing Decisions?”,
Journal of Finance, Vol. 45, No. 5, pp. 1471-1493.
Maddala, G.S. (1983). “Limited-Dependent and Qualitative Variables in
Econometrics”, Econometric Society Monographs in Quantitative Economics,
Cambridge, University Press.
Maksimovic, V. (1988), “Capital Structure in Repeated Oligopolies”, Rand Journal
of Economics, Vol. 19, No. 3, pp. 389-407.

259
Manos, R., Green, C., and Murinde, V. (2001), “Business Groups and Capital
Structure: Evidence on Indian Firms”, Institute for Development Policy and
Management, University of Manchester, Paper No 34.
Marsh, P. (1982), “The Choice between Equity and Debt: An Empirical Study”,
Journal of Finance, Vol. 37, No. 1, pp. 121- 144.
Mayer, C. and Sussman, O. (2004), “A New Test of Capital Structure”, Saïd
Business School, University of Oxford, Working paper.
Mehran, H., R.A. Taggart and D. Yermack (1999), ‘CEO Ownership, Leasing and
Debt Financing’, Financial Management, Vol. 28, No. 2, pp. 5-15.
Mehrotra, V., Mikkelson, W., and Partch, M. (2005), “Do Managers Have Capital
Structure Targets? Evidence from Corporate Spinoffs”, Journal of Applied
Corporate Finance, Vol. 17, No. 1, pp. 18-25.
Miller M.H. (1977), “Debt and Taxes”, Journal of Finance, Vol. 32, No. 2, pp. 261-
275.
Ministry of Commerce and Industry, (1999) “Corporate Law”, Ministry of Planning
Press, Riyadh, Saudi Arabia.
Ministry of Planning, (1990) “The Seventh Development Plan: 1990-1995”,
Ministry of Planning Press, Riyadh, Saudi Arabia.
Ministry of Planning, (1995) “The Seventh Development Plan: 1995-2000”,
Ministry of Planning Press, Riyadh, Saudi Arabia.
Ministry of Planning, (2000) “The Seventh Development Plan: 2000-2005”,
Ministry of Planning Press, Riyadh, Saudi Arabia.
Mitton, T. (2006), “Why Have Debt Ratios Increased for Firms in Emerging
Markets?”, SSRN, ID: 897581.
Modigliani, F. and Miller, M. H. (1958), “The Cost of Capital, Corporation Finance
and the Theory of Investment”, American Economic Review, Vol. 48, No. 3, pp.
261-297.

260
Modigliani, F. and Miller, M. H. (1963), “Corporate Income Taxes and the Cost of
Capital: A Correction”, American Economic Review, Vol. 53, No. 3, pp. 433-443.
Moh'd, M. A., Perry, L. G., and Rimbey, J. N. (1998), “The Impact of Ownership
Structure On Corporate Debt Policy: a Time-Series Cross-Sectional Analysis”,
Financial Review, Vol. 33, No. 3, pp. 85-98.
Molina C. (2005), “Are Firms Underleveraged? An Examination of the Effect of
Leverage on Default Probabilities”, Journal of Finance, Vol. 60, No. 3, 1427-1459.
Muller, E. (2005), “Benefits of Control, Capital Structure and Company Growth”,
SSRN, ID: 776364.
Mutenheri, E. and Green, C. (2002), “Financial Reform and Financing Decisions of
Listed Firms in Zimbabwe”, Loughborough University, Economic Research Paper,
No. 02/5.
Myers, S. C. (1977), “Determinants of Corporate Borrowing”, Journal of Financial
Economics, Vol. 5, No. 2, pp. 147-175.
Myers, S. C. (1984), “The Capital Structure Puzzle”, Journal of Finance, Vol. 39,
No. 3, pp. 575-592.
Myers, S. C. and Majluf, N. (1984), “Corporate Financing Decisions and
Investment Decisions When Firms Have Information That Investors Do Not Have”,
Journal of Financial Economics, Vol. 13, No. 2, pp. 187-221.
Nam, J., Ottoo, R. E., and Thornton, J. (2003), “The Effect of Managerial Incentives
to Bear Risk on Corporate Capital Structure and RandD Investment”, Financial
Review, Vol. 38, No. 1, pp. 77-101.
Naser, K. (1998), “Investment Prospects in a Sample of Arab Stock Exchanges”,
Emirates Occasional Papers, (17), 1-42.
Nguyen, T. and Ramachandran, N. (2006), “Capital Structure in Small and
Medium-sized Enterprises: The Case of Vietnam”, ASEAN Economic Bulletin, Vol.
23, No. 2, pp. 192–211.

261
Nishioka, S. and Baba, N. (2004), “Dynamic Capital Structure of Japanese Firms:
How Far Has the Reduction of Excess Leverage Progressed in Japan”, Bank of
Japan, Working Paper Series No.04-E-16.
Nivorozhkin, E. (2002), “Capital Structures in Emerging Stock Markets: the case of
Hungary”, Developing Economies, Vol. 40, No. 2, pp. 166-187.
Norton, E. (1989), “Determinants of Capital Structure: A Survey,” Advances in
financial planning and forecasting. Vol. 3, pp. 323-350.
Omet, G. and Mashharawe, F. (2001), “The Capital Structure Choice in Tax
Contrasting Environments: Evidence from the Jordanian, Kuwaiti, Omani and Saudi
Corporate Sectors”, Hashemite University, Working Paper.
Ooi J. (1999), “The Determinants of Capital Structure Evidence on UK Property
Companies”, Journal of Property Investment and Finance, Vol. 17 No. 5, pp. 464-
480.
Opler, T. C. and Titman, S. (1994), “Financial Distress and Corporate
Performance”, Journal of Finance, Vol. 49, No. 3, pp. 1015-1040.
Ozkan, A. (2001), “Determinants of Capital Structure and Adjustment to Long Run
Target: Evidence from UK Company Panel Data”, Journal of Business Finance and
Accounting, Vol. 28, No. 1&2, pp. 175-198.
Petersen, M. A. and Rajan, R. G. (1994), “The Benefits of Lending Relationships:
Evidence from Small Business Data”. Journal of Finance 49, pp. 3–37.
Pindyck R. and Rubinfeld D. (1998), “Econometric Models and Economic
Forecasts”, Irwin, fourth edition.
Rajan, R. G. and Zingales, L. (1995), “What Do We Know about Capital Structure?
Some Evidence from International Data”, Journal of Finance, Vol. 50, No. 5, pp.
1421-1460.
Ramalho, J. J. S. and Vidigal Da Silva, J. (2007), “A Two-Part Fractional
Regression Model for the Capital Structure Decisions of Micro, Small, Medium and
Large Firms”, SSRN, ID: 968017.

262
Rosenthal, R., “Meta-Analytic Procedures for Social Research”, (1991), Newbury
Park, Sage.
Ross, S. (1977), “The Determination of Financial Structure: The Incentive
Signalling Approach”, Bell Journal of Economics, Vol. 8, No. 1, pp. 23-40.
Sapar, N. R. and Lukose, P. J. (2002), “An Empirical Study on the Determinants of
the Capital Structure of Listed Indian Firms”, SSRN, ID: 433120.
Sarig, O.H. (1998), "The Effect of Leverage on Bargaining with Corporation",
Financial Review, Vol. (33), No. 1, pp. 1-16.
Saudi Arabian Monetary Agency (1985), “Money and Banking Statistics”, SAMA,
Research and Statistics Department.
Saudi Arabian Monetary Agency (SAMA) (1995). “Money and Banking Statistics”,
SAMA, Research and Statistics Department.
Saudi British Bank, (2003), “Special Report on Saudi Banks”, SAAB, Riyadh, Saudi
Arabia.
Schmidt, F., Hunter, J. E., Pearlman, K., Hirsh, H., Sackett, P. R., Schmitt, N. E.,
Tenopyr, M. L., Kehoe, J., and Zedeck, S. (1985), “Forty Questions About Validity
Generalization and Meta-analysis.”, Personnel Psychology, Vol. 38, No. 4, pp. 697-
798.
Shenoy, C. and Koch, P. (1996), “The Firm’s Leverage-Cash Flow Relationship”,
Journal of Empirical Finance, Vol. 2, No. 4, pp. 307- 331.
Short, H., Keasey, K., and Duxbury, D. (2002), “Capital Structure, Management
Ownership and Large External Shareholders: A UK Analysis”, International
Journal of the Economics of Business, Vol. 9, No. 3, pp. 375-399.
Shuetrim, G., Lowe, P. and Morling, S. (1993), “The Determinants of Corporate
Leverage: A Panel Data Analysis”, Reserve Bank of Australia, Working paper.

263
Shyam-Sunder, L. and Myers, S. C. (1999), “Testing Static Trade-off against
Pecking Order Models of Capital Structure”, Journal of Financial Economics, Vol.
51, No. 2, pp. 219-244.
Sogorb-Mira, F. (2001), “On Capital Structure in the Small and Medium
Enterprises: The Spanish Case”, SSRN, ID: 277090.
Sogorb-Mira, F. and Lopez-Gracia, J. (2003), “Pecking Order Versus Trade-off: An
Empirical Approach to the Small and Medium Enterprise Capital Structure”, SSRN,
ID: 393160.
Song, H. (2005), “Capital Structure Determinants: An Empirical Study of Swedish
Companies”, CESIS, Electronic Working Paper Series, Paper No.25.
Smith, C. and Warner, J. (1979), “On Financing Contracting: An Analysis of Bond
Covenants,” Journal of Financial Economics, Vol. 7, pp. 117-161.
Stulz R. (1988), “Managerial Control of Voting Rights: Financing Policies and the
Market for Corporate Control” Journal of Financial Economics, Vol. 20, pp. 25-54.
Stulz, R. (1990), “Managerial Discretion and Optimal Financing Policies”, Journal
of Financial Economics, Vol. 26, pp. 3-27.
Taggart, R. A., Jr. (1977), “A Model of Corporate Financing Decisions”, Journal of
Finance, Vol. 32, No. 5, pp. 1467-1484.
Tariq, A. (2004), “Managing Financial Risks of Sukuk Structures”, Loughborough
University, Unpublished master degree dissertation.
Theis, J. and Casey, M. (1999), “An Empirical Investigation of Agency
Relationships and Capital Structure of Property Management Firms in the UK”,
Journal of Property Investment and Finance, Vol. 17, No. 1, pp. 27-34.
Thies, C. F. and Klock, M. S. (1992), “Determinants of Capital Structure”, Review
of Financial Economics, Vol. 1, No. 2, pp. 40-52.
Titman, S. (1984), “The Effect of Capital Structure on the Firm’s Liquidation
Decision”, Journal of Financial Economics, Vol. 13, No. 1, pp. 137-151.

264
Titman, S. and Wessels, R. (1988), “The Determinants of Capital Structure Choice”,
Journal of Finance, Vol. 43, No. 1, pp. 1-19.
Tong, G. and Green, C. J. (2005), “Pecking Order or Trade-off Hypothesis?
Evidence on The Capital Structure of Chinese Companies”, Applied Economics,
Vol. 37, No. 19, pp. 2179-2189.
Twite, G. (2001), “Capital Structure Choices and Taxes: Evidence from the
Australian Dividend Imputation Tax System”, International Review of Finance,
Vol. 2, No. 4, pp. 217-234.
Voulgaris, F., Asteriou, D., and Agiomirgianakis, G. (2004), “Size and
Determinants of Capital Structure in the Greek Manufacturing Sector”,
International Review of Applied Economics, Vol. 18, No. 2, pp. 247-262.
Wald, J. K. (1999), “How Firm Characteristics Affect Capital Structure: An
International Comparision”, Journal of Financial Research, Vol. 22, No. 2, p. 161.
Wanzenried G. (2002), “Capital Structure Dynamics in UK and Continental
Europe”, University of Bern, Working paper.
Wen, Y., Rwegasira, K., and Bilderbeek, J. (2002), “Corporate Governance and
Capital Structure Decisions of the Chinese Listed Firms”, Corporate Governance:
An International Review, Vol. 10, No. 2, pp. 75-83.
Wi, S. K. and Sorensen, E. H. (1986), “Evidence on the Impact of the Agency Costs
of Debt on Corporate Debt Policy”, Journal of Financial and Quantitative Analysis,
Vol. 21, No. 2, p. 131.
Wiwattanakantang, Y. (1999) “An Empirical Study on The Determinants of the
Capital Structure of Thai Firms”, Pacific-Basin Finance Journal, Vol. 7, pp. 371–
403.
Wolf, F. M. (1986), “Meta-Analysis: Quantitative Methods For Research
Synthesis”, Beverly Hills, Sage Publications.
Yan, A. (2006), “Leasing and Debt Financing: Substitutes or Complements?”,
Journal of Financial and Quantitative Analysis, Vol. 41, No. 3, pp. 709-731.

265
Yu, H. C. (2000), “Banks Capital Structure and the Liquid Asset Policy Implication
of Taiwan”, Pacific Economic Review, Vol. 5, pp. 109-114.
Yu, H. C. (2003), “Public Debt, Bank Debt and Non-bank Private Debt and Firm
Characteristics among Taiwanese Listed Companies”, SSRN, ID: 424860.
Zou, H. and Xiao, J. Z. (2006), “The Financing Behaviour of Listed Chinese
Firms”, British Accounting Review, Vol. 38, No. 3, pp. 239-258.

266
Internet reference
Arab newspaper (www.arabnews.com).
Bakheet Investment Group (www.bakheetgroup.com)
Olayan company profile, (www.olayan.com).
Saudi Arabian Monetary Agency (www.sama.gov.sa).
Saudi Organization for Certified Public Accountants (SOCPA), (www.socpa.org.sa)
TADAWUL official web sit (www.tadawul.com.sa)
Washingtonpost spotlight, (www.Washingtonpost.com).
The Ministry of Commerce and Industry web site (www.commerce.gov.sa).

267
Appendices Appendix 1
Table-1: Summary of the studies included in the meta-analysis.
Study Studies’Source Data source Country Period
Adedeji (1998) J B F A Table app. D: page 1148 UK 1993-96 Aivazian et al (2005) JCF Table 2: page 254 Canada 1982-99 Akhtar S. (2005) AJM Table 6, p332 Australia 1992-01 Akhtar S. and Oliver B. (2006) WP Table 2: page 27 Japan 1994-03
Allayannis et al. (2003) J F Table III: page 2685 8 East Asia countries 1996
Allen (1993) AFE Table 5: page 108 Australia 1954-66 Allen and Mizuno (1989) AE Table 3, p 576 Japan 1980-83 Allen, M. T. (1995) FR Table 4: page 421 USA 1980-89 Almazan A. and Molina C. (2005) JEMS Table III: page 276-77 USA 1998-00 Alves P. and Ferreira M. (2007) SSRN Table A-2: page 47 31 Countries 1995-00 Antoniou et al. (2008) JFQA Table 6: page 79 FR, GR &UK 1989-00 Alti A. (2006) J F Table V: page 1697 USA 1971-02 Baker, M. and Wurgler J. (2002) J F Table III: page 16 USA 1968-99 Balakrishnan and Fox (1993) SMJ Table 2: page 11 USA 1978-87
Barakat and Rao 2004 WP Table 7: page 44 12 Arabs countries 1996-01
Barclay M. et al. (2003) JCF Table 3: page 160 USA 1980-99 Barry P et al (2000) AJAE Table 2: page 927 USA 1990-94 Baskin (1989) FM Exhibit 2: page 30 USA 1960-72
Bennett and Donnelly (1993) BAR Tables 4,5 and 6: page 54,56,57 UK 1977-88
Berger et al (1997) J F Table IV: page 1428 USA 1984-91 Bevan and Danbolt (2004) AFE Table 2: page 60 UK 1991-97 Bhaduri (2002) AFE Table 5: page 663 India 1990-95 Billett et al. (2007) J F Table VII: page 719 USA 1989-02
Booth et al. (2001) J F Table V, VI and VII: page 106-11
10 developing countries 1989-90
Boyle and Eckhold (1997) AFE Table 2: page 434 New Zealand 1986-89 Bradley et al (1984) J F Table IV: page 875 USA 1962-81 Brailsford et al (2002) AF Table 2: page 16 Australia 1989-95 Bulan L. and Sanyal P. (2006) WP Table 2, page 24 USA 1990-03 Burgman T. (1996) JIBS Table 6: page USA 1987-91 Cassar and Holmes (2003) AF Table 3: page 137 Australia 1995-97 Chang and Rhee (1993) FM Exhibit 2: page 27 USA 1981-87

268
Chen and Hammes (2004) SSRN Table, 3 and 5: page 29, 31
6 European countries and US
1990-96
Chen and Zhao (2006) FRL Table 4 and 5: page 13 and 17 USA 1972-02
Chen et al. (1998) WP Table 7.4 and 4.5: page 26 Netherlands 1984-95
Chen J. (2004) JBR Table 4 and 5: page 1344,1345 China 1995-00
Chung K (1993) JBFA Table 4, P 93 USA 1980-84 Chun-Hung T. and Jang S. (2007) IJHM Table 3: page 182 USA 1997-03 Colombo E. (2001) AE Table 7: page 1699 Hungary 1992-96 Crutchley and Hansen (1989) FM Exhibit 6: page 45 USA 1977-85
Deesomsak et al (2004) JMFM Table 4: page 13 4 Asian countries 1993-01
De Jong A. (2002) EFR Table IV: page 50 Netherlands 1992–97 De Jong et al (2007) FBF Table 2, p 34-39 42 countries 1997-2001DeMedeiros and Daher (2004) WP Table 1: page 8 Brazil 1995-02 DeMiguel and Pindado (2001) JCF Table 4: page 91 Spain 1990-97 Desai et al. (2004) J F Table II: page 2464 USA 1982-94 Dessí R. and Robertson D. (2003) EJ Table 3: page 914 UK 1976-89 Doukas and Pantzalis (2003) JCF Table 2: page 76 USA 1988-94 Downs T. (1993) FR Table 4: page 570 USA 1969-85 Drobetz and fix (2005) SZVS Table 7: page 101 Switzerland 1996–01
Du and Dai (2005) CGIR Table 1: page 65-66 9 East Asia countries 1994-96
Dzolkarnaini N (2006) MAR Table7: page 25-27 Malaysia 1995-02 Eriotis N. (2007) FM Table III: page 328 Greece 1997-01 Esperança et al. (2003) JSBED Table IV: page 70 Portugal 1992-96 Fama and French (2002) RFS Table 3: page 21 USA 1965-99
Fan et al. (2006) SSRN Table App. 3: page 49-50 39 developed and developing countries
1991-00
Fattouh et al. (2005) SSRN Table 3 and 5: page 25 and 27 UK 1988-98
Fischer et al (1989) J F Table IX: page 36 USA 1977-85 Flannery and Rangan (2006) JFE Table 11: page 501 USA 1965-01 Frank and Goyal (2003) JFE Table 7: page 240 USA 1971-93 Frank and Goyal (2004) SSRN Table 8: page 43 USA 1950-00 Fraser et al. (2006) JBF Table 4: page 1301 Malaysia 1990-99 Frieder and Martell (2006) SSRN Table 3: page 30 USA 1988-98 Friend and Lang (1988) J F Table II and III: page 277 USA 1979-83
Frydenberg S. (2003) SSRN Table III, IV, V: page 42-43 Norway 1990-00
Gatward and Sharpe (1996) AJM Table 1,p 101 Australia 1967-85 Gaud et al. (2005) EFM Table 3: page 61-62 Switzerland 1991-00

269
Gaud et al. (2007) IRFA Table 2 page 13 European country
Giannetti (2003) JFQA Table 6: page 198 8 European countries 1997
Graham and Tucker (2005) SSRN Table 5: page 36 USA 1975 -00 Gul F. (1999) P-BFJ Table 6: page 169 China 1990-95
Hall et al. (2004) JBFA Tables 5 and 6: page 723-24
8 European countries 1995
Harvey et al (2004) JFE Table 2: page 12 18 emerging markets 1995-96
Heshmati (2001) WP Table 6: page 33 SWEDEN 1993-97 Hirota (1999) JJIE Table IV: page 217 Japan 1977-92 Hogfeldt and Oborenko (2005) SSRN Table 5: page 38 SWEDEN 1979-97 Homaifar et al (1994) J B F A Table 3: page 9 USA 1979-88 Hovakimian (2006) JFQA Table 1: page 225 USA 1983-02 Hovakimian et al (2001) JFQA Table 3: page 8 USA 1979-97 Huang and Song (2006) CER Table 7: page 32 China 1994-03 Hung et al. (2002) JPIF Table V: page 445 Hong Kong 1993-00 Hussain and Nivorozhkin (1997) SSRN Table 10: page 21 Poland 1991-94 Jensen et al (1992) JFQA Table 3A: page 256 USA 1982 Jiraporn and Gleason (2007) JFR Table 5: page 31 USA 1993-02 Jordan et al. (1998) J B F A Table 3: page 17 UK 1989-93 Kahle and Shastri (2005) JFQA Table 3: page 148-149 USA 1995-99 Kale and Shahrur (2007) SSRN Table 3: page appendix USA 1984-03
Joeveer K. (2006) WP Appendix 6: page 19 9 Eastern European countries.
1995–02
Kayhan and Titman (2007) JFE Table B.1: page 30 USA 1971-02 Kester (1986) FM Table 5: page 13 Japan and US 1982-83 Kim, et al. (2006), AEJ Table 2: page 299 South Korea 1985-02 Klapper et al. (2006) SSRN Table 9, p 41 Poland 1998-02 Kyereboah and Biekpe (2006) SFJE Table 2: page 678 Nairobi 1996-98 Lasfer (1995) EFM Table 4: page 277 UK 1972-83 Lee, et al. (2000) AEJ Table 2, 4: page 348, 352 South Korea 1981-97 Lemmon et al. (2006) SSRN Table 4 appendix USA 1965-03 Lord and McIntyre (2003) IRFA Table 3, page 299 USA 1974-87 Lowe et al (1994) MDE Table 2: page 252 Australia 1984-88 Macic-Mason J. (1990) J F Table II, p 1484-85 USA 1977-87 MacKay and Phillips (2005) RFS Table 5: page 1456 USA 1981-00 Manos et al (2001) WP Table 5:panel b: page 38 India 2000 Mehran et al (1999) FM Table 3: page 13 USA 1986-91 Mehrotra et al (2005) JACF Table 4: page 24 USA 1979-97
Mitton T. (2006) SSRN Table 7: page appendix 34 emerging markets 1980-04
Moh’d et al. (1998) FR Table 2: page 98 USA 1972-89

270
Molina C. (2005) J F Table III: page 1440 USA 1988-02 Mueller E. (2005) SSRN Table, 4: page 21 UK 1997-01 Mutenheri and Green (2002) WP Table 4: page 19 Zimbabwe 1986-99 Nam et al (2003) FR Table 3: page 88 USA 1996 Nguyen and Ramachandran (2006) AEB Table 7: page 205 Vietnam 1998-01 Nishioka and Baba (2004) WP Table 2-1,2-2: page 20-21 Japan 1992-03 Nivorozhkin E. (2002) DE Tables, VIII: page 181-82 Hungary 1992–95
Omet and Mashharawe (2001) WP Tables 4 and 8: page 21, 23
4 Arab countries 1996-01
Ooi J. (1999) JPIF Table IV: page 475 UK 1989-96 Ozkan (2001) J B F A Table 2: page 187 UK 1984-96 Petersen and Rajan (1994) J F Table V: page 19 US 1988-89
Rajan and Zingales (1995) J F Table IX: page 1453 7 developed countries 1984-91
Ramalho and Da Silva (2007) SSRN Table 4: page 30 Portugal 1999 Sapar N. and Lukose P. (2002) SSRN Table VIII: page appendix India 1990-92 Shenoy and Koch (1996) JEF Table 5: page 324 USA 1979-89 Short et al. (2002) IJEB Table 2: page 391 UK 1988-92 Shuetrim et al. (1993) WP Table 3: page 24 Australia 1974-90 Shyam-Sunder and Myers (1999) JFE Table 5: page 241 USA 1971-89 Sogorb-Mira and Gracia (2003) SSRN Table 13: page 28 Spain 1994-98 Sogorb-Mira F. (2001) SSRN Table 4: page 27 Spain 1994-98 Song H. (2005) WP Table 8: page 21 SWEDEN 1992-00 Theis and Casey (1999) JPIF Table I: page 31 UK 1996 Thies and Klock (1992) RFE Table 2: page 12 USA 1935-83 Titman and Wessels (1988) J F Table IV: page 13 USA 1974-82 Tong and Green (2005) AE Table, 4: page 2187 China 2001–03 Twite G. (2001) IRF Table 4: page 233 Australia 1983-97 Voulgaris et al (2004) IRAE Table 4: page 254 Greece 1989-96
Wald (1999) JFR Tables 4, 2a: page 174, 185
5 developed countries 1991-92
Wanzenried G. (2002) WP Table 7.2.1: page 23 10 European countries 1988-98
Wen et al (2002) CGIR Table 2: page 79 China 1996-98 Wi and Sorensen (1986) JFQA Table 3: page 139 USA 1970-80
Wiwattanakantang 1999 P-BFJ Table 12 and 13: page 397-98 Thailand 1996
Yan An (2006) JFQA Tables 5, 6: page 723-24 USA 1983-97 Yu H. (2003) SSRN Table 7: page 34 Taiwan 1991-00 Zou and Xiao (2006) BAR Table 4: page China 1993–00

271
AE: Applied Economics AEB: ASEAN Economic Bulletin AEJ: Asian Economic Journal AF: Accounting and finance AFE: Applied Financial Economics AJAE: American Journal of Agricultural Economics AJM: Australian Journal of Management BAR: British Accounting Review CER: China Economic Review CGIR: Corporate Governance: An International Review DE: Developing Economies EFM: European Financial Management EFR: European Finance Review EJ: Economic Journal FM: Financial Management FR: Financial Review FRL: Finance Research Letters IJEB: Int. J. of the Economics of Business IJHM: International Journal of Hospitality Management IRAE: International Review of Applied Economics IRF: International Review of Finance IRFA: International Review of Financial Analysis JACF: Journal of Applied Corporate Finance JBF: Journal of Banking & Finance JBFA: Journal of Business Finance and Accounting JBR: Journal of Business Research JCF: Journal of Corporate Finance JEF: Journal of Empirical Finance JEMS: Journal of Economics & Management Strategy JF: Journal of Finance JFE: Journal of Financial Economics JFQA: Journal of Financial and Quantitative Analysis JFR: Journal of Financial Research JIBS: Journal of International Business Studies JJIE: Journal of the Japanese and International Economies JMFM: Journal of Multinational Financial Management JPIF: Journal of Property Investment & Finance JSBED: Journal of Small Business and Enterprise Development MAR: Malaysian Accounting Review MDE: Managerial and Decision Economics P-BFJ: Pacific-Basin Finance Journal RFE: Review of Financial Economics RFS: Review of Financial Studies SFJE: South African Journal of Economics SMJ: Strategic management journal SSRN: Social Science Research Network SZVS: Schweizerische Zeitschrift for Volkswirtschaft und Statistik WP: Working paper

272
Appendix 2
Table-2: Top 100 Saudi Companies in 2003
Company Revenue Rank in
2003
Revenue in 2002 (SR in
million)
Assets 2002 (SR in
million) Sector Listed
in SSM
Kingdom Holding Company 1 35,600 92,300 Diversified Y Saudi Basic Industries Corp. 2 34,026 99,172 Petrochemical Y Saudi Telecom Company 3 23,547 40,913 Telecom. Y Dallah Al-Baraka Group 4 17,374 47,974 Diversified N Saudi Aramco Mobil Refinery Co. Ltd 5 11,014 5,493 Petrochemicals N Consolidated Contractors Int’l Co. S.A.L 6 5,578 4,217 Contracting N Olayan group Holding Company 7 4,133 8,577 Diversified N Riyad Bank 8 3,673 67,209 Banking Y Savola Group 9 3,624 3,472 Agribusiness Y Saad Group 10 3,452 4,012 Diversified N Al Rajhi Banking & Investment Corp. 11 3,379 59,113 Banking Y Samba Financial group 12 3,143 76,362 Banking Y Al Faisaliah Group Co. (Ltd.) 13 2,500 1,645 Diversified N Alsuwaiket Trading & Contracting Co. 14 2,113 994 Contracting N S.A. Al Rajhi Co. 15 1,979 4,548 Agribusiness N The Saudi British Bank 16 1,841 46227 Banking Y Arab National Bank 17 1,718 44,299 Banking Y Banque Saudi Fransi 18 1,699 44,713 Banking Y Marei Bin Mahfouz Group of Co. Ltd. 19 1,670 1,695 Industrial N Riyadh Cables Group of Companies 20 1,536 1,590 Industrial N Saudi Hollandi Bank 21 1,523 26,899 Banking Y Al Duais Group 22 1,500 0 Hospitality N Zamil Industrial Investment Co. (ZIIC) 23 1,406 1,262 Industrial Y Al Tayyar Travel Group Ltd. 24 1,404 357 Services N El Seif Group of Companies 25 1,359 0 Diversified N National Gas & Ind. Co. 26 1,255 925 Industrial Y Arab Supply & Trading Corp. 27 1,216 1,732 Agribusiness N The National Shipping Co. of Saudi Arabia 28 1,210 4,398 Shipping Y
Saudi Arabian Amiantit Co. 28 1,210 2,440 Industrial Y National Co. Cooperative Insurance 30 1,181 1,699 Insurance Y Haji Husein Alireza & Co. Ltd. 31 1,132 0 Trading N Isam Kabbani Group of Companies 32 1,128 871 Industrial N Alhamrani Group of Companies 33 956 1,024 Trading N Samama Group of Companies 34 900 559 Diversified N Southern Province Cement Co. 35 888 2,086 Industrial Y Gulf United Investment 36 825 500 Investment N Saudi Dairy Foodstuff Co. 37 795 827 Agribusiness Y Saleh & Abdulaziz Abahsain Co. Ltd. 38 785 722 Diversified N Al Obeikan Group for Ind. Invest. Co. Ltd. 39 753 963 Publishing N
Yanbu Cement Co. 40 746 2,060 Industrial Y Saudi Cable Company 41 730 1,124 Industrial Y Arabic Computer Systems Ltd. 42 721 111 IT N Fursan Travel & Tourism 43 704 12 Services N Alsalam Aircraft Co. Ltd 44 652 645 Aeronautics N Al Tuwairqi Group of Companies 45 645 573 Industrial N Yamama Saudi Cement Co. Ltd. 46 625 1,372 Industrial Y The Saudi Investment Bank 47 608 19,957 Banking Y M. & A. Al Subeaei for Exchange & Trading 48 600 1,980 Finance N

273
Table-2: Top 100 Saudi Companies in 2003
Company Revenue Rank in
2003
Revenue in 2002 (SR in
million)
Assets 2002 (SR in
million) Sector Listed
in SSM
Mohammed Al Mojil Group 48 600 1,500 Construction N AAl Taher Group 50 599 0 Diversified N Advanced Electronics Company 51 592 486 Electronics N Al Aujan Industries Co. 52 590 489 Industrial N Zahran Maintenance Co. 53 584 21 Engineering N Abdul Ghani El Ajou & Sons Holding 54 580 0 Diversified N Al Babtain Group 55 560 681 Industrial N Jarir Marketing Co. 56 541 559 Trading Y Arabian Agricultural Services Co. 57 521 923 Agribusiness N Jeddah Cable Company 58 515 140 Industrial N Arabian Cement Co. Ltd. 59 514 1,368 Industrial Y Al Alamiah Electronic Co. 60 514 502 IT N Aluminium Products Co. Ltd. 61 505 530 Industrial N Mohammed Assad Aldrees & Sons Co. 62 502 532 Petrochemical N The National Titanium Dioxide Co. Ltd. 63 465 1,092 Industrial N National Agricultural Development Co. 64 459 1,050 Agribusiness Y Trading & Industrial Group Holding Ltd. 65 450 500 Finance N Saudi Arabian Lubricating Oil Co. 66 418 402 Petrochemicals N Al Abdulkarim Trading Co. 67 380 0 Trading N Saudi Pharma. Ind. & Medical Appl. Co. 68 362 203 Medical Y ABB Contracting Company Ltd. 69 354 108 Contracting N Abdullah A.M Al Khodari Sons Co. 70 350 325 Contracting N ABB Electrical Industries Co. Ltd. 71 331 241 Industrial N Consolidated Contractors Co. WLL 72 326 327 Contracting N Arabian Drilling Company 73 318 460 Petrochemicals N Arabian Gulf Manuf. Ltd For Plastic Ind. 74 310 371 Industrial N
Al Majal Services Co. 75 310 107 Services N Mekkah Construction & Development Co. 76 307 2,545 Contracting Y Arabian Geophysical & Surveying Co. Ltd. 77 305 406 Petrochemicals N
Aswad Group 77 305 210 Contracting N Saudi Guardian Int’l. Float Glass Co. Ltd. 79 285 465 Industrial N Tihama for Adv., PR & Marketing 80 272 316 Advertising Y National Industrialization Co. 81 250 2,227 Industrial Y Elaf Group of Companies 82 247 68 Hospitality N Saudi Ceramic Co. 83 225 563 Industrial Y Samir Photographic Supplies 84 220 177 Electronics N Saudi Arabian Fertilizer Co. 85 212 4,320 Industrial Y International Computer Company Ltd. 86 200 3 IT N Al Jazira Bank 87 198 6 Banking Y Saudi Hotels & Resorts Co. 88 167 1,383 Hospitality Y Projects & Trading Co. 89 149 202 Construction N Arabian Pipes Co. 90 145 288 Industrial Y Hail Agricultural Development Co. 91 136 371 Agribusiness Y Saudi Fisheries Company 92 135 244 Agribusiness Y Mindshare S.A. 93 135 0 Advertising N
Heating & Air conditioning Ent. Ltd 94 100 71 Industrial N
L’Azurde Group for Industrial Investment 94 100 0 Jewelery N
Taiba Inv. & Real Estate Dev. Co 96 90 1,272 Investment Y

274
Table-2: Top 100 Saudi Companies in 2003
Company Revenue Rank in
2003
Revenue in 2002 (SR in
million)
Assets 2002 (SR in
million) Sector Listed
in SSM
Modern Arab Construction Co. Ltd 97 69 55 Contracting N
Nardeen Lighting Co. Ltd. 98 66 44 Lighting N
International System Engineering Co. Ltd 99 26 0 IT N
Aljardan International Agencies 100 17 3 Technology N
Source: www.arabnews.com
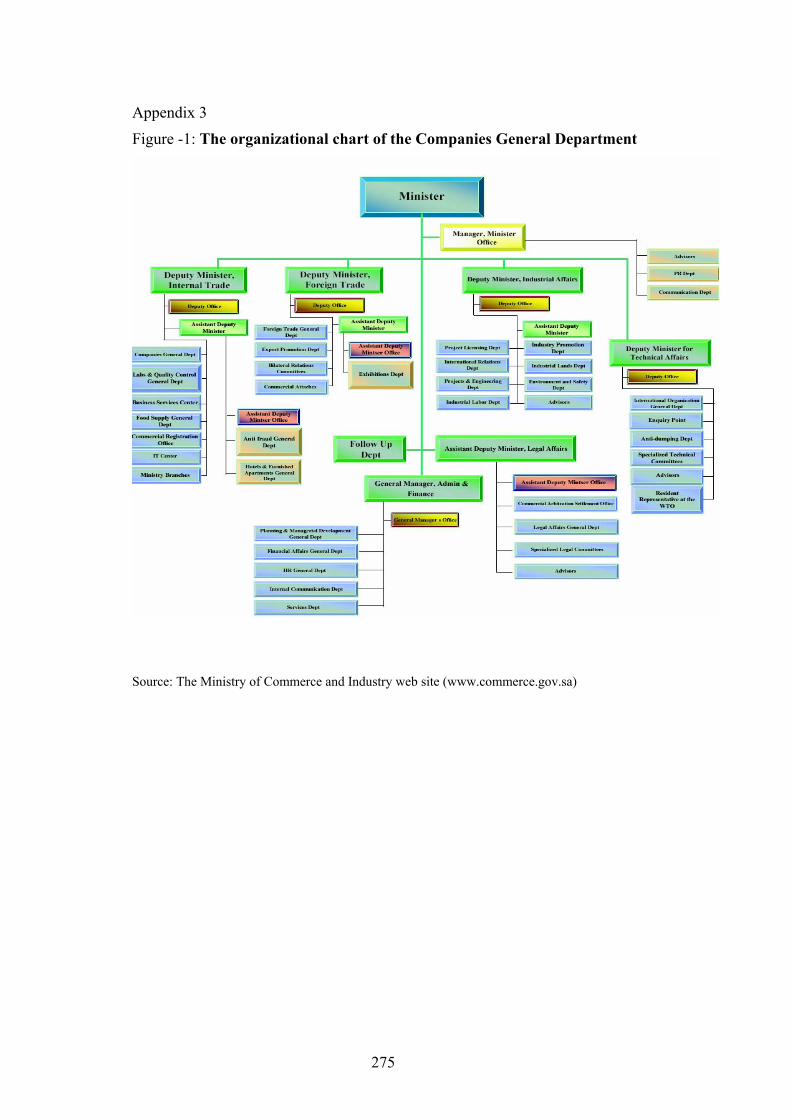
275
Appendix 3
Figure -1: The organizational chart of the Companies General Department
Source: The Ministry of Commerce and Industry web site (www.commerce.gov.sa)

276
Table-3: The Initial list of Saudi listed companies as of at 31 January 2006
No. Symbol Long Name Short Name Acronym 1 2010 Saudi Basic Industries Corp SABIC SABIC
2 2310 Saudi Internati. Petroche Co Sipchem SIPCHEM
3 4180 Ahmed H. Fitaihi Company AHF AHFCO
4 4061 Al Mawashi Al Mukairish United Co. MMUCO MMUCO
5 1120 Al Rajhi Bank Al Rajhi RJHI
6 2140 Al-Ahsa Development Co. ADC AADC
7 4130 Al-Baha Investment & Development co Al-baha ABDICO
8 6070 Al-Jouf Agriculture Development Co. ALJOUF JADCO
9 4200 Aldrees Petroleum & Transport Services Co. Aldrees Aldrees
10 2280 Almarai Company Almarai ALMARAI
11 2170 Alujain Corporation Alujain ALCO
12 1080 Arab National Bank ARNB ARNB
13 3010 Arabian Cement Co.LTd ACC ARCCO
14 2200 Arabian Pipes Company APC APCO
15 4150 Arriyadh Development Co. ARDCO ADCO
16 4080 Aseer Trading, Tourism & Manufacturing Co. Aseer ATTMCO
17 6060 Ashargiyah Agriculture Development Co. ASH SHARQIYAH ASACO
18 1140 BANK ALBILAD ALBILAD ALBI
19 1020 Bank AlJazira BJAZ BJAZ
20 1050 Banque Saudi Fransi BSFR BSFR
21 6080 Bishah Agriculture Development Co. BISHACO BISACO
22 3080 Eastern Province Cement Co. E.P.C.C.O EACCO
23 2300 Saudi Paper Manufacturing Co. SPM SPM
24 2180 Filing & Packing Materials Manufacturing Co. FIPCO FIPCO
25 2100 Food Products Co. githaiah FPCO
26 6030 Hail Agriculture Development Co. HADCO HAACO
27 4190 Jarir Marketing Co Jarir Jarir
28 6090 Jazan Development Co. JAZADCO GIZACO
29 4100 Makkah Construction & Development Co. MCDC MCDCO
30 2210 Nama Chemicals Co. Nama Chemicals NAMA
31 6010 National Agriculture Development Co. NADEC NADEC
32 4160 National Agriculture Marketing Co. THIMAR THIMAR
33 2080 National Gas & Industrialization Co. GASCO NGIC
34 2090 National Gypsum Company NGC NGCO
35 2060 National Industrialization Co NIC NIC
36 2220 National Metal Manufacturing and Casting Co. Maadaniyah NMMCC
37 6020 Qassim Agriculture Co. GACO QAACO
38 1010 Riyad Bank RIBL RIBL
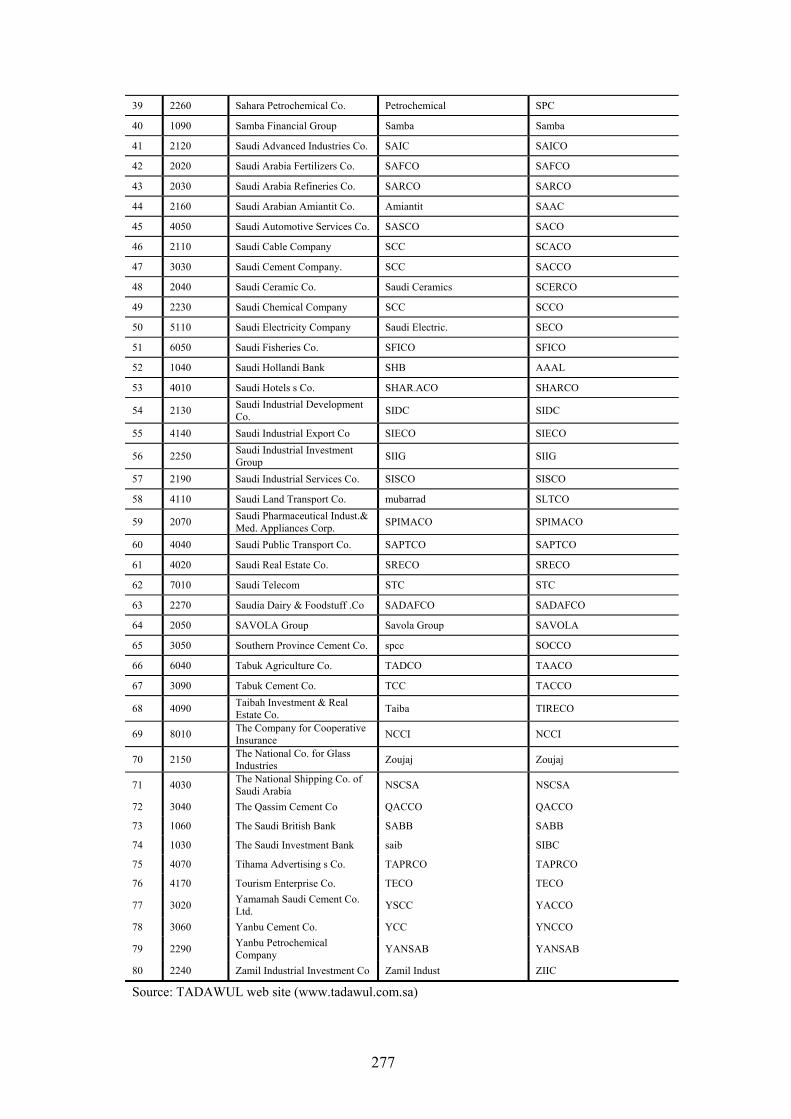
277
39 2260 Sahara Petrochemical Co. Petrochemical SPC
40 1090 Samba Financial Group Samba Samba
41 2120 Saudi Advanced Industries Co. SAIC SAICO
42 2020 Saudi Arabia Fertilizers Co. SAFCO SAFCO
43 2030 Saudi Arabia Refineries Co. SARCO SARCO
44 2160 Saudi Arabian Amiantit Co. Amiantit SAAC
45 4050 Saudi Automotive Services Co. SASCO SACO
46 2110 Saudi Cable Company SCC SCACO
47 3030 Saudi Cement Company. SCC SACCO
48 2040 Saudi Ceramic Co. Saudi Ceramics SCERCO
49 2230 Saudi Chemical Company SCC SCCO
50 5110 Saudi Electricity Company Saudi Electric. SECO
51 6050 Saudi Fisheries Co. SFICO SFICO
52 1040 Saudi Hollandi Bank SHB AAAL
53 4010 Saudi Hotels s Co. SHARِACO SHARCO
54 2130 Saudi Industrial Development Co. SIDC SIDC
55 4140 Saudi Industrial Export Co SIECO SIECO
56 2250 Saudi Industrial Investment Group SIIG SIIG
57 2190 Saudi Industrial Services Co. SISCO SISCO
58 4110 Saudi Land Transport Co. mubarrad SLTCO
59 2070 Saudi Pharmaceutical Indust.& Med. Appliances Corp. SPIMACO SPIMACO
60 4040 Saudi Public Transport Co. SAPTCO SAPTCO
61 4020 Saudi Real Estate Co. SRECO SRECO
62 7010 Saudi Telecom STC STC
63 2270 Saudia Dairy & Foodstuff .Co SADAFCO SADAFCO
64 2050 SAVOLA Group Savola Group SAVOLA
65 3050 Southern Province Cement Co. spcc SOCCO
66 6040 Tabuk Agriculture Co. TADCO TAACO
67 3090 Tabuk Cement Co. TCC TACCO
68 4090 Taibah Investment & Real Estate Co. Taiba TIRECO
69 8010 The Company for Cooperative Insurance NCCI NCCI
70 2150 The National Co. for Glass Industries Zoujaj Zoujaj
71 4030 The National Shipping Co. of Saudi Arabia NSCSA NSCSA
72 3040 The Qassim Cement Co QACCO QACCO
73 1060 The Saudi British Bank SABB SABB
74 1030 The Saudi Investment Bank saib SIBC
75 4070 Tihama Advertising s Co. TAPRCO TAPRCO
76 4170 Tourism Enterprise Co. TECO TECO
77 3020 Yamamah Saudi Cement Co. Ltd. YSCC YACCO
78 3060 Yanbu Cement Co. YCC YNCCO
79 2290 Yanbu Petrochemical Company YANSAB YANSAB
80 2240 Zamil Industrial Investment Co Zamil Indust ZIIC
Source: TADAWUL web site (www.tadawul.com.sa)

278
Appendix 4
Table-4: Pure cross-sectional regression (Short-term debt) Listed (n = 60) Unlisted (n = 403) STD
2000 2001 2002 2003 2004 2000 2001 2002 2003 2004 0.025 0.039** 0.011 0.009 0.025 0.062*** 0.062*** 0.068*** 0.053*** 0.051*** LOGASSETS (0.115) (0.039) (0.577) (0.713) (0.115) (0.000) (0.000) (0.000) (0.000) (0.000) 0.076 0.374*** 0.233* 0.054 0.293*** -0.029 -0.011 -0.017 -0.094* -0.083* ROA (0.502) (0.003) (0.092) (0.753) (0.008) (0.509) (0.843) (0.741) (0.066) (0.093) -0.040 0.047 -0.021 -0.016 0.010 -0.130*** -0.109*** -0.086** -0.112*** -0.139*** TANG1 (0.359) (0.182) (0.619) (0.700) (0.740) (0.001) (0.009) (0.042) (0.003) (0.000) -0.123 -0.199 -0.424** -0.235 -0.252** -0.043 -0.165*** -0.109** -0.156*** -0.176*** FCF (0.405) (0.177) (0.020) (0.168) (0.025) (0.290) (0.000) (0.017) (0.004) (0.000)
-0.024*** -0.001 -0.014** 0.007 -0.010*** -0.033*** -0.032*** -0.031*** -0.030*** -0.030*** QR (0.001) (0.899) (0.016) (0.714) (0.005) (0.000) (0.000) (0.000) (0.000) (0.000) 0.119 -0.066 -0.024 -0.070 -0.077 -0.077 0.025 0.013 0.002 0.092 UNIQ (0.248) (0.551) (0.887) (0.586) (0.420) (0.371) (0.821) (0.881) (0.989) (0.469)
0.034* -0.006 0.005 0.016 -0.012* -0.029 -0.065** -0.077** -0.030 M/B & G. ASSETS (0.053) (0.669) (0.805) (0.332) (0.062) (0.263) (0.023) (0.011) (0.313)
0.000 -0.025** -0.018 0.003 -0.037* -0.001 -0.002 -0.001 -0.007 0.002 DIV (0.994) (0.038) (0.129) (0.913) (0.082) (0.913) (0.866) (0.837) (0.294) (0.766) -0.086* -0.041 -0.046 -0.060 -0.036 0.062** 0.077** 0.064* 0.105** 0.079 LOGAGE (0.071) (0.340) (0.284) (0.295) (0.345) (0.039) (0.041) (0.096) (0.026) (0.156)
0.000 0.0001* RISK (0.976) (0.047) -0.084** -0.143*** -0.062 -0.064 -0.080** Gov. (0.043) (0.002) (0.158) (0.255) (0.031)
0.021 0.045** 0.055** 0.063** 0.019 0.021 0.011 -0.008 0.002 -0.002 MINDUM (0.382) (0.030) (0.041) (0.031) (0.194) (0.253) (0.561) (0.658) (0.918) (0.936) 0.002 -0.007 0.064 -0.006 0.054** CEMDUM (0.933) (0.779) (0.144) (0.914) (0.040) -0.010 -0.027 0.011 0.018 -0.006 -0.049 -0.030 -0.026 -0.017 -0.021 FARMDUM (0.729) (0.239) (0.682) (0.449) (0.782) (0.103) (0.560) (0.581) (0.768) (0.754) -0.047 -0.260 0.021 0.013 -0.096 -0.311*** -0.336*** -0.369*** -0.273** -0.226**
INTERCEPT (0.757) (0.137) (0.912) (0.954) (0.531) (0.001) (0.001) (0.001) (0.014) (0.031)
Wald χ2 -test 38.19*** 47.65*** 29.29*** 21.61* 36.09*** 120.83*** 133.22*** 124.37*** 128.25*** 152.40*** Adjusted R2 0.2172 0.2375 0.1710 0.0579 0.2111 0.1770 0.1884 0.1654 0.1760 0.1797
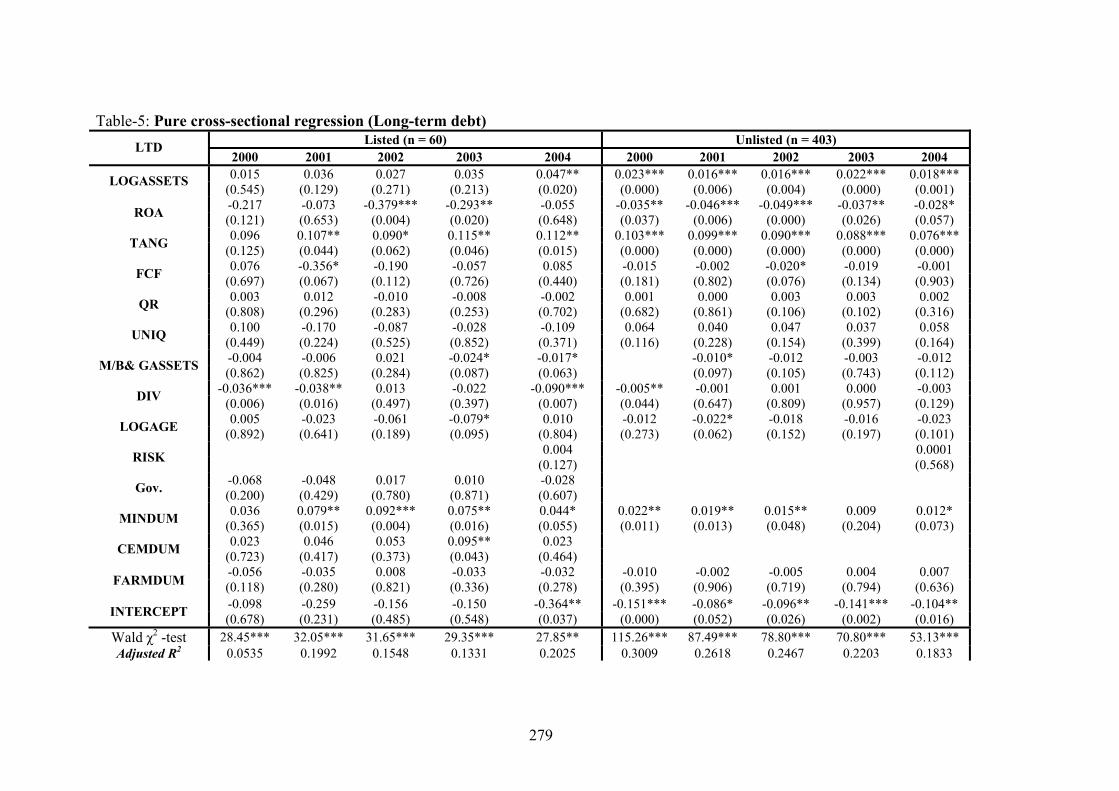
279
Table-5: Pure cross-sectional regression (Long-term debt) Listed (n = 60) Unlisted (n = 403) LTD
2000 2001 2002 2003 2004 2000 2001 2002 2003 2004 0.015 0.036 0.027 0.035 0.047** 0.023*** 0.016*** 0.016*** 0.022*** 0.018*** LOGASSETS (0.545) (0.129) (0.271) (0.213) (0.020) (0.000) (0.006) (0.004) (0.000) (0.001) -0.217 -0.073 -0.379*** -0.293** -0.055 -0.035** -0.046*** -0.049*** -0.037** -0.028* ROA (0.121) (0.653) (0.004) (0.020) (0.648) (0.037) (0.006) (0.000) (0.026) (0.057) 0.096 0.107** 0.090* 0.115** 0.112** 0.103*** 0.099*** 0.090*** 0.088*** 0.076*** TANG (0.125) (0.044) (0.062) (0.046) (0.015) (0.000) (0.000) (0.000) (0.000) (0.000) 0.076 -0.356* -0.190 -0.057 0.085 -0.015 -0.002 -0.020* -0.019 -0.001 FCF (0.697) (0.067) (0.112) (0.726) (0.440) (0.181) (0.802) (0.076) (0.134) (0.903) 0.003 0.012 -0.010 -0.008 -0.002 0.001 0.000 0.003 0.003 0.002 QR (0.808) (0.296) (0.283) (0.253) (0.702) (0.682) (0.861) (0.106) (0.102) (0.316) 0.100 -0.170 -0.087 -0.028 -0.109 0.064 0.040 0.047 0.037 0.058 UNIQ (0.449) (0.224) (0.525) (0.852) (0.371) (0.116) (0.228) (0.154) (0.399) (0.164) -0.004 -0.006 0.021 -0.024* -0.017* -0.010* -0.012 -0.003 -0.012 M/B& GASSETS (0.862) (0.825) (0.284) (0.087) (0.063) (0.097) (0.105) (0.743) (0.112)
-0.036*** -0.038** 0.013 -0.022 -0.090*** -0.005** -0.001 0.001 0.000 -0.003 DIV (0.006) (0.016) (0.497) (0.397) (0.007) (0.044) (0.647) (0.809) (0.957) (0.129) 0.005 -0.023 -0.061 -0.079* 0.010 -0.012 -0.022* -0.018 -0.016 -0.023 LOGAGE (0.892) (0.641) (0.189) (0.095) (0.804) (0.273) (0.062) (0.152) (0.197) (0.101)
0.004 0.0001 RISK (0.127) (0.568) -0.068 -0.048 0.017 0.010 -0.028 Gov. (0.200) (0.429) (0.780) (0.871) (0.607) 0.036 0.079** 0.092*** 0.075** 0.044* 0.022** 0.019** 0.015** 0.009 0.012* MINDUM (0.365) (0.015) (0.004) (0.016) (0.055) (0.011) (0.013) (0.048) (0.204) (0.073) 0.023 0.046 0.053 0.095** 0.023 CEMDUM (0.723) (0.417) (0.373) (0.043) (0.464) -0.056 -0.035 0.008 -0.033 -0.032 -0.010 -0.002 -0.005 0.004 0.007 FARMDUM (0.118) (0.280) (0.821) (0.336) (0.278) (0.395) (0.906) (0.719) (0.794) (0.636) -0.098 -0.259 -0.156 -0.150 -0.364** -0.151*** -0.086* -0.096** -0.141*** -0.104** INTERCEPT (0.678) (0.231) (0.485) (0.548) (0.037) (0.000) (0.052) (0.026) (0.002) (0.016)
Wald χ2 -test 28.45*** 32.05*** 31.65*** 29.35*** 27.85** 115.26*** 87.49*** 78.80*** 70.80*** 53.13*** Adjusted R2 0.0535 0.1992 0.1548 0.1331 0.2025 0.3009 0.2618 0.2467 0.2203 0.1833

280
Table-6: Pure cross-sectional regression (Total debt) Listed (n = 60) Unlisted (n = 403) TD
2000 2001 2002 2003 2004 2000 2001 2002 2003 2004 0.038 0.077** 0.039 0.044 0.072*** 0.099*** 0.093*** 0.099*** 0.087*** 0.078*** LOGASSETS (0.244) (0.013) (0.260) (0.225) (0.005) (0.000) (0.000) (0.000) (0.000) (0.000) -0.150 0.309 -0.148 -0.220 0.237 -0.102** -0.092 -0.096* -0.165*** -0.131** ROA (0.462) (0.164) (0.458) (0.273) (0.144) (0.050) (0.128) (0.076) (0.006) (0.021) 0.059 0.156** 0.071 0.087 0.123** 0.055 0.058 0.052 0.025 -0.018 TANG1 (0.511) (0.036) (0.361) (0.308) (0.047) (0.260) (0.246) (0.295) (0.621) (0.725) -0.047 -0.576** -0.611*** -0.392* -0.168 -0.082* -0.164*** -0.140*** -0.173*** -0.181*** FCF (0.880) (0.017) (0.006) (0.077) (0.348) (0.068) (0.000) (0.004) (0.001) (0.000) -0.022 0.011 -0.024** -0.006 -0.013* -0.032*** -0.031*** -0.026*** -0.024*** -0.025*** QR (0.151) (0.485) (0.045) (0.764) (0.056) (0.000) (0.000) (0.000) (0.000) (0.000) 0.222 -0.242 -0.108 -0.159 -0.185 0.067 0.071 0.060 0.063 0.171 UNIQ (0.254) (0.198) (0.635) (0.434) (0.276) (0.559) (0.573) (0.552) (0.622) (0.248) 0.031 -0.011 0.027 -0.007 -0.029** -0.046* -0.097*** -0.086*** -0.055* M/B (0.358) (0.700) (0.390) (0.749) (0.021) (0.084) (0.002) (0.009) (0.095)
-0.036* -0.065*** -0.005 -0.023 -0.127*** -0.009 -0.003 0.001 -0.010 -0.004 DIV (0.082) (0.002) (0.832) (0.621) (0.003) (0.346) (0.783) (0.904) (0.158) (0.662) -0.082 -0.062 -0.105 -0.148** -0.026 0.049 0.038 0.037 0.091* 0.067 LOGAGE (0.223) (0.386) (0.135) (0.050) (0.685) (0.160) (0.362) (0.399) (0.078) (0.274)
0.004 0.0001 RISK (0.251) (0.107) -0.151** -0.193** -0.045 -0.051 -0.107 Gov. (0.043) (0.011) (0.565) (0.527) (0.113)
0.058 0.122*** 0.146*** 0.145*** 0.063** 0.041* 0.031 0.005 0.007 0.006 MINDUM (0.239) (0.002) (0.002) (0.002) (0.025) (0.082) (0.160) (0.827) (0.766) (0.791) 0.026 0.035 0.113 0.111 0.076** CEMDUM (0.723) (0.556) (0.178) (0.165) (0.048) -0.066 -0.064 0.017 -0.009 -0.038 -0.093** -0.056 -0.051 -0.034 -0.028 FARMDUM (0.195) (0.119) (0.710) (0.833) (0.373) (0.011) (0.322) (0.321) (0.585) (0.681) -0.133 -0.535* -0.146 -0.118 -0.460** -0.565*** -0.512*** -0.559*** -0.501*** -0.418*** INTERCEPT (0.678) (0.067) (0.648) (0.740) (0.045) (0.000) (0.000) (0.000) (0.000) (0.005)
Wald χ2 -test 33.68*** 66.58*** 39.97*** 36.76*** 44.87*** 168.27*** 175.13*** 163.75*** 165.85*** 165.16*** Adjusted R2 0.0829 0.3255 0.1839 0.1961 0.3411 0.2586 0.2432 0.2194 0.2147 0.1820

281
Appendix 5: Note: shaded cells represent the changes observed in the relationship when alternative proxy entered to the basic model while italic bold cells represent the alternative proxy position in the model.
Table-7: Alternative proxies (short-term debt) Listed sample
Listed STD Basic LOG-Sales ROS T. Asset & Invent. CR UNIQ-
DUM Growth (Sales)
Growth (Assets)
DIV- DUM Age
-0.047 0.029*** -0.048 -0.046 -0.047 -0.047 -0.049 -0.080 -0.048 -0.053 SIZE (0.469) (0.009) (0.451) (0.470) (0.465) (0.472) (0.468) (0.326) (0.452) (0.391) -0.006 -0.044 0.006 -0.006 -0.009 -0.010 -0.002 -0.010 -0.008 0.005 ROA (0.939) (0.571) (0.406) (0.937) (0.910) (0.899) (0.982) (0.893) (0.912) (0.947) 0.004 0.004 0.005 0.010 0.001 -0.003 0.001 0.026 -0.001 0.015 TANG (0.935) (0.924) (0.918) (0.811) (0.980) (0.956) (0.984) (0.597) (0.983) (0.748)
-0.130*** -0.111*** -0.133*** -0.130*** -0.131*** -0.129*** -0.129*** -0.111*** -0.129*** -0.133*** FCF (0.003) (0.002) (0.004) (0.004) (0.003) (0.003) (0.003) (0.001) (0.003) (0.002) -0.007* -0.006 -0.007* -0.006 -0.005* -0.007* -0.006* -0.007** -0.007* -0.006* QR (0.079) (0.201) (0.071) (0.103) (0.096) (0.073) (0.100) (0.029) (0.052) (0.075) -0.016 -0.009 -0.008 -0.020 -0.003 0.013 -0.009 -0.002 -0.015 -0.016 UNIQ (0.844) (0.915) (0.920) (0.805) (0.968) (0.181) (0.907) (0.979) (0.861) (0.836) 0.003 0.001 0.003 0.003 0.003 0.003 0.007 0.065 0.004 -0.002 M/B (0.449) (0.763) (0.432) (0.448) (0.406) (0.435) (0.500) (0.183) (0.364) (0.622) -0.001 0.0003 -0.001 -0.001 -0.000 -0.001 -0.001 -0.000 -0.008 -0.001 DIV (0.818) (0.929) (0.846) (0.812) (0.944) (0.846) (0.879) (0.947) (0.337) (0.913) -0.126 -0.180** -0.123 -0.125 -0.125 -0.137 -0.103 -0.113 -0.123 0.000 LOGAGE (0.185) (0.017) (0.205) (0.187) (0.187) (0.156) (0.244) (0.169) (0.202) (0.979) 0.636 0.054 0.641 0.628 0.644 0.643 0.628 0.906 0.655 0.534 INTERCEPT (0.216) (0.658) (0.201) (0.216) (0.212) (0.213) (0.233) (0.170) (0.203) (0.308)
F -test 3.98*** 4.58*** 4.00*** 3.97*** 3.94*** 4.02*** 3.92*** 4.26*** 4.01*** 3.67*** R2 within 0.1448 0.1443 0.1497 0.1487 0.1522 0.1513 0.1490 0.1717 0.1525 0.1329
R2 between 0.0313 0.1323 0.0302 0.0333 0.0285 0.0451 0.0277 0.0132 0.0321 0.0030 R2 overall 0.0389 0.1302 0.0380 0.0410 0.0363 0.0520 0.0359 0.0196 0.0395 0.0091
Corr (ui, x) -0.4221 -0.2637 -0.4213 -0.4133 -0.4353 -0.4190 -0.4064 -0.5808 -0.4438 -0.3878 N 300 300 300 300 300 300 300 300 300 300

282
Table-8: Alternative proxies (long-term debt) Listed sample
Listed LTD Basic LOG-Sales ROS T. Asset & Invent. CR UNIQ-
DUM Growth (Sales)
Growth (Assets)
DIV- DUM Age
0.050* 0.025 0.061** 0.049* 0.051* 0.054** 0.034 0.037 0.051* 0.052* SIZE (0.058) (0.149) (0.031) (0.059) (0.053) (0.040) (0.151) (0.240) (0.055) (0.052) -0.189** -0.242*** -0.028** -0.187** -0.191** -0.217*** -0.271*** -0.237*** -0.187** -0.193** ROA (0.013) (0.005) (0.018) (0.013) (0.014) (0.003) (0.000) (0.001) (0.014) (0.012) 0.104** 0.088* 0.096** 0.094** 0.110** 0.096** 0.096** 0.109** 0.103** 0.101** TANG (0.018) (0.068) (0.030) (0.015) (0.011) (0.030) (0.035) (0.024) (0.023) (0.022) -0.011 -0.020 -0.030 -0.012 -0.010 -0.014 -0.009 -0.008 -0.012 -0.010 FCF (0.776) (0.603) (0.400) (0.749) (0.799) (0.714) (0.812) (0.831) (0.759) (0.782) -0.001 -0.001 -0.001 -0.000 0.000 -0.001 -0.001 -0.001 -0.001 -0.001 QR (0.820) (0.636) (0.813) (0.875) (0.847) (0.701) (0.709) (0.600) (0.810) (0.794) 0.213* 0.239** 0.190* 0.211* 0.210* 0.061** 0.238** 0.219** 0.216** 0.213* UNIQ (0.052) (0.036) (0.075) (0.059) (0.054) (0.019) (0.029) (0.046) (0.050) (0.057) -0.007 -0.006 -0.012*** -0.007 -0.008 -0.007 0.022** 0.015 -0.007 -0.006 M/B (0.126) (0.186) (0.008) (0.131) (0.113) (0.133) (0.025) (0.667) (0.119) (0.287) -0.003 -0.003 -0.002 -0.003 -0.003 -0.003 -0.003 -0.003 -0.001 -0.003 DIV (0.448) (0.417) (0.512) (0.479) (0.433) (0.451) (0.393) (0.369) (0.921) (0.422) 0.032 0.031 0.038 0.022 0.035 -0.022 -0.041 -0.036 0.034 -0.000 LOGAGE (0.626) (0.626) (0.559) (0.746) (0.599) (0.745) (0.442) (0.513) (0.610) (0.888)
-0.456* -0.206 -0.558** -0.434* -0.473* -0.445* -0.219 -0.262 -0.464* -0.429* INTERCEPT (0.064) (0.205) (0.031) (0.073) (0.056) (0.065) (0.319) (0.369) (0.057) (0.070) F -test 4.04*** 4.34*** 3.92*** 4.24*** 4.04*** 4.98*** 4.22*** 3.86*** 4.04*** 3.99***
R2 within 0.2023 0.1915 0.1966 0.2013 0.2022 0.2447 0.2111 0.1926 0.2013 0.2015 R2 between 0.0729 0.0637 0.0684 0.0918 0.0713 0.0558 0.0903 0.0856 0.0689 0.0854 R2 overall 0.0852 0.0787 0.0796 0.1039 0.0833 0.0717 0.1046 0.0975 0.0814 0.0972
Corr (ui, x) -0.2442 -0.1422 -0.2787 -0.1756 -0.2615 -0.3158 -0.1457 -0.1697 -0.2504 -0.2145 N 300 300 300 300 300 300 300 300 300 300
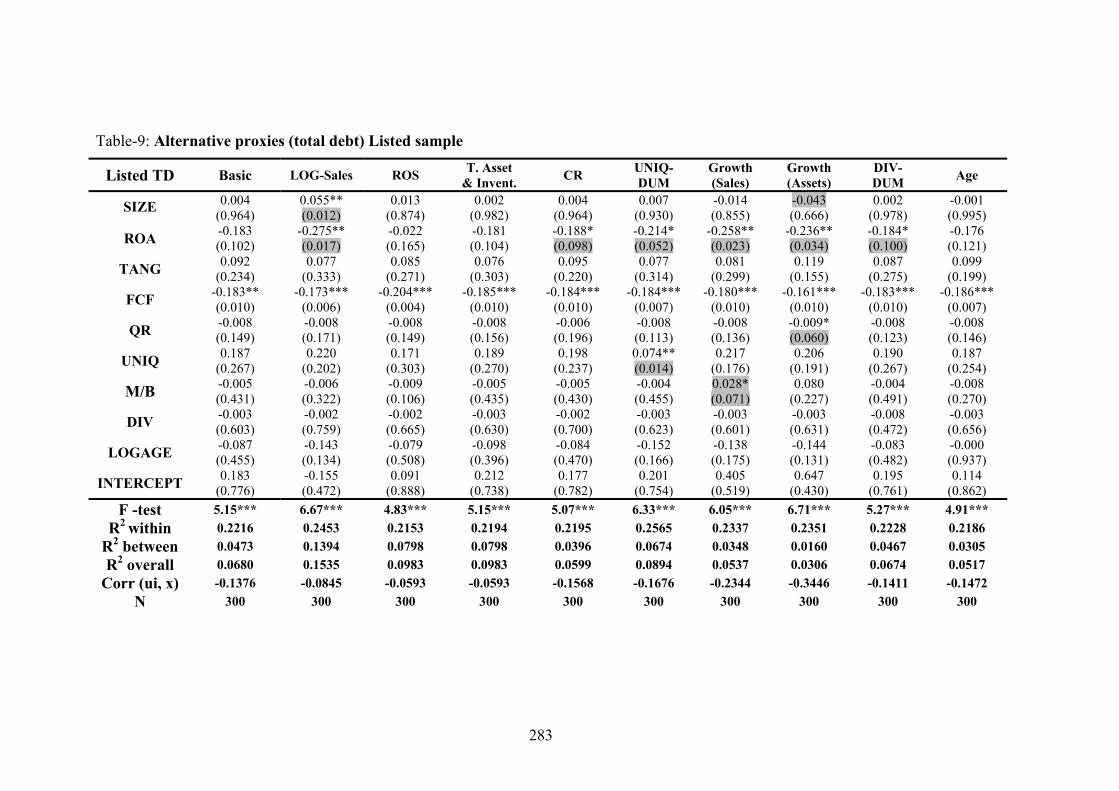
283
Table-9: Alternative proxies (total debt) Listed sample
Listed TD Basic LOG-Sales ROS T. Asset & Invent. CR UNIQ-
DUM Growth (Sales)
Growth (Assets)
DIV- DUM Age
0.004 0.055** 0.013 0.002 0.004 0.007 -0.014 -0.043 0.002 -0.001 SIZE (0.964) (0.012) (0.874) (0.982) (0.964) (0.930) (0.855) (0.666) (0.978) (0.995) -0.183 -0.275** -0.022 -0.181 -0.188* -0.214* -0.258** -0.236** -0.184* -0.176 ROA (0.102) (0.017) (0.165) (0.104) (0.098) (0.052) (0.023) (0.034) (0.100) (0.121) 0.092 0.077 0.085 0.076 0.095 0.077 0.081 0.119 0.087 0.099 TANG (0.234) (0.333) (0.271) (0.303) (0.220) (0.314) (0.299) (0.155) (0.275) (0.199)
-0.183** -0.173*** -0.204*** -0.185*** -0.184*** -0.184*** -0.180*** -0.161*** -0.183*** -0.186*** FCF (0.010) (0.006) (0.004) (0.010) (0.010) (0.007) (0.010) (0.010) (0.010) (0.007) -0.008 -0.008 -0.008 -0.008 -0.006 -0.008 -0.008 -0.009* -0.008 -0.008 QR (0.149) (0.171) (0.149) (0.156) (0.196) (0.113) (0.136) (0.060) (0.123) (0.146) 0.187 0.220 0.171 0.189 0.198 0.074** 0.217 0.206 0.190 0.187 UNIQ (0.267) (0.202) (0.303) (0.270) (0.237) (0.014) (0.176) (0.191) (0.267) (0.254) -0.005 -0.006 -0.009 -0.005 -0.005 -0.004 0.028* 0.080 -0.004 -0.008 M/B (0.431) (0.322) (0.106) (0.435) (0.430) (0.455) (0.071) (0.227) (0.491) (0.270) -0.003 -0.002 -0.002 -0.003 -0.002 -0.003 -0.003 -0.003 -0.008 -0.003 DIV (0.603) (0.759) (0.665) (0.630) (0.700) (0.623) (0.601) (0.631) (0.472) (0.656) -0.087 -0.143 -0.079 -0.098 -0.084 -0.152 -0.138 -0.144 -0.083 -0.000 LOGAGE (0.455) (0.134) (0.508) (0.396) (0.470) (0.166) (0.175) (0.131) (0.482) (0.937) 0.183 -0.155 0.091 0.212 0.177 0.201 0.405 0.647 0.195 0.114 INTERCEPT (0.776) (0.472) (0.888) (0.738) (0.782) (0.754) (0.519) (0.430) (0.761) (0.862)
F -test 5.15*** 6.67*** 4.83*** 5.15*** 5.07*** 6.33*** 6.05*** 6.71*** 5.27*** 4.91*** R2 within 0.2216 0.2453 0.2153 0.2194 0.2195 0.2565 0.2337 0.2351 0.2228 0.2186
R2 between 0.0473 0.1394 0.0798 0.0798 0.0396 0.0674 0.0348 0.0160 0.0467 0.0305 R2 overall 0.0680 0.1535 0.0983 0.0983 0.0599 0.0894 0.0537 0.0306 0.0674 0.0517
Corr (ui, x) -0.1376 -0.0845 -0.0593 -0.0593 -0.1568 -0.1676 -0.2344 -0.3446 -0.1411 -0.1472 N 300 300 300 300 300 300 300 300 300 300

284
Table-10: Alternative proxies (short-term debt) Unlisted sample
Unlisted STD Basic LOG-Sales ROS T. Asset
& Invent. CR UNIQ- DUM
Growth (Sales)
DIV- DUM Age
0.066*** 0.040** 0.067*** .067*** 0.061*** 0.066*** 0.052*** 0.065*** 0.071*** SIZE (0.003) (0.022) (0.003) (0.003) (0.006) (0.003) (0.008) (0.003) (0.001) -0.082*** -0.126*** -0.015 -0.081*** -0.074*** -0.082*** -0.065** -0.083*** -0.082*** ROA (0.003) (0.000) (0.593) (0.003) (0.008) (0.003) (0.027) (0.003) (0.003)
-0.030 -0.036 -0.033 -0.014 -0.039 -0.032 -0.025 -0.030 -0.032 TANG (0.426) (0.324) (0.389) (0.674) (0.320) (0.412) (0.510) (0.435) (0.400) -0.110*** -0.109*** -0.118*** -0.109*** -0.111*** -0.109*** -0.103*** -0.109*** -0.107*** FCF (0.000) (0.000) (0.000) (0.000) (0.000) (0.000) (0.000) (0.000) (0.000) -0.020*** -0.020*** -0.022*** -0.020*** -0.020*** -0.020*** -0.020*** -0.020*** -0.020*** QR (0.000) (0.000) (0.000) (0.000) (0.000) (0.000) (0.000) (0.000) (0.000)
-0.053 -0.011 -0.055 -0.055 -0.052 -0.009 -0.061 -0.056 -0.048 UNIQ (0.572) (0.902) (0.557) (0.562) (0.581) (0.609) (0.522) (0.550) (0.611) -0.025** -0.016 -0.024** -0.025** -0.027** -0.025** -0.012 -0.026** -0.026** G. Assets (0.023) (0.121) (0.026) (0.025) (0.016) (0.025) (0.127) (0.018) (0.018)
0.003 0.003 0.004 0.003 0.004 0.003 0.004 0.001 0.004* DIV (0.125) (0.123) (0.108) (0.125) (0.112) (0.120) (0.112) (0.839) (0.096) 0.095*** 0.098*** 0.087** 0.096*** 0.094*** 0.096*** 0.099*** 0.097*** 0.003** LOGAGE (0.006) (0.005) (0.013) (0.006) (0.006) (0.005) (0.003) (0.005) (0.022) -0.401** -0.200* -0.416** -0.418** -0.358** -0.405** -0.311** -0.401** -0.379** INTERCEPT (0.013) (0.093) (0.011) (0.011) (0.026) (0.011) (0.032) (0.013) (0.018)
F -test 13.87*** 13.57*** 12.30*** 13.64*** 13.47*** 13.87*** 13.71*** 13.77*** 13.02*** R2 within 0.1218 0.1211 0.1155 0.1214 0.1294 0.1217 0.1198 0.1207 0.1200
R2 between 0.1838 0.1817 0.1890 0.1775 0.2010 0.1856 0.1844 0.1836 0.1877 R2 overall 0.1722 0.1699 0.1752 0.1670 0.1876 0.1737 0.1721 0.1719 0.1750
Corr (ui, x) -0.0104 0.0601 0.0269 -0.0274 0.0127 -0.0064 0.0439 -0.0118 -0.0118 N 2015 2015 2015 2015 2015 2015 2015 2015 2015

285
Table-11: Alternative proxies (long-term debt) Unlisted sample
Basic LOG-Sales ROS T. Asset & Invent. CR UNIQ-
DUM Growth (Sales)
DIV- DUM Age
0.024*** 0.008*** 0.025*** 0.022*** 0.025*** 0.024*** 0.020*** 0.024*** 0.024*** SIZE (0.000) (0.002) (0.000) (0.000) (0.000) (0.000) (0.000) (0.000) (0.000) -0.014* -0.024*** 0.000 -0.016** -0.015* -0.015* -0.014* -0.014* -0.014* ROA (0.072) (0.005) (0.957) (0.048) (0.052) (0.068) (0.095) (0.071) (0.082)
0.048*** 0.043** 0.048*** 0.029** 0.049*** 0.048*** 0.049*** 0.048*** 0.048*** TANG (0.007) (0.011) (0.008) (0.014) (0.006) (0.007) (0.006) (0.007) (0.007) -0.002 -0.002 -0.004 -0.002 -0.002 -0.002 -0.001 -0.002 -0.003 FCF (0.415) (0.531) (0.164) (0.394) (0.466) (0.406) (0.826) (0.456) (0.212) 0.001 0.001 0.001 0.001 0.001 0.001 0.001 0.001 0.001 QR (0.292) (0.428) (0.468) (0.323) (0.181) (0.293) (0.276) (0.272) (0.286) 0.007 0.017 0.006 0.008 0.007 0.003 0.008 0.006 0.006 UNIQ (0.830) (0.584) (0.847) (0.795) (0.824) (0.564) (0.790) (0.844) (0.844)
-0.005** -0.000 -0.005** -0.005** -0.005** -0.005** 0.000 -0.005** -0.005** G. Assets (0.034) (0.903) (0.034) (0.049) (0.039) (0.031) (0.994) (0.025) (0.034) 0.001 0.001 0.001 0.001 0.001 0.001 0.001 -0.001 0.001 DIV (0.270) (0.268) (0.246) (0.286) (0.282) (0.275) (0.199) (0.781) (0.308)
-0.044*** -0.037*** -0.045*** -0.047*** -0.044*** -0.045*** -0.043*** -0.043*** -0.002*** LOGAGE (0.000) (0.001) (0.000) (0.000) (0.000) (0.000) (0.000) (0.000) (0.000) -0.118*** -0.002 -0.121*** -0.101*** -0.124*** -0.116*** -0.090** -0.119*** -0.137*** INTERCEPT (0.005) (0.992) (0.004) (0.006) (0.003) (0.006) (0.031) (0.004) (0.001)
F -test 3.33*** 2.91*** 3.24*** 3.68*** 3.43*** 3.44*** 3.03*** 3.17*** 4.15*** R2 within 0.0278 0.0208 0.0261 0.0223 0.0286 0.0280 0.0265 0.0275 0.0310
R2 between 0.2315 0.2036 0.2214 0.1800 0.2354 0.2323 0.2379 0.2361 0.2015 R2 overall 0.1949 0.1683 0.1863 0.1516 0.1983 0.1957 0.1995 0.1986 0.1712
Corr (ui, x) 0.1217 0.2258 0.1267 0.1203 0.1231 0.1243 0.1669 0.1326 0.0515 N 2015 2015 2015 2015 2015 2015 2015 2015 2015
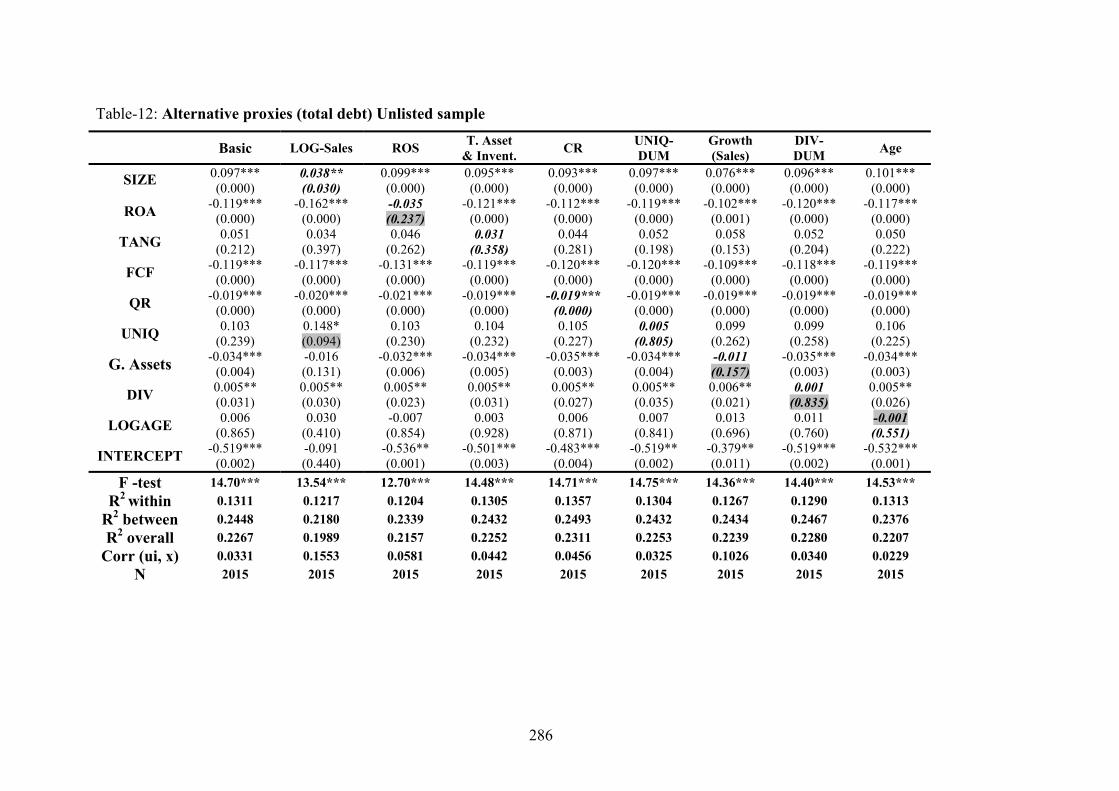
286
Table-12: Alternative proxies (total debt) Unlisted sample
Basic LOG-Sales ROS T. Asset & Invent. CR UNIQ-
DUM Growth (Sales)
DIV- DUM Age
0.097*** 0.038** 0.099*** 0.095*** 0.093*** 0.097*** 0.076*** 0.096*** 0.101*** SIZE (0.000) (0.030) (0.000) (0.000) (0.000) (0.000) (0.000) (0.000) (0.000) -0.119*** -0.162*** -0.035 -0.121*** -0.112*** -0.119*** -0.102*** -0.120*** -0.117*** ROA (0.000) (0.000) (0.237) (0.000) (0.000) (0.000) (0.001) (0.000) (0.000)
0.051 0.034 0.046 0.031 0.044 0.052 0.058 0.052 0.050 TANG (0.212) (0.397) (0.262) (0.358) (0.281) (0.198) (0.153) (0.204) (0.222) -0.119*** -0.117*** -0.131*** -0.119*** -0.120*** -0.120*** -0.109*** -0.118*** -0.119*** FCF (0.000) (0.000) (0.000) (0.000) (0.000) (0.000) (0.000) (0.000) (0.000) -0.019*** -0.020*** -0.021*** -0.019*** -0.019*** -0.019*** -0.019*** -0.019*** -0.019*** QR (0.000) (0.000) (0.000) (0.000) (0.000) (0.000) (0.000) (0.000) (0.000)
0.103 0.148* 0.103 0.104 0.105 0.005 0.099 0.099 0.106 UNIQ (0.239) (0.094) (0.230) (0.232) (0.227) (0.805) (0.262) (0.258) (0.225) -0.034*** -0.016 -0.032*** -0.034*** -0.035*** -0.034*** -0.011 -0.035*** -0.034*** G. Assets (0.004) (0.131) (0.006) (0.005) (0.003) (0.004) (0.157) (0.003) (0.003) 0.005** 0.005** 0.005** 0.005** 0.005** 0.005** 0.006** 0.001 0.005** DIV (0.031) (0.030) (0.023) (0.031) (0.027) (0.035) (0.021) (0.835) (0.026) 0.006 0.030 -0.007 0.003 0.006 0.007 0.013 0.011 -0.001 LOGAGE (0.865) (0.410) (0.854) (0.928) (0.871) (0.841) (0.696) (0.760) (0.551)
-0.519*** -0.091 -0.536** -0.501*** -0.483*** -0.519** -0.379** -0.519*** -0.532*** INTERCEPT (0.002) (0.440) (0.001) (0.003) (0.004) (0.002) (0.011) (0.002) (0.001) F -test 14.70*** 13.54*** 12.70*** 14.48*** 14.71*** 14.75*** 14.36*** 14.40*** 14.53***
R2 within 0.1311 0.1217 0.1204 0.1305 0.1357 0.1304 0.1267 0.1290 0.1313 R2 between 0.2448 0.2180 0.2339 0.2432 0.2493 0.2432 0.2434 0.2467 0.2376 R2 overall 0.2267 0.1989 0.2157 0.2252 0.2311 0.2253 0.2239 0.2280 0.2207
Corr (ui, x) 0.0331 0.1553 0.0581 0.0442 0.0456 0.0325 0.1026 0.0340 0.0229 N 2015 2015 2015 2015 2015 2015 2015 2015 2015

287
Appendix 6
Table-13: Estimation robustness (Listed and Unlisted samples)
Listed (n =300) Unlisted (n =2015) STD LTD TD STD LTD TD
OLS Newey OLS Newey OLS Newey OLS Newey OLS Newey OLS Newey 0.016 0.016 0.033*** 0.033** 0.050*** 0.050** 0.059*** 0.059*** 0.019*** 0.019*** 0.091*** 0.091*** LOGASSETS
(0.111) (0.182) (0.004) (0.023) (0.002) (0.012) (0.000) (0.000) (0.000) (0.000) (0.000) (0.000) 0.224*** 0.224*** -0.227*** -0.227*** 0.003 0.003 -0.046** -0.046** -0.040*** -0.040*** -0.117*** -0.117*** ROA (0.000) (0.001) (0.000) (0.002) (0.967) (0.971) (0.038) (0.038) (0.000) (0.000) (0.000) (0.000)
0.001 0.001 0.086*** 0.086*** 0.086** 0.086* -0.115*** -0.115*** 0.092*** 0.092*** 0.035 0.035 TANG1 (0.938) (0.951) (0.000) (0.005) (0.013) (0.057) (0.000) (0.000) (0.000) (0.000) (0.114) (0.114) -0.248*** -0.248*** -0.054 -0.054 -0.339*** -0.339*** -0.124*** -0.124*** -0.011** -0.011** -0.144*** -0.144*** FCF (0.002) (0.004) (0.462) (0.477) (0.003) (0.005) (0.000) (0.000) (0.021) (0.021) (0.000) (0.000) -0.010** -0.010** -0.005 -0.005 -0.016*** -0.016*** -0.032*** -0.032*** 0.002* 0.002* -0.028*** -0.028*** QR (0.024) (0.037) (0.132) (0.166) (0.005) (0.008) (0.000) (0.000) (0.051) (0.051) (0.000) (0.000) -0.014 -0.014 -0.027 -0.027 -0.055 -0.055 0.001 0.001 0.049*** 0.049*** 0.077 0.077 UNIQ (0.806) (0.839) (0.669) (0.725) (0.541) (0.618) (0.991) (0.991) (0.005) (0.005) (0.163) (0.163) -0.003 -0.003 -0.006 -0.006 -0.008 -0.008 M/B (0.414) (0.446) (0.169) (0.230) (0.204) (0.244)
-0.044*** -0.044*** -0.011*** -0.011*** -0.067*** -0.067*** G Assets (0.001) (0.001) (0.004) (0.004) (0.000) (0.000) -0.009 -0.009 -0.024** -0.024** -0.034** -0.034** -0.002 -0.002 -0.002 -0.002 -0.005 -0.005 DIVID (0.184) (0.221) (0.019) (0.028) (0.015) (0.023) (0.613) (0.638) (0.238) (0.242) (0.229) (0.260)
-0.048** -0.048* -0.026 -0.026 -0.074** -0.074* 0.081*** 0.081*** -0.020*** -0.020*** 0.054*** 0.054** LOGAGE (0.038) (0.095) (0.240) (0.355) (0.024) (0.074) (0.000) (0.000) (0.000) (0.004) (0.005) (0.028) -0.001 -0.001 0.003 0.003 0.002 0.002 0.0001** 0.0001** 0.0001 0.0001 0.0001* 0.0001* RISK (0.763) (0.763) (0.293) (0.284) (0.657) (0.664) (0.040) (0.041) (0.572) (0.573) (0.084) (0.085)
-0.085*** -0.085*** -0.020 -0.020 -0.103*** -0.103** GOV (0.000) (0.002) (0.456) (0.560) (0.005) (0.026) 0.040*** 0.040*** 0.067*** 0.067*** 0.109*** 0.109*** 0.005 0.005 0.016*** 0.016*** 0.019* 0.019 MINDUM (0.000) (0.004) (0.000) (0.000) (0.000) (0.000) (0.541) (0.636) (0.000) (0.000) (0.068) (0.158) 0.032** 0.032** 0.044** 0.044* 0.081*** 0.081** CEMEDUM (0.016) (0.044) (0.043) (0.098) (0.003) (0.015) -0.008 -0.008 -0.016 -0.016 -0.023 -0.023 -0.028 -0.028 -0.001 -0.001 -0.051** -0.051 FARMDUM (0.444) (0.523) (0.276) (0.382) (0.243) (0.343) (0.223) (0.356) (0.908) (0.929) (0.041) (0.122) -0.030 -0.030 -0.222** -0.222* -0.249* -0.249 -0.309*** -0.309*** -0.114*** -0.114*** -0.511*** -0.511*** INTERCIPT (0.751) (0.795) (0.030) (0.089) (0.084) (0.171) (0.000) (0.000) (0.000) (0.000) (0.000) (0.000)
F test 7.98*** 4.96*** 6.59*** 4.30*** 10.42*** 6.57*** 51.81*** 32.83*** 31.26*** 19.18*** 66.69*** 41.79*** Adjusted R2 0.2589 0. 2589 0.2395 0.2395 0.3094 0.3094 0.1878 0.1878 0.2565 0.2565 0.2330 0.2330

288
Appendix 7
Table-14: Pair-wise correlation for listed sample
Log Sales
Log Assets ROA ROS TANG1
(Fixed) TANG2 (F&Inv) FCF CR QR UNIQ UNIQ
DUM M/B G. Sales
G. Assets
DIV
DIV- DUM
AGE
LOG- AGE
RISK
GOV
MIN- DUM
FAR- DUM
CEM- DUM
Log sales 1
Log Assets 0.84*** 1
ROA 0.50*** 0.22*** 1
ROS 0.19** 0.22*** 0.43*** 1
TANG1 0.09 0.22*** -0.06 0.05 1
TANG2 0.19*** 0.21*** 0.08 0.04 0.92*** 1
FCF 0.27*** 0.17*** 0.43*** 0.24*** -0.02 0.00 1
CR 0.02 -0.04 0.14** 0.07 -0.15** -0.11** 0.21*** 1
QR -0.02 -0.05 0.09 0.07 -0.15** -0.23*** 0.19*** 0.91*** 1
UNIQ -0.09 -0.15** 0.11* -0.15** -0.07 -0.01 -0.26*** 0.03 -0.02 1
UNIQDUM 0.25*** 0.07 0.21*** -0.08 0.03 0.10* 0.00 0.16*** 0.12** 0.44*** 1
M/B 0.29*** 0.23*** 0.46*** 0.20*** -0.00 -0.01 0.47*** 0.27*** 0.27*** -0.28*** 0.05 1
G. Sales 0.25*** 0.18*** 0.18*** 0.20*** -0.03 -0.01 0.07 0.01 0.00 -0.04 0.13** 0.18*** 1
G. Assets 0.08 0.13** 0.08 0.12** -0.27*** -0.28*** -0.15** 0.05 0.11* -0.04 -0.00 0.19*** 0.32*** 1
DIV 0.26*** 0.21*** 0.27*** 0.18*** -0.03 0.03 0.29*** 0.07 -0.01 -0.09 0.05 0.16** -0.03 -0.05 1 DIV
DUM 0.38*** 0.36*** 0.35*** 0.28*** 0.01 0.03 0.38*** 0.07 0.04 -0.10* 0.01 0.34*** 0.12** -0.02 0.62*** 1
AGE 0.24*** 0.25*** 0.17*** 0.23*** 0.06 0.01 0.28*** 0.20*** 0.20*** -0.17*** 0.11** 0.40*** 0.03 0.04 0.18*** 0.35*** 1 LOG- AGE 0.16** 0.18*** 0.02 0.18** 0.07 -0.02 0.17*** 0.17*** 0.19*** -0.12** 0.13** 0.33*** -0.01 0.02 0.10* 0.25*** 0.93*** 1
RISK -0.02 0.02 0.06 -0.04 -0.07 -0.08 -0.05 0.02 0.01 0.16** -0.08 0.06 0.06 0.24*** 0.02 0.03 -0.10* -0.09 1
GOV 0.47*** 0.57*** 0.12** 0.13** 0.32*** 0.24*** 0.13** -0.00 0.01 -0.10* 0.03 0.13** -0.02 -0.07 0.14** 0.27*** 0.16** 0.18*** -0.01 1 MIN- DUM 0.09 0.04 0.11* -0.01 -0.31*** -0.25*** -0.08- -0.16** -0.14** 0.11* -0.03 -0.05 0.10* 0.21**
* -0.09 -0.10* -0.09 -0.10* -0.03 -0.21*** 1
FAR- DUM -0.30*** -0.30*** -0.20*** -0.24*** 0.14** 0.14** -0.14** 0.10* 0.08 0.44*** 0.14** -
0.27*** -0.13** -0.11* -0.15** -0.21*** -0.09 -0.01 -0.04 -0.06 -0.35*** 1
CEM- DUM 0.21*** 0.22*** 0.32*** 0.25*** 0.08 0.09 0.52*** 0.42*** 0.39*** -0.24*** 0.23**
* 0.51*** 0.11* -0.03 0.20*** 0.31*** 0.48*** 0.40*** -0.05 0.14** -0.33*** -0.16*** 1

289
Table-15: Pair-wise correlation for unlisted sample.
Log Sales
Log Assets
ROA ROS TANG (Fixed)
TANG (F&Inv) FCF CR QR UNIQ UNIQ-
DUM G. Sales G. Assets DIV DIV- DUM AGE LOG
AGE RISK MIN- DUM
FAR- DUM
Log Sales 1
Log Assets 0.88*** 1
ROA -0.02 -0.31*** 1
ROS -0.25*** -0.15*** 0.53*** 1
TANG 1 0.03 0.13*** -0.13*** 0.03 1
TANG 2 0.02 0.06** -0.03 0.05** 0.74*** 1
FCF 0.08*** -0.02 0.29*** 0.13*** -0.08*** -0.09*** 1
CR -0.27*** -0.26*** 0.19*** 0.27*** -0.15*** -0.09*** 0.13*** 1
QR -0.26*** -0.24*** 0.17*** 0.25*** -0.19*** -0.33*** 0.15*** 0.92*** 1
UNIQ 0.06*** 0.10*** 0.17*** 0.26*** 0.11*** 0.25*** -0.05** -0.09*** -0.17*** 1
UNIQDUM 0.28*** 0.27*** 0.08*** 0.05** 0.14*** 0.30*** -0.01 -0.07*** -0.18*** 0.63*** 1
G. Sale 0.14*** 0.06** 0.11*** -0.02 0.02 0.00 -0.06** -0.04* -0.04* -0.01 0.04* 1
G. Assets 0.08*** 0.09*** 0.00 0.05** -0.04* -0.06*** -0.26*** -0.07*** -0.05** -0.02 0.04* 0.45*** 1
DIV 0.10*** 0.05** 0.10*** -0.01 -0.09*** -0.07*** 0.18*** 0.08*** 0.09*** -0.10*** -0.03 -0.12*** -0.11*** 1
DIVDUM 0.24*** 0.15*** 0.20*** 0.02 -0.05** -0.04* 0.25*** 0.06** 0.07*** -0.10*** 0.04 -0.07*** -0.05** 0.55*** 1
AGE 0.34*** 0.33*** -0.07*** -0.07*** 0.03 0.06** 0.09*** -0.07*** -0.09*** 0.02 0.14*** -0.05** -0.05** 0.07*** 0.17*** 1
LOGAGE 0.33*** 0.31*** -0.05** -0.06** 0.03 0.06** 0.11*** -0.06*** -0.08*** 0.04* 0.15*** -0.06*** -0.06** 0.08*** 0.17*** 0.95*** 1
RISK -0.02 -0.07*** 0.13*** 0.10*** -0.05** -0.06** 0.06** 0.11*** 0.11*** -0.11*** -0.07*** 0.05** 0.07*** 0.03 0.07*** 0.02 -0.00 1
MIN-DUM 0.08*** 0.13*** -0.04* 0.08*** 0.38*** 0.40*** 0.01 0.01 -0.09*** 0.20*** 0.28*** 0.03 0.02 -0.04* 0.02 0.05** 0.04* -0.01 1
FAR-DUM 0.11*** 0.13*** -0.00 0.01 0.08*** 0.07*** 0.01 -0.03 -0.04* 0.17*** 0.18*** 0.01 -0.01 -0.00 0.02 0.07*** 0.10*** -0.08*** -0.13*** 1

290
Appendix 8
Table-16: DFIT regression results STD, LTD and TD refer to short-term, long-term, and total debt respectively. Size is the log of total assets. ROA refers to the return on assets. TANG is the ratio of fixed assets to total assets. FCF refers to the earnings before interest and tax plus depreciation less capital expenditure normalised by total assets. QR refers to the quick ratio. UNIQ is the ratio of selling & marketing expenses to total sales. M/B refers to the market to book ratio and G.ASSETS is the growth in assets for listed and unlisted companies. DIV refers to dividends paid divided by net income. LOGAGE is the log number of years since firm founded. Note: White’s heteroskedastic-consistent covariance matrix estimation is used to adjust for heteroskedasticity. Probability of (t) are in parentheses for. *, ** and *** denote significant at the 10, 5, and 1% respectively (two tails).
Listed Unlisted Panel
STD LTD TD STD LTD TD
0.039** 0.046* 0.111*** 0.064*** 0.022*** 0.098*** LOGASSETS (0.049) (0.082) (0.009) (0.004) (0.000) (0.000) 0.060 -0.224*** -0.111 -0.071*** -0.015* -0.117***
ROA (0.230) (0.002) (0.216) (0.009) (0.055) (0.000) 0.030 0.112** 0.107 -0.037 0.045** 0.059
TANG1 (0.466) (0.013) (0.116) (0.307) (0.013) (0.149) -0.085** 0.023 -0.103* -0.109*** -0.001 -0.122***
FCF (0.013) (0.386) (0.058) (0.000) (0.691) (0.000)
-0.009*** 0.000 -0.012*** -0.021*** 0.001 -0.020*** QR
(0.000) (0.975) (0.006) (0.000) (0.353) (0.000) 0.049 0.224** 0.343** -0.026 0.009 0.128
UNIQ (0.557) (0.040) (0.048) (0.779) (0.780) (0.134) -0.001 -0.006 -0.007
M/B (0.762) (0.182) (0.160) -0.023** -0.006** -0.034***
G. Assets (0.022) (0.011) (0.003)
0.000 -0.006 -0.001 0.003 0.000 0.005** DIV (0.971) (0.110) (0.866) (0.144) (0.567) (0.027)
-0.141* 0.021 -0.198** 0.089*** -0.050*** 0.000 LOGAGE
(0.013) (0.742) (0.016) (0.009) (0.000) (0.997) -0.119 -0.407* -0.648* -0.385** -0.094** -0.525*** INTERCEPT (0.487) (0.097) (0.088) (0.015) (0.018) (0.002)
F -test 6.71*** 4.02*** 9.88*** 14.01*** 3.32*** 15.20*** R2 within 0.2122 0.2148 0.3231 0.1259 0.0299 0.1412
R2 between 0.0752 0.0788 0.0826 0.1976 0.2167 0.2544 R2 overall 0.0825 0.0943 0.1033 0.1846 0.1809 0.2356
Corr (ui, x) -0.3153 -0.2356 -0.3703 0.0028 0.1125 0.0179 N 295 298 296 2002 1998 2002

291
Appendix 9
Figure -2: Normal Probability Plot for Short-term debt (Listed) 0.
000.
250.
500.
751.
00pr
obab
ility
0.00 0.25 0.50 0.75 1.00Quartile
Listed sampleNormal Probability Plot (NPP) for STD regression's residuals
Figure -3: Normal Probability Plot for Long-term debt (Listed)
0.00
0.25
0.50
0.75
1.00
prob
abili
ty
0.00 0.25 0.50 0.75 1.00Quartile
Listed sampleNormal Probability Plot (NPP) for LTD regression's residuals
Figure -4: Normal Probability Plot for Total debt (Listed)
0.00
0.25
0.50
0.75
1.00
prob
abili
ty
0.00 0.25 0.50 0.75 1.00Quartile
Listed sampleNormal Probability Plot (NPP) for TD regression's residuals

292
Figure -5: Normal Probability Plot for Short-term debt (Unlisted)
0.
000.
250.
500.
751.
00pr
obab
ility
0.00 0.25 0.50 0.75 1.00Quartile
UnlistedNormal Probability Plot (NPP) for STD regression's residuals
Figure -6: Normal Probability Plot for Long-term debt (Unlisted)
0.00
0.25
0.50
0.75
1.00
prob
abilit
y
0.00 0.25 0.50 0.75 1.00Quartile
UnlistedNormal Probability Plot (NPP) for LTD regression's residuals
Figure -7: Normal Probability Plot for Total debt (Unlisted)
0.00
0.25
0.50
0.75
1.00
prob
abili
ty
0.00 0.25 0.50 0.75 1.00Quartile
UnlistedNormal Probability Plot (NPP) for TD regression's residuals