Embed Size (px)
Citation preview
Capital Structure, Firm Performance and the Recent Financial Crisis
Ashrafee Tanvir Hossain Memorial University of Newfoundland
Dao Xuan Nguyen
Memorial University of Newfoundland
We examine the impact of financial leverage on firm performance. By analyzing stock and operating performances of top ten Canadian oil & gas companies for a ten year period (2004-2013), we find that leverage has a strong negative relationship with performance, for all three periods in concern, that is the pre-crisis (2004-2006), crisis (2007-2009), and post-crisis recovery (2010-2013) periods. These results hold both in univariate and cross-sectional set up even after controlling for firm specific variables. INTRODUCTION
One of the most difficult challenges that management faces is the decision on capital structure
(Pouraghajan, et al., 2012). In short, capital structure is a firm’s financing through the combination of equity and debt (Mujahid and Akhtar, 2014). One direct effect of the capital structure decision is that it determines the cost of capital, resulting in changes in a company’s market value. To a larger extent, capital structure also influences other factors, such as company performances and profitability.
In 1958, Modigliani and Miller were one of the first to introduce a general theory of capital structure, known as the M&M propositions. While the original concept offered a fundamental explanation for capital structure, it was also controversial. According to the original Modigliani-Miller theorem, in a perfect market, a firm’ market value is independent of capital structure choices and dividend policies. Subsequent to the original M&M propositions, researchers incorporated market imperfections such as taxes, transaction costs, bankruptcy and agency costs, adverse selection etc., in order to further develop the theory (Mujahid and Sorin, 2009).
In recent years, there has been robust research on the capital structure’s effect on firm financial performance. Research has been made in different disciplines, such as in the financial sector with the banking industry (Skopljak and Luo, 2012), or in the non-financial sector with the iron and steel (Banerjee and De, 2014), the oil and gas (Sabir and Malik, 2012), and the textile industry (Mujahid and Akhtar, 2014). There has also been research that consists of both financial and non-financial firms (Gabrijelcic, et al., 2014). In general, available research evaluates the relationship of capital structure and firm performance by economic crisis periods (Gabrijelcic, et al., 2014), or in general timeframe (Sabir and Malik, 2012).
Based on the agency cost theory, Jiraporn et al. (2011) identifies a negative impact of capital structure on firm performance. Similarly, Sabir and Malik (2012), and Gabrijelcic et al. (2014) also find a negative relationship between capital structure and financial performance. A research by Skopljak and Luo (2012)
76 Journal of Accounting and Finance Vol. 16(1) 2016
shows that different variation in capital structure leads to variation in firm performance. Agnihotri (2014), however, proposes a flexible structure. According to Agnihotri (2014), depending on its competitive strategies and market condition, if a firm can decide an appropriate capital structure, both high and low leverage will result in lower cost of debts, and thus enhancing its performance. Finally, a particular financial ratio can have either the same or different relation with capital structures under different circumstances. For example, in their research, Saeedi and Mahmoodi (2011) discover a negative relation between capital structure and return on assets (ROA), but no significant relationship between capital structure and return on equity (ROE), while Ebrati et al. (2013) find a similar result for ROA but positive relation for ROE.
Canadian economy is increasing its dependence on oil & gas revenue over the past two decades. It is very important to understand the dynamics of oil & gas industry in Canada. As discussed above, we acknowledge the fact that there have been papers that analyze the impact of capital structure on firm performance. However, a specific focused study on oil and gas industry is missing. We believe that it is a very important industry and that this industry acts little differently during the others during crisis period like we encountered in 2007-2009. Therefore, our study will add value by analyzing this specific industry for an oil revenue dependent G7 country like Canada.
In this study, we developed hypotheses to test the effect of the financial leverage on firm performance. We find a strong negative relation between leverage and firm profitability. The testing process, the results, and their implications are discussed in the remaining parts of this paper. Section 2 proposes the development of the hypotheses; sections 3 and 4 describe the data and testing methods, respectively; section 5 discusses the result and their implications; and section 6 concludes the paper.
HYPOTHESIS DEVELOPMENT
The agency cost theory is a basic financial concept elaborated by Jensen amd Meckling (1976), which
is widely used to explain the relation of a firm’s capital structure and performance. They find that a firm’s managers’ and owners’ goals are not aligned if they are separate entities. This conflict arises when managers are key decision-makers who try to maximize their utilities instead of acting in the best interests of shareholders and the firm. In addition to the conflict between managers and owners, there is also the conflict between debtholders and equity investors where there is a risk of default (Jensen and Meckling, 1976). The agency cost theory proposes two different outcomes for leverage’s impact on firm performance. First, as the firm’s leverage is increased, so is the agency cost. In this case, the conflict between debt owners and equity holders increases because shareholders are likely to adopt riskier projects at the expense of debtholders. Thus, there is a negative relationship between higher leverage and firm performance (Soumadi and Hayajneh, 2012). However, from a counter perspective, leverage can positively affect firms’ performance. In this case, as more debts lead to more interest expense, it creates higher risk of bankruptcy; as a result, managers have to perform better to avoid bankruptcy and associated costs, which in turns improves firm performance (Soumadi and Hayajneh, 2012).
Nevertheless, considering the specific nature of the Canadian oil and gas industry, one impact may be greater than the other. First, the oil and gas industry is capital intensive, which requires a significant amount of investments in properties and technology. At the same time, it is highly unpredictable, especially in the stage of exploration. Therefore, the industry is associated with high risks, coming with high return. Also, once natural sources have been found, additional investment is made as long as the oil gained can offset out-of-pocket expenses (Committee on Price Research, 1939). Second, on average, Canadian interest rates have been relatively low in the last ten years, except for 2006, 2007 and 2009 (World Bank, n.d). Thus, default risks have been reduced. Finally, larger oil and gas firms have shown much higher stability and survival rates (Mansell, et al., 2012) over the same period. These conditions would probably allow managers to engage in riskier projects to satisfy the need for large investments at low costs of debts. Hence, the negative effects of the financial leverage would likely outweigh the positive ones.
Journal of Accounting and Finance Vol. 16(1) 2016 77
H1: We will expect that in the pre-crisis period (2004-2006), firms will show regular phenomenon as discussed above, and therefore, firms with above median leverage (higher D/E ratio) will have a negative impact on performance.
H2: However, we expect the scenario to be different during the financial crisis period of the last decade. When the world economies were tumbling one after another, Canada stood tall amongst the G20 countries. However, the growth slowed down and Canada did go into brief period of recession during that period. It is to be noted that the oil price did not take a hit due to the financial crisis; as a matter of fact it peaked during the crisis period. Therefore, during the financial crisis (2007-2009), we expect leverage will continue to have a negative influence on firm performance but the impact will not be as strong as it used to be in the pre-crisis period.
H3: As firms are recovering in the post-crisis (2010-2013) period, performances are getting better as well. However, we have observed an unprecedented dip in oil prices in the recent years. As oil prices are plummeting, it is having an impact on the equity prices of oil companies. We anticipate a lower equity pricing will cause the debt-to-equity ratio to rise in general, and therefore, the impact of leverage on firm performance will show a stronger negative influence in the post-crisis recovery period than that was in the crisis period.
DATA DESCRIPTION
We collect our data for a ten year period (2004-2013) from the financial statements of the ten largest
Canadian oil & gas companies. The detailed list of sample companies is provided in Appendix 1. We divide the sample period into three sub-periods—pre-crisis (2004-2006), crisis (2007-2009), and post-crisis recovery (2010-2013) periods. The definition of the financial ratios used in this study is provided in Appendix 2.
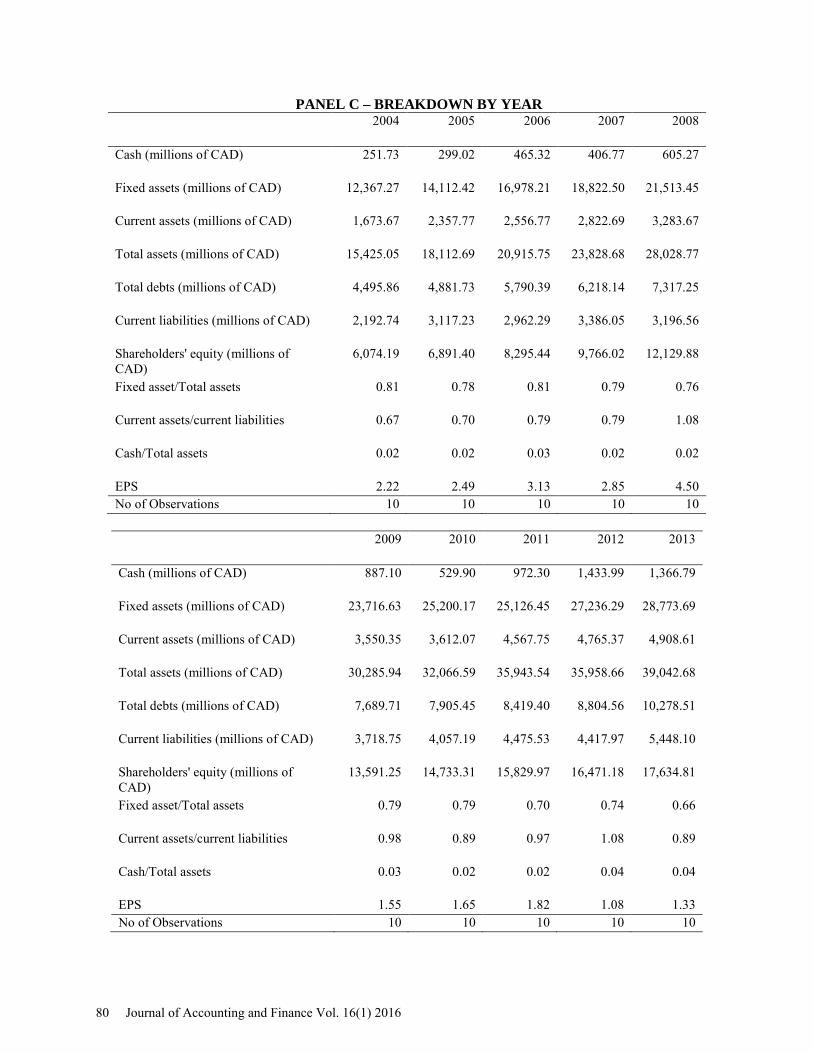
In table 1, we provide some descriptive statistics about our sample firms. We report mean values for cash, fixed assets, current assets, total assets, total debts, current liabilities, and shareholders’ equity. We also provide the ratios, including fixed asset ratio, current ratio, cash ratio, and earnings per share.
In panel A, we split our sample based on the three subperiods mentioned earlier (pre-crisis, crisis, and post-crisis). In panel B we divide the data correspondent to highly leveraged group, low leveraged group, and overall performance. In panel C we break down the data on a year-by-year basis. In absolute terms, there is a steady growth of all accounting parameters (cash, fixed assets, current assets, total debts, current liabilities, and shareholders’ equity) over the ten-year period. This increase is also conforming to the pre-crisis, during crisis and post-crisis interval. With regards to specific ratios, fixed asset ratio is highest before the crisis (0.8), and then steadily declines during and after the crisis (0.78 and 0.72, respectively). Current ratio increases from 0.72 pre-crisis to 0.95 in the crisis and 0.96 post-crisis. Similarly, cash ratio increases from 0.019 pre-crisis to 0.025 during the crisis, and to 0.03 post-crisis. EPS, on the other hand, performs best during the crisis (2.97) and drops post-crisis (1.47) to a level even lower than pre-crisis (2.61). With regards to comparison by high leverage and low leverage, most ratios and indicators are higher for firms having lower leverage, except for absolute amount of fix assets, total assets and debts. For the overall ten-year period, current ratio and cash ratio increase from 0.67 to 0.89 and from 0.02 to 0.04, respectively. Fixed assets ratio and EPS decrease from 0.81 to 0.66 and from 2.22 to 1.33, respectively.
In table 2 we report the level of leverage on a year-by-year basis, and by each subperiod. We report leverage levels for above median (hi D/E), and below median (low D/E) subsamples for each of the two criteria mentioned above.
In general, the level of leverage reduces during the crisis period. The average difference in leverage ratios of hi and low D/E companies are 0.84 before the crisis, 0.63 during the crisis and 0.78 after the crisis. The mean and median for the difference across the ten year period are 0.75 and 0.79 respectively. However, we observe a spike in 2006 (0.98) and 2011 (0.91) and a dip in 2008 (0.39). It is to be noted that 2006 was immediately before the crisis, 2011 was when recovery was gaining pace, and 2008 was the peak of the crisis. The year 2008 was the worst year in of the crisis period marked by the failures of large
78 Journal of Accounting and Finance Vol. 16(1) 2016
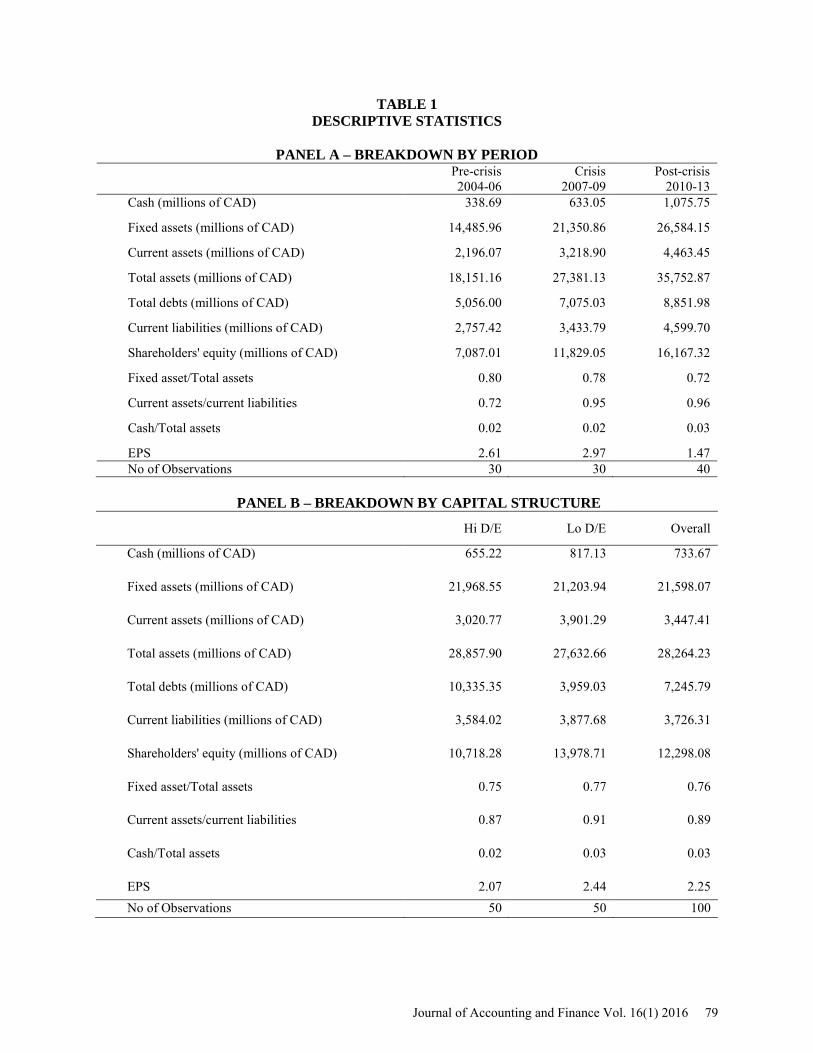
TABLE 1 DESCRIPTIVE STATISTICS
PANEL A – BREAKDOWN BY PERIOD
Pre-crisis 2004-06
Crisis 2007-09
Post-crisis 2010-13
Cash (millions of CAD) 338.69 633.05 1,075.75
Fixed assets (millions of CAD) 14,485.96 21,350.86 26,584.15
Current assets (millions of CAD) 2,196.07 3,218.90 4,463.45
Total assets (millions of CAD) 18,151.16 27,381.13 35,752.87
Total debts (millions of CAD) 5,056.00 7,075.03 8,851.98
Current liabilities (millions of CAD) 2,757.42 3,433.79 4,599.70
Shareholders' equity (millions of CAD) 7,087.01 11,829.05 16,167.32
Fixed asset/Total assets 0.80 0.78 0.72
Current assets/current liabilities 0.72 0.95 0.96
Cash/Total assets 0.02 0.02 0.03
EPS 2.61 2.97 1.47 No of Observations 30 30 40
PANEL B – BREAKDOWN BY CAPITAL STRUCTURE
Hi D/E Lo D/E Overall
Cash (millions of CAD) 655.22 817.13 733.67
Fixed assets (millions of CAD) 21,968.55 21,203.94 21,598.07
Current assets (millions of CAD) 3,020.77 3,901.29 3,447.41
Total assets (millions of CAD) 28,857.90 27,632.66 28,264.23
Total debts (millions of CAD) 10,335.35 3,959.03 7,245.79
Current liabilities (millions of CAD) 3,584.02 3,877.68 3,726.31
Shareholders' equity (millions of CAD) 10,718.28 13,978.71 12,298.08
Fixed asset/Total assets 0.75 0.77 0.76
Current assets/current liabilities 0.87 0.91 0.89
Cash/Total assets 0.02 0.03 0.03
EPS 2.07 2.44 2.25 No of Observations 50 50 100
Journal of Accounting and Finance Vol. 16(1) 2016 79
PANEL C – BREAKDOWN BY YEAR 2004 2005 2006 2007 2008
Cash (millions of CAD) 251.73 299.02 465.32 406.77 605.27
Fixed assets (millions of CAD) 12,367.27 14,112.42 16,978.21 18,822.50 21,513.45
Current assets (millions of CAD) 1,673.67 2,357.77 2,556.77 2,822.69 3,283.67
Total assets (millions of CAD) 15,425.05 18,112.69 20,915.75 23,828.68 28,028.77
Total debts (millions of CAD) 4,495.86 4,881.73 5,790.39 6,218.14 7,317.25
Current liabilities (millions of CAD) 2,192.74 3,117.23 2,962.29 3,386.05 3,196.56
Shareholders' equity (millions of CAD)
6,074.19 6,891.40 8,295.44 9,766.02 12,129.88
Fixed asset/Total assets 0.81 0.78 0.81 0.79 0.76
Current assets/current liabilities 0.67 0.70 0.79 0.79 1.08
Cash/Total assets 0.02 0.02 0.03 0.02 0.02
EPS 2.22 2.49 3.13 2.85 4.50 No of Observations 10 10 10 10 10 2009 2010 2011 2012 2013
Cash (millions of CAD) 887.10 529.90 972.30 1,433.99 1,366.79
Fixed assets (millions of CAD) 23,716.63 25,200.17 25,126.45 27,236.29 28,773.69
Current assets (millions of CAD) 3,550.35 3,612.07 4,567.75 4,765.37 4,908.61
Total assets (millions of CAD) 30,285.94 32,066.59 35,943.54 35,958.66 39,042.68
Total debts (millions of CAD) 7,689.71 7,905.45 8,419.40 8,804.56 10,278.51
Current liabilities (millions of CAD) 3,718.75 4,057.19 4,475.53 4,417.97 5,448.10
Shareholders' equity (millions of CAD)
13,591.25 14,733.31 15,829.97 16,471.18 17,634.81
Fixed asset/Total assets 0.79 0.79 0.70 0.74 0.66
Current assets/current liabilities 0.98 0.89 0.97 1.08 0.89
Cash/Total assets 0.03 0.02 0.02 0.04 0.04
EPS 1.55 1.65 1.82 1.08 1.33 No of Observations 10 10 10 10 10
80 Journal of Accounting and Finance Vol. 16(1) 2016
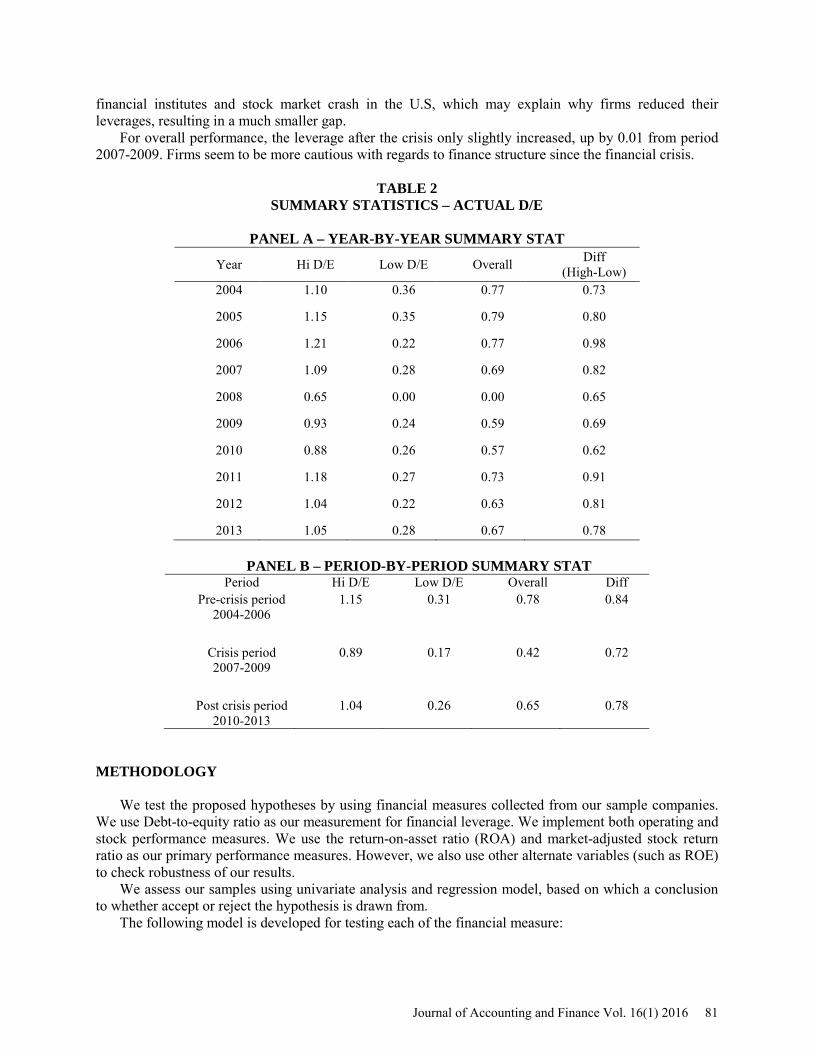
financial institutes and stock market crash in the U.S, which may explain why firms reduced their leverages, resulting in a much smaller gap.
For overall performance, the leverage after the crisis only slightly increased, up by 0.01 from period 2007-2009. Firms seem to be more cautious with regards to finance structure since the financial crisis.
TABLE 2
SUMMARY STATISTICS – ACTUAL D/E
PANEL A – YEAR-BY-YEAR SUMMARY STAT
Year Hi D/E Low D/E Overall Diff (High-Low)
2004 1.10 0.36 0.77 0.73
2005 1.15 0.35 0.79 0.80
2006 1.21 0.22 0.77 0.98
2007 1.09 0.28 0.69 0.82
2008 0.65 0.00 0.00 0.65
2009 0.93 0.24 0.59 0.69
2010 0.88 0.26 0.57 0.62
2011 1.18 0.27 0.73 0.91
2012 1.04 0.22 0.63 0.81
2013 1.05 0.28 0.67 0.78
PANEL B – PERIOD-BY-PERIOD SUMMARY STAT Period Hi D/E Low D/E Overall Diff
Pre-crisis period 2004-2006
1.15 0.31 0.78 0.84
Crisis period 2007-2009
0.89 0.17 0.42 0.72
Post crisis period 2010-2013
1.04 0.26 0.65 0.78
METHODOLOGY
We test the proposed hypotheses by using financial measures collected from our sample companies.
We use Debt-to-equity ratio as our measurement for financial leverage. We implement both operating and stock performance measures. We use the return-on-asset ratio (ROA) and market-adjusted stock return ratio as our primary performance measures. However, we also use other alternate variables (such as ROE) to check robustness of our results.
We assess our samples using univariate analysis and regression model, based on which a conclusion to whether accept or reject the hypothesis is drawn from.
The following model is developed for testing each of the financial measure:
Journal of Accounting and Finance Vol. 16(1) 2016 81
𝑌 = 𝛽0 + 𝛽1𝑋1(𝑡) + 𝛽2𝑋2(𝑡) + 𝛽3𝑋3(𝑡) + 𝛽4𝑋4(𝑡) + 𝛽5𝑋5(𝑡) + 𝛽6𝑋6(𝑡) Where: Y = Dependent variable (ROE, ROE, Market-adjusted stock return)
𝑋1(𝑡)= Leverage ratio at time t 𝑋2(𝑡)= Cash ratio at time t 𝑋3(𝑡)= Current ratio at time t 𝑋4(𝑡)= Fixed asset ratio at time t 𝑋5(𝑡)= EPS at time t 𝑋6(𝑡)= Lagged ROA, lagged ROE or lagged Market-adjusted stock return at time t
DISCUSSION OF RESULTS Univariate Analysis
We use return-on-asset (ROA), return-on-equity (ROE) and market-adjusted stock returns to evaluate firms’ performance. Debt and equity, as main components of capital structure, directly affect the company’s asset values. Thus, it is reasonable to use profitability ratios such as ROA and ROE in order to understand firms’ profitability fluctuation corresponding to capital structure change. We use market adjusted stock returns for robustness.
We report the ROA, ROE and market-adjusted stock returns in tables 3, 4, and 5 respectively. In general, we find a negative relationship between firm performance and its leverage ratio.
TABLE 3
OPERATING PERFORMANCE – RETURN ON ASSETS
PANEL A – YEAR-BY-YEAR BREAKDOWN OF ROA
Year Hi D/E Low D/E Overall Diff (High-Low) t-stat
2004 6.6% 9.8% 8.0% -3.2% -1.53*
2005 5.3% 11.8% 8.2% -6.5% -3.30***
2006 8.1% 13.7% 10.6% -5.6% -1.52*
2007 6.6% 10.7% 8.7% -4.1% -1.12
2008 8.3% 15.0% 11.6% -6.8% -2.40**
2009 4.5% 3.5% 4.0% 0.9% 0.53
2010 4.2% 5.2% 4.7% -1.0% -0.54
2011 2.1% 7.6% 4.9% -5.5% -3.58***
2012 -1.2% 5.5% 2.1% -6.7% -1.70*
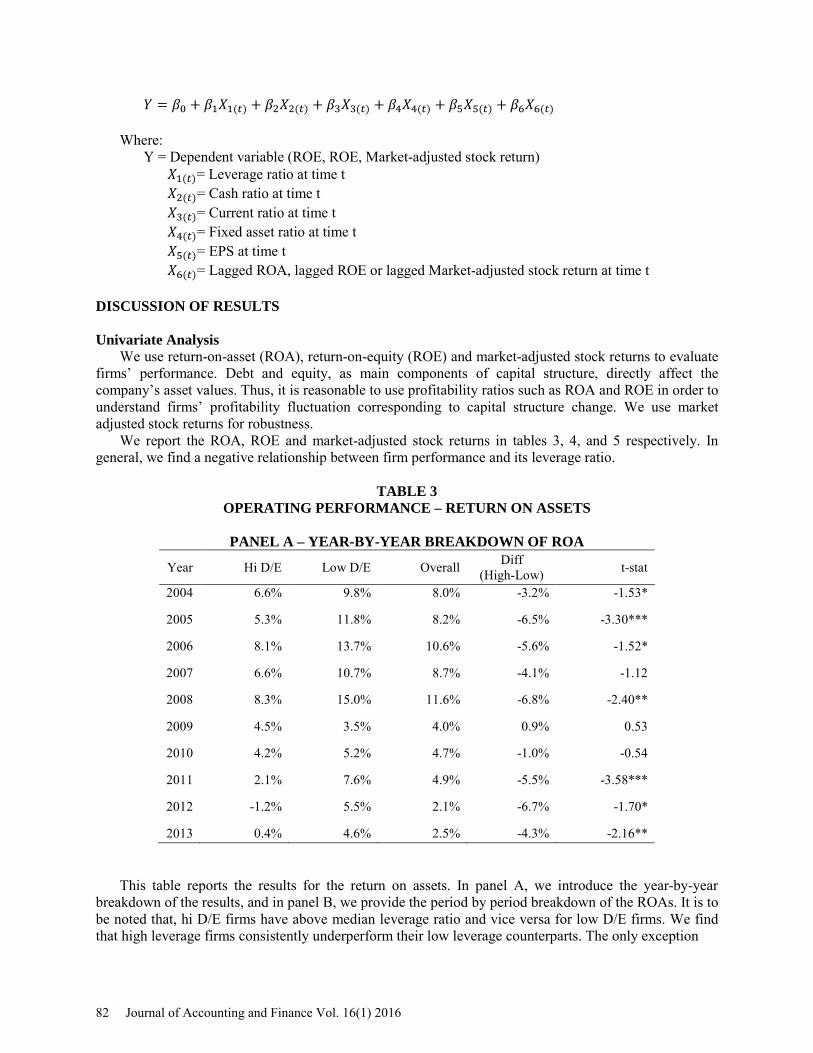
2013 0.4% 4.6% 2.5% -4.3% -2.16** This table reports the results for the return on assets. In panel A, we introduce the year-by-year
breakdown of the results, and in panel B, we provide the period by period breakdown of the ROAs. It is to be noted that, hi D/E firms have above median leverage ratio and vice versa for low D/E firms. We find that high leverage firms consistently underperform their low leverage counterparts. The only exception
82 Journal of Accounting and Finance Vol. 16(1) 2016
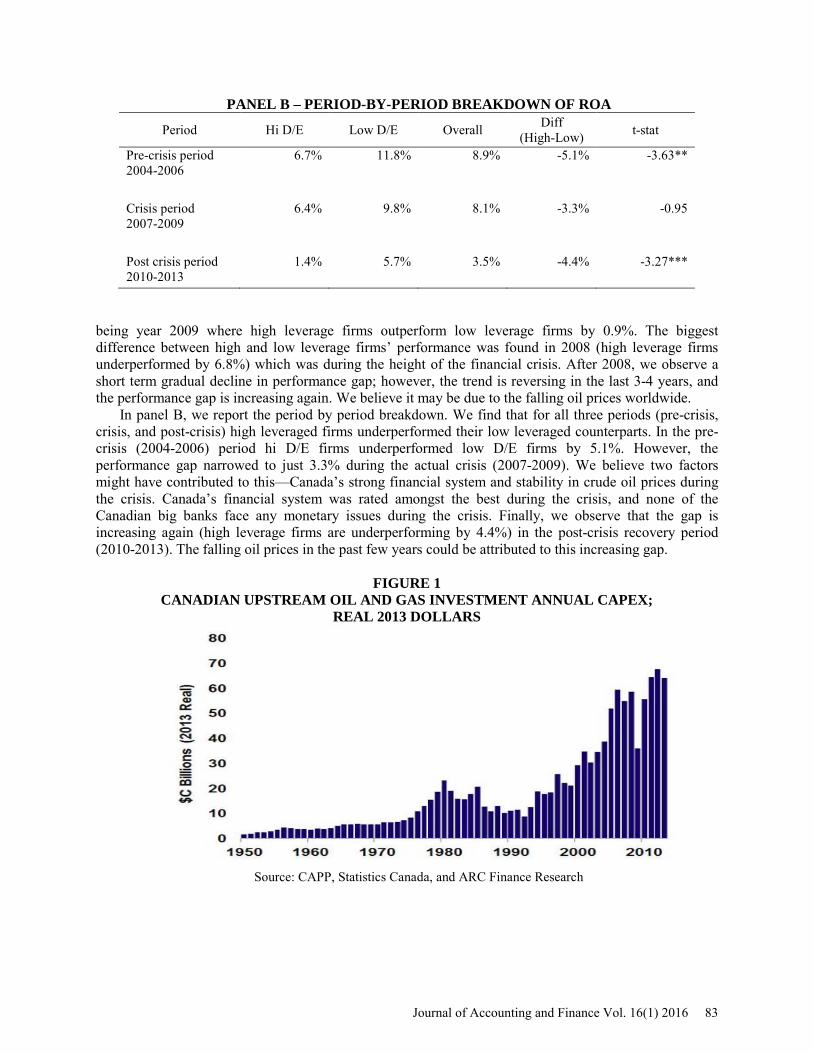
PANEL B – PERIOD-BY-PERIOD BREAKDOWN OF ROA
Period Hi D/E Low D/E Overall Diff (High-Low) t-stat
Pre-crisis period 2004-2006
6.7% 11.8% 8.9% -5.1% -3.63**
Crisis period 2007-2009
6.4% 9.8% 8.1% -3.3% -0.95
Post crisis period 2010-2013
1.4% 5.7% 3.5% -4.4% -3.27***
being year 2009 where high leverage firms outperform low leverage firms by 0.9%. The biggest difference between high and low leverage firms’ performance was found in 2008 (high leverage firms underperformed by 6.8%) which was during the height of the financial crisis. After 2008, we observe a short term gradual decline in performance gap; however, the trend is reversing in the last 3-4 years, and the performance gap is increasing again. We believe it may be due to the falling oil prices worldwide.
In panel B, we report the period by period breakdown. We find that for all three periods (pre-crisis, crisis, and post-crisis) high leveraged firms underperformed their low leveraged counterparts. In the pre-crisis (2004-2006) period hi D/E firms underperformed low D/E firms by 5.1%. However, the performance gap narrowed to just 3.3% during the actual crisis (2007-2009). We believe two factors might have contributed to this—Canada’s strong financial system and stability in crude oil prices during the crisis. Canada’s financial system was rated amongst the best during the crisis, and none of the Canadian big banks face any monetary issues during the crisis. Finally, we observe that the gap is increasing again (high leverage firms are underperforming by 4.4%) in the post-crisis recovery period (2010-2013). The falling oil prices in the past few years could be attributed to this increasing gap.
FIGURE 1
CANADIAN UPSTREAM OIL AND GAS INVESTMENT ANNUAL CAPEX; REAL 2013 DOLLARS
Source: CAPP, Statistics Canada, and ARC Finance Research
Journal of Accounting and Finance Vol. 16(1) 2016 83
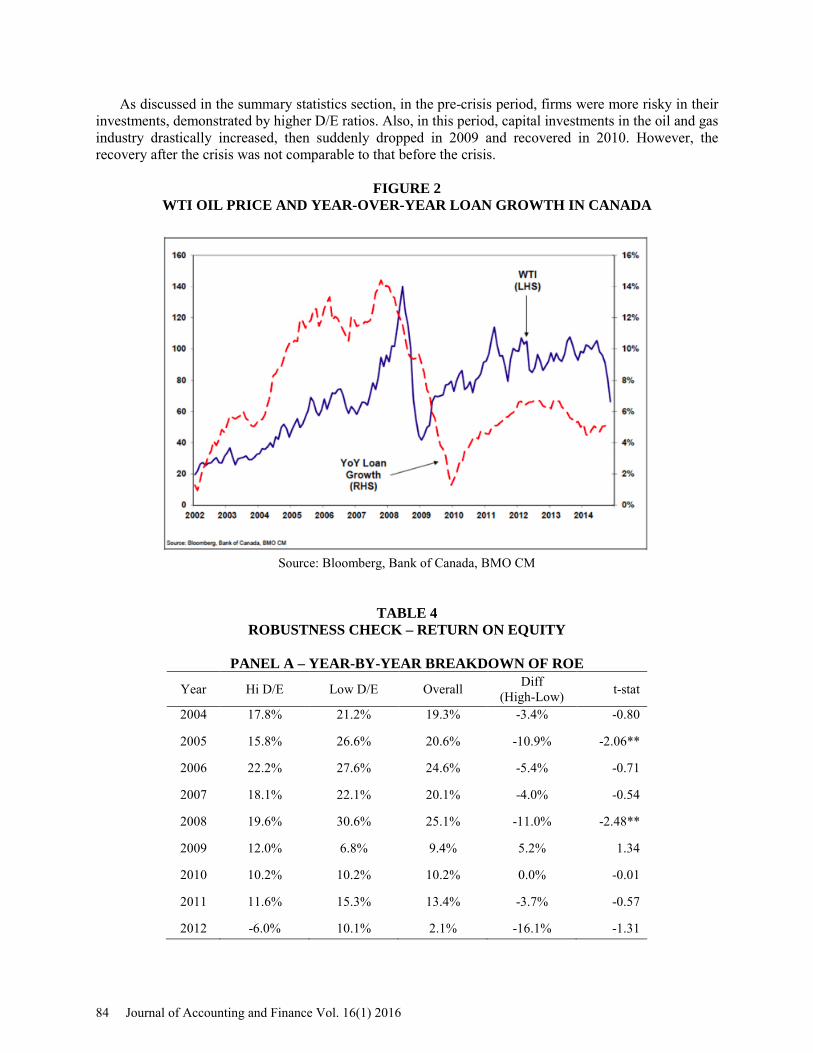
As discussed in the summary statistics section, in the pre-crisis period, firms were more risky in their investments, demonstrated by higher D/E ratios. Also, in this period, capital investments in the oil and gas industry drastically increased, then suddenly dropped in 2009 and recovered in 2010. However, the recovery after the crisis was not comparable to that before the crisis.
FIGURE 2
WTI OIL PRICE AND YEAR-OVER-YEAR LOAN GROWTH IN CANADA
Source: Bloomberg, Bank of Canada, BMO CM
TABLE 4 ROBUSTNESS CHECK – RETURN ON EQUITY
PANEL A – YEAR-BY-YEAR BREAKDOWN OF ROE
Year Hi D/E Low D/E Overall Diff (High-Low) t-stat
2004 17.8% 21.2% 19.3% -3.4% -0.80
2005 15.8% 26.6% 20.6% -10.9% -2.06**
2006 22.2% 27.6% 24.6% -5.4% -0.71
2007 18.1% 22.1% 20.1% -4.0% -0.54
2008 19.6% 30.6% 25.1% -11.0% -2.48**
2009 12.0% 6.8% 9.4% 5.2% 1.34
2010 10.2% 10.2% 10.2% 0.0% -0.01
2011 11.6% 15.3% 13.4% -3.7% -0.57
2012 -6.0% 10.1% 2.1% -16.1% -1.31
84 Journal of Accounting and Finance Vol. 16(1) 2016
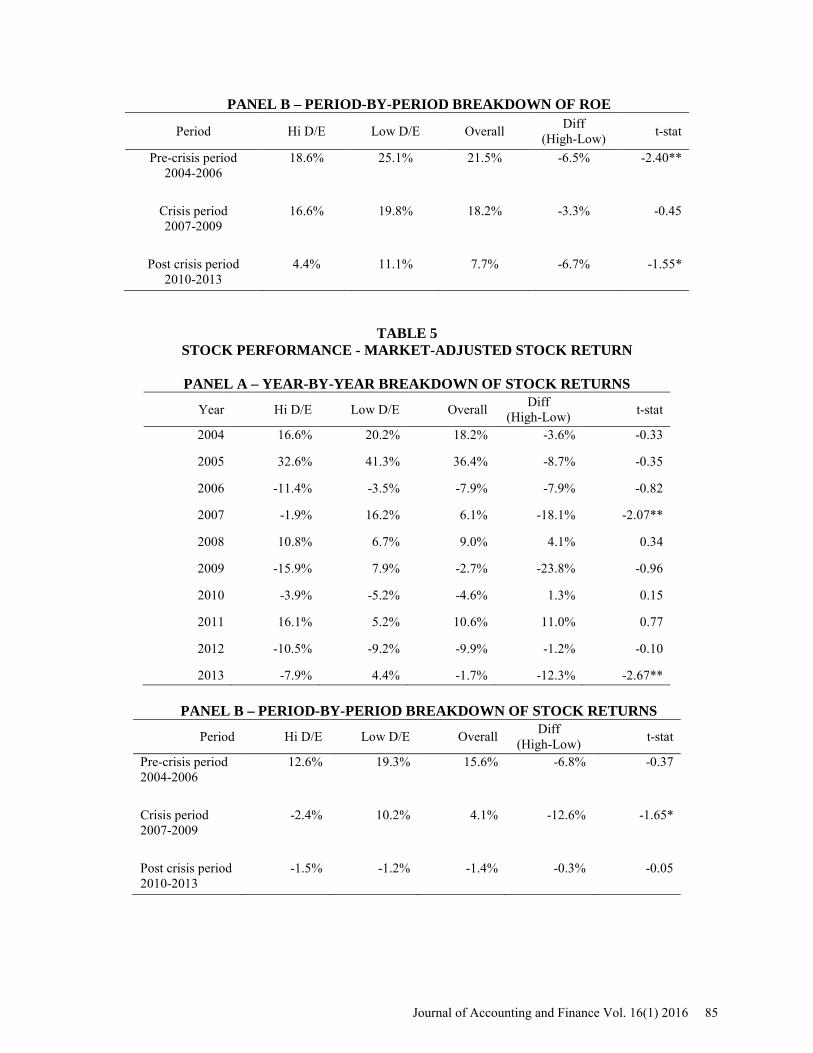
PANEL B – PERIOD-BY-PERIOD BREAKDOWN OF ROE
Period Hi D/E Low D/E Overall Diff (High-Low) t-stat
Pre-crisis period 2004-2006
18.6% 25.1% 21.5% -6.5% -2.40**
Crisis period 2007-2009
16.6% 19.8% 18.2% -3.3% -0.45
Post crisis period 2010-2013
4.4% 11.1% 7.7% -6.7% -1.55*
TABLE 5 STOCK PERFORMANCE - MARKET-ADJUSTED STOCK RETURN
PANEL A – YEAR-BY-YEAR BREAKDOWN OF STOCK RETURNS
Year Hi D/E Low D/E Overall Diff (High-Low) t-stat
2004 16.6% 20.2% 18.2% -3.6% -0.33
2005 32.6% 41.3% 36.4% -8.7% -0.35
2006 -11.4% -3.5% -7.9% -7.9% -0.82
2007 -1.9% 16.2% 6.1% -18.1% -2.07**
2008 10.8% 6.7% 9.0% 4.1% 0.34
2009 -15.9% 7.9% -2.7% -23.8% -0.96
2010 -3.9% -5.2% -4.6% 1.3% 0.15
2011 16.1% 5.2% 10.6% 11.0% 0.77
2012 -10.5% -9.2% -9.9% -1.2% -0.10
2013 -7.9% 4.4% -1.7% -12.3% -2.67**
PANEL B – PERIOD-BY-PERIOD BREAKDOWN OF STOCK RETURNS
Period Hi D/E Low D/E Overall Diff (High-Low) t-stat
Pre-crisis period 2004-2006
12.6% 19.3% 15.6% -6.8% -0.37
Crisis period 2007-2009
-2.4% 10.2% 4.1% -12.6% -1.65*
Post crisis period 2010-2013
-1.5% -1.2% -1.4% -0.3% -0.05
Journal of Accounting and Finance Vol. 16(1) 2016 85
Similarly, the oil price grew quickly before the crisis and peaked in early 2008, then plunged in 2009. While the oil price has slightly recovered since 2010, the fluctuation of the oil price has not been as large as before the crisis. As a result, these factors may have magnified the variance in firms’ profitability, leading to a more negative impact of leverage on firms’ performance before the crisis.
We report the return on equity results in table 4. Consistent with our findings in the previous section, we find that high leverage firms are underperforming their low leverage counterparts. The results are qualitatively similar to that of the ROA. The gap decreased during the crisis and it is increasing in the post-crisis period. The performance gap between high and low leverage firms are 6.5% (pre-crisis), 3.3% (crisis), and 6.7% (post-crisis).
For robustness, we analyzed the market adjusted stock returns for the entire sample. We find that high leverage firms still underperform their low leverage counterparts. However, the magnitude of underperformance is greatest during the crisis. This is different from the operating performance results discussed above. As the investor confidence took a big dive and everyone was selling off, we are not surprised to find this phenomenon for the stock returns.
In summary, these results consistently show that high leverage firms underperform their low leverage counterparts. We also observe stronger negative trends in the pre- and post- crisis period compared to that of the crisis-period. These findings support our hypotheses.
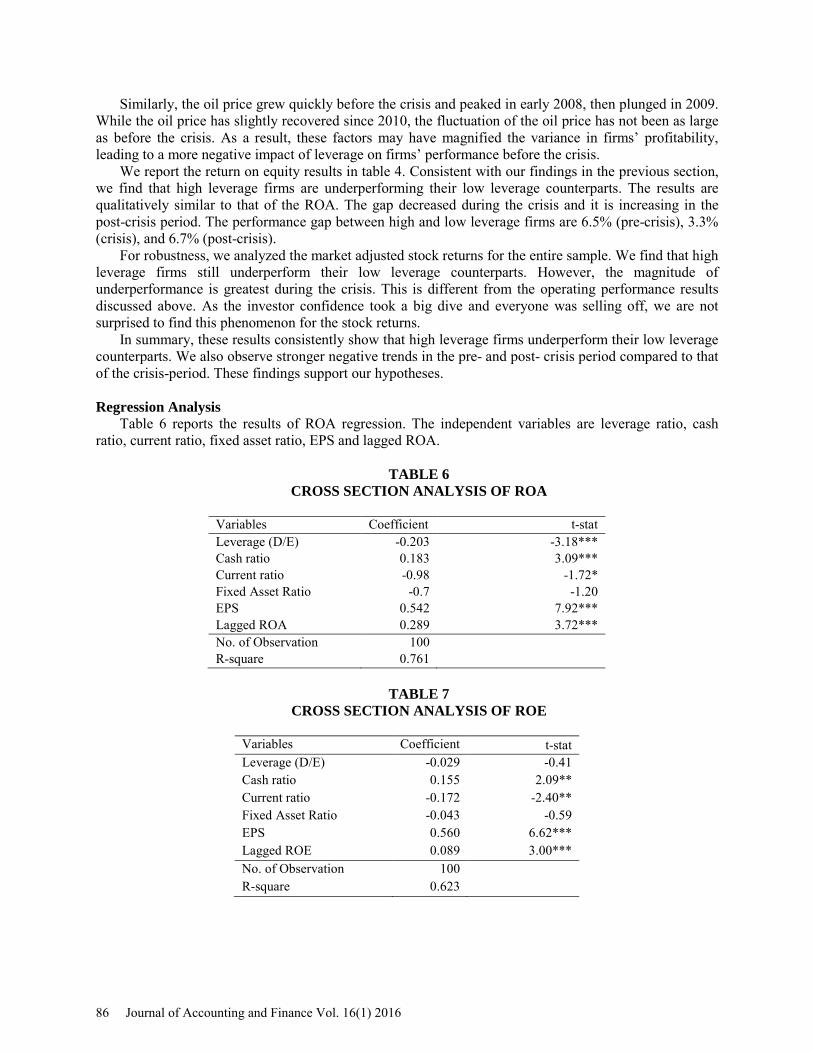
Regression Analysis
Table 6 reports the results of ROA regression. The independent variables are leverage ratio, cash ratio, current ratio, fixed asset ratio, EPS and lagged ROA.
TABLE 6
CROSS SECTION ANALYSIS OF ROA
Variables Coefficient t-stat Leverage (D/E) -0.203 -3.18*** Cash ratio 0.183 3.09*** Current ratio -0.98 -1.72* Fixed Asset Ratio -0.7 -1.20 EPS 0.542 7.92*** Lagged ROA 0.289 3.72*** No. of Observation 100 R-square 0.761
TABLE 7
CROSS SECTION ANALYSIS OF ROE
Variables Coefficient t-stat Leverage (D/E) -0.029 -0.41 Cash ratio 0.155 2.09** Current ratio -0.172 -2.40** Fixed Asset Ratio -0.043 -0.59 EPS 0.560 6.62*** Lagged ROE 0.089 3.00*** No. of Observation 100 R-square 0.623
86 Journal of Accounting and Finance Vol. 16(1) 2016
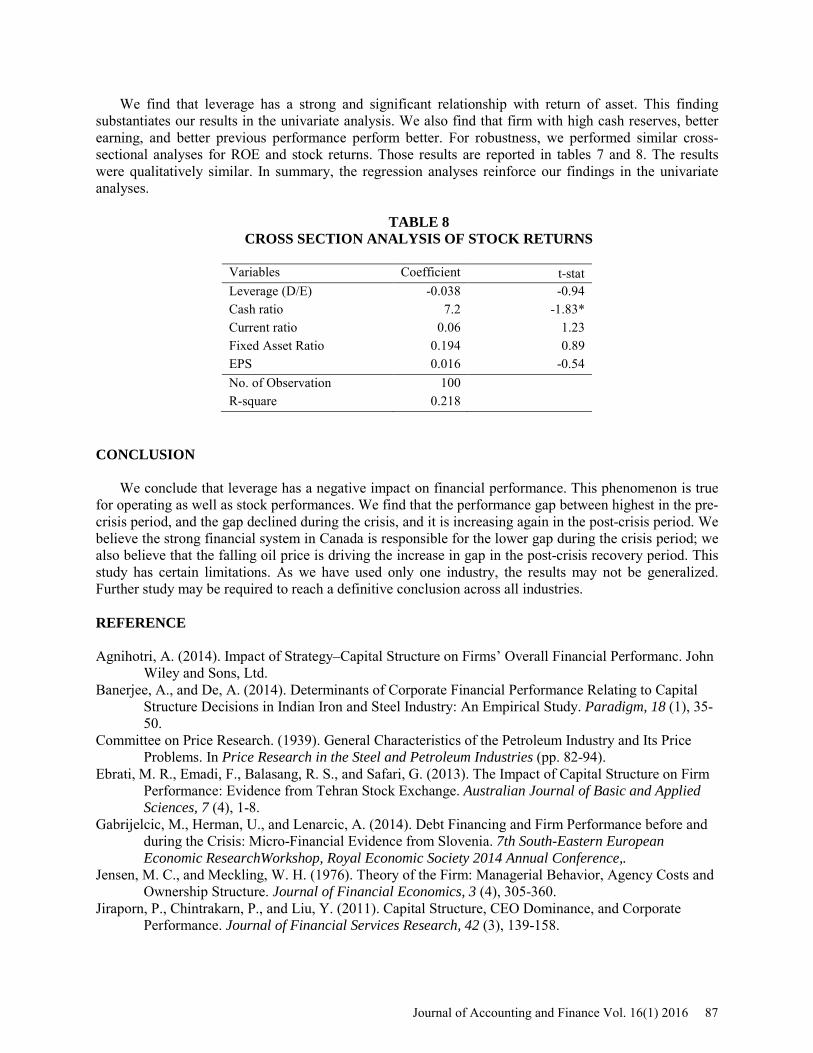
We find that leverage has a strong and significant relationship with return of asset. This finding substantiates our results in the univariate analysis. We also find that firm with high cash reserves, better earning, and better previous performance perform better. For robustness, we performed similar cross-sectional analyses for ROE and stock returns. Those results are reported in tables 7 and 8. The results were qualitatively similar. In summary, the regression analyses reinforce our findings in the univariate analyses.
TABLE 8 CROSS SECTION ANALYSIS OF STOCK RETURNS
Variables Coefficient t-stat Leverage (D/E) -0.038 -0.94 Cash ratio 7.2 -1.83* Current ratio 0.06 1.23 Fixed Asset Ratio 0.194 0.89 EPS 0.016 -0.54 No. of Observation 100 R-square 0.218
CONCLUSION
We conclude that leverage has a negative impact on financial performance. This phenomenon is true
for operating as well as stock performances. We find that the performance gap between highest in the pre-crisis period, and the gap declined during the crisis, and it is increasing again in the post-crisis period. We believe the strong financial system in Canada is responsible for the lower gap during the crisis period; we also believe that the falling oil price is driving the increase in gap in the post-crisis recovery period. This study has certain limitations. As we have used only one industry, the results may not be generalized. Further study may be required to reach a definitive conclusion across all industries. REFERENCE Agnihotri, A. (2014). Impact of Strategy–Capital Structure on Firms’ Overall Financial Performanc. John
Wiley and Sons, Ltd. Banerjee, A., and De, A. (2014). Determinants of Corporate Financial Performance Relating to Capital
Structure Decisions in Indian Iron and Steel Industry: An Empirical Study. Paradigm, 18 (1), 35-50.
Committee on Price Research. (1939). General Characteristics of the Petroleum Industry and Its Price Problems. In Price Research in the Steel and Petroleum Industries (pp. 82-94).
Ebrati, M. R., Emadi, F., Balasang, R. S., and Safari, G. (2013). The Impact of Capital Structure on Firm Performance: Evidence from Tehran Stock Exchange. Australian Journal of Basic and Applied Sciences, 7 (4), 1-8.
Gabrijelcic, M., Herman, U., and Lenarcic, A. (2014). Debt Financing and Firm Performance before and during the Crisis: Micro-Financial Evidence from Slovenia. 7th South-Eastern European Economic ResearchWorkshop, Royal Economic Society 2014 Annual Conference,.
Jensen, M. C., and Meckling, W. H. (1976). Theory of the Firm: Managerial Behavior, Agency Costs and Ownership Structure. Journal of Financial Economics, 3 (4), 305-360.
Jiraporn, P., Chintrakarn, P., and Liu, Y. (2011). Capital Structure, CEO Dominance, and Corporate Performance. Journal of Financial Services Research, 42 (3), 139-158.
Journal of Accounting and Finance Vol. 16(1) 2016 87
Mansell, R., Winter, J., Krzepkowski, M., and Moore, M. (2012). Size, role and performance in the oil and gas sector. University of Calgary, The School of Public Policy.
Mujahid, M., and Akhtar, K. (2014). Impact of Capital Structure on Firms Financial Performance and Shareholders Wealth: Textile Sector of Pakistan . International Journal of Learning and Development , 4 (2), 27-33.
Mujahid, M., and Sorin, V. (2009). A review of the capital structure theories. Pouraghajan, A., Malekian, E., Emamgholipour, M., Lotfollahpour, V., and Bagheri, M. M. (2012). The
Relationship between Capital Structure and Firm Performance Evaluation Measures: Evidence from the Tehran Stock Exchange . International Journal of Business and Commerce , 1 (9), 166-181.
Sabir, M., and Malik, Q. A. (2012). Determinants of Capital Structure – A Study of Oil and Gas Sector of Pakistan. Interdisciplinary Journal of Contemporary Research in Business, 3 (10), 395-400.
Saeedi, A., and Mahmoodi, I. (2011). Capital Structure and Firm Performance: Evidence from Iranian Companies. International Research Journal of Finance and Economics, 70, 20-30.
Skopljak, V., and Luo, R. H. (2012). Capital Structure and Firm Performance in the Financial Sector: Evidence from Australia. Asian Journal of Finance and Accounting, 4 (1), 278-298.
Soumadi, M. M., and Hayajneh, O. S. (2012). Capital structure and corporate performance empirical study on the public Jordanian share holding firms listed in the Amman stock market. European Scientific Journal , 8 (22), 173-189.
The Globe and Mail. (2013, June 27). Canada's 100 biggest companies by market cap. Retrieved April 6, 2015, from The Globe and Mail: http://www.theglobeandmail.com/report-on-business/top-1000/article12832687/
World Bank. (n.d). Real interest rate (%). Retrieved July 23, 2015, from http://data.worldbank.org/: http://data.worldbank.org/indicator/FR.INR.RINR/countries/1W-CA-US?display=graph
ACKNOWLEDGEMENTS
Hossain thanks Memorial University for providing financial support for this paper. He also thanks Dr.
Alex Faseruk for his comments in earlier version of this paper. All other usual disclosure applies. APPENDIX 1
We selected top ten Canadian oil & gas companies based on market cap from the Globe and Mail,
2013 list:
1. Suncor ($49,819 million) 2. Canadian Natural Resources ($31,277million) 3. Imperial Oil ($36,218 million) 4. Enbridge ($34,631 million) 5. TransCanada Corp ($33,171 million) 6. Husky Energy ($28,878 million) 7. Cenovus Energy ($25,162 million) 8. Encana ($14,476 million) 9. Crescent Point Energy ($14,158 million) 10. Talisman Energy ($11,536 million)
88 Journal of Accounting and Finance Vol. 16(1) 2016
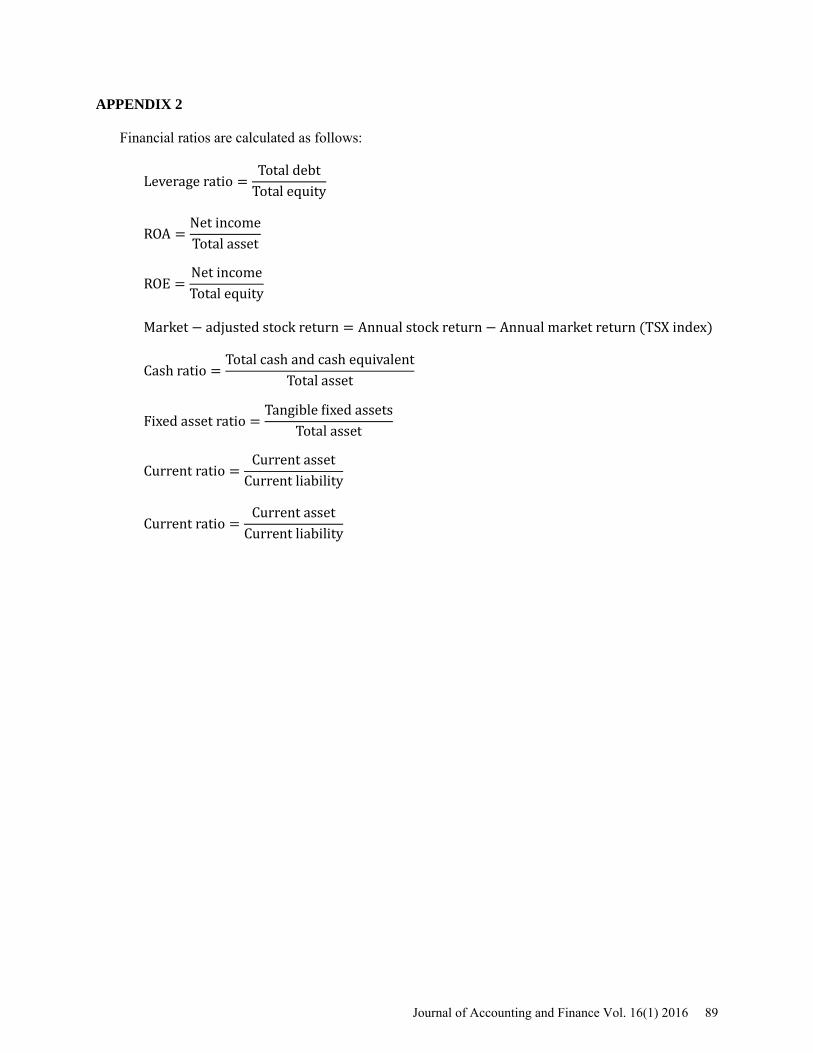
APPENDIX 2 Financial ratios are calculated as follows:
Leverage ratio =Total debt
Total equity
ROA =Net incomeTotal asset
ROE =Net incomeTotal equity
Market − adjusted stock return = Annual stock return − Annual market return (TSX index)
Cash ratio =Total cash and cash equivalent
Total asset
Fixed asset ratio =Tangible �ixed assets
Total asset
Current ratio =Current asset
Current liability
Current ratio =Current asset
Current liability
Journal of Accounting and Finance Vol. 16(1) 2016 89