Embed Size (px)
Citation preview

Capital Structure EngineeringThe Use of Leverage to Enhance Shareholder Returns

Capital Structure Engineering
2
Methodology SummaryWe analyzed the stock performance of 293 firms that were included in the S&P 500 Index for each of the past 11 years. Since we are interested primarily in the impact of capital structure on value creation or destruction, we focused on firms with debt on their balance sheets and share repurchase programs in place.
Results SummaryUsing statistical analysis we have determined that the change in firm value is significantly less than zero, meaning firms destroyed value (See Appendix for Hypothesis Test). Our analysis has indicated that in the aggregate, firms under study destroyed a total of $353 billon in value through levered share repurchases throughout the 11 year period.
In analyzing firms, we expected to see a strong/significant correlation between change in leverage and value destruction. The results show that the correlation of value destruction as a percent of enterprise value and absolute change in debt/total capital over the 11 year period was statistically significant; however, the actual correlation between the two variables for the 293 firms under study was very weak at 0.149. This suggests that as a firm’s leverage increases (decreases) there is a slight increase (decrease) in value destruction from share repurchase.
Despite the statistical significance, the surprisingly low correlation led us to the conclusion that Franco Modigliani and Merton Miller were correct in their theorem stating that capital structure is irrelevant (on a first order basis). Therefore, it can be argued that firm management is essentially wasting time in managing capital structure as there is no strong evidence that share repurchases create firm value over time. In fact, there is more evidence to the contrary; increasing leverage may actually decrease firm value long-term.
IntroductionCredit analysts have observed for a number of years the increasing “shareholder-friendly” activity on the part of corporate management teams. Beginning with the LBO of RJ Reynolds in 1988, bondholders have suffered at the hands of managers who were intent on boosting shareholder returns through nothing more than increased leverage and balance sheet engineering. Following the stock market nosedive in the fall of 2008, Company Management teams would continue to talk about the size of their share repurchase programs, how many shares had been repurchased, and whether or not those repurchases would continue in the current environment. Interestingly, when stock prices were at their cheapest levels in a decade, there were very few companies which were active in their share repurchase programs. Anecdotally, we were not aware of any firms which questioned the value of the share repurchase program – it still seems to be an article of faith among managers (and their advisors) that a share repurchase program is an essential tool in providing value to shareholders.
We question that assumption. In this paper, we decided to analyze 1) the extent to which share repurchase programs have added to or detracted from enterprise value, and 2) the impact that use of leverage had on value creation or destruction. Our hypothesis was that balance sheet engineering through a share repurchase program destroyed value for the corporation. The importance of capital structure has been the subject of an extensive amount of research, so we begin with a brief review of the literature.
Value of Shares Repurchased (Over Time)
-400,000-300,000-200,000-100,000
0100,000200,000300,000400,000500,000
Dec-99Jun-00Dec-00Jun-01Dec-01Jun-02Dec-02Jun-03Dec-03Jun-04Dec-04Jun-05Dec-05Jun-06Dec-06Jun-07Dec-07Jun-08Dec-08Jun-09
02004006008001,0001,2001,4001,6001,800
Value of Shares Repurchased S&P 500
Figure 1: Value of Shares Repurchased
Source: Bloomberg, RBC GAM (US)
Capital Structure Engineering
3
We also believe that this subject continues to warrant serious research, and the final chapter of the leverage cycle has yet to be written. Our study focused primarily on investment grade debt of large issuers. We did not examine the effect of the massive LBO boom which took place from 2004 to 2008, and this represents a much larger increase in leverage than we observed in our data. We suspect that many of these companies will end up re-organizing in bankruptcy, and we would like to ultimately compare the value destruction of this group of companies to those in our data set. We suspect that the apparent irrelevance of capital structure begins to disappear at the extreme levels of debt which many of the LBO companies took on. Perhaps Miller and Modigliani were right, but only within the bounds of reason.
Background - Theories of Corporate Finance:The following theories of corporate finance present a basic overview of how firm capital structure is envisaged. We also give possible theories of why value was destroyed by these share repurchases. However, first we give some motive of why firms repurchase shares.
Firm Motives for Share Repurchases:Managing Earnings Per ShareManagers in general assume that investors determine firm value by simply applying a multiple to current earnings. In addition, there has been some evidence to suggest that when management compensation is tied to established earnings targets there is a greater tendency to focus on E.P.S. management (Mauboussin 2006).
Signaling To The Market That A Firm’s Shares Are Undervalued & That The Firm’s Future Prospects Are StrongSome observers believe that share repurchases send a strong signal to the market. Executives are essentially viewed as insiders with privileged information on the firm’s financials, so it must be a positive sign when they initiate share repurchases.
Mitigating Dilution From Employee Stock Option ProgramsMany firms look to share repurchases as a way to keep outstanding shares at a constant level. As options are granted, firms repurchase similar amounts to offset share dilution.
“Paying” More Tax Effective Dividends To ShareholdersWhen a firm buys back shares it places them in a treasury stock account on the balance sheet. This reduces cash and equity, in precisely the same way payment of a cash dividend would. Most managers would argue that this results in a more tax effective return of capital to shareholders.
This also, however, results in increased leverage. Firms can amplify repurchase’s effect on leverage by buying back
shares through debt issuance. A firm desires leverage for multiple reasons. The first reason is the use of leverage through share repurchases increases important financial performance ratios such as ROE. Repurchasing shares reduces the firm’s equity base, which in turn, enhances the firm’s ROE (second order benefits).
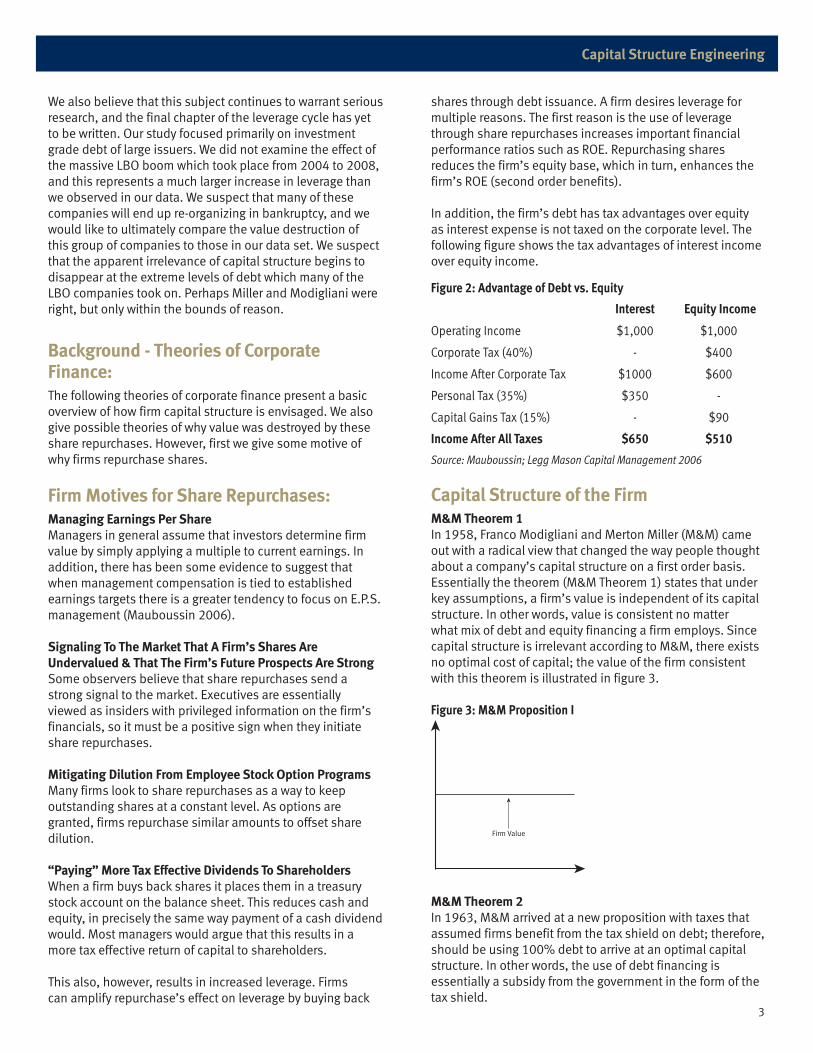
In addition, the firm’s debt has tax advantages over equity as interest expense is not taxed on the corporate level. The following figure shows the tax advantages of interest income over equity income.
Capital Structure of the FirmM&M Theorem 1In 1958, Franco Modigliani and Merton Miller (M&M) came out with a radical view that changed the way people thought about a company’s capital structure on a first order basis. Essentially the theorem (M&M Theorem 1) states that under key assumptions, a firm’s value is independent of its capital structure. In other words, value is consistent no matter what mix of debt and equity financing a firm employs. Since capital structure is irrelevant according to M&M, there exists no optimal cost of capital; the value of the firm consistent with this theorem is illustrated in figure 3.
Figure 3: M&M Proposition I
M&M Theorem 2In 1963, M&M arrived at a new proposition with taxes that assumed firms benefit from the tax shield on debt; therefore, should be using 100% debt to arrive at an optimal capital structure. In other words, the use of debt financing is essentially a subsidy from the government in the form of the tax shield.
Figure 2: Advantage of Debt vs. Equity
Interest Equity Income
Operating Income $1,000 $1,000
Corporate Tax (40%) - $400
Income After Corporate Tax $1000 $600
Personal Tax (35%) $350 -
Capital Gains Tax (15%) - $90
Income After All Taxes $650 $510
Source: Mauboussin; Legg Mason Capital Management 2006
Firm Value

Capital Structure Engineering
4
However, this proposition still ignores bankruptcy costs. In today’s financial environment more than ever, it seems illogical to assume there are no costs of financial distress. The Static Trade-off Theory takes bankruptcy risk into account.
Static Trade-Off Theory:The static trade-off theory of optimal capital structure states that company managers trade off the tax shield benefit of debt issuance versus bankruptcy costs of financial distress from debt issuance (Myers 1989).
The expected cost of financial distress equals the probability of financial distress multiplied by the cost if actually distressed. As a firm continues farther out the curve due to increased leverage, the probably of financial distress grows, which decreases the value of the firm. Figure 4 illustrates this theorem.
Figure 4: Static Trade-Off Theory
Value Destruction Theory - Tax Benefits vs. Bankruptcy CostsOne theory for firm value destruction relates to management having difficulty implementing its firm’s optimal capital structure related to the static trade-off theory. More specifically, companies lever up to take advantage of the tax benefits of debt financing which increases the risk of financial distress.
Investors are also aware of the tax benefit of debt versus equity issuance. More often than not, immediate reaction from investors is positive when a firm increases leverage, while a reduction in leverage is taken as bad news (Smith, 1986). Thus, reductions in equity via share repurchase usually results in an increased stock price in the short run.
One of the basic tenets of corporate finance theory is that management’s goal is to maximize shareholder wealth. The positive response by the market to news of an increase in leverage provides managers with motivation and the incentive to take on more debt. This introduced the question; do managers know when to stop using or reduce leverage?
Agency TheoryThe Static Trade-off Theory does not consider agency costs because it assumes that managers are not solely acting on behalf of equity shareholders but also debt holders. The following are potential conflicts between different parties with misaligned interests that affect the capital structure of the firm.
• Equity Shareholders vs. Debt Holders One of the most important agency issues relates to equity
shareholders and debt holders. It is in shareholders’ best interest to maximize value by taking on higher risk projects with higher returns at the expense of the debt holders. Debt holders have a fixed return; therefore, taking on more risk only increases the likelihood of financial distress without providing higher returns.
• Management vs. Equity Shareholders A conflict of interest exists between Agents (management),
who want to maximize compensation, and Principals (shareholders), who want to maximize profits and dividends. Consequently, actions that managers may believe to be in the best interest of the company, may not necessarily be in the best interest of shareholders. In order to align management and shareholders interests, stock options have historically been a popular (and significant) component of executive compensation. It is not clear that there has been a true functional alignment of interests as a result of this practice, which we address below. In addition, option-based compensation has introduced a new Principal/Agent conflict – between debtholders and management.
• Management vs. Debt Holders When a large percentage of executive compensation is
tied to stock options, management can essentially be considered an equity shareholder, whose ownership interest has been obtained on a fully levered basis. This not only motivates them to take on risky projects in search of higher returns and to repurchase shares with debt, both of which are a detriment to bond holders, but the leverage implicit in the equity options gives management a greater desire for volatility than even shareholders. If their gambles do not pay off, management can use the bankruptcy as a vehicle to eliminate existing shareholders and re-price their options. Often, bankruptcy does not result in termination of management; more frequently, they are given incentives to stay on with the company.
Figure 5: Appetite For Volatility Throughout The Capital
Firm Value (Financed 100% by Equity)
PV of Tax Shield
Optimal Capital StructureFirm Debt
FirmMarketValue
PV of Bankruptcy Costs
Bond Holders ShareholdersManagement
(Stock Options)
Low High

Capital Structure Engineering
5
Contingent Claims Analysis - Merton ModelRobert Merton developed a model that states that a firm’s equity shareholders essentially own a call option on the firm’s assets. Shareholders get all of the upside, and their downside is restricted to the firm going into bankruptcy due to limited liability. Therefore, it can be assumed that as firms lever up, the cost of debt should increase because the likelihood of bankruptcy increases.
Because of this reason, the structure of a firm can be looked at as bondholders being the “equity holders” of the firm’s assets, while equity shareholders have a deep in-the-money call option on those assets. Since the bondholders own the assets of the firm, they desire low volatility. On the other hand, it is in the best interest of the equity shareholders to introduce volatility into the stock price in order to increase the value of their option. In order to do this, the company can repurchase shares with debt which levers up the firm at a cheaper price than if the firm would take on the whole debt load at once (Simplified example shown in Figure 6). In other words, the newly issued debt to purchase shares, which would be issued at expensive rates, would be added onto existing debt financed at cheap rates. The firm has essentially delivered a one-time dividend to equity shareholders at the expense of bondholders by taking advantage of its historical strong performance.
By levering up an additional $300M to repurchase shares, the firm was able to increase its potential return to equity shareholders from 70%, if it had issued the $800M all at once, to 103% by establishing a track record with investors. This assumes that the cost of debt for the existing debt was 7%, while debt to take the firm to an 80/20 debt/equity capital structure cost 20%. The upside was obtained without reducing the downside for equity shareholders.
Value Destruction Theory - Agency CostsAnother theory for equity value destruction through debt-financed share repurchases relates to firms simply over-levering to try to enhance equity returns. Equity shareholders have incentives to authorize debt-financed share repurchase programs that are designed to lever up firms to enhance volatility in stock prices. This helps shareholders take advantage of the call option nature of equity.
An additional factor in increasing volatility in stock price relates to employee stock options mentioned above. Stock option compensation has aligned management interests with shareholders’ at the expense of bondholders. Since management has a call option on their own company, they have incentive to take on risky projects that have high upside. This incentive potentially motivates the introduction of volatility in the stock price so options will become exercisable. Debt holders bear downside risk in these instances.
Figure 6 (cont.)
Original Capital Structure (80% Debt/20% Equity)
Cost of Debt: 20%
t=0 t=1 Return
Assets 1,000,000,0001,300,000,000769,230,769
Debt 800,000,000960,000,000769,230,769
20%-4%
Equity 200,000,000340,000,000
–70%
-100%
Leverage Buyback Cap Structure (80% Debt/20% Equity)
Cost of Debt1: 7%
Cost of Debt2: 20%
t=0 t=1 Return
Assets 1,000,000,0001,300,000,000769,230,769
Debt1 500,000,000535,000,000480,769,231
7%-4%
Debt2 300,000,000360,000,000288,461,538
20%-4%
Equity 200,000,000405,000,000
–103%-100%
Figure 6
Original Capital Structure (50% Debt/50% Equity)
Cost of Debt: 7%
t=0 t=1 Return
Assets 1,000,000,0001,300,000,000769,230,769
Debt 500,000,000535,000,000535,000,000
7%7%
Equity 500,000,000765,000,000234,230,769
53%-53%
Assumptions:
Probability Up-State = 30%
Probability Down-State = 30%
Upside to equity returns is enhanced while downside is capped at equity value (-100%)

Capital Structure Engineering
6
Debt’s Impact On Firm Capital StructureCorporations fund themselves using the three following sources:1. Internally generated funds (i.e. cash flow from
operations); the cheapest source of funding.2. Debt issuance; the next cheapest source due to the tax
shield on interest expense.3. Equity issuance which is the most expensive source of
funding as there is no tax benefit. In addition, there is the implied cost of a lower stock price (due to the signaling effect1) that equity-friendly, stock option incented management prefers to avoid.
As mentioned, debt is more attractive to firms as a source of financing because of the tax shield. The advantage of the tax shield is it decreases the weighted average cost of capital (WACC), thereby increasing the value of equity. In our structured example in figure 7, a firm with a 50-50 capital structure can lower its WACC by almost 1.5% and significantly increase its equity value due to the tax shield from debt.
Trend Of Total Absolute Debt Of S&P 500As a whole, we believe that firms have been taking on too much debt and too much risk in order to enhance returns for shareholders. This has exposed them to financial distress which has not increased value of the firm, but has significantly destroyed value. The following chart shows absolute levels of debt and equity throughout the previous 11 years.
From 1998 - 2007, firms in the S&P 500, as a whole, have increased debt at a CAGR of 11% while market cap grew at only 4%. 2008 was the first time in the 11 years that total debt was reduced on an annual basis.
Source: Bloomberg, RBC GAM (US)€
WACC = DD+ E
{(1− tax) * rD}+ ED+ E
* rE
Figure 7: Advantage of Debt vs. Equity
Market Value Weight
Equity 50% 50%
Debt 50% 50%
Firm $1000 100%
Tax Shield No Shield
Cost of Debt 5.0% 5.0%
Tax @ 40% 40%
After-Tax Cost of Debt 3.0% 5.0%
Cost of Equity 8.0% 8.0%
WACC 5.5% 6.5%
Figure 8: Total Debt vs. Market
0
1,000,000
2,000,000
3,000,000
4,000,000
5,000,000
6,000,000
1998 2000 2002 2004 2006 2008
Total Debt
0
1,000,000
2,000,000
3,000,000
4,000,000
5,000,000
6,000,000
7,000,000
8,000,000
9,000,000
10,000,000
Market Cap
Total Debt Market Cap
1Issuance of new shares is considered a signal to the market from management that the company’s shares are overvalued.

Capital Structure Engineering
7
MethodologyQualifying Company UniverseWe focused our analysis on large, actively-traded firms that used leverage. As such, we dissected the S&P 500 Index and selected only those firms that have been in the Index for each of the past 11 years. We then excluded all firms that had no long-term or short-term debt on their balance sheets during the entire 44 quarters included in the period between Q1-98 and Q4-08. The 293 firms that satisfied our criteria largely reflect firms that have survived as S&P members over the period under study.
Because our firm universe only includes firms that have been in the S&P 500 over the entire 11 year period, there is survivorship bias that reinforces our thesis of value destruction through share repurchase. The tested firms are considered the “strongest” firms as the majority of firms that dropped out of Index are assumed to be weaker (exceptions may include firms acquired by others such as BUD).
Cost Of Debt We divided the qualifying universe into the appropriate S&P Industries and determined the historical quarterly yields by industry. We assigned each company a cost of debt based on its own corporate debt rating over the 11 year period. For example, the cash flows of AAA-rated consumer cyclical companies were discounted at 5.7% in Q1-08, 5.5% in Q2-08, while the cash flows of BBB rated companies were discounted at 6.5% during Q1-98 and 6.4% in Q2-98 (Figure 9). For those companies that only had short-term debt on their balance sheets, we used the yield on the 10-year Treasury (that corresponded to each time-period) as a proxy for the cost of debt. This enabled us to standardize our analysis while capturing the negative impact of higher leverage as demonstrated by increased borrowing costs and lower credit ratings.
Destruction Of Value Value creation or destruction was determined by calculating the current value at July 2, 2009 of shares repurchased between 1998 and 2008. For example, drug manufacturer Pfizer Inc. repurchased on average $1.3 billion in stock (total of $56 billion) over the past 44 quarters and paid a quarterly dividend to its shareholders. During this time, the company maintained an average quarterly debt burden of $2.9 billion which we are assuming was used to fund the share buyback and repurchase. Alternatively, if these shareholder friendly programs were not in place, debt would have been reduced by an equal amount. We then calculated the current value of this initiative and found that as of July 2, 2009, PFE had destroyed $30.2 billion in value. (Appendix 2)
Current Value = (Share repurchase + Dividends) * Future Value Factor
Future Value Factor = Nominal Value * (1 + i)n where “i” = the discount rate and n ≈ 90 days or 0.25 years
Figure 9: Historical Bond Yields: Consumer Cyclical Industry
AAA AA A BBB BB B CCC
3/31/1998 5.7 6.1 6.3 6.5 7.2 8.9 14.2
6/30/1998 5.5 6.0 6.2 6.4 7.4 8.9 14.0
9/30/1998 4.3 5.1 5.5 5.8 7.5 10.6 17.2
12/31/1998 4.6 5.3 5.7 6.3 7.9 10.7 19.2
3/31/1999 5.2 5.8 6.0 6.6 7.9 14.0 20.3
6/30/1999 5.7 6.5 6.8 7.1 8.6 10.8 24.1
9/30/1999 5.8 6.6 6.9 7.4 9.2 12.2 20.7
12/31/1999 6.4 7.1 7.4 7.8 9.5 13.8 21.2
Source: Barclays Capital Live
S1
44
2Only 2 firms: MSFT and BBBY were members for the entire duration but did not have any debt on their balance sheets and as such were excluded from our study.

Capital Structure Engineering
8
ResultsAccording to the data, 219 companies (75% of the companies surveyed) destroyed approximately $353 billion in value. This was the result we anticipated; however, our original hypotheses assumed that leverage was the main culprit in a firm’s value destruction. We expected to find that firms may have exceeded their optimal capital structure by levering up and thus exposing themselves to increased bankruptcy costs. If this were the case, increased leverage should have been associated with increased value destruction.
To test the relationship between value destruction and leverage, a regression of value destruction as a percent of enterprise value and debt/total capital was plotted for all 293 firms tested. The results show a R2 of nearly 0.0223 which implies a weak correlation of 0.149 between value destruction and leverage. The significance of the relationship was also tested resulting in rejecting the null hypothesis implying that the correlation of firm value destruction as a percent of enterprise value and debt to total capital is significantly different than zero, albeit very weak (see Appendix 3).
The same tests were conducted on an industry level with a goal of finding possible patterns and correlations in the data. Only one significant/semi-strong relationship was found in the industry-based data set. The Energy Industry data had a R2 of 0.258 which implies a correlation of 0.508; however, the number of observations is only 16.
Figure 10: Value Destroyed: Qualifying Universe Statistics
# Firms Total
($ Millions)
Value Destroyed-Increased Leverage & Destroyed Value-% Increased Leverage & Destroyed Value
219140
63.93%($525,489)
Value Destroyed-Increased Leverage & Destroyed Value-% Increased Leverage & Destroyed Value
7430
40.54%($172,151)
Total Value Created (Destroyed) ($353,338)
Source: Bloomberg
Figure 11: Value Destroyed: Top 10 Firms, Qualifying Universe
Value Destroyed
Debt/Total CapitalName 1998 2008 AbsolutePfizer Inc. -30,156 28.37 23.04 -5.34Intel Corp. -26,489 3.60 4.84 1.24General Electric Co. -26,111 79.34 82.18 2.84Citigroup Inc. -24,155 87.45 85.17 -2.28Bank of America Corp. -21,955 79.15 79.59 0.44Dell Inc. -21,612 0.00 13.58 13.58Merck & Co. Inc. -13,339 14.83 22.77 7.94Cisco Systems Inc. -9,852 0.00 16.69 16.69American Express Co. -8,770 73.61 85.36 11.75Home Depot Inc. -7,027 16.62 43.12 26.50Total ($ Millions) -189,467 38.30 45.63 7.34Source: Bloomberg
Figure 12: Value Destroyed: Top 10 Firms, Excluding Financials
Value Destroyed
Debt/Total CapitalName 1998 2008 AbsolutePfizer Inc. -30,156 28.37 23.04 -5.34Intel Corp. -26,489 3.60 4.84 1.24General Electric Co. -26,111 79.34 82.18 2.84Dell Inc. -21,612 0.00 13.58 13.58Merck & Co. Inc. -13,339 14.83 22.77 7.94Cisco Systems Inc. -9,852 0.00 16.69 16.69Home Depot Inc. -7,027 16.62 43.12 26.50Boeing Co. -6,972 34.46 120.81 86.35Ford Motor Co. -6,875 84.57 113.71 29.14Texas Instruments Inc. -6,815 18.01 0.00 -18.01Total ($ Millions) -155,248 27.98 44.07 16.09Source: Bloomberg
y = 0.2842x + 0.1189
R2 = 0.0223
-200%
-100%
0%
100%
200%
300%
400%
-80% -60% -40% -20% 0% 20% 40% 60% 80% 100% 120% 140%
Debt/Total Capital (Absolute Change 1998-2008)
Destruction as a % of EV
Figure 13: Value Destruction vs. Debt/Total Cap (293 Total)
Source: Bloomberg, RBC GAM (US)
Figure 14: Energy Value Destruction vs. Leverage
Source: Bloomberg, RBC GAM (US)
y = 0.4264x + 0.0846
R2 = 0.258
-20%
-10%
0%
10%
20%
30%
40%
50%
60%
-60% -50% -40% -30% -20% -10% 0% 10% 20% 30%
Debt/Total Cap (Absolute Change 1998-2008)
Value Dest as % of EV
Energy Linear (Energy)

Capital Structure Engineering
9
Conclusion/RecommendationsThe low correlation between value destruction and leverage suggests that there may not be an optimal capital structure. The manipulation of capital structure by firms through share repurchases has been a detriment as evidenced by the $353 billion in value destruction for the 293 firms under study. However, the group which used leverage did not destroy significantly more value than the group which made lower use of leverage. For the group that we studied, it appears that Miller & Modigliani were right – capital structure is only modestly relevant, suggesting that Managers would be better off focusing on maximizing the value of the assets they manage, rather than on financing techniques.
Firms risk focusing on short-term prosperity for shareholders versus maximizing the value of the firm as a going concern. The substantial effort put in by firm board members and management to increase shareholder value, manage earnings, and increase leverage to enhance financial ratios through share buybacks has not added value, and at the margin appears to have actually diminished firm value. Our conclusion from viewing these results is that firms should focus on managing the operational aspects of the firm relating to capital structure rather than engineering a “shot in the arm” to equity value. We do not believe this recommendation is in conflict with shareholder interests in any way. The primary beneficiaries of balance sheet engineering are the bankers, who generate fees from their recommendations in this regard, and to a lesser extent, aggressive management teams which benefit from the increased volatility.
We also believe there is significantly more room for studying this topic. We have only addressed a limited sample of very large, primarily investment grade companies, and have thus only evaluated shifts in capital structure within a fairly narrow range. We believe that the LBO boom of the past several years, which takes the leveraged share repurchase to its most extreme level, has actually resulted in value destruction on a much greater scale. That is beyond the scope of this investigation, but we think this topic is worthy of continued study.

Capital Structure Engineering
10
Appendix 1: Hypothesis Test - Value Destruction
A hypothesis test was conducted on the 293 firms to determine if their change in value was statistically less than zero. It was determined that we can reject the null hypothesis stating that firm value is greater than or equal to zero. We conclude that firm value was less than zero based on a .05 significance level.
Hypothesis Test
Ho M >= 0
Ha M < 0
Sample Size (n) 293.0
Sample Mean -1205.9
Sample Standard Deviation 5740.2
Standard Error 335.3
Z-Stat -3.6
Lower Critical Value (95%) -1.645
Decision Reject Ho
Source:

Capital Structure Engineering
11
Pfizer Inc.
Date 3/31/98 6/28/98 3/30/08 6/29/08 9/28/08 12/31/08 7/2/09
Repurchased Amount -201.00 -122.00 0.00 -500.00 0.00 0.00
Divident Per Share 0.06 0.06 0.32 0.32 0.32 0.32
Weighted Avg. Price Per Share 33.02 37.31 20.58 17.34 18.54 17.77
Shares Repurchased 6.09 3.27 0.00 28.84 0.00 0.00
Discount Rate 6.07 5.93 4.03 4.65 4.88 3.62 3.62
Tax Rate 40.00 40.00 40.00 40.00 40.00 40.00 40.00
Tax Adjusted Discount Rate 3.64 3.56 2.42 2.79 2.93 2.17 2.17
FVF 1.38 1.37 1.02 1.02 1.01 1.01 1.00
FV Repurchase Price -45.73 -51.23 -21.09 -17.65 -18.74 -17.87
FV Returns 7.23 7.14 0.33 0.65 0.98 1.30
NFV/Share Repurchased -38.50 -44.09 -20.77 -16.99 -17.76 -16.57
Total Repurchase NFV -234.35 -144.15 0.00 -490.09 0.00 0.00
Current Share Price 14.55
Value of Repurchase -19063.23 -25023.47 -22772.89 -24207.79 -30155.96
Source:
Appendix 2: Determining Destruction Of Value

Capital Structure Engineering
12
Appendix 3: Hypothesis Test - Value Destruction vs. Debt/Total Cap
Strength of Relationship Between Value Destruction as % of EV and Debt/Total Cap Abs. Increase
Tested S&P Universe
Basic Materials
Consumer Cyclical
Consumer Non-Cyclical Energy Financial Industrial Technology Utilities
CorrelationCoefficient of Determination (R^2)
0.1490.0222820
0.3220.103
0.0260.001
-0.0310.001
0.5080.258
0.2220.049
0.2160.046
0.1800.032
0.2130.045
Significance of Relationship
Null Hypothesis Correlation of Value Destruction as % of EV and Debt/Total Capital = 0
Alternative Hypothesis Correlation of Value Destruction as % of EV and Debt/Total Capital = 0
Number of Observations 293 19 46 56 16 38 43 51 24
Degrees of Freedom 291 17 44 54 14 36 41 49 22
T-Statistic 2.58 1.40 0.17 -0.23 2.21 1.37 1.41 1.28 1.02
Critical Value (95%) 1.97 2.11 2.02 2.00 2.14 2.03 2.02 2.01 2.07
Null Hypothesis Decision Reject Do Not Reject Do Not Reject Do Not Reject Reject Do Not Reject Do Not Reject Do Not Reject Do Not Reject
Source:

Capital Structure Engineering
13
12/31/99 3/31/00 6/30/00 9/30/00 12/31/00 3/31/01 6/30/01 9/30/01 12/31/01 3/31/02 6/30/02 9/30/02 12/31/02 3/31/03 6/30/03 9/30/03 12/31/03 3/31/04 6/30/04 9/30/04 12/31/04 3/31/05 6/30/05 9/30/05 12/31/05 3/31/06 6/30/06 9/30/06 12/31/06AA Equity 811.01 375.95 -101.11 -410.48 261.36 337.53 604.34 -430.54 192.15 403.77 -218.40 -1912.04 -1468.69 -1879.53 -1139.58 -1021.44 433.76 23.88 -213.14 -140.53 -389.94 -526.00 -1065.70 -1279.70 -644.92 -524.33 -305.35 -888.42 -629.57AAPL Equity -22.51 10.43 55.04 2.20 -15.06 -175.75 -142.60 -132.76 -171.86 -140.38 -134.97 -162.98 -175.89 -178.41 -176.82 -156.60 -149.22 -148.49 -110.89 -74.58 -50.65 103.29 228.80 174.70 346.41 561.00 462.74 363.40 707.55ABT Equity -225.95 -246.98 -85.69 -14.34 -1.03 -56.95 4.19 87.42 228.05 125.56 -325.72 -274.25 -311.64 -344.93 -139.48 -183.90 -45.09 -232.69 -134.91 -71.02 131.63 124.26 258.25 -159.77 -332.53 -96.51 -24.46 494.50 523.12ADBE Equity 813.09 1348.98 2376.09 2627.16 2674.76 230.70 960.42 518.48 414.98 836.50 755.17 -529.57 232.94 24.25 691.34 1002.08 1212.91 807.02 1610.90 1677.58 3248.80 3320.05 3469.64 2254.42 3926.77 4747.59 2408.24 3262.90 4977.21ADI Equity 101.30 268.58 483.78 407.69 376.07 343.28 254.31 267.69 197.39 219.82 151.13 33.29 70.71 26.95 145.17 211.38 273.54 317.55 262.51 218.54 208.67 109.06 76.69 207.31 64.22 226.31 147.85 -115.61 -180.11ADM Equity -95.52 -160.57 -165.33 -224.09 -250.39 -284.93 -6.52 -80.36 -49.25 -75.87 15.74 -3.06 -84.34 -109.20 -117.72 -224.72 -72.35 -56.84 101.81 222.60 209.15 229.00 650.92 810.06 565.33 823.86 835.15 1560.99 2220.81ADP Equity 17.54 19.85 57.84 5.58 39.17 151.63 124.77 -54.18 -134.24 -305.83 153.21 88.04 -485.94 -918.89 -632.08 -1170.91 -962.51 -834.40 -570.82 -405.85 -417.79 -473.89 -195.92 -150.58 -428.09 -357.33 -37.34 -70.77 -118.64ADSK Equity -14.30 -100.20 -120.26 -169.72 -112.14 -77.88 -316.80 -312.38 -56.67 -88.01 -46.87 -135.57 28.89 -65.87 -333.17 -379.62 -221.86 -188.14 -221.52 1.50 349.95 819.30 1232.74 2016.88 2413.12 2769.01 3137.62 4691.10 4050.75AEE Equity 0.00 0.00 0.00 0.00 0.00 0.00 0.00 0.00 0.00 0.00 0.00 6.94 7.12 4.51 9.65 8.43 18.19 18.46 10.20 18.29 29.29 26.26 43.93 38.66 32.50 28.87 30.57 37.01 39.36AEP Equity 1.62 0.81 1.04 5.44 11.90 11.42 10.93 8.74 8.99 11.42 5.70 -3.70 -5.33 -10.86 -1.82 -1.88 1.06 7.70 5.10 4.91 12.20 12.47 57.58 101.17 60.91 17.03 16.08 55.09 148.38AES Equity 0.00 0.00 0.00 0.00 0.00 0.00 0.00 0.00 -7.96 -15.67 -19.63 -22.49 -22.02 -21.22 -18.43 -17.43 -15.32 -16.31 -14.92 -14.83 -11.02 -8.22 -8.15 -8.25 -8.91 -7.62 -6.02 -4.09 -2.47AFL Equity 0.00 0.00 0.00 0.00 0.00 0.00 0.00 0.00 0.00 0.00 0.00 0.00 0.00 0.00 0.00 0.00 0.00 -15.97 -20.75 -38.75 -45.47 -82.21 -16.87 3.15 12.77 -23.64 -1.60 -27.22 -30.03AGN Equity -35.05 -43.92 105.42 162.30 266.59 70.15 158.74 0.02 71.26 -61.92 -33.44 -174.64 -117.65 27.90 139.17 140.70 109.58 202.98 294.75 107.30 158.56 -0.24 232.00 325.47 595.70 601.45 559.33 656.45 790.59AIG Equity 0.00 0.00 0.00 0.00 0.00 0.00 0.00 0.00 0.00 0.00 0.00 0.00 0.00 0.00 0.00 0.00 0.00 -13.04 -52.04 -86.06 -100.96 -191.49 -165.58 -129.19 -72.75 -99.62 -183.28 -99.63 -34.29ALL Equity 0.00 0.00 0.00 0.00 0.00 0.00 0.00 0.00 0.00 0.00 0.00 0.00 0.00 0.00 0.00 0.00 0.00 -8.58 -26.21 -30.42 27.32 41.84 231.65 -74.25 -166.33 -336.07 -148.05 554.12 775.60AMAT Equity 174.24 401.86 789.44 482.60 182.67 102.48 203.78 82.09 -125.26 -23.14 137.49 -316.62 -349.84 -398.50 -346.77 -100.39 -0.80 71.29 -181.99 -304.58 -426.97 -448.74 -675.00 -122.71 -548.19 142.94 -292.34 -1006.04 -609.87AMD Equity 0.00 0.00 0.00 0.00 0.00 0.00 0.00 -36.07 28.97 12.46 -34.16 -66.31 -61.96 -62.87 -62.02 -18.95 13.07 22.12 21.03 -6.47 79.68 25.16 36.80 84.15 155.97 202.52 101.17 107.89 65.50AMGN Equity 2038.13 1863.92 2408.46 2443.31 2065.83 1529.49 1614.26 1351.42 1066.96 1208.42 -922.58 -969.11 -132.63 983.69 1909.08 1753.88 1215.59 578.04 -241.68 40.96 1443.09 -123.94 341.62 5197.91 5007.54 3246.38 903.64 2796.62 1754.65AOC Equity 0.00 0.00 0.00 0.00 0.00 0.00 0.00 0.00 0.00 0.00 0.00 0.00 0.00 -0.33 0.91 -0.23 0.83 2.17 2.29 2.49 0.80 0.49 1.19 -0.69 4.26 -0.29 -69.17 -94.54 -92.84APA Equity 0.29 12.21 27.94 29.26 47.80 23.98 11.59 -6.69 27.66 46.88 47.08 51.37 45.14 68.80 78.74 91.55 126.74 141.56 143.02 183.14 187.06 246.55 272.64 335.05 290.88 271.82 277.27 234.33 263.97APC Equity 0.00 0.00 0.00 0.00 0.00 0.00 -15.43 -47.74 -12.28 -23.08 -59.70 -84.00 -67.27 -76.60 -84.02 -101.03 -49.90 -46.60 -29.97 -8.62 -125.74 125.15 310.01 689.72 574.04 795.43 556.34 278.62 274.72APD Equity -138.55 -90.73 -133.88 -113.01 -59.07 -7.76 -41.39 44.57 -48.38 62.63 120.85 103.83 -6.51 5.89 -9.24 -6.08 40.06 131.52 98.66 128.05 153.52 201.09 263.50 210.25 103.48 194.48 361.42 284.01 343.15ATI Equity -144.17 -186.84 -224.30 -236.21 -301.36 -249.57 -229.20 -345.25 -261.67 -265.04 -282.09 -486.48 -500.22 -571.30 -489.21 -490.40 -339.05 -362.61 -232.45 -231.08 -150.26 -99.10 -141.70 57.13 168.00 722.99 921.74 762.91 1399.59AVP Equity -84.82 -166.57 191.72 135.06 353.20 83.50 277.85 273.56 281.61 514.60 442.00 246.69 499.36 621.52 797.44 877.40 970.91 1269.78 1915.39 1720.73 1325.58 1668.81 1254.29 270.13 435.11 707.80 691.89 675.17 927.27AVY Equity 88.68 19.38 52.01 -85.93 -37.67 -46.45 -55.49 -97.67 -12.41 37.03 51.75 15.77 19.41 20.35 -87.07 -74.71 -24.07 37.97 53.61 54.61 25.22 42.15 -40.60 -45.92 -18.38 13.57 8.27 26.54 100.36AXP Equity 0.00 0.00 0.00 0.00 0.00 0.00 0.00 0.00 0.00 0.00 0.00 0.00 0.00 0.00 0.00 0.00 0.00 -140.12 -273.17 -348.05 -203.56 -626.42 -490.08 -232.43 -114.54 -67.96 -43.80 269.10 1049.26AZO Equity -163.05 -184.61 -294.00 -387.82 -495.65 -371.26 -477.85 -225.32 462.72 1346.10 1307.07 1815.51 1541.85 2256.10 1011.96 2245.16 2471.15 2535.99 2225.77 1795.43 1117.85 2028.67 2658.70 1823.07 2712.70 2057.12 2878.33 2384.68 1877.48BA Equity -298.02 -667.23 -269.24 2120.66 2282.32 821.78 673.55 -3430.01 -2263.19 -398.26 -1075.07 -3289.18 -3548.39 -5105.72 -3223.43 -3254.98 -1631.40 -1886.80 131.72 208.11 309.58 1701.11 3407.25 3760.15 4388.59 6390.00 7369.55 6608.96 9322.24BAC Equity 0.00 0.00 0.00 0.00 0.00 0.00 0.00 0.00 0.00 0.00 0.00 0.00 0.00 0.00 0.00 0.00 0.00 60.21 199.85 353.96 802.31 429.62 812.28 -1.47 941.38 865.15 1828.84 4186.80 4070.06BAX Equity -21.82 -28.42 2.05 18.62 82.53 129.71 158.45 243.61 203.10 325.28 -9.82 -368.42 -480.08 -1040.75 -537.43 -363.55 -223.21 -200.92 117.50 -78.85 137.20 100.20 375.20 615.25 419.75 495.35 293.34 1160.30 1268.63BBBY Equity 0.00 0.00 0.00 0.00 0.00 3.05 3.73 5.48 7.81 11.12 10.42 12.76 13.22 13.89 12.30 14.07 12.95 18.25 18.91 18.43 17.88 15.47 15.53 18.09 15.37 49.68 56.49 74.83 0.43BBT Equity 0.00 0.00 0.00 0.00 0.00 0.00 0.00 0.00 0.00 0.00 0.00 0.00 0.00 0.00 0.00 0.00 0.00 2.42 7.78 16.54 33.16 -0.15 13.45 -4.41 35.09 -30.36 29.79 134.98 137.25BBY Equity 0.68 -18.79 -1.83 -49.49 -143.63 -32.03 47.93 -272.64 -221.62 -115.10 -70.26 25.38 -3.89 9.13 -280.35 -205.03 -191.96 -81.22 73.33 177.81 62.29 51.75 -32.04 149.78 19.23 53.10 345.02 475.27 570.18BCR Equity -16.47 -126.71 -45.77 -95.35 -57.54 -72.99 24.31 -27.45 86.77 38.94 12.06 -9.22 28.15 77.64 154.38 149.72 251.98 417.88 583.23 586.67 741.03 831.10 796.12 779.03 776.56 818.46 952.05 990.27 1205.27BDK Equity -121.64 -277.53 -268.04 -339.57 -280.79 -314.70 -266.41 -429.69 -293.85 -137.15 -98.42 -187.97 -208.50 -360.19 -186.00 -243.51 -47.69 99.05 208.58 500.46 831.31 608.04 846.98 649.92 770.73 770.67 651.15 471.29 478.31BDX Equity -2.97 -5.03 -4.53 -2.41 -5.69 9.07 10.34 10.92 13.17 2.86 12.58 -6.88 -50.26 -34.03 1.60 48.79 -0.91 93.99 227.92 281.03 273.37 413.91 453.60 258.70 234.61 527.65 581.46 548.53 970.40BEN Equity 0.00 0.00 0.00 0.00 0.00 0.00 0.00 0.00 0.00 0.00 0.00 0.00 0.00 0.00 0.00 0.00 0.00 -1.14 -0.47 -4.72 -0.62 8.36 2.79 27.07 47.23 80.81 78.58 -22.31 242.31BF/B Equity 2.03 -5.27 -1.71 -10.11 -10.33 -12.94 -6.64 -3.02 -6.66 -1.96 -9.77 -4.30 7.61 -3.01 2.25 -7.76 -28.42 -14.42 34.61 109.85 111.54 101.52 76.86 129.43 246.33 305.14 377.24 507.21 562.45BHI Equity 0.72 5.41 6.79 9.22 11.51 8.64 7.33 4.78 8.79 9.41 7.25 2.28 5.31 0.94 2.21 -13.92 -14.36 15.92 25.09 70.62 64.04 75.95 125.14 193.04 190.16 248.17 312.16 -36.86 159.64BIG Equity -45.25 -27.17 -47.03 -44.84 -48.59 -50.47 -50.66 -51.33 -50.58 -51.85 -50.17 -55.91 -52.23 -46.45 -46.22 -44.59 -49.86 -49.95 -46.60 -46.86 -47.95 -47.91 -62.53 -62.63 -71.45 -77.89 -57.24 -71.78 -51.87BLL Equity -42.71 -58.38 -66.29 -71.71 -12.37 -27.48 -17.62 48.36 111.59 247.04 156.85 289.24 288.23 355.57 197.19 334.65 408.81 554.82 583.14 653.54 875.38 797.63 548.41 568.17 694.85 878.31 559.06 723.44 868.47BMC Equity -54.84 -2.10 54.23 83.92 -17.45 -65.00 -142.39 -186.56 -141.49 -117.40 -270.43 -218.43 -171.24 -239.64 -341.89 -229.78 -304.15 -268.84 -375.80 -183.35 -153.89 -205.11 -336.69 -200.16 -380.29 -244.27 -91.86 -122.34 -60.06BMS Equity -1.75 0.41 -3.81 -7.03 -4.19 -5.29 13.25 11.30 38.38 50.87 33.91 37.37 38.57 18.12 31.56 24.72 38.95 44.98 56.26 47.25 62.47 73.14 49.05 36.87 60.83 88.13 79.30 98.14 106.68BMY Equity -197.20 -569.70 -685.69 -751.24 372.60 -903.10 -1560.07 -923.14 -1455.91 -2803.21 -4560.08 -4846.68 -4942.77 -5172.75 -4398.88 -4620.44 -4236.76 -4806.16 -4765.46 -4877.40 -4620.81 -4650.40 -4696.09 -4824.65 -4955.92 -4736.59 -4596.46 -4713.84 -4540.24BNI Equity -274.42 -365.24 -322.01 -467.25 110.74 288.81 250.67 -137.50 127.38 282.50 277.18 -456.95 -204.99 -337.10 98.37 120.61 564.32 435.47 877.34 1334.85 2514.67 3381.45 2464.42 4229.35 5785.28 7762.92 7079.49 6101.27 6180.02BSX Equity -49.49 -77.70 -84.35 -151.52 -219.17 -85.57 -141.39 -83.47 -7.87 6.11 94.17 119.14 338.69 271.58 733.27 736.41 1016.01 1365.36 1359.68 1182.51 880.98 410.06 172.71 -200.36 -87.98 -212.31 -819.20 -1019.48 -783.49BXP Equity 0.00 0.00 0.00 0.00 0.00 0.00 0.00 0.00 1.71 1.82 1.85 1.65 1.62 1.70 2.10 2.07 2.44 2.86 2.55 2.94 3.59 3.30 3.95 4.04 4.53 6.38 6.09 7.32 8.17C Equity 0.00 0.00 0.00 0.00 0.00 0.00 0.00 0.00 0.00 0.00 0.00 0.00 0.00 0.00 0.00 0.00 0.00 -4.45 -58.53 -70.49 35.15 -41.32 45.30 -65.36 548.66 167.64 538.50 1084.48 3808.93CA Equity -693.22 -130.70 60.46 361.17 26.15 -217.06 -1119.34 -1384.77 -1055.03 -646.20 -1139.64 -673.17 -1368.70 -1673.06 -2043.95 -1804.77 -1798.18 -1249.60 -1013.11 -930.72 -967.93 -905.16 -1018.67 -702.72 -990.25 -962.39 -967.53 -955.06 -1059.77CAG Equity -51.99 -61.11 -66.15 -112.64 -72.38 -95.26 -59.41 -92.41 -89.92 -77.18 -71.76 -58.03 -39.74 -11.99 -42.63 -71.07 -81.83 -104.58 -57.68 -12.36 28.84 -43.03 -0.75 3.14 -29.51 -209.67 -230.71 -275.33 -202.79CAH Equity -17.63 -24.48 -29.57 -117.59 91.82 224.74 304.38 229.62 302.14 367.42 220.59 324.62 136.30 74.44 -59.80 -221.25 79.85 -333.10 -131.58 200.09 83.57 -1399.16 -488.22 -669.01 -561.66 -154.00 205.69 610.73 -274.58CAT Equity -55.27 -138.92 -249.59 -238.14 112.59 38.98 202.23 51.17 278.12 413.83 184.40 -171.05 72.44 183.25 369.30 743.94 1141.93 994.67 986.68 1031.98 1686.69 1425.59 1601.98 2644.87 2514.00 4041.66 4248.36 3071.93 2314.21CB Equity 0.00 0.00 0.00 0.00 0.00 0.00 0.00 0.00 0.00 0.00 0.00 0.00 0.00 0.00 0.00 0.00 0.00 0.00 0.00 0.00 0.00 0.00 0.00 0.00 -9.94 -29.95 -30.96 -43.20 -19.49CBE Equity -253.65 -410.22 -478.69 -403.37 -95.25 -472.42 -270.21 -210.54 -400.53 -195.74 -254.83 -576.16 -364.76 -380.70 -183.64 50.05 389.96 348.98 420.16 424.60 774.14 895.12 610.07 795.51 953.89 1550.31 1780.22 1453.50 1689.54CCE Equity -273.17 -256.44 -398.56 -408.76 -327.41 -358.63 -398.23 -437.61 -324.47 -329.33 -230.35 -261.85 -244.95 -325.36 -349.72 -328.61 -242.98 -169.46 -34.70 -331.59 -272.81 -282.00 -236.23 -312.50 -322.96 -286.93 -289.71 -272.91 -284.08CCL Equity 0.11 -0.40 -27.87 -115.58 -31.55 292.47 140.08 236.12 70.64 118.40 213.59 25.52 134.24 -27.72 213.15 336.18 360.04 652.24 595.97 681.26 914.20 947.44 903.31 787.87 946.55 842.75 369.30 447.72 856.80CEG Equity -9.92 23.92 40.32 246.40 175.18 174.57 151.03 -69.70 -38.06 14.80 -8.48 -62.89 -22.36 -22.78 55.96 73.68 115.55 124.93 100.06 124.69 171.04 266.35 341.74 391.27 337.78 304.73 298.45 360.74 474.54CI Equity 0.00 0.00 0.00 0.00 0.00 0.00 0.00 0.00 0.00 0.00 0.00 0.00 0.00 0.00 0.00 0.00 0.00 0.00 -45.22 -82.27 -13.61 22.40 210.81 296.45 116.14 534.30 -439.49 127.31 760.37CINF Equity 0.00 0.00 0.00 0.00 0.00 0.00 0.00 0.00 0.00 0.00 0.00 0.00 0.00 0.00 0.00 0.00 0.00 -0.37 0.12 -0.83 -1.13 -2.09 -6.21 -2.01 4.24 -6.59 16.25 21.79 6.22CL Equity 346.74 137.52 155.58 -243.69 404.16 -83.03 127.37 -10.76 -15.60 -79.87 -559.01 -317.58 -485.26 -289.88 10.66 -179.81 -744.63 -258.69 60.88 -1307.57 -689.48 -581.01 -801.28 -551.53 -246.09 49.04 373.83 665.98 1087.47CLX Equity 8.51 -40.12 12.66 -67.06 33.21 -9.40 -72.07 -85.55 -58.44 -36.30 -1.73 46.56 -5.86 -44.16 -24.81 159.36 18.26 119.22 227.13 236.85 442.21 432.94 524.10 843.59 273.52 222.68 364.67 625.07 709.62CMA Equity 0.00 0.00 0.00 0.00 0.00 0.00 0.00 0.00 0.00 0.00 0.00 0.00 0.00 0.00 0.00 0.00 0.00 1.47 2.72 23.53 34.70 -5.95 20.26 26.19 -8.41 11.07 -88.45 -6.19 25.14CMI Equity -3.46 -14.94 -27.62 -25.96 -16.53 -17.70 -12.88 -28.39 -13.97 -1.33 -23.06 -35.93 -30.45 -35.83 -17.89 -3.51 1.73 12.12 23.63 35.84 55.00 38.06 37.72 63.55 60.81 86.83 122.34 116.61 111.25CMS Equity -133.32 -214.29 -175.68 -199.95 -124.53 -158.38 -191.14 -355.45 -272.68 -310.91 -593.16 -647.02 -619.65 -746.87 -652.45 -669.44 -682.14 -657.48 -649.54 -634.72 -582.46 -452.51 -333.45 -261.55 -370.21 -448.56 -449.74 -368.34 -249.41CNP Equity -5.19 -3.29 31.13 108.07 95.77 102.55 39.29 -86.51 -70.75 -132.67 -830.43 -1372.16 -1350.00 -1423.72 -1334.11 -1239.48 -1193.16 -1027.13 -1032.47 -1129.48 -1039.41 -971.58 -864.69 -712.33 -899.93 -972.32 -931.03 -757.42 -546.33COF Equity 0.00 0.00 0.00 0.00 0.00 0.00 0.00 0.00 0.00 0.00 0.00 0.00 0.00 0.00 0.00 0.00 0.00 0.00 0.00 -0.03 -2.93 -4.92 -4.30 -4.34 -7.71 -12.16 -8.69 -13.86 -16.81COP Equity 41.89 35.39 90.12 225.43 158.59 129.37 150.58 114.42 196.84 219.97 188.98 -15.05 17.40 105.21 127.03 120.86 307.52 373.33 480.03 586.92 657.36 988.68 1129.13 1642.71 973.95 1314.64 1454.35 980.69 1957.67COST Equity 0.00 0.00 0.00 -0.19 -23.84 -23.85 -2.42 -21.17 -15.97 -5.20 6.39 -8.41 -28.39 -32.68 -43.13 -24.10 -32.57 -26.56 -16.84 -21.54 -4.02 12.04 8.46 -1.97 -34.60 33.62 -2.39 145.43 -159.04CPB Equity -471.28 -454.00 -1053.69 -1231.88 -1212.54 -1111.60 -990.09 -1085.51 -1311.29 -1241.87 -1213.41 -1291.83 -1623.79 -1613.99 -1517.72 -1662.87 -1525.35 -1389.06 -1363.03 -1267.49 -1412.86 -1326.00 -1173.14 -1141.63 -1038.10 -1182.48 -1113.78 -951.84 -566.01CPWR Equity -93.63 -252.22 -344.90 -149.87 -433.91 -622.08 -655.16 -689.43 -634.44 -563.84 -660.76 -595.44 -580.48 -697.75 -747.26 -719.63 -740.26 -702.26 -708.91 -697.65 -671.75 -686.38 -712.76 -690.02 -675.83 -679.08 -637.25 -654.57 -688.99CSC Equity 0.00 0.00 0.00 0.00 0.00 0.00 0.00 0.00 0.00 0.00 0.00 0.00 0.00 0.00 0.00 0.00 0.00 0.00 0.00 0.00 0.00 0.00 0.00 0.00 -0.21 -24.51 -10.72 7.66 33.38CSCO Equity 0.00 0.00 0.00 0.00 0.00 0.00 0.00 0.00 0.00 -84.16 -107.93 -342.83 -682.03 -918.02 -671.21 -927.95 828.50 960.05 5790.39 672.50 249.39 -1930.63 -3556.71 -4912.83 -2290.47 -5885.07 -3124.38 700.26 -5079.97CSX Equity -48.10 -66.89 -71.49 -71.24 -64.65 -33.61 -24.54 -45.09 -28.66 -15.43 -27.05 -58.37 -55.38 -53.36 -48.98 -51.21 -25.04 -48.95 -37.34 -32.75 -6.82 -0.14 4.74 18.82 36.44 73.34 103.61 58.98 94.76CTL Equity 0.00 0.00 0.00 0.00 0.00 0.00 0.00 0.00 0.00 0.00 0.00 0.00 0.00 0.00 0.00 0.00 0.00 -22.19 -31.30 5.86 4.33 -36.15 -72.46 -62.96 -115.70 -10.28 -94.54 7.30 191.40CTSH Equity 0.00 0.00 0.00 0.00 0.00 0.00 0.00 0.00 0.00 0.00 0.00 0.00 0.00 0.00 0.00 0.00 0.00 0.00 0.00 0.00 0.00 0.00 0.00 0.00 0.00 0.00 0.00 0.00 0.00CTX Equity -12.04 -11.58 -20.79 -31.54 -37.85 -37.43 -17.36 -1.15 6.76 4.42 -15.25 47.01 34.04 47.69 4.74 21.22 37.27 120.72 112.74 218.46 267.19 165.99 216.69 324.57 301.10 447.07 360.52 399.03 212.07CTXS Equity 0.00 0.00 0.00 -34.63 -21.85 -53.53 70.37 -88.73 -59.33 -164.44 -389.83 -397.93 -172.86 -145.18 158.67 226.71 174.79 207.50 140.00 10.78 350.38 312.70 211.77 381.73 586.79 1105.63 1234.07 1032.86 449.34CVS Equity 0.00 -31.06 -39.04 -13.74 43.75 35.32 -49.47 -98.98 -123.37 -87.90 -118.31 -138.37 -170.87 -165.11 -140.84 -114.66 -75.09 -85.75 -28.02 -16.19 -1.90 53.32 103.08 103.13 64.24 119.92 131.37 157.18 137.17CVX Equity 23.62 64.63 5.05 71.78 67.02 112.05 172.73 31.47 197.92 221.64 154.26 -382.52 -461.38 -506.55 -294.44 -319.29 104.80 132.92 326.43 770.26 701.66 1225.80 993.14 2021.86 956.48 1149.31 1803.94 2195.36 3921.21D Equity 124.91 632.85 921.93 1707.63 2149.02 2022.67 1792.21 1716.92 1794.40 2086.63 2102.82 1308.33 1566.49 1613.55 2109.47 1975.38 2102.70 2110.90 2034.53 2164.91 2331.52 2696.86 2656.23 3435.47 2869.92 2391.35 2731.63 2851.38 3267.65DD Equity -46.21 -321.05 -545.79 -613.12 -358.92 -635.37 -385.40 -800.56 -528.48 -167.16 -414.90 -1200.60 -651.32 -918.38 -687.69 -832.29 -330.59 -645.69 -461.53 -604.10 -19.44 180.98 -610.55 -1092.43 -763.88 -822.19 -922.58 -691.69 358.50DE Equity -249.16 -88.54 -165.91 -205.89 -248.08 -97.18 -148.42 -124.66 -227.64 -96.61 -68.35 -136.34 -29.13 -127.82 -86.37 60.54 269.08 316.08 443.12 317.75 243.18 465.51 262.29 626.01 162.49 595.86 1236.81 521.83 1209.03DELL Equity 4287.43 2960.13 2859.87 2562.53 2068.36 4343.03 2828.46 -731.49 -1412.55 -1910.57 -1144.97 -2496.96 -1772.33 -2902.52 -3196.06 -1153.90 -3643.28 -956.58 913.74 2230.74 753.31 1456.85 1600.01 1122.88 4787.42 525.94 4505.79 -2838.90 -4653.70DGX Equity 7.42 13.57 38.42 76.83 95.95 52.44 102.49 81.08 97.14 116.24 120.66 80.13 72.16 76.81 82.63 60.49 86.65 134.96 111.57 130.14 162.36 283.57 304.77 207.36 216.94 204.79 508.02 569.71 219.53DHI Equity 2.34 4.68 5.11 7.98 20.93 37.47 41.57 47.52 39.25 78.81 95.53 100.03 63.07 56.26 63.97 123.90 147.30 226.38 305.99 221.44 271.53 358.41 344.20 469.45 447.61 433.98 395.38 244.87 254.23DHR Equity -0.98 -26.19 -28.37 -27.53 3.87 -19.32 -16.39 -34.83 -9.65 11.15 0.95 -16.31 -0.39 -1.00 5.76 16.55 52.06 56.59 70.01 74.67 99.95 80.59 73.76 72.55 68.18 137.71 142.72 177.69 214.97DIS Equity -17.46 -30.17 11.60 -1.81 -15.15 -129.40 -140.09 -131.86 -405.00 -251.77 -115.05 -379.12 -602.54 -533.42 -481.94 -308.24 -289.17 -102.93 1.40 28.47 -178.10 222.11 249.88 -122.88 -293.57 -377.46 422.66 794.07 981.88DNR Equity 0.00 0.00 0.00 0.00 0.00 0.00 0.00 0.00 0.00 0.00 0.00 0.00 0.00 0.00 0.00 -0.15 -0.07 -0.10 0.12 0.57 0.74 2.16 3.16 6.26 4.50 10.94 10.50 8.03 7.02DO Equity 21.42 55.91 39.16 60.08 56.33 54.90 21.41 -21.65 19.40 27.01 10.88 -57.05 -38.72 -57.55 -42.82 -60.80 -42.84 -6.23 -10.57 81.09 157.97 255.11 294.66 382.71 462.17 663.92 606.28 483.76 567.52DOV Equity 28.61 83.93 -64.78 73.87 -116.13 -177.53 -137.80 -315.86 -144.88 -56.50 -194.00 -413.60 -326.22 -432.09 -302.72 -181.31 -80.70 -100.67 -28.19 -99.72 -24.81 -122.23 -158.94 -53.46 -59.13 140.06 154.70 110.40 150.05DOW Equity 516.86 301.17 -17.02 -234.71 226.58 22.76 105.90 61.00 120.16 72.45 126.94 -153.39 -58.31 -127.47 0.45 61.44 405.13 362.09 377.94 546.00 731.12 737.90 540.07 396.11 498.19 362.92 289.23 291.48 342.30DRI Equity 3.86 -88.59 -114.80 -234.56 -74.91 -118.10 203.47 -8.23 314.71 279.41 392.08 917.55 687.53 646.25 391.43 26.55 116.49 333.51 219.38 429.18 460.85 324.13 959.79 929.84 1472.32 1325.06 1844.55 2579.39 1859.62DTE Equity -14.75 -3.21 11.53 53.09 57.64 83.94 156.46 117.66 115.32 183.91 157.90 75.04 202.01 48.00 46.13 12.37 62.89 95.33 76.70 114.42 138.11 184.89 216.10 193.15 135.69 75.83 83.44 104.05 248.74DUK Equity 38.14 45.68 62.60 162.07 164.08 156.18 132.94 120.65 141.72 126.59 68.44 0.67 10.18 -50.10 17.14 3.84 44.08 74.75 57.23 108.27 170.41 308.26 408.90 367.57 283.16 406.80 422.35 490.70 721.72ECL Equity -0.12 -7.33 -13.25 -33.28 14.28 -1.48 -12.89 -50.33 -14.30 29.32 33.44 -8.32 62.19 58.40 65.06 47.98 97.04 119.34 208.71 202.08 304.67 226.67 199.49 190.73 336.78 406.51 493.21 589.28 686.93ED Equity -4.15 -100.11 -68.13 25.24 140.01 93.39 152.59 179.10 177.61 218.22 206.33 177.91 247.14 133.20 259.80 193.36 256.72 282.76 165.14 228.21 277.56 229.16 355.54 400.14 342.59 269.52 289.54 341.38 387.46EFX Equity -200.19 -182.95 -165.62 -162.88 -135.88 -106.51 -41.59 -39.99 7.44 127.88 52.63 -80.10 -48.96 -127.64 31.01 -72.86 -20.00 14.77 -22.21 25.07 78.13 167.96 346.64 297.28 421.34 388.20 262.39 355.55 537.01EIX Equity -289.09 -591.98 -468.67 -548.21 -788.15 -950.30 -1007.20 -916.37 -767.73 -658.00 -640.43 -1180.31 -993.05 -783.92 -518.58 -243.81 51.60 281.88 418.55 520.59 1100.11 1342.75 1982.06 2722.24 2302.37 2041.82 1781.32 2114.02 2546.33EK Equity -422.41 -626.81 -562.56 -1050.62 -1170.52 -1162.65 -864.15 -1501.61 -1644.19 -1563.60 -1659.81 -1748.83 -1433.57 -1717.39 -1839.65 -2174.12 -1931.00 -1904.96 -1867.59 -1587.76 -1582.15 -1571.70 -1855.27 -2008.41 -2047.49 -1777.23 -2024.40 -2092.89 -1921.10EL Equity 0.27 -5.25 0.77 -1.79 -4.00 -14.76 -9.70 -15.02 -9.07 -23.44 -23.82 -23.23 -18.23 -52.66 -72.07 -44.71 -28.67 -23.52 48.77 111.56 184.39 64.51 123.60 105.62 -43.04 -168.39 -218.25 -85.68 -29.58EMC Equity 0.00 0.00 0.00 0.00 0.00 0.00 -0.72 -6.88 -4.33 -6.99 -63.87 -156.70 -132.10 -64.11 128.48 225.02 241.92 291.33 82.41 76.38 408.14 102.70 257.81 98.59 168.76 122.91 -638.62 -294.72 123.23EMN Equity 7.16 5.38 9.02 -15.82 13.09 11.74 8.02 -21.23 -12.64 11.75 6.79 -15.99 -19.62 -38.93 -32.00 -27.83 -12.30 -3.98 5.13 7.86 34.39 37.60 27.86 6.63 18.99 17.45 24.21 25.04 38.80EMR Equity -8.65 -101.46 -160.37 -5.70 120.22 329.71 4.46 -24.24 -324.16 26.06 24.39 -91.24 -410.47 -201.81 -368.32 -176.25 -135.04 262.08 110.27 210.12 166.91 456.93 268.35 183.81 539.54 680.35 1089.15 1069.22 1068.52EP Equity -202.76 -169.40 -34.12 125.14 260.33 151.59 -21.98 -172.54 -117.98 -127.26 -466.83 -669.56 -689.44 -707.97 -665.59 -683.17 -664.05 -685.73 -672.10 -647.31 -619.00 -613.91 -631.24 -520.90 -606.64 -611.27 -473.48 -536.68 -465.87ETFC Equity 0.00 0.00 0.00 0.00 0.00 0.00 0.00 0.00 0.00 0.00 0.00 0.00 0.00 0.00 0.00 0.00 0.00 -16.10 -40.13 -43.59 -23.58 -73.92 -43.53 13.32 77.29 186.38 97.78 118.53 79.03ETN Equity -119.85 -100.93 -151.53 -163.85 -48.45 -13.56 11.43 -124.14 68.43 141.90 46.78 -67.49 103.21 11.89 112.94 226.83 448.55 490.40 710.69 679.40 938.56 729.45 553.70 665.09 798.08 1010.67 1078.48 860.08 1080.08ETR Equity 72.96 75.60 340.88 674.55 876.37 708.60 731.34 596.93 766.15 952.93 903.54 853.67 1056.98 1159.07 1376.10 1437.82 1568.46 1672.24 1513.01 1737.42 2098.14 2264.23 2580.96 2472.92 2059.51 2081.73 2204.35 2803.79 3823.72EXC Equity 0.00 0.00 0.00 0.00 5.33 20.67 28.43 26.95 24.00 34.45 76.23 170.29 234.63 271.55 300.84 281.34 377.77 592.90 639.56 798.46 868.84 852.48 856.60 983.35 1143.97 1171.77 1408.98 1586.01 1708.05F Equity -699.51 -981.61 -1076.48 -1768.46 -2346.50 -2182.72 -2860.94 -4005.48 -4332.28 -4263.47 -4328.45 -5569.54 -5641.93 -6050.04 -5298.69 -5361.89 -4251.38 -4781.99 -4340.40 -4716.70 -4564.28 -5299.69 -5588.59 -5747.53 -6307.56 -6237.96 -6588.16 -6228.53 -6405.68FCX Equity 160.62 -16.75 -60.88 -45.85 -12.15 163.63 99.92 84.22 192.40 380.74 398.28 200.72 353.17 368.03 695.65 1120.22 1583.11 1485.74 1026.42 1619.59 1459.40 1545.55 1422.64 2298.05 2721.68 3193.06 2839.28 2674.50 2853.90FDX Equity 0.00 0.00 -108.12 -209.39 -231.04 -164.36 -36.40 -143.33 -164.92 -129.30 -76.21 105.91 17.21 -113.27 -16.45 -45.11 194.34 245.86 361.19 278.21 389.47 590.82 921.49 987.38 777.21 574.56 991.99 1215.71 1254.57FE Equity 40.44 38.42 89.51 137.92 214.85 152.66 226.74 286.65 287.21 292.66 261.74 229.40 337.31 289.68 549.22 286.20 416.57 567.75 500.24 646.28 588.92 674.14 958.14 1119.13 980.08 992.41 1216.84 1280.74 1517.85FHN Equity 0.00 0.00 0.00 0.00 0.00 0.00 0.00 0.00 0.00 0.00 0.00 0.00 0.00 0.00 0.00 0.00 0.00 -3.16 -9.15 -17.13 -16.71 -26.27 -19.71 -44.79 -36.13 -28.21 -40.35 -52.37 -27.36FITB Equity 0.00 0.00 0.00 0.00 0.00 0.00 0.00 0.00 0.00 0.00 0.00 0.00 0.00 0.00 0.00 0.00 0.00 -19.63 -53.26 -122.00 -155.42 -274.96 -389.96 -656.16 -602.92 -498.87 -635.10 -562.13 -416.29FO Equity -52.36 -148.14 -170.79 -105.47 -17.77 98.93 177.36 71.17 244.87 548.33 758.41 458.87 440.41 309.06 682.94 853.28 1437.18 1642.11 1569.83 1512.76 1650.25 1826.93 2196.04 2076.35 1922.15 2050.37 1576.19 1782.02 2284.92FPL Equity -19.29 -5.08 11.14 77.53 105.03 51.53 41.91 2.17 23.56 40.15 40.57 4.28 42.60 36.14 82.01 60.62 84.82 96.19 68.16 109.01 169.97 215.92 258.76 354.27 243.48 220.32 237.68 308.42 481.76FRX Equity 83.18 49.22 38.26 98.89 161.78 225.60 263.33 326.46 277.91 357.89 366.78 417.73 415.07 353.80 424.59 524.93 586.85 594.72 543.49 680.47 799.80 608.29 458.25 412.80 155.01 214.93 195.04 264.34 460.93FTR Equity 22.73 35.90 42.98 23.93 23.33 23.05 18.86 0.03 9.82 10.29 -4.59 -18.13 8.15 6.11 24.93 15.72 24.20 27.87 22.44 31.14 34.59 28.12 33.59 52.40 38.21 71.13 68.31 109.60 123.32GAS Equity -0.03 3.14 8.70 19.07 37.45 20.75 28.02 29.23 43.19 61.55 67.31 -19.66 7.49 -22.82 24.62 14.53 9.73 15.53 9.20 22.65 24.18 23.77 44.27 48.34 34.32 35.56 45.07 52.67 71.35GCI Equity 40.81 -111.39 -369.75 -579.03 -305.67 -371.28 -260.73 -372.59 -197.38 -15.90 -16.63 -59.12 -122.73 -114.98 -4.04 15.53 233.69 232.74 144.44 76.90 -75.99 -156.56 -483.17 -690.15 -1090.95 -1203.14 -1466.29 -1441.21 -1088.96GD Equity -18.42 -24.05 -25.54 27.63 100.64 22.35 104.59 171.74 114.23 217.73 295.06 127.88 96.68 -101.21 128.25 187.43 358.44 362.77 461.79 530.08 556.20 582.83 613.48 764.66 669.02 905.08 947.92 1169.65 1260.84GE Equity 1849.18 1922.68 1813.56 2599.57 1198.61 127.03 1311.38 -924.47 -265.73 -875.78 -2644.77 -3811.78 -3742.52 -3448.20 -2675.84 -2413.13 -2183.21 -2244.67 -1813.80 -1525.87 -756.02 -888.02 -1181.49 -1556.43 -1140.42 -1269.12 -2143.04 -899.31 331.53GIS Equity 79.98 143.59 8.83 -131.45 101.91 -270.74 195.14 281.49 227.50 357.92 383.48 233.57 47.59 -304.12 139.20 -72.04 199.43 181.04 -15.38 41.52 147.63 255.92 9.05 854.62 569.20 211.62 364.45 535.16 864.06GLW Equity 179.76 372.73 620.09 688.66 68.85 -382.53 -441.75 -548.48 -550.97 -575.09 -640.57 -681.04 -617.20 -516.07 -459.61 -386.10 -347.04 -315.31 -248.44 -320.23 -294.34 -321.61 -105.28 -16.95 -1.60 273.11 166.67 184.30 -35.00GPC Equity 9.85 10.60 2.51 4.18 83.96 86.15 154.21 159.52 221.43 222.63 199.81 141.91 148.59 146.50 167.97 165.73 182.17 177.50 268.08 249.66 330.38 321.20 293.38 313.88 332.09 331.50 292.57 325.05 407.44GPS Equity 1139.47 1221.83 1344.08 490.82 1009.75 144.79 285.82 -1271.22 -290.61 -781.01 -802.04 -2247.64 -2251.55 -2167.39 -2551.47 -2430.12 -2179.33 -1993.15 -1844.37 -1704.22 -1756.33 -1376.01 -1330.91 -1650.59 -1557.46 -1699.12 -1828.86 -2849.47 -2771.67GR Equity -29.07 -29.42 -25.47 31.71 -14.58 12.86 9.31 -191.11 -102.04 -35.22 -79.92 -197.88 -206.53 -263.14 -168.42 -125.44 -47.27 -69.44 -11.85 -30.84 -7.94 71.97 113.90 153.02 109.36 144.62 94.08 105.28 170.64GT Equity -89.03 -95.65 -99.72 -103.63 -95.47 -94.59 -87.77 -103.44 -94.29 -91.72 -102.57 -118.39 -121.48 -124.28 -123.96 -121.83 -130.83 -126.89 -123.50 -114.31 -91.00 -98.46 -88.71 -85.82 -74.79 -92.93 -112.58 -90.89 -53.14GWW Equity -7.47 28.17 -90.18 -114.22 -68.03 -75.96 -39.08 -54.93 -2.40 49.30 6.57 -54.02 28.85 -46.78 -11.76 -2.53 -8.81 -2.62 96.69 93.48 202.02 151.62 56.35 161.75 281.27 337.66 325.55 199.94 242.12HAL Equity -9.15 -9.56 -5.28 -7.50 -145.44 -147.69 -157.22 -466.43 -668.97 -578.31 -604.52 -673.22 -547.55 -493.52 -439.22 -407.15 -373.02 -275.52 -276.64 -191.84 -55.87 32.35 151.01 650.86 478.33 744.37 760.81 245.60 454.00HAS Equity -274.56 -399.31 -433.49 -612.96 -680.53 -558.09 -487.46 -524.98 -408.85 -437.93 -512.49 -612.67 -618.53 -515.22 -373.99 -342.83 -228.39 -224.63 -300.65 -347.60 -311.35 -249.20 -272.25 -267.03 -264.41 -241.64 -387.54 -143.04 148.86HBAN Equity 0.00 0.00 0.00 0.00 0.00 0.00 0.00 0.00 0.00 0.00 0.00 0.00 0.00 0.00 0.00 0.00 0.00 0.00 0.00 0.00 0.00 0.00 -1.25 -5.82 -3.75 -2.22 -15.42 -5.66 -16.16HD Equity 0.79 0.76 0.88 1.20 1.40 1.40 1.27 0.74 0.96 1.08 1.13 0.78 1.14 1.02 0.35 -123.99 -479.12 147.04 357.03 778.80 533.37 424.80 -5.94 1467.96 1283.09 1.54 2107.09 1167.24 1120.92HES Equity -13.56 -6.37 -17.65 -28.91 -4.77 10.77 20.15 -72.24 -71.44 26.42 43.17 -44.76 -118.31 -179.76 -149.46 -147.05 -128.73 -60.49 22.39 82.16 44.35 124.08 188.89 371.09 302.90 387.59 493.91 293.09 438.16HIG Equity 0.00 0.00 0.00 0.00 0.00 0.00 0.00 0.00 0.00 0.00 0.00 0.00 0.00 0.00 0.00 0.00 0.00 0.00 0.00 0.00 -0.15 -0.17 -0.06 0.01 0.31 0.03 0.25 0.36 0.41HNZ Equity -184.79 -155.54 -191.00 -408.32 -399.01 -279.73 -220.61 -169.34 -340.28 -207.98 -225.82 -272.86 -224.45 -389.27 -619.18 -490.50 -568.05 -393.69 -364.31 -344.30 -222.44 -281.28 -363.98 -248.38 -293.64 -284.64 -343.27 -517.47 44.67HOG Equity 17.81 61.88 15.66 124.04 68.98 24.47 139.02 2.52 238.39 242.53 180.12 129.07 105.05 15.90 20.36 132.51 122.32 141.19 384.39 324.62 364.98 302.23 -2.47 -87.70 27.56 -32.35 60.26 502.47 1104.58HON Equity 3.53 -201.09 -1036.25 -952.17 -378.77 -734.07 -998.62 -1446.79 -1071.43 -839.49 -992.59 -1674.02 -1573.47 -1687.56 -1412.86 -1442.65 -1100.00 -1075.20 -915.40 -966.25 -993.74 -865.94 -900.51 -866.61 -890.85 -325.10 -621.16 -518.20 -10.54HOT Equity 14.31 23.15 48.88 44.85 68.11 56.99 75.41 -8.96 65.00 132.80 88.30 -4.61 8.67 9.25 52.00 104.73 116.67 159.06 201.82 218.28 395.04 420.31 401.44 370.26 480.87 552.00 716.41 602.79 849.46HPQ Equity -86.21 2245.48 4500.66 4686.56 2354.83 -520.95 -3276.15 -4580.94 -7193.98 -5528.14 -7207.40 -8529.17 -7533.81 -7141.44 -7462.15 -5362.69 -5026.17 -4338.77 -6079.18 -6009.33 -6883.49 -6265.06 -5774.15 -3067.03 -723.03 1517.14 2703.89 1988.52 8446.29HRB Equity 23.19 95.55 -46.81 -35.71 -62.42 -152.72 -78.29 71.96 296.68 615.48 531.41 1113.17 809.28 1188.79 1014.12 610.58 664.50 898.68 1182.50 1826.54 983.84 1217.81 1068.85 1144.60 1252.95 1874.37 1208.75 1169.71 891.31HSY Equity -74.38 -60.37 -68.87 -28.59 61.59 95.55 31.79 61.76 85.36 94.14 38.81 38.42 76.38 24.01 120.49 169.81 223.54 306.70 444.42 467.34 831.16 1013.43 1118.43 819.17 757.97 596.72 756.15 628.42 409.67HUM Equity 0.00 0.00 0.00 -8.55 2.85 -9.18 -9.91 -5.54 -5.92 -1.68 3.84 -10.94 -32.15 -41.74 24.30 52.49 117.82 64.35 25.44 74.69 238.03 279.10 407.47 551.32 654.01 627.76 641.13 839.57 665.36IBM Equity 673.87 1982.45 -123.99 90.99 -5768.73 -3528.10 482.56 -5270.04 2267.59 -2536.01 -11533.23 -15598.77 -9827.78 -9536.05 -8303.68 -6742.45 -5778.21 -6154.92 -7556.98 -8551.79 -3925.96 -6970.13 -13523.17 -11351.87 -10818.93 -10540.29 -13583.49 -10937.58 -2741.10IFF Equity -46.98 -67.51 -104.66 -205.14 -185.60 -166.51 -116.42 -86.70 -56.79 21.20 -20.13 -37.25 21.15 -47.80 -35.12 -18.34 20.39 24.90 60.57 76.39 174.19 103.79 30.69 4.72 -36.79 -22.37 -0.33 106.54 373.14
Quarterly Creation (Destruction) of Value
Appendix 3: Hypothesis Test - Value Destruction vs. Debt/Total Cap (cont.)

Capital Structure Engineering
14
INTC Equity 3766.12 14427.48 14095.98 2408.89 -3871.29 -6420.11 -4225.05 -10338.83 -2494.77 -3961.16 -12827.81 -15931.43 -14641.31 -13947.35 -10784.04 -3976.36 -301.55 -4558.97 -4612.75 -13585.49 -9599.50 -10265.80 -5853.52 -8741.11 -8233.18 -18232.79 -19333.70 -15999.45 -16634.58IP Equity 0.00 0.00 0.00 0.00 -2.18 -4.61 -4.63 -5.08 -2.46 -1.47 -1.36 -11.65 -8.01 -15.29 -36.14 35.36 121.49 103.29 151.19 59.96 99.85 -13.77 -150.62 -165.23 -81.42 -61.93 -109.66 -136.00 -158.64IPG Equity -15.25 -153.45 -245.39 -404.58 -284.36 -461.46 -571.87 -772.67 -567.15 -468.54 -684.91 -871.92 -918.06 -1018.59 -932.18 -917.36 -883.94 -889.24 -924.48 -995.98 -932.45 -958.57 -959.95 -969.55 -1018.54 -1019.74 -1047.08 -1011.73 -958.40ITT Equity -409.62 -464.44 -475.66 -431.52 -232.62 -235.03 -27.06 -18.76 215.09 680.70 969.54 615.81 580.48 303.63 770.58 551.20 1108.16 1191.51 1441.60 1306.39 1521.33 1750.03 2067.70 2686.72 2249.01 2664.06 2052.86 2223.48 2737.61ITW Equity -6.66 -12.91 -13.49 -14.03 -12.02 -13.72 -8.77 -15.78 -5.48 -2.95 -5.30 -12.50 -7.97 -12.78 -7.26 -6.70 4.84 1.55 -7.59 -83.15 -122.35 -193.57 -422.79 -397.12 -190.86 64.16 24.55 -144.43 -62.87JAVA Equity 443.42 817.02 2189.06 3404.14 2757.41 4267.26 873.32 -832.16 -879.14 -2356.46 -1444.95 -2236.14 -3142.70 -3942.18 -3631.19 -3547.68 -2998.64 -3349.65 -3120.59 -3234.21 -3135.78 -3224.73 -2658.43 -3291.28 -3418.41 -3366.05 -3145.40 -2874.24 -3242.36JCI Equity 0.00 0.00 0.00 0.00 0.00 0.00 0.00 0.00 0.00 0.00 0.00 0.00 0.00 0.00 0.00 0.00 0.00 0.00 0.00 0.00 0.00 0.00 0.00 0.00 0.00 0.00 0.00 0.00 0.00JCP Equity -129.92 -75.36 -87.46 -222.54 -282.05 -327.66 -298.75 -369.51 -343.84 -243.28 -152.45 -198.15 -200.65 -232.59 -302.45 -283.27 -268.13 -307.68 -292.12 -187.22 -139.87 -12.06 88.06 -120.66 108.22 472.07 1108.81 297.92 1177.07JNJ Equity 9.17 -449.89 205.17 78.87 350.13 -183.57 248.05 565.73 812.43 1262.39 -488.97 -284.46 -385.87 381.28 -934.69 -1438.54 -964.13 -1161.96 86.93 308.54 2145.89 3094.61 2520.05 1987.24 1059.90 820.22 993.17 2575.05 3030.79JWN Equity 197.28 55.80 -34.30 -195.31 -295.09 -109.95 -441.44 -485.27 -337.52 -414.00 -268.24 -552.56 -178.97 -236.55 -396.34 -349.44 -419.17 -453.99 -316.39 13.24 315.73 188.79 481.53 443.47 583.56 707.21 1695.57 1286.95 2176.95K Equity -65.07 -97.02 -72.02 -105.85 -93.50 -88.02 -76.56 -68.71 -67.46 -44.07 -29.63 -49.07 -38.35 -82.49 -30.03 -44.38 10.79 16.67 51.17 49.28 103.97 54.59 99.39 142.58 47.51 45.09 253.48 311.08 335.73KBH Equity -11.33 -26.92 -37.89 27.13 91.73 56.02 27.57 105.20 118.86 242.55 315.16 253.49 200.06 225.88 454.95 377.35 583.25 639.67 518.04 564.68 938.03 1605.50 1786.10 2013.11 1875.87 1743.90 1062.78 676.75 1066.42KEY Equity 0.00 0.00 0.00 0.00 0.00 0.00 0.00 0.00 0.00 0.00 0.00 0.00 0.00 0.00 0.00 0.00 0.00 5.27 5.45 30.16 69.90 45.22 60.84 41.88 52.00 140.66 102.27 161.10 175.41KLAC Equity 2.11 5.96 70.15 145.40 71.87 6.15 -60.77 -19.90 130.20 -94.62 68.09 234.35 4.98 -185.57 -92.19 -87.71 48.65 116.34 197.73 94.47 69.31 -49.98 27.52 17.21 -26.10 59.77 66.76 48.23 -116.93KMB Equity 476.66 179.33 136.12 111.05 906.60 708.44 64.59 378.85 251.82 561.70 385.79 -24.21 -748.74 -888.07 -309.86 -408.15 305.77 628.19 920.54 799.82 1024.56 1007.72 673.52 186.54 232.56 -16.81 522.10 1050.55 1468.13KO Equity -672.72 -921.91 -689.93 -733.58 -596.19 -1005.97 -1006.17 -963.04 -956.27 -818.76 -676.66 -1006.08 -1182.37 -1348.22 -1027.36 -1227.78 -746.09 -804.01 -810.02 -1829.36 -1653.21 -1667.00 -1624.13 -1513.60 -1944.09 -1697.23 -1501.18 -1205.94 -542.93KR Equity -110.10 -119.87 -113.27 -105.18 -187.02 -170.96 -258.31 -499.39 -383.14 -614.84 -1115.30 -1042.92 -1036.63 -705.07 -731.40 -672.14 -970.99 -1152.47 -985.29 -851.47 -907.11 -528.34 -513.39 -648.84 -442.05 8.58 -183.90 584.52 1275.48KSS Equity 0.00 0.00 0.00 0.00 0.00 0.00 -11.48 -18.54 -6.69 -12.81 -14.02 -13.68 -77.63 -44.59 -87.47 -107.74 -147.45 -130.64 -109.71 -127.35 -186.46 -197.73 -178.77 -152.74 -179.10 -171.87 -125.53 -181.80 -186.82L Equity 0.00 0.00 0.00 0.00 0.00 0.00 0.00 0.00 0.00 0.00 0.00 0.00 0.00 0.00 0.00 0.00 0.00 0.00 -0.04 -0.05 -2.30 -1.47 -0.46 3.24 3.94 -0.32 -15.11 2.85 9.43LEG Equity -15.88 -17.75 -41.28 -45.00 -25.38 -25.12 -1.66 -26.57 9.97 26.24 12.06 -34.45 -0.62 -56.26 -21.28 -1.03 -4.17 34.82 88.62 115.87 121.51 134.44 78.55 -90.89 -15.36 27.23 43.91 49.18 6.08LLY Equity -878.89 -1090.77 801.83 -204.14 359.31 -639.03 -762.62 -369.52 -478.70 -677.01 -1992.01 -2142.73 -1546.97 -2010.54 -1131.23 -1926.93 -1024.85 -1264.30 -1050.38 -1836.43 -2106.31 -2460.31 -2187.77 -2363.93 -2123.50 -2225.27 -2255.58 -2113.76 -2537.25LM Equity 0.00 0.00 0.00 0.00 0.00 0.00 0.00 0.00 0.00 0.00 0.00 0.00 0.00 0.00 0.00 0.00 0.00 0.00 -3.00 -2.68 -1.49 -4.10 -17.25 20.04 29.14 81.65 88.80 109.06 119.45LMT Equity -43.78 -44.52 -40.56 -32.53 -31.66 -29.80 -28.60 -21.48 -18.93 -7.96 3.91 -1.33 -14.00 -52.82 -50.08 -64.88 -37.88 -105.48 -48.10 1.68 -6.37 106.42 196.34 41.45 124.44 598.99 367.01 1298.56 1733.59LNC Equity 0.00 0.00 0.00 0.00 0.00 0.00 0.00 0.00 0.00 0.00 0.00 0.00 0.00 0.00 0.00 0.00 0.00 -2.26 -8.40 -13.53 -14.70 -29.87 -13.39 31.24 40.28 54.83 48.76 133.94 226.88LOW Equity 0.00 0.00 0.00 0.00 0.00 0.00 0.00 -0.39 0.26 0.68 1.20 1.19 2.10 1.86 0.87 1.67 0.97 1.92 2.20 3.35 2.84 -31.76 -132.41 19.99 13.39 -87.23 237.12 44.04 152.26LSI Equity 17.58 49.89 37.12 -12.27 -43.34 -47.00 -37.10 -57.19 -47.20 -43.24 -64.55 -70.97 -72.72 -75.43 -68.71 -63.47 -64.34 -62.82 -67.62 -76.09 -73.04 -72.88 -64.83 -61.70 -66.45 -57.18 -64.02 -65.81 -63.56LTD Equity 47.92 102.19 0.37 -51.55 -312.50 57.29 -2.76 63.15 -104.58 -309.76 -316.85 -629.43 -196.47 -130.89 -332.77 -360.34 -576.43 -488.62 -307.08 -246.39 -202.65 -21.01 -76.89 455.41 233.97 -58.37 527.69 -645.49 233.93LUV Equity -54.77 -36.58 -56.44 28.20 205.19 71.18 82.44 -12.96 101.57 116.55 25.92 -62.26 -115.50 -90.85 71.17 94.49 -12.85 -154.62 23.95 -221.82 0.18 -177.40 -200.62 -136.16 7.48 114.32 -77.73 -46.86 -219.61LXK Equity 292.72 424.06 -47.39 -483.68 -393.81 -371.31 -24.37 -374.68 -142.03 -204.76 -298.09 -484.06 -185.87 -26.38 62.57 -121.59 228.62 534.37 627.73 317.67 321.84 141.35 -327.57 -510.16 -1171.07 -1177.13 -709.03 -599.75 288.11M Equity -228.10 -151.41 -84.34 -201.24 -293.92 -502.10 -836.61 -693.91 -48.76 -157.41 -387.74 -651.12 -260.88 -319.99 -644.18 -814.50 -1102.58 -857.93 -242.15 234.66 219.95 322.78 207.06 377.82 806.40 1007.66 2755.72 1096.30 1984.29MAR Equity -242.20 -328.24 -201.21 -96.90 35.87 -71.11 122.73 -44.06 -88.74 63.70 -205.32 -450.35 -405.80 -517.59 -211.53 -136.22 196.28 -103.21 414.37 255.75 1320.61 1424.18 1661.42 1061.72 1418.63 1564.20 1829.19 2107.00 4376.56MAS Equity -51.23 -78.35 -101.74 -100.66 -21.66 -60.91 -32.15 -139.51 -30.04 36.34 25.00 -168.50 -120.92 -193.87 52.27 71.89 239.04 435.75 466.02 753.75 973.65 724.31 401.41 248.68 186.46 475.73 61.87 -242.31 127.81MAT Equity -37.17 -49.84 -37.64 -46.40 -32.97 -16.50 -10.84 -26.11 -17.60 -1.03 -0.02 -15.80 -9.45 6.49 -10.74 -12.70 -22.01 -35.64 -53.79 -56.35 -12.17 47.36 -62.82 -138.37 -177.50 -39.04 -137.21 82.79 300.06MBI Equity 0.00 0.00 0.00 0.00 0.00 0.00 0.00 0.00 0.00 0.00 0.00 0.00 0.00 0.00 0.00 0.00 0.00 -2.06 -10.28 -21.34 -11.42 -90.87 -38.50 -33.83 -37.03 -34.35 -56.94 -18.09 135.53MCD Equity -168.76 -415.05 -872.01 -1124.81 -798.57 -1673.21 -1561.62 -1571.39 -1659.48 -1455.60 -1392.73 -3228.20 -3551.96 -3818.13 -2401.38 -2127.19 -1895.37 -1130.16 -1676.83 -1252.88 -290.41 -511.98 -1289.19 106.99 224.14 355.92 157.30 1985.29 3521.24MCHP Equity 31.32 83.82 103.44 172.82 277.31 251.86 182.08 102.19 119.81 182.56 130.23 258.81 275.45 276.63 163.32 228.99 159.77 234.01 224.13 375.46 258.97 347.87 263.24 254.79 244.45 324.40 330.14 373.99 457.28MCK Equity -0.29 -0.50 -1.50 -2.25 -2.54 -2.54 -6.90 -2.96 -18.71 6.94 6.13 -0.75 0.09 -15.08 -34.05 -42.75 -51.42 -13.44 -29.88 -42.99 -65.44 -27.54 -107.56 -51.58 7.14 64.80 74.30 113.30 93.33MDP Equity -17.44 -13.95 -2.52 -41.52 -18.34 -39.57 -29.60 -17.82 -13.19 -34.02 -12.84 25.22 -0.02 27.46 13.30 -4.38 32.97 48.62 65.64 77.87 106.09 79.29 103.77 39.24 61.78 65.88 88.74 124.80 51.10MDT Equity -31.19 -55.50 -118.80 119.26 331.60 333.39 298.09 388.92 42.74 190.60 5.76 206.20 54.48 -175.39 92.88 71.17 160.94 234.59 8.06 120.36 204.89 135.37 216.92 263.23 269.63 355.44 527.96 563.06 -154.83MHP Equity 50.82 -49.66 27.67 93.50 33.20 44.27 104.09 12.07 45.81 129.39 22.41 35.91 21.13 -56.87 48.71 48.59 176.13 278.42 281.19 337.80 599.71 483.83 494.03 690.66 901.43 1221.94 635.34 1320.98 2214.55MIL Equity 0.00 0.00 0.00 0.00 -0.13 -0.21 -0.13 -0.18 -0.13 -0.19 -0.27 -0.27 -0.26 -0.26 -0.19 -0.18 -0.20 -0.15 -0.12 -0.17 -0.16 -0.20 -0.11 -0.08 -0.06 -0.01 -0.08 -0.09 -0.05MMC Equity 0.00 0.00 0.00 0.00 0.00 0.00 0.00 0.00 0.00 0.00 0.00 0.00 0.00 -31.84 7.51 -76.90 -114.92 -187.07 -243.58 -229.66 -715.22 -796.54 -887.23 -801.14 -752.38 -835.34 -921.45 -876.27 -780.22MMM Equity 151.26 37.55 -78.46 88.60 750.47 345.31 673.15 86.44 824.88 674.44 1017.56 433.69 983.01 1307.63 1252.76 1722.76 3188.00 2842.15 3690.67 2550.13 2851.43 3245.33 1597.14 1562.89 2185.54 1921.91 2677.77 1601.25 2216.67MO Equity 11239.18 15516.61 19685.15 23281.93 28312.11 30894.88 32983.03 34367.33 35465.44 39263.97 38053.80 40743.42 44613.60 41350.50 49622.19 48753.72 54321.10 54580.66 52482.66 51050.81 58636.56 60972.00 60895.71 65437.56 66380.89 64306.28 65694.25 67375.17 72317.86MOLX Equity -7.10 -5.06 62.16 112.07 70.64 100.59 8.35 -5.42 -4.75 -53.46 -37.40 -13.50 -24.73 -116.23 -122.89 -139.68 -78.69 -61.81 14.28 -44.22 -28.75 -58.23 -53.65 -104.72 -111.60 -105.46 -121.70 19.95 27.31MOT Equity 0.00 0.00 0.00 0.00 -2.71 -12.31 -9.49 -10.44 -11.22 -12.68 -11.95 -17.55 -20.41 -20.85 -19.25 -15.41 -12.71 -6.21 -7.22 -6.12 -5.27 -8.75 -14.52 2.66 -8.22 -36.66 -304.94 215.52 -588.05MRK Equity -935.09 -1464.65 47.81 -58.46 2950.42 -115.18 -2017.10 -1704.95 -3204.55 -3600.77 -5080.47 -6261.10 -3610.25 -3998.61 -2487.84 -4467.78 -5784.75 -6360.64 -5371.11 -9890.79 -10186.24 -10143.85 -10612.67 -11892.81 -10220.18 -8941.44 -8530.17 -6432.53 -5821.74MRO Equity 0.00 0.00 0.00 2.18 6.16 1.79 9.58 -0.03 25.11 31.99 -5.68 -102.25 -129.48 -69.83 -15.30 27.72 133.80 139.88 230.99 311.26 230.64 431.85 596.27 937.85 749.99 1066.40 1238.12 1008.81 1574.90MS Equity 0.00 0.00 0.00 0.00 0.00 0.00 0.00 0.00 0.00 0.00 0.00 0.00 0.00 0.00 0.00 0.00 0.00 0.00 -13.64 -41.08 -84.82 -53.66 -463.99 -368.52 -59.46 180.67 130.85 776.52 2069.05MU Equity 0.00 0.00 0.00 0.00 0.00 0.00 0.00 0.00 0.00 0.00 0.00 0.00 0.00 0.00 0.00 0.00 0.00 -18.53 3.98 -7.07 -22.10 -22.53 -23.77 -25.25 -21.11 -5.48 1.94 7.27 10.08MWW Equity 0.00 0.00 0.00 0.00 0.00 0.00 0.00 0.00 0.00 0.00 0.00 -1.28 1.38 0.76 12.31 18.76 14.96 19.52 19.20 17.69 28.68 22.30 22.89 25.03 37.25 47.34 32.79 18.47 41.40NEM Equity 0.00 0.00 0.00 0.00 0.00 0.00 0.00 0.00 0.00 0.00 0.00 0.00 -0.10 -0.16 -0.03 0.11 0.31 0.27 0.10 0.24 0.22 0.18 0.11 0.28 0.41 0.38 0.40 0.18 0.24NKE Equity 86.44 -85.63 -140.19 -485.81 -191.38 -244.46 -174.89 -297.32 -238.88 55.69 122.87 305.58 140.49 -229.20 -176.52 -122.93 232.43 254.13 678.67 943.08 817.83 987.70 1459.77 1555.45 1278.65 1079.08 1469.71 1521.32 1119.52NOC Equity -0.03 -0.05 0.20 0.67 0.43 0.59 0.46 0.88 0.84 1.07 1.33 1.29 0.77 0.57 0.57 0.06 -15.14 -22.92 0.49 -18.32 -27.61 -66.12 -38.00 -92.52 57.87 346.45 125.38 318.22 307.72NOVL Equity -82.30 324.22 -205.41 -696.82 -725.05 -735.57 -973.24 -955.27 -1042.22 -943.73 -1039.74 -1123.52 -1111.29 -1066.61 -1086.95 -1038.76 -908.43 -501.58 -665.17 -857.55 -832.53 -948.59 -932.86 -916.33 -803.42 -632.59 -769.54 -972.39 -1029.83NSC Equity -0.41 -1.58 -1.41 -1.52 -1.73 -1.10 -0.34 -1.26 -0.76 0.35 0.17 -0.44 -0.49 -0.73 -0.60 -0.78 0.27 -0.07 0.79 1.44 2.76 2.92 1.77 3.59 4.45 1.27 -8.16 -83.06 49.91NSM Equity 0.00 0.00 0.00 0.00 0.00 0.00 -14.17 -49.66 -8.29 33.03 10.76 -34.48 24.26 -99.18 -89.41 -118.20 -58.14 -3.38 20.04 12.07 54.36 -289.57 -188.65 -24.27 -35.02 216.48 298.13 360.28 200.35NTAP Equity 0.00 0.00 0.00 0.01 0.02 0.02 0.03 0.01 0.00 0.00 0.00 0.00 0.00 0.00 0.00 0.00 0.00 -3.16 10.31 3.62 -14.21 -16.97 26.74 97.55 35.45 17.32 26.89 135.08 287.34NTRS Equity 0.00 0.00 0.00 0.00 0.00 0.00 0.00 0.00 0.00 0.00 0.00 0.00 0.00 0.00 0.00 0.00 0.00 -3.29 -9.63 -14.15 5.21 -14.49 -8.65 12.77 17.75 20.52 39.21 63.68 85.48NUE Equity 28.45 51.60 93.08 148.61 253.91 268.77 373.78 249.90 429.62 574.62 575.57 265.59 278.79 260.80 386.81 368.94 462.38 531.61 682.24 909.83 1066.14 1203.09 940.61 1309.28 1542.98 2711.89 2819.26 2514.72 2878.25NWL Equity -2.21 -27.73 -10.07 -67.68 -71.24 -4.60 -26.01 -66.90 16.08 88.46 132.54 67.85 57.92 27.34 21.99 -80.40 -62.81 -56.72 -54.03 -107.77 -41.28 -76.92 -44.46 -64.92 -46.70 -21.36 -12.22 29.79 39.10NYT Equity 195.95 37.63 -68.54 -178.58 -161.50 -158.66 -113.38 -353.46 -73.70 151.11 356.92 86.27 4.02 -73.17 -6.07 -121.75 123.49 -97.02 -64.22 -467.00 -359.10 -728.71 -1052.44 -1121.35 -1402.31 -1476.56 -1585.07 -1724.22 -1562.84ODP Equity -251.15 -256.83 -594.23 -529.96 -577.88 -447.32 -323.45 -55.11 352.93 484.03 202.04 -68.61 -18.55 -215.74 55.72 6.94 173.91 298.80 292.54 19.63 224.25 709.98 675.78 1349.44 1458.96 2105.57 2153.35 2400.69 2147.83OMC Equity 121.06 55.56 11.61 -135.89 -50.61 -65.65 -31.67 -266.11 7.03 -2.86 -702.66 -569.60 -435.02 -588.53 -331.25 -330.35 -108.29 -232.03 -317.14 -416.47 -127.67 -74.44 -326.24 -227.37 -182.74 -273.05 -85.90 101.26 584.72ORCL Equity -380.86 278.11 3049.21 10377.23 9802.08 13354.08 1535.71 -1324.61 -4369.05 -6631.68 -5424.05 -3562.14 -10717.75 -9446.97 -7280.57 -7497.20 -6359.37 -6780.01 -7655.23 -6533.33 -8624.79 -10533.25 -6973.70 -6460.30 -6900.78 -6766.28 -7083.02 -7406.55 -5219.74OXY Equity -82.44 -108.49 -85.65 -61.39 42.00 40.66 119.97 22.79 119.68 206.45 240.71 176.25 178.98 238.76 377.60 437.21 711.38 829.66 941.99 1312.02 1434.94 2045.17 2355.21 2765.17 2474.55 3082.47 3545.62 3098.07 3231.44PBI Equity -172.41 -220.17 -322.93 -326.87 -512.19 -435.62 -150.99 -278.55 -249.71 -32.44 -164.97 -596.41 -486.17 -515.52 -165.14 -164.16 -45.42 71.79 170.53 162.41 299.44 228.12 138.30 16.82 37.36 92.57 -21.20 211.46 341.33PCAR Equity 1.57 53.42 44.88 39.70 73.25 62.39 76.11 72.17 111.84 127.71 111.46 75.42 117.19 132.32 191.94 214.77 250.15 246.88 267.27 346.13 427.49 372.84 354.05 350.74 379.71 394.03 578.83 630.02 834.74PCG Equity -968.75 -940.46 -673.81 -709.05 -1034.47 -1511.53 -1530.24 -1309.20 -1042.14 -779.63 -1174.43 -1569.82 -1394.54 -1414.01 -918.43 -750.90 -497.00 -419.37 -491.76 -338.36 -145.01 -112.99 288.45 454.29 190.62 452.12 461.87 827.54 1644.69PEG Equity 60.47 -22.09 84.69 257.02 341.82 236.63 395.97 183.71 205.20 327.50 232.78 -205.52 -148.40 11.33 200.34 199.64 271.73 385.70 122.73 213.72 579.07 663.82 908.91 1052.14 1060.07 1045.59 1099.37 922.89 1122.68PEP Equity -684.71 -972.85 -15.27 3.73 734.26 19.35 82.64 628.35 690.26 956.59 912.58 -1273.98 -479.25 -685.56 149.95 60.39 486.44 1678.17 2661.28 1438.72 1768.81 1872.83 2800.03 2547.40 4103.80 4106.48 4192.50 6184.32 5408.33PFE Equity -1268.93 -760.71 613.36 278.29 435.09 -515.02 -461.94 -771.68 -829.93 -959.70 -2106.86 -4144.62 -3667.40 -3065.63 -1847.34 -4699.77 -1508.47 -2193.56 -2387.74 -6214.11 -8817.94 -9559.62 -8682.79 -11018.58 -12892.56 -10833.82 -12646.39 -6602.37 -9814.31PG Equity -188.42 120.37 1044.51 -2256.73 -2442.64 -1507.76 -634.57 -2044.39 -1790.12 -1001.19 -344.09 748.82 751.62 593.84 278.19 646.42 664.75 1065.24 1878.04 2493.92 2961.62 2828.03 3127.91 2274.82 2261.24 4431.74 3897.60 3663.16 2488.11PGN Equity 0.00 0.00 0.00 0.01 0.01 0.01 0.01 0.01 0.01 0.02 0.02 0.01 0.01 0.00 0.01 0.57 0.70 0.96 0.43 0.19 0.67 0.14 0.69 0.58 0.45 0.46 0.28 0.71 1.28PGR Equity 0.00 0.00 0.00 0.00 0.00 0.00 0.00 0.00 0.00 0.00 0.00 0.00 0.00 0.00 0.00 0.00 0.00 -2.12 -7.08 -11.06 -92.60 28.47 171.35 301.07 590.64 276.64 240.34 126.73 61.57PH Equity 12.43 10.85 41.35 -10.15 -49.17 -56.43 13.11 -22.01 -6.07 -52.41 16.51 39.18 26.48 -33.67 15.16 -28.16 -8.17 6.58 94.07 75.80 90.58 89.23 189.75 101.17 106.39 119.88 132.08 231.08 208.18PHM Equity 0.00 -6.52 -16.41 15.74 43.85 37.71 44.38 6.50 49.67 58.95 90.49 43.11 57.72 61.50 102.96 122.85 210.74 275.06 245.00 309.34 327.89 394.68 473.06 480.59 407.10 383.27 192.58 259.72 281.89PKI Equity 22.78 63.04 59.78 128.56 137.81 34.54 39.19 36.02 72.63 4.10 -26.13 -50.04 -39.49 -34.83 -14.75 -6.97 -1.64 12.80 13.73 -1.00 22.14 13.45 7.70 12.84 24.23 12.11 -13.71 -39.28 7.37PLL Equity -17.27 -11.56 -32.93 -8.01 -22.05 -30.93 2.65 0.61 -1.47 -22.65 -8.55 -33.61 -71.09 -63.26 -83.12 -29.81 -12.14 -3.53 20.01 -7.52 -14.11 16.23 32.08 29.02 93.58 13.74 56.91 81.11 8.23PNC Equity 0.00 0.00 0.00 0.00 0.00 0.00 0.00 0.00 0.00 0.00 0.00 0.00 0.00 0.00 0.00 0.00 0.00 -0.87 -7.76 -3.53 12.80 -18.25 -0.69 21.02 48.21 91.37 112.54 132.92 149.33PNW Equity -28.33 -39.66 -11.32 60.12 44.42 38.93 44.48 11.41 21.80 35.62 9.60 -41.41 -13.12 -16.44 2.77 -6.75 13.55 9.63 14.00 19.18 32.86 23.16 32.86 30.95 17.65 7.82 11.02 36.41 61.56PPG Equity 1.49 -48.14 -88.56 -100.34 -34.73 -42.87 24.28 -55.81 19.76 56.42 120.11 -59.98 -2.00 -51.44 8.34 22.58 151.12 89.24 136.12 124.19 198.34 232.76 111.82 33.86 12.18 130.91 188.35 227.83 153.30PPL Equity 78.03 6.03 61.66 682.33 784.43 740.50 1066.62 373.16 527.45 740.64 426.35 424.87 561.50 613.31 1020.74 894.12 1062.58 1159.03 1185.96 1259.85 1616.04 1644.28 1956.63 2260.62 1910.42 1918.48 2223.60 2323.22 2648.25PX Equity 29.06 -15.61 -45.34 -49.60 9.59 5.29 24.12 -16.39 111.47 148.97 108.14 25.80 126.84 105.23 159.92 183.21 437.16 384.53 507.04 614.39 683.93 845.62 800.62 838.70 1116.01 1218.29 1153.41 1461.99 1458.97QCOM Equity 0.00 0.00 0.00 0.00 0.00 0.00 0.00 0.00 0.00 0.00 0.00 0.00 -1.00 0.99 -21.42 -32.40 -4.30 45.77 88.10 120.36 156.35 215.88 101.13 -36.82 357.84 354.84 538.65 44.09 -96.36R Equity -56.79 -75.96 -131.38 -141.16 -175.42 -150.00 -125.09 -123.94 -84.87 31.37 -9.27 -46.71 -82.78 -111.16 -30.19 25.06 100.03 166.63 184.61 305.13 321.47 201.07 103.58 47.96 178.52 261.95 599.03 427.89 415.94RDC Equity 24.07 64.39 71.48 61.15 52.32 53.70 25.04 -31.15 14.74 37.82 30.55 5.23 34.36 13.66 35.25 50.70 38.87 22.82 46.36 62.08 59.36 88.76 88.85 129.43 130.63 191.37 129.60 98.83 112.55ROK Equity 503.68 390.51 213.68 -42.35 -57.43 548.23 142.57 221.66 198.35 485.07 672.00 684.50 321.76 749.14 740.58 1076.21 1301.93 2250.55 2157.70 2406.89 2558.52 3721.25 4497.97 3623.63 4068.86 4825.23 6378.87 6342.65 4584.87RRD Equity -366.07 -466.05 -408.75 -366.33 -313.61 -320.36 -218.44 -292.04 -189.49 -152.34 -281.27 -438.24 -491.50 -618.10 -327.46 -380.53 -185.11 -185.67 -75.00 -137.07 11.27 -133.21 1.34 112.69 -12.15 -79.33 -115.45 -63.63 50.19RSH Equity 161.63 157.88 -33.29 483.80 -182.98 -411.40 -620.12 -894.96 -638.67 -666.69 -679.34 -1189.39 -1261.42 -1091.05 -843.32 -719.46 -585.09 -412.08 -765.43 -773.19 -454.30 -1106.28 -1214.33 -1164.83 -1534.43 -1712.62 -2241.32 -1688.41 -1960.35RTN Equity -321.73 -380.02 -367.45 -309.29 -288.62 -301.22 -320.82 -263.00 -282.57 -218.96 -224.50 -283.70 -294.92 -304.72 -277.55 -308.25 -297.05 -291.40 -265.05 -248.56 -235.01 -240.73 -244.70 -276.90 -229.38 -138.76 -159.35 -114.60 37.51RX Equity -369.45 -821.08 -831.23 -638.60 -264.72 -486.77 -251.28 -537.08 -907.22 -723.19 -1086.60 -1352.24 -1249.76 -1290.44 -1082.79 -807.41 -457.96 -635.31 -627.44 -590.50 -640.62 -509.37 -483.90 -402.76 -474.87 -410.09 -244.64 -281.10 -156.93SBUX Equity 0.00 0.00 0.00 0.00 0.00 0.00 0.00 0.00 -15.05 0.31 13.29 18.65 -6.68 -17.61 21.10 3.89 44.58 65.15 103.47 157.39 172.79 391.02 184.94 113.69 25.40 381.98 946.36 937.34 584.33SCHW Equity 0.00 0.00 0.00 0.00 0.00 0.00 0.00 0.00 0.00 0.00 0.00 0.00 0.00 0.00 0.00 0.00 0.00 0.00 0.00 4.65 48.70 0.37 49.37 257.60 284.10 522.35 369.29 603.93 802.73SEE Equity -18.14 -39.76 -45.27 -115.72 -247.10 -206.26 -171.76 -183.50 -131.20 -67.05 -143.94 -407.92 -173.28 -141.54 -57.41 -292.00 -16.89 -181.98 -60.60 -347.12 -41.60 -105.07 -184.65 -300.41 75.10 147.28 -110.80 -12.04 480.42SGP Equity -277.38 -417.35 -152.03 -275.76 -1.71 -685.97 -702.52 -678.36 -708.01 -860.79 -1074.73 -1189.24 -1161.28 -1309.54 -1276.87 -1390.34 -1324.82 -1361.66 -1287.78 -1270.38 -1204.46 -1295.49 -1260.95 -1200.46 -1207.04 -1265.24 -1269.50 -1171.54 -1112.98SHW Equity -48.25 -33.93 -39.84 -39.88 29.70 17.06 -40.66 -36.60 83.29 95.04 131.80 -32.35 94.40 49.01 60.58 141.51 317.96 447.68 575.12 668.76 700.77 669.93 789.18 643.20 727.92 941.89 818.50 1250.16 1699.67SIAL Equity -11.90 -56.13 -35.55 26.90 172.62 395.92 162.27 298.28 133.60 351.87 449.25 413.20 391.89 251.71 577.89 498.06 660.28 592.11 746.86 683.36 779.81 808.13 613.21 901.83 879.98 978.08 1234.10 1352.62 1445.95SLB Equity 0.00 0.00 0.00 0.00 0.00 0.00 0.00 0.00 0.00 0.00 0.00 0.00 0.00 0.00 0.00 0.00 0.00 0.00 0.00 0.00 -25.02 -12.86 5.18 62.36 175.95 503.79 543.20 394.78 464.41SLE Equity -782.90 -740.65 -863.50 -1234.59 -1150.80 -979.87 -207.87 -778.70 -1261.70 -820.39 -599.16 -869.09 -884.23 -1272.02 -579.59 -1323.81 -1329.42 -1254.09 -739.36 -582.42 -209.05 -215.63 42.71 -506.58 -1116.80 -1359.33 -1339.32 -1638.14 -2180.89SLM Equity 0.00 0.00 0.00 0.00 0.00 0.00 0.00 0.00 0.00 0.00 0.00 0.00 0.00 0.00 0.00 0.00 0.00 -34.10 -69.81 -43.34 99.97 9.99 8.63 61.99 72.96 -36.28 -21.59 -74.51 -204.53SNA Equity -39.08 -41.50 -36.10 -46.02 -30.41 -25.42 -43.85 -51.45 -0.63 -1.35 -19.03 -48.46 -28.34 -40.77 -22.50 -29.47 -6.17 -1.73 1.56 -28.16 8.08 -11.26 7.00 16.98 30.21 32.72 49.39 83.84 114.98SO Equity 687.93 878.39 1044.12 1669.16 1739.56 1862.96 2083.02 2190.94 2358.03 2500.53 2577.78 2829.69 2856.83 2875.84 3330.72 3040.34 3178.62 3217.83 2969.72 3137.75 3760.63 3451.07 3966.89 4142.02 3914.89 3601.63 3447.93 3932.85 4352.16SPLS Equity -9.50 -12.81 -35.47 -119.90 -140.18 -205.08 -317.86 -364.88 -250.94 -276.87 -304.27 -293.04 -220.58 -161.49 -306.95 -300.06 -246.02 -190.10 -158.68 22.81 9.33 -14.37 64.47 82.38 156.49 -24.73 271.70 175.34 331.85SRE Equity 206.14 217.46 368.42 472.00 479.01 659.99 536.86 545.90 559.63 438.82 315.45 497.73 557.12 717.34 753.80 784.21 863.20 974.02 1051.37 1079.89 1205.24 1286.56 1574.56 1455.47 1547.73 1493.48 1752.65 2052.14 2301.18STI Equity 0.00 0.00 0.00 0.00 0.00 0.00 0.00 0.00 0.00 0.00 0.00 0.00 0.00 0.00 0.00 0.00 0.00 -0.38 -1.40 -0.26 0.48 -2.17 -1.19 -8.98 0.50 -1.51 13.12 13.09 19.98STJ Equity -183.63 -226.54 -39.60 10.83 121.66 40.50 110.11 189.76 279.83 276.97 248.11 221.81 299.73 479.44 660.40 480.23 697.05 1018.14 1107.39 1122.09 1372.17 1016.64 1488.29 1657.93 1860.18 1304.03 743.27 969.79 1089.01STT Equity 0.00 0.00 0.00 0.00 0.00 0.00 0.00 0.00 0.00 0.00 0.00 0.00 0.00 0.00 0.00 0.00 0.00 0.00 -0.22 -0.48 -18.38 -49.25 -27.74 -37.54 13.45 78.59 21.58 119.40 236.18S Equity 0.00 0.00 0.00 0.00 0.00 0.00 0.00 0.00 0.00 0.00 0.00 0.00 0.00 0.00 0.00 -10.35 -6.97 -1.24 -3.46 4.04 17.84 11.50 18.54 14.12 13.57 -23.57 -70.66 -303.79 -142.32SVU Equity 5.95 30.46 -38.15 -101.76 -161.28 -80.42 -197.74 -121.88 -228.88 -179.41 -45.93 16.89 72.56 153.08 -35.84 -148.17 -246.48 -3.31 73.69 115.51 194.00 311.38 141.39 339.02 321.33 351.26 293.73 363.43 326.90SWK Equity -13.01 -17.18 -22.05 -21.74 28.07 38.57 97.06 60.43 130.55 127.47 92.53 33.59 51.29 -20.21 3.00 14.41 66.27 106.34 123.88 104.60 146.77 120.47 128.02 130.30 140.80 151.52 111.51 141.30 145.35SWY Equity -234.79 -98.00 -118.47 25.41 269.41 57.91 29.49 -88.05 -290.00 -197.38 -885.81 -1231.71 -1613.17 -1897.80 -1907.98 -1384.50 -1721.37 -1856.30 -1475.96 -1783.12 -1899.96 -2017.85 -1557.74 -1466.94 -1555.64 -1409.42 -1460.78 -940.57 -515.58SYY Equity 135.20 192.81 352.38 246.27 306.72 184.74 218.79 379.96 249.83 391.11 373.84 118.54 403.68 690.76 921.16 1082.56 720.89 341.09 1031.81 776.87 835.91 307.91 266.70 383.16 190.28 559.00 993.50 592.79 483.33TER Equity 12.05 94.86 59.38 -268.74 -307.13 -360.75 -324.91 -499.99 -389.26 -289.66 -451.61 -609.16 -571.63 -581.92 -525.33 -500.59 -439.32 -440.46 -488.85 -560.55 -529.21 -558.00 -585.04 -535.67 -557.34 -545.88 -562.64 -587.89 -558.95TGT Equity 131.13 124.49 79.13 37.12 9.10 6.39 -130.13 -399.51 217.03 278.43 245.85 15.65 513.05 534.48 -122.97 -133.53 -249.65 8.06 243.55 327.71 251.25 521.69 491.28 809.61 764.14 454.30 1571.18 1090.57 1116.83THC Equity 0.00 0.00 0.00 0.00 0.00 0.00 0.00 0.00 0.00 -33.95 -60.45 -164.92 -113.22 -708.97 -859.05 -769.24 -717.46 -876.97 -809.70 -891.20 -882.97 -864.67 -839.23 -875.94 -992.76 -999.39 -1009.81 -974.71 -1010.53TJX Equity 211.77 312.30 272.76 -2.99 -517.94 -364.44 -572.88 87.21 473.10 568.25 666.93 844.66 1277.40 1626.50 799.80 1281.30 1044.79 876.01 1181.53 1319.13 1880.63 2276.00 1933.78 2055.45 2298.83 1706.42 1953.20 1143.77 2314.73TLAB Equity 12.35 10.51 14.90 3.91 -79.06 -126.53 -184.54 -206.02 -192.25 -207.54 -219.90 -224.75 -215.97 -220.24 -218.32 -217.68 -213.18 -211.45 -213.39 -210.77 -212.70 -245.77 -220.02 -189.39 -187.35 -77.15 -169.12 -267.19 -302.87TMK Equity 0.00 0.00 0.00 0.00 0.00 0.00 0.00 0.00 0.00 0.00 0.00 0.00 0.00 0.00 0.00 0.00 0.00 -9.19 -23.42 -36.98 -22.73 -71.37 -107.50 -106.59 -67.32 -54.63 -4.81 44.07 58.59TMO Equity -76.83 -19.35 -11.90 68.12 111.22 -0.79 -31.89 -156.73 54.40 -102.34 -343.27 -360.03 -140.33 -284.11 -62.42 -46.19 173.17 436.48 474.11 289.73 493.10 106.02 233.96 536.76 489.63 1017.56 912.12 1179.42 1666.61TROW Equity 0.00 0.00 0.00 0.00 0.00 0.00 0.00 0.00 0.00 0.00 0.00 0.00 0.00 0.00 0.00 0.00 0.00 0.00 0.00 -0.37 3.78 1.67 4.39 7.56 18.36 27.83 20.91 84.74 54.85TRV Equity 0.00 0.00 0.00 0.00 0.00 0.00 0.00 0.00 0.00 0.00 0.00 0.00 0.00 0.00 0.00 0.00 0.00 -0.59 -1.33 -5.08 -3.03 -3.83 -1.79 2.09 1.27 -3.49 -12.72 -6.42 17.18TXN Equity 506.25 1476.40 1101.14 384.48 448.48 -155.81 -144.49 -480.70 -346.84 -118.07 -583.07 -1129.36 -1113.70 -1032.13 -950.03 -591.13 -131.49 -166.81 -605.20 -862.62 -606.10 -688.85 -374.09 765.51 294.08 271.08 -489.25 418.64 -1338.17TXT Equity -215.03 -548.57 -697.16 -891.96 -922.59 -635.24 -667.53 -1256.52 -1010.90 -780.36 -901.02 -1245.86 -1030.73 -1496.22 -1141.09 -1084.83 -483.46 -613.49 -450.26 -201.58 112.73 171.85 195.76 -0.19 219.41 1022.91 910.53 664.62 1043.34UNH Equity -476.34 -371.26 851.15 1399.03 2516.86 2183.94 2382.21 2838.45 3398.14 3946.04 5852.19 5125.54 4539.67 5669.39 6966.66 6765.73 9368.24 11194.34 10359.04 14196.85 19265.23 22046.95 25574.78 28220.18 33091.94 27887.81 18552.33 22322.87 26174.54UNM Equity 0.00 0.00 0.00 0.00 0.00 0.00 0.00 0.00 0.00 0.00 0.00 0.00 0.00 0.00 0.00 0.00 0.00 0.00 0.00 0.00 0.00 0.00 0.00 0.00 0.00 0.00 0.00 0.00 0.00UNP Equity 0.00 0.00 0.00 0.00 0.00 0.00 0.00 0.00 0.00 0.00 0.00 0.00 0.00 0.00 0.00 0.00 0.00 0.00 0.00 0.00 0.00 0.00 0.00 0.00 0.00 0.00 0.00 0.00 0.00UTX Equity 129.04 42.71 -180.95 314.08 628.17 401.66 378.52 -839.36 83.08 548.52 189.34 -424.48 -135.55 -382.87 455.32 898.13 2025.26 1420.98 1773.91 1899.25 2644.42 2506.28 2617.67 2580.38 3264.71 3628.71 4574.44 4574.42 4384.15VFC Equity -78.80 -113.23 -115.55 -108.04 12.35 -0.80 17.33 -75.40 69.13 139.40 71.46 46.10 35.94 50.28 -26.58 98.30 158.60 244.62 271.48 295.74 411.63 472.44 450.42 460.46 398.89 436.73 711.08 865.21 1091.05VMC Equity 2.42 15.24 8.87 1.32 24.03 21.73 43.13 9.52 25.73 25.49 12.29 -13.02 -7.82 -30.19 -8.66 0.79 24.70 23.98 24.47 34.03 47.96 51.38 83.29 119.31 80.61 204.08 124.33 125.35 275.41VZ Equity 91.32 7.20 -567.71 -726.15 -636.13 -701.34 -317.50 -292.58 -768.83 -901.07 -1395.81 -2301.92 -1442.97 -1690.63 -1393.90 -1925.90 -1723.20 -1613.35 -1639.94 -1394.81 -1287.25 -1727.87 -1793.06 -1978.16 -2197.43 -1817.76 -1889.87 -1437.08 -1214.03WAG Equity -1.67 -0.13 -0.99 -0.39 0.92 3.92 3.96 2.81 1.28 0.84 2.80 2.32 1.46 -10.51 -13.39 -11.35 -9.44 5.33 -9.46 -23.53 -24.26 -9.20 46.02 62.30 60.74 56.24 4.85 -189.38 184.65WDC Equity -32.11 -37.81 -37.82 -30.46 -35.90 -33.87 -41.51 -36.26 -38.53 -42.21 -31.80 -32.51 -39.77 -37.03 -31.88 -25.09 -21.18 -17.07 -21.11 -22.09 -29.41 -27.41 -17.63 -3.78 -0.53 -7.04 45.82 54.05 55.18WFC Equity 0.00 0.00 0.00 0.00 0.00 0.00 0.00 0.00 0.00 0.00 0.00 0.00 0.00 0.00 0.00 0.00 0.00 -9.11 -19.56 38.86 121.79 17.92 75.55 -136.99 154.70 250.67 549.31 1088.97 942.38WHR Equity -58.62 -105.56 -193.98 -285.64 -173.04 -151.53 18.55 -100.71 156.15 165.92 26.42 -263.16 -180.27 -224.17 2.25 58.83 124.72 53.02 17.27 -152.20 41.11 9.16 50.70 178.91 335.37 505.56 315.88 360.38 326.97WMB Equity -40.81 -18.74 -21.98 -20.84 -25.01 -19.90 -102.28 -149.00 -158.85 -174.47 -313.84 -303.57 -268.11 -97.20 140.93 311.29 360.87 331.68 601.61 618.64 1098.83 1397.33 1418.77 2125.19 1884.37 1694.25 1923.13 1978.50 2241.56WMI Equity 0.00 0.00 0.00 0.00 0.00 0.00 0.00 0.00 0.00 -34.97 -60.30 -123.27 -156.84 -222.08 -101.95 -14.09 125.25 158.43 182.24 -35.76 154.68 71.09 19.87 12.81 182.68 651.34 705.19 831.79 805.44WMT Equity 2554.60 2898.20 2555.20 4535.76 4146.99 4325.26 4287.24 2773.77 4286.21 3753.97 4243.29 3558.36 4740.20 4084.14 2669.03 3626.85 2319.70 4172.65 4187.95 4635.19 3104.57 3978.52 2271.74 2609.01 2003.92 -353.08 719.93 -453.47 -862.68WPI Equity 0.00 0.00 0.00 0.00 0.00 0.00 0.00 0.00 0.00 0.00 0.00 0.00 0.00 0.00 0.00 0.00 0.00 0.00 0.00 0.00 0.00 -10.31 -28.75 -3.33 -40.36 -74.54 -125.08 -99.76 -100.45WY Equity 5.32 -14.27 -47.85 -80.38 121.24 121.01 185.73 66.06 180.98 341.07 359.32 -4.79 76.55 50.15 165.52 262.77 345.13 375.69 298.47 356.84 414.76 435.38 384.35 426.16 417.32 528.87 292.73 256.25 528.45WYE Equity -652.99 -312.88 -163.55 -251.05 -13.15 -201.97 -173.37 -210.86 -98.16 58.39 -413.33 -1172.86 -965.45 -944.76 -667.80 -648.45 -781.64 -960.89 -1006.99 -964.60 -769.83 -782.80 -703.67 -643.46 -643.65 -560.72 -727.43 -459.33 -468.93X Equity -0.37 -6.25 -11.91 -14.89 -12.95 -15.45 -10.57 -15.94 -12.26 -12.11 -10.86 -18.07 -16.74 -19.63 -13.88 -12.19 2.52 4.92 2.53 4.67 16.88 16.78 2.16 3.63 -5.24 76.04 119.49 0.82 194.38XEL Equity -30.79 -29.70 -27.50 -5.49 0.10 2.94 -2.85 -4.33 -4.03 -12.00 -39.00 -64.05 -58.95 -52.64 -45.13 -43.98 -38.90 -34.89 -40.53 -37.50 -32.90 -38.21 -26.60 -26.51 -31.93 -33.43 -28.34 -20.31 -8.49XLNX Equity 184.65 350.95 447.72 710.59 1456.42 1515.95 1568.33 571.01 229.62 427.21 -165.23 397.42 367.03 -204.37 -434.41 -263.30 -190.66 -110.04 31.92 373.31 395.14 84.25 -50.08 3.92 -28.32 -181.69 -87.04 -231.05 -214.45XOM Equity 449.67 363.05 378.40 902.51 739.80 223.06 891.30 -54.27 72.05 1378.96 353.99 -2736.43 -1540.87 -1313.49 -843.07 -512.95 1778.26 2237.87 3957.67 6455.01 8586.29 15377.55 13684.35 18949.89 11236.50 16304.53 17239.03 24124.46 37738.81XRX Equity -189.85 -175.73 -202.59 -218.67 -276.97 -261.89 -226.47 -256.01 -210.68 -204.38 -268.47 -300.01 -252.92 -236.75 -205.68 -211.29 -155.43 -140.03 -141.77 -148.06 -99.38 -128.84 -150.06 -156.21 -198.94 -205.59 -317.27 -211.48 -104.04YHOO Equity 0.00 0.00 0.00 0.00 0.00 0.00 0.00 -22.52 39.54 39.79 15.08 -44.44 65.97 193.52 338.89 391.54 424.28 525.15 1250.64 1118.36 1351.82 1061.27 1077.00 1013.68 1367.13 660.13 691.46 -302.67 -269.65
YUM Equity -46.24 -107.81 -145.21 -146.01 -109.87 -86.67 31.39 -49.88 60.45 172.75 220.14 200.06 -27.88 5.84 106.47 167.67 289.05 405.55 418.94 542.17 823.06 1046.38 1147.72 752.11 710.32 843.87 1083.05 801.73 1740.71
Total 17052.7 32125.9 46324.4 45060.6 47867.8 34752.5 27367.6 -18291.2 6089.5 16012.7 -23439.4 -69669.2 -52734.7 -62201.6 -22065.4 -11060.1 33081.8 41951.3 61532.3 48158.9 89454.8 98047.0 104673.9 130266.9 141539.5 147320.8 151462.7 187782.1 256178.6
Appendix 3: Hypothesis Test - Value Destruction vs. Debt/Total Cap (cont.)

Capital Structure Engineering
15
Past performance is not indicative of future results. There can be no guarantee that any investment strategy discussed in this brochure will achieve its investment objectives. As with all investment strategies, there is a risk of loss of all or a portion of the amount invested. No chart, graph, or formula can by itself determine which securities an investor should buy or sell or which strategies should be pursued.
RBC Global Asset Management (RBC GAM) comprises RBC Global Asset Management (U.S.) Inc. (RBC GAM (US)), RBC Asset Management Inc. (RBC AM) and Phillips, Hager & North Investment Management Ltd. (PH&N), which are separate but affiliated corporate entities. ® Registered trademark of Royal Bank of Canada. RBC Global Asset Management is a trademark of Royal Bank of Canada. Used under license.
© 2010 RBC Global Asset Management (U.S.) Inc. | Equal Opportunity Employer M/F/D/V
RBC Global Asset Management (U.S.) Inc.100 South Fifth Street, Suite 2300Minneapolis, Minnesota 55402800.553.2143 • 612.376.7000www.rbcgam.us
References: Cohen, Ruben D. “An Implication of the Modigliani-Miller Capital Structuring Theorems on the Relation between Equity and Debt.”
Dobbs, Richard and Rehm, Werner. Feb. 2006. “The Value of Share Buybacks.” Mckinsey & Company.
Hull, Nelken, and White. Sept. 2004. “Merton’s Model, Credit Risk, and Volatility Skews.”
Jensen, Michael C., 1976. “Theory of the Firm: Managerial Behavior, Agency Costs and Ownership Structure.” In Journal of Financial Economics, pp 305-360.
Mauboussin, Michael J. Jan. 2006. “Clear Thinking about Share Repurchase.” Legg Mason Capital Management.
Milken, Michael, 2009. “Why Capital Structure Matters.” In WSJ.com.
Modigliani, F. and M.H. Miller, 1958. “The Costs of Capital, Corporate Finance, and the Theory of Investment.” In Ameri-can Economic Review 48 (June), pp. 261-297.
Modigliani, F. and M.H. Miller, 1963. “Corporate Income Taxes and the Cost of Capital: A Correction.” In American Economic Review 53 (June), pp. 433-443.
Myers, Stewart C. 1989. “Still Searching for Optimal Capital Structure.” In R.W. Kopke and E.S. Rosengren, eds., pp 81-105.
Smith, Clifford W., 1986. “Investment Banking and the Capi-tal Acquisition Process.” In Journal of Financial Economics 15, pp 3-29.
Acknowledgements: John Huber, Chief Investment Officer - Fixed Income, Susanna Gibbons, Portfolio Manager, and Don Henken, Analyst, collaborated in the development of this paper. Special thanks to interns Sarah Alaemo and Andy Pauly for their research support.