Embed Size (px)
Citation preview
Capital Structure and Regulation: Do
Ownership and Regulatory Independence
Matter?
BERNARDO BORTOLOTTI
Department of EconomicsUniversita di Torino
Corso Unione Sovietica 218bis10134 Torino, Italy
CARLO CAMBINI
Politecnico di Torino and IMT LuccaDISPEA, Corso Duca degli Abruzzi 24
10129 Torino, Italycarlo.cambini @polito.it
LAURA RONDI
Politecnico di Torino and CERIS-CNRDISPEA, Corso Duca degli Abruzzi 24
10129 Torino, [email protected]
YOSSI SPIEGEL
Recanati Graduate School of Business AdministrationTel Aviv University, CEPR, and ZEW
Tel Aviv UniversityRamat Aviv
Tel Aviv 69978, [email protected]
We thank Yaakov Amihud, Stephen W. Davies, Tomaso Duso, Farid Gasmi, YannisKatsoulacos, Martin Hellwig, Elisabetta Iossa, Alberto F. Pozzolo, Jon Stern, TommasoValletti, and seminars participants at FEEM, ICTI in Lisbon, Politecnico di Milano, SabanciUniversity, Tel Aviv University, Trento University, Universitat Mannheim, UniversityCollege Dublin, IMT Institute for Advanced Studies Lucca, the 2007 IIOC Conferencein Savannah GA, the 2007 CRESSE Conference in Corfu, the 5th INFER Workshop onCompetition Theory and Policy in Mannheim, 2007, the 2008 “Campus for Finance—Research Conference” in Vallendar, Germany, the 2008 “Government and Governance”Conference in Barcelona, and the 2009 EEA Annual Meeting in Barcelona for helpfulcomments. We also thank Mara Faccio and Fabrizio Gilardi for data and ValentinaMilella and Silvana Zelli for excellent research assistance. Bernardo Bortolotti gratefullyacknowledges financial support from the European Commission (Contract No. CIT5-CT-
C© 2011 Wiley Periodicals, Inc.Journal of Economics & Management Strategy, Volume 20, Number 2, Summer 2011, 517–564
518 Journal of Economics & Management Strategy
We study the effect of ownership structure and regulatory independenceon the interaction between capital structure and regulated prices using acomprehensive panel data of publicly traded European utilities. We find thatfirms in our sample tend to have a higher leverage if they are privately controlledand regulated by an independent regulatory agency. Moreover, the leverage ofthese firms has a positive and significant effect on their regulated prices, but notvice versa. Our results are consistent with the theory that privately controlledregulated firms use leverage strategically to obtain better regulatory outcomes.
1. Introduction
The wave of privatization and institutional reforms that swept net-work industries in Europe during the 1990s dramatically affectedthe incentives, strategies, and performance of regulated utilities. Onepeculiar and often neglected aspect of this process is the change in theircapital structure: casual observation suggests that regulated utilitieshave substantially increased their financial leverage since the early1990s. This trend is widespread across countries and across sectors,and seems to be independent of the leverage boom that fed the globalcrisis in the second half of 2000s. For example, Telefonica de Espana, theSpanish incumbent telecom operator, increased its leverage after beingprivatized in 1997 from 36% to 68% in 2005; Autostrade per l’Italia, thelargest freight road operator in Italy, increased its leverage from 32% in1999, when it was completely privatized, to 88% in 2003; National GridGroup Plc, the UK energy transport operator, increased its leveragefrom 30% in 1997 to 72% in 2005; and Anglian Water Plc, the largestwater company in England and Wales, raised its leverage from 7% in1997 to 49% in 2005. A joint study of the UK Department of Trade andIndustry (DTI) and the HM Treasury (DTI-HM, 2004) has expresseda concern about the “dash for debt” or “flight of equity” within theUK utilities sector from the mid-late 1990s and argued that such highleverage “could imply greater risks of financial distress, transferring riskto consumers and taxpayers and threatening the future financeabilityof investment requirements” (DTI-HM, 2004, p. 6).1 Similar concernshave been recently expressed by the Italian energy regulatory agency,
2005-028647). Carlo Cambini and Laura Rondi gratefully acknowledge financial supportfrom the Italian Ministry of Education (No. 2006130472_002).
1. For a related report, see Ofwat and Ofgem (2006). In December 2008, the UK energyregulatory agency, Ofgem, published a position paper that sets out the arrangementsfor responding in the event that a network company experienced financial distress (seeOfgem, 2008). In particular, Chapter 4 of the position paper considers the scope forreopening a price control in case of a financial distress, the factors that are likely justifythis procedure, and its key elements.
Capital Structure and Regulation 519
AEEG, which announced its intention to start monitoring the financialleverage of Italian energy utilities in order to discourage speculativebehavior that might jeopardize their financial stability (see AEEG, 2007;p. 38).
Given these concerns, it is clearly important to understand thedeterminants of the capital structure of regulated firms and its impli-cations for regulated prices. Existing empirical literature has focused,however, almost exclusively on the U.S., where the high leverage of pri-vately owned regulated utilities is a well-known and well-documentedphenomenon.2 Yet, the institutional framework in Europe differs fromthat in the U.S. in at least two important respects. First, while largeutilities in the U.S. were always privately owned, private ownershipand control of utilities in the EU is still the exception rather than therule—despite the privatization wave of the last two decades, manyEU utilities are still controlled by central or local governments (seeBortolotti and Faccio, 2008). Second, utilities in the U.S. were subject torate regulation by state and federal regulatory commissions since the1910s. In the EU by contrast, Independent Regulatory Agencies (IRA)were established only recently and are fully operational only in theenergy and the telecom sectors; in other sectors, such as transports andwater, utilities are still regulated directly by ministries, governmentalcommittees, or local governments.
In light of these institutional differences, we believe that it isimportant to study the capital structure of regulated utilities in theEU and its interaction with regulated prices, and examine if and howthis interaction varies across ownership structures and whether andhow it is affected by the existence of an IRA. To this end, we haveconstructed a comprehensive panel data on 92 publicly traded EUutilities over the period 1994–2005. Our data covers practically allmajor publicly traded regulated utilities in the EU-15 member statesbefore the 2004 enlargement. These firms were involved in majorprivatization transactions that account for almost a half of the EU-15total privatization revenues across all sectors (including banking andinsurance, oil companies, basic materials, and consumer goods).
To the best of our knowledge, our paper is the first systematicstudy of the capital structure of EU utilities and the first to exam-ine empirically the relationship between capital structure, regulatedprices, ownership structure, and regulatory independence. Our analysisreveals the following:
2. See for example, Bowen, Daly, and Huber (1982), Bradley, Jarrell, and Kim (1984),Smith (1986), and Barclay, Marx, and Smith (2003).
520 Journal of Economics & Management Strategy
(i) Firms tend to have higher leverage when they are privatelycontrolled and regulated by an IRA.
(ii) When firms are privately controlled and regulated by an IRA,leverage Granger-causes regulated prices (but not vice versa).When firms are state controlled, levterage and regulated pricesdo not Granger-cause one another.
These results hold even after controlling for various firm-specificcharacteristics such as size, asset tangibility, profitability, and non debttax shield, and for key features of the macroeconomic and institutionalenvironment, such as the growth rate of GDP, the political orientationof the government, and the strength of the legal protection of investors’rights. Result (i) suggests that the “dash for debt” phenomenon is aby-product of the transition towards private-control of utilities in theEU and regulation by independent agencies. Result (ii) supports theconcerns of regulators that the financial leverage of regulated firmsmay lead to higher prices. However, leverage does not necessarilyhurt consumers: to the extent that high prices boost the incentives ofregulated firm to invest, it may benefit consumers by allowing them toenjoy better and more reliable services.
As mentioned earlier, existing empirical studies on the capitalstructure of regulated firms have mainly focused on the U.S. Taggart(1985) finds that electric utilities have increased their debt-to-equityratios following the introduction of rate regulation in various states inthe U.S. in the 1910s. He argues that this increase may have been dueto the fact that state regulation made the business environment saferfor utilities, but cannot rule out the possibility that some utilities mayhave adopted higher debt-to-equity ratios in an attempt to win priceconcessions from regulators. Hagerman and Ratchford (1978) showthat, for a sample of 79 electric utilities in 33 states, the allowed rate-of-return on equity is increasing in the debt-equity ratio.3 Dasgupta andNanda (1993) study a cross-section of U.S. electric utilities, and find thatfirms operating in less pro-firm regulatory environments tend to havehigher debt-equity ratios. Klein, Phillips and Shiu (2002) study a cross-section of U.S. property-liability insurers and find strong and robustevidence that the degree of price regulation and its stringency havepositive effects on the insurers’ leverage. Bulan and Sanyal (2005) studya panel of U.S. investor-owned electric utilities for the period 1990–2000and find that they reduced their debt-to-total assets ratios in responseto the heightened regulatory and competitive uncertainty created by
3. Besley and Bolton (1990) find in a survey of 27 regulatory agencies and 65 utilitiesthat approximately 60% of the regulators and utilities surveyed believe that an increasein debt relative to equity increases regulated prices.
Capital Structure and Regulation 521
the deregulation process. Bulan and Sanyal (2006), use a similar panelto show that after deregulation, U.S. investor-owned electric utilitiesrespond to growth opportunities in a two-step process: first, theyaccumulate financial slack in anticipation of new growth opportunities,but then, when the growth opportunities become more viable, they usedebt finance to finance them. Ovtchinnikov (2008) studies a large sampleof U.S. firms in industries that were subject to some form of deregulationduring the 1966–2006 period, including entertainment, petroleum andnatural gas, electricity, telecommunications, and transportation. Hefinds that following deregulation, firms reduce their leverage by about30%, and moreover, leverage becomes much less negatively correlatedwith profitability and market-to-book ratios and much more positivelycorrelated with firm size. To the best of our knowledge, the onlypaper that does not focus on the U.S. is Correia da Silva, Estache andJarvela (2006). They examine the leverage of 121 regulated utilities in16 less developed countries over the period 1991–2002 and find thatleverage varies significantly across sectors, with the highest leveragebeing observed in transportation and the lowest in water supply. Theyalso find that leverage steadily increases over time while investmentlevels fall.
The rest of the paper is organized as follows. Section 2 providesa brief institutional framework of the regulatory environment in theEU. Section 3 presents the theoretical background and the empiricalimplications that we test. We describe our panel data in Section 4 andpresent our empirical results in Sections 5 and 6. Concluding remarksare in Section 7.
2. Background: Liberalization and Structural
Reforms in European Network Industries
Following a big wave of nationalization after the Second World War,network industries in Europe were largely dominated by verticallyintegrated, stated-owned, monopolies. Under this regime, utilities wereviewed as an operational branch of the government and were instructedto provide universal services at low prices, absorb unemployment,and invest in infrastructure. The government in turn played the dualrole of owner and “regulator,” and set tariffs, quality standards, andinvestment levels. This arrangement however created ill-performingand highly inefficient public monopolies (Megginson and Netter, 2001).
Starting from the mid 1980s, the European Commission haspromoted a gradual liberalization process intended to improve theefficiency and service quality of EU public utilities and boost their

522 Journal of Economics & Management Strategy
investments. In particular, the European Commission has enacted anumber of directives aimed at setting up a common regulatory frame-work for EU member states, which were in turn required to transposethese directives into national legislation. However, the Commission leftthe decision about the ownership structure of utilities in liberalizedmarkets entirely in the hands of national governments. As a result, manyprivatized utilities in the EU are still partially owned either by state or bylocal governments, despite being publicly traded in the stock exchange.In some cases, the state holds a “golden share” in the firm that grantsthe state special control rights, including the right to appoint boardmembers, veto proposed acquisitions, and cap shareholders’ votingrights.4
The extent of effective liberalization varies considerably acrossmember states and across industries. In telecommunications, liberal-ization started in 1987 with the publication of the Green Paper for theDevelopment of the Common Market for telecommunication servicesand equipment. The Green Paper was followed by a sequence of direc-tives, starting from Directive 90/388 on “Competition in the marketsfor telecommunications services,” which established the institution ofnational IRAs in each member state.5 In the energy sector, the EuropeanCommission has been undertaking legislative actions since 1988 toestablish an internal energy market for both electricity and natural gaswithin the EU. The milestone legislation is Directive 96/92 for the elec-tricity, followed by Directive 98/30 for the gas market; these directivesaimed at gradually introducing competition in generation/productionand distribution, and at unbundling the different segments in the energyvalue chain. Importantly, these directives established independentnational regulatory agencies.6 Table I shows the year in which an IRAin telecommunications and in energy were established, as well as theextent of privatization in these years. The table shows that in most cases,the establishment of an IRA preceded large scale privatization, whichis consistent with EU policy guidelines that required member states to“ensure effective structural separation of the regulatory functions from
4. For a more comprehensive analysis of the privatization process in Europe, seeBortolotti, Fantini, and Siniscalco (2003).
5. Art. 7 Directive 90/388/EC and also preamble 11 to Directive 96/19/CE.6. Art. 20 Directive 96/92/EC and Art. 21 of Directive 98/30/EC. Initially, the national
energy IRAs were granted powers to settle disputes among operators and were onlyrequired to be independent from the regulated firms. Over time, however, EC legislationhas broadened the powers of the IRAs to encompass the responsibility for ensuring non-discrimination, effective competition, and the efficient functioning of the market, alongwith the implementation of unbundling rules (see Art. 23 Directive 2003/54 and Art. 25Directive 2003/55).

Capital Structure and Regulation 523
Table I.
The Timing of Regulation and Privatization in the
Energy and Telecommunications Sectors in the
EU-15 Member States
Energy (Electricity and Gas) Telecommunications
Country
Date ofEstablishingan Energy
IRA
PrivatizationRevenues
before an IRAwas Established
Date ofEstablishing aTelecom IRA
PrivatizationRevenues before
an IRA wasEstablished
Austria 2000 70.8% 1997 0%Belgium 1999 10.1% 1991 0%Denmark 1999 0% 2002 100%Finland 1995 0.4% 1987 0%France 2000 2.5% 1996 2.2%Germany 2006 100% 1996 0%Greece 2000 0% 1992 0%Ireland 1999 n.a. 1997 0%Italy 1995 0% 1997 5.7%Netherlands 1998 0% 1997 41.9%Portugal 1995 12.9% 2001 100%Spain 1998 52.6% 1996 22.2%Sweden 1998 0% 1992 0%UK 1989 18.6% 1984 3.1%
activities associated with ownership or control” (Directive 97/51 for thetelecommunication industry; see also Gilardi, 2005).
Unlike the telecommunications and energy sectors, the liberaliza-tion efforts in the water and transportation sectors are still in earlystages. At present, privatization activity is still limited, and, with theexception of the UK, where firms were privatized and two IRAs wereestablished to regulate the water industry (Ofwat) and the railwayindustry (ORR), no IRAs were yet established, and privatization is stillextremely limited and occurred in only six member states.
3. Theoretical Predictions
Regulators set the prices of regulated firms by explicitly taking intoaccount the firm’s capital structure. In the U.S., this practice stemsfrom the need to ensure regulated firms a “fair rate of return” ontheir investments (see, e.g., Spulber, 1989). This fair rate of returndepends, among other things, on the firm’s cost of capital, which in
524 Journal of Economics & Management Strategy
turn depends on the firm’s capital structure.7 Under RPI-X regulationthat is widely used in the EU, regulators set price caps that ensure thatthe regulated firm’s revenue will cover its operating costs, depreciation,and infrastructure renewals charges, and will yield a sufficiently highreturn on its capital to induce it to enhance and maintain its network. Asin the U.S., the return on capital depends on the firm’s capital structure.
The fact that regulated prices are set on the basis of the firm’scapital structure suggests that regulated firms can affect their prices byappropriately choosing their capital structure. There are two conflictingviews on the link between capital structure and regulated prices. Thefirst view starts with the observation that in practice, regulators oftenuse the firm’s Weighted Average Cost of Capital (WACC) in computingthe firm’s cost of capital that the regulated price is designed to cover.Taggart (1981, Sec. IIB) then shows that as long the allowed returnon equity exceeds the after-tax imbedded cost of debt, the regulatedfirm can induce price increases by substituting equity for debt. Thepositive effect of equity financing on the regulated price in turn createsa strong incentive for regulated firms to use equity financing. It shouldbe noted, however, that this view is inconsistent with the empiricalevidence mentioned in the Introduction that shows that regulated rates-of-return and prices tend to increase with leverage (Hagerman andRatchford, 1978, and Besley and Bolton, 1990) and that firms tend toincrease their leverage in response to regulation (Taggart, 1985, andOvtchinnikov, 2008), and it is also inconsistent with the recent concernin the U.K. and in Italy regarding the “dash for debt” of regulatedutilities.
An alternative view, advanced by Taggart (1981, Sec. IIC), Spiegeland Spulber (1994 and 1997), and Spiegel (1994 and 1996) is thatregulators are averse to the possibility that the firm they regulatedwill become financially distressed and therefore raise prices when thefirm increases its leverage in order to minimize the risk of financialdistress.8 According to this view, regulated firms have a strong incentiveto increase their leverage in order to induce regulators to set high prices.In a recent document, the Italian Corte Dei Conti (National Audit
7. The Supreme court of the U.S. stated in an early decision from 1898, Smyth v. Ames(1898) 169 U.S. 466, that “what the company is entitled to ask is a fair return upon thevalue of that which it employs for the public convenience.” In its landmark decision FederalPower Comm. v. Hope Natural Gas Co. (1944) 320 U.S. 591, the Supreme court elaboratedon the concept of “fair return” and stated that “the return to the equity owner should becommensurate with returns on investments in other enterprises having correspondingrisks.”
8. For example, Owen and Braeutigam (1978) argue that “One of the worst fears of aregulatory agency is the bankruptcy of the firm it supervises, resulting in “instability” ofservices to the public or wildly fluctuating prices.”

Capital Structure and Regulation 525
Office) expressed a similar opinion and wrote that “Privatized firmsstrategically increase the risk of insolvency in order to obtain highertariffs to finance investments. The regulated firm uses leverage as acommitment device vis-a-vis the regulator to maintain a high level ofprofitability.”9 Of course, the strategic effect of leverage on prices begsthe question why regulators do not restrict the leverage of regulatedfirms.10 Spiegel (1994, 1996) provides a possible answer to this questionby showing that the increase in regulated prices due to leverage maylead to more efficient investment choices by the regulated firm.
The above theoretical predictions are based however on theimplicit assumption that the regulated firm is privately owned andregulated by an IRA. But as mentioned in Section 1, many Europeanutilities are still state-controlled and in many cases, are still regu-lated by ministries, governmental committees, or local governmentsrather than by an IRA. These institutional features have importantimplications.
First, when the state controls the regulated firm, it plays the dualrole of an owner and a regulator. Hence, unlike privately controlledregulated firms, state-controlled regulated firms do not need to usetheir capital structure strategically as a way to induce higher prices.
Second, it is often argued that IRAs have a better ability to makecredible long-term commitments to regulatory policies than ministriesand government agencies (see e.g., Levy and Spiller, 1994, and Gilardi2002 and 2005). An empirical support for this argument is providedby Guasch, Laffont, and Straub (2008). They study a sample of 307transportation and water concession contracts in Argentina, Brazil,Chile, Colombia, and Mexico over the period 1989 to 2000,11 and findthat although 45% of the transport concession contracts and 71% of
9. See Corte Dei Conti, “Obiettivi E Risultati Delle Operazioni Di PrivatizzazioneDi Partecipazioni Pubbliche,” Roma, February 10, 2010, p. 195, available at http://www.cnim.it/cnimnm/articlefiles/407-Privatizzazioni%20definitivo%20-%20relazione.pdf.See also p. 219 for a similar statement.
10. In the U.S. regulatory commissions allow regulated firms to exercise discretion inchoosing their capital structures (see Phillips, 1988). For example, the Colorado SupremeCourt in Re Mountain States Teleph. & Teieg. Co. (39 PUR 4th 222, 247–248) stated that “aguiding principle of utility regulation is that management is to be left free to exercise itsjudgment regarding the most appropriate ratio between debt and equity.” As for the EU,we are not aware of any case in which EU regulators have interfered with the financingdecisions of a privatized regulated firm.
11. A concession is the right to use the assets of a former state company for a limitedperiod of time (usually 20 to 30 years), being fully responsible for all investments andhaving to secure a number of targets specified in the contract. At the end of the concession,all the assets go back to the government. In a sense then, concessions could be viewedas limited-term privatizations. Guasch, Laffont, and Straub (2008) report that duringthe 1990s concessions have been used in 67% of the private sector participation casesworldwide, all sectors included.
526 Journal of Economics & Management Strategy
the water concession contracts were renegotiated, the presence of anIRA lowered the probability of renegotiation by 5%–7.3%. This effectis significant given that the average probability of renegotiation of anyindividual contract at any point in time is around 1%. The better abilityof IRAs to make long-term commitments suggests that IRAs are lesslikely to cut prices once the firm’s investment is sunk and thereby benefitconsumers at the expense of the firm’s owners.12 This implies in turnthat privately controlled firms which are subject to regulation by IRAsanticipate, other things being equal, higher regulated prices and hencea lower risk of financial distress. As a result, these firms are likely toissue more debt. In other words, the cost of using debt strategically inorder to induce regulators to raise prices is cheaper when regulators areindependent and hence, regulated firms are expected to have a higherleverage when facing an independent regulator.13
Taggart (1981) suggests another reason why leverage may behigher when the firm is regulated by an IRA: he argues that lags oruncertainties in the regulator’s reaction to the firm’s capital structuredecision weaken the firm’s incentive to manipulate its capital structurein an attempt to influence the regulated price. As a result, the regulatedfirm has a stronger incentive to issue debt when it faces effectiveregulators who are expected to respond in an immediate and predictableway to changes in the firm’s financing mix.
A third reason why leverage may be higher when the firm isregulated by an IRA is that when the state acts as a regulator, the firmmay lobby the state directly to obtain more favorable terms and hencemay not have to use leverage strategically in order to achieve the samegoal.
The two hypotheses that we test in this paper are therefore asfollows:
Hypothesis 1: Conditional on the existence of an IRA, privately controlledregulated firms will have a higher leverage than state-controlledfirms.
12. Henisz and Zelner (2001) study data from 55 countries over 20 years and findthat stronger constraints on executive discretion, which improves their ability to commitnot to expropriate the property of privately owned regulated firms, leads to a fasterdeployment of basic telecommunications infrastructure. Li (2009) examines data on 22mobile carriers from 7 countries over the time period 1995–2007 and shows that regulatoryindependence is associated with a higher mobile penetration and network expansion,and greater technical efficiency, TFP growth and innovation. Moreover, this effect isparticularly significant when firms are privately controlled.
13. Cambini and Spiegel (2011) formalize this idea in the context of a theoretical modelthat explicitly accounts for partial ownership of the regulated firm by the state and for theregulator’s ability to make long-term commitments. They show that the regulated priceis an increasing function of the firm’s debt level, but the value of this function is higherin the presence of an IRA. As a result the cost of issuing debt is lower for firms that facean IRA and hence these firms end up having a higher leverage.
Capital Structure and Regulation 527
Hypothesis 2: An increase (decrease) in leverage leads to an increase (decrease)in regulated prices provided that the firm is privately controlledand regulated by an IRA.
Hypotheses 1 and 2 exploit the heterogeneity in our sampleacross ownership structures (private vs. state control) and regulatoryframeworks (independent vs. non independent regulatory agencies)to examine the strategic interaction between regulation and capitalstructure.
4. Data and Main Variables
Using Worldscope, we identify publicly traded firms operating inregulated sectors during the period 1994–2005 in the EU-15 memberstates. We define regulated sectors to be those in which entry andprices are subject to regulatory oversight either by the state or byan IRA. These sectors include electricity, natural gas, water supply,telecommunications, freight roads concessions, ports, and airports.Excluded from the sample are airlines, oil and refinery companies, andcompanies operating exclusively in wireless telecommunications or inelectricity generation because the prices of these services are typicallynot regulated.
By applying these selection criteria, we end up with an unbalancedpanel of 92 publicly traded utilities and transportation infrastructureoperators. In all, we have 44 firms that engage in electricity and gasdistribution, 13 water supply companies, 15 telecoms (mainly verticallyintegrated operators), 8 freight roads concessionaires, and 12 transporta-tion infrastructure operators (airport, ports, and docks). Appendix Blists the firms in our sample and provides relevant information on eachfirm. Table II provides summary statistics for the main variables we usein the econometric analysis.
As mentioned above, our main objective is to find out if andhow capital structure and regulated prices are affected by regulatoryindependence and by firm ownership. In the rest of this section wedescribe in detail how we constructed our main dependent variables(leverage and regulated prices) and our main explanatory variables(regulation and ownership). Apart from these variables we also use inour regression analysis in Section 5 various firm level controls that wewill described below in the relevant regressions in which they are used.
4.1 Leverage and Regulated Prices
To test our theoretical predictions, it is important for us to use a measureof leverage that captures the risk of default because the theory suggests

528 Journal of Economics & Management Strategy
Table II.
Summary Statistics
Variable Mean Std. Dev. Min Max No. Obs.
Panel A: Full sample 1994–2005
Market Leverage 0.181 0.168 0 0.881 765Book Leverage 0.272 0.215 0 1 889Real Total Asset (inmillions of 2005 dollars)
20,245 32,951 30 205,179 891
Real Sales (in millions of2005 dollars)
9,262 14,750 4 80,226 891
Tangibility 0.622 0.210 0.034 0.967 890EBIT-to-Total Asset 0.074 0.099 −1.948 0.299 871Market-to-Book 1.416 0.736 0.572 14.176 767Nondebt Tax Shield 0.052 0.03 0 0.183 891State’s UCR 0.348 0.359 0 1 891
Panel B: Privately controlled utilities (50%)
Market Leverage 0.191 0.175 0 0.881 537Book Leverage 0.287 0.222 0 1 552Real Total Assets (in
millions of 2005dollars)
20,335 28,227 41 156,216 552
Real Sales (in millions of2005 dollars)
10,083 14,757 4 75,287 552
Tangibility 0.620 0.225 0.034 0.967 551EBIT-to-Total Asset 0.075 0.104 −1.948 0.293 546Market-to-Book 1.388 0.575 0.664 9.675 537Nondebt Tax Shield 0.048 0.029 0.003 0.183 552State’s UCR 0.10 0.15 0 0.499 552
Panel C: State-controlled utilities
Market Leverage 0.156 0.150 0 0.757 228Book Leverage 0.246 0.202 0 1 337Real Total Assets (in
millions of 2005dollars)
20,097 39,450 30 205,179 339
Real Sales (in millions of2005 dollars)
7,924 14,640 8 80,266 339
Tangibility 0.625 0.184 0.068 0.962 339EBIT-to-Total Asset 0.071 0.090 −0.975 0.299 325Market-to-Book 1.482 1.015 0.572 14.177 230Nondebt Tax Shield 0.058 0.031 0 0.161 339State’s UCR 0.751 0.196 0.5 1 339

Capital Structure and Regulation 529
that leverage induces regulators to raise prices in order to minimizethe risk of costly financial distress. Therefore, in most of the analysis,our measure of leverage will be market leverage that is defined as totalfinancial debt (both long- and short-term) in book values divided by thesum of total financial debt and the market value of equity.14 The latteris computed by multiplying the number of outstanding shares at theend of the relevant year by the share price at that date converted intoU.S. dollars. It should be emphasized that market leverage can increase(decrease) either because the face value of debt increases (decreases) orbecause the market value of equity decreases (increases). We believehowever that in both cases, the firm becomes more vulnerable tofinancial distress and hence regulators may be forced to raise regulatedprices. In some of our analysis we will also use the book value ofleverage, that is, the total financial debt divided by the sum of totalfinancial debt and the book value of equity, as an alternative a measureof leverage to check the robustness of the results.
Accounting and financial market data have been collected fromWorldscope. Table II shows that the mean market leverage in our sampleis 18.1%, while mean book leverage is 27.2%. Moreover, market leverageis higher for privately controlled firms than for state-controlled firms(19.1% vs. 15.6%). Table II reveals a large variability in the debt ratios:market leverage (D/(D + ME)) ranges from 0 to 88%, while bookleverage may be as large as 100%.15 Unreported statistics at the industrylevel shows that on average, the most highly leveraged firms in oursample are electric utilities with a mean market leverage of 22.8%,followed by multiutilities, 19.2%, and telecoms with a mean marketleverage of 17.4%. The least leveraged are airports with a mean marketleverage of 5.5%, and ports and docks with a mean market leverageof 8.4%.
To test Hypothesis 2, we need data on regulated prices. Unfortu-nately, we were unable to find reliable data on regulated retail pricesat the individual firm level. Instead, we collected country- and sector-specific retail price indices (see Appendix A for the sources).16 All priceindices are in constant 2005 prices. We believe that given that there is stilllimited competition in the utilities sectors and given that there is little
14. See Rajan and Zingales (1995) for a discussion of alternative leverage measures.Notice that ideally, market leverage would also include the market value of debt. However,because debt is not always publicly traded, we were unable to find reliable data on themarket value of debt. For this reason we also cannot include bond ratings as a controlvariable in our regression analysis.
15. Only 2 firms in our data have zero leverage: Aereoporti di Firenze and ThessalonikiWater, both are state-controlled.
16. We were unable however to find price indices for airports, ports, and docks, whoseservices are considered to be intermediate rather than final services.
530 Journal of Economics & Management Strategy
price dispersion, these price indices appropriately reflect the relevantprices for the firms in our sample.17
4.2 Regulation
In order to study the effect of regulatory independence on the interactionbetween capital structure and regulated prices, we constructed an IRAdummy that is equal to 1 in all years in which the firm was subjectto regulation by an IRA and equals 0 otherwise, that is when the firmis subject to regulatory oversight by the state or by local governments.Hence, for each sector/country in our dataset, the IRA dummy switchesfrom 0 to 1 in the year when the IRA was set up. The IRA dummywas constructed using the inception dates collected by Gilardi (2002)for the energy and telecommunications sectors in which IRAs alreadyexist in all countries in our sample. We complemented this data bydrawing from additional sources for freight roads, airports, port anddocks, and water. As described in Section 2, except for the water andrailway industries in the UK, in all other member states IRAs were notin place in the water and transportation sectors.
4.3 Ownership
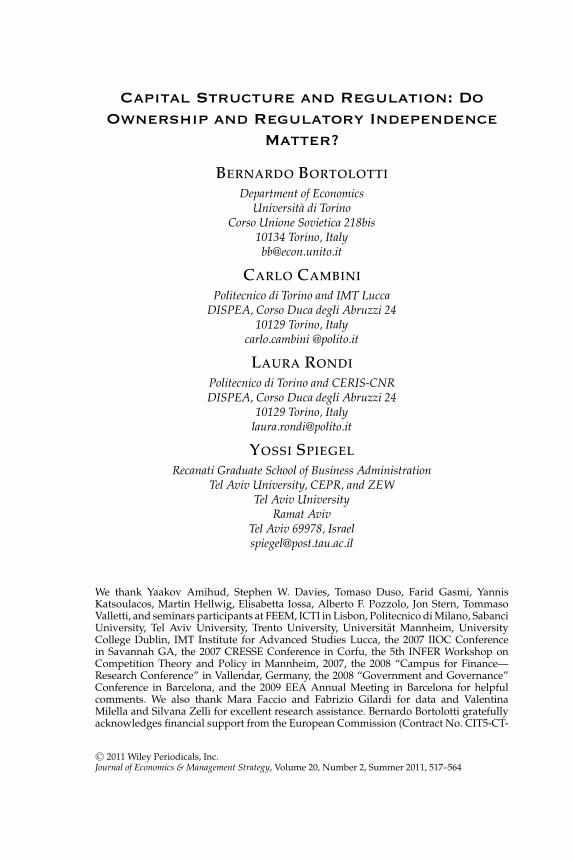
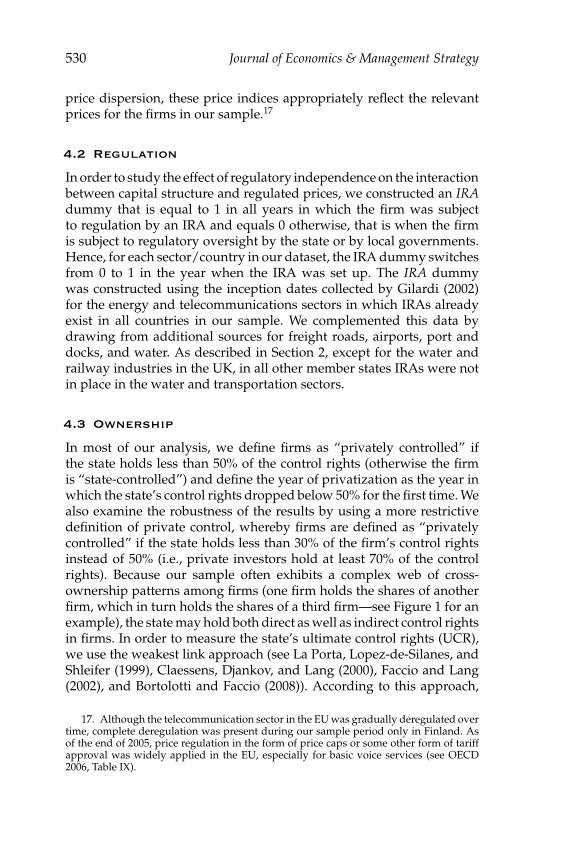
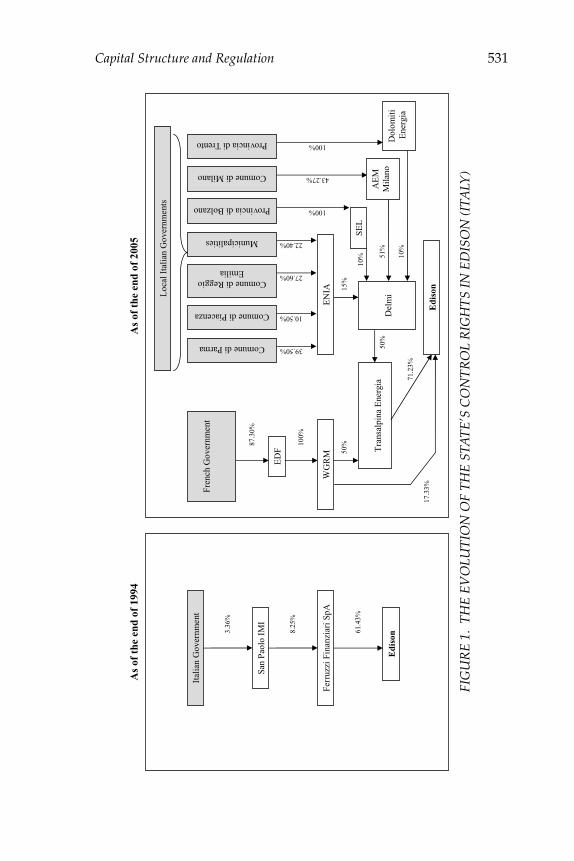
In most of our analysis, we define firms as “privately controlled” ifthe state holds less than 50% of the control rights (otherwise the firmis “state-controlled”) and define the year of privatization as the year inwhich the state’s control rights dropped below 50% for the first time. Wealso examine the robustness of the results by using a more restrictivedefinition of private control, whereby firms are defined as “privatelycontrolled” if the state holds less than 30% of the firm’s control rightsinstead of 50% (i.e., private investors hold at least 70% of the controlrights). Because our sample often exhibits a complex web of cross-ownership patterns among firms (one firm holds the shares of anotherfirm, which in turn holds the shares of a third firm—see Figure 1 for anexample), the state may hold both direct as well as indirect control rightsin firms. In order to measure the state’s ultimate control rights (UCR),we use the weakest link approach (see La Porta, Lopez-de-Silanes, andShleifer (1999), Claessens, Djankov, and Lang (2000), Faccio and Lang(2002), and Bortolotti and Faccio (2008)). According to this approach,
17. Although the telecommunication sector in the EU was gradually deregulated overtime, complete deregulation was present during our sample period only in Finland. Asof the end of 2005, price regulation in the form of price caps or some other form of tariffapproval was widely applied in the EU, especially for basic voice services (see OECD2006, Table IX).
Capital Structure and Regulation 531
As
of t
he e
nd o
f 19
94
As
of t
he e
nd o
f 20
05
Edi
son
Ital
ian
Gov
ernm
ent
San
Pao
lo I
MI
3.36
%
Fer
ruzz
i Fin
anzi
ari S
pA
8.25
%
61.4
3%
Edi
son
Loc
al I
tali
an G
over
nmen
ts
Comune di Milano
Comune di Parma
Comune di Piacenza
Comune di Reggio Emilia
Municipalities
Provincia di Bolzano
EN
IA
Del
mi
15%
39.50%
10.50%
27.60%
22.40%
SE
L
100%
43.27%
10%
51%
Fre
nch
Gov
ernm
ent
ED
F
WG
RM
Tra
nsal
pina
Ene
rgia
50
%
71.2
3%
87.3
0%
100%
50%
17.3
3%
AE
M
Mil
ano
Provincia di Trento 100% Dol
omit
i E
nerg
ia
10%
FIG
UR
E1.
THE
EVO
LUTI
ON
OF
THE
STA
TE’S
CO
NTR
OL
RIG
HTS
INED
ISO
N(I
TALY
)
532 Journal of Economics & Management Strategy
the UCR of a given investor (the state in our case) is simply equal to theminimum ownership stake along a chain (i.e., the weakest link). In thecase of multiple chains, the UCR’s are summed up across all chains.18
The sources used to compute the state’s UCR are listed inAppendix A.19
Among the 92 firms in our sample, 43 firms are privately controlledthroughout our sample, 25 are state-controlled throughout our sampleperiod, and 24 were privatized during our sample period and hencewe observe them before and after their privatization.20 Table II showsthat the mean UCR of the state (including both central and local gov-ernments, ministries, and various branches of public administration) inthe firms in our sample is 34.8% for the entire sample, 10% for privatelycontrolled firms, and 75.1% for state-controlled firms. In terms of size,the mean total assets of firms in our sample are slightly over 20 billiondollars (in constant 2005 prices) and this figure is similar for privatelyand state-controlled firms. The mean annual sales (in constant price2005) are 10,083 million dollars for privately controlled firms and 7,924million dollars for state-controlled firms.
Our definition of private control may be overstated due to thepresence of “golden shares,” which give the state special control rightsin the firm, including the right to appoint board members, the rightto veto proposed acquisitions, and the right to cap the share of votingrights that individual shareholders can own. Our sample includes 11firms with golden shares (see Table II). Of these firms, 4 are telecoms,4 are electric utilities, 2 are natural gas utilities, and 1 is an airport. Inpractically all cases, golden shares are present only when the firm isprivately controlled.
5. Empirical Results
Our main goal is to test Hypotheses 1–2 stated in Section 3. In thefollowing subsections we examine these hypotheses in turn.
18. To illustrate, suppose that an investor has an ownership stake of 50% in firm Aand 30% in firm B. Firm A in turn has a 30% ownership stake in firm C, while firm B hasa 10% ownership stake in firm C. Then, the investor’s UCR in firm C is equal to min (50,30) + min (30, 10) = 40.
19. In some cases, firms in our data have shares with multiple voting rights, althoughas of May 1998, such shares were outlawed in Italy, Spain, the U.K., and Germany.Unfortunately, our data sources do not report the identity of the owners of these sharesand hence we must treat them as ordinary shares. As a result, our data on state’s UCRmay be biased downward.
20. To the best of our knowledge, none of the 25 firms in our sample that were stillstate-controlled by the end of 2005 was privatized in 2006–2009.
Capital Structure and Regulation 533
Table III.
Mean Market Leverage by Ownership and
Regulation Types
Total IRA does RegulationObservations IRA Exists not Exist Difference
N = 765 N = 464 N = 301 p-value
Panel A: Mean market leverage 1994–2005 (50% control threshold)
Total observations 19.9% 15.2% 4.7%(0.8%) (0.9%) p = 0.0001
Privately controlled 19.1% 20.7% 16.4% 4.3%(0.7%) (0.9%) (1.1%) p = 0.004
N = 537 N = 333 N = 204State-controlled 15.6% 17.8% 12.7% 5.1%
(0.9%) (1.2%) (1.5%) p = 0.010N = 228 N = 131 N = 97
Ownership difference 3.4% 2.9% 3.6%p-value p = 0.009 p = 0.103 p = 0.058
Panel B: Mean market leverage 1994–2005 (30% control threshold)
Total observations 19.9% 15.2% 4.7%(0.8%) (0.9%) p = 0.0001
Privately controlled 19.4% 21.0% 16.6% 4.4%(0.8%) (1.1%) (1.3%) p = 0.0131
N = 434 N = 279 N = 155State-controlled 16.3% 18.2% 13.7% 4.5%
(0.8%) (1.1%) (1.2%) p = 0.006N = 331 N = 185 N = 146
Ownership difference 3.1% 2.8% 2.85%p-value p = 0.009 p = 0.086 p = 0.115
Market Leverage is total financial debt divided by the sum of total financial debt and the market value of equity. Thelatter is based on the price and number of outstanding shares at the end of the relevant year in U.S. dollars. Firms aredefined “privately controlled” if the state’s UCR does not exceed 50% (Panels A and C) or 30% (Panels B and D) andare defined as “state-controlled” otherwise. (Standard errors are in parenthesis). The p-values are based on two-sidedtest of the Null hypothesis that the difference in the average leverage between two different groups is equal to 0.
5.1 Leverage
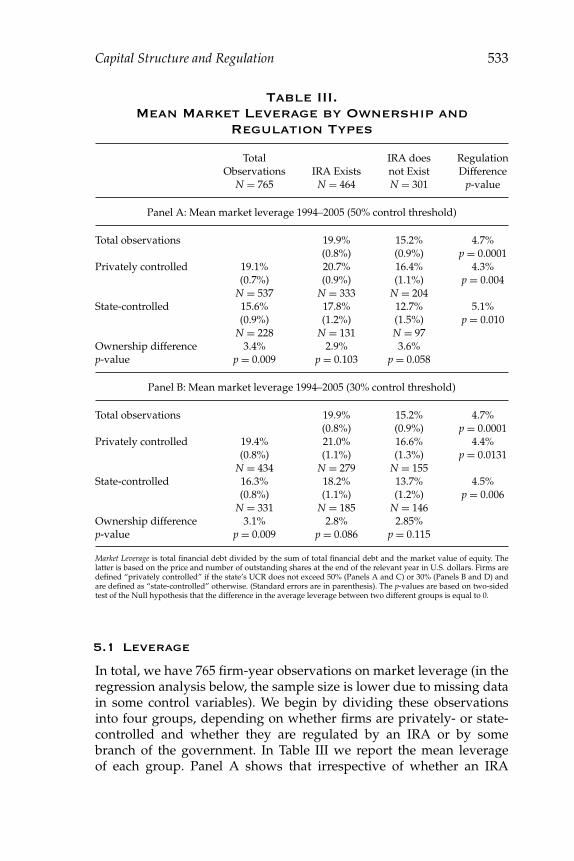
In total, we have 765 firm-year observations on market leverage (in theregression analysis below, the sample size is lower due to missing datain some control variables). We begin by dividing these observationsinto four groups, depending on whether firms are privately- or state-controlled and whether they are regulated by an IRA or by somebranch of the government. In Table III we report the mean leverageof each group. Panel A shows that irrespective of whether an IRA
534 Journal of Economics & Management Strategy
exists, the mean market leverage of regulated firms is significantlyhigher if they are privately controlled, and irrespective of owner-ship, the mean leverage is higher when an IRA exists. Panel B ofTable III shows that these results continue to hold when we use amore stringent definition of private-control (i.e., firms are defined asprivately controlled only if the state’s UCR are 30% or less ratherthan 50% or less). Overall, Table III shows that the mean marketleverage of firms is particularly high when they are privately controlledand subject to regulation by an IRA (20.7% in Panel A and 21% inPanel B) and is particularly low when they are state-controlled andnot subject to regulation by an IRA (12.7% in Panel A and 13.7% inPanel B).
The preliminary results in Table III suggest that both the own-ership structure and the existence of an IRA matter for the financialstructure of regulated firms. In particular, leverage tends to be higherwhen firms are privately controlled and when an IRA exists. Of course,these results are only suggestive because we are yet to control for variouspossible alternative determinants of capital structure. We therefore turnnow to a regression analysis.
Our core specification is the following:
Lit = α0 + α1Private Controlit + α2IRAit + α3Private Controlit × IRAit
+α4Xit+α5Yit+∑
n
μinCountryn+∑
j
ρi j Sector j+∑
t
λtYeart+εi t,(1)
where Lit is the Market Leverage of firm i in year t, Private Controlit isa dummy that is equal to 1 if firm i was privately controlled in yeart and is equal to 0 otherwise, IRAit is a dummy that is equal to 1 iffirm i was subject to regulation by an IRA in year t and is equal to0 otherwise, Xit is a vector of firm-specific variables, Yit is a vector ofcountry-specific variables, Country, Sector, and Year are country, sector,and year dummies, and εit is an error term.
The vector Xit of firm-specific variables includes various firmcharacteristics that were shown in the empirical corporate financeliterature to be reliable determinants of capital structure.21 Our maingoal is to find out if ownership structure and regulatory independencehave a significant effect on leverage (as we show in Table III) evenafter controlling for these alternative potential determinants of capitalstructure. Specifically, the vector Xit includes the log of real total assetsto control for firm’s size (size is typically shown to have a positive effect
21. For common firm characteristics that are included in leverage regressions see forexample, Titman and Wessels (1988), Rajan and Zingales (1995), Fama and French (2002),and Frank and Goyal (2007).

Capital Structure and Regulation 535
of leverage), the ratio of fixed to total assets that reflects asset tangibility(tangible assets can serve a collateral and hence lower the cost of debtfinancing), the ratio of EBIT (earnings before interests and taxes) to totalassets that is a proxy for profitability and “efficiency,” (more efficientfirms are likely to have higher earnings with the same assets), and theratio of depreciation and amortization to total assets as a proxy fornondebt tax shields (tax deductions for depreciations are substitutes forthe tax benefits of debt financing).
Given that our sample covers firms from 14 different countriesover a period of 12 years, we include in the regression a vector Yitof time-varying country-specific variables that includes GDP Growthto account for differences in macroeconomic conditions over time, aPolitical Orientation index that measures the political orientation of thegovernment, and an Investor Protection index that measures the legalprotection of shareholders’ rights (the latter two indices appear in onlysome of our specifications). The Political Orientation index ranges from0 (extreme left wing) to 10 (extreme right wing) and is computed asthe weighted average of the right-left political orientation scores of theparties forming the executive branch of government, where the weightsare equal to the number of parliamentary seats held by each partydivided by the total number of parliamentary seats held by the rulingcoalition as a whole (see Huber and Inglehart, 1995, and Bortolotti andFaccio, 2008). We expect higher values of the Political Orientation index tobe associated with more pro-firm regulation (this is true even when anIRA exists although naturally to a lesser extent). The Investor Protectionindex we use is the “anti-director rights” index developed by La Portaet al. (1998) and updated by Pagano and Volpin (2005). We expect thathigher values of this index would be associated with lower cost of equityand hence lower leverage.
The regulatory and institutional environment in our sample maydiffer across sectors, across countries, and over time. One way to controlfor unobserved characteristics of the regulatory and institutional envi-ronment (like the effectiveness of the regulatory rules, the regulatoryclimate, the internal organization of the regulatory body, etc.) is toinclude country and sector dummies. Unfortunately, time invariantcountry- and sector-specific dummies cannot be estimated by the fixedeffects model because they are perfectly collinear with the firm fixedeffects. Therefore, we often rely on random effect estimation that allowsus to include country- and sector-specific dummies and which is moreefficient. This approach is valid however only when the firm-specificeffect included in the error term is not correlated with the regressors. To
536 Journal of Economics & Management Strategy
ensure that this is the case, we perform the Hausman (1978) specificationtest and report the associated p-values along with the results.22
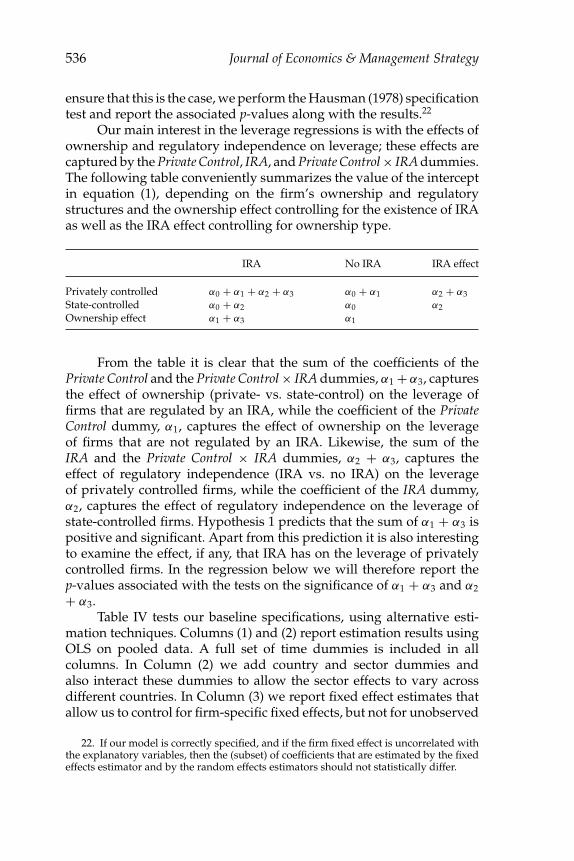
Our main interest in the leverage regressions is with the effects ofownership and regulatory independence on leverage; these effects arecaptured by the Private Control, IRA, and Private Control × IRA dummies.The following table conveniently summarizes the value of the interceptin equation (1), depending on the firm’s ownership and regulatorystructures and the ownership effect controlling for the existence of IRAas well as the IRA effect controlling for ownership type.
IRA No IRA IRA effect
Privately controlled α0 + α1 + α2 + α3 α0 + α1 α2 + α3State-controlled α0 + α2 α0 α2Ownership effect α1 + α3 α1
From the table it is clear that the sum of the coefficients of thePrivate Control and the Private Control × IRA dummies, α1 + α3, capturesthe effect of ownership (private- vs. state-control) on the leverage offirms that are regulated by an IRA, while the coefficient of the PrivateControl dummy, α1, captures the effect of ownership on the leverageof firms that are not regulated by an IRA. Likewise, the sum of theIRA and the Private Control × IRA dummies, α2 + α3, captures theeffect of regulatory independence (IRA vs. no IRA) on the leverageof privately controlled firms, while the coefficient of the IRA dummy,α2, captures the effect of regulatory independence on the leverage ofstate-controlled firms. Hypothesis 1 predicts that the sum of α1 + α3 ispositive and significant. Apart from this prediction it is also interestingto examine the effect, if any, that IRA has on the leverage of privatelycontrolled firms. In the regression below we will therefore report thep-values associated with the tests on the significance of α1 + α3 and α2+ α3.
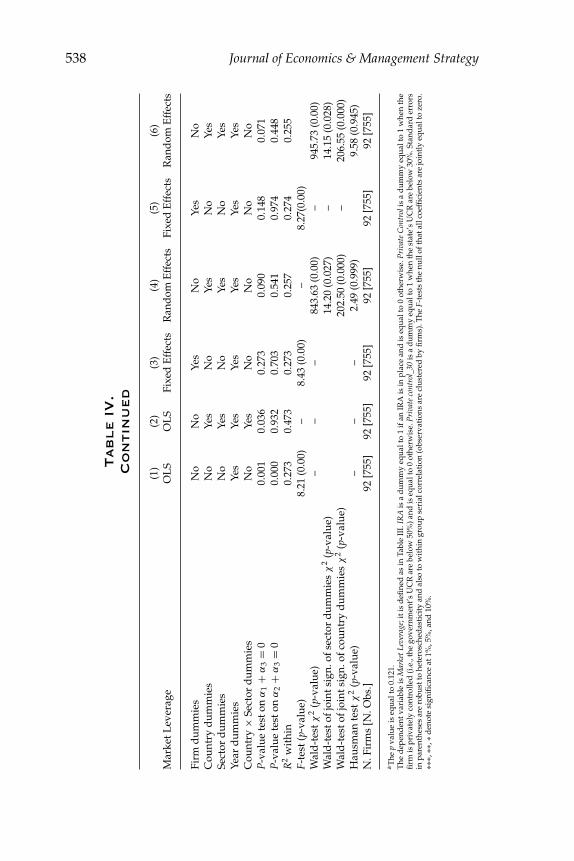
Table IV tests our baseline specifications, using alternative esti-mation techniques. Columns (1) and (2) report estimation results usingOLS on pooled data. A full set of time dummies is included in allcolumns. In Column (2) we add country and sector dummies andalso interact these dummies to allow the sector effects to vary acrossdifferent countries. In Column (3) we report fixed effect estimates thatallow us to control for firm-specific fixed effects, but not for unobserved
22. If our model is correctly specified, and if the firm fixed effect is uncorrelated withthe explanatory variables, then the (subset) of coefficients that are estimated by the fixedeffects estimator and by the random effects estimators should not statistically differ.

Capital Structure and Regulation 537
Tab
le
IV
.
Lever
ag
e,R
eg
ulatio
nan
dO
wn
er
sh
ip:T
he
Baselin
eE
qu
atio
n
(1)
(2)
(3)
(4)
(5)
(6)
Mar
ketL
ever
age
OL
SO
LS
Fixe
dE
ffec
tsR
and
omE
ffec
tsFi
xed
Eff
ects
Ran
dom
Eff
ects
Log
ofre
alto
tala
sset
s0.
028∗∗
∗0.
020∗
0.08
4∗∗∗
0.03
5∗∗∗
0.08
4∗∗∗
0.03
4∗∗∗
(0.0
05)
(0.0
10)
(0.0
25)
(0.0
10)
(0.0
25)
(0.0
10)
Fixe
d-t
o-to
tala
sset
s−0
.106
∗−0
.118
∗−0
.242
∗∗∗
−0.1
31∗∗
−0.2
42∗∗
∗−0
.120
∗∗
(0.0
55)
(0.0
62)
(0.0
90)
(0.0
55)
(0.0
90)
(0.0
57)
EB
IT-t
o-to
tala
sset
s−0
.356
∗∗∗
−0.3
26∗∗
∗−0
.316
∗∗∗
−0.3
22∗∗
∗−0
.323
∗∗∗
−0.3
32∗∗
∗
(0.0
81)
(0.0
76)
(0.0
78)
(0.0
79)
(0.0
78)
(0.0
79)
Non
deb
ttax
shie
ld−0
.957
∗∗∗
−1.2
00∗∗
∗−0
.939
∗−1
.187
∗∗∗
−0.9
78∗∗
−1.2
02∗∗
∗
(0.3
06)
(0.4
37)
(0.4
92)
(0.4
05)
(0.5
00)
(0.4
03)
GD
Pgr
owth
−0.0
19∗∗
−0.0
30∗∗
∗−0
.027
∗∗∗
−0.0
29∗∗
∗−0
.026
∗∗∗
−0.0
28∗∗
∗
(0.0
08)
(0.0
09)
(0.0
09)
(0.0
08)
(0.0
09)
(0.0
08)
Priv
ate
cont
rol(
α1)
−0.0
31−0
.053
−0.0
16−0
.020
––
(0.0
31)
(0.0
40)
(0.0
32)
(0.0
28)
––
Priv
ate
cont
rol_
30(α
1)–
––
–−0
.006
−0.0
03–
––
–(0
.031
)(0
.026
)IR
A(α
2)−0
.028
−0.1
57∗∗
∗−0
.072
−0.0
64∗
−0.0
70∗
−0.0
45(0
.035
)(0
.056
)(0
.044
)(0
.037
)(0
.038
)(0
.030
)Pr
ivat
eco
ntro
l×IR
A(α
3)0.
084∗∗
0.16
0∗∗∗
0.06
2a0.
077∗
∗–
–(0
.042
)(0
.057
)(0
.040
)(0
.035
)–
–Pr
ivat
eco
ntro
l_30
×IR
A(α
3)–
––
–0.
069∗
0.06
3∗∗
––
––
(0.0
39)
(0.0
32)
Con
tinue
d
538 Journal of Economics & Management Strategy
Tab
le
IV
.
Co
ntin
ued
(1)
(2)
(3)
(4)
(5)
(6)
Mar
ketL
ever
age
OL
SO
LS
Fixe
dE
ffec
tsR
and
omE
ffec
tsFi
xed
Eff
ects
Ran
dom
Eff
ects
Firm
dum
mie
sN
oN
oYe
sN
oYe
sN
oC
ount
ryd
umm
ies
No
Yes
No
Yes
No
Yes
Sect
ord
umm
ies
No
Yes
No
Yes
No
Yes
Year
dum
mie
sYe
sYe
sYe
sYe
sYe
sYe
sC
ount
ry×
Sect
ord
umm
ies
No
Yes
No
No
No
No
P-va
lue
test
onα
1+
α3
=0
0.00
10.
036
0.27
30.
090
0.14
80.
071
P-va
lue
test
onα
2+
α3
=0
0.00
00.
932
0.70
30.
541
0.97
40.
448
R2
wit
hin
0.27
30.
473
0.27
30.
257
0.27
40.
255
F-te
st(p
-val
ue)
8.21
(0.0
0)–
8.43
(0.0
0)–
8.27
(0.0
0)W
ald
-tes
tχ2
(p-v
alue
)–
––
843.
63(0
.00)
–94
5.73
(0.0
0)W
ald
-tes
tofj
oint
sign
.ofs
ecto
rd
umm
ies
χ2
(p-v
alue
)14
.20
(0.0
27)
–14
.15
(0.0
28)
Wal
d-t
esto
fjoi
ntsi
gn.o
fcou
ntry
dum
mie
sχ
2(p
-val
ue)
202.
50(0
.000
)–
206.
55(0
.000
)H
ausm
ante
stχ
2(p
-val
ue)
––
–2.
49(0
.999
)9.
58(0
.945
)N
.Fir
ms
[N.O
bs.]
92[7
55]
92[7
55]
92[7
55]
92[7
55]
92[7
55]
92[7
55]
a The
pva
lue
iseq
ualt
o0.
121.
The
dep
end
entv
aria
ble
isM
arke
tLev
erag
e;it
isd
efine
das
inTa
ble
III.
IRA
isa
dum
my
equa
lto
1if
anIR
Ais
inpl
ace
and
iseq
ualt
o0
othe
rwis
e.Pr
ivat
eC
ontr
olis
ad
umm
yeq
ualt
o1
whe
nth
efi
rmis
priv
atel
yco
ntro
lled
(i.e
.,th
ego
vern
men
t’sU
CR
are
belo
w50
%)a
ndis
equa
lto
0ot
herw
ise.
Priv
ate
cont
rol_
30is
ad
umm
yeq
ualt
o1
whe
nth
est
ate’
sU
CR
are
belo
w30
%.S
tand
ard
erro
rsin
pare
nthe
ses
are
robu
stto
hete
rosc
hed
asti
city
and
also
tow
ithi
ngr
oup
seri
alco
rrel
atio
n(o
bser
vati
ons
are
clus
tere
dby
firm
s).T
heF-
test
sth
enu
llof
that
allc
oeffi
cien
tsar
ejo
intl
yeq
ualt
oze
ro.
∗∗∗,
∗∗,∗
den
ote
sign
ifica
nce
at1%
,5%
,and
10%
.

Capital Structure and Regulation 539
country- and sector-effects. In Column (4) we turn to random effectsestimation that allows us to include the country and sector dummies inthe estimation. In Columns (5) and (6) we examine the robustness of theresults by replacing the Private Control dummy with the more restrictivePrivate Control_30 dummy. Note that the Wald tests of the country andsector dummies in Columns (4) and (6) indicate that both dummiesare jointly significant (and hence should be included in the regression),while the Hausman specification test indicates that the random effectsmodel is valid. We therefore believe that the random effects model ismore appropriate than the fixed effects model (where we cannot includecountry- and sector-specific dummies).
The estimates in Table IV are very similar across all specifications.The various firm-specific controls are significant and their signs aregenerally consistent with earlier empirical studies on the determinantsof capital structure (see e.g., Rajan and Zingales, 1995). The onlyexception is the negative and significant coefficient on fixed-to-totalassets, which is our proxy for tangibility. Earlier studies typically findthat tangibility has a positive effect on leverage, the logic being thattangible assets can serve as a collateral and hence lower the cost ofdebt financing. In our sample, however, fixed assets are highly firm-specific and nonredeployable (e.g., roads, airports, physical electricityor telecommunications networks) and may therefore serve as poorcollaterals.23
More importantly for us, the sum of the Private Control and PrivateControl × IRA dummies (α1+α3) is positive and mostly significant; theonly exceptions are in Columns (3) and (5) where we use fixed effectsestimates (recall though that in these regressions we cannot includecountry- and sector-specific dummies). These results hold both whenwe use the Private Control dummy (Columns (1)–(4)), as well as whenwe use the more restrictive Private Control_30 dummy (Columns (5) and(6)).24 The findings then provide empirical support for Hypothesis 1
23. Estimating the leverage regressions separately for the subsamples of telecoms,electric utilities, and energy utilities (electricity and natural gas), water, and transportationinfrastructures (freight roads, ports, and airports), reveals that the significant negativecoefficient on tangibility is due to telecoms; the coefficient is not significant for othersectors and is even positive (though not significant) for electric utilities.
24. We tested the robustness of the Private Control_30 × IRA coefficient in Columns(3)–(6) to the clustering of observations by regulatory agencies (i.e., all firms regulated bythe same agency are in the same cluster), and by countries (all firms that belong to thesame country are in the same cluster) rather than by firms, as we do in Table IV. We foundthat when we cluster by regulatory agencies the interacted dummy remains significantin Columns (3) and (4), and when we cluster by countries, the Private Control_30 × IRAdummy is significant in Columns (4)–(6). In addition, because there are some firm-yearobservations where the Market Leverage is zero, we also tested the baseline specification onthe sub-sample of utilities with strictly positive Market Leverage. The resulting coefficient
540 Journal of Economics & Management Strategy
and suggest that when an IRA exists, privately controlled firms havesignificantly higher leverage than state-controlled firms. On the otherhand, the Private Control dummy itself is never significant (this is alsotrue in Tables V–VII below), so absent an IRA, the leverage of privatelycontrolled firms is not significantly different than the leverage of state-controlled firms.
Table IV also shows that the sum of the IRA and Private Control ×IRA dummies (α2 + α3) is not significant: in and of itself, the existenceof an IRA does not have a significant effect on the leverage of privatelycontrolled regulated firms. By contrast, the IRA dummy is negative andin some cases significant; this provides weak support for the hypothesisthat state-controlled firms have a lower leverage in the presence of anIRA. Table VII below shows that this is mainly due to firms that werestate-controlled throughout our sample.
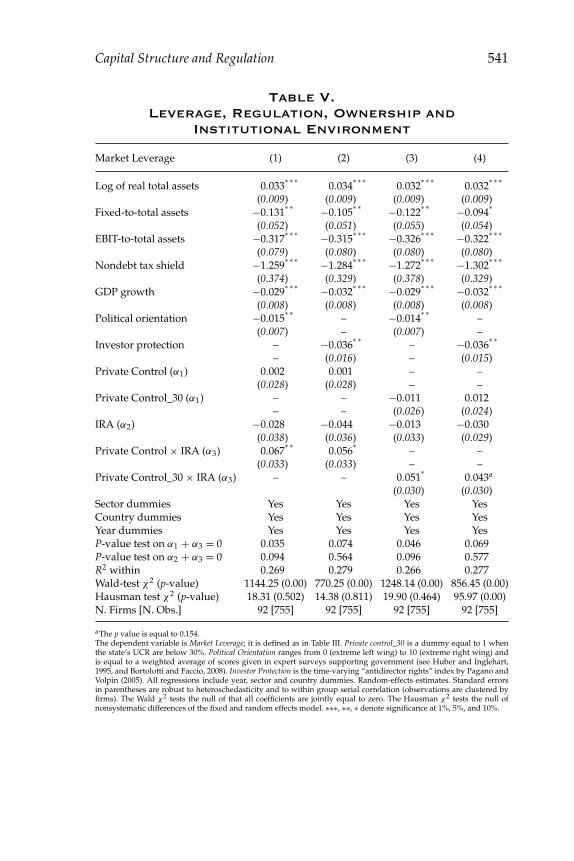
In Table V we add the Political Orientation and Investor Protectionvariables to our core specification to control for institutional factors.25
Columns (1) and (2) use the Private Control dummy, while Columns (3)and (4) use the more restrictive Private Control_30 dummy. Columns (1)and (3) show that the Political Orientation variable, which reflects howright wing the government is, is negative and significant under bothdefinitions of private control. If we think of right-wing governments asbeing more pro-firm, then this result suggests that firms facing morepro-firm governments do not need to rely on high leverage to obtainfavorable regulatory outcomes as much as firms facing pro-consumergovernments. On the other hand, Columns (2) and (4) show, as expected,that stronger investor protection is associated with lower leverage,presumably because it lowers the cost of equity financing. Like Table IV,the results in Table V also provide empirical support for Hypothesis 1as the sum of the Private control and Private control × IRA dummies(α1 + α3) is once again positive and significant across all specifications.Moreover, in Columns (1) and (3), the sum of the IRA and Private control× IRA dummies (α2 + α3) is positive and significant. This suggests thatonce we control for investor protection, privately controlled firms havesignificantly higher leverage when they are subject to regulation by anIRA.
One might argue that the results in Table V are at least partlydriven by exogenous fluctuations in equity markets which affect the
on the Private Control × IRA dummy is 0.081(the p-value is 0.02) and the coefficient on thePrivate Control_30 × IRA dummy is 0.064 (the p-value is 0.04).
25. We do not include the two variables in the same regression because then theHausman specification test rejects the random effects model. As mentioned above, weprefer to use the random effects model because we cannot include country- and sector-specific dummies in fixed effects estimation.
Capital Structure and Regulation 541
Table V.
Leverage, Regulation, Ownership and
Institutional Environment
Market Leverage (1) (2) (3) (4)
Log of real total assets 0.033∗ ∗ ∗
0.034∗ ∗ ∗
0.032∗ ∗ ∗
0.032∗ ∗ ∗
(0.009) (0.009) (0.009) (0.009)Fixed-to-total assets −0.131
∗ ∗ −0.105∗ ∗ −0.122
∗ ∗ −0.094∗
(0.052) (0.051) (0.055) (0.054)EBIT-to-total assets −0.317
∗ ∗ ∗ −0.315∗ ∗ ∗ −0.326
∗ ∗ ∗ −0.322∗ ∗ ∗
(0.079) (0.080) (0.080) (0.080)Nondebt tax shield −1.259
∗ ∗ ∗ −1.284∗ ∗ ∗ −1.272
∗ ∗ ∗ −1.302∗ ∗ ∗
(0.374) (0.329) (0.378) (0.329)GDP growth −0.029
∗ ∗ ∗ −0.032∗ ∗ ∗ −0.029
∗ ∗ ∗ −0.032∗ ∗ ∗
(0.008) (0.008) (0.008) (0.008)Political orientation −0.015
∗ ∗– −0.014
∗ ∗–
(0.007) – (0.007) –Investor protection – −0.036
∗ ∗– −0.036
∗ ∗
– (0.016) – (0.015)Private Control (α1) 0.002 0.001 – –
(0.028) (0.028) – –Private Control_30 (α1) – – −0.011 0.012
– – (0.026) (0.024)IRA (α2) −0.028 −0.044 −0.013 −0.030
(0.038) (0.036) (0.033) (0.029)Private Control × IRA (α3) 0.067
∗ ∗0.056
∗– –
(0.033) (0.033) – –Private Control_30 × IRA (α3) – – 0.051
∗0.043a
(0.030) (0.030)Sector dummies Yes Yes Yes YesCountry dummies Yes Yes Yes YesYear dummies Yes Yes Yes YesP-value test on α1 + α3 = 0 0.035 0.074 0.046 0.069P-value test on α2 + α3 = 0 0.094 0.564 0.096 0.577R2 within 0.269 0.279 0.266 0.277Wald-test χ2 (p-value) 1144.25 (0.00) 770.25 (0.00) 1248.14 (0.00) 856.45 (0.00)Hausman test χ2 (p-value) 18.31 (0.502) 14.38 (0.811) 19.90 (0.464) 95.97 (0.00)N. Firms [N. Obs.] 92 [755] 92 [755] 92 [755] 92 [755]
aThe p value is equal to 0.154.The dependent variable is Market Leverage; it is defined as in Table III. Private control_30 is a dummy equal to 1 whenthe state’s UCR are below 30%. Political Orientation ranges from 0 (extreme left wing) to 10 (extreme right wing) andis equal to a weighted average of scores given in expert surveys supporting government (see Huber and Inglehart,1995, and Bortolotti and Faccio, 2008). Investor Protection is the time-varying “antidirector rights” index by Pagano andVolpin (2005). All regressions include year, sector and country dummies. Random-effects estimates. Standard errorsin parentheses are robust to heteroschedasticity and to within group serial correlation (observations are clustered byfirms). The Wald χ2 tests the null of that all coefficients are jointly equal to zero. The Hausman χ2 tests the null ofnonsystematic differences of the fixed and random effects model. ∗∗∗, ∗∗, ∗ denote significance at 1%, 5%, and 10%.
542 Journal of Economics & Management Strategy
Table VI.
Robustness: Book Leverage Regressions
Book Leverage (1) (2) (3) (4)
Log of real total assets 0.035∗∗∗ 0.033∗∗∗ 0.034∗∗∗ 0.034∗∗∗(0.011) (0.010) (0.010) (0.011)
Fixed-to-total assets −0.264∗∗∗ −0.264∗∗∗ −0.252∗∗∗ −0.260∗∗∗(0.077) (0.076) (0.075) (0.076)
EBIT-to-total assets −0.332∗∗∗ −0.326∗∗∗ −0.327∗∗∗ −0.341∗∗∗(0.097) (0.097) (0.098) (0.097)
Nondebt tax shield −0.900∗∗ −0.936∗∗ −0.951∗∗ −0.887∗∗(0.453) (0.450) (0.430) (0.454)
GDP growth −0.021∗∗ −0.022∗∗ −0.022∗∗ −0.021∗∗(0.010) (0.010) (0.010) (0.010)
Political orientation – −0.012∗ – –– (0.07) – –
Investor protection – – −0.018 –– – (0.013) –
Private control (α1) −0.047 −0.034 −0.038 –(0.031) (0.032) (0.033) –
Private control_30 (α1) – – – −0.052– – – (0.034)
IRA (α2) −0.102∗∗∗ −0.085∗∗ −0.098∗∗∗ −0.092∗∗∗(0.034) (0.036) (0.035) (0.030)
Private control × IRA (α3) 0.115∗∗∗ 0.114∗∗∗ 0.108∗∗∗ –(0.038) (0.038) (0.038) –
Private control_30 × IRA (α3) – – – 0.126∗∗∗– – – (0.037)
Sector dummies Yes Yes Yes YesCountry dummies Yes Yes Yes YesYear dummies Yes Yes Yes YesP-value test on α1 + α3 = 0 0.052 0.021 0.045 0.013P-value test on α2 + α3 = 0 0.648 0.312 0.731 0.282R2 within 0.201 0.208 0.206 0.201Wald-test χ2 (p-value) 906.21 (0.00) 1210.2 (0.00) 995.71 (0.00) 933.78 (0.00)Hausman test χ2 (p-value) 0.93 (1.000) 7.44 (0.995) 12.90 (0.882) 6.12 (0.998)N. Firms [N. Obs.] 92 [869] 92 [869] 92 [869] 92 [869]
The dependent variable is Book Leverage, which is total financial debt divided by the sum of total financial debt and thebook value of equity. The explanatory variables are defined similarly to Table IV. All regressions include year, sector,and country dummies. Random-effects estimates. Standard errors in parentheses are robust to heteroschedasticity andto within group serial correlation (observations are clustered by firms). The Wald χ2 tests the null of that all coefficientsare jointly equal to zero. The Hausman χ2 tests the null of nonsystematic differences of the fixed and random effectsmodel. ∗∗∗ , ∗∗ , ∗ denote significance at 1%, 5%, and 10%.
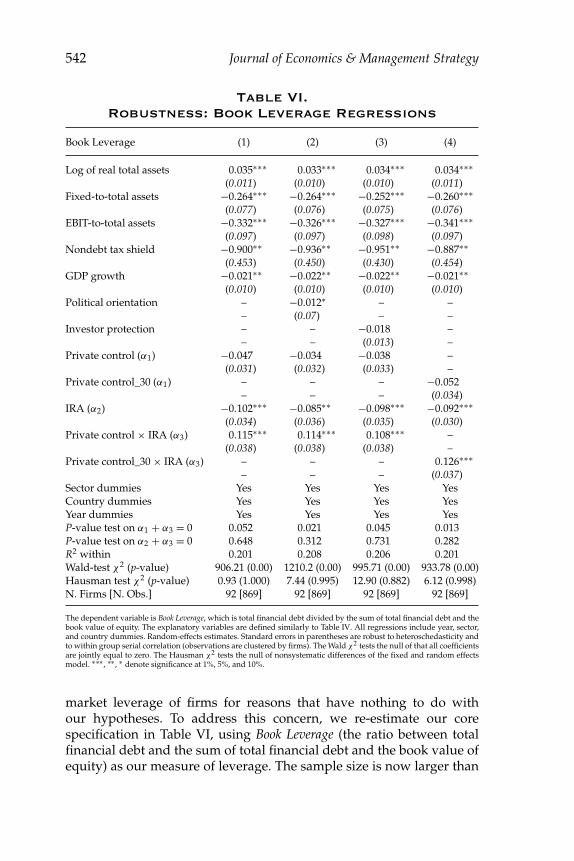
market leverage of firms for reasons that have nothing to do withour hypotheses. To address this concern, we re-estimate our corespecification in Table VI, using Book Leverage (the ratio between totalfinancial debt and the sum of total financial debt and the book value ofequity) as our measure of leverage. The sample size is now larger than
Capital Structure and Regulation 543
Tab
le
VII.
Th
eE
ffect
of
Ow
ner
sh
ip
Str
uctu
re
on
Mar
ket
Lever
ag
e (4)
(1)
(2)
(3)
Priv
atel
yC
ontr
olle
dSt
ate-
Con
trol
led
Mar
ketL
ever
age
Priv
atiz
edU
tilit
ies
Priv
atiz
edU
tilit
ies
Priv
atiz
edU
tilit
ies
Thr
ough
outt
hePe
riod
Thr
ough
outt
hePe
riod
Log
ofre
alto
tala
sset
s0.
040∗
∗∗0.
040∗
∗∗0.
042∗
∗∗0.
022∗
0.03
9∗∗∗
(0.0
10)
(0.0
10)
(0.0
10)
(0.0
13)
(0.0
13)
Fixe
d-t
o-to
tala
sset
s−0
.078
−0.0
75−0
.110
∗−0
.152
∗∗∗
0.19
1(0
.060
)(0
.063
)(0
.063
)(0
.055
)(0
.150
)E
BIT
-to-
tota
lass
ets
−0.9
34∗∗
∗−0
.929
∗∗∗
−0.8
79∗∗
∗−0
.370
∗∗∗
0.18
7∗∗∗
(0.2
08)
(0.2
07)
(0.2
09)
(0.0
41)
(0.0
44)
Non
deb
ttax
shie
ld−2
.153
∗∗∗
−2.1
51∗∗
∗−2
.439
∗∗∗
−1.0
37∗∗
−2.3
54∗∗
∗(0
.481
)(0
.485
)(0
.475
)(0
.522
)(0
.854
)G
DP
grow
th−0
.025
∗∗−0
.025
∗∗−0
.027
∗∗−0
.027
−0.0
27∗∗
∗(0
.011
)(0
.012
)(0
.011
)(0
.017
)(0
.009
)Po
litic
alor
ient
atio
n−0
.006
−0.0
06−0
.005
−0.0
27∗∗
∗−0
.019
(0.0
17)
(0.0
17)
(0.0
18)
(0.0
09)
(0.0
13)
Priv
ate
cont
rol(
α1)
0.00
7−0
.000
−0.0
18–
–(0
.038
)(0
.033
)(0
.038
)–
–IR
A(α
2)0.
080∗
0.06
70.
090∗
0.06
7∗−0
.260
∗∗∗
0.04
5(0
.050
)(0
.047
)(0
.037
)(0
.055
)Pr
ivat
eco
ntro
l×IR
A(α
3)–
0.01
60.
069∗
––
–(0
.043
)(0
.041
)–
–
Con
tinue
d
544 Journal of Economics & Management StrategyT
ab
le
VII.
Co
ntin
ued
(4)
(1)
(2)
(3)
Priv
atel
yC
ontr
olle
dSt
ate-
Con
trol
led
Mar
ketL
ever
age
Priv
atiz
edU
tilit
ies
Priv
atiz
edU
tilit
ies
Priv
atiz
edU
tilit
ies
Thr
ough
outt
hePe
riod
Thr
ough
outt
hePe
riod
Gol
den
shar
es(α
4)–
–0.
066
––
––
(0.0
69)
––
Gol
den
shar
es×
IRA
(α5)
––
−0.1
30∗
––
–(0
.078
)–
–Se
ctor
dum
mie
sYe
sYe
sYe
sYe
sC
ount
ryd
umm
ies
Yes
Yes
Yes
Yes
Year
dum
mie
sYe
sYe
sYe
sYe
sYe
ar×
Priv
ate/
Stat
ed
umm
ies
No
No
No
Yes
Sect
or×
Priv
ate/
Stat
ed
umm
ies
No
No
No
Yes
P-va
lue
test
onα
1+
α3
=0
0.77
00.
312
P-va
lue
test
onα
1+
α3
+α
4+
α5
=0
0.90
3P-
valu
ete
ston
α1
+α
4=
00.
443
P-va
lue
test
onα
4+
α5
=0
0.18
9P-
valu
ete
ston
α2
+α
3=
00.
084
0.00
0P-
valu
ete
ston
α2
+α
3+
α5
=0
0.65
8R
2w
ithi
n0.
445
0.44
50.
447
0.25
7W
ald
-tes
tχ2
(p-v
alue
)10
800
(0.0
0)22
25(0
.00)
5234
.86
(0.0
0)46
843.
71(0
.00)
Hau
sman
test
χ2
(p-v
alue
)17
.31(
0.50
2)7.
57(0
.991
)12
.90
(0.9
12)
13.9
0(0
.999
)N
.Fir
ms
[N.O
bs.]
25[1
95]
25[1
95]
25[1
95]
66[5
52]
Var
iabl
esar
ed
efine
dsi
mila
rly
toTa
ble
IV.C
olum
ns(1
)–(3
)exa
min
ea
subs
ampl
eof
firm
sth
atw
ere
priv
atiz
ed(i
.e.,
the
stat
e’s
UC
Rw
entb
elow
50%
)dur
ing
our
sam
ple
peri
od.W
eob
serv
eth
ese
firm
sbe
fore
and
afte
rpr
ivat
izat
ion.
Gol
den
Shar
esis
ad
umm
yeq
ualt
o1
whe
ngo
lden
shar
esar
ein
plac
ean
deq
uals
0ot
herw
ise.
Col
umn
(4)
repo
rts
resu
lts
for
the
subs
ampl
eof
utili
ties
that
rem
aine
dei
ther
priv
atel
y-or
stat
e-co
ntro
lled
thro
ugho
utou
rsa
mpl
epe
riod
.All
regr
essi
ons
incl
ude
year
,sec
tor,
and
coun
try
dum
mie
s.In
Col
umn
(4)t
hese
ctor
and
the
year
dum
mie
sar
eal
soin
tera
cted
wit
hth
ePr
ivat
eC
ontr
olan
dth
eSt
ate
Con
trol
dum
mie
s(t
heSt
ate
Con
trol
dum
my
isd
efine
das
1-Pr
ivat
eC
ontr
ol).
Ran
dom
effe
cts
esti
mat
es.S
tand
ard
erro
rsin
pare
nthe
ses
are
robu
stto
hete
rosc
hed
asti
city
and
tow
ithi
ngr
oup
seri
alco
rrel
atio
n(o
bser
vati
ons
are
clus
tere
dby
firm
s).T
heW
ald
χ2
test
sth
enu
llof
that
allc
oeffi
cien
tsar
ejo
intl
yeq
ualt
oze
ro.T
heH
ausm
anχ
2te
sts
the
null
ofno
nsys
tem
atic
dif
fere
nces
ofth
efi
xed
and
rand
omef
fect
sm
odel
.∗∗∗
,∗∗ ,
∗d
enot
esi
gnifi
canc
eat
1%,5
%,a
nd10
%.
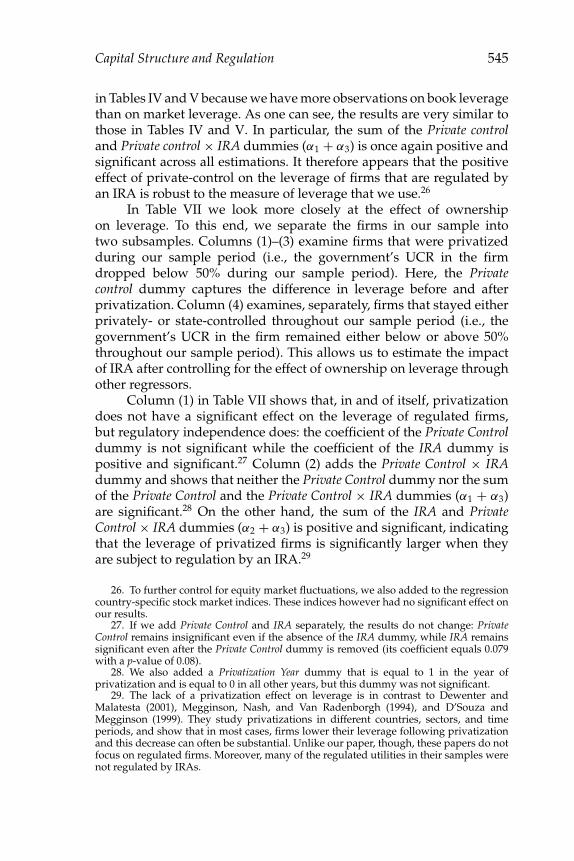
Capital Structure and Regulation 545
in Tables IV and V because we have more observations on book leveragethan on market leverage. As one can see, the results are very similar tothose in Tables IV and V. In particular, the sum of the Private controland Private control × IRA dummies (α1 + α3) is once again positive andsignificant across all estimations. It therefore appears that the positiveeffect of private-control on the leverage of firms that are regulated byan IRA is robust to the measure of leverage that we use.26
In Table VII we look more closely at the effect of ownershipon leverage. To this end, we separate the firms in our sample intotwo subsamples. Columns (1)–(3) examine firms that were privatizedduring our sample period (i.e., the government’s UCR in the firmdropped below 50% during our sample period). Here, the Privatecontrol dummy captures the difference in leverage before and afterprivatization. Column (4) examines, separately, firms that stayed eitherprivately- or state-controlled throughout our sample period (i.e., thegovernment’s UCR in the firm remained either below or above 50%throughout our sample period). This allows us to estimate the impactof IRA after controlling for the effect of ownership on leverage throughother regressors.
Column (1) in Table VII shows that, in and of itself, privatizationdoes not have a significant effect on the leverage of regulated firms,but regulatory independence does: the coefficient of the Private Controldummy is not significant while the coefficient of the IRA dummy ispositive and significant.27 Column (2) adds the Private Control × IRAdummy and shows that neither the Private Control dummy nor the sumof the Private Control and the Private Control × IRA dummies (α1 + α3)are significant.28 On the other hand, the sum of the IRA and PrivateControl × IRA dummies (α2 + α3) is positive and significant, indicatingthat the leverage of privatized firms is significantly larger when theyare subject to regulation by an IRA.29
26. To further control for equity market fluctuations, we also added to the regressioncountry-specific stock market indices. These indices however had no significant effect onour results.
27. If we add Private Control and IRA separately, the results do not change: PrivateControl remains insignificant even if the absence of the IRA dummy, while IRA remainssignificant even after the Private Control dummy is removed (its coefficient equals 0.079with a p-value of 0.08).
28. We also added a Privatization Year dummy that is equal to 1 in the year ofprivatization and is equal to 0 in all other years, but this dummy was not significant.
29. The lack of a privatization effect on leverage is in contrast to Dewenter andMalatesta (2001), Megginson, Nash, and Van Radenborgh (1994), and D’Souza andMegginson (1999). They study privatizations in different countries, sectors, and timeperiods, and show that in most cases, firms lower their leverage following privatizationand this decrease can often be substantial. Unlike our paper, though, these papers do notfocus on regulated firms. Moreover, many of the regulated utilities in their samples werenot regulated by IRAs.
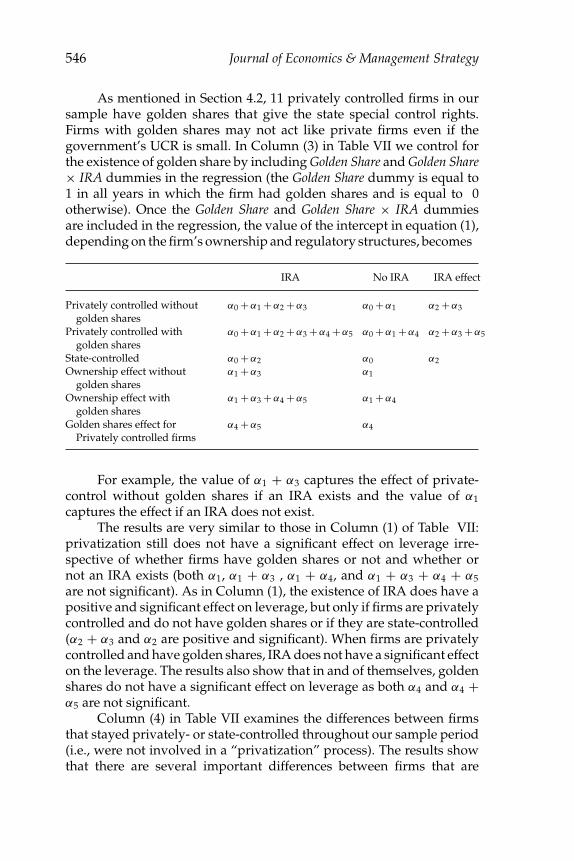
546 Journal of Economics & Management Strategy
As mentioned in Section 4.2, 11 privately controlled firms in oursample have golden shares that give the state special control rights.Firms with golden shares may not act like private firms even if thegovernment’s UCR is small. In Column (3) in Table VII we control forthe existence of golden share by including Golden Share and Golden Share× IRA dummies in the regression (the Golden Share dummy is equal to1 in all years in which the firm had golden shares and is equal to 0otherwise). Once the Golden Share and Golden Share × IRA dummiesare included in the regression, the value of the intercept in equation (1),depending on the firm’s ownership and regulatory structures, becomes
IRA No IRA IRA effect
Privately controlled withoutgolden shares
α0 +α1 +α2 + α3 α0 + α1 α2 +α3
Privately controlled withgolden shares
α0 +α1 +α2 + α3 +α4 + α5 α0 + α1 +α4 α2 +α3 +α5
State-controlled α0 +α2 α0 α2Ownership effect without
golden sharesα1 +α3 α1
Ownership effect withgolden shares
α1 +α3 +α4 + α5 α1 + α4
Golden shares effect forPrivately controlled firms
α4 +α5 α4
For example, the value of α1 + α3 captures the effect of private-control without golden shares if an IRA exists and the value of α1captures the effect if an IRA does not exist.
The results are very similar to those in Column (1) of Table VII:privatization still does not have a significant effect on leverage irre-spective of whether firms have golden shares or not and whether ornot an IRA exists (both α1, α1 + α3 , α1 + α4, and α1 + α3 + α4 + α5are not significant). As in Column (1), the existence of IRA does have apositive and significant effect on leverage, but only if firms are privatelycontrolled and do not have golden shares or if they are state-controlled(α2 + α3 and α2 are positive and significant). When firms are privatelycontrolled and have golden shares, IRA does not have a significant effecton the leverage. The results also show that in and of themselves, goldenshares do not have a significant effect on leverage as both α4 and α4 +α5 are not significant.
Column (4) in Table VII examines the differences between firmsthat stayed privately- or state-controlled throughout our sample period(i.e., were not involved in a “privatization” process). The results showthat there are several important differences between firms that are
Capital Structure and Regulation 547
privately- or state-controlled throughout our sample period. First,tangibility (Fixed-to-Total Assets) has a significantly negative coefficientfor privately controlled firms, but not for state-controlled firms; thisdifference is probably due to the fact that telecoms are heavily rep-resented in the group of privately controlled firms (see Footnote 23above). Second, the measure of profitability (EBIT-to-Total Assets) hasa significant negative effect in the case of privately controlled firms,which is consistent with the typical findings in the empirical corporatefinance literature, but has a significant positive effect in the case of state-controlled firms. Third, the GDP Growth coefficient is significant only inthe case of state-controlled firms, but not in the case of privately con-trolled firms. Fourth, the Political Orientation variable is not significantin the case of state-controlled firms, but is negative and significant inthe case of privately controlled firms. Because an increase in the PoliticalOrientation variable indicates that the government is more right-wingand hence likely to be more pro-firm, the latter result suggests thatwhen privately controlled firms face a more pro-firm government, theydo not need to rely on high leverage to obtain favorable regulatoryoutcomes. The fact that the leverage of state-controlled firms is notaffected by the political orientation variable is consistent with thetheory because state-controlled firms do not need to issue debt to shieldthemselves from regulatory opportunism. Finally, the IRA variable ispositive and significant in the case of privately controlled firms, whichis consistent with Hypothesis 1, and is negative and highly significantin the case of state-controlled firms. The latter result, together withthe fact that Column (1) shows that the IRA variable is positive in thecase of privatized firms, suggests that the negative coefficient of theIRA variable in Table IV is driven by firms that were state-controlledthroughout our sample.
5.2 Leverage and Regulated Prices
Next, we consider Hypothesis 2, which states that higher leverageinduces regulators to raise regulated prices provided that the firm isprivately controlled. When the firm is state-controlled, the state plays adual role of an owner and a regulator and hence the firm does not needto use its leverage as a way to induce higher regulated prices.
To test Hypothesis 2, we apply the Granger (1969) and Sims (1972)causality tests to examine whether leverage Granger-causes regulatedprices. That is, we examine whether an increase in leverage is followedby an increase in regulated prices, but not vice versa.30 There are
30. See Arellano (2003, Ch. 6) for details regarding the use Granger causality tests inthe context of a panel setting and an application to panel data with a relatively shorttime horizon from 1983 to 1990 (our panel data covers a longer period: 1994–2005).
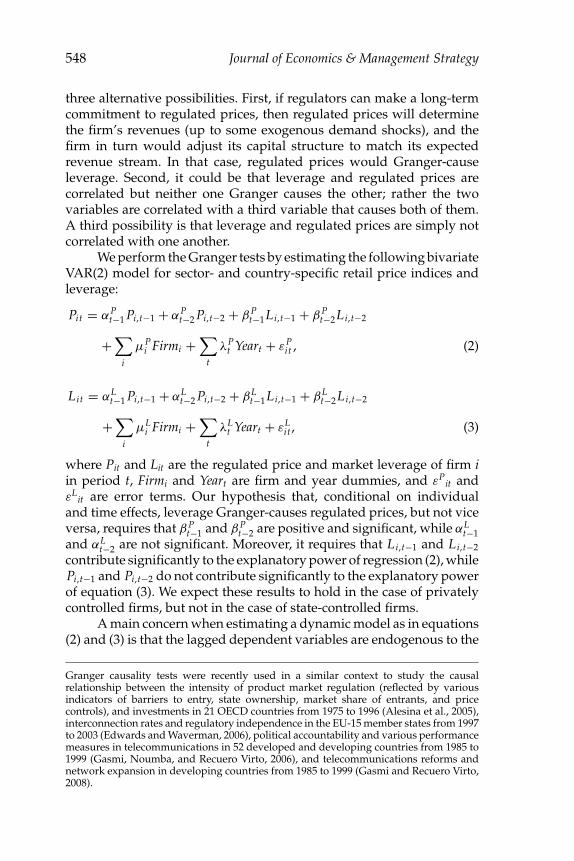
548 Journal of Economics & Management Strategy
three alternative possibilities. First, if regulators can make a long-termcommitment to regulated prices, then regulated prices will determinethe firm’s revenues (up to some exogenous demand shocks), and thefirm in turn would adjust its capital structure to match its expectedrevenue stream. In that case, regulated prices would Granger-causeleverage. Second, it could be that leverage and regulated prices arecorrelated but neither one Granger causes the other; rather the twovariables are correlated with a third variable that causes both of them.A third possibility is that leverage and regulated prices are simply notcorrelated with one another.
We perform the Granger tests by estimating the following bivariateVAR(2) model for sector- and country-specific retail price indices andleverage:
Pit = αPt−1 Pi,t−1 + αP
t−2 Pi,t−2 + β Pt−1 Li,t−1 + β P
t−2Li,t−2
+∑
i
μPi Firmi +
∑
t
λPt Yeart + εP
it , (2)
Lit = αLt−1 Pi,t−1 + αL
t−2 Pi,t−2 + βLt−1Li,t−1 + βL
t−2 Li,t−2
+∑
i
μLi Firmi +
∑
t
λLt Yeart + εL
it, (3)
where Pit and Lit are the regulated price and market leverage of firm iin period t, Firmi and Yeart are firm and year dummies, and εP
it andεL
it are error terms. Our hypothesis that, conditional on individualand time effects, leverage Granger-causes regulated prices, but not viceversa, requires that β P
t−1 and β Pt−2 are positive and significant, while αL
t−1and αL
t−2 are not significant. Moreover, it requires that Li,t−1 and Li,t−2contribute significantly to the explanatory power of regression (2), whilePi,t−1 and Pi,t−2 do not contribute significantly to the explanatory powerof equation (3). We expect these results to hold in the case of privatelycontrolled firms, but not in the case of state-controlled firms.
A main concern when estimating a dynamic model as in equations(2) and (3) is that the lagged dependent variables are endogenous to the
Granger causality tests were recently used in a similar context to study the causalrelationship between the intensity of product market regulation (reflected by variousindicators of barriers to entry, state ownership, market share of entrants, and pricecontrols), and investments in 21 OECD countries from 1975 to 1996 (Alesina et al., 2005),interconnection rates and regulatory independence in the EU-15 member states from 1997to 2003 (Edwards and Waverman, 2006), political accountability and various performancemeasures in telecommunications in 52 developed and developing countries from 1985 to1999 (Gasmi, Noumba, and Recuero Virto, 2006), and telecommunications reforms andnetwork expansion in developing countries from 1985 to 1999 (Gasmi and Recuero Virto,2008).
Capital Structure and Regulation 549
fixed effects in the error term, thus giving rise to a dynamic panelbias. To deal with this bias and with the potential endogeneity of otherregressors in the leverage equation, we use the Arellano and Bond (1991)and Arellano and Bover (1995) linear generalized method of moments(GMM) estimators. More specifically, we use the dynamic System-GMMmodel developed by Arellano and Bond (1991) and Blundell and Bond(1998). This model estimates a system of level and first-differencedequations and uses lags of first-differenced variables as instrumentsfor equations in levels and lags of variables in levels as instruments forequations in first-differences.31 For the validity of the GMM estimatesit is crucial, however, that the instruments are exogenous. We thereforecalculate the two-step Sargan-Hansen statistic under the null of jointvalidity of the instruments and report the resulting p-values withthe regression results. To ensure that the lagged variables are validinstruments, we use the Arellano and Bond (1991) autocorrelation testcontrol for AR(1) and AR(2). Because AR(2) was detected, we restrictthe lags instrumenting the lagged leverage to t − 3 and t − 4.
Tables VIII and IX report the results from estimating equations(2) and (3). In both tables, we examine the full sample in Column (1),and several subsamples in Columns (2)–(7). Table VIII shows that withthe exception of firms which are not regulated by an IRA (Column (3)),or are state-controlled (Column (7)), the second lag of market leveragehas a significant positive effect on regulated prices. Moreover, a Waldstatistic test indicates that the first and second lags of market leverageare jointly significantly. On the other hand, Table IX shows that thelagged regulated prices do not have significant effect on leverage eitherindividually or jointly. Together, these results imply that, so long as firmsare privately controlled and/or regulated by an IRA, leverage Granger-causes regulated prices, but not vice versa. These results are consistentwith the hypothesis that regulated firms which are either privatelycontrolled or regulated by an IRA (or both), choose their leveragestrategically in order to induce regulators to set higher prices, andinconsistent with the alternative hypotheses that long-term regulatorycommitments to prices induce firms to adjust their capital structure tomatch their resulting expected revenue stream, or that leverage andregulated prices are driven by a third variable that causes both of them.The results are also inconsistent with the hypothesis that regulatedprices increase when the firm issues more equity, say because regulatorsbase prices on the firm’s WACC that is in turn decreasing with the firm’sleverage.
31. For estimation we used the xtabond2 Stata command created by David Roodman(2006).
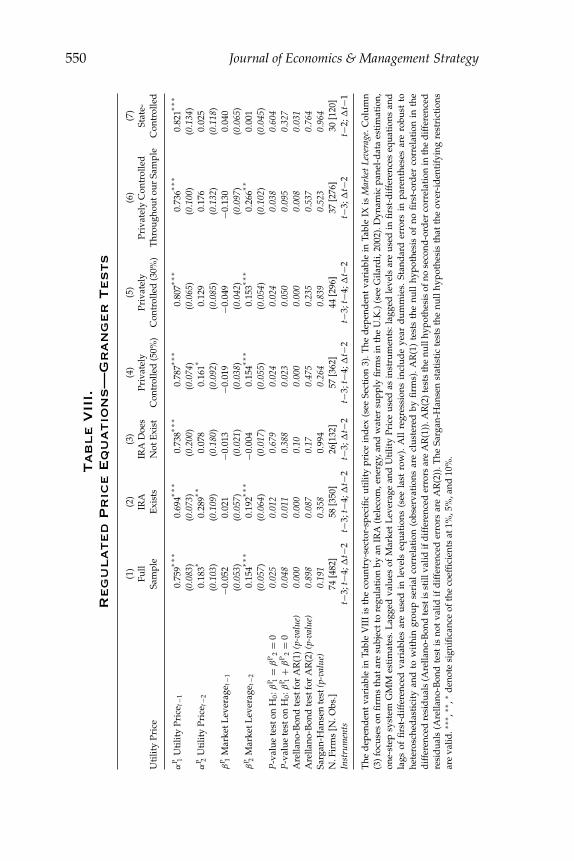
550 Journal of Economics & Management Strategy
Tab
le
VIII.
Reg
ulated
Pr
ice
Eq
uatio
ns—
Gr
an
ger
Tests
(1)
(2)
(3)
(4)
(5)
(6)
(7)
Full
IRA
IRA
Doe
sPr
ivat
ely
Priv
atel
yPr
ivat
ely
Con
trol
led
Stat
e-U
tilit
yPr
ice
Sam
ple
Exi
sts
Not
Exi
stC
ontr
olle
d(5
0%)
Con
trol
led
(30%
)T
hrou
ghou
tour
Sam
ple
Con
trol
led
αP 1
Uti
lity
Pric
e t−1
0.75
9∗∗∗
0.69
4∗∗∗
0.73
8∗∗∗
0.78
7∗∗∗
0.80
7∗∗∗
0.73
6∗∗∗
0.82
1∗∗∗
(0.0
83)
(0.0
73)
(0.2
00)
(0.0
74)
(0.0
65)
(0.1
00)
(0.1
34)
αP 2
Uti
lity
Pric
e t−2
0.18
3∗0.
289∗∗
0.07
80.
161∗
0.12
90.
176
0.02
5(0
.103
)(0
.109
)(0
.180
)(0
.092
)(0
.085
)(0
.132
)(0
.118
)β
P 1M
arke
tLev
erag
e t−1
−0.0
520.
021
−0.0
13−0
.019
−0.0
49−0
.130
0.04
0(0
.053
)(0
.057
)(0
.021
)(0
.038
)(0
.042
)(0
.097
)(0
.065
)β
P 2M
arke
tLev
erag
e t−2
0.15
4∗∗∗
0.19
2∗∗∗
−0.0
040.
154∗∗
∗0.
153∗∗
∗0.
266∗∗
0.00
1(0
.057
)(0
.064
)(0
.017
)(0
.055
)(0
.054
)(0
.102
)(0
.045
)P-
valu
ete
ston
H0:
βP 1
=β
P2
=0
0.02
50.
012
0.67
90.
024
0.02
40.
038
0.60
4P-
valu
ete
ston
H0:
βP 1
+β
P2
=0
0.04
80.
011
0.38
80.
023
0.05
00.
095
0.32
7A
rella
no-B
ond
test
for
AR
(1)(
p-va
lue)
0.00
00.
000
0.10
0.00
00.
000
0.00
80.
031
Are
llano
-Bon
dte
stfo
rA
R(2
)(p-
valu
e)0.
898
0.08
70.
170.
475
0.23
50.
537
0.76
4Sa
rgan
-Han
sen
test
(p-v
alue
)0.
191
0.35
80.
994
0.26
40.
839
0.52
30.
964
N.F
irm
s[N
.Obs
.]74
[482
]58
[350
]26
[132
]57
[362
]44
[296
]37
[276
]30
[120
]In
stru
men
tst−
3;t−
4;�
t−2
t−3;
t−4;
�t−
2t−
3;�
t−2
t−3;
t−4;
�t−
2t−
3;t−
4;�
t−2
t−3;
�t−
2t−
2;�
t−1
The
dep
end
ent
vari
able
inTa
ble
VII
Iis
the
coun
try-
sect
or-s
peci
ficut
ility
pric
ein
dex
(see
Sect
ion
3).T
hed
epen
den
tva
riab
lein
Tabl
eIX
isM
arke
tLe
vera
ge.C
olum
n(3
)foc
uses
onfir
ms
that
are
subj
ectt
ore
gula
tion
byan
IRA
(tel
ecom
,ene
rgy,
and
wat
ersu
pply
firm
sin
the
U.K
.)(s
eeG
ilard
i,20
02).
Dyn
amic
pane
l-d
ata
esti
mat
ion,
one-
step
syst
emG
MM
esti
mat
es.L
agge
dva
lues
ofM
arke
tL
ever
age
and
Uti
lity
Pric
eus
edas
inst
rum
ents
:lag
ged
leve
lsar
eus
edin
first
-dif
fere
nces
equa
tion
san
dla
gsof
firs
t-d
iffe
renc
edva
riab
les
are
used
inle
vels
equa
tion
s(s
eela
stro
w).
All
regr
essi
ons
incl
ude
year
dum
mie
s.St
and
ard
erro
rsin
pare
nthe
ses
are
robu
stto
hete
rosc
hed
asti
city
and
tow
ithi
ngr
oup
seri
alco
rrel
atio
n(o
bser
vati
ons
are
clus
tere
dby
firm
s).A
R(1
)te
sts
the
null
hypo
thes
isof
nofi
rst-
ord
erco
rrel
atio
nin
the
dif
fere
nced
resi
dua
ls(A
rella
no-B
ond
test
isst
illva
lidif
dif
fere
nced
erro
rsar
eA
R(1
)).A
R(2
)tes
tsth
enu
llhy
poth
esis
ofno
seco
nd-o
rder
corr
elat
ion
inth
ed
iffe
renc
edre
sid
uals
(Are
llano
-Bon
dte
stis
not
valid
ifd
iffe
renc
eder
rors
are
AR
(2))
.The
Sarg
an-H
anse
nst
atis
tic
test
sth
enu
llhy
poth
esis
that
the
over
-id
enti
fyin
gre
stri
ctio
nsar
eva
lid.∗∗
∗ ,∗∗
,∗d
enot
esi
gnifi
canc
eof
the
coef
fici
ents
at1%
,5%
,and
10%
.
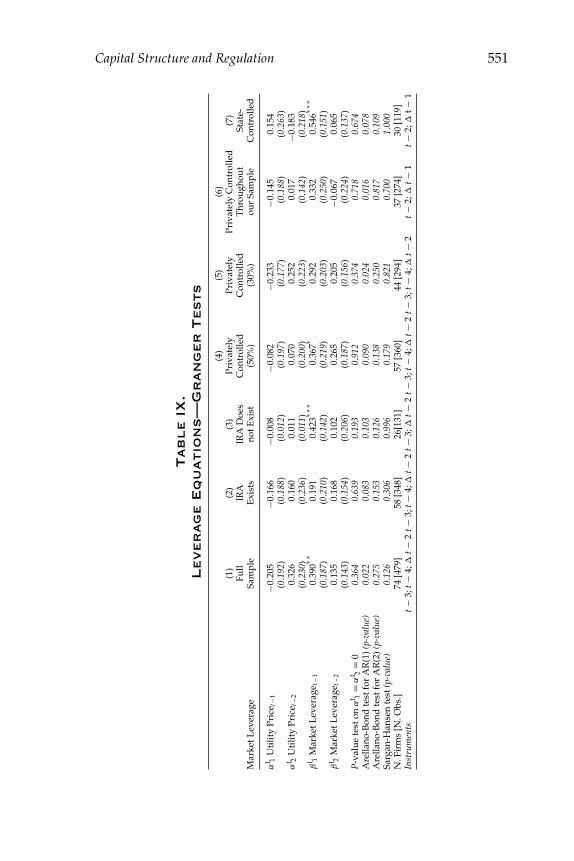
Capital Structure and Regulation 551
Tab
le
IX
.
Lever
ag
eE
qu
atio
ns—
Gr
an
ger
Tests
(4)
(5)
(6)
(1)
(2)
(3)
Priv
atel
yPr
ivat
ely
Priv
atel
yC
ontr
olle
d(7
)Fu
llIR
AIR
AD
oes
Con
trol
led
Con
trol
led
Thr
ough
out
Stat
e-M
arke
tLev
erag
eSa
mpl
eE
xist
sno
tExi
st(5
0%)
(30%
)ou
rSa
mpl
eC
ontr
olle
d
αL 1
Uti
lity
Pric
e t−1
−0.2
05−0
.166
−0.0
08−0
.082
−0.2
33−0
.145
0.15
4(0
.192
)(0
.188
)(0
.012
)(0
.197
)(0
.177
)(0
.188
)(0
.263
)α
L 2U
tilit
yPr
ice t
−20.
326
0.16
00.
011
0.07
00.
252
0.01
7−0
.183
(0.2
30)
(0.2
36)
(0.0
11)
(0.2
00)
(0.2
23)
(0.1
42)
(0.2
18)
βL 1
Mar
ketL
ever
age t
−10.
390∗∗
0.19
10.
423∗∗
∗0.
367∗
0.29
20.
332
0.54
6∗∗∗
(0.1
87)
(0.2
10)
(0.1
42)
(0.2
19)
(0.2
03)
(0.2
50)
(0.1
51)
βL 2
Mar
ketL
ever
age t
−20.
135
0.16
80.
102
0.26
50.
205
−0.0
670.
065
(0.1
43)
(0.1
54)
(0.2
06)
(0.1
87)
(0.1
56)
(0.2
24)
(0.1
37)
P-va
lue
test
onα
L 1=
αL 2
=0
0.36
40.
639
0.19
30.
912
0.37
40.
718
0.67
4A
rella
no-B
ond
test
for
AR
(1)(
p-va
lue)
0.02
20.
083
0.10
30.
090
0.02
40.
016
0.07
8A
rella
no-B
ond
test
for
AR
(2)(
p-va
lue)
0.27
50.
153
0.12
60.
138
0.25
00.
817
0.10
9Sa
rgan
-Han
sen
test
(p-v
alue
)0.
126
0.30
60.
996
0.17
90.
821
0.70
01.
000
N.F
irm
s[N
.Obs
.]74
[479
]58
[348
]26
[131
]57
[360
]44
[294
]37
[274
]30
[119
]In
stru
men
tst−
3;t−
4;�
t−2
t−3;
t−4;
�t−
2t−
3;�
t−2
t−3;
t−4;
�t −
2t−
3;t−
4;�
t−2
t−2;
�t−
1t−
2;�
t−1
552 Journal of Economics & Management Strategy
6. The Subsample of Energy Utilities
So far our analysis was based on a diverse set of firms operating in awide array of industries. Although all of our regressions include sectorspecific dummies, one may worry that the large heterogeneity of firmsin our sample and the fact that they are subject to different regulatoryenvironments biases our results in some way. To address this concernwe now reestimate our main specifications using a subsample of energyutilities (gas and electricity). This group of firms is the largest in oursample and comprises of 44 utilities and 354 firm-year observations(46% of our full sample). Firms in this subsample are all regulated byenergy regulatory agencies and are subject to the same EU directives,described in Section 2, which member states were required to transposeinto national legislation. It should also be noted that the “dash for debt”concern was raised mainly in the context of energy utilities (see AEEG,2007; Ofgem, 2008).
In Table X, we reestimate our baseline specification for the leverageequation using random effects estimation. The main difference betweenthe results in Tables IV–VII, and X is that the coefficients of the IRA andthe Private Control × IRA dummies are larger in absolute values andmore significant than in Section 5. Moreover, Column (1) in Table Xshows that as in Tables IV–VII, the coefficient of the Private Controldummy is insignificant while the sum of the coefficients of the PrivateControl and Private Control × IRA dummies (α1 + α3) is positive andsignificant. This result is coefficient with Hypothesis 1 because it impliesthat privately controlled regulated firms have a higher leverage thanstate-control firms provided that they are regulated by an IRA. Columns(2)–(4) show that this conclusion is not altered when Golden Shares aretaken into account, when we restrict attention only to firms that wereprivatized during our sample period, and when we replace the PrivateControl dummy with the Private Control_30 dummy.
Table XI presents the results of our Granger tests regarding theinteraction between leverage and regulated rates for the subsample ofenergy utilities. Columns (1), (3), (5), and (7) report the results fromestimating equation (2), while Columns (2), (4), (6), and (8) reportthe results from estimating equation (3). The results are very similarto those in Tables VIII and IX: the coefficients of the lagged leverageterms in the price equation are jointly significant and so is their sum forthe full sample and the subsamples of privately controlled firms andfirms that are regulated by an IRA, but not for state-controlled firms.32
By contrast, the coefficients of the lagged prices are insignificant in
32. Unfortunately, we have only 52 firm-year observations on energy utilities withoutan IRA and hence were unable to run Granger causality tests for this subsample of firms.
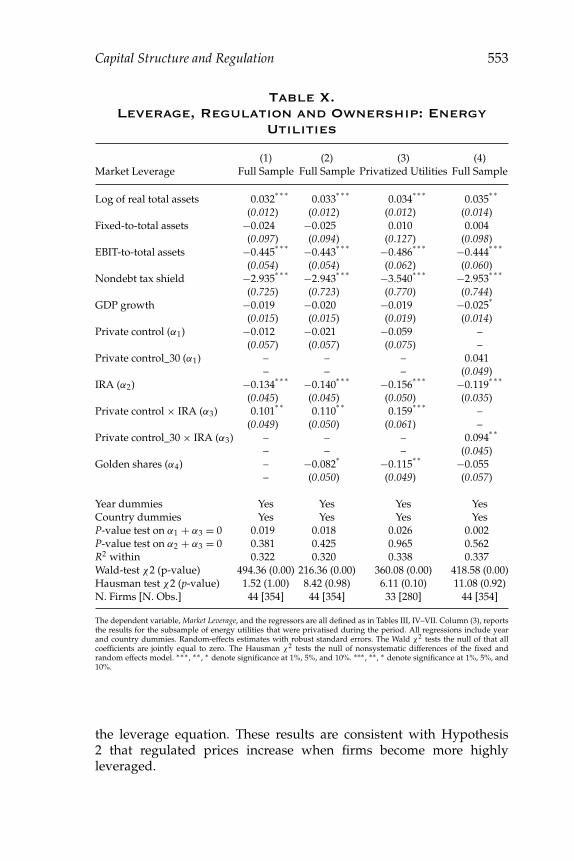
Capital Structure and Regulation 553
Table X.
Leverage, Regulation and Ownership: Energy
Utilities
(1) (2) (3) (4)Market Leverage Full Sample Full Sample Privatized Utilities Full Sample
Log of real total assets 0.032∗ ∗ ∗
0.033∗ ∗ ∗
0.034∗ ∗ ∗
0.035∗ ∗
(0.012) (0.012) (0.012) (0.014)Fixed-to-total assets −0.024 −0.025 0.010 0.004
(0.097) (0.094) (0.127) (0.098)EBIT-to-total assets −0.445
∗ ∗ ∗ −0.443∗ ∗ ∗ −0.486
∗ ∗ ∗ −0.444∗ ∗ ∗
(0.054) (0.054) (0.062) (0.060)Nondebt tax shield −2.935
∗ ∗ ∗ −2.943∗ ∗ ∗ −3.540
∗ ∗ ∗ −2.953∗ ∗ ∗
(0.725) (0.723) (0.770) (0.744)GDP growth −0.019 −0.020 −0.019 −0.025
∗
(0.015) (0.015) (0.019) (0.014)Private control (α1) −0.012 −0.021 −0.059 –
(0.057) (0.057) (0.075) –Private control_30 (α1) – – – 0.041
– – – (0.049)IRA (α2) −0.134
∗ ∗ ∗ −0.140∗ ∗ ∗ −0.156
∗ ∗ ∗ −0.119∗ ∗ ∗
(0.045) (0.045) (0.050) (0.035)Private control × IRA (α3) 0.101
∗ ∗0.110
∗ ∗0.159
∗ ∗ ∗–
(0.049) (0.050) (0.061) –Private control_30 × IRA (α3) – – – 0.094
∗ ∗
– – – (0.045)Golden shares (α4) – −0.082
∗ −0.115∗ ∗ −0.055
– (0.050) (0.049) (0.057)
Year dummies Yes Yes Yes YesCountry dummies Yes Yes Yes YesP-value test on α1 + α3 = 0 0.019 0.018 0.026 0.002P-value test on α2 + α3 = 0 0.381 0.425 0.965 0.562R2 within 0.322 0.320 0.338 0.337Wald-test χ2 (p-value) 494.36 (0.00) 216.36 (0.00) 360.08 (0.00) 418.58 (0.00)Hausman test χ2 (p-value) 1.52 (1.00) 8.42 (0.98) 6.11 (0.10) 11.08 (0.92)N. Firms [N. Obs.] 44 [354] 44 [354] 33 [280] 44 [354]
The dependent variable, Market Leverage, and the regressors are all defined as in Tables III, IV–VII. Column (3), reportsthe results for the subsample of energy utilities that were privatised during the period. All regressions include yearand country dummies. Random-effects estimates with robust standard errors. The Wald χ2 tests the null of that allcoefficients are jointly equal to zero. The Hausman χ2 tests the null of nonsystematic differences of the fixed andrandom effects model. ∗∗∗ , ∗∗ , ∗ denote significance at 1%, 5%, and 10%. ∗∗∗ , ∗∗ , ∗ denote significance at 1%, 5%, and10%.
the leverage equation. These results are consistent with Hypothesis2 that regulated prices increase when firms become more highlyleveraged.
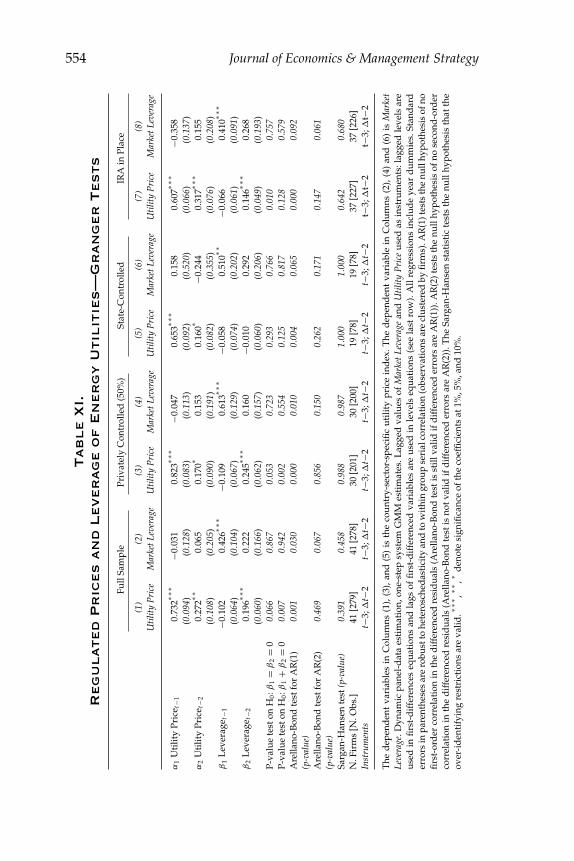
554 Journal of Economics & Management StrategyT
ab
le
XI.
Reg
ulated
Pr
ices
an
dL
ever
ag
eo
fE
ner
gy
Utilities—
Gr
an
ger
Tests
Full
Sam
ple
Priv
atel
yC
ontr
olle
d(5
0%)
Stat
e-C
ontr
olle
dIR
Ain
Plac
e
(1)
(2)
(3)
(4)
(5)
(6)
(7)
(8)
Util
ityPr
ice
Mar
ketL
ever
age
Util
ityPr
ice
Mar
ketL
ever
age
Util
ityPr
ice
Mar
ketL
ever
age
Util
ityPr
ice
Mar
ketL
ever
age
α1
Uti
lity
Pric
e t−1
0.73
2∗∗∗
−0.0
310.
823∗∗
∗−0
.047
0.65
3∗∗∗
0.15
80.
607∗∗
∗−0
.358
(0.0
94)
(0.1
28)
(0.0
83)
(0.1
13)
(0.0
92)
(0.5
20)
(0.0
66)
(0.1
37)
α2
Uti
lity
Pric
e t−2
0.27
2∗∗0.
065
0.17
0∗0.
153
0.16
0∗−0
.244
0.31
7∗∗∗
0.15
5(0
.108
)(0
.205
)(0
.090
)(0
.191
)(0
.082
)(0
.355
)(0
.076
)(0
.208
)β
1L
ever
age t
−1−0
.102
0.42
6∗∗∗
−0.1
090.
613∗∗
∗−0
.058
0.51
0∗∗−0
.066
0.41
0∗∗∗
(0.0
64)
(0.1
04)
(0.0
67)
(0.1
29)
(0.0
74)
(0.2
02)
(0.0
61)
(0.0
91)
β2
Lev
erag
e t−2
0.19
6∗∗∗
0.22
20.
245∗∗
∗0.
160
−0.0
100.
292
0.14
6∗∗∗
0.26
8(0
.060
)(0
.166
)(0
.062
)(0
.157
)(0
.060
)(0
.206
)(0
.049
)(0
.193
)P-
valu
ete
ston
H0:
β1
=β
2=
00.
066
0.86
70.
053
0.72
30.
293
0.76
60.
010
0.75
7P-
valu
ete
ston
H0:
β1
+β
2=
00.
007
0.94
20.
002
0.55
40.
125
0.81
70.
128
0.57
9A
rella
no-B
ond
test
for
AR
(1)
(p-v
alue
)0.
001
0.03
00.
000
0.01
00.
004
0.06
50.
000
0.09
2
Are
llano
-Bon
dte
stfo
rA
R(2
)(p
-val
ue)
0.46
90.
067
0.85
60.
150
0.26
20.
171
0.14
70.
061
Sarg
an-H
anse
nte
st(p
-val
ue)
0.39
10.
458
0.98
80.
987
1.00
01.
000
0.64
20.
680
N.F
irm
s[N
.Obs
.]41
[279
]41
[278
]30
[201
]30
[200
]19
[78]
19[7
8]37
[227
]37
[226
]In
stru
men
tst−
3;�
t−2
t−3;
�t−
2t−
3;�
t−2
t−3;
�t −
2t−
3;�
t−2
t−3;
�t−
2t−
3;�
t−2
t−3;
�t−
2
The
dep
end
ent
vari
able
sin
Col
umns
(1),
(3),
and
(5)
isth
eco
untr
y-se
ctor
-spe
cific
utili
typr
ice
ind
ex.T
hed
epen
den
tva
riab
lein
Col
umns
(2),
(4)
and
(6)
isM
arke
tLe
vera
ge.D
ynam
icpa
nel-
dat
aes
tim
atio
n,on
e-st
epsy
stem
GM
Mes
tim
ates
.Lag
ged
valu
esof
Mar
ket
Leve
rage
and
Util
ityPr
ice
used
asin
stru
men
ts:l
agge
dle
vels
are
used
infir
st-d
iffe
renc
eseq
uati
ons
and
lags
offi
rst-
dif
fere
nced
vari
able
sar
eus
edin
leve
lseq
uati
ons
(see
last
row
).A
llre
gres
sion
sin
clud
eye
ard
umm
ies.
Stan
dar
der
rors
inpa
rent
hese
sar
ero
bust
tohe
tero
sche
das
tici
tyan
dto
wit
hin
grou
pse
rial
corr
elat
ion
(obs
erva
tion
sar
ecl
uste
red
byfir
ms)
.AR
(1)t
ests
the
null
hypo
thes
isof
nofir
st-o
rder
corr
elat
ion
inth
ed
iffe
renc
edre
sid
uals
(Are
llano
-Bon
dte
stis
still
valid
ifd
iffe
renc
eder
rors
are
AR
(1))
.AR
(2)t
ests
the
null
hypo
thes
isof
nose
cond
-ord
erco
rrel
atio
nin
the
dif
fere
nced
resi
dua
ls(A
rella
no-B
ond
test
isno
tval
idif
dif
fere
nced
erro
rsar
eA
R(2
)).T
heSa
rgan
-Han
sen
stat
isti
cte
sts
the
null
hypo
thes
isth
atth
eov
er-i
den
tify
ing
rest
rict
ions
are
valid
.∗∗∗ ,∗∗
,∗d
enot
esi
gnifi
canc
eof
the
coef
fici
ents
at1%
,5%
,and
10%
.
Capital Structure and Regulation 555
7. Conclusion
Following the large scale privatization and structural reforms in net-work industries in Europe over the past 20 years, it appears thatEuropean regulated utilities in telecommunications, electricity, naturalgas, water, and transportation, have accumulated large amounts ofdebt. This phenomenon has been described by the UK Departmentof Trade and Industry (DTI) and the HM Treasury (DTI-HM, 2004)as the “dash for debt,” and has raised concerns among policymakersabout the financial stability of regulated utilities and their ability tofinance future investments. Theoretical models and earlier empiricalwork based on U.S data suggest however that high leverage is a naturalresponse of regulated firms to the inability of regulators to make long-term commitments to prices. High leverage protects regulated firmsagainst the “regulatory opportunism” — the risk that regulators willlower prices in the future once investments become sunk in order tobenefit consumers at the firm’s expense.
In this paper we examine this idea empirically, using a compre-hensive panel of virtually all major publicly traded regulated utilities inthe EU-15 member states. Our data covers firms with various degreesof state ownership that are either regulated by IRA or by ministries,governmental committees, or local governments. This heterogeneityallows us to examine the effect of private- versus state-ownership and ofregulatory independence on the capital structure of regulated firms andits implications for regulated prices. Our analysis reveals that privatelycontrolled firms tend to have a higher leverage than state-controlledfirms provided that they are regulated by IRA, and that the increasedleverage is associated with higher regulated prices. By contrast, wedo not find a significant effect of leverage on prices in the case of state-controlled firms. These results provide strong support for the hypothesisthat privately controlled regulated firms rely on debt financing as away to induce IRA to set higher prices. To the extent that regulatedfirms may take “regulatory opportunism” into account when makinginvestment decisions, our results suggest that debt financing may havesome desirable consequence because it may boost the incentives ofprivately controlled regulated firms to invest. Of course, given that debtfinancing also leads to higher regulated prices and may also increasethe likelihood of financial distress, it is clear that more research, boththeoretically and empirically, is needed to determine if the “dash fordebt” phenomenon is desirable and provides (at least in part) a solutionto a regulatory opportunism problem, or whether it is an unintendedconsequence of the privatization of firms in network industries andshould be discouraged.

556 Journal of Economics & Management Strategy
Appendix A: Data Sources
Panel A. Ownership Data
CountryIndividual Countries
Sources 1994–2004All Countries Sources
1994–2004
Austria 1. Austrian Holding and PrivatisationAgency, www.oiag.at
1. Company Web Sites;
Belgium 1. Bureau Federal du Plan (BFP),www.plan.be, “ParticipationsPubliques dans le Secteur Marchanden Belgique, 1997–2003”
2. Annual Reports;
Finland 1. Ministry of Trade & Industry,“State—Owned Companies”Publications, 1995, 2005
3. 20-F Reports;
France 1. La Caisse des Depots,www.caissedesdepots.fr/FR/index.php
4. SEC, Filings & Forms (EDGAR),www.sec.gov/edgar.shtml;
2. L’Agence des participations de l’Etat(APE), www.ape.minefi.gouv.fr/
5. Hoovers Company In-deptRecords;
3. Euronext,www.euronext.com/home/0,3766,1732,00.html
6. SDC Thomson Financial;
Germany 1. KfW,www.kfw.de/EN_Home/index.jsp
7. Amadeus, Bureau van Dijk;
Greece 1. Athens Stock Exchange,www.ase.gr/default_en.asp
8. Lexis Nexis, Business News;
2. Hellenic Capital Market Commission,Annual Reports 1999–2005,www.hcmc.gr/english/index2.htm
9. Privatization Barometer,www.privatizationbarometer.net;
Italy 1. MEF, Dipartimento del Tesoro, “Librobianco sulle privatizzazioni,” April2001, 2002 and 2003
10. Financial Times;
2. MEF, Dipartimento del Tesoro, “Larelazione sulle privatizzazioni,”1997–2000
11. For Banks and FinancialInstitutions: IMF WorkingPaper, 2005, “State-OwnedBanks, Stability, Privatization,and Growth: Practical PolicyDecisions in a World WithoutEmpirical Proof,”www.imf.org/external/pubs/ft/wp/2005/wp0510.pdf
3. MEF, Dipartimento del Tesoro, “Libroverde sulle partecipazioni dello Stato,”November 1992
4. MEF, www.dt.tesoro.it/Aree-Docum/Partecipaz/Partecipaz/Partecipate.htm_cvt.htm
Continued

Capital Structure and Regulation 557
Appendix A:
Continued
Panel A. Ownership data
CountryIndividual Countries
Sources 1994–2004All Countries Sources
1994–2004
5. IRI (2001) “Le privatizzazioni in Italia,1992–2000,” edited by Bemporad S. and E.Reviglio
6. Mediobanca (2000) “Le privatizzazioni inItalia dal 1992”
7. Borsa Italiana, “Operazioni diPrivatizzazione—Anni 1993–2006,”www.borsaitaliana.it/documenti/ufficiostampa/datistorici/privatizzazioni_pdf.htm
8. Consob, www.consob.itNetherlands 1. Ministry of Finance,
www.minfin.nl/en/subjects,government-participation
2. Morgan Stanley, Journal of AppliedCorporate Finance, Vol. 9, Number 1,Spring 1996
3. OECD, 1998, Reforming PublicEnterprises: The Netherlands
Portugal 1. Ministry of Finance and PublicAdministration, Economic Research andForecasting Department (DGEP),www.dgep.pt/menprinci.html
Spain 1. Sociedad Estatal de ParticipacionesIndustriales, www.sepi.es
2. Economic Monthly Report (1995 and1999), La Caixa, www.lacaixa.comunicacions.com
3. The Comision Nacional del Mercado deValores (CNMV), www.cnmv.es
Sweden 1. Ministry of Industry, Employment andCommunication, Annual Report forGovernment-Owned Companies,2000–2005,www.sweden.gov.se/sb/d/2106/a/19792
UK 1. “Who Owns Whom in the UK ElectricityIndustry,” Electricity Association PolicyResearch, June 2003
2. www.ukprivatisation.com
Continued
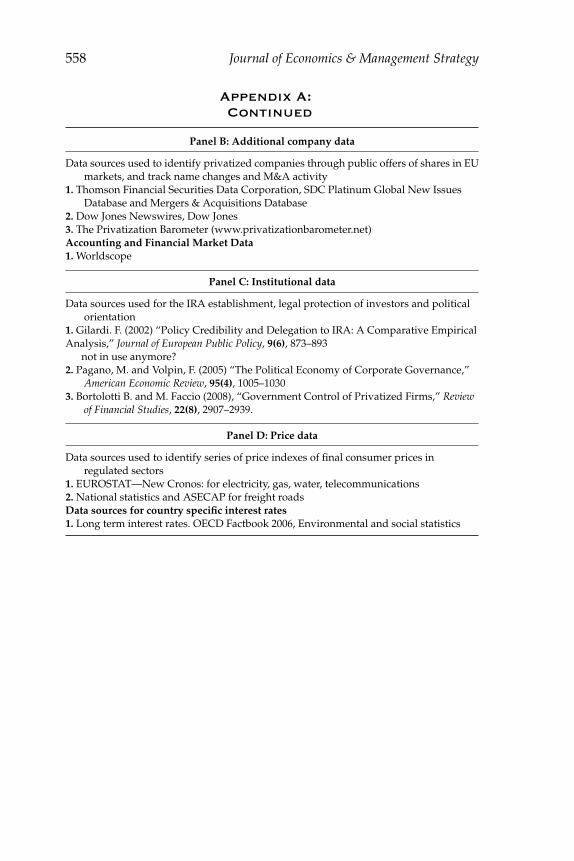
558 Journal of Economics & Management Strategy
Appendix A:
Continued
Panel B: Additional company data
Data sources used to identify privatized companies through public offers of shares in EUmarkets, and track name changes and M&A activity
1. Thomson Financial Securities Data Corporation, SDC Platinum Global New IssuesDatabase and Mergers & Acquisitions Database
2. Dow Jones Newswires, Dow Jones3. The Privatization Barometer (www.privatizationbarometer.net)Accounting and Financial Market Data1. Worldscope
Panel C: Institutional data
Data sources used for the IRA establishment, legal protection of investors and politicalorientation
1. Gilardi. F. (2002) “Policy Credibility and Delegation to IRA: A Comparative EmpiricalAnalysis,” Journal of European Public Policy, 9(6), 873–893
not in use anymore?2. Pagano, M. and Volpin, F. (2005) “The Political Economy of Corporate Governance,”
American Economic Review, 95(4), 1005–10303. Bortolotti B. and M. Faccio (2008), “Government Control of Privatized Firms,” Review
of Financial Studies, 22(8), 2907–2939.
Panel D: Price data
Data sources used to identify series of price indexes of final consumer prices inregulated sectors
1. EUROSTAT—New Cronos: for electricity, gas, water, telecommunications2. National statistics and ASECAP for freight roadsData sources for country specific interest rates1. Long term interest rates. OECD Factbook 2006, Environmental and social statistics
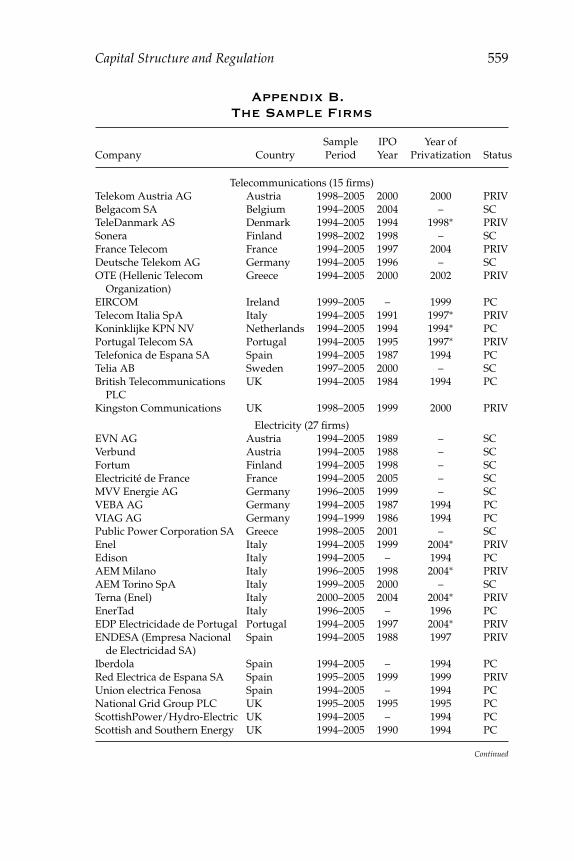
Capital Structure and Regulation 559
Appendix B.
The Sample Firms
Sample IPO Year ofCompany Country Period Year Privatization Status
Telecommunications (15 firms)Telekom Austria AG Austria 1998–2005 2000 2000 PRIVBelgacom SA Belgium 1994–2005 2004 – SCTeleDanmark AS Denmark 1994–2005 1994 1998∗ PRIVSonera Finland 1998–2002 1998 – SCFrance Telecom France 1994–2005 1997 2004 PRIVDeutsche Telekom AG Germany 1994–2005 1996 – SCOTE (Hellenic Telecom
Organization)Greece 1994–2005 2000 2002 PRIV
EIRCOM Ireland 1999–2005 – 1999 PCTelecom Italia SpA Italy 1994–2005 1991 1997∗ PRIVKoninklijke KPN NV Netherlands 1994–2005 1994 1994∗ PCPortugal Telecom SA Portugal 1994–2005 1995 1997∗ PRIVTelefonica de Espana SA Spain 1994–2005 1987 1994 PCTelia AB Sweden 1997–2005 2000 – SCBritish Telecommunications
PLCUK 1994–2005 1984 1994 PC
Kingston Communications UK 1998–2005 1999 2000 PRIV
Electricity (27 firms)EVN AG Austria 1994–2005 1989 – SCVerbund Austria 1994–2005 1988 – SCFortum Finland 1994–2005 1998 – SCElectricite de France France 1994–2005 2005 – SCMVV Energie AG Germany 1996–2005 1999 – SCVEBA AG Germany 1994–2005 1987 1994 PCVIAG AG Germany 1994–1999 1986 1994 PCPublic Power Corporation SA Greece 1998–2005 2001 – SCEnel Italy 1994–2005 1999 2004∗ PRIVEdison Italy 1994–2005 – 1994 PCAEM Milano Italy 1996–2005 1998 2004∗ PRIVAEM Torino SpA Italy 1999–2005 2000 – SCTerna (Enel) Italy 2000–2005 2004 2004∗ PRIVEnerTad Italy 1996–2005 – 1996 PCEDP Electricidade de Portugal Portugal 1994–2005 1997 2004∗ PRIVENDESA (Empresa Nacional
de Electricidad SA)Spain 1994–2005 1988 1997 PRIV
Iberdola Spain 1994–2005 – 1994 PCRed Electrica de Espana SA Spain 1995–2005 1999 1999 PRIVUnion electrica Fenosa Spain 1994–2005 – 1994 PCNational Grid Group PLC UK 1995–2005 1995 1995 PCScottishPower/Hydro-Electric UK 1994–2005 – 1994 PCScottish and Southern Energy UK 1994–2005 1990 1994 PC
Continued

560 Journal of Economics & Management Strategy
Appendix B.
Continued
Sample IPO Year ofCompany Country Period Year Privatization Status
United Utilities UK 1994–2005 – 1994 PCBritish Energy PLC UK 1996–2005 1996 1996 PCViridian UK 1994–2005 – 1994 PCNational Power—PowerGen
LtdUK 1994–2001 1991 1994 PC
Yorkshire Electricity Group UK 1994–1997 1990 1994 PC
Gas (11 firms)OMV AG Austria 1994–2005 1987 1994 PCDistrigaz SA Belgium 2001–2005 1996 2001∗ PRIVFluxys Belgium 2001–2005 – 2005∗ PRIVGaz de France France 1994–2005 2005 – SCAmga SpA Italy 1996–2005 1996 – SCAcsm SpA Italy 1998–2005 1999 – SCSNAM Rete Gas SpA Italy 2000–2005 2004 2000 PCEnagas Spain 2000–2005 – 2000 PCGas Natural SDG SA Spain 1994–2005 1996 1994 PCBritish Gas PLC UK 1994–2005 1986 1994 PCCentrica UK 1996–2005 – 1996 PC
Freight Roads (8 firms)Autoroutes du Sud de la France France 1999–2005 2002 2005 PRIVSAPRR (Autoroutes
Paris-Rhin-Rhone)France 2001–2005 2004 2005 PRIV
SANEF (Autoroutes du Nord etde l’Est de la France)
France 2002–2005 2005 2005 PRIV
Autostrade SpA Italy 1994–2005 1999 1999 PRIVAutostrada Torino-Milano Italy 1994–2005 – 1994 PCSias—Societa Autostrada
Torino MilanoItaly 1998–2005 – 1998 PC
Brisa Auto Estradas de Portugal Portugal 1995–2005 1997 1998 PRIVAbertis Spain 1994–2005 – 1994 PC
Multiutilities (7 firms)Suez France 1994–2005 1987 1994 PCHERA Italy 2003–2005 2003 – SCACEA SpA Italy 1998–2005 1999 – SCAcegas Italy 1997–2005 2001 – SCMeta SpA Italy 2002–2004 2003 – SCRWE Germany 1994–2005 – 1994 PCFraport AG Germany 1994–2005 2001 – SC
Water (13 firms)Vivendi France 1994–2005 – 1994 PCVeolia France 2000–2005 – 2001 PRIVWater Supply & Sewerage
Systems Co of AthensGreece 2000–2005 1999 – SC
Continued
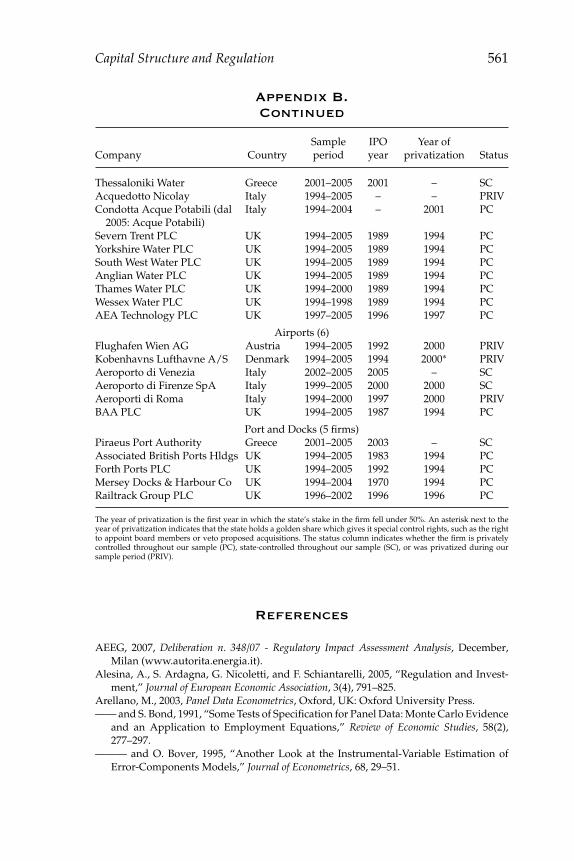
Capital Structure and Regulation 561
Appendix B.
Continued
Sample IPO Year ofCompany Country period year privatization Status
Thessaloniki Water Greece 2001–2005 2001 – SCAcquedotto Nicolay Italy 1994–2005 – – PRIVCondotta Acque Potabili (dal
2005: Acque Potabili)Italy 1994–2004 – 2001 PC
Severn Trent PLC UK 1994–2005 1989 1994 PCYorkshire Water PLC UK 1994–2005 1989 1994 PCSouth West Water PLC UK 1994–2005 1989 1994 PCAnglian Water PLC UK 1994–2005 1989 1994 PCThames Water PLC UK 1994–2000 1989 1994 PCWessex Water PLC UK 1994–1998 1989 1994 PCAEA Technology PLC UK 1997–2005 1996 1997 PC
Airports (6)Flughafen Wien AG Austria 1994–2005 1992 2000 PRIVKobenhavns Lufthavne A/S Denmark 1994–2005 1994 2000∗ PRIVAeroporto di Venezia Italy 2002–2005 2005 – SCAeroporto di Firenze SpA Italy 1999–2005 2000 2000 SCAeroporti di Roma Italy 1994–2000 1997 2000 PRIVBAA PLC UK 1994–2005 1987 1994 PC
Port and Docks (5 firms)Piraeus Port Authority Greece 2001–2005 2003 – SCAssociated British Ports Hldgs UK 1994–2005 1983 1994 PCForth Ports PLC UK 1994–2005 1992 1994 PCMersey Docks & Harbour Co UK 1994–2004 1970 1994 PCRailtrack Group PLC UK 1996–2002 1996 1996 PC
The year of privatization is the first year in which the state’s stake in the firm fell under 50%. An asterisk next to theyear of privatization indicates that the state holds a golden share which gives it special control rights, such as the rightto appoint board members or veto proposed acquisitions. The status column indicates whether the firm is privatelycontrolled throughout our sample (PC), state-controlled throughout our sample (SC), or was privatized during oursample period (PRIV).
References
AEEG, 2007, Deliberation n. 348/07 - Regulatory Impact Assessment Analysis, December,Milan (www.autorita.energia.it).
Alesina, A., S. Ardagna, G. Nicoletti, and F. Schiantarelli, 2005, “Regulation and Invest-ment,” Journal of European Economic Association, 3(4), 791–825.
Arellano, M., 2003, Panel Data Econometrics, Oxford, UK: Oxford University Press.—— and S. Bond, 1991, “Some Tests of Specification for Panel Data: Monte Carlo Evidence
and an Application to Employment Equations,” Review of Economic Studies, 58(2),277–297.
——— and O. Bover, 1995, “Another Look at the Instrumental-Variable Estimation ofError-Components Models,” Journal of Econometrics, 68, 29–51.

562 Journal of Economics & Management Strategy
Barclay, M.J., L. Marx, and C. Smith, 2003, “The Joint Determination of Leverage andMaturity,” Journal of Corporate Finance, 9, 149–167.
Besley, S. and E. Bolten, 1990, “What Factors Are Important in Establishing MandatedReturns?” Public Utilities Fortnightly, 125, 26–30.
Blundell, R. and S. Bond, 1998, “Initial Conditions and Moment Restrictions in DynamicPanle Data Models,” Journal of Econometrics, 87, 115–143.
Bortolotti B. and M. Faccio, 2008, “Government Control of Privatized Firms,” Review ofFinancial Studies, 22(8), 2907–2939.
———, M. Fantini, and D. Siniscalco, 2003, “Privatisation around the World: EvidenceFrom Panel Data,” Journal of Public Economics, 88(1–2), 305–332.
Bowen, R.M., L.A. Daley, and C. Huber, 1982, “Evidence on the Existence and Determi-nants of Inter-Industry Differences in Leverage,” Financial Management, 11(4), 10–20.
Bradley, M., G. Jarrell, and H. Kim, 1984, “On the Existence of an Optimal CapitalStructure: Theory and Evidence,” Journal of Finance, 39(3), 857–878.
Bulan, L. and P. Sanyal, 2005, “Regulatory Risk, Market Risk and Capital Structure:Evidence from U.S. Electric Utilities,” Mimeo, Brandeis University.
——— and ———, 2006, “Is There Room For Growth? Capital Structure and theDeregulation of U.S. Electric Utilities,” Mimeo, Brandeis University.
Cambini, C. and Y. Spiegel, 2010, “Investment and Capital Structure of Partially RegulatedFirms,” Mimeo.
Claessens, S., S. Djankov, and L. Lang, 2000, “The Separation of Ownership and Controlin East Asian Corporations,” Journal of Financial Economics, 58, 81–112.
Correia da Silva, L., A. Estache and S. Jarvela, 2006, “Is Debt Replacing Equity in RegulatedPrivatized Infrastructure in LDCs?,” Utilities Policy, 14, 90–102.
Dasgupta, S. and V. Nanda, 1993, “Bargaining and Brinkmanship—Capital StructureChoice by Regulated Firms,” International Journal of Industrial Organization, 11(4),475–497.
Department of Trade and Industry and HM Treasury, 2004, The Drivers and Public PolicyConsequences of Increased Gearing, October, London.
Dewenter, K. and P. Malatesta, 2001, “State-Owned and Privately-Owned Firms: AnEmpirical Analysis of Profitability, Leverage, and Labor Intensity,” The AmericanEconomic Review, 91(1), 320–334.
D’Souza, J. and W. Megginson, 1999, “The Financial and Operating Performance ofPrivatized Firms during the 1990s,” The Journal of Finance, 54(4), 1397–1438.
Edwards, G. and L. Waverman, 2006, “The Effects of Public Ownership and RegulatoryIndependence on Regulatory Outcomes,” Journal of Regulatory Economics, 29(1), 23–67.
Faccio, M. and L.H.P. Lang, 2002, “The Ultimate Ownership of Western EuropeanCorporations,” Journal of Financial Economics, 65, 365–395.
Fama, E. and K.R. French, 2002, “Testing Trade-Off and Pecking Order Predictions aboutDividends and Debt,” Review of Financial Studies, 15, 1–33.
Frank, M. and V. Goyal, 2007, “Capital Structure Decisions: Which Factors are ReliablyImportant,” Mimeo.
Gasmi, F., P. Noumba and L. Recuero Virto, 2006, “Political Accountability and RegulatoryPerformance in Infrastructured Industries: an Empirical Analysis,” World Bank PolicyResearch Working Paper n. 4101, December, Washington, DC.
——— and L. Recuero Virto, 2008, “The Determinants and Impact of TelecommunicationsReforms in Developing Countries,” Mimeo.
Gilardi, F., 2002, “Policy Credibility and Delegation to Independent Regulatory Agencies:A Comparative Empirical Analysis,” Journal of European Public Policy, 9(6), 873–893.

Capital Structure and Regulation 563
———, 2005, “The Institutional Foundations of Regulatory Capitalism: The Diffusion ofIndependent Regulatory Agencies in Western Europe,” The ANNALS of the AmericanAcademy of Political and Social Science, 598, 84–101.
Granger, C.W., 1969, “Investigating Causal Relations by Econometric Models and Cross-Spectral Methods,” Econometrica, 37, 24–36.
Guasch, J.L., J.-J. Laffont, and S. Straub, 2008, “Renegotiation of Concession Contracts inLatin America,” International Journal of Industrial Organization, 26(2), 421–442.
Hagermarn, L. and T. Ratchford, 1978, “Some Determinants of Allowed Rates of Returnon Equity to Electric Utilities,” Bell Journal of Economics, 9, 46–55.
Hausman, J.A., 1978, “Specification Tests in Econometrics,” Econometrica, 46, 1251–1272.Henitsz, W.J. and B.A. Zelner, 2001, “The Institutional Environment for Telecommunica-
tions Investment”, Journal of Economics and Management Strategy, 10(1), 123–147.Huber, J. and R. Inglehart, 1995, “Expert Interpretations of Party Space and Party Locations
in 42 Societies,” Party Politics, 1, 73–111.Klein, R., R. Phillips, and W. Shiu, 2002, “The Capital Structure of Firms Subject to
Price Regulation: Evidence from the Insurance Industry,” Journal of Financial ServicesResearch, 22(1–2), 79–100.
La Porta, R., F. Lopez-de-Silanes, A. Shleifer, and R. Vishny, 1998, “Law and Finance,”Journal of Political Economy, 106, 1113–1155.
———, ———, and ———, 1999, “Corporate Ownership Around the World,” Journal ofFinance, 54, 471–518.
Levy, B. and P. Spiller, 1994, “The Institutional Foundations of Regulatory Commitment: AComparative Analysis of Telecommunications Regulation,” Journal of Law, Economics,and Organization, 10(2), 201–246.
Li, Y., 2009, “A Firm-Level Panel-Data Approach to Efficiency, Total Factor Productivity,Catch-Up and Innovation and Mobile Telecommunications Reform (1995–2007),” CCPWorking Paper 09-06, University of East Anglia.
Megginson, W., R. Nash, and M. van Randenborgh, 1994, “The Financial and OperatingPerformance of Newly Privatized Firms: An International Empirical Analysis,” Journalof Finance, 49, 403–452.
———, and J. Netter, 2001, “From State to Market: A Survey of Empirical Studies onPrivatization,” Journal of Economic Literature, 39(2), 321–389.
OECD, 2006, Telecommunication Regulatory Institutional Structures and Responsibilities,January, Paris.
Ofgem, 2008, Responding to Financial Distress, position paper no. 158/08, December,London.
Ofwat and Ofgem, 2006, Financing Networks: A Discussion Paper, February, London.Ovtchinnikov, A., 2008, “Capital Structure Decisions: Evidence from Deregulated Indus-
tries,” Mimeo, Owen Graduate School of Management.Owen, B. and R. Braeutigam, 1978, The Regulation Game: Strategic Use of the Administrative
Process, Cambridge, MA: Ballinger.Pagano, M. and P. Volpin, 2005, “The Political Economy of Corporate Governance,”
American Economic Review, 95(4), 1005–1030.Phillips, C.F. Jr., 1988, The Regulation of Public Utilities: Theory and Practice, Arlington, VA:
Public Utilities Reports.Rajan, R. and L. Zingales, 1995, “What Do We Know about Capital Structure? Some
Evidence from International Data,” The Journal of Finance, 50(5), 1421–1460.Roodman, D., 2006, “How to Do xtanbond2: An Introduction to “Difference” and
“System” GMM in Stata,” The Center for Global Development, WP n. 103.Sims, C.A., 1972, “Money, Income, and Causality,” American Economic Review, 62, 540–552.Smith, C.W., 1986, “Investment Banking and the Capital Acquisition Process,” Journal of
Financial Economics, 15, 3–29.

564 Journal of Economics & Management Strategy
Spiegel, Y., 1994, “The Capital Structure and Investment of Regulated Firms,” Journal ofRegulatory Economics, 6, 297–320.
Spiegel, 1996, “The Choice of Technology and Capital Structure under Rate Regulation,”International Journal of Industrial Organization, 15, 191–216.
—— and D. Spulber, 1994, “The Capital Structure of a Regulated Firm,” RAND Journal ofEconomics, 25(3), 424–440.
—— and ——, 1997, “Capital Structure With Countervailing Incentives,” RAND Journalof Economics, 28(1), 1–24.
Spulber, D., 1989, Regulation and Markets, Cambridge, MA: MIT Press.Taggart, R., 1981, “Rate-of-Return Regulation and Utility Capital Structure Decision,” The
Journal of Finance, 36(2), 383–393.——, 1985, “Effects of Regulation on Utility Financing: Theory and Evidence,” Journal of
Industrial Economics, 33(3), 257–276.Titman, S. and R. Wessel, 1988, “The Determinants of Capital Structure Choice,” Journal
of Finance, 43, 1–19.