Embed Size (px)
Citation preview
1
Capital Raising in the U.S.: An Analysis of the Market for Unregistered Securities Offerings, 2009‐20171
AUGUST 2018
SCOTT BAUGUESS, RACHITA GULLAPALLI, AND VLADIMIR IVANOV Division of Economic and Risk Analysis (DERA) U.S. Securities and Exchange Commission
ABSTRACT
Capital formation through private placement of securities has increased substantially since the the 2008 global financial crisis. During recent years, amounts raised through unregistered securities offerings have outpaced the level of capital formation through registered securities offerings, and totaled more than $3.0 trillion during 2017. In this analysis, we provide insights into a large segment of the unregistered securities market2: offerings conducted in reliance on Regulation D of the Securities Act. Using information collected from Form D filings, this study provides a detailed examination of offering characteristics, including the types of issuers, investors, and financial intermediaries that participate in the offerings. As part of the examination, we analyze the new and amended exemptions created pursuant to the Jumpstart Our Business Startups Act of 2012 (“JOBS Act”) – the new Rule 506(c) exemption which became effective in September 2013 and allows general solicitation and general advertising, changing almost 80 years of regulatory practice, the amended Regulation A which became effective June 19, 2015 and the new Regulation Crowdfunding that became effective May 16, 2016. We also provide some perspective on the state of competition and potential regulatory burden in alternate capital markets by analyzing the level of activity among the various registered and unregistered offering alternatives.
1 Research assistance provided by Daniel Bresler. The U.S. Securities and Exchange Commission, as a matter of policy, disclaims responsibility for any private publication or statement of any of its employees. The views expressed herein are those of the author and do not necessarily reflect the views of the Commission or of the author’s colleagues on the staff of the Commission. This study was prepared for Chyhe Becker, Acting Director of DERA and Acting Chief Economist, and is a follow‐up to a study conducted in 2015, which provided an analysis of capital raised through unregistered offerings for the period 2009‐2014. See Scott Bauguess, Rachita Gullapalli and Vladimir Ivanov, Capital Raising in the U.S.: An Analysis of the Market for Unregistered Securities Offerings, 2009‐2016 (October 2015) (the “2015 Unregistered Offerings Study”), available at: https://www.sec.gov/dera/staff‐papers/white‐papers/30oct15_white_unregistered_offering.html. The information in this study may be particularly useful in assessing the potential need for current or future rulemaking activity. This analysis is not intended to inform the Commission about compliance with or enforcement of federal securities laws. 2 As used throughout the study, the term “market” refers to capital markets in general, and, where discussed in the context of a specific rule, relates to the provisions of the relevant exemption or safe harbor.
2
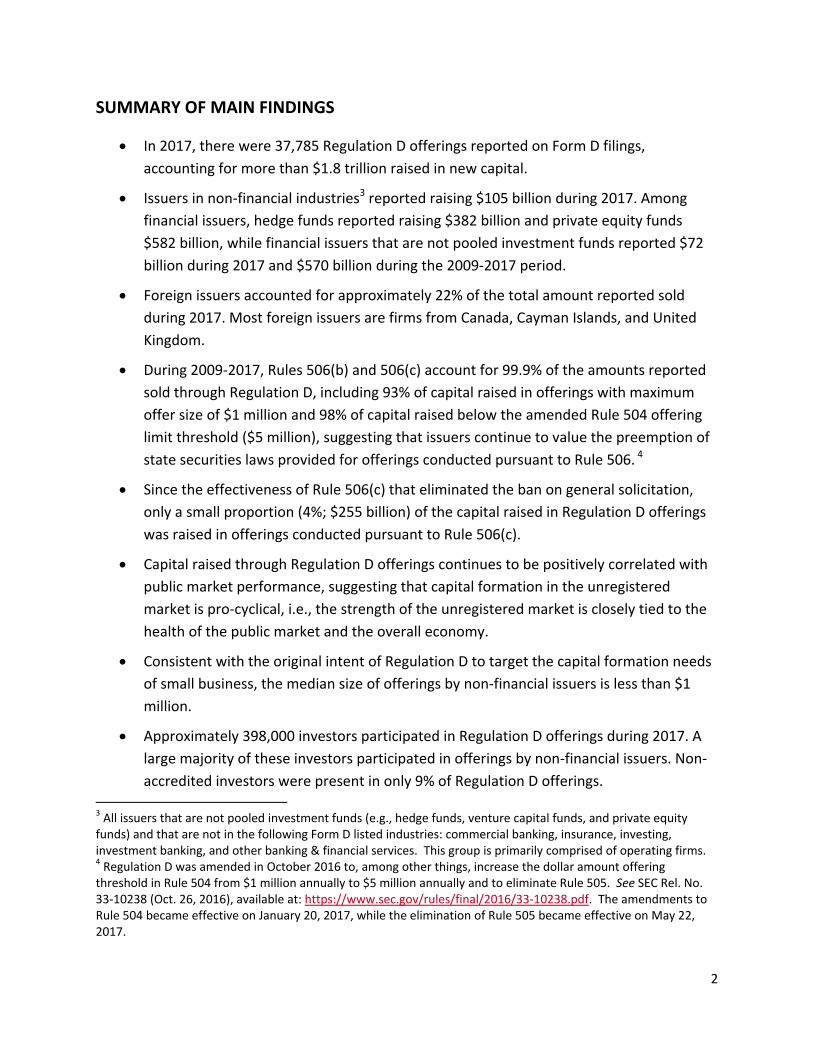
SUMMARY OF MAIN FINDINGS
In 2017, there were 37,785 Regulation D offerings reported on Form D filings,
accounting for more than $1.8 trillion raised in new capital.
Issuers in non‐financial industries3 reported raising $105 billion during 2017. Among
financial issuers, hedge funds reported raising $382 billion and private equity funds
$582 billion, while financial issuers that are not pooled investment funds reported $72
billion during 2017 and $570 billion during the 2009‐2017 period.
Foreign issuers accounted for approximately 22% of the total amount reported sold
during 2017. Most foreign issuers are firms from Canada, Cayman Islands, and United
Kingdom.
During 2009‐2017, Rules 506(b) and 506(c) account for 99.9% of the amounts reported
sold through Regulation D, including 93% of capital raised in offerings with maximum
offer size of $1 million and 98% of capital raised below the amended Rule 504 offering
limit threshold ($5 million), suggesting that issuers continue to value the preemption of
state securities laws provided for offerings conducted pursuant to Rule 506. 4
Since the effectiveness of Rule 506(c) that eliminated the ban on general solicitation,
only a small proportion (4%; $255 billion) of the capital raised in Regulation D offerings
was raised in offerings conducted pursuant to Rule 506(c).
Capital raised through Regulation D offerings continues to be positively correlated with
public market performance, suggesting that capital formation in the unregistered
market is pro‐cyclical, i.e., the strength of the unregistered market is closely tied to the
health of the public market and the overall economy.
Consistent with the original intent of Regulation D to target the capital formation needs
of small business, the median size of offerings by non‐financial issuers is less than $1
million.
Approximately 398,000 investors participated in Regulation D offerings during 2017. A
large majority of these investors participated in offerings by non‐financial issuers. Non‐
accredited investors were present in only 9% of Regulation D offerings. 3 All issuers that are not pooled investment funds (e.g., hedge funds, venture capital funds, and private equity funds) and that are not in the following Form D listed industries: commercial banking, insurance, investing, investment banking, and other banking & financial services. This group is primarily comprised of operating firms. 4 Regulation D was amended in October 2016 to, among other things, increase the dollar amount offering threshold in Rule 504 from $1 million annually to $5 million annually and to eliminate Rule 505. See SEC Rel. No. 33‐10238 (Oct. 26, 2016), available at: https://www.sec.gov/rules/final/2016/33‐10238.pdf. The amendments to Rule 504 became effective on January 20, 2017, while the elimination of Rule 505 became effective on May 22, 2017.
3
I. Introduction
Securities laws require that all offers and sales of securities be either registered with the
Securities and Exchange Commission (SEC) under the Securities Act of 1933 or made in reliance
upon an exemption from registration. When raising capital through the sale of securities to any
potential investors in the public capital market (a “public” offering), the issuer must generally
register the offer and sale of securities with the SEC, a process that is accompanied by extensive
information production and subsequent reporting, unless an exemption from registration is
available.5 Alternatively, a company can raise capital by accessing the private capital markets
through an unregistered (“private”) offering in a transaction exempt from registration. In
general, this path reduces an issuer’s regulatory obligations, as compared to the obligations
attendant to registered public offerings, thereby reducing issuance costs and the time required
to raise new capital. This particularly benefits smaller firms, for whom accessing public capital
markets may generally be too costly. However, because of these accommodations, private
offering alternatives are generally subject to investor restrictions and/or offering limits. These
investor protection provisions must be met to qualify for an exemption from registration.
The private offering market is governed by several exemptions from registration,
including those under Sections 4(a)(2), 3(b) and 3(a)(11) of the Securities Act. For example,
Section 3(b) is the exemptive authority for Rule 504 under Regulation D, as well as Regulation A
that was amended, effective June 2015, pursuant to Title IV of the JOBS Act.6 Other parts of the
private market rely on "safe harbors": rules and regulations that set forth specific conditions
that, if satisfied, ensure compliance with an exemption from registration. For example, issuers
can use non‐exclusive safe harbors such as Rule 506(b) of Regulation D, which is a safe harbor
under Section 4(a)(2), Regulation S for offerings outside of the U.S., and Rule 144A for the
resale of restricted securities to qualified institutional buyers (QIBs). A comparative analysis of
the characteristics of these and other offering exemptions and safe harbors is provided in
Appendix II. The Commission also recently adopted final rules that increased the maximum
offer size under Rule 504 from $1 million to $5 million and repealed Rule 505 in light of its
limited and declining usage.7 These changes to Regulation D (amended Rule 504 and repeal of
Rule 505) became effective in 2017.
The importance of private capital markets as a source of financing in the economy is
underscored by the fact that less than 0.02% of the estimated 5.8 million employee‐based firms
5 For example, an exception to the general rule exist in unregistered securities offerings conducted pursuant to Regulation A, an exemption from registration for securities offerings of up to $50 million annually. 6 Among the changes in Regulation A is an increase in the amount of capital that can be raised (from $5 million to $50 million) and state securities law preemption for certain offerings. 7 Exemptions to Facilitate Intrastate and Regional Securities Offerings, Release No. 33‐10238 (October 26, 2016).
4
and 23.8 million non‐employer firms in the U.S. are currently exchange listed firms.8 Moreover,
there has been a steady and significant decrease in the number of public reporting companies
in the U.S., particularly since the dot com crash and implementation of the Sarbanes‐Oxley Act.9
During this period, private offerings of securities have contributed significantly to capital
formation in the U.S. economy, particularly for small and emerging companies that are often
considered to be the engine for creating new jobs,10 driving innovation, and for accelerating
economic growth. Hence, private capital markets provide an important financing alternative for
companies that for various reasons forego financing in the public capital markets.
This study focuses on securities issuances by issuers that conduct unregistered offerings
pursuant to Regulation D of the Securities Act. Currently, Regulation D is comprised of three
rules: Rule 504, Rule 506(b) and Rule 506(c). 11 The analysis updates and extends previous work
by SEC staff on this topic,12 and includes a comprehensive look at the use and effect of the
introduction of Rule 506(c) under Title II of the JOBS Act, which allows an issuer to generally
solicit investors and generally advertise its offering. A critical component of our analysis is the
data we rely on. The data used in the study, including how we compiled our sample, is
described in detail in Appendix I. As the analysis below shows, Regulation D remains a widely
used regulation for conducting unregistered offerings of securities. More than $1.8 trillion was
reported as sold during 2017, the highest levels reported since Form D filings became machine
readable in 2008.13 This amount is larger than the amount of capital raised by public equity and
debt offerings combined. And as indicated in the next Section, it is likely that the reported data
on Regulation D offerings underestimates the actual amount raised through offerings where
the issuer intended to rely on Regulation D. Most of the $1.8 trillion was reported raised
through Rule 506(b), which prohibits general solicitation and general advertising, and limits
investor participation to accredited investors and up to 35 sophisticated non‐accredited14,
8 Data is for 2014. See https://www.sba.gov/sites/default/files/advocacy/SB‐FAQ‐2017‐WEB.pdf. Also see, There were 4,369 listed domestic companies in 2014. See, World Federation of Exchanges Database, World Bank. http://data.worldbank.org/indicator/CM.MKT.LDOM.NO?locations=US. 9 See Doidge, C., A. Karolyi, and R. Stulz, The U.S. Listing Gap, The Journal of Financial Economics, Vol 123, Issue 3, March 2017. 10 The United States Small Business Administration estimates show that small businesses accounted for 48% of U.S. employment during 2014, and contributed to creating 62% of all net new jobs during 1993‐2016. See https://www.sba.gov/sites/default/files/advocacy/SB‐FAQ‐2017‐WEB.pdf. 11 See fn. 4 above. 12 See, the 2015 Unregistered Offerings Study. 13 Prior to 2008, filings were filed in paper making large scale extraction from tens of thousands of filings impractical. 14 These are investors that do not meet the definition of an accredited investor provided under Rule 501 of Regulation D. Generally, accredited investors are institutions that have total assets of at‐least $5 million or natural persons that have individual income of at least $200,000, joint income of at least $300,000, in each of the last two years and an expectation to reach the same income in the current year, or net‐worth (excluding primary residence) of at‐least $1 million. See Section IVb. for more information on investors in Regulation D offerings.
5
investors. Amounts reported raised under Rule 506(c) remain a small fraction of the total (4%)
of the capital reported raised pursuant to Regulation D since the rule became effective on
September 23, 2013, suggesting that most issuers of unregistered securities are not yet seeking
investors through general solicitation and general advertising.
Among the other findings, the majority of the capital raised in the Regulation D market
in 2017 was raised by pooled investment vehicles ($1,671 billion), while non‐financial issuers
raised $105 billion.15 Regulation D offerings are very popular with small businesses: there have
been more than 100,700 issuances by non‐financial issuers since 2009, with a median offer size
of less than $1 million. Unlike public offerings, only 20% of new Regulation D offerings since
2009 report using a financial intermediary. The average commission is 6%, but it varies
significantly by the size of the offering and the type of the issuer involved.
The results of our analysis take into consideration several factors that may affect an
issuer’s choice of offering method for issuance of unregistered securities, such as preemption
of state securities laws, ability to advertise, ability of non‐accredited investors to participate,
limits to the amount of capital that can be raised, geographical constraints, and level of
required initial and ongoing disclosure to investors. These factors may affect both the level of
burden (costs) incurred by an issuer to raise capital as well as the amount of protection
available to investors, including, for instance, through additional oversight by state securities
regulators.
Similarly, while Regulation D has been in existence since 1982, other private offering
issuance methods are newer, such as those arising from the JOBS Act (e.g., the new Rule 506(c)
effective since September 2013, the amended Regulation A effective since June 2015, the
Regulation Crowdfunding since May 2016 and the amended Rule 147 and new Rule 147A for
intrastate offerings that became effective April 2017). The last section in this study presents a
comparative analysis of capital raising activity under Regulation D exemptions relative to
Regulation A and Regulation Crowdfunding. Compared to Regulation A and Regulation
Crowdfunding offerings, Regulation D offerings of similar offering sizes are much more
numerous and raise significantly more capital. Additionally, very few Regulation Crowdfunding
issuers have used the Regulation D market in the past, suggesting that Regulation
Crowdfunding, at least based on data as of December 31, 2017, tends to bring new issuers to
the private offering market rather than encouraging current issuers to switch between private
offerings exemptions. A caveat is due, however, since we do not observe if these Regulation
Crowdfunding issuers use other private offering exemptions for which we do not have data
15 Pooled investment vehicles include hedge funds, private equity funds, venture capital funds, commodity pools, and a few other types of funds. In the paper we use the terms “pooled investment vehicles” and “funds” interchangeably. Non‐financial issuers are defined as operating companies that are outside of the financial sector.
6
(e.g., Section 4(a)(2) offerings). As of December 31, 2017, approximately 61% of Regulation A
issuers have undertaken private offerings16, most of them in reliance on Section 4(a)(2) or
Regulation D, suggesting that, at least based on the two and a half years of data since the
changes in Regulation A became effective, most issuers in this market tend to switch between
private offerings exemptions. Additionally, we do not have enough information to determine
the extent to which some of these newer rules and the amendments to Regulation D that
became effective in 2017 (amended Rule 504 and repeal of Rule 505) will affect the importance
of Rule 506(b) and 506(c) of Regulation D or serve as alternatives to registered offerings.
The study is organized as follows. Section II provides an overview of the private offerings
market. Section III provides an overview of capital formation in the market for Regulation D
offerings. Section IV provides a detailed analysis of the characteristics of market participants in
the Regulation D market. Section V compares Regulation D offerings and issuer characteristics
to similar Regulation A and Regulation Crowdfunding offerings.
16 See Anzhela Knyazeva, Regulation A+: What do we know so far? (November 2016), available at https://www.sec.gov/files/Knyazeva_RegulationA%20.pdf
7
II. The size of the private offerings market
To estimate the total size of the private offerings market, we sum the total amount of
securities sold using available data17 for each of the main private offering exemptions during
the period 2009‐2017, including:
Regulation D
Rule 144A (resale of unregistered securities to QIBs)
Regulation S (offshore component of 144A offerings)
Regulation A offerings
Regulation Crowdfunding offerings
Other Section 4(a)(2) private offerings
Data for some of these exemptions is more readily available than for others. For example,
because issuers relying on Section 4(a)(2) are not required to file any document with the
Commission, offering information available in the commercial databases likely underestimates
the amount of capital raised through this exemption. Similarly, the available data on Regulation
D offerings could underestimate the true amount of capital raised through such offerings. While
Rule 503 of Regulation D requires the filing of a notice on Form D no later than 15 days after
the first sale of securities, the filing of a Form D is not a condition to claiming a Regulation D
safe harbor or exemption, and it is possible that some issuers do not file Forms D for offerings
relying on Regulation D.18
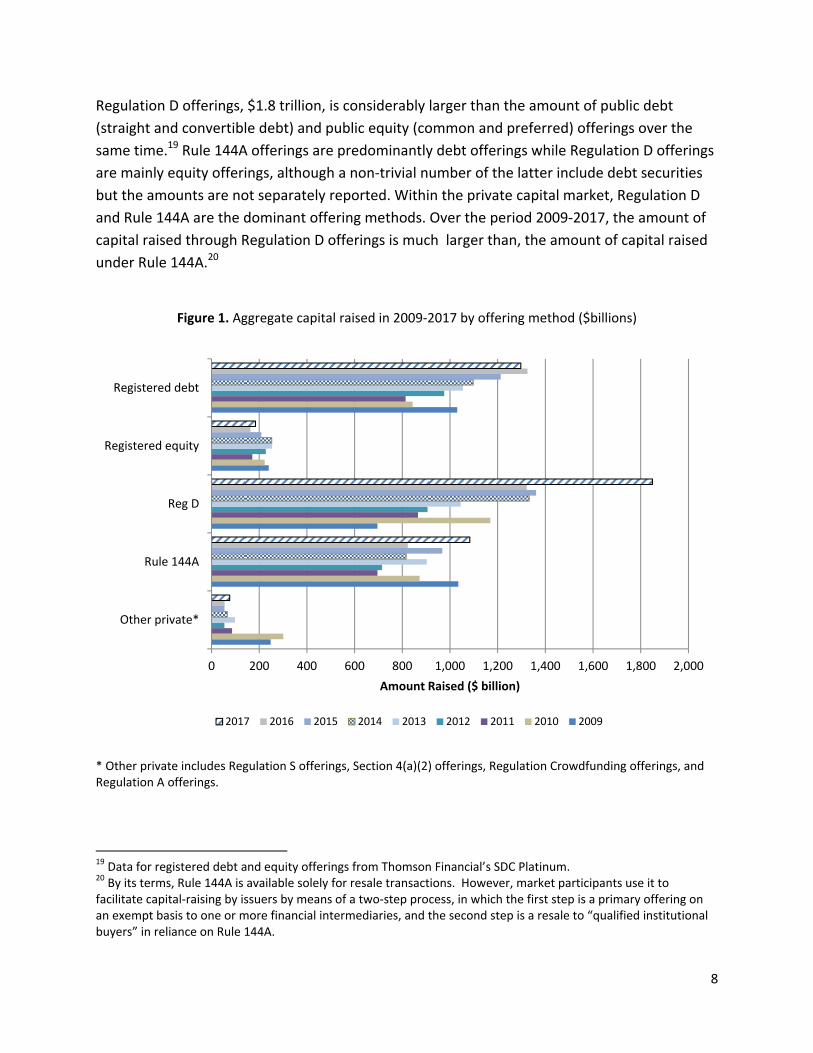
Figure 1 illustrates that the total capital raised annually in the private capital market is
large both in absolute terms and when compared to the amounts raised in the public markets.
In 2017, registered offerings accounted for $1.5 trillion of new capital compared to more than
$3.0 trillion reported raised through all private offering channels. The amount raised by
17 Data on Regulation D offerings was collected from all Form D filings (new filings and amendments) on EDGAR from January 2009 through December 2017; Data on non‐ABS Rule 144A offerings was collected from Thomson Financial SDC new Issues database, Dealogic, and the Mergent database. Data on ABS and CMBS Rule 144A offerings was collected from the Asset‐Backed Alert and Commercial Mortgage Alert publications; Data for Regulation S offerings was collected from Thomson Financial’s SDC Platinum service; Data on Regulation A and Regulation Crowdfunding offerings was collected from all Form 1‐A and Form C filings (new filings and amendments) on EDGAR from May 2015 through December 2017; and Data for other private offerings (excluding Regulation A and Regulation Crowdfunding offerings) was collected from Thomson Financial’s SDC Platinum, which uses information from underwriters, issuer websites, and issuer SEC filings to compile its Private Issues database. These include offerings under Section 4(a)(2) of the Securities Act that do not claim a Regulation D or Reg S exemption and that are without a follow‐on Rule 144A sale. These numbers are accurate only to the extent that SDC is able to collect such information, and may understate the actual amount of capital raised under Section 4(a)(2) if issuers and underwriters do not make this data available. 18 Separate analysis by DERA staff of Form D filings by funds advised by registered investment advisers and broker‐dealer members of FINRA suggests that Form D filings are not made for as much as 10% of unregistered offerings eligible for relief under Regulation D.
8
Regulation D offerings, $1.8 trillion, is considerably larger than the amount of public debt
(straight and convertible debt) and public equity (common and preferred) offerings over the
same time.19 Rule 144A offerings are predominantly debt offerings while Regulation D offerings
are mainly equity offerings, although a non‐trivial number of the latter include debt securities
but the amounts are not separately reported. Within the private capital market, Regulation D
and Rule 144A are the dominant offering methods. Over the period 2009‐2017, the amount of
capital raised through Regulation D offerings is much larger than, the amount of capital raised
under Rule 144A.20
Figure 1. Aggregate capital raised in 2009‐2017 by offering method ($billions)
* Other private includes Regulation S offerings, Section 4(a)(2) offerings, Regulation Crowdfunding offerings, and Regulation A offerings.
19 Data for registered debt and equity offerings from Thomson Financial’s SDC Platinum. 20 By its terms, Rule 144A is available solely for resale transactions. However, market participants use it to facilitate capital‐raising by issuers by means of a two‐step process, in which the first step is a primary offering on an exempt basis to one or more financial intermediaries, and the second step is a resale to “qualified institutional buyers” in reliance on Rule 144A.
0 200 400 600 800 1,000 1,200 1,400 1,600 1,800 2,000
Other private*
Rule 144A
Reg D
Registered equity
Registered debt
Amount Raised ($ billion)
2017 2016 2015 2014 2013 2012 2011 2010 2009
9
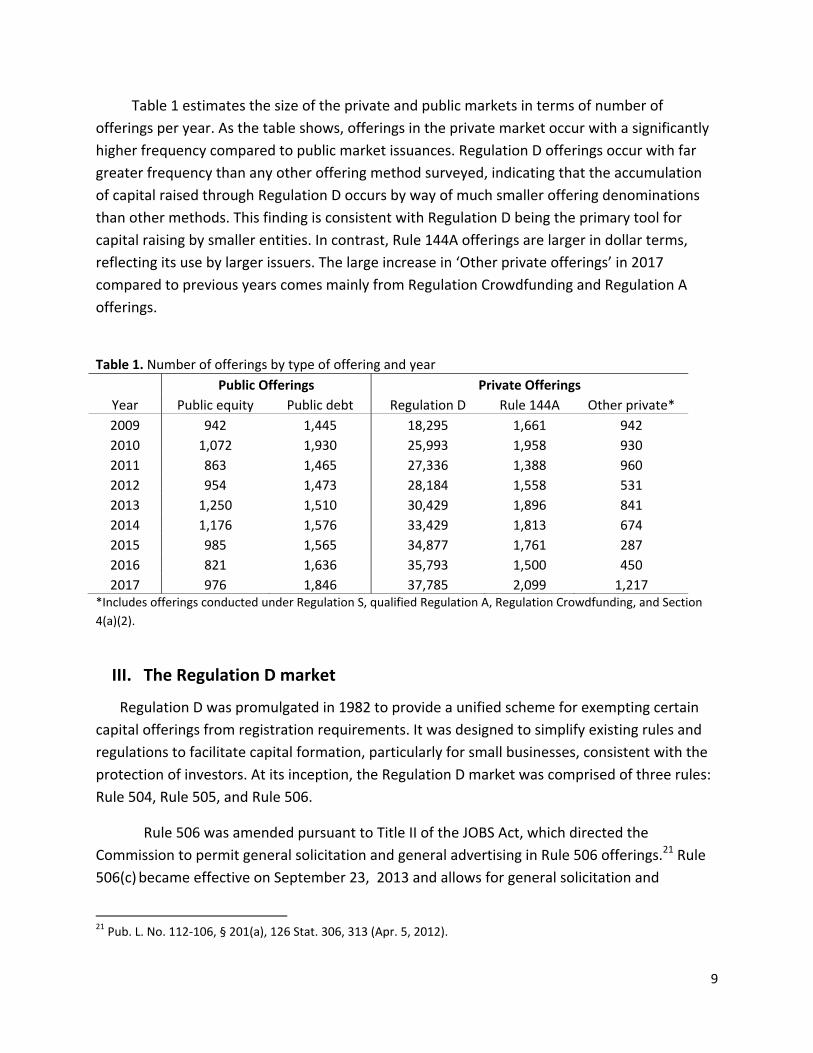
Table 1 estimates the size of the private and public markets in terms of number of
offerings per year. As the table shows, offerings in the private market occur with a significantly
higher frequency compared to public market issuances. Regulation D offerings occur with far
greater frequency than any other offering method surveyed, indicating that the accumulation
of capital raised through Regulation D occurs by way of much smaller offering denominations
than other methods. This finding is consistent with Regulation D being the primary tool for
capital raising by smaller entities. In contrast, Rule 144A offerings are larger in dollar terms,
reflecting its use by larger issuers. The large increase in ‘Other private offerings’ in 2017
compared to previous years comes mainly from Regulation Crowdfunding and Regulation A
offerings.
Table 1. Number of offerings by type of offering and year
Public Offerings Private Offerings
Year Public equity Public debt Regulation D Rule 144A Other private*
2009 942 1,445 18,295 1,661 942
2010 1,072 1,930 25,993 1,958 930
2011 863 1,465 27,336 1,388 960
2012 954 1,473 28,184 1,558 531
2013 1,250 1,510 30,429 1,896 841
2014 1,176 1,576 33,429 1,813 674
2015 985 1,565 34,877 1,761 287
2016 821 1,636 35,793 1,500 450
2017 976 1,846 37,785 2,099 1,217 *Includes offerings conducted under Regulation S, qualified Regulation A, Regulation Crowdfunding, and Section
4(a)(2).
III. The Regulation D market
Regulation D was promulgated in 1982 to provide a unified scheme for exempting certain
capital offerings from registration requirements. It was designed to simplify existing rules and
regulations to facilitate capital formation, particularly for small businesses, consistent with the
protection of investors. At its inception, the Regulation D market was comprised of three rules:
Rule 504, Rule 505, and Rule 506.
Rule 506 was amended pursuant to Title II of the JOBS Act, which directed the
Commission to permit general solicitation and general advertising in Rule 506 offerings.21 Rule
506(c) became effective on September 23, 2013 and allows for general solicitation and
21 Pub. L. No. 112‐106, § 201(a), 126 Stat. 306, 313 (Apr. 5, 2012).
10
advertising in Rule 506 offerings as long as all purchasers are accredited investors and issuers
take reasonable steps to verify that such purchasers are accredited investors.22 Rule 506, as it
existed before the adoption of Rule 506(c), was preserved and re‐designated as Rule 506(b).
As noted above, in view of the low levels of usage of Rule 505, SEC recently repealed the
Rule 505 exemption, effective May 22, 2017.23 At the same time, the Commission amended
Rule 504 to increase the aggregate amount of securities that may be offered and sold in a 12‐
month period, from $1 million to $5 million.24 In addition to being more reflective of
contemporary seed‐capital needs of early stage companies, the higher ceiling under Rule 504
was adopted to facilitate the development of regional offerings, and intrastate crowdfunding
offerings.
The tables and figures in this section provide a broad overview of capital formation in
the Regulation D capital market and its various exemptions. The information in this section, as
well as the following Section IV, that provides a detailed analysis of the characteristics of
Regulation D market participants is based on information reported in Forms D and D/A filed by
issuers of such offerings.
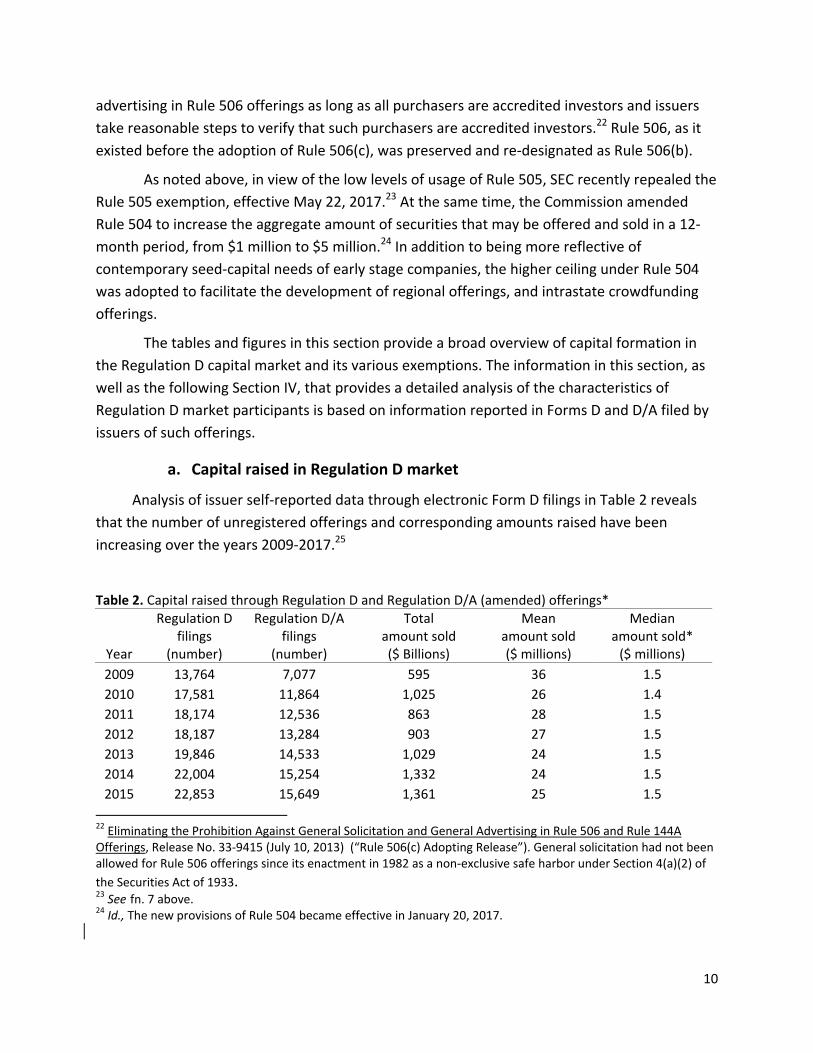
a. Capital raised in Regulation D market
Analysis of issuer self‐reported data through electronic Form D filings in Table 2 reveals
that the number of unregistered offerings and corresponding amounts raised have been
increasing over the years 2009‐2017.25
Table 2. Capital raised through Regulation D and Regulation D/A (amended) offerings*
Year
Regulation D filings
(number)
Regulation D/A filings
(number)
Total amount sold ($ Billions)
Mean amount sold ($ millions)
Median amount sold* ($ millions)
2009 13,764 7,077 595 36 1.5
2010 17,581 11,864 1,025 26 1.4
2011 18,174 12,536 863 28 1.5
2012 18,187 13,284 903 27 1.5
2013 19,846 14,533 1,029 24 1.5
2014 22,004 15,254 1,332 24 1.5
2015 22,853 15,649 1,361 25 1.5
22 Eliminating the Prohibition Against General Solicitation and General Advertising in Rule 506 and Rule 144A Offerings, Release No. 33‐9415 (July 10, 2013) (“Rule 506(c) Adopting Release”). General solicitation had not been allowed for Rule 506 offerings since its enactment in 1982 as a non‐exclusive safe harbor under Section 4(a)(2) of
the Securities Act of 1933. 23 See fn. 7 above. 24 Id., The new provisions of Rule 504 became effective in January 20, 2017.
11
2016 22,991 16,490 1,322 24 1.5
2017 24,476 17,192 1,849 32 2 *Mean and median amount sold based on initial (new) Form D filings only. Total amount sold includes additional amounts raised and reported in amended filings, recorded at the time of the amendment.
These estimates are based on the reported “total amount sold” at the time of the original
filing – required within 15 days of the first sale – as well as any additional capital raised and
reported in amended filings. The data likely underreport the actual amount sold due to two
factors. First, because electronic filings were phased‐in through the end of March 2009, paper
filings in the first quarter of 2009 are not captured in the analysis. Underreporting could occur
in all years because Regulation D filings can be made prior to the completion of the offering,
and amendments to reflect additional amounts sold generally are not required if the offering is
completed within one year and the amount sold does not exceed the original offering size by
more than 10%. Second, as previously described, Rule 503 requires the filing of a notice on
Form D, but filing a Form D is not a condition to claiming a Regulation D safe harbor or
exemption. Hence, it is possible that some issuers do not file a Form D for offerings relying on
Regulation D.26 Finally, in their annual amendments, some funds appear to report net asset
values for total amount sold under the offering. Net asset values could reflect fund
performance as well as new investment into, and redemptions from, the fund. Based on Form D
data, it is not possible to distinguish between the two impacts.
b. Cyclicality
It is a well‐documented empirical fact that public capital markets are cyclical and the
cyclicality appears to be driven by the business cycle, investor sentiment, and time‐varying
information asymmetry.27 However, there is little empirical evidence on the cyclicality of capital
raised through private offering markets, and in particular, whether issuers rely more on private
markets when public markets are under distress (e.g., during recessions).
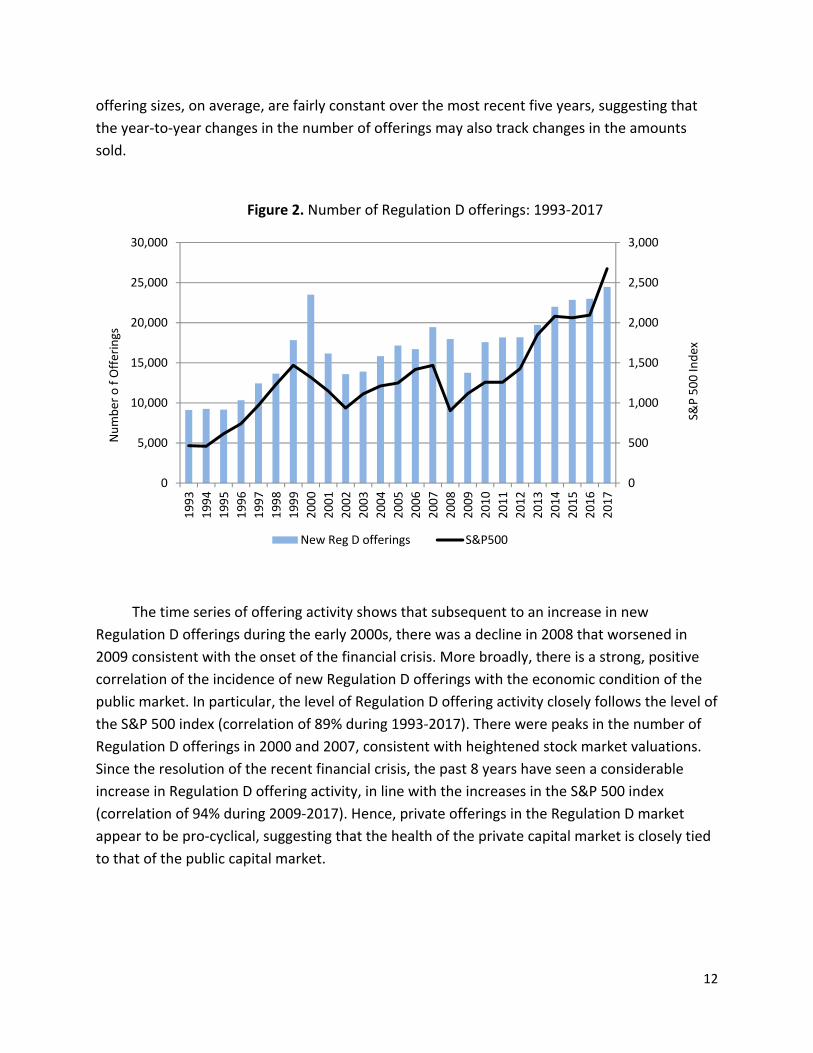
Figure 2 shows Regulation D offering activity based on the number of offerings by
calendar year, relative to the S&P 500 index, for the period 1993‐2017. These numbers
correspond to all new (non‐amended) Form D filings on the EDGAR filing system. While the data
does not indicate the aggregate amount raised through these offerings, Table 2 shows that
26 Separate analysis by DERA staff of Form D filings by funds advised by registered investment advisers and broker‐dealer members of FINRA during the period 2009‐2011 suggests that Form D filings are not made for as much as 10% of unregistered offerings eligible for relief under Regulation D. 27 See Ivanov, I. and C. Lewis, The Determinants of Market‐Wide Issue Cycles for Initial Public Offerings, Journal of Corporate Finance, December 2008; Lowry, M., Why Does IPO Volume Fluctuate So Much?, Journal of Financial Economics, January 2003; and Choe,H. , R. Masulis and V. Nanda: Common Stock Offerings Across the Business Cycle: Theory and Evidence, Journal of Empirical Finance, June 1993.
12
offering sizes, on average, are fairly constant over the most recent five years, suggesting that
the year‐to‐year changes in the number of offerings may also track changes in the amounts
sold.
Figure 2. Number of Regulation D offerings: 1993‐2017
The time series of offering activity shows that subsequent to an increase in new
Regulation D offerings during the early 2000s, there was a decline in 2008 that worsened in
2009 consistent with the onset of the financial crisis. More broadly, there is a strong, positive
correlation of the incidence of new Regulation D offerings with the economic condition of the
public market. In particular, the level of Regulation D offering activity closely follows the level of
the S&P 500 index (correlation of 89% during 1993‐2017). There were peaks in the number of
Regulation D offerings in 2000 and 2007, consistent with heightened stock market valuations.
Since the resolution of the recent financial crisis, the past 8 years have seen a considerable
increase in Regulation D offering activity, in line with the increases in the S&P 500 index
(correlation of 94% during 2009‐2017). Hence, private offerings in the Regulation D market
appear to be pro‐cyclical, suggesting that the health of the private capital market is closely tied
to that of the public capital market.
0
500
1,000
1,500
2,000
2,500
3,000
0
5,000
10,000
15,000
20,000
25,000
30,000
1993
1994
1995
1996
1997
1998
1999
2000
2001
2002
2003
2004
2005
2006
2007
2008
2009
2010
2011
2012
2013
2014
2015
2016
2017
New Reg D offerings S&P500
Number o f Offerings
S&P 500 Index
13
c. Offering Security Type
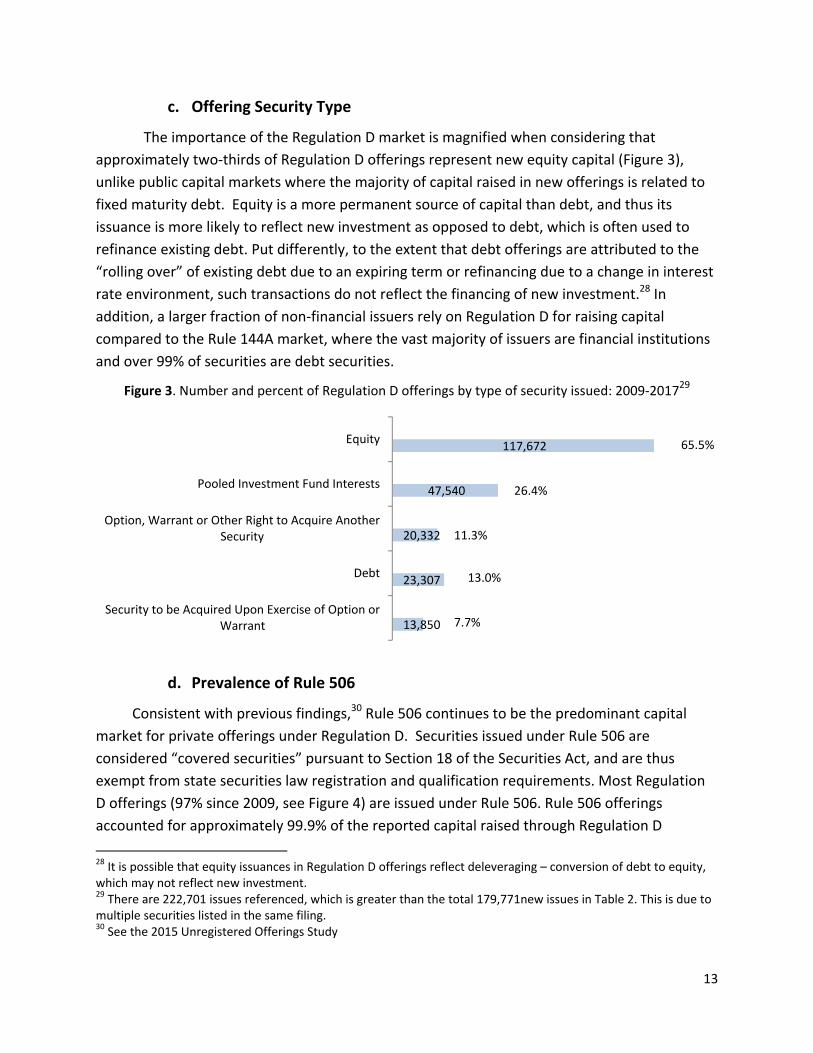
The importance of the Regulation D market is magnified when considering that
approximately two‐thirds of Regulation D offerings represent new equity capital (Figure 3),
unlike public capital markets where the majority of capital raised in new offerings is related to
fixed maturity debt. Equity is a more permanent source of capital than debt, and thus its
issuance is more likely to reflect new investment as opposed to debt, which is often used to
refinance existing debt. Put differently, to the extent that debt offerings are attributed to the
“rolling over” of existing debt due to an expiring term or refinancing due to a change in interest
rate environment, such transactions do not reflect the financing of new investment.28 In
addition, a larger fraction of non‐financial issuers rely on Regulation D for raising capital
compared to the Rule 144A market, where the vast majority of issuers are financial institutions
and over 99% of securities are debt securities.
Figure 3. Number and percent of Regulation D offerings by type of security issued: 2009‐201729
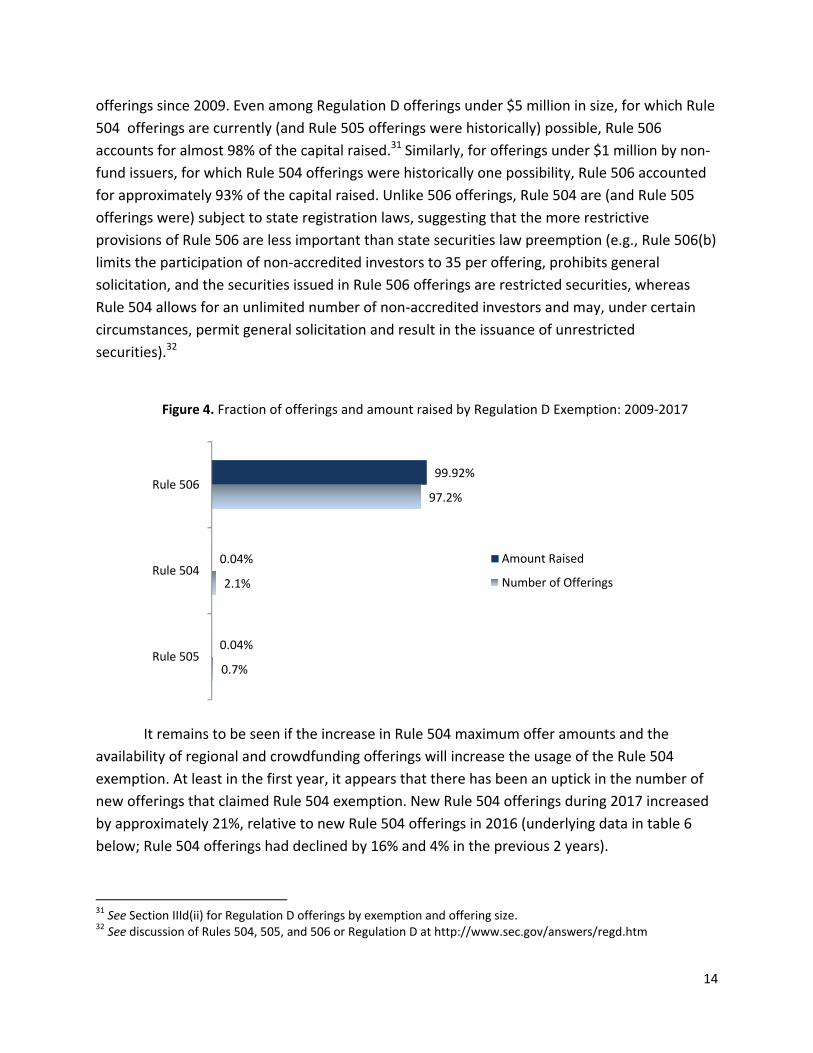
d. Prevalence of Rule 506
Consistent with previous findings,30 Rule 506 continues to be the predominant capital
market for private offerings under Regulation D. Securities issued under Rule 506 are
considered “covered securities” pursuant to Section 18 of the Securities Act, and are thus
exempt from state securities law registration and qualification requirements. Most Regulation
D offerings (97% since 2009, see Figure 4) are issued under Rule 506. Rule 506 offerings
accounted for approximately 99.9% of the reported capital raised through Regulation D
28 It is possible that equity issuances in Regulation D offerings reflect deleveraging – conversion of debt to equity, which may not reflect new investment. 29 There are 222,701 issues referenced, which is greater than the total 179,771new issues in Table 2. This is due to multiple securities listed in the same filing. 30 See the 2015 Unregistered Offerings Study
13,850
23,307
20,332
47,540
117,672
7.7%
13.0%
11.3%
26.4%
65.5%
Security to be Acquired Upon Exercise of Option orWarrant
Debt
Option, Warrant or Other Right to Acquire AnotherSecurity
Pooled Investment Fund Interests
Equity
14
offerings since 2009. Even among Regulation D offerings under $5 million in size, for which Rule
504 offerings are currently (and Rule 505 offerings were historically) possible, Rule 506
accounts for almost 98% of the capital raised.31 Similarly, for offerings under $1 million by non‐
fund issuers, for which Rule 504 offerings were historically one possibility, Rule 506 accounted
for approximately 93% of the capital raised. Unlike 506 offerings, Rule 504 are (and Rule 505
offerings were) subject to state registration laws, suggesting that the more restrictive
provisions of Rule 506 are less important than state securities law preemption (e.g., Rule 506(b)
limits the participation of non‐accredited investors to 35 per offering, prohibits general
solicitation, and the securities issued in Rule 506 offerings are restricted securities, whereas
Rule 504 allows for an unlimited number of non‐accredited investors and may, under certain
circumstances, permit general solicitation and result in the issuance of unrestricted
securities).32
Figure 4. Fraction of offerings and amount raised by Regulation D Exemption: 2009‐2017
It remains to be seen if the increase in Rule 504 maximum offer amounts and the
availability of regional and crowdfunding offerings will increase the usage of the Rule 504
exemption. At least in the first year, it appears that there has been an uptick in the number of
new offerings that claimed Rule 504 exemption. New Rule 504 offerings during 2017 increased
by approximately 21%, relative to new Rule 504 offerings in 2016 (underlying data in table 6
below; Rule 504 offerings had declined by 16% and 4% in the previous 2 years).
31 See Section IIId(ii) for Regulation D offerings by exemption and offering size. 32 See discussion of Rules 504, 505, and 506 or Regulation D at http://www.sec.gov/answers/regd.htm
0.7%
2.1%
97.2%
0.04%
0.04%
99.92%
Rule 505
Rule 504
Rule 506
Amount Raised
Number of Offerings
15
i. The new Rule 506(c) market
From September 23, 2013 to December 31, 2017, a total of 6,690 issuers initiated 7,110
new Rule 506(c) offerings (Table 3). During this period, based on initial Form D filings, almost
$183.3 billion was reported raised. An additional $72 billion was reported raised in
amendments to initial filings, some of which were originally initiated as Rule 506(b) offerings.
During the same period, there were 87,890 new Rule 506(b) offerings that reported to raise
$1.8 trillion in their initial Form D filings, and an incremental amount of $4.0 trillion was
reported to be raised in amendments filed. On a relative basis, issuances claiming the new Rule
506(c) exemption have accounted for only 4.4% of the reported capital raised pursuant to Rule
506 since becoming effective in September 2013.
While the underlying motivation for permitting general solicitation was to boost capital
formation through increased accessibility of certain issuers to accredited investors, the vast
majority of Regulation D issuers continue to raise capital through rule 506(b) offerings. The
relative novelty of the 506(c) provisions after decades of non‐permissibility of general
solicitation in Regulation D offerings may be one reason why Rule 506(b) continues to dominate
the Regulation D market. In particular, issuers with pre‐existing sources of financing and/or
intermediation channels may not yet have a need for the new flexibility. Other issuers may
become more comfortable with market practices as they develop over time, including among
other things, certainty over what constitutes general solicitation.33 Some issuers may be
reluctant to use general solicitation to avoid sharing information publicly (through Form D
filings or through advertising materials), for competitive and general business reasons.34 There
may also be concerns about the added burden or appropriate levels of verification of the
accredited investor status of all purchasers,35 for which efficient market solutions may develop
over time. Regulatory uncertainty has also been previously identified as a possible explanation
for the relatively low level of the Rule 506(c) offerings.36
33 See, for example Keith Higgins, Director of the Division of Corporation Finance, U.S. Securities and Exchange Commission, Remarks before the 2014 Angel Capital Association Conference (Mar 28, 2014) available at: (http://www.sec.gov/News/Speech/Detail/Speech/1370541320533. See also comments of Jean Peters, Board member, Angel Capital Association, at the 33rd Securities & Exchange Commission Government‐Business Forum on Small Business Capital Formation, November 20, 2014. 34 See, https://www.bna.com/rule‐506cs‐general‐b73014451604/. See also, comments of Jean Peters, Board member, Angel Capital Association, at the 33rd Securities & Exchange Commission Government‐Business Forum on Small Business Capital Formation, November 20, 2014. 35 Id. 36 See, for example, https://dealflow.com/whitepapers/Dealflow_White_Paper_Q3_2014.pdf
16
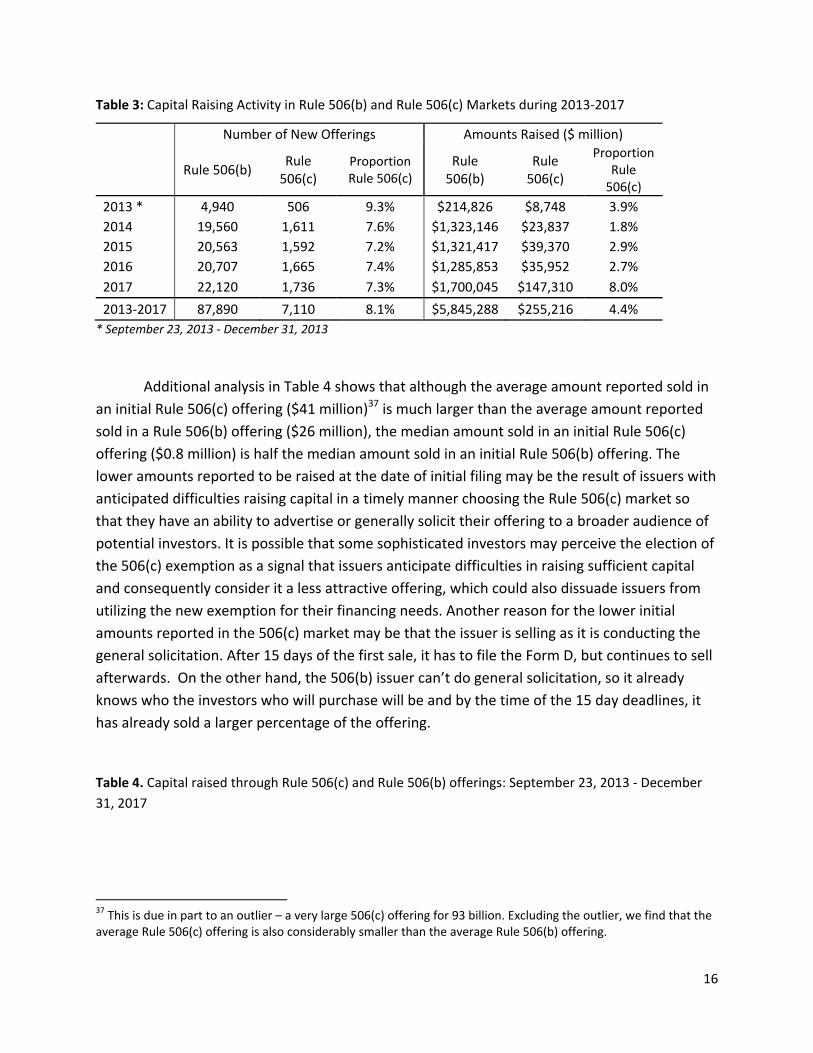
Table 3: Capital Raising Activity in Rule 506(b) and Rule 506(c) Markets during 2013‐2017
Number of New Offerings Amounts Raised ($ million)
Rule 506(b) Rule 506(c)
Proportion Rule 506(c)
Rule 506(b)
Rule 506(c)
Proportion Rule 506(c)
2013 * 4,940 506 9.3% $214,826 $8,748 3.9%
2014 19,560 1,611 7.6% $1,323,146 $23,837 1.8%
2015 20,563 1,592 7.2% $1,321,417 $39,370 2.9%
2016 20,707 1,665 7.4% $1,285,853 $35,952 2.7%
2017 22,120 1,736 7.3% $1,700,045 $147,310 8.0%
2013‐2017 87,890 7,110 8.1% $5,845,288 $255,216 4.4%
* September 23, 2013 ‐ December 31, 2013
Additional analysis in Table 4 shows that although the average amount reported sold in
an initial Rule 506(c) offering ($41 million)37 is much larger than the average amount reported
sold in a Rule 506(b) offering ($26 million), the median amount sold in an initial Rule 506(c)
offering ($0.8 million) is half the median amount sold in an initial Rule 506(b) offering. The
lower amounts reported to be raised at the date of initial filing may be the result of issuers with
anticipated difficulties raising capital in a timely manner choosing the Rule 506(c) market so
that they have an ability to advertise or generally solicit their offering to a broader audience of
potential investors. It is possible that some sophisticated investors may perceive the election of
the 506(c) exemption as a signal that issuers anticipate difficulties in raising sufficient capital
and consequently consider it a less attractive offering, which could also dissuade issuers from
utilizing the new exemption for their financing needs. Another reason for the lower initial
amounts reported in the 506(c) market may be that the issuer is selling as it is conducting the
general solicitation. After 15 days of the first sale, it has to file the Form D, but continues to sell
afterwards. On the other hand, the 506(b) issuer can’t do general solicitation, so it already
knows who the investors who will purchase will be and by the time of the 15 day deadlines, it
has already sold a larger percentage of the offering.
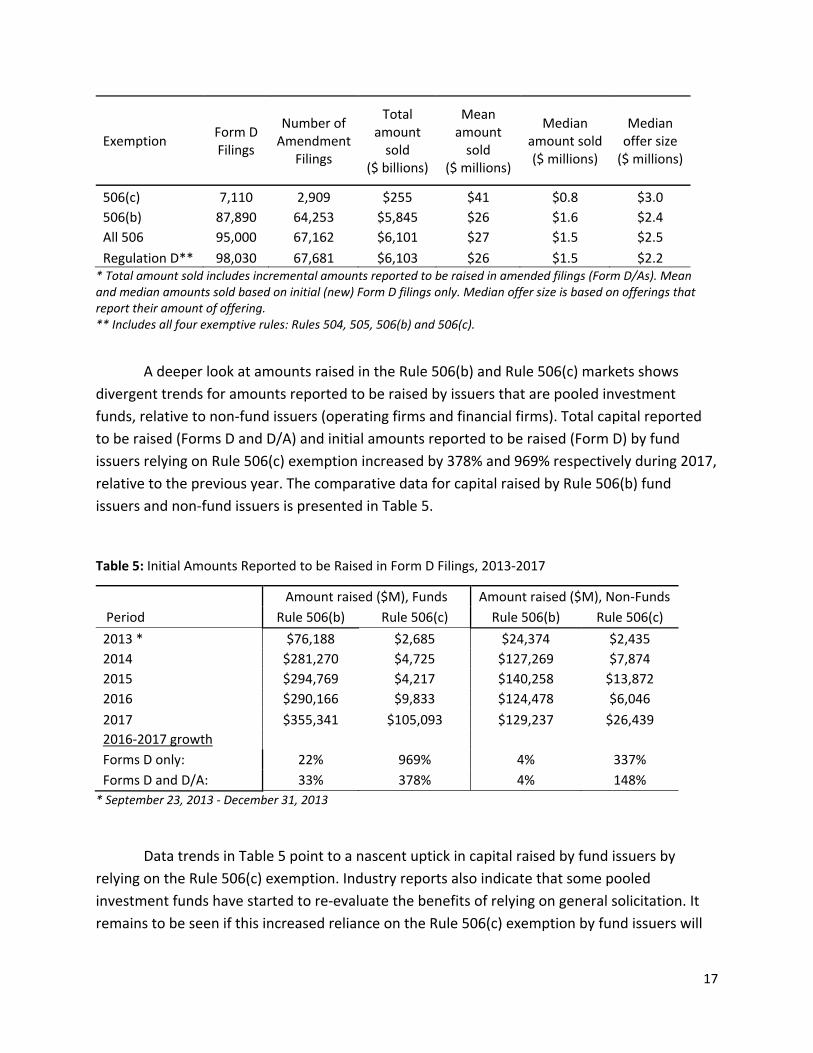
Table 4. Capital raised through Rule 506(c) and Rule 506(b) offerings: September 23, 2013 ‐ December
31, 2017
37 This is due in part to an outlier – a very large 506(c) offering for 93 billion. Excluding the outlier, we find that the average Rule 506(c) offering is also considerably smaller than the average Rule 506(b) offering.
17
Exemption Form D Filings
Number of Amendment
Filings
Total amount sold
($ billions)
Mean amount sold
($ millions)
Median amount sold ($ millions)
Median offer size ($ millions)
506(c) 7,110 2,909 $255 $41 $0.8 $3.0
506(b) 87,890 64,253 $5,845 $26 $1.6 $2.4
All 506 95,000 67,162 $6,101 $27 $1.5 $2.5
Regulation D** 98,030 67,681 $6,103 $26 $1.5 $2.2 * Total amount sold includes incremental amounts reported to be raised in amended filings (Form D/As). Mean and median amounts sold based on initial (new) Form D filings only. Median offer size is based on offerings that report their amount of offering. ** Includes all four exemptive rules: Rules 504, 505, 506(b) and 506(c).
A deeper look at amounts raised in the Rule 506(b) and Rule 506(c) markets shows
divergent trends for amounts reported to be raised by issuers that are pooled investment
funds, relative to non‐fund issuers (operating firms and financial firms). Total capital reported
to be raised (Forms D and D/A) and initial amounts reported to be raised (Form D) by fund
issuers relying on Rule 506(c) exemption increased by 378% and 969% respectively during 2017,
relative to the previous year. The comparative data for capital raised by Rule 506(b) fund
issuers and non‐fund issuers is presented in Table 5.
Table 5: Initial Amounts Reported to be Raised in Form D Filings, 2013‐2017
Amount raised ($M), Funds Amount raised ($M), Non‐Funds
Period Rule 506(b) Rule 506(c) Rule 506(b) Rule 506(c)
2013 * $76,188 $2,685 $24,374 $2,435
2014 $281,270 $4,725 $127,269 $7,874
2015 $294,769 $4,217 $140,258 $13,872
2016 $290,166 $9,833 $124,478 $6,046
2017 $355,341 $105,093 $129,237 $26,439
2016‐2017 growth
Forms D only: 22% 969% 4% 337%
Forms D and D/A: 33% 378% 4% 148%
* September 23, 2013 ‐ December 31, 2013
Data trends in Table 5 point to a nascent uptick in capital raised by fund issuers by
relying on the Rule 506(c) exemption. Industry reports also indicate that some pooled
investment funds have started to re‐evaluate the benefits of relying on general solicitation. It
remains to be seen if this increased reliance on the Rule 506(c) exemption by fund issuers will
18
develop into a longer‐term trend that will expand the Rule 506(c) market, relative to the
traditional Rule 506(b) market.
For now, consistent with the somewhat limited uptake of new Rule 506(c), there has not
been significant migration of existing issuer capital raising activity from Rule 506(b) to Rule
506(c). There has been some movement in the number of “repeat” issuers that have switched
their offering types from a non‐Rule 506(c) to Rule 506(c): Almost 1,574 new Rule 506(c)
offerings (22% of all new Rule 506(c) offerings) were initiated by 1,101 issuers that also
conducted another Regulation D offering that relied on an exemption other than Rule 506(c).
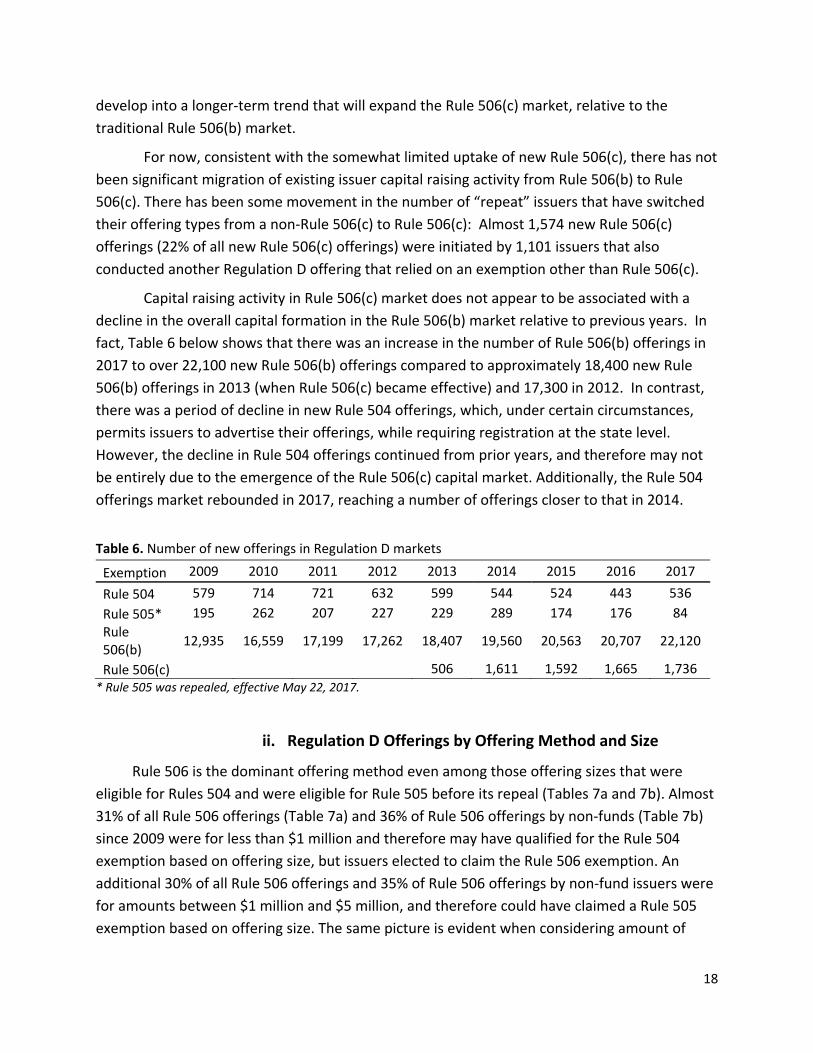
Capital raising activity in Rule 506(c) market does not appear to be associated with a
decline in the overall capital formation in the Rule 506(b) market relative to previous years. In
fact, Table 6 below shows that there was an increase in the number of Rule 506(b) offerings in
2017 to over 22,100 new Rule 506(b) offerings compared to approximately 18,400 new Rule
506(b) offerings in 2013 (when Rule 506(c) became effective) and 17,300 in 2012. In contrast,
there was a period of decline in new Rule 504 offerings, which, under certain circumstances,
permits issuers to advertise their offerings, while requiring registration at the state level.
However, the decline in Rule 504 offerings continued from prior years, and therefore may not
be entirely due to the emergence of the Rule 506(c) capital market. Additionally, the Rule 504
offerings market rebounded in 2017, reaching a number of offerings closer to that in 2014.
Table 6. Number of new offerings in Regulation D markets
Exemption 2009 2010 2011 2012 2013 2014 2015 2016 2017
Rule 504 579 714 721 632 599 544 524 443 536
Rule 505* 195 262 207 227 229 289 174 176 84
Rule 506(b)
12,935 16,559 17,199 17,262 18,407 19,560 20,563 20,707 22,120
Rule 506(c) 506 1,611 1,592 1,665 1,736 * Rule 505 was repealed, effective May 22, 2017.
ii. Regulation D Offerings by Offering Method and Size
Rule 506 is the dominant offering method even among those offering sizes that were
eligible for Rules 504 and were eligible for Rule 505 before its repeal (Tables 7a and 7b). Almost
31% of all Rule 506 offerings (Table 7a) and 36% of Rule 506 offerings by non‐funds (Table 7b)
since 2009 were for less than $1 million and therefore may have qualified for the Rule 504
exemption based on offering size, but issuers elected to claim the Rule 506 exemption. An
additional 30% of all Rule 506 offerings and 35% of Rule 506 offerings by non‐fund issuers were
for amounts between $1 million and $5 million, and therefore could have claimed a Rule 505
exemption based on offering size. The same picture is evident when considering amount of
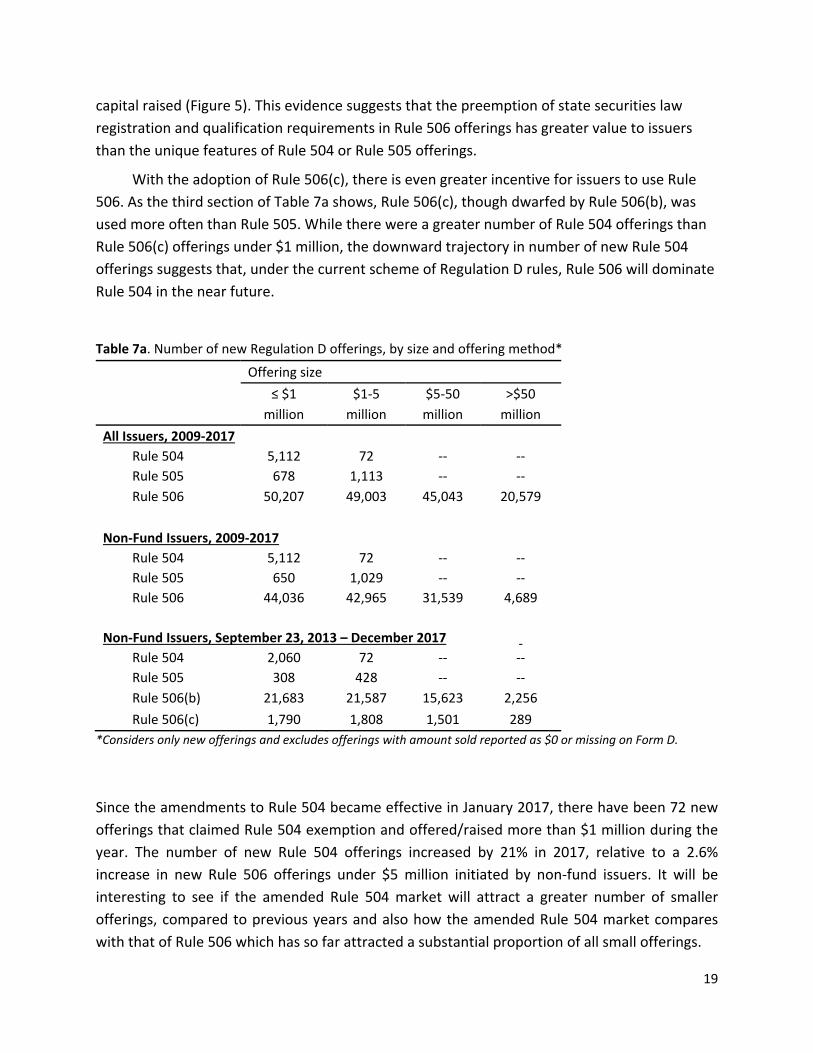
19
capital raised (Figure 5). This evidence suggests that the preemption of state securities law
registration and qualification requirements in Rule 506 offerings has greater value to issuers
than the unique features of Rule 504 or Rule 505 offerings.
With the adoption of Rule 506(c), there is even greater incentive for issuers to use Rule
506. As the third section of Table 7a shows, Rule 506(c), though dwarfed by Rule 506(b), was
used more often than Rule 505. While there were a greater number of Rule 504 offerings than
Rule 506(c) offerings under $1 million, the downward trajectory in number of new Rule 504
offerings suggests that, under the current scheme of Regulation D rules, Rule 506 will dominate
Rule 504 in the near future.
Table 7a. Number of new Regulation D offerings, by size and offering method*
Offering size
≤ $1 $1‐5 $5‐50 >$50
million million million million
All Issuers, 2009‐2017
Rule 504 5,112 72 ‐‐ ‐‐
Rule 505 678 1,113 ‐‐ ‐‐
Rule 506 50,207 49,003 45,043 20,579
Non‐Fund Issuers, 2009‐2017
Rule 504 5,112 72 ‐‐ ‐‐
Rule 505 650 1,029 ‐‐ ‐‐
Rule 506 44,036 42,965 31,539 4,689
Non‐Fund Issuers, September 23, 2013 – December 2017
Rule 504 2,060 72 ‐‐ ‐‐
Rule 505 308 428 ‐‐ ‐‐
Rule 506(b) 21,683 21,587 15,623 2,256
Rule 506(c) 1,790 1,808 1,501 289
*Considers only new offerings and excludes offerings with amount sold reported as $0 or missing on Form D.
Since the amendments to Rule 504 became effective in January 2017, there have been 72 new
offerings that claimed Rule 504 exemption and offered/raised more than $1 million during the
year. The number of new Rule 504 offerings increased by 21% in 2017, relative to a 2.6%
increase in new Rule 506 offerings under $5 million initiated by non‐fund issuers. It will be
interesting to see if the amended Rule 504 market will attract a greater number of smaller
offerings, compared to previous years and also how the amended Rule 504 market compares
with that of Rule 506 which has so far attracted a substantial proportion of all small offerings.
20
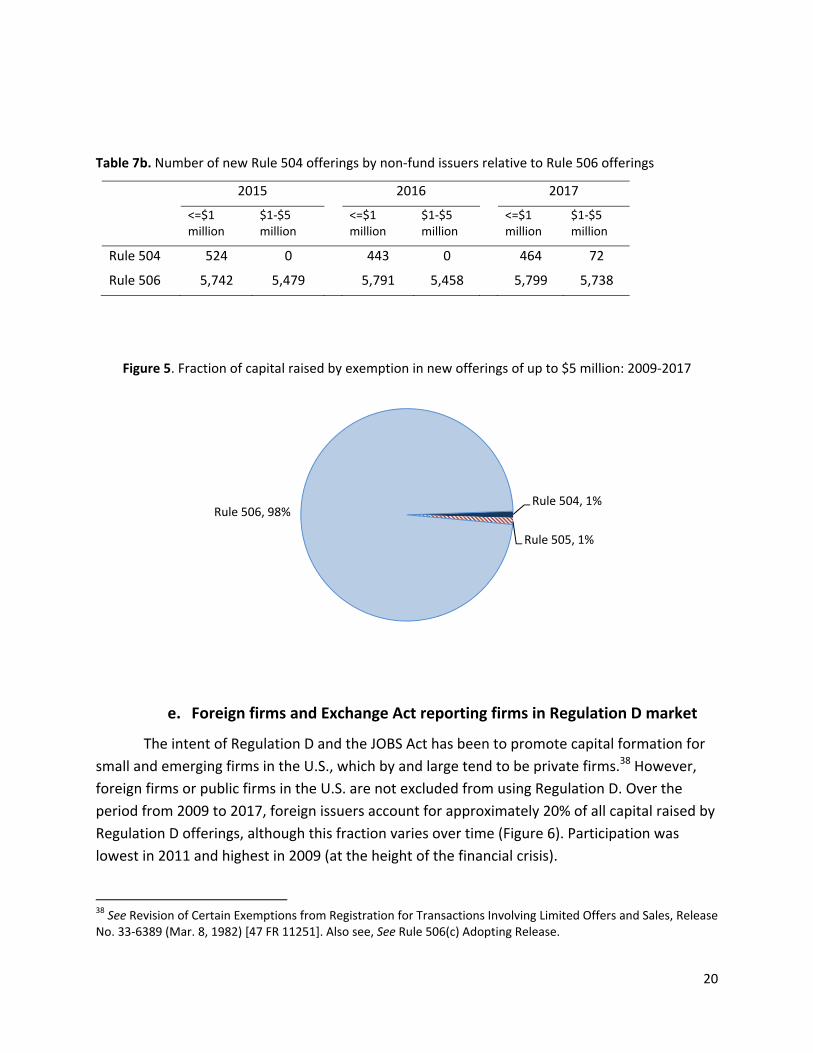
Table 7b. Number of new Rule 504 offerings by non‐fund issuers relative to Rule 506 offerings
2015 2016 2017
<=$1 million
$1‐$5 million
<=$1 million
$1‐$5 million
<=$1 million
$1‐$5 million
Rule 504 524 0 443 0 464 72
Rule 506 5,742 5,479 5,791 5,458 5,799 5,738
Figure 5. Fraction of capital raised by exemption in new offerings of up to $5 million: 2009‐2017
e. Foreign firms and Exchange Act reporting firms in Regulation D market
The intent of Regulation D and the JOBS Act has been to promote capital formation for
small and emerging firms in the U.S., which by and large tend to be private firms.38 However,
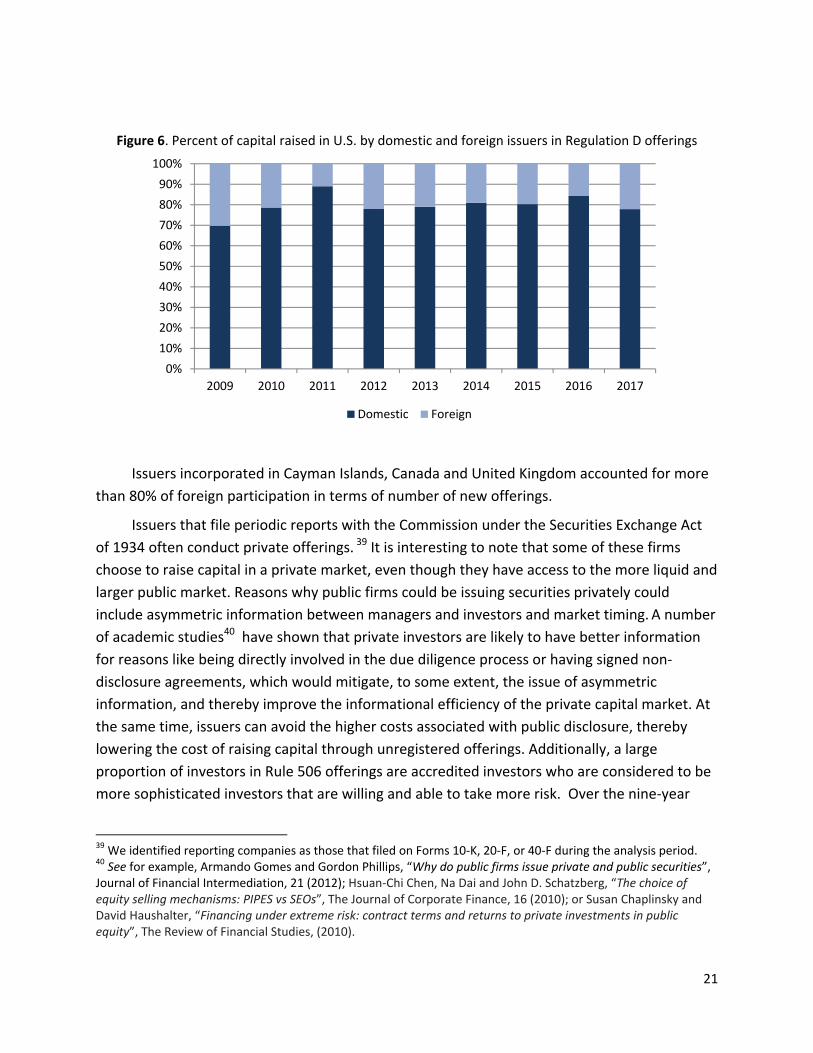
foreign firms or public firms in the U.S. are not excluded from using Regulation D. Over the
period from 2009 to 2017, foreign issuers account for approximately 20% of all capital raised by
Regulation D offerings, although this fraction varies over time (Figure 6). Participation was
lowest in 2011 and highest in 2009 (at the height of the financial crisis).
38 See Revision of Certain Exemptions from Registration for Transactions Involving Limited Offers and Sales, Release No. 33‐6389 (Mar. 8, 1982) [47 FR 11251]. Also see, See Rule 506(c) Adopting Release.
Rule 504, 1%
Rule 505, 1%
Rule 506, 98%
21
Figure 6. Percent of capital raised in U.S. by domestic and foreign issuers in Regulation D offerings
Issuers incorporated in Cayman Islands, Canada and United Kingdom accounted for more
than 80% of foreign participation in terms of number of new offerings.
Issuers that file periodic reports with the Commission under the Securities Exchange Act
of 1934 often conduct private offerings. 39 It is interesting to note that some of these firms
choose to raise capital in a private market, even though they have access to the more liquid and
larger public market. Reasons why public firms could be issuing securities privately could
include asymmetric information between managers and investors and market timing. A number
of academic studies40 have shown that private investors are likely to have better information
for reasons like being directly involved in the due diligence process or having signed non‐
disclosure agreements, which would mitigate, to some extent, the issue of asymmetric
information, and thereby improve the informational efficiency of the private capital market. At
the same time, issuers can avoid the higher costs associated with public disclosure, thereby
lowering the cost of raising capital through unregistered offerings. Additionally, a large
proportion of investors in Rule 506 offerings are accredited investors who are considered to be
more sophisticated investors that are willing and able to take more risk. Over the nine‐year
39 We identified reporting companies as those that filed on Forms 10‐K, 20‐F, or 40‐F during the analysis period. 40 See for example, Armando Gomes and Gordon Phillips, “Why do public firms issue private and public securities”, Journal of Financial Intermediation, 21 (2012); Hsuan‐Chi Chen, Na Dai and John D. Schatzberg, “The choice of equity selling mechanisms: PIPES vs SEOs”, The Journal of Corporate Finance, 16 (2010); or Susan Chaplinsky and David Haushalter, “Financing under extreme risk: contract terms and returns to private investments in public equity”, The Review of Financial Studies, (2010).
0%
10%
20%
30%
40%
50%
60%
70%
80%
90%
100%
2009 2010 2011 2012 2013 2014 2015 2016 2017
Domestic Foreign
22
analysis period, 8% of Regulation D non‐fund offerings were conducted by Exchange Act
reporting companies. In addition, about 4% of non‐fund offerings were by issuers that
subsequently registered an offering with the Commission by filing a Form S‐1. For these issuers,
a Regulation D offering was a precursor to going public.
IV. Regulation D market participants
a. Issuers of securities under Regulation D
i. Capital formation and offering activity by issuer type
The largest issuers in the Regulation D capital market, by amount sold, are pooled
investment funds that are classified in Form D filings as hedge funds, venture capital funds,
private equity funds, and other pooled investment funds. The predominant entities among
other pooled investment funds are registered investment companies and commodity pools.41
Since the inception of the electronic Form D filings in 2009, pooled investment funds have
accounted for $8.9 trillion of new capital raised through Regulation D offerings and reported on
Form D, compared to $1.42 trillion raised by non‐funds. Hedge funds are the largest private
fund issuer, and raised almost $3.1 trillion of new capital, of which $382 billion was raised in
2017. In terms of amounts raised by fund, private equity funds raised the largest median
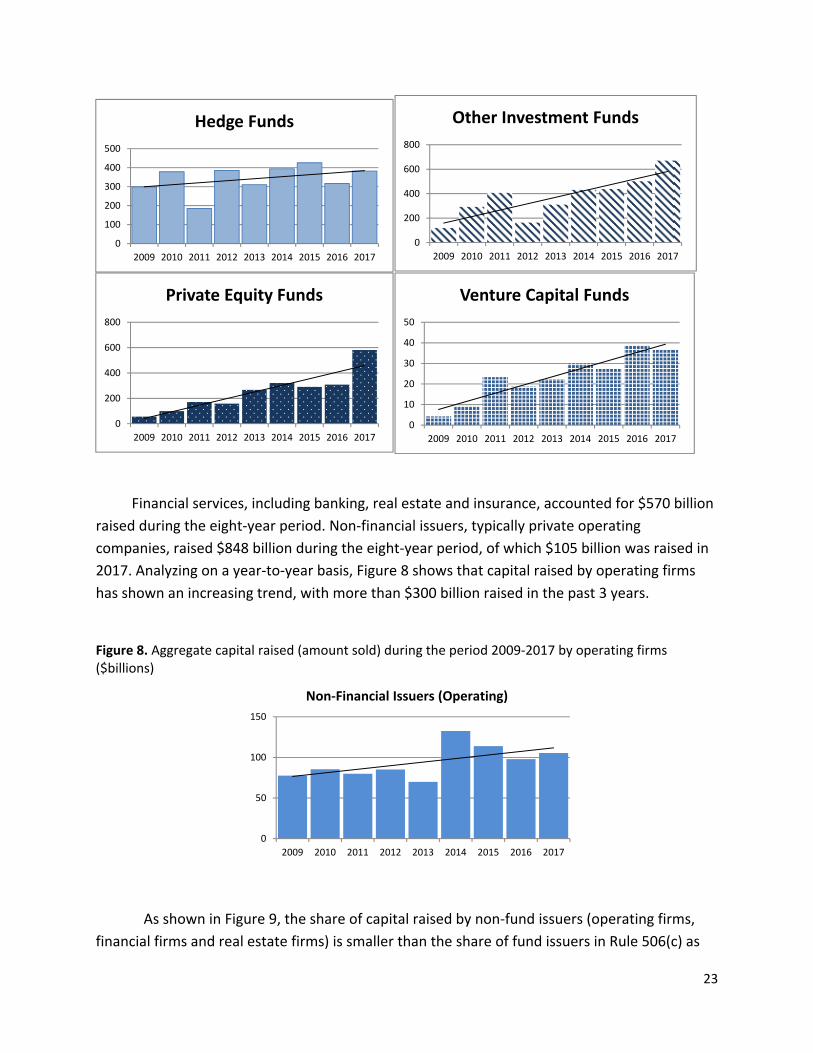
amount. A break‐up of capital raised by type of private fund over the past eight years shows an
increasing trend for all types of funds (Figure 7).
Figure 7. Aggregate capital raised (amount sold) during the period 2009‐2017 by fund‐issuer type ($billion)
41 Registered investment companies are entities such as mutual funds that issue securities to investors, hold pools of securities and other assets and are registered with the Commission under the Investment Company Act. Commodity pools are investment trusts, syndicates, or similar enterprises that are operated for the purpose of trading commodity futures.
23
Financial services, including banking, real estate and insurance, accounted for $570 billion
raised during the eight‐year period. Non‐financial issuers, typically private operating
companies, raised $848 billion during the eight‐year period, of which $105 billion was raised in
2017. Analyzing on a year‐to‐year basis, Figure 8 shows that capital raised by operating firms
has shown an increasing trend, with more than $300 billion raised in the past 3 years.
Figure 8. Aggregate capital raised (amount sold) during the period 2009‐2017 by operating firms ($billions)
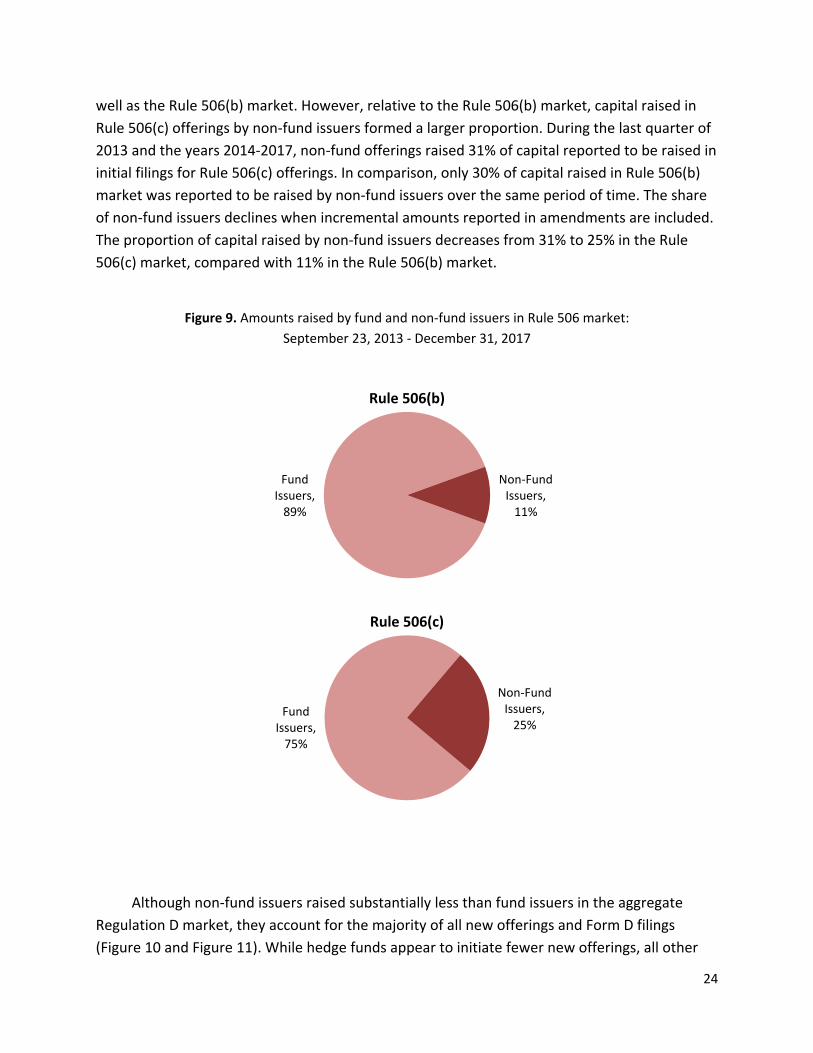
As shown in Figure 9, the share of capital raised by non‐fund issuers (operating firms,
financial firms and real estate firms) is smaller than the share of fund issuers in Rule 506(c) as
0
100
200
300
400
500
2009 2010 2011 2012 2013 2014 2015 2016 2017
Hedge Funds
0
200
400
600
800
2009 2010 2011 2012 2013 2014 2015 2016 2017
Other Investment Funds
0
200
400
600
800
2009 2010 2011 2012 2013 2014 2015 2016 2017
Private Equity Funds
0
10
20
30
40
50
2009 2010 2011 2012 2013 2014 2015 2016 2017
Venture Capital Funds
0
50
100
150
2009 2010 2011 2012 2013 2014 2015 2016 2017
Non‐Financial Issuers (Operating)
24
well as the Rule 506(b) market. However, relative to the Rule 506(b) market, capital raised in
Rule 506(c) offerings by non‐fund issuers formed a larger proportion. During the last quarter of
2013 and the years 2014‐2017, non‐fund offerings raised 31% of capital reported to be raised in
initial filings for Rule 506(c) offerings. In comparison, only 30% of capital raised in Rule 506(b)
market was reported to be raised by non‐fund issuers over the same period of time. The share
of non‐fund issuers declines when incremental amounts reported in amendments are included.
The proportion of capital raised by non‐fund issuers decreases from 31% to 25% in the Rule
506(c) market, compared with 11% in the Rule 506(b) market.
Figure 9. Amounts raised by fund and non‐fund issuers in Rule 506 market:
September 23, 2013 ‐ December 31, 2017
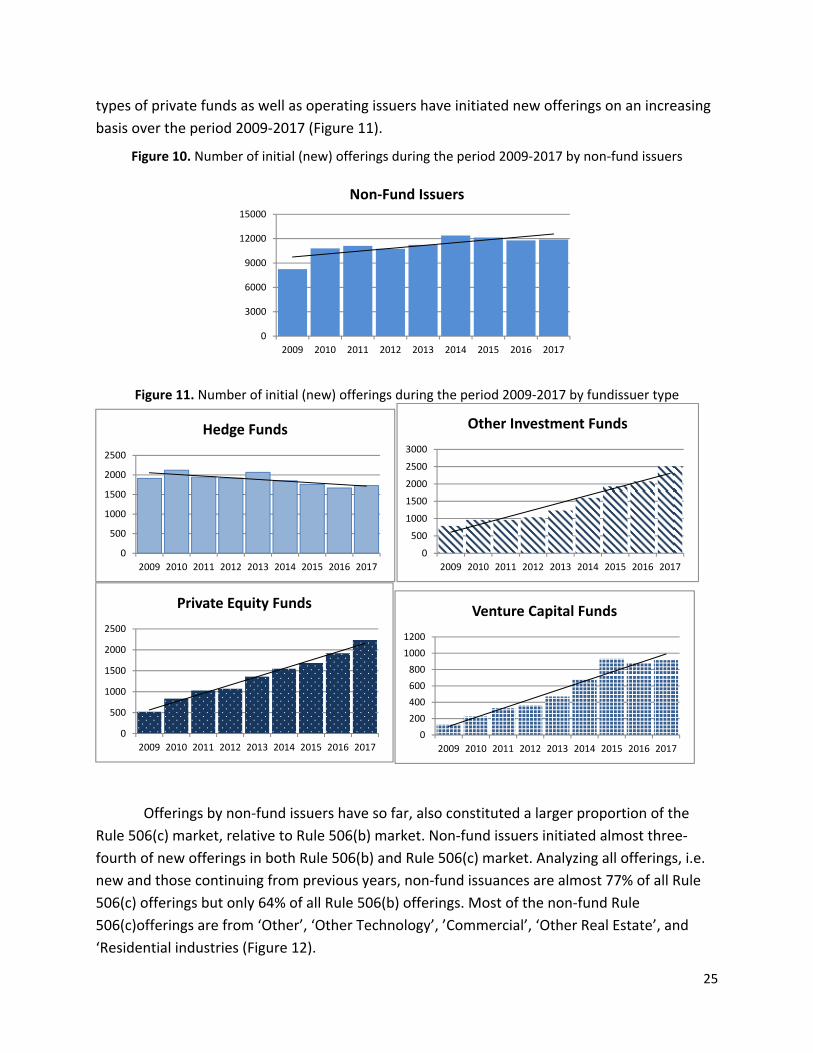
Although non‐fund issuers raised substantially less than fund issuers in the aggregate
Regulation D market, they account for the majority of all new offerings and Form D filings
(Figure 10 and Figure 11). While hedge funds appear to initiate fewer new offerings, all other
Fund Issuers, 89%
Non‐Fund Issuers, 11%
Rule 506(b)
Fund Issuers, 75%
Non‐Fund Issuers, 25%
Rule 506(c)
25
types of private funds as well as operating issuers have initiated new offerings on an increasing
basis over the period 2009‐2017 (Figure 11).
Figure 10. Number of initial (new) offerings during the period 2009‐2017 by non‐fund issuers
Figure 11. Number of initial (new) offerings during the period 2009‐2017 by fundissuer type
Offerings by non‐fund issuers have so far, also constituted a larger proportion of the
Rule 506(c) market, relative to Rule 506(b) market. Non‐fund issuers initiated almost three‐
fourth of new offerings in both Rule 506(b) and Rule 506(c) market. Analyzing all offerings, i.e.
new and those continuing from previous years, non‐fund issuances are almost 77% of all Rule
506(c) offerings but only 64% of all Rule 506(b) offerings. Most of the non‐fund Rule
506(c)offerings are from ‘Other’, ‘Other Technology’, ’Commercial’, ‘Other Real Estate’, and
‘Residential industries (Figure 12).
0
3000
6000
9000
12000
15000
2009 2010 2011 2012 2013 2014 2015 2016 2017
Non‐Fund Issuers
0
500
1000
1500
2000
2500
2009 2010 2011 2012 2013 2014 2015 2016 2017
Hedge Funds
0
500
1000
1500
2000
2500
3000
2009 2010 2011 2012 2013 2014 2015 2016 2017
Other Investment Funds
0
500
1000
1500
2000
2500
2009 2010 2011 2012 2013 2014 2015 2016 2017
Private Equity Funds
0
200
400
600
800
1000
1200
2009 2010 2011 2012 2013 2014 2015 2016 2017
Venture Capital Funds
26
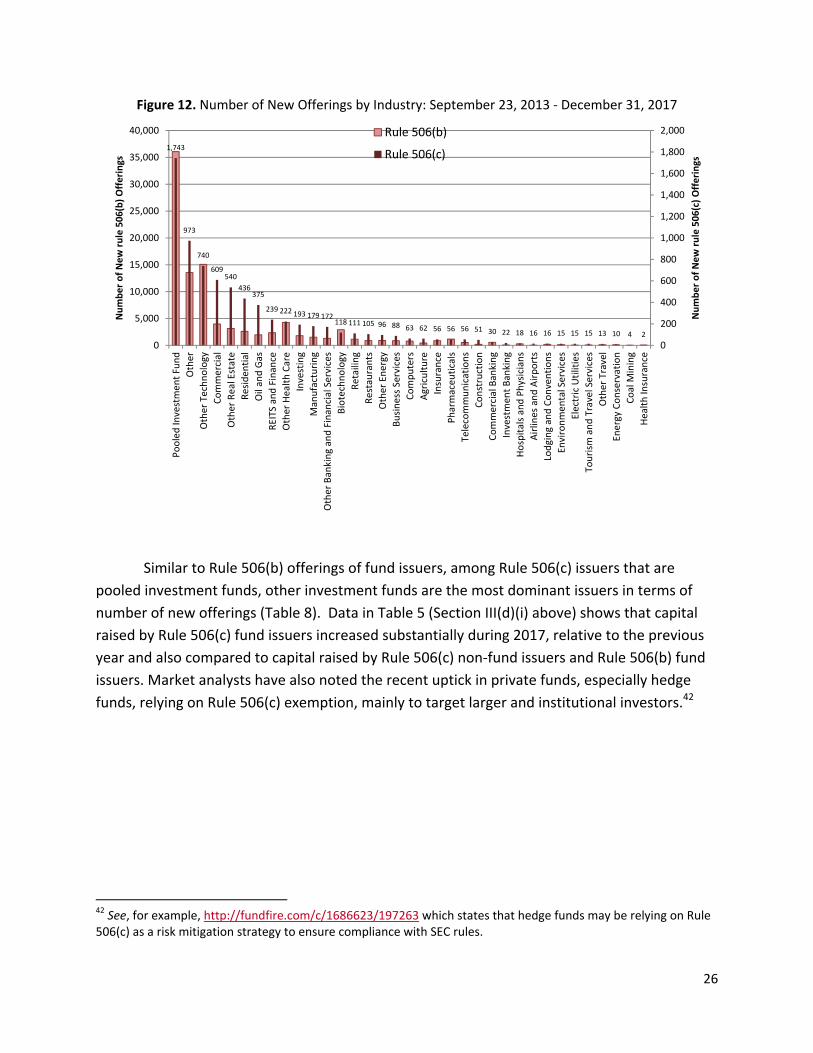
Figure 12. Number of New Offerings by Industry: September 23, 2013 ‐ December 31, 2017
Similar to Rule 506(b) offerings of fund issuers, among Rule 506(c) issuers that are
pooled investment funds, other investment funds are the most dominant issuers in terms of
number of new offerings (Table 8). Data in Table 5 (Section III(d)(i) above) shows that capital
raised by Rule 506(c) fund issuers increased substantially during 2017, relative to the previous
year and also compared to capital raised by Rule 506(c) non‐fund issuers and Rule 506(b) fund
issuers. Market analysts have also noted the recent uptick in private funds, especially hedge
funds, relying on Rule 506(c) exemption, mainly to target larger and institutional investors.42
42 See, for example, http://fundfire.com/c/1686623/197263 which states that hedge funds may be relying on Rule 506(c) as a risk mitigation strategy to ensure compliance with SEC rules.
1,743
973
740
609540
436375
239 222 193 179 172118 111 105 96 88 63 62 56 56 56 51 30 22 18 16 16 15 15 15 13 10 4 2
0
200
400
600
800
1,000
1,200
1,400
1,600
1,800
2,000
0
5,000
10,000
15,000
20,000
25,000
30,000
35,000
40,000
Pooled Investment Fund
Other
Other Technology
Commercial
Other Real Estate
Residen
tial
Oil and Gas
REITS and Finance
Other Health Care
Investing
Manufacturing
Other Banking and Financial Services
Biotechnology
Retailing
Restaurants
Other Energy
Business Services
Computers
Agriculture
Insurance
Pharmaceu
ticals
Telecommunications
Construction
Commercial Banking
Investmen
t Banking
Hospitals and Physicians
Airlines and Airports
Lodging and Conventions
Environmental Services
Electric Utilities
Tourism
and Travel Services
Other Travel
Energy Conservation
Coal M
ining
Health Insurance
Number of New rule 506(c) Offerings
Number of New rule 506(b) Offerings
Rule 506(b)
Rule 506(c)
27
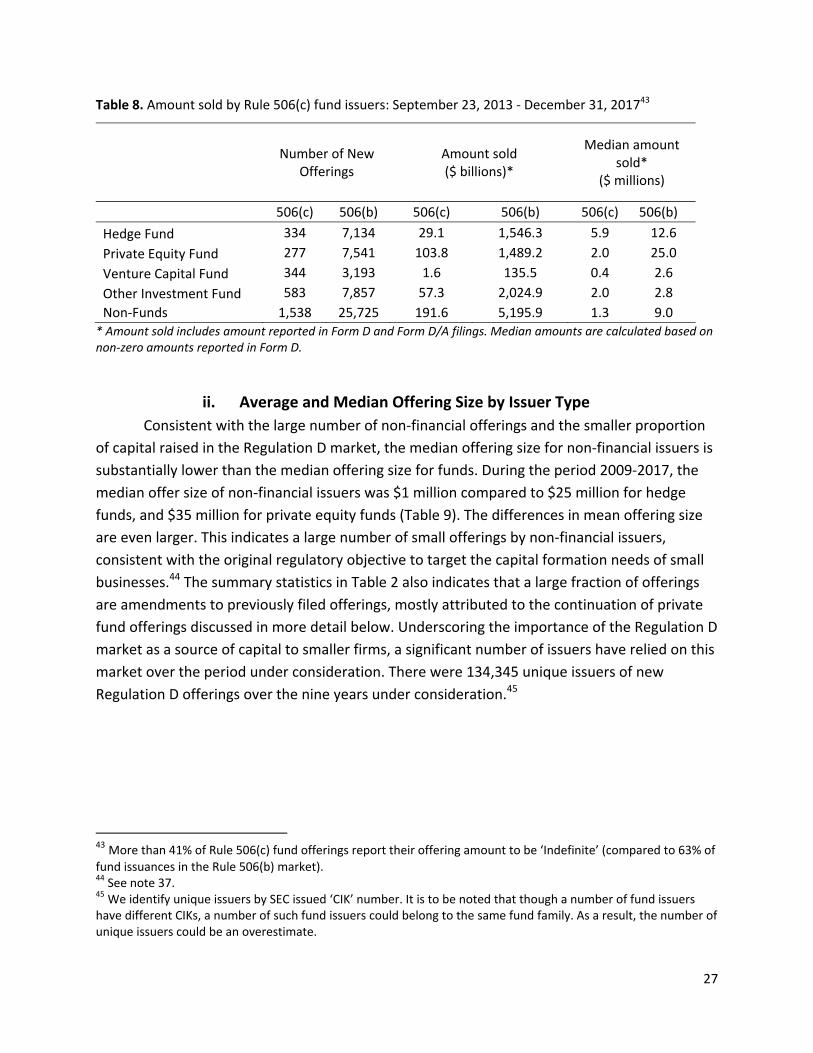
Table 8. Amount sold by Rule 506(c) fund issuers: September 23, 2013 ‐ December 31, 201743
Number of New Offerings
Amount sold ($ billions)*
Median amount sold*
($ millions)
506(c) 506(b) 506(c) 506(b) 506(c) 506(b)
Hedge Fund 334 7,134 29.1 1,546.3 5.9 12.6
Private Equity Fund 277 7,541 103.8 1,489.2 2.0 25.0
Venture Capital Fund 344 3,193 1.6 135.5 0.4 2.6
Other Investment Fund 583 7,857 57.3 2,024.9 2.0 2.8
Non‐Funds 1,538 25,725 191.6 5,195.9 1.3 9.0
* Amount sold includes amount reported in Form D and Form D/A filings. Median amounts are calculated based on non‐zero amounts reported in Form D.
ii. Average and Median Offering Size by Issuer Type
Consistent with the large number of non‐financial offerings and the smaller proportion
of capital raised in the Regulation D market, the median offering size for non‐financial issuers is
substantially lower than the median offering size for funds. During the period 2009‐2017, the
median offer size of non‐financial issuers was $1 million compared to $25 million for hedge
funds, and $35 million for private equity funds (Table 9). The differences in mean offering size
are even larger. This indicates a large number of small offerings by non‐financial issuers,
consistent with the original regulatory objective to target the capital formation needs of small
businesses.44 The summary statistics in Table 2 also indicates that a large fraction of offerings
are amendments to previously filed offerings, mostly attributed to the continuation of private
fund offerings discussed in more detail below. Underscoring the importance of the Regulation D
market as a source of capital to smaller firms, a significant number of issuers have relied on this
market over the period under consideration. There were 134,345 unique issuers of new
Regulation D offerings over the nine years under consideration.45
43 More than 41% of Rule 506(c) fund offerings report their offering amount to be ‘Indefinite’ (compared to 63% of fund issuances in the Rule 506(b) market). 44 See note 37. 45 We identify unique issuers by SEC issued ‘CIK’ number. It is to be noted that though a number of fund issuers have different CIKs, a number of such fund issuers could belong to the same fund family. As a result, the number of unique issuers could be an overestimate.
28
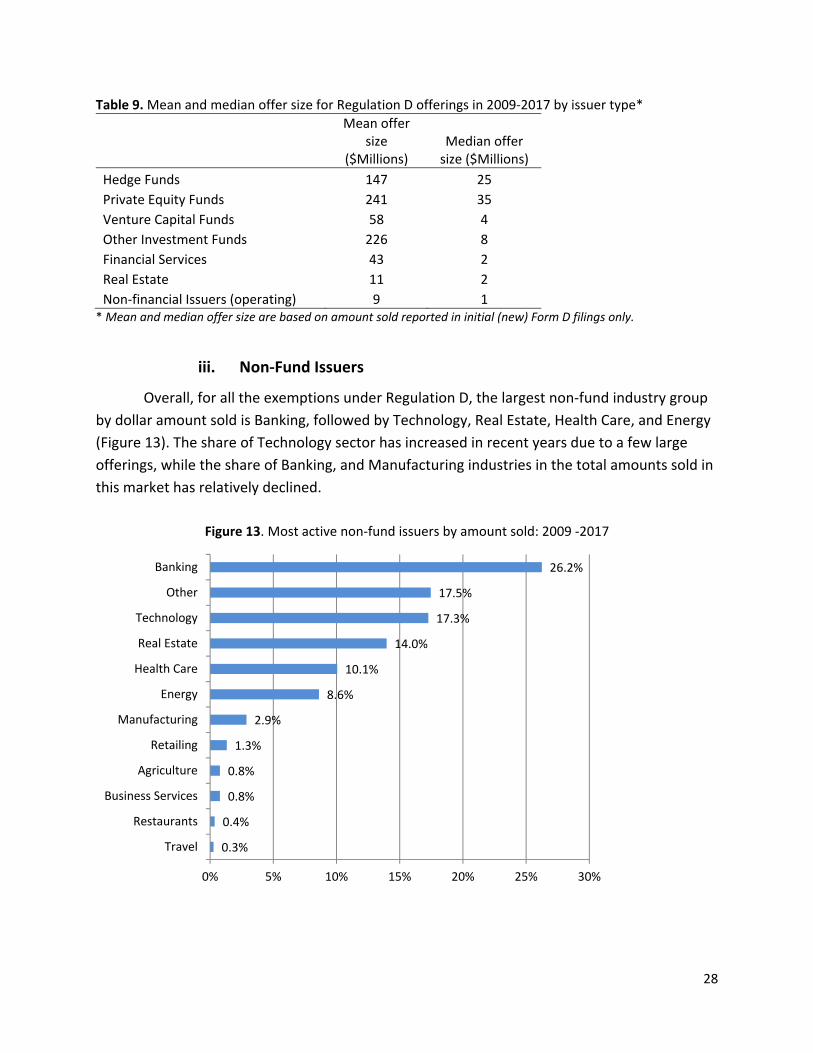
Table 9. Mean and median offer size for Regulation D offerings in 2009‐2017 by issuer type*
Mean offer size
($Millions) Median offer size ($Millions)
Hedge Funds 147 25
Private Equity Funds 241 35
Venture Capital Funds 58 4
Other Investment Funds 226 8
Financial Services 43 2
Real Estate 11 2
Non‐financial Issuers (operating) 9 1 * Mean and median offer size are based on amount sold reported in initial (new) Form D filings only.
iii. Non‐Fund Issuers
Overall, for all the exemptions under Regulation D, the largest non‐fund industry group
by dollar amount sold is Banking, followed by Technology, Real Estate, Health Care, and Energy
(Figure 13). The share of Technology sector has increased in recent years due to a few large
offerings, while the share of Banking, and Manufacturing industries in the total amounts sold in
this market has relatively declined.
Figure 13. Most active non‐fund issuers by amount sold: 2009 ‐2017
0.3%
0.4%
0.8%
0.8%
1.3%
2.9%
8.6%
10.1%
14.0%
17.3%
17.5%
26.2%
0% 5% 10% 15% 20% 25% 30%
Travel
Restaurants
Business Services
Agriculture
Retailing
Manufacturing
Energy
Health Care
Real Estate
Technology
Other
Banking
29
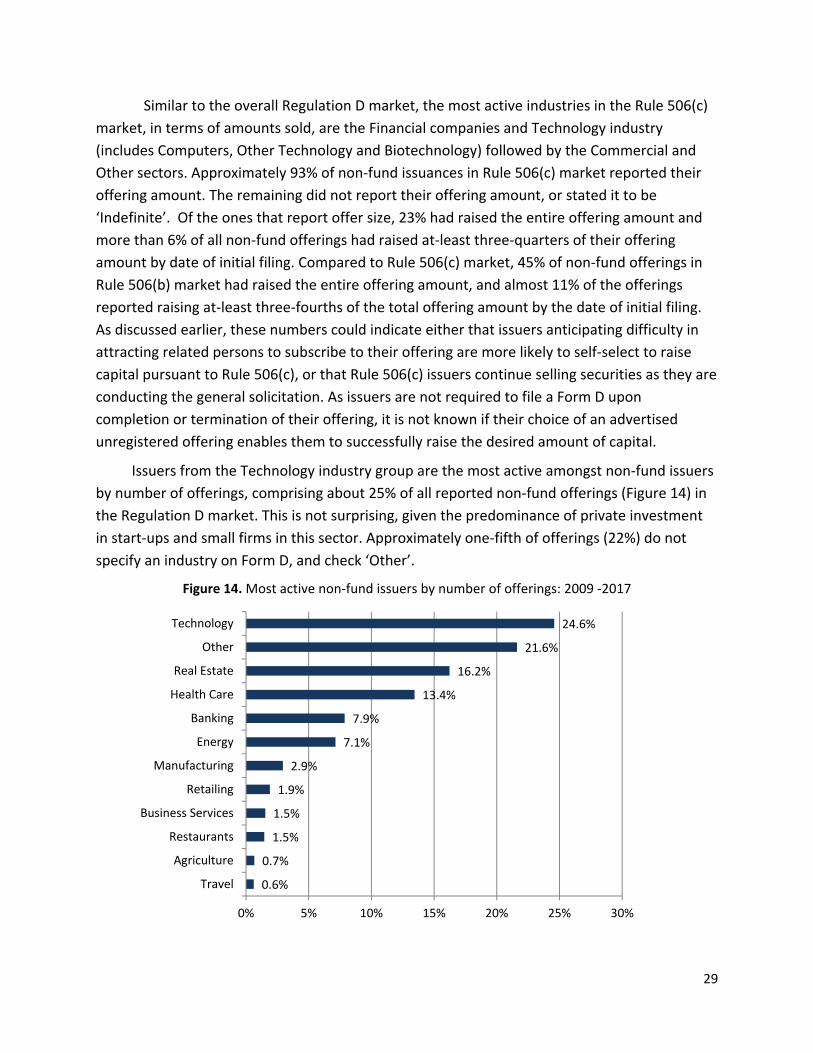
Similar to the overall Regulation D market, the most active industries in the Rule 506(c)
market, in terms of amounts sold, are the Financial companies and Technology industry
(includes Computers, Other Technology and Biotechnology) followed by the Commercial and
Other sectors. Approximately 93% of non‐fund issuances in Rule 506(c) market reported their
offering amount. The remaining did not report their offering amount, or stated it to be
‘Indefinite’. Of the ones that report offer size, 23% had raised the entire offering amount and
more than 6% of all non‐fund offerings had raised at‐least three‐quarters of their offering
amount by date of initial filing. Compared to Rule 506(c) market, 45% of non‐fund offerings in
Rule 506(b) market had raised the entire offering amount, and almost 11% of the offerings
reported raising at‐least three‐fourths of the total offering amount by the date of initial filing.
As discussed earlier, these numbers could indicate either that issuers anticipating difficulty in
attracting related persons to subscribe to their offering are more likely to self‐select to raise
capital pursuant to Rule 506(c), or that Rule 506(c) issuers continue selling securities as they are
conducting the general solicitation. As issuers are not required to file a Form D upon
completion or termination of their offering, it is not known if their choice of an advertised
unregistered offering enables them to successfully raise the desired amount of capital.
Issuers from the Technology industry group are the most active amongst non‐fund issuers
by number of offerings, comprising about 25% of all reported non‐fund offerings (Figure 14) in
the Regulation D market. This is not surprising, given the predominance of private investment
in start‐ups and small firms in this sector. Approximately one‐fifth of offerings (22%) do not
specify an industry on Form D, and check ‘Other’.
Figure 14. Most active non‐fund issuers by number of offerings: 2009 ‐2017
0.6%
0.7%
1.5%
1.5%
1.9%
2.9%
7.1%
7.9%
13.4%
16.2%
21.6%
24.6%
0% 5% 10% 15% 20% 25% 30%
Travel
Agriculture
Restaurants
Business Services
Retailing
Manufacturing
Energy
Banking
Health Care
Real Estate
Other
Technology
30
iv. Issuer Size, Age and Location
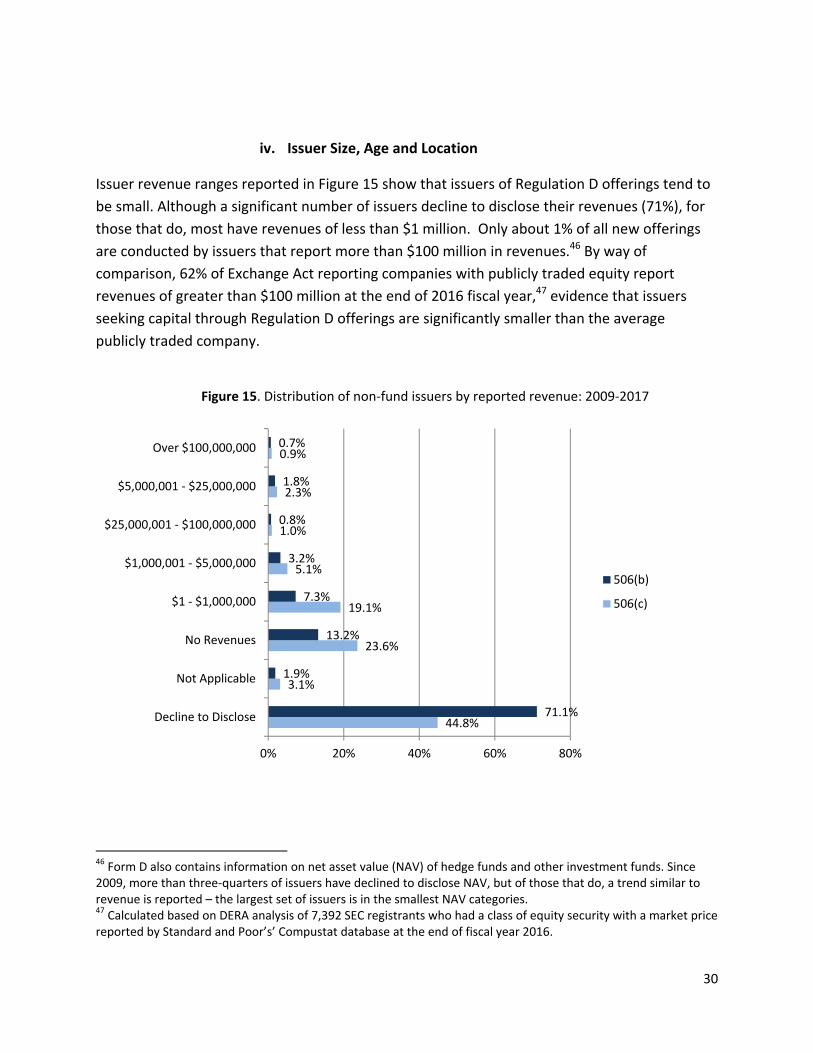
Issuer revenue ranges reported in Figure 15 show that issuers of Regulation D offerings tend to
be small. Although a significant number of issuers decline to disclose their revenues (71%), for
those that do, most have revenues of less than $1 million. Only about 1% of all new offerings
are conducted by issuers that report more than $100 million in revenues.46 By way of
comparison, 62% of Exchange Act reporting companies with publicly traded equity report
revenues of greater than $100 million at the end of 2016 fiscal year,47 evidence that issuers
seeking capital through Regulation D offerings are significantly smaller than the average
publicly traded company.
Figure 15. Distribution of non‐fund issuers by reported revenue: 2009‐2017
46 Form D also contains information on net asset value (NAV) of hedge funds and other investment funds. Since 2009, more than three‐quarters of issuers have declined to disclose NAV, but of those that do, a trend similar to revenue is reported – the largest set of issuers is in the smallest NAV categories. 47 Calculated based on DERA analysis of 7,392 SEC registrants who had a class of equity security with a market price reported by Standard and Poor’s’ Compustat database at the end of fiscal year 2016.
44.8%
3.1%
23.6%
19.1%
5.1%
1.0%
2.3%
0.9%
71.1%
1.9%
13.2%
7.3%
3.2%
0.8%
1.8%
0.7%
0% 20% 40% 60% 80%
Decline to Disclose
Not Applicable
No Revenues
$1 ‐ $1,000,000
$1,000,001 ‐ $5,000,000
$25,000,001 ‐ $100,000,000
$5,000,001 ‐ $25,000,000
Over $100,000,000
506(b)
506(c)
31
A much smaller proportion of Rule 506(c) non‐fund issuers (45%) declined to disclose their
size. Of those that did report their size, almost 80% (Figure 15) were either start‐up firms (no
revenues) or small, early‐stage firms ($1‐$1million revenue range). The predominance of small
issuers indicates that Regulation D, and especially Rule 506(c) capital markets, are active
avenues for small business capital formation. Most fund issuers decline to disclose their size
when they raise capital in the Rule 506 market. This includes issuers of 68% of all new fund
offerings in Rule 506(c) market and almost 91% of new offerings by funds in Rule 506(b) market
during the period September 23, 2013 ‐ December 31, 2016.
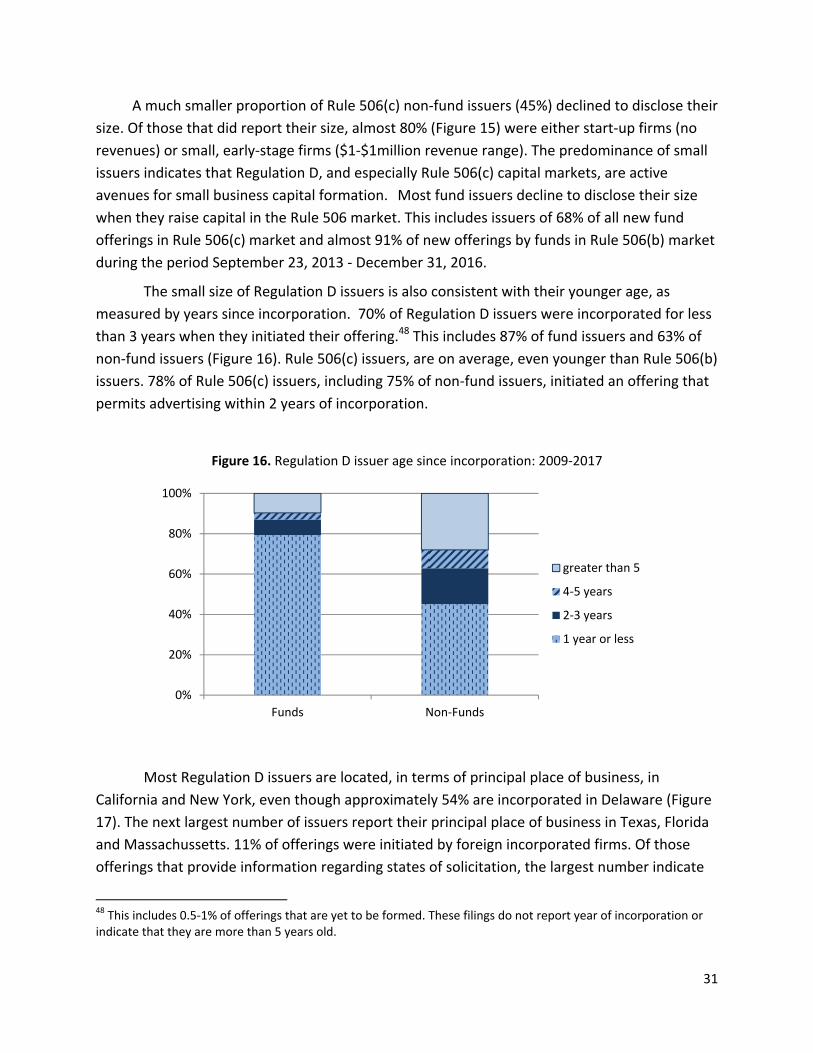
The small size of Regulation D issuers is also consistent with their younger age, as
measured by years since incorporation. 70% of Regulation D issuers were incorporated for less
than 3 years when they initiated their offering.48 This includes 87% of fund issuers and 63% of
non‐fund issuers (Figure 16). Rule 506(c) issuers, are on average, even younger than Rule 506(b)
issuers. 78% of Rule 506(c) issuers, including 75% of non‐fund issuers, initiated an offering that
permits advertising within 2 years of incorporation.
Figure 16. Regulation D issuer age since incorporation: 2009‐2017
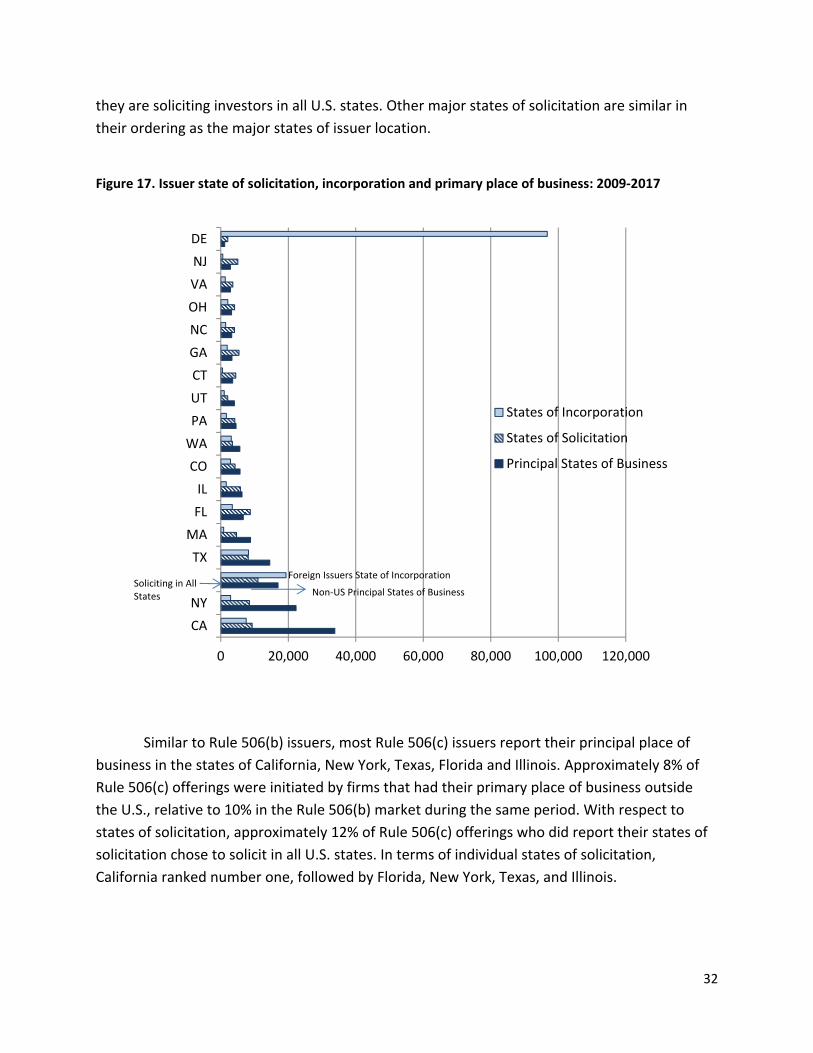
Most Regulation D issuers are located, in terms of principal place of business, in
California and New York, even though approximately 54% are incorporated in Delaware (Figure
17). The next largest number of issuers report their principal place of business in Texas, Florida
and Massachussetts. 11% of offerings were initiated by foreign incorporated firms. Of those
offerings that provide information regarding states of solicitation, the largest number indicate
48 This includes 0.5‐1% of offerings that are yet to be formed. These filings do not report year of incorporation or indicate that they are more than 5 years old.
0%
20%
40%
60%
80%
100%
Funds Non‐Funds
greater than 5
4‐5 years
2‐3 years
1 year or less
32
they are soliciting investors in all U.S. states. Other major states of solicitation are similar in
their ordering as the major states of issuer location.
Figure 17. Issuer state of solicitation, incorporation and primary place of business: 2009‐2017
Similar to Rule 506(b) issuers, most Rule 506(c) issuers report their principal place of
business in the states of California, New York, Texas, Florida and Illinois. Approximately 8% of
Rule 506(c) offerings were initiated by firms that had their primary place of business outside
the U.S., relative to 10% in the Rule 506(b) market during the same period. With respect to
states of solicitation, approximately 12% of Rule 506(c) offerings who did report their states of
solicitation chose to solicit in all U.S. states. In terms of individual states of solicitation,
California ranked number one, followed by Florida, New York, Texas, and Illinois.
0 20,000 40,000 60,000 80,000 100,000 120,000
CA
NY
TX
MA
FL
IL
CO
WA
PA
UT
CT
GA
NC
OH
VA
NJ
DE
States of Incorporation
States of Solicitation
Principal States of Business
Soliciting in All States
Foreign Issuers State of Incorporation
Non‐US Principal States of Business
33
v. Issuer offering activity in Regulation D market
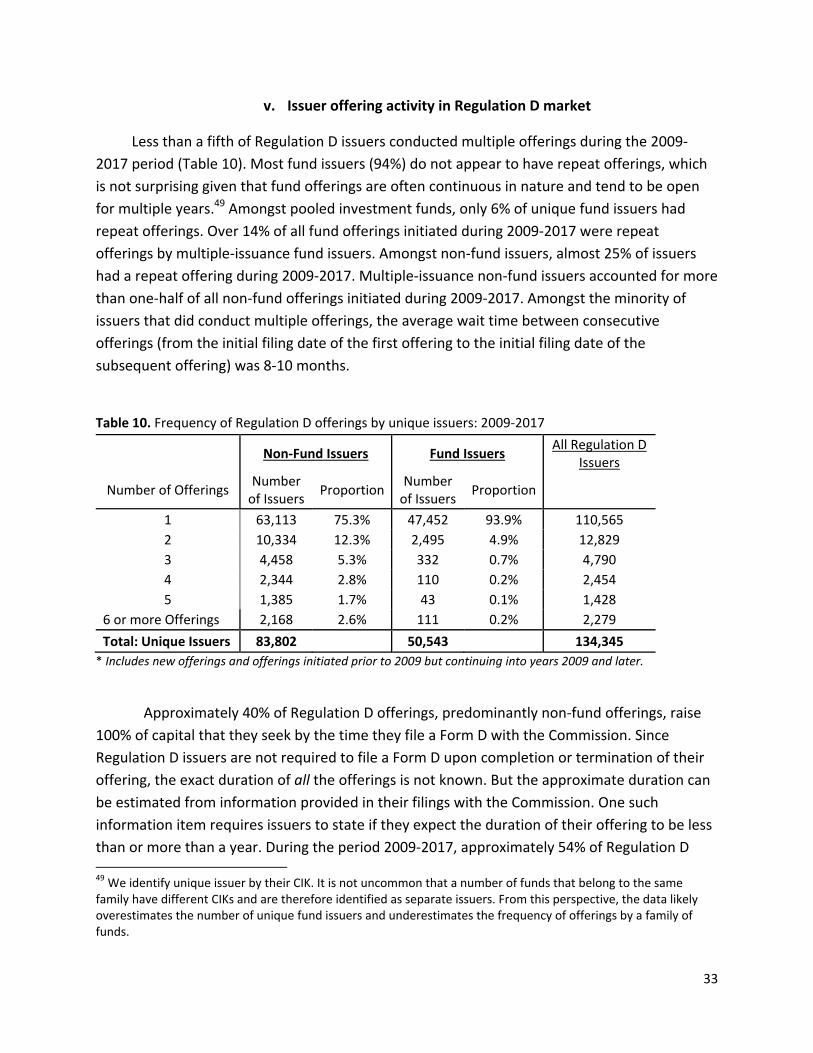
Less than a fifth of Regulation D issuers conducted multiple offerings during the 2009‐
2017 period (Table 10). Most fund issuers (94%) do not appear to have repeat offerings, which
is not surprising given that fund offerings are often continuous in nature and tend to be open
for multiple years.49 Amongst pooled investment funds, only 6% of unique fund issuers had
repeat offerings. Over 14% of all fund offerings initiated during 2009‐2017 were repeat
offerings by multiple‐issuance fund issuers. Amongst non‐fund issuers, almost 25% of issuers
had a repeat offering during 2009‐2017. Multiple‐issuance non‐fund issuers accounted for more
than one‐half of all non‐fund offerings initiated during 2009‐2017. Amongst the minority of
issuers that did conduct multiple offerings, the average wait time between consecutive
offerings (from the initial filing date of the first offering to the initial filing date of the
subsequent offering) was 8‐10 months.
Table 10. Frequency of Regulation D offerings by unique issuers: 2009‐2017
Non‐Fund Issuers Fund Issuers All Regulation D
Issuers
Number of Offerings Number of Issuers
Proportion Number of Issuers
Proportion
1 63,113 75.3% 47,452 93.9% 110,565
2 10,334 12.3% 2,495 4.9% 12,829
3 4,458 5.3% 332 0.7% 4,790
4 2,344 2.8% 110 0.2% 2,454
5 1,385 1.7% 43 0.1% 1,428
6 or more Offerings 2,168 2.6% 111 0.2% 2,279
Total: Unique Issuers 83,802 50,543 134,345
* Includes new offerings and offerings initiated prior to 2009 but continuing into years 2009 and later.
Approximately 40% of Regulation D offerings, predominantly non‐fund offerings, raise
100% of capital that they seek by the time they file a Form D with the Commission. Since
Regulation D issuers are not required to file a Form D upon completion or termination of their
offering, the exact duration of all the offerings is not known. But the approximate duration can
be estimated from information provided in their filings with the Commission. One such
information item requires issuers to state if they expect the duration of their offering to be less
than or more than a year. During the period 2009‐2017, approximately 54% of Regulation D 49 We identify unique issuer by their CIK. It is not uncommon that a number of funds that belong to the same family have different CIKs and are therefore identified as separate issuers. From this perspective, the data likely overestimates the number of unique fund issuers and underestimates the frequency of offerings by a family of funds.
34
issuers that are funds, 19% of issuers that are financial firms, and 6% of operating firms report
in their Form D filing that their offering is expected to stay open beyond a year.
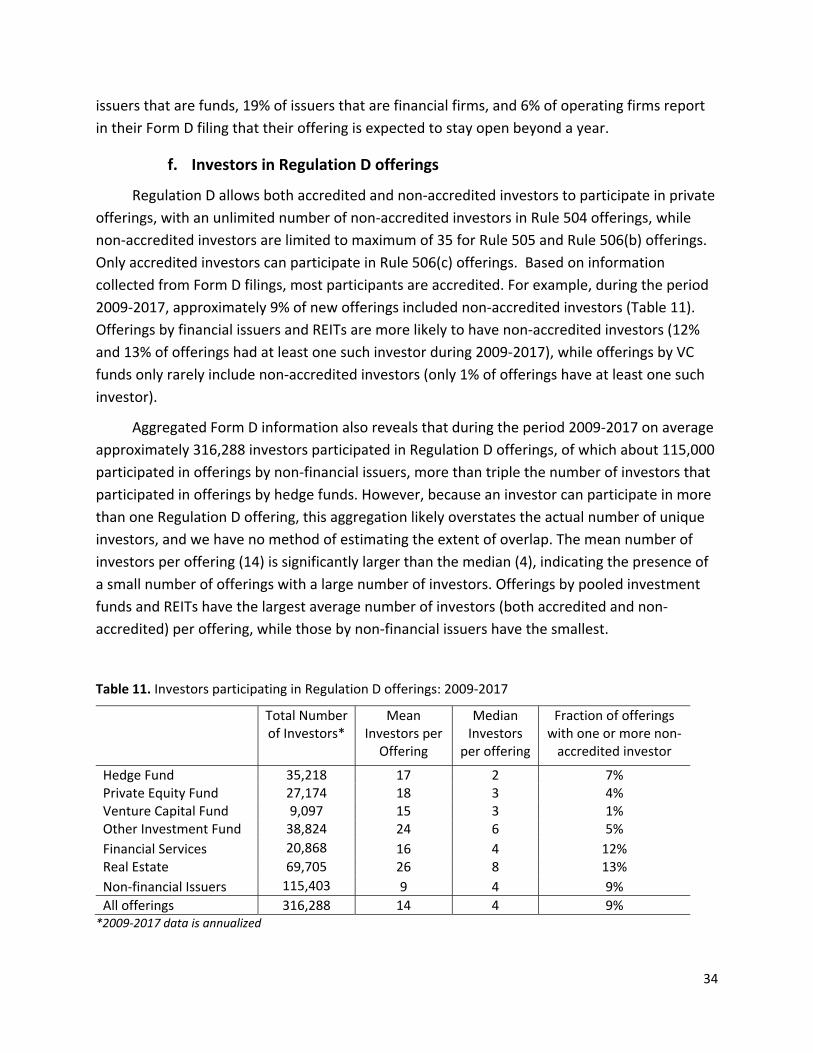
f. Investors in Regulation D offerings
Regulation D allows both accredited and non‐accredited investors to participate in private
offerings, with an unlimited number of non‐accredited investors in Rule 504 offerings, while
non‐accredited investors are limited to maximum of 35 for Rule 505 and Rule 506(b) offerings.
Only accredited investors can participate in Rule 506(c) offerings. Based on information
collected from Form D filings, most participants are accredited. For example, during the period
2009‐2017, approximately 9% of new offerings included non‐accredited investors (Table 11).
Offerings by financial issuers and REITs are more likely to have non‐accredited investors (12%
and 13% of offerings had at least one such investor during 2009‐2017), while offerings by VC
funds only rarely include non‐accredited investors (only 1% of offerings have at least one such
investor).
Aggregated Form D information also reveals that during the period 2009‐2017 on average
approximately 316,288 investors participated in Regulation D offerings, of which about 115,000
participated in offerings by non‐financial issuers, more than triple the number of investors that
participated in offerings by hedge funds. However, because an investor can participate in more
than one Regulation D offering, this aggregation likely overstates the actual number of unique
investors, and we have no method of estimating the extent of overlap. The mean number of
investors per offering (14) is significantly larger than the median (4), indicating the presence of
a small number of offerings with a large number of investors. Offerings by pooled investment
funds and REITs have the largest average number of investors (both accredited and non‐
accredited) per offering, while those by non‐financial issuers have the smallest.
Table 11. Investors participating in Regulation D offerings: 2009‐2017
Total Number of Investors*
Mean Investors per Offering
Median Investors
per offering
Fraction of offerings with one or more non‐accredited investor
Hedge Fund 35,218 17 2 7% Private Equity Fund 27,174 18 3 4% Venture Capital Fund 9,097 15 3 1% Other Investment Fund 38,824 24 6 5%
Financial Services 20,868 16 4 12% Real Estate 69,705 26 8 13%
Non‐financial Issuers 115,403 9 4 9%
All offerings 316,288 14 4 9% *2009‐2017 data is annualized
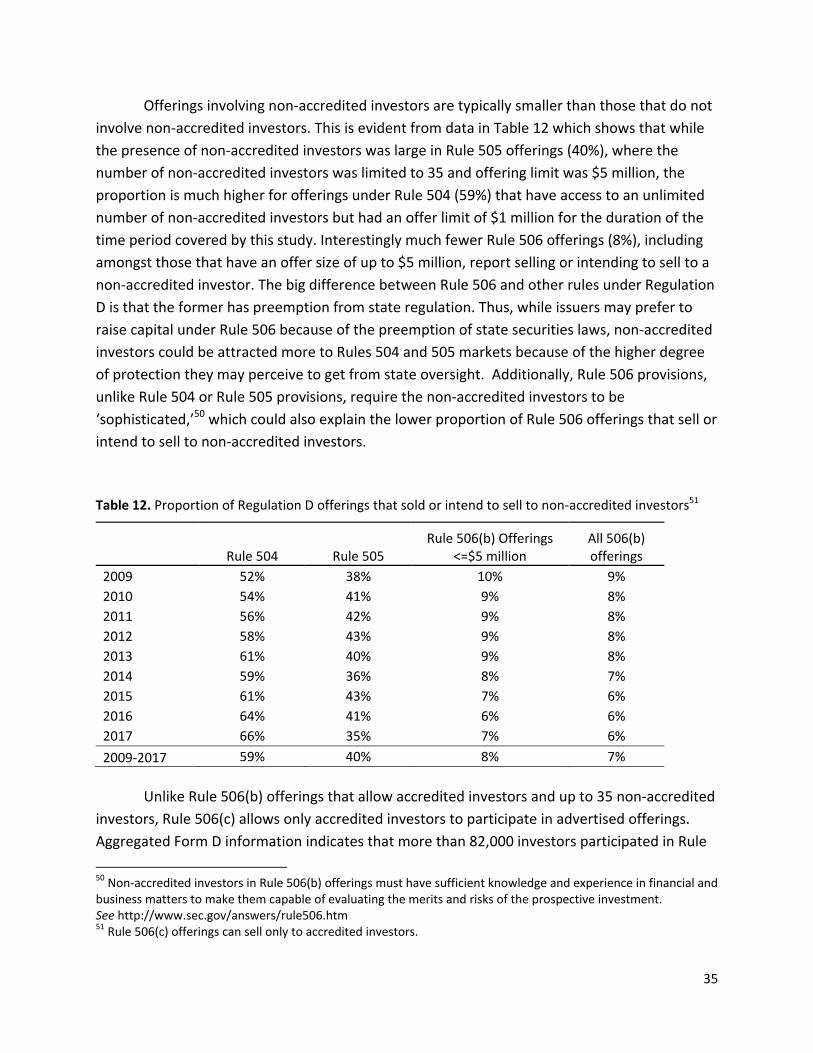
35
Offerings involving non‐accredited investors are typically smaller than those that do not
involve non‐accredited investors. This is evident from data in Table 12 which shows that while
the presence of non‐accredited investors was large in Rule 505 offerings (40%), where the
number of non‐accredited investors was limited to 35 and offering limit was $5 million, the
proportion is much higher for offerings under Rule 504 (59%) that have access to an unlimited
number of non‐accredited investors but had an offer limit of $1 million for the duration of the
time period covered by this study. Interestingly much fewer Rule 506 offerings (8%), including
amongst those that have an offer size of up to $5 million, report selling or intending to sell to a
non‐accredited investor. The big difference between Rule 506 and other rules under Regulation
D is that the former has preemption from state regulation. Thus, while issuers may prefer to
raise capital under Rule 506 because of the preemption of state securities laws, non‐accredited
investors could be attracted more to Rules 504 and 505 markets because of the higher degree
of protection they may perceive to get from state oversight. Additionally, Rule 506 provisions,
unlike Rule 504 or Rule 505 provisions, require the non‐accredited investors to be
‘sophisticated,’50 which could also explain the lower proportion of Rule 506 offerings that sell or
intend to sell to non‐accredited investors.
Table 12. Proportion of Regulation D offerings that sold or intend to sell to non‐accredited investors51
Rule 504 Rule 505 Rule 506(b) Offerings
<=$5 million All 506(b) offerings
2009 52% 38% 10% 9%
2010 54% 41% 9% 8%
2011 56% 42% 9% 8%
2012 58% 43% 9% 8%
2013 61% 40% 9% 8%
2014 59% 36% 8% 7%
2015 61% 43% 7% 6%
2016 64% 41% 6% 6%
2017 66% 35% 7% 6%
2009‐2017 59% 40% 8% 7%
Unlike Rule 506(b) offerings that allow accredited investors and up to 35 non‐accredited
investors, Rule 506(c) allows only accredited investors to participate in advertised offerings.
Aggregated Form D information indicates that more than 82,000 investors participated in Rule
50 Non‐accredited investors in Rule 506(b) offerings must have sufficient knowledge and experience in financial and business matters to make them capable of evaluating the merits and risks of the prospective investment. See http://www.sec.gov/answers/rule506.htm 51 Rule 506(c) offerings can sell only to accredited investors.
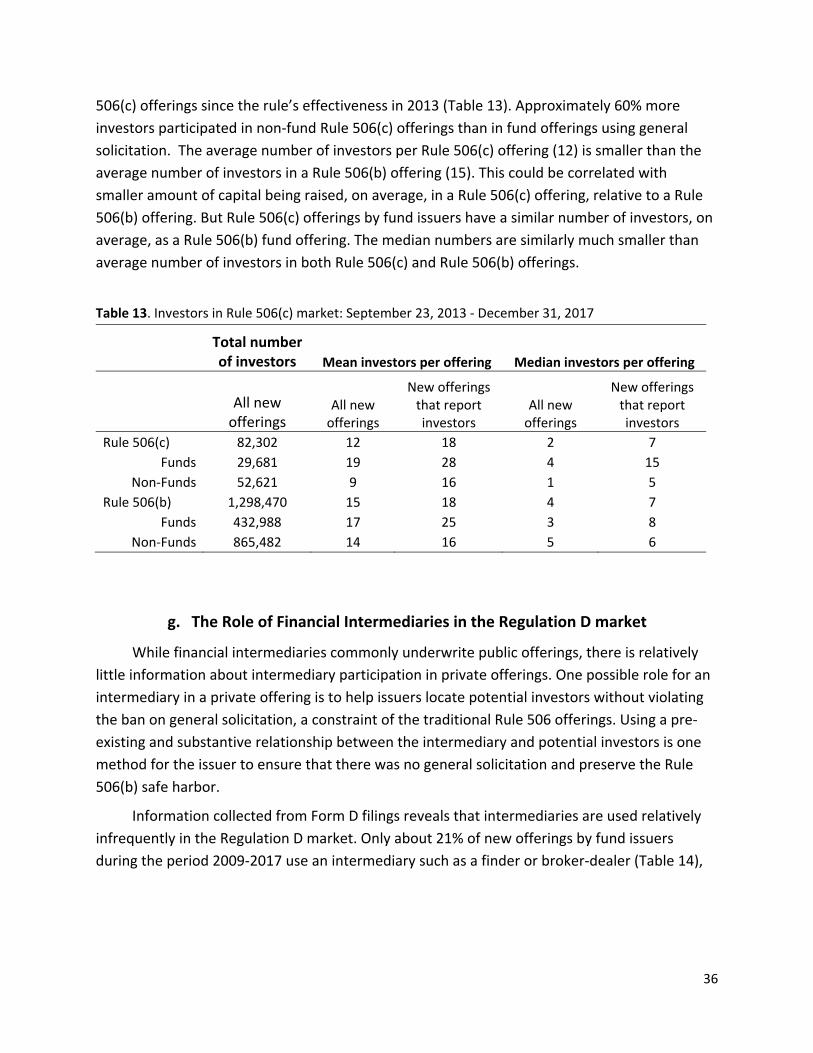
36
506(c) offerings since the rule’s effectiveness in 2013 (Table 13). Approximately 60% more
investors participated in non‐fund Rule 506(c) offerings than in fund offerings using general
solicitation. The average number of investors per Rule 506(c) offering (12) is smaller than the
average number of investors in a Rule 506(b) offering (15). This could be correlated with
smaller amount of capital being raised, on average, in a Rule 506(c) offering, relative to a Rule
506(b) offering. But Rule 506(c) offerings by fund issuers have a similar number of investors, on
average, as a Rule 506(b) fund offering. The median numbers are similarly much smaller than
average number of investors in both Rule 506(c) and Rule 506(b) offerings.
Table 13. Investors in Rule 506(c) market: September 23, 2013 ‐ December 31, 2017
Total number of investors Mean investors per offering Median investors per offering
All new offerings
All new offerings
New offerings that report investors
All new offerings
New offerings that report investors
Rule 506(c) 82,302 12 18 2 7
Funds 29,681 19 28 4 15
Non‐Funds 52,621 9 16 1 5
Rule 506(b) 1,298,470 15 18 4 7
Funds 432,988 17 25 3 8
Non‐Funds 865,482 14 16 5 6
g. The Role of Financial Intermediaries in the Regulation D market
While financial intermediaries commonly underwrite public offerings, there is relatively
little information about intermediary participation in private offerings. One possible role for an
intermediary in a private offering is to help issuers locate potential investors without violating
the ban on general solicitation, a constraint of the traditional Rule 506 offerings. Using a pre‐
existing and substantive relationship between the intermediary and potential investors is one
method for the issuer to ensure that there was no general solicitation and preserve the Rule
506(b) safe harbor.
Information collected from Form D filings reveals that intermediaries are used relatively
infrequently in the Regulation D market. Only about 21% of new offerings by fund issuers
during the period 2009‐2017 use an intermediary such as a finder or broker‐dealer (Table 14),
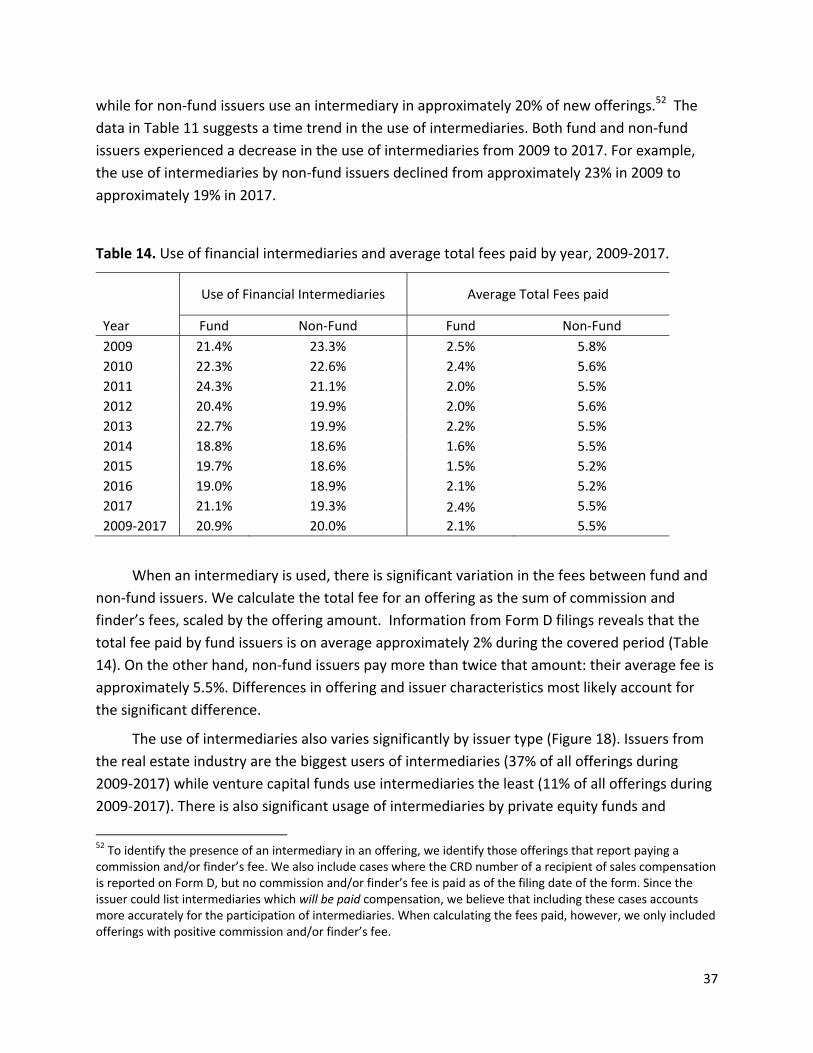
37
while for non‐fund issuers use an intermediary in approximately 20% of new offerings.52 The
data in Table 11 suggests a time trend in the use of intermediaries. Both fund and non‐fund
issuers experienced a decrease in the use of intermediaries from 2009 to 2017. For example,
the use of intermediaries by non‐fund issuers declined from approximately 23% in 2009 to
approximately 19% in 2017.
Table 14. Use of financial intermediaries and average total fees paid by year, 2009‐2017.
Use of Financial Intermediaries Average Total Fees paid
Year Fund Non‐Fund Fund Non‐Fund
2009 21.4% 23.3% 2.5% 5.8%
2010 22.3% 22.6% 2.4% 5.6%
2011 24.3% 21.1% 2.0% 5.5%
2012 20.4% 19.9% 2.0% 5.6%
2013 22.7% 19.9% 2.2% 5.5%
2014 18.8% 18.6% 1.6% 5.5%
2015 19.7% 18.6% 1.5% 5.2%
2016 19.0% 18.9% 2.1% 5.2%
2017 21.1% 19.3% 2.4% 5.5%
2009‐2017 20.9% 20.0% 2.1% 5.5%
When an intermediary is used, there is significant variation in the fees between fund and
non‐fund issuers. We calculate the total fee for an offering as the sum of commission and
finder’s fees, scaled by the offering amount. Information from Form D filings reveals that the
total fee paid by fund issuers is on average approximately 2% during the covered period (Table
14). On the other hand, non‐fund issuers pay more than twice that amount: their average fee is
approximately 5.5%. Differences in offering and issuer characteristics most likely account for
the significant difference.
The use of intermediaries also varies significantly by issuer type (Figure 18). Issuers from
the real estate industry are the biggest users of intermediaries (37% of all offerings during
2009‐2017) while venture capital funds use intermediaries the least (11% of all offerings during
2009‐2017). There is also significant usage of intermediaries by private equity funds and
52 To identify the presence of an intermediary in an offering, we identify those offerings that report paying a commission and/or finder’s fee. We also include cases where the CRD number of a recipient of sales compensation is reported on Form D, but no commission and/or finder’s fee is paid as of the filing date of the form. Since the issuer could list intermediaries which will be paid compensation, we believe that including these cases accounts more accurately for the participation of intermediaries. When calculating the fees paid, however, we only included offerings with positive commission and/or finder’s fee.
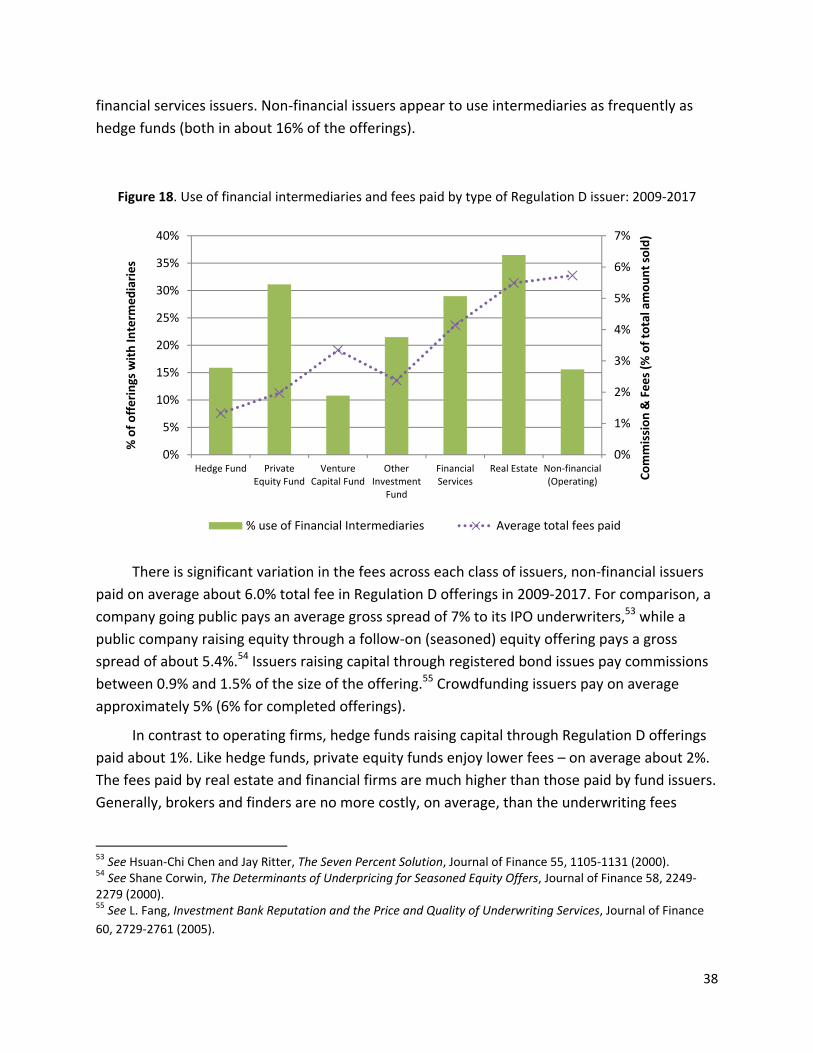
38
financial services issuers. Non‐financial issuers appear to use intermediaries as frequently as
hedge funds (both in about 16% of the offerings).
Figure 18. Use of financial intermediaries and fees paid by type of Regulation D issuer: 2009‐2017
There is significant variation in the fees across each class of issuers, non‐financial issuers
paid on average about 6.0% total fee in Regulation D offerings in 2009‐2017. For comparison, a
company going public pays an average gross spread of 7% to its IPO underwriters,53 while a
public company raising equity through a follow‐on (seasoned) equity offering pays a gross
spread of about 5.4%.54 Issuers raising capital through registered bond issues pay commissions
between 0.9% and 1.5% of the size of the offering.55 Crowdfunding issuers pay on average
approximately 5% (6% for completed offerings).
In contrast to operating firms, hedge funds raising capital through Regulation D offerings
paid about 1%. Like hedge funds, private equity funds enjoy lower fees – on average about 2%.
The fees paid by real estate and financial firms are much higher than those paid by fund issuers.
Generally, brokers and finders are no more costly, on average, than the underwriting fees
53 See Hsuan‐Chi Chen and Jay Ritter, The Seven Percent Solution, Journal of Finance 55, 1105‐1131 (2000). 54 See Shane Corwin, The Determinants of Underpricing for Seasoned Equity Offers, Journal of Finance 58, 2249‐2279 (2000). 55 See L. Fang, Investment Bank Reputation and the Price and Quality of Underwriting Services, Journal of Finance
60, 2729‐2761 (2005).
0%
1%
2%
3%
4%
5%
6%
7%
0%
5%
10%
15%
20%
25%
30%
35%
40%
Hedge Fund PrivateEquity Fund
VentureCapital Fund
OtherInvestment
Fund
FinancialServices
Real Estate Non‐financial(Operating) C
ommission & Fees (%
of total amount sold)
% of offerings with In
term
ediaries
% use of Financial Intermediaries Average total fees paid
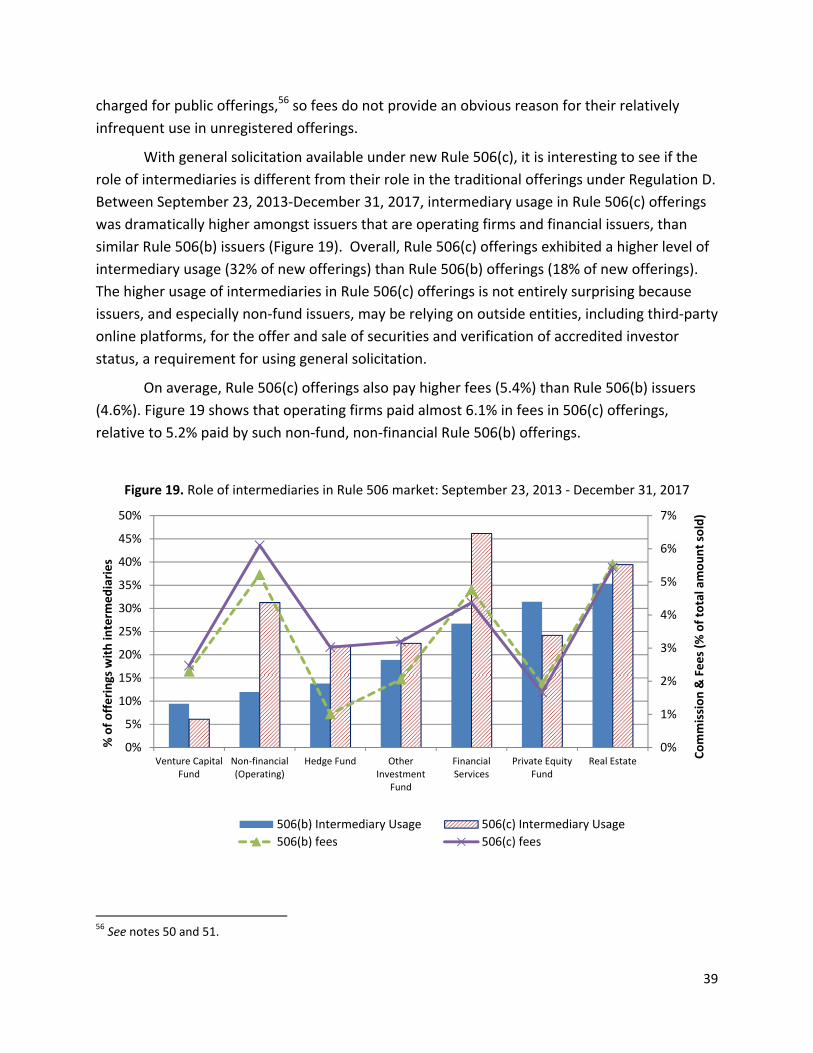
39
charged for public offerings,56 so fees do not provide an obvious reason for their relatively
infrequent use in unregistered offerings.
With general solicitation available under new Rule 506(c), it is interesting to see if the
role of intermediaries is different from their role in the traditional offerings under Regulation D.
Between September 23, 2013‐December 31, 2017, intermediary usage in Rule 506(c) offerings
was dramatically higher amongst issuers that are operating firms and financial issuers, than
similar Rule 506(b) issuers (Figure 19). Overall, Rule 506(c) offerings exhibited a higher level of
intermediary usage (32% of new offerings) than Rule 506(b) offerings (18% of new offerings).
The higher usage of intermediaries in Rule 506(c) offerings is not entirely surprising because
issuers, and especially non‐fund issuers, may be relying on outside entities, including third‐party
online platforms, for the offer and sale of securities and verification of accredited investor
status, a requirement for using general solicitation.
On average, Rule 506(c) offerings also pay higher fees (5.4%) than Rule 506(b) issuers
(4.6%). Figure 19 shows that operating firms paid almost 6.1% in fees in 506(c) offerings,
relative to 5.2% paid by such non‐fund, non‐financial Rule 506(b) offerings.
Figure 19. Role of intermediaries in Rule 506 market: September 23, 2013 ‐ December 31, 2017
56 See notes 50 and 51.
0%
1%
2%
3%
4%
5%
6%
7%
0%
5%
10%
15%
20%
25%
30%
35%
40%
45%
50%
Venture CapitalFund
Non‐financial(Operating)
Hedge Fund OtherInvestment
Fund
FinancialServices
Private EquityFund
Real Estate
Commission & Fees (%
of total amount sold)
% of offerings with interm
ediaries
506(b) Intermediary Usage 506(c) Intermediary Usage
506(b) fees 506(c) fees
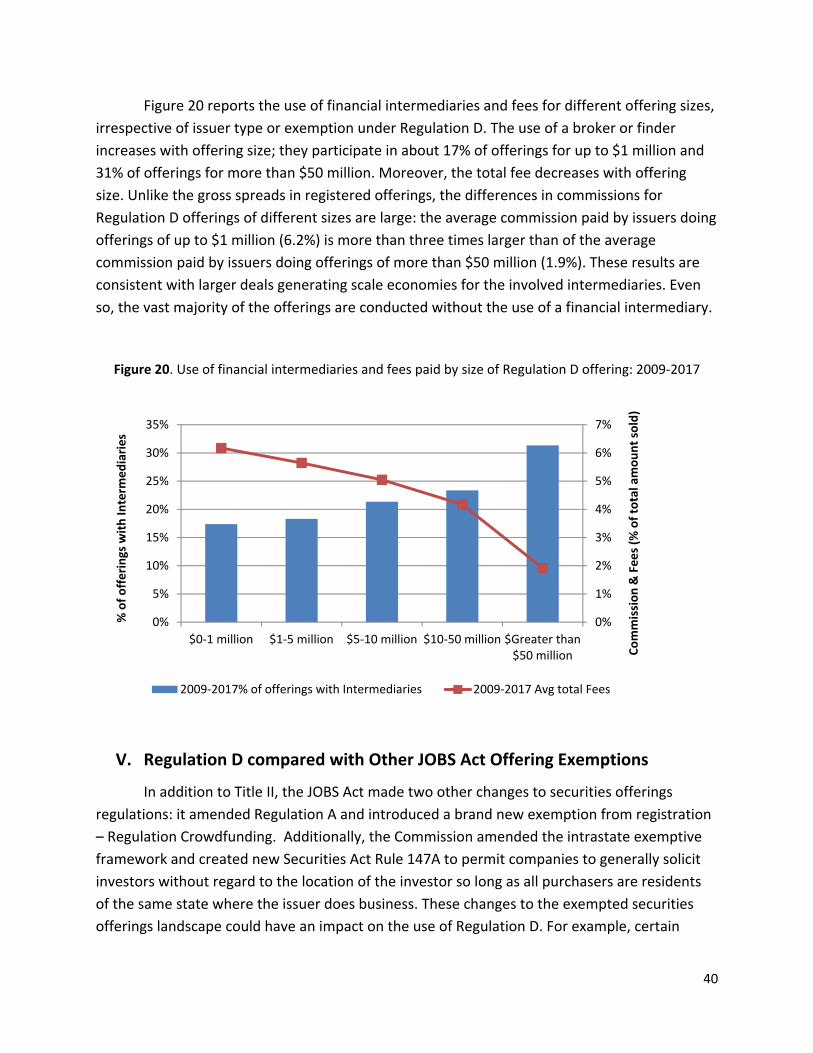
40
Figure 20 reports the use of financial intermediaries and fees for different offering sizes,
irrespective of issuer type or exemption under Regulation D. The use of a broker or finder
increases with offering size; they participate in about 17% of offerings for up to $1 million and
31% of offerings for more than $50 million. Moreover, the total fee decreases with offering
size. Unlike the gross spreads in registered offerings, the differences in commissions for
Regulation D offerings of different sizes are large: the average commission paid by issuers doing
offerings of up to $1 million (6.2%) is more than three times larger than of the average
commission paid by issuers doing offerings of more than $50 million (1.9%). These results are
consistent with larger deals generating scale economies for the involved intermediaries. Even
so, the vast majority of the offerings are conducted without the use of a financial intermediary.
Figure 20. Use of financial intermediaries and fees paid by size of Regulation D offering: 2009‐2017
V. Regulation D compared with Other JOBS Act Offering Exemptions
In addition to Title II, the JOBS Act made two other changes to securities offerings
regulations: it amended Regulation A and introduced a brand new exemption from registration
– Regulation Crowdfunding. Additionally, the Commission amended the intrastate exemptive
framework and created new Securities Act Rule 147A to permit companies to generally solicit
investors without regard to the location of the investor so long as all purchasers are residents
of the same state where the issuer does business. These changes to the exempted securities
offerings landscape could have an impact on the use of Regulation D. For example, certain
0%
1%
2%
3%
4%
5%
6%
7%
0%
5%
10%
15%
20%
25%
30%
35%
$0‐1 million $1‐5 million $5‐10 million $10‐50 million $Greater than$50 million C
ommission & Fees (%
of total amount sold)
% of offerings with In
term
ediaries
2009‐2017% of offerings with Intermediaries 2009‐2017 Avg total Fees
41
issuers could switch from Regulation D offerings to Regulation A and crowdfunding offerings,
thus leaving capital formation unchanged. On the other hand, the changes brought about by
Title III and IV of the JOBS Act could bring new issuers to the private offerings market, which
would increase capital formation.
a. Regulation A and Regulation Crowdfunding
Regulation A is an exemption from registration under Section 3(b)(2) of the Securities
Act. Prior to June 19, 2015, it enabled issuers to raise up to $5 million in a 12‐month period
(subsequently, up to $50 million). It is available to issuers organized, and with a principal place
of business, in the United States or Canada. Historically, the Regulation A exemption was not
available to Securities Exchange Act of 1934 (Exchange Act) reporting companies, investment
companies (including business development companies), development stage companies that
have no specific business plan or purpose or have indicated that their business plan is to engage
in a merger or acquisition with an unidentified company or companies, issuers of fractional
undivided interests in oil or gas rights or a similar interest in other mineral rights. In addition,
Regulation A also excludes issuers that have not filed certain ongoing reports required by
Regulation A, issuers subject to certain Section 12(j) orders by the Commission, and issuers
subject to “bad actor” disqualification under Rule 262.
Title IV of the JOBS Act added Section 3(b)(2) to the Securities Act, directing the
Commission to adopt rules exempting from registration public offerings of up to $50 million
annually. On March 25, 2015, the Commission adopted final rules.57 The final rules expand
Regulation A into two tiers: Tier 1, for securities offerings of up to $20 million (that tracks more
closely “old” Regulation A); and Tier 2, for offerings of up to $50 million. Under the final rules,
Tier 2 issuers are required to include audited financial statements in their offering documents
and to file annual, semiannual, and current reports with the Commission. With the exception
of securities listed on a national securities exchange, purchasers in Tier 2 offerings either must
be accredited investors or are subject to specified limitations on their investment. The
amendments to Regulation A became effective on June 19, 2015.
Title III of the JOBS Act (Regulation Crowdfunding) amended Section 4 of the Securities
Act and created a new exemption from registration for Internet‐based securities offerings of up
to $1 million58 over a 12‐month period. Title III was intended to help small and startup
businesses conduct low‐dollar capital raising on the Internet. It can be thought of as an 57 See Amendments to Regulation A, SEC Release No. 33‐9741 (March 25, 2015) [80 FR 21805 (April 20, 2015)], available at http://www.sec.gov/rules/final/2015/33‐9741.pdf. 58 See SEC Releases No. 33-9974 (Oct. 30, 2015) [80 FR 71387 (Nov. 16, 2015)] (Crowdfunding Adopting Release), available at https://www.sec.gov/rules/final/2015/33-9974.pdf.. On March 31, 2017, the Commission adopted amendments to increase the amount that issuers can raise through crowdfunding to adjust for inflation. The maximum aggregate offering amount increased to $1,070,000, and the new thresholds became effective on April 12, 2017.
42
Internet‐based method of raising seed financing from a broad, mostly retail investor base. Title
III included a number of investor protection provisions, including investment limitations, issuer
disclosure requirements, and a requirement to use regulated intermediaries. The SEC adopted
the final “Regulation Crowdfunding” rules on October 30, 2015, to implement the requirements
of Title III.59 Issuers were able to use the new exemption beginning May 16, 2016, when
Regulation Crowdfunding became fully effective.60
While securities‐based crowdfunding under Regulation Crowdfunding shares certain
similarities with non‐securities‐based (lending‐based, reward‐based, donation‐based, and
royalty‐based) crowdfunding, such as the ability of the public to participate and the use of an
Internet‐based platform to solicit backers, there are important distinctions. Non‐securities‐
based crowdfunding campaigns do not involve a profit or revenue‐sharing model and are
generally not subject to regulation under federal securities laws. Although any crowdfunding
backer may have nonpecuniary reasons for participating, backers in non‐securities based
crowdfunding campaigns are more likely to be guided by such motives. Overall, the differences
in the legal framework, characteristics of fundraisers, and objectives of funders limit
extrapolation from non‐securities based crowdfunding to Title III crowdfunding.
Regulation Crowdfunding established requirements for issuers and intermediaries
seeking to participate in an Internet‐based crowdfunding offering. The key provisions are
summarized below:61
A given issuer is able to raise up to $1,070,000 across all crowdfunding offerings in a 12‐
month period. An issuer must raise at least the target amount to receive funds.
Crowdfunding securities are generally subject to resale limitations for one year.
The rules impose limits on the amount that an investor can invest in all Title III
crowdfunding offerings over a 12‐month period. Investors with both an annual income
and net worth of at least $107,000 can invest up to 10% of the lesser of annual income
or net worth, but an investor’s total investment across all Title III offerings may not
exceed $107,000 in a 12‐month period. Other investors can invest the greater of either
$2,200 or 5% of the lesser of their annual income or net worth.
Crowdfunding issuers are subject to disclosure requirements at the time of the offering
(on Form C), during the offering’s progress and on completion of the offering (on Form
C‐U) and annually in the form of annual reporting requirements (on Form C‐AR).
Additionally, in offerings of over $107,000 in a 12‐month period, financial statements
59 See Crowdfunding Adopting Release. 60 Provisions related to funding portal registration became effective on January 29, 2016, to give funding portals additional time to undergo the SEC registration and FINRA membership process. 61 See Crowdfunding Adopting Release for details. In the JOBS Act Technical Amendments Release, the Commission revised the investment limits and other dollar amount thresholds in Regulation Crowdfunding to adjust for inflation. The inflated‐adjusted amounts are reflected below.
43
must be reviewed by an independent accountant, and in offerings of over $535,000 in a
12‐month period (except the issuer’s first crowdfunding offering), financial statements
must be audited.
Crowdfunding securities must be offered through an SEC‐registered intermediary, either
a broker‐dealer or a funding portal, a new intermediary type established in Regulation
Crowdfunding. These intermediaries must take measures to reduce the risk of fraud,
make required disclosures about issuers available to the public, provide communication
channels to permit discussion of offerings on the platform, disclose the compensation
received by an intermediary, provide educational materials to investors, and comply
with additional requirements related to investor commitments, notices to investors, and
maintenance and transmission of funds. Registered funding portals that participate in
crowdfunding offerings may engage in a narrower set of activities than broker‐dealers.62
Given the offering limits, crowdfunding is primarily used by relatively small issuers, thus
many of the economic considerations applicable to small and early‐stage issuers apply to
crowdfunding as well.63 The availability of solicitation over the Internet and sales to investors
nationwide, irrespective of the location of the issuer (as long as the issuer is a U.S. issuer)
distinguish Regulation Crowdfunding from intrastate securities‐based crowdfunding regulated
under state law that historically has relied on Securities Act Rules 147 or 504.64
b. Comparison between Regulation D offering and Regulation A and Regulation
Crowdfunding offerings
Compared to Regulation Crowdfunding offerings, Regulation D offerings for up to $1
million are more numerous and raise significantly more capital (Table 15). Regulation D issuers
also tend to be younger (approximately 55%% are less than a year old at the time of the
offering). On the other hand, issuers relying on Regulation Crowdfunding tend to be smaller as
based on the size of their revenues, although caution is due when making such comparison
given that about 70% of Regulation D issuers declined to disclose their revenues.
62 Among other things, a funding portal cannot offer investment advice or recommendations; solicit purchases, sales or offers to buy the securities offered or displayed on its platform; compensate employees, agents or other persons for solicitation or based on the sale of securities on its platform; and hold, manage, possess, or otherwise handle investor funds or securities. 63 See Crowdfunding Adopting Release. 64 See Crowdfunding Adopting Release. The Commission recently amended Rule 147 and Rule 504 and adopted a new intrastate offering exemption as Rule 147A. See Rel. No. 33‐10238, Exemptions to Facilitate Intrastate and Regional Securities Offerings (Oct. 26, 2016). Amendments to Rule 504 took effect on January 20, 2017. The amended Rule 147 and the new Rule 147A took effect on April 20, 2017.
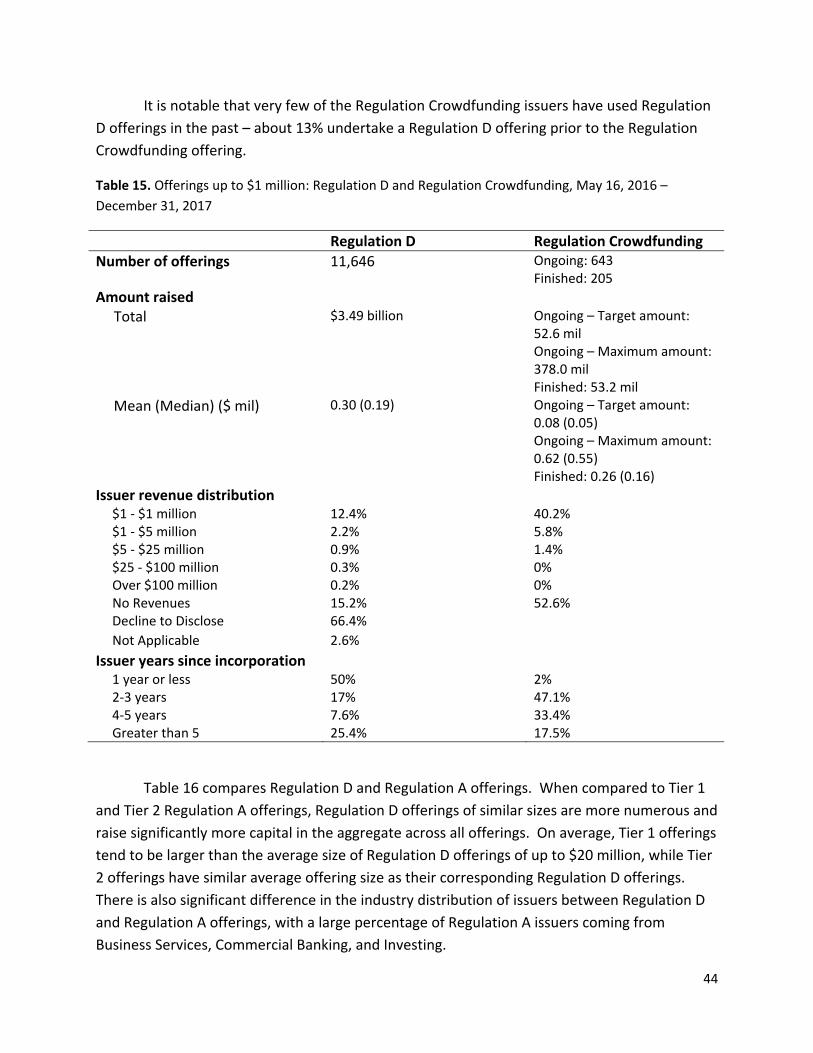
44
It is notable that very few of the Regulation Crowdfunding issuers have used Regulation
D offerings in the past – about 13% undertake a Regulation D offering prior to the Regulation
Crowdfunding offering.
Table 15. Offerings up to $1 million: Regulation D and Regulation Crowdfunding, May 16, 2016 –
December 31, 2017
Regulation D Regulation Crowdfunding
Number of offerings 11,646 Ongoing: 643 Finished: 205
Amount raised Total $3.49 billion Ongoing – Target amount:
52.6 mil Ongoing – Maximum amount: 378.0 mil Finished: 53.2 mil
Mean (Median) ($ mil) 0.30 (0.19) Ongoing – Target amount: 0.08 (0.05) Ongoing – Maximum amount: 0.62 (0.55) Finished: 0.26 (0.16)
Issuer revenue distribution $1 ‐ $1 million 12.4% 40.2% $1 ‐ $5 million 2.2% 5.8% $5 ‐ $25 million 0.9% 1.4% $25 ‐ $100 million 0.3% 0% Over $100 million 0.2% 0% No Revenues 15.2% 52.6% Decline to Disclose 66.4% Not Applicable 2.6% Issuer years since incorporation 1 year or less 50% 2% 2‐3 years 17% 47.1% 4‐5 years 7.6% 33.4% Greater than 5 25.4% 17.5%
Table 16 compares Regulation D and Regulation A offerings. When compared to Tier 1
and Tier 2 Regulation A offerings, Regulation D offerings of similar sizes are more numerous and
raise significantly more capital in the aggregate across all offerings. On average, Tier 1 offerings
tend to be larger than the average size of Regulation D offerings of up to $20 million, while Tier
2 offerings have similar average offering size as their corresponding Regulation D offerings.
There is also significant difference in the industry distribution of issuers between Regulation D
and Regulation A offerings, with a large percentage of Regulation A issuers coming from
Business Services, Commercial Banking, and Investing.
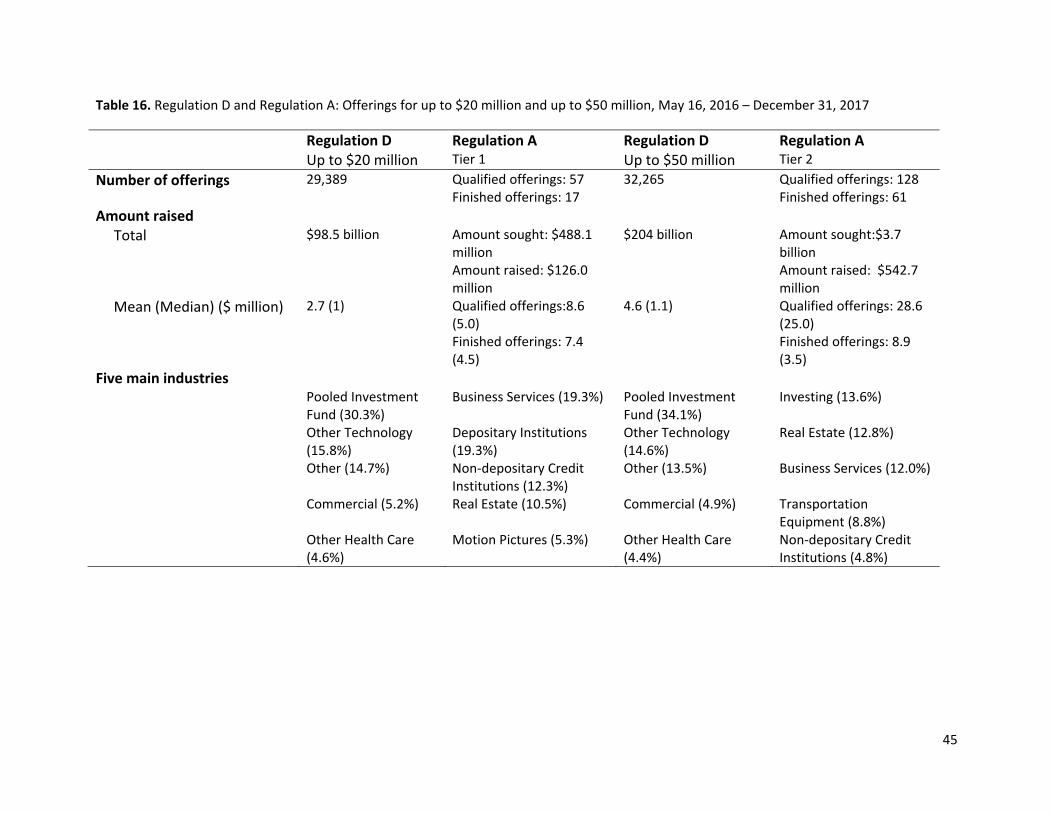
45
Table 16. Regulation D and Regulation A: Offerings for up to $20 million and up to $50 million, May 16, 2016 – December 31, 2017
Regulation D Regulation A Regulation D Regulation A Up to $20 million Tier 1 Up to $50 million Tier 2
Number of offerings 29,389 Qualified offerings: 57 Finished offerings: 17
32,265 Qualified offerings: 128 Finished offerings: 61
Amount raised Total $98.5 billion Amount sought: $488.1
million Amount raised: $126.0 million
$204 billion Amount sought:$3.7 billion Amount raised: $542.7 million
Mean (Median) ($ million) 2.7 (1) Qualified offerings:8.6 (5.0) Finished offerings: 7.4 (4.5)
4.6 (1.1) Qualified offerings: 28.6 (25.0) Finished offerings: 8.9 (3.5)
Five main industries Pooled Investment
Fund (30.3%) Business Services (19.3%) Pooled Investment
Fund (34.1%) Investing (13.6%)
Other Technology (15.8%)
Depositary Institutions (19.3%)
Other Technology (14.6%)
Real Estate (12.8%)
Other (14.7%) Non‐depositary Credit Institutions (12.3%)
Other (13.5%) Business Services (12.0%)
Commercial (5.2%) Real Estate (10.5%) Commercial (4.9%) Transportation Equipment (8.8%)
Other Health Care (4.6%)
Motion Pictures (5.3%) Other Health Care (4.4%)
Non‐depositary Credit Institutions (4.8%)
46
Appendix I: Data Used in Analysis
This appendix describes the procedures used to collect the Regulation D sample and the
data on the other offerings. One of the original purposes of Form D, first adopted in 1982, was
to collect and analyze data on issuers using Regulation D.65 However, until 2008, issuers filed
Form D on paper, making the extraction of information for large‐scale statistical analysis
cumbersome. In February 2008, the SEC adopted amendments to Form D that required issuers
to submit their Form D filings electronically, in a structured data format. 66 As a result of these
requirements, which were phased in from September 2008 through March 2009, Form D filings
are now machine‐readable. Using basic text parsing tools, DERA staff was able to extract the
reported elements and place them in a database enabling the large‐scale statistical analysis
reported here.
A. Regulation D sample
We collected all Form D filings (new filings and amendments) on EDGAR starting in
January 2009 through December 2017. We extracted all fields from each filing and applied the
following treatments to arrive at our final sample.
‐ Subsequent amendments to a new filing are treated as incremental fundraising and
recorded in the calendar year in which the amendment is filed. For offerings
initiated prior to 2009 and continuing into future years, an issuer would have filed
only Form D amendments in an electronic (machine readable) form required for this
analysis. If these amendments reference a post‐2008 sale date, the first filed
amendment is treated as an original Form D filing as we do not have access to Form
D data prior to 2009.
‐ The incremental amount sold between two successive filings of the same issuer is
determined by taking the difference between the “total amounts sold” reported in
each such filing.
‐ We estimate the incremental amount of capital raised and reported in amended
filings for which there is no original filing in electronic form. This occurs only in 2009.
The estimated incremental capital raised in these instances is based on a “haircut”
of the total amount sold reported in the latest filed amendment. This percentage is
the average incremental amount sold in all amendments for which there is an
original filing in electronic form, calculated separately for funds and non‐funds. This
65Release No. 33–6389 (Mar. 8, 1982); 47 Fed. Reg. 11251 (1982) (adopting Form D as a replacement for Forms 4(6), 146, 240 and 242). 66 Release No. 33–8891 (Feb. 27, 2008); Electronic Filing and Revision of Form D, 70 Fed. Reg. 10,592 (2008) .
47
resulted in haircut percentages of 11% and 27%, respectively. This treatment is
unnecessary for offerings starting in 2010.
‐ A number of pooled investment funds appear to report, in their annual
amendments, net asset values for total amount sold under the offering. Net asset
values could reflect fund performance as well as new investment into, and
redemptions from, the fund. Since it is not possible to distinguish between the two
impacts, we present the second category of amendments (filed for offerings initiated
prior to 2017) separate from the total amount raised in initial offerings. However, it
is plausible that amendments filed within the same year when offerings are initiated,
would reflect updates to capital raising efforts of the issuers. Therefore, we use the
incremental amounts in the first set of amendments in calculating total amount
raised in initial offerings.
‐ Foreign issuers are determined based on the information on Issuer State that they
provide.
‐ When an issuer checks the box to claim more than one offering exemption (Rule
504, 505, or 506), for the purpose of this analysis, we assume that any issuer that
checks the box for Rule 506 is in fact relying on Rule 506.
B. Other offerings ‐ Data on IPOs, equity offerings by seasoned issuers (EOSIs), convertible debt
offerings, public debt offerings, and private offerings are taken from Securities Data
Corporation’s New Issues database (Thomson Financial). Data on non‐ABS Rule 144A
offerings are taken from Securities Data Corporation’s New Issues database,
Dealogic, and Mergent database.
‐ Data on ABS Rule 144A offerings are taken from the Asset‐Backed Alert and
Commercial Mortgage Alert publications. We use non‐U.S. collateral backed deals to
proxy for deals done by foreign issuers.
‐ Public debt offerings by government, state, municipal, and quasi‐governmental
issuers (e.g., Fannie Mae, Freddie Mac) are excluded from the public debt sample.
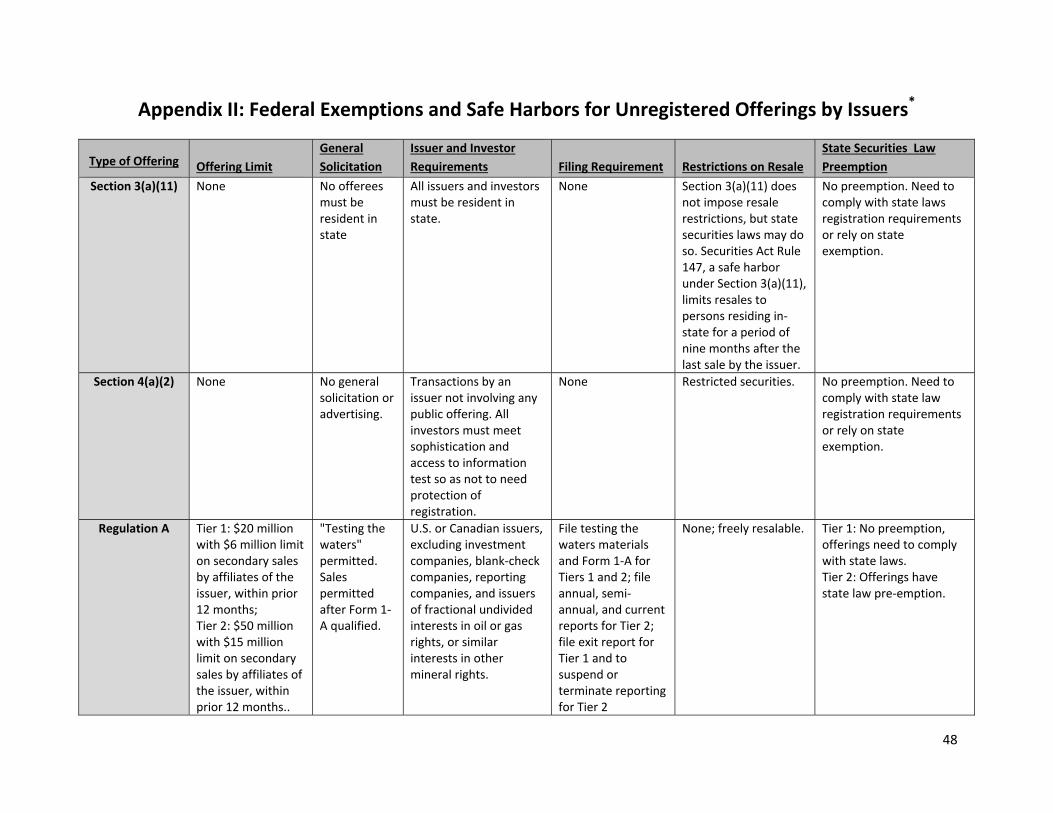
48
Appendix II: Federal Exemptions and Safe Harbors for Unregistered Offerings by Issuers*
Type of Offering Offering Limit
General
Solicitation
Issuer and Investor
Requirements Filing Requirement Restrictions on Resale
State Securities Law
Preemption
Section 3(a)(11)
None No offerees must be resident in state
All issuers and investors must be resident in state.
None Section 3(a)(11) does not impose resale restrictions, but state securities laws may do so. Securities Act Rule 147, a safe harbor under Section 3(a)(11), limits resales to persons residing in‐state for a period of nine months after the last sale by the issuer.
No preemption. Need to comply with state laws registration requirements or rely on state exemption.
Section 4(a)(2) None No general solicitation or advertising.
Transactions by an issuer not involving any public offering. All investors must meet sophistication and access to information test so as not to need protection of registration.
None Restricted securities. No preemption. Need to comply with state law registration requirements or rely on state exemption.
Regulation A Tier 1: $20 million with $6 million limit on secondary sales by affiliates of the issuer, within prior 12 months; Tier 2: $50 million with $15 million limit on secondary sales by affiliates of the issuer, within prior 12 months..
"Testing the waters" permitted. Sales permitted after Form 1‐A qualified.
U.S. or Canadian issuers, excluding investment companies, blank‐check companies, reporting companies, and issuers of fractional undivided interests in oil or gas rights, or similar interests in other mineral rights.
File testing the waters materials and Form 1‐A for Tiers 1 and 2; file annual, semi‐annual, and current reports for Tier 2; file exit report for Tier 1 and to suspend or terminate reporting for Tier 2
None; freely resalable. Tier 1: No preemption, offerings need to comply with state laws. Tier 2: Offerings have state law pre‐emption.
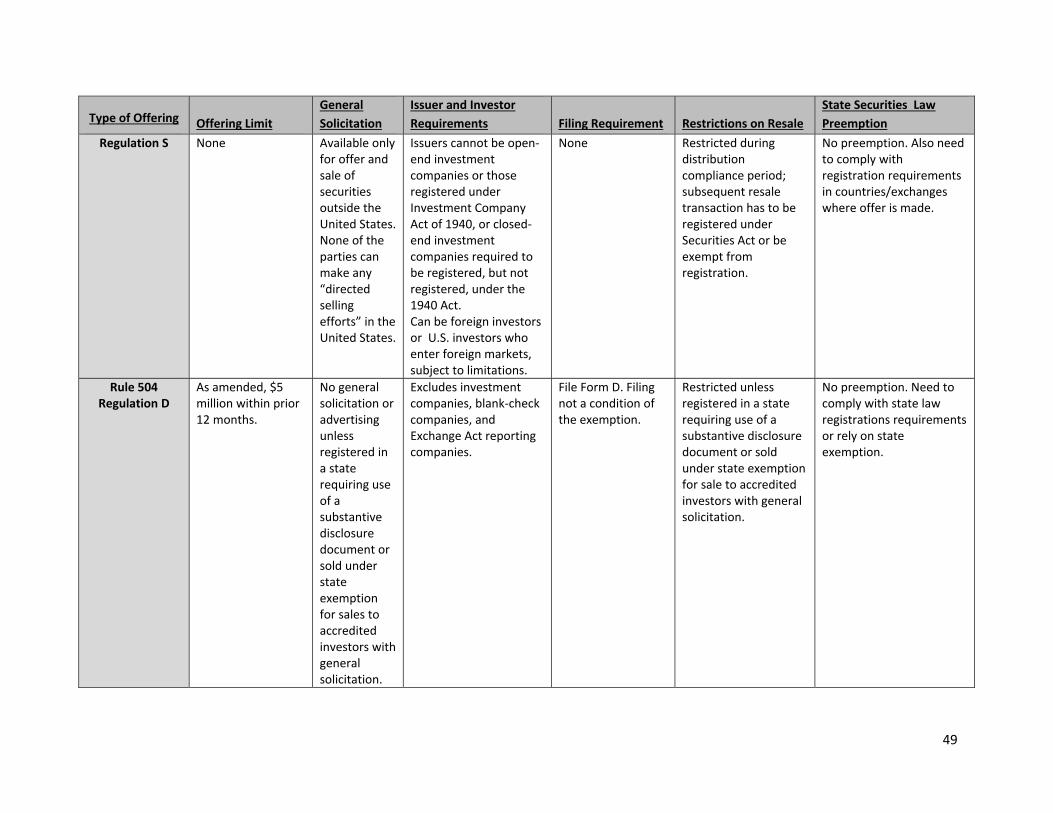
49
Type of Offering Offering Limit
General
Solicitation
Issuer and Investor
Requirements Filing Requirement Restrictions on Resale
State Securities Law
Preemption
Regulation S None Available only for offer and sale of securities outside the United States. None of the parties can make any “directed selling efforts” in the United States.
Issuers cannot be open‐end investment companies or those registered under Investment Company Act of 1940, or closed‐end investment companies required to be registered, but not registered, under the 1940 Act. Can be foreign investors or U.S. investors who enter foreign markets, subject to limitations.
None Restricted during distribution compliance period; subsequent resale transaction has to be registered under Securities Act or be exempt from registration.
No preemption. Also need to comply with registration requirements in countries/exchanges where offer is made.
Rule 504 Regulation D
As amended, $5 million within prior 12 months.
No general solicitation or advertising unless registered in a state requiring use of a substantive disclosure document or sold under state exemption for sales to accredited investors with general solicitation.
Excludes investment companies, blank‐check companies, and Exchange Act reporting companies.
File Form D. Filing not a condition of the exemption.
Restricted unless registered in a state requiring use of a substantive disclosure document or sold under state exemption for sale to accredited investors with general solicitation.
No preemption. Need to comply with state law registrations requirements or rely on state exemption.
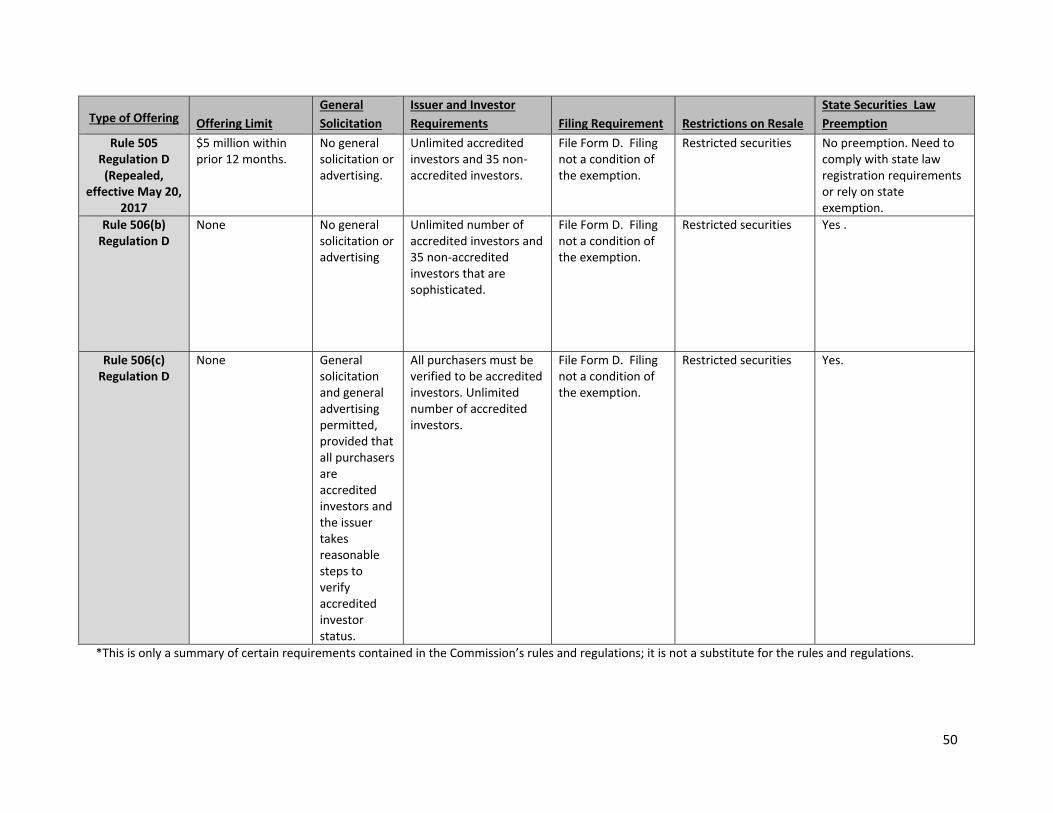
50
Type of Offering Offering Limit
General
Solicitation
Issuer and Investor
Requirements Filing Requirement Restrictions on Resale
State Securities Law
Preemption
Rule 505 Regulation D (Repealed,
effective May 20, 2017
$5 million within prior 12 months.
No general solicitation or advertising.
Unlimited accredited investors and 35 non‐accredited investors.
File Form D. Filing not a condition of the exemption.
Restricted securities No preemption. Need to comply with state law registration requirements or rely on state exemption.
Rule 506(b) Regulation D
None No general solicitation or advertising
Unlimited number of accredited investors and 35 non‐accredited investors that are sophisticated.
File Form D. Filing not a condition of the exemption.
Restricted securities Yes .
Rule 506(c) Regulation D
None General solicitation and general advertising permitted, provided that all purchasers are accredited investors and the issuer takes reasonable steps to verify accredited investor status.
All purchasers must be verified to be accredited investors. Unlimited number of accredited investors.
File Form D. Filing not a condition of the exemption.
Restricted securities Yes.
*This is only a summary of certain requirements contained in the Commission’s rules and regulations; it is not a substitute for the rules and regulations.