Embed Size (px)
Citation preview
Capital One Financial Corporation (NYSE:COF)
December 5, 2013Valerie Chan, Hisham Haider Dewan
Caleb Pierson, Harout Sahakian
Agenda
2
• Introduction• Company overview•Macro-economic overview• Industry analysis• Financial analysis and projections• Valuation• Recommendation

COMPANY OVERVIEW
3

Introduction to Capital One
4Source: 2012 Capital One 10K

5
COF Subsidiaries & Business Segments
• Capital One Bank, National Association (COBNA)• Capital One, National Association (CONA)
Source: 2012 Capital One 10K Page 1
Credit Card Consumer Banking
Commercial Banking
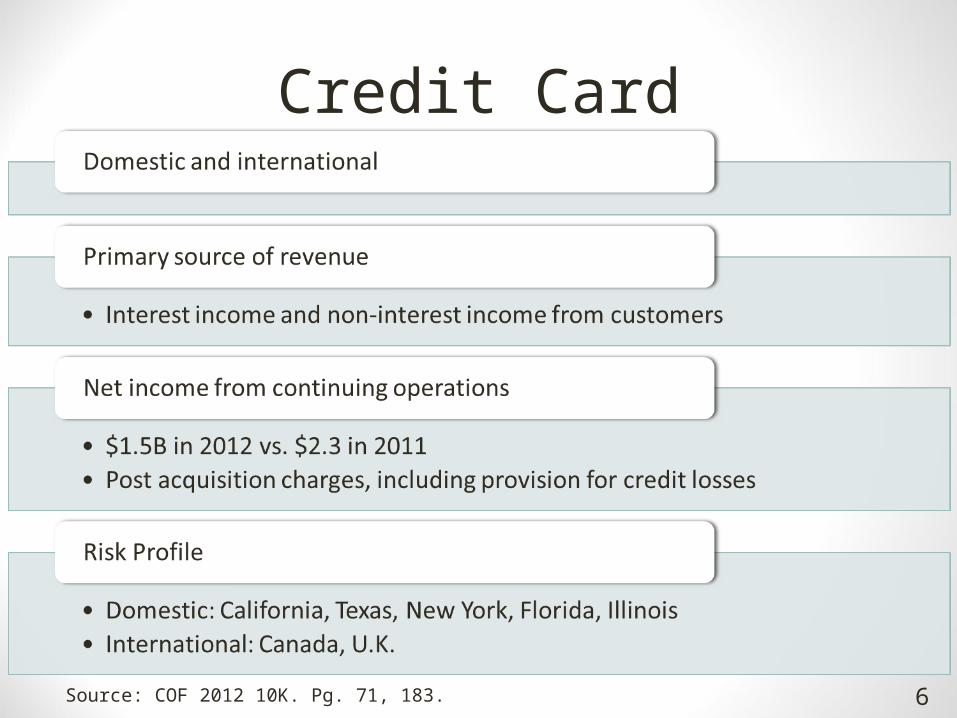
Credit Card
Source: COF 2012 10K. Pg. 71, 183. 6
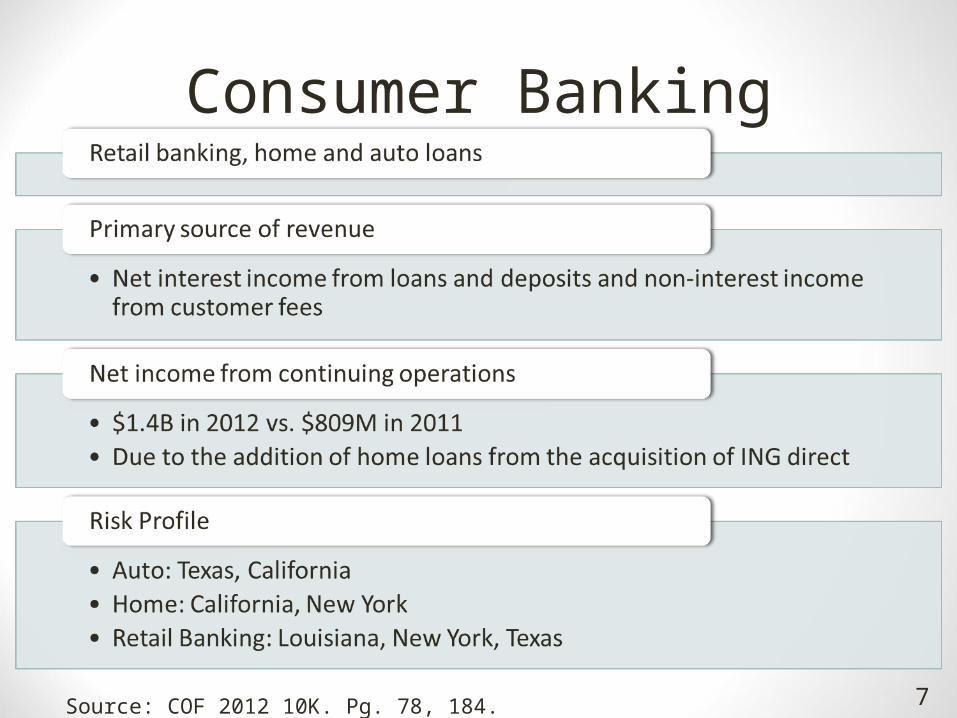
Consumer Banking
Source: COF 2012 10K. Pg. 78, 184. 7
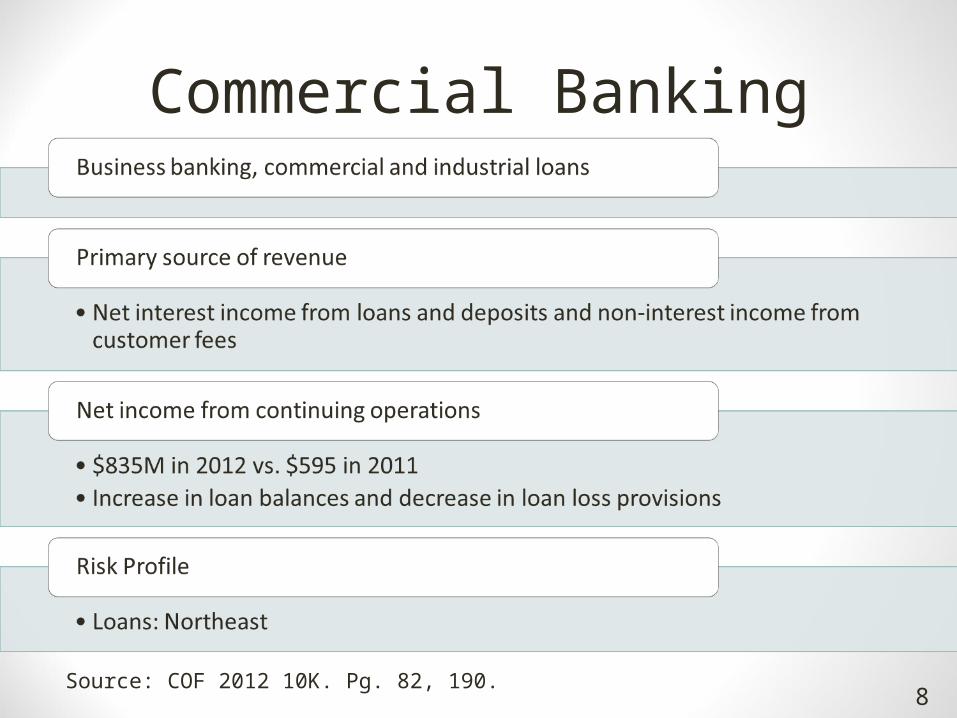
Commercial Banking
Source: COF 2012 10K. Pg. 82, 190. 8
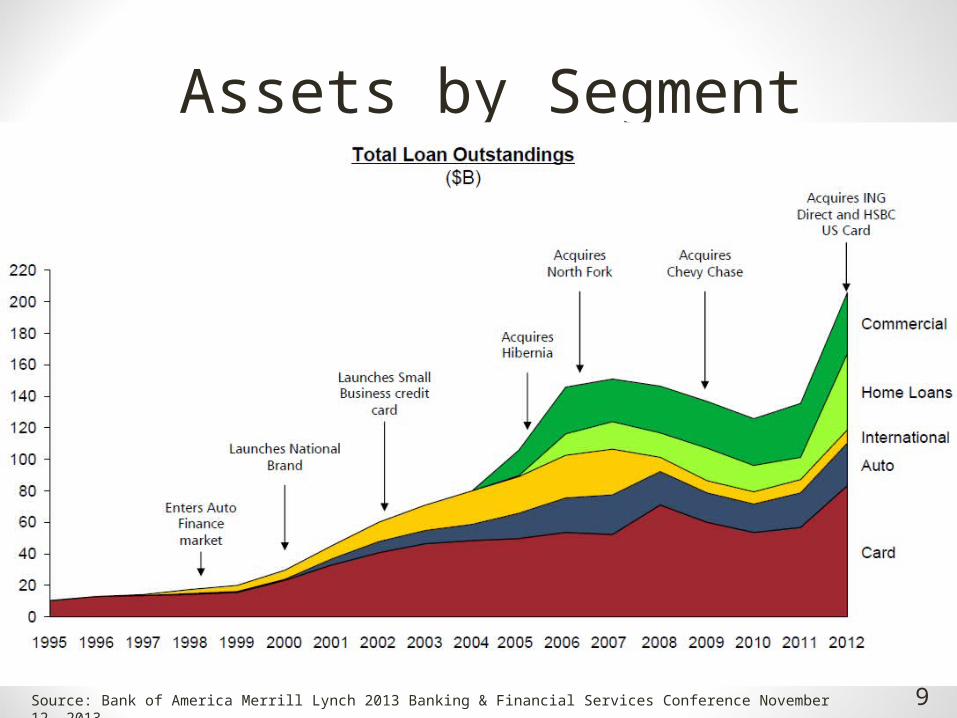
Assets by Segment
9Source: Bank of America Merrill Lynch 2013 Banking & Financial Services Conference November 12, 2013

Segment Revenue Trends
*in millions
Source: Capital IQ 10

Operation & Income Trends
Source: Capital IQ 11

Recent Developments
Source: COF 2013 3Q 10Q. Pg. 11. http://www.bloomberg.com/news/2013-11-21/capital-one-ceo-sells-44-million-of-stock-in-november.html?cmpid=yhoo
12

Regulation
Source: COF 2012 10K. Pgs. 9-17. 13

MACRO-ECONOMIC OVERVIEW
14

15
U.S. Household debt

Treasury Yield Curve
16
Source: ycharts.com
Source: federalreserve.gov

INDUSTRY ANALYSIS
17

Credit Card Issuing
Commercial Banking
18Source: 1) IBISWorld Industry Report 52221, Credit Card Issuing in the US, October 20132) IBISWorld Industry Report 52211, Commercial Banking in the US, August 2013

Banking More Mobile and Online
19

COMPETITIVE POSITION OF COF
20

COF Porter's Five Forces Analysis
21Source: FDIC Statistics At A Glance Sept 2013
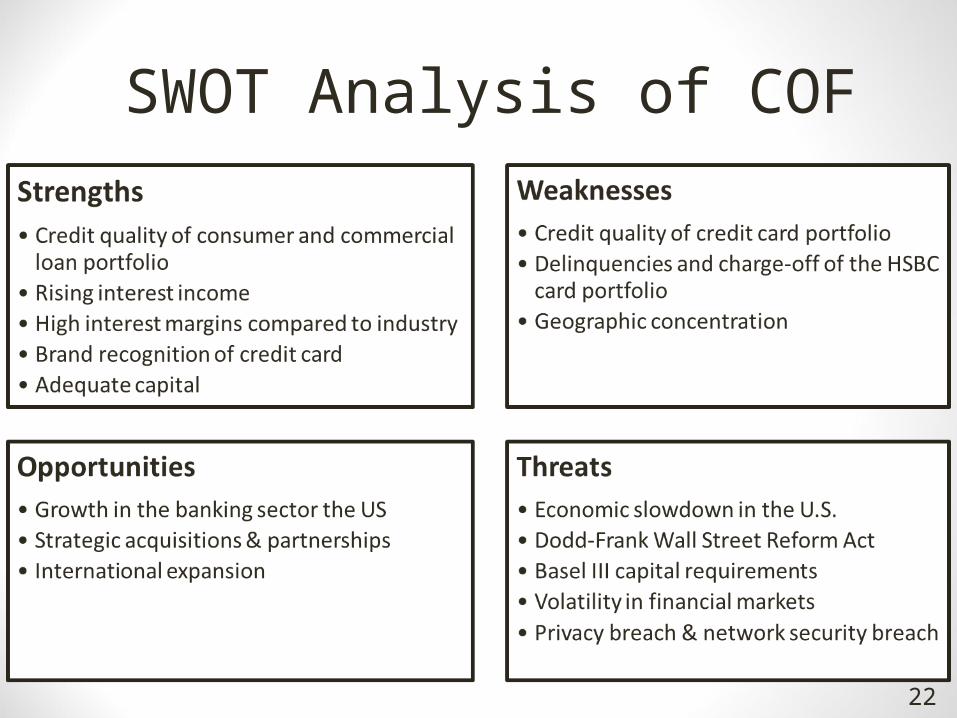
SWOT Analysis of COF
22

FINANCIAL ANALYSIS
23
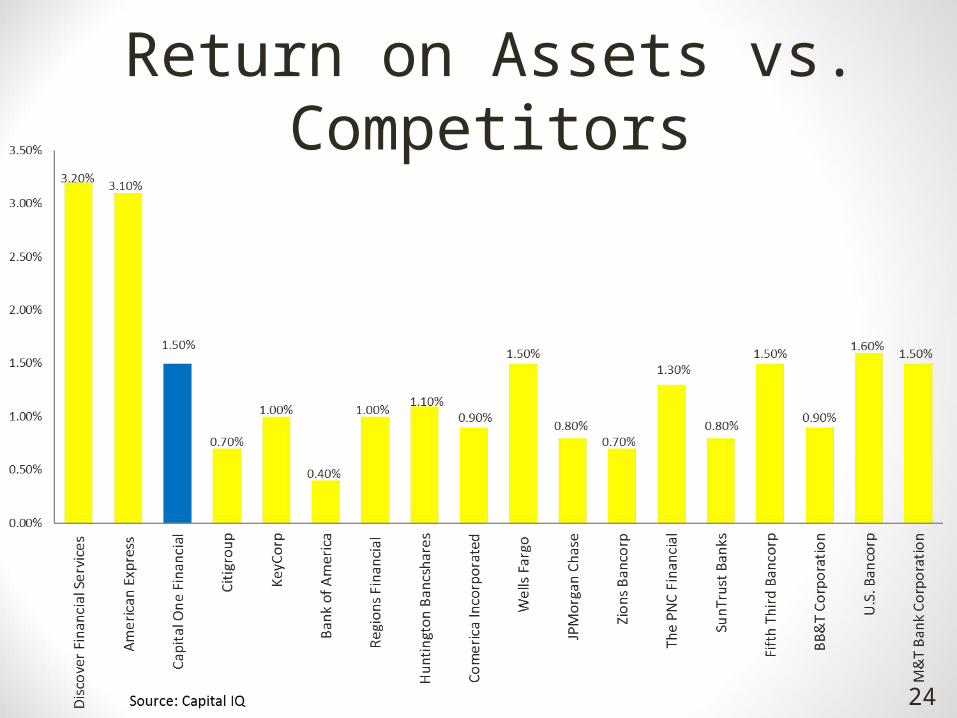
24
Return on Assets vs. Competitors

Capital Ratio
Balance Sheet as of: Sep-30-2012 Sep-30-2013
Tier 1 Capital Ratio % 12.7% 13.1%
Total Capital Ratio % 15.0% 15.3%
Leverage Ratio % 9.9% 10.1%
25Source: Capital IQ
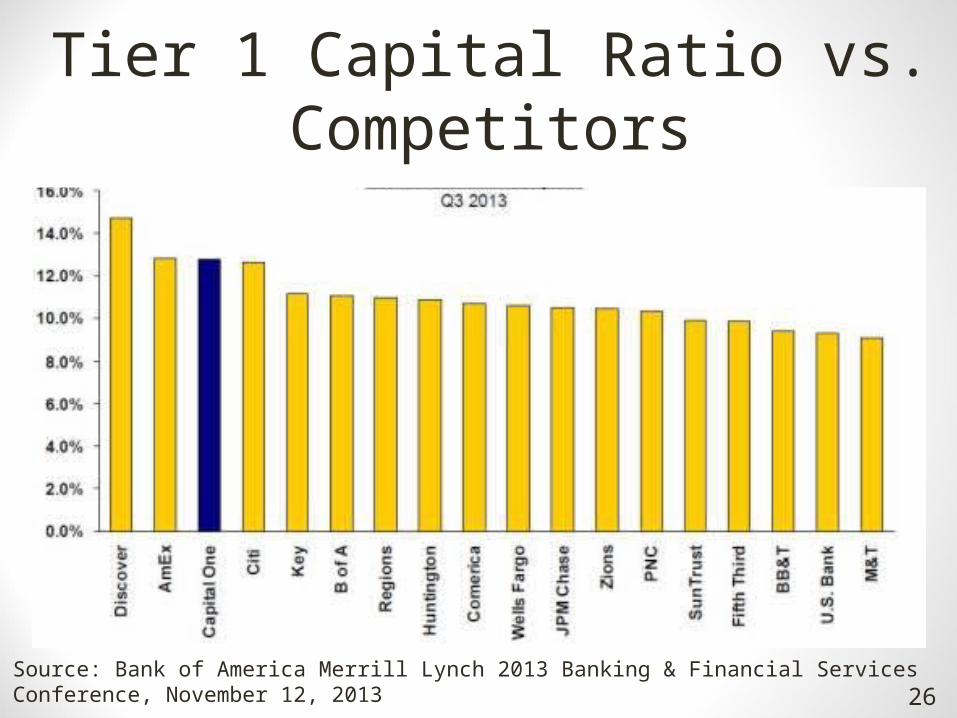
Tier 1 Capital Ratio vs. Competitors
26Source: Bank of America Merrill Lynch 2013 Banking & Financial Services Conference, November 12, 2013

Asset Quality
27Source: Capital IQ
2008 2009 2010 2011 2012Sep-30-2013
Nonperforming Loans / Total Loans %
0.8 1.4 1.0 0.8 0.5 0.5
Nonperforming Assets / Total Assets %
0.6 0.9 0.8 0.6 0.4 0.4
Nonperforming Assets / Equity %
3.6 5.8 5.8 4.2 3.2 2.8
Allow. for Credit Losses / Total Loans %
4.5 4.5 4.5 3.1 2.5 2.3
Net Charge-offs / Total Avg. Loans %
3.5 4.6 5.2 2.9 1.9 NA

Loan Loss & Write-Offs
28
Income Statement 2008 2009 2010 2011 2012 Sep-30-2013Provision For Loan Losses
5,101 4,230 3,907 2,360 4,415 3,647
Balance Sheet 2008 2009 2010 2011 2012Sep-30-
2013Gross Loans 101,342 90,767 125,947 135,892 205,889 191,814Allowance For Loan Losses
(4,524) (4,127) (5,628) (4,250) (5,156) (4,333)

Transforming Source of Funds
Source: Bank of America Merrill Lynch 2013 Banking & Financial Services Conference, November 12, 2013 29

Profitability & Margin Analysis
For the Fiscal Period Ending 2008 2009 2010 2011 2012
LTM12 months30/092013
ProfitabilityReturn on Assets % 0.1% 0.6% 1.7% 1.6% 1.4% 1.5% Margin AnalysisEBT Margin % 17.5% 17.6% 36.6% 34.2% 30.9% 35.9% Net Income Margin% (0.5%) 10.1% 22.4% 22.6% 21.5% 22.0%
30Source: Capital IQ
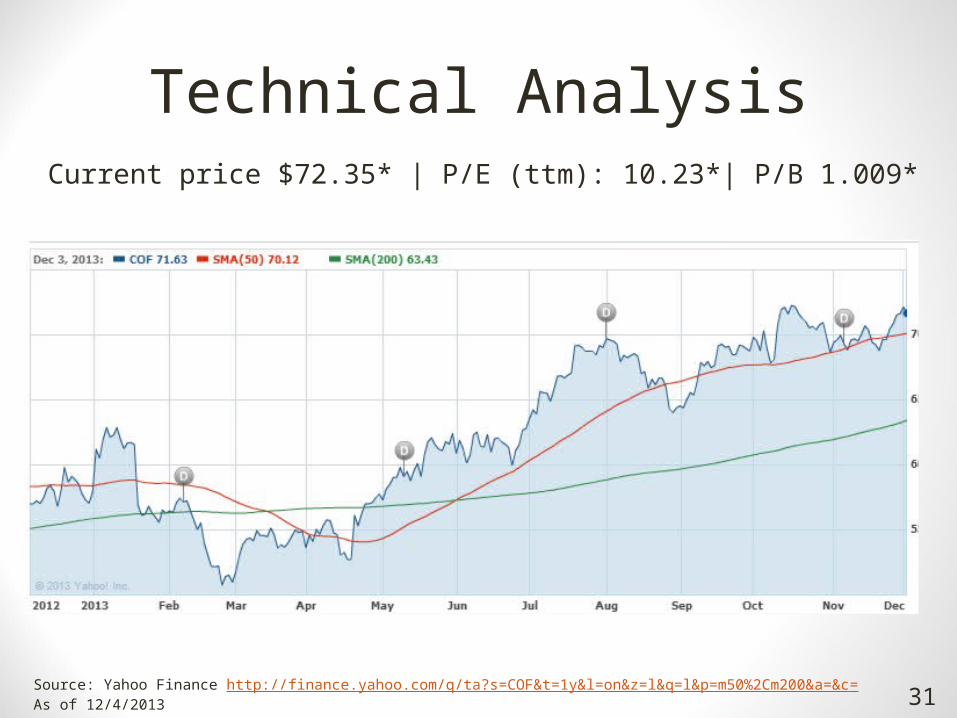
Technical AnalysisCurrent price $72.35* | P/E (ttm): 10.23*| P/B 1.009*
31Source: Yahoo Finance http://finance.yahoo.com/q/ta?s=COF&t=1y&l=on&z=l&q=l&p=m50%2Cm200&a=&c=As of 12/4/2013

COF Stock Performance vs. Competitors
32Source: Yahoo Finance http://finance.yahoo.com/q/ta?s=COF&t=1y&l=on&z=l&q=l&p=m50%2Cm200&a=&c=As of 12/4/2013

VALUATIONResidual Income, Comparable Company, Benjamin Graham
33
34
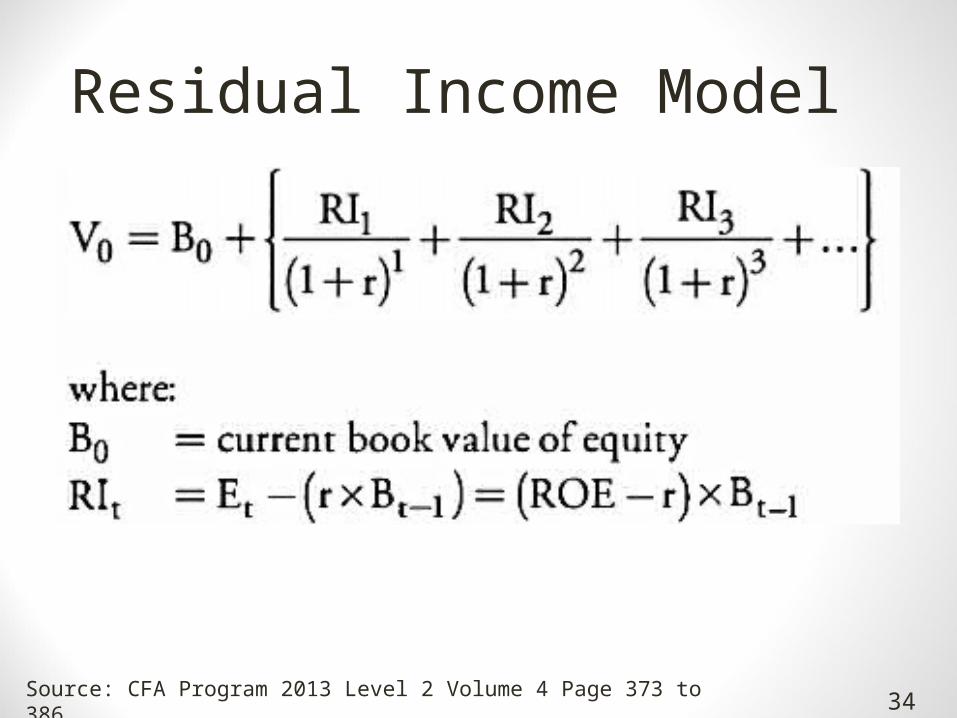
Residual Income Model
Source: CFA Program 2013 Level 2 Volume 4 Page 373 to 386
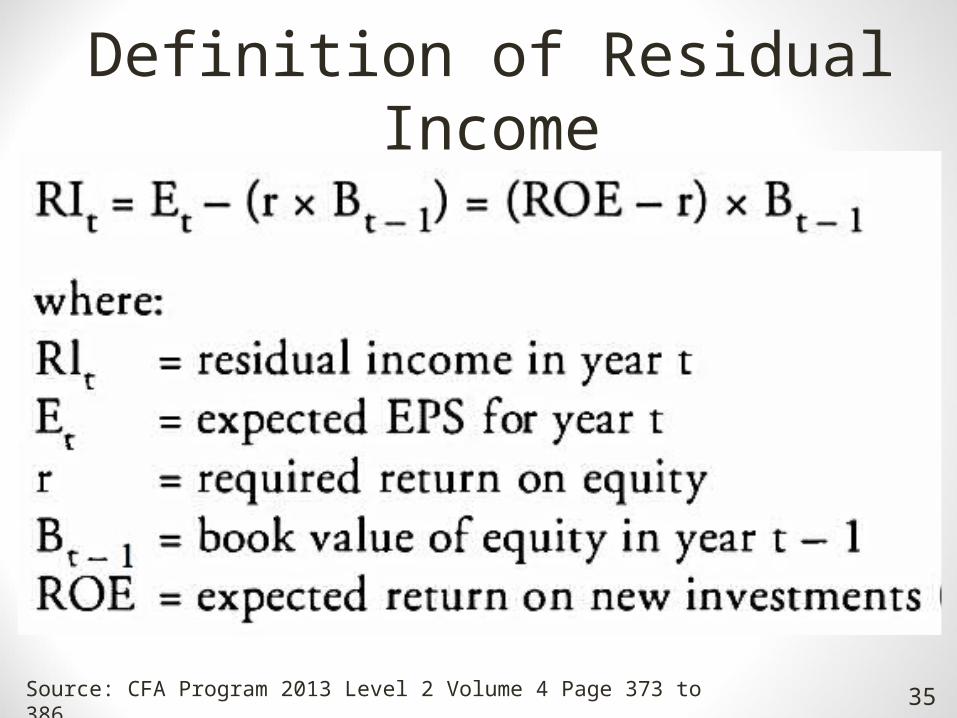
Definition of Residual Income
35Source: CFA Program 2013 Level 2 Volume 4 Page 373 to 386
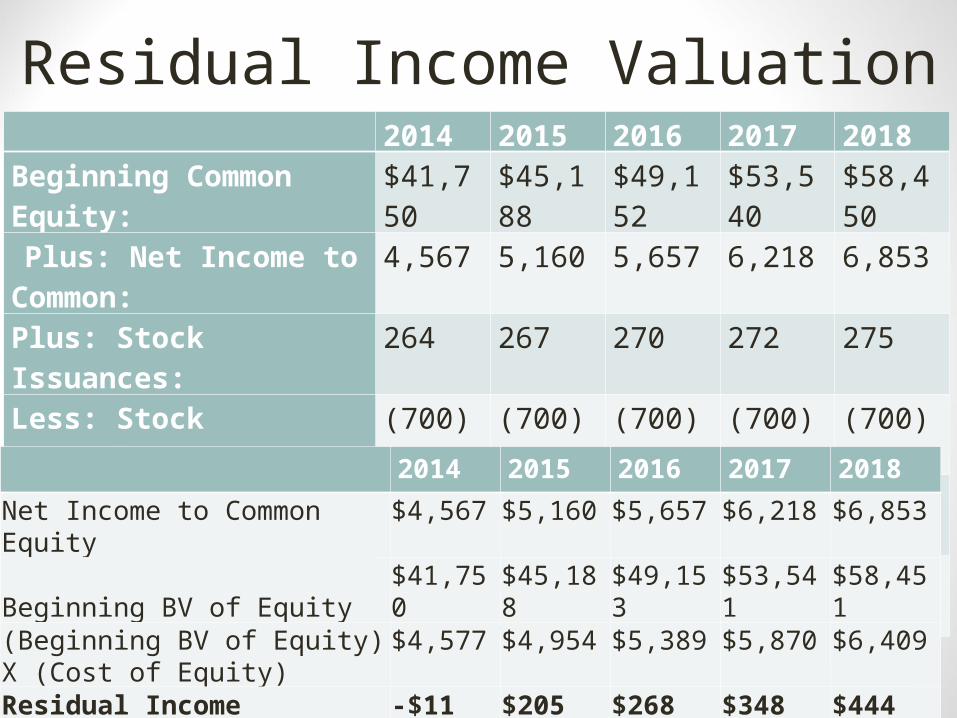
Residual Income Valuation
36
2014 2015 2016 2017 2018Beginning Common Equity: $41,750 $45,188 $49,152 $53,540 $58,450
Plus: Net Income to Common:
4,567 5,160 5,657 6,218 6,853
Plus: Stock Issuances: 264 267 270 272 275Less: Stock Repurchases: (700) (700) (700) (700) (700)Less: Common Dividends: (693) (762) (838) (880) (924)Ending Common Equity $45,188 $49,152 $53,540 $58,450 $63,954
Residual Income = (Net Income to Common Equity) – (Beginning BV of Equity) X (Cost of Equity)
2014 2015 2016 2017 2018
Net Income to Common Equity $4,567 $5,160 $5,657 $6,218 $6,853Beginning BV of Equity $41,750 $45,188 $49,153 $53,541 $58,451(Beginning BV of Equity) X (Cost of Equity)
$4,577 $4,954 $5,389 $5,870 $6,409
Residual Income -$11 $205 $268 $348 $444

Residual Income Assumptions
37
Cost of equity using CAPM
Beta 1.256Market risk premium (Rm-Rf) 6.50%10 year treasury yeild 2.80%Cost of equity using CAPM 10.964%
Current Value of Common Equity $41,750 Sum of PV of Residual Income from 2014 to 2018 $847 PV of Res. Inc. Terminal Value $2,407
Present Value of Equity $45,004 Shares Outstanding 577.4 Implied Share Price $77.94
Terminal Value CalculationTerminal NI Growth Rate 2.5%Estimated Year 6 NI to Common 7,355 Return on Common Equity - Long-Term 11.5%

Return on Equity
38Cost of Equity using CAPM 10.964%
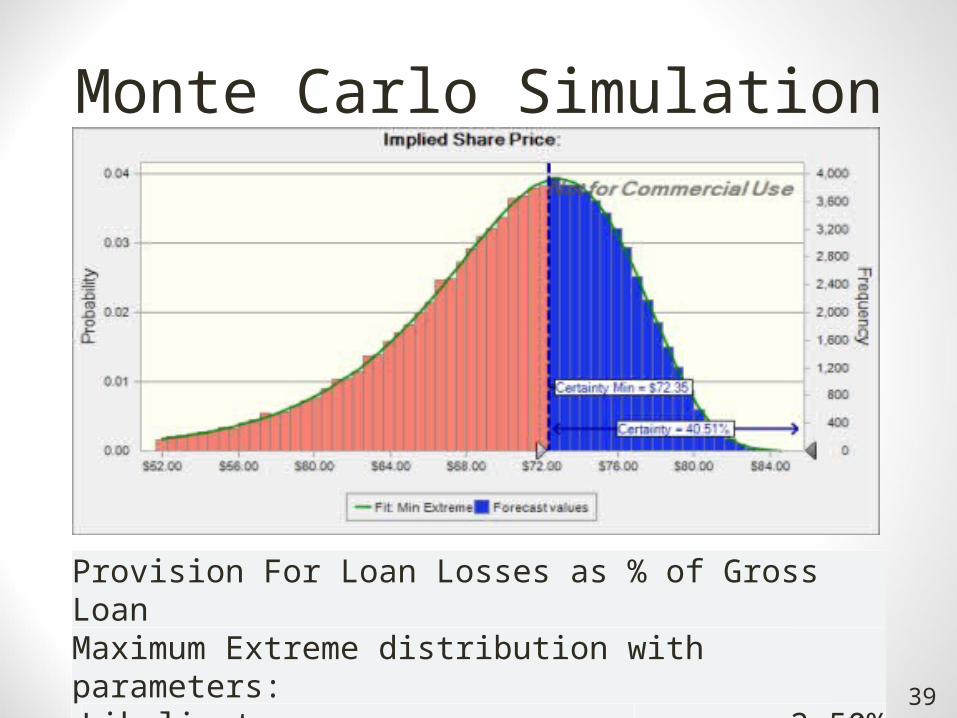
Monte Carlo Simulation
Provision For Loan Losses as % of Gross LoanMaximum Extreme distribution with parameters:Likeliest 2.50%Scale 0.50% 39
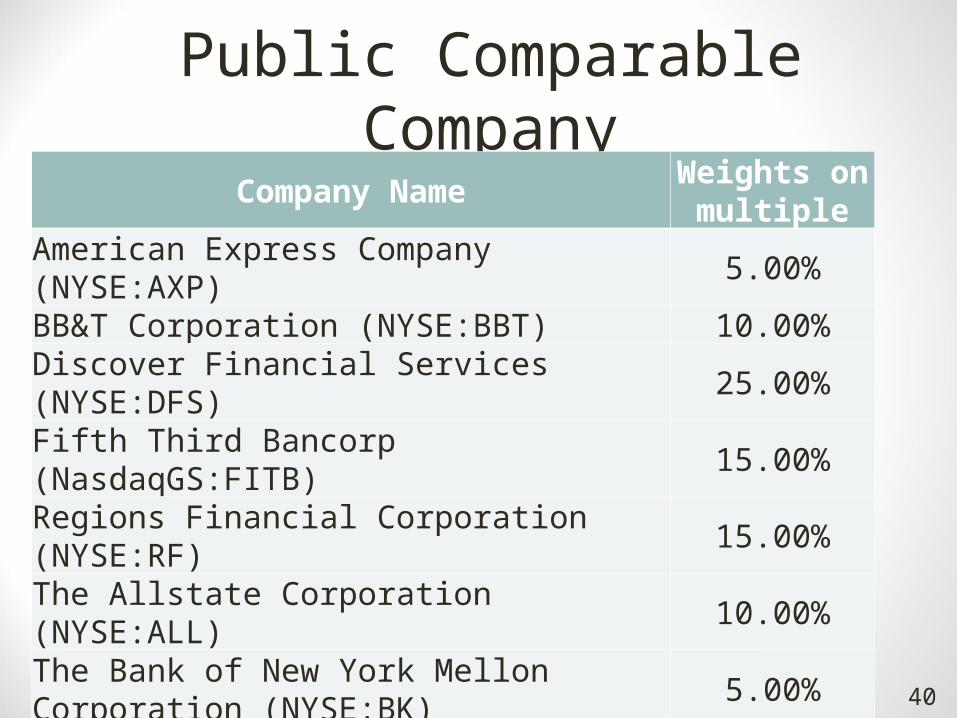
Public Comparable Company
Company Name Weights on multiple
American Express Company (NYSE:AXP) 5.00%BB&T Corporation (NYSE:BBT) 10.00%Discover Financial Services (NYSE:DFS) 25.00%Fifth Third Bancorp (NasdaqGS:FITB) 15.00%Regions Financial Corporation (NYSE:RF) 15.00%The Allstate Corporation (NYSE:ALL) 10.00%The Bank of New York Mellon Corporation (NYSE:BK) 5.00%
The PNC Financial Services Group, Inc. (NYSE:PNC) 10.00%
U.S. Bancorp (NYSE:USB) 5.00%SUM 100.0%
40
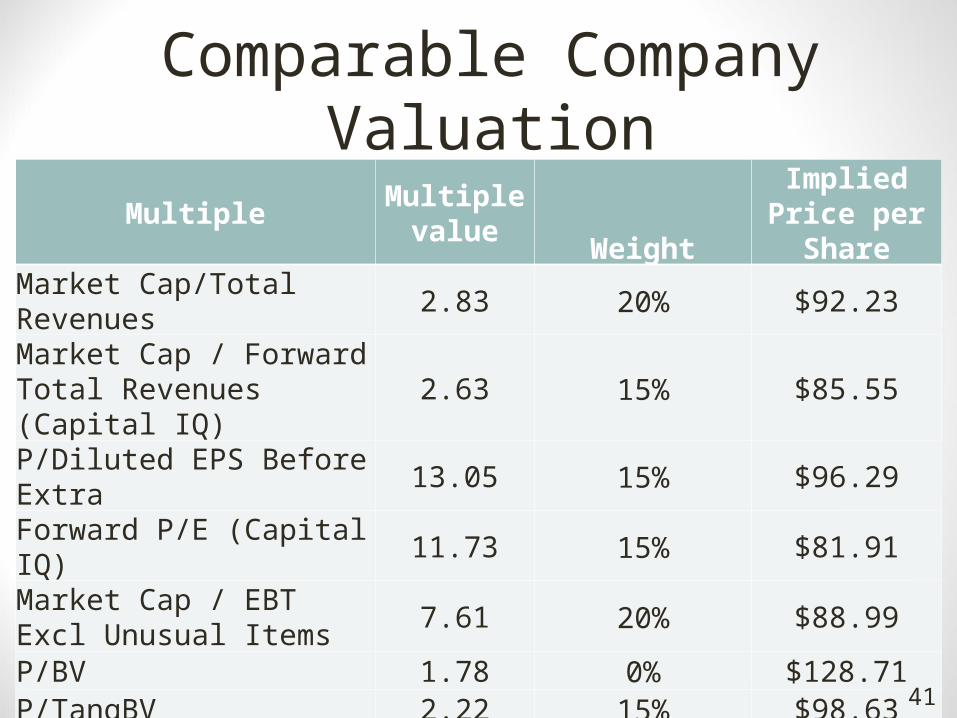
Comparable Company Valuation
Multiple Multiple value Weight
Implied Price per Share
Market Cap/Total Revenues 2.83 20% $92.23Market Cap / Forward Total Revenues (Capital IQ) 2.63 15% $85.55
P/Diluted EPS Before Extra 13.05 15% $96.29Forward P/E (Capital IQ) 11.73 15% $81.91Market Cap / EBT Excl Unusual Items 7.61 20% $88.99
P/BV 1.78 0% $128.71P/TangBV 2.22 15% $98.63Implied Price per Share $90.60
41
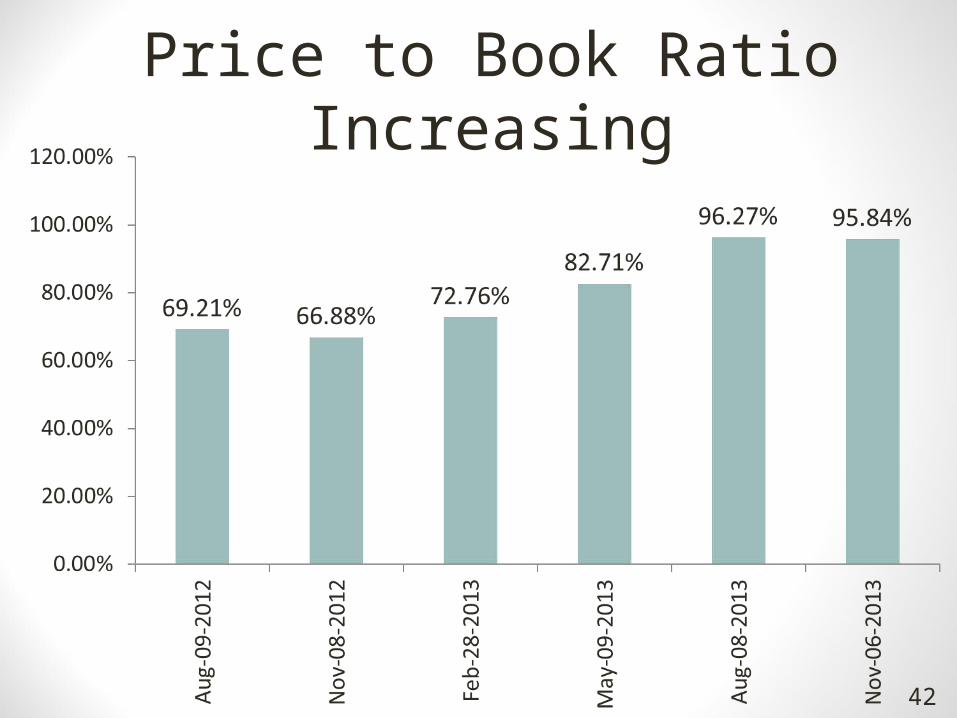
Price to Book Ratio Increasing
42

Benjamin Graham’s Formula
Current (normal earnings, $Mil.) 4,143
Expected annual growth rate (%) 2.5
Number of shares 577.4
Estimated price per share $78.92
43

Valuation Summary
Price per shareResidual Income $77.94Relative Valuation $90.60Benjamin Graham formula $78.92Current market price 12/05/2013 $72.35
44
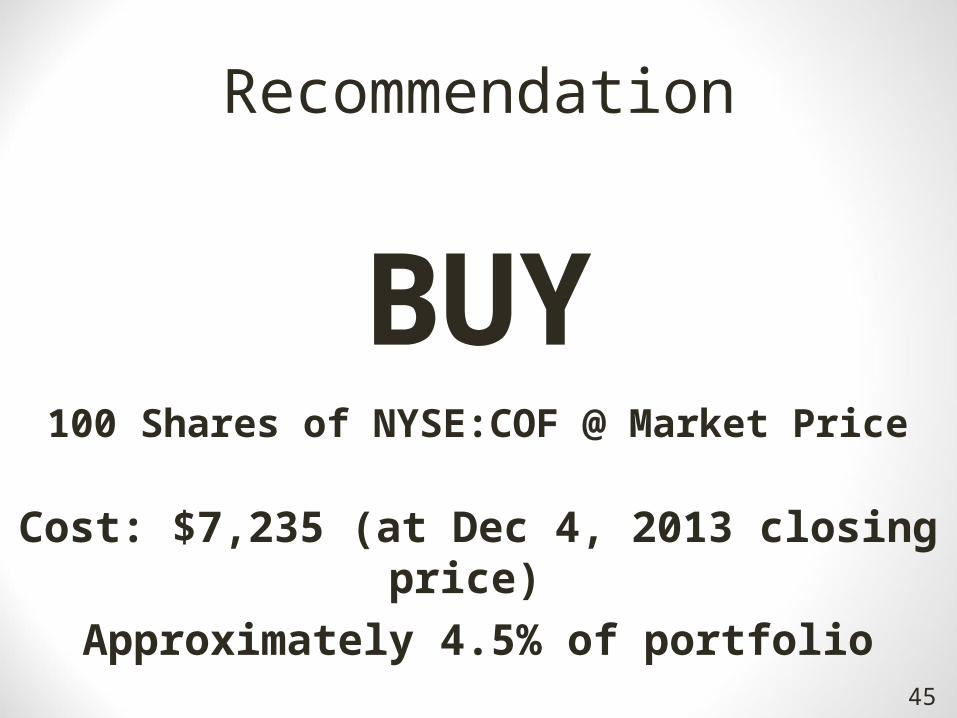
Recommendation
100 Shares of NYSE:COF @ Market Price
45
BUY
Cost: $7,235 (at Dec 4, 2013 closing price) Approximately 4.5% of portfolio