Embed Size (px)
Citation preview

Capital Metro Communication and Engagement Survey
June 2014
Canberra Office: (02) 6282 4963
www.piazzaresearch.com.au

Capital Metro Communication and Engagement Survey
2 | P a g e © P i a z z a R e s e a r c h P t y L t d 2 0 1 4
2
TABLE OF CONTENTS
BACKGROUND AND METHODOLOGY ..................................................................................................................... 3
Methodology .......................................................................................................................................................... 3
Questionnaire design ......................................................................................................................................... 3
Data collection .................................................................................................................................................... 3
Sample Design .................................................................................................................................................... 3
Data Processing and Analysis ................................................................................................................................. 4
SUMMARY OF MAIN FINDINGS .............................................................................................................................. 5
FUTURE CHALLENGES ............................................................................................................................................. 7
BRAND/COMMUNICATIONS ................................................................................................................................... 8
CONSULTATION/CHANNELS ................................................................................................................................. 11
BENEFITS ............................................................................................................................................................... 13
MESSAGES ............................................................................................................................................................ 19
USE OF PUBLIC TRANSPORT ................................................................................................................................. 21
CONCEPTUAL OPTION .......................................................................................................................................... 24
INFLUENCERS / SUBJECTIVE NORMS .................................................................................................................... 24
SUPPORT ............................................................................................................................................................... 25
DEMOGRAPHICS ................................................................................................................................................... 30

Capital Metro Communication and Engagement Survey
3 | P a g e © P i a z z a R e s e a r c h P t y L t d 2 0 1 4
BACKGROUND AND METHODOLOGY
The ACT Government Capital Metro Agency is in the process of planning and improving community communication and consultation strategies regarding the Capital Metro light rail system. Piazza Research (a local quality certified market and social research firm) was selected to conduct community research to inform and support the communication activities of the Capital Metro Agency.
The research involved a two-stage process including focus groups of various demographic categories across Canberra and a quantitative telephone survey of residents. Many issues were explored including understanding the views of Canberra residents regarding future challenges for Canberra, the level of awareness and support for the Capital metro project, as well as the community’s perceptions of the project’s benefits and their concerns.
This report shows the findings of the quantitative telephone survey of Canberra residents conducted in June 2014.
Methodology
A telephone survey of Canberra residents was conducted as this method provided results which were most representative of the ACT population overall.
Questionnaire design
The survey questions were developed using insights gained from the Stage 1 focus groups, input from the Capital Metro Agency management team and input from Piazza Research project consultants. The survey was designed to be succinct to minimise respondent burden and could be administered by telephone in 8 to 11 minutes. Most questions were ‘closed’ (or tick-box) format. Lists of issues presented (when asking for importance ratings from the community) were asked in randomised order to prevent any question order bias in results.
Data collection
Data collection was conducted between the 10th and 24th June 2014 by trained research interviewers. A Computer Assisted Telephone Interviewing (CATI) system was used and quality control checks were conducted by data collection team supervisors.
Sample Design
List assisted random digit dialling was used to achieve a random sample of adult residents across the ACT.
A total of 1,192 responses were achieved. For the 95% confidence interval, overall results to this survey are calculated to be accurate to within +/- 2.9% margin of error.
Quality Assurance System – This project complies with the ISO 20252 Market, Opinion and Social Research Standard.
Capital Metro Communication and Engagement Survey
4 | P a g e © P i a z z a R e s e a r c h P t y L t d 2 0 1 4
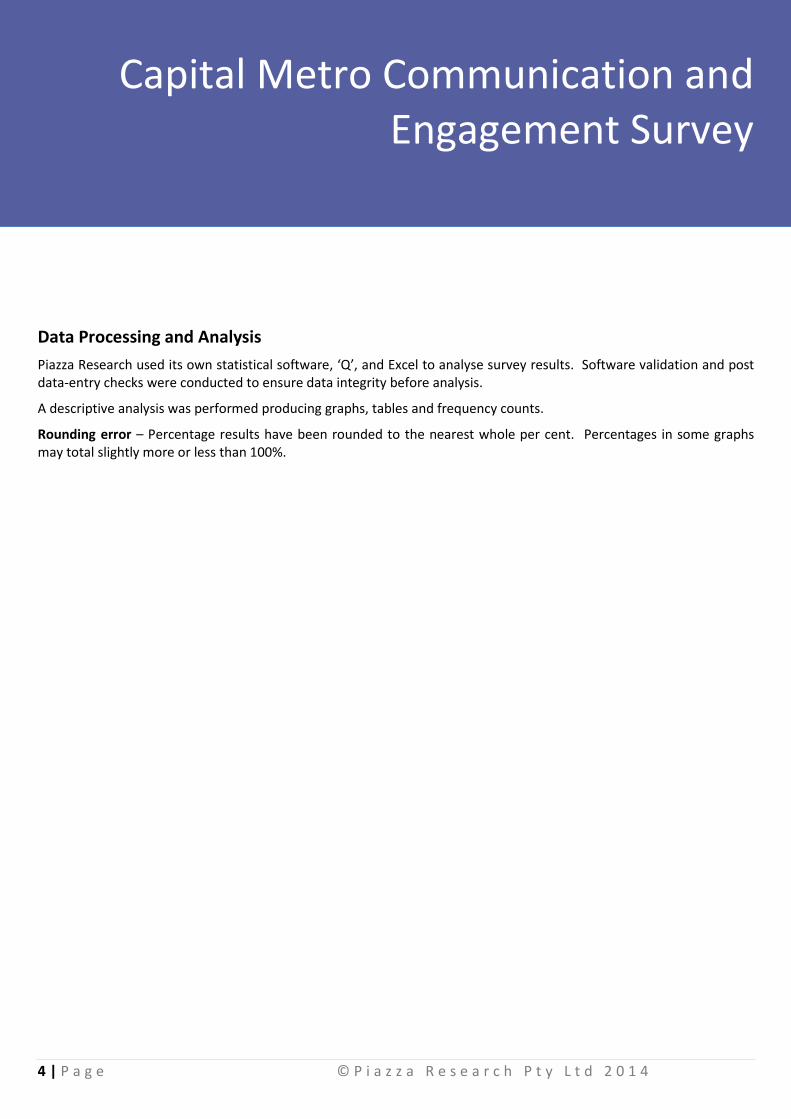
Data Processing and Analysis
Piazza Research used its own statistical software, ‘Q’, and Excel to analyse survey results. Software validation and post data-entry checks were conducted to ensure data integrity before analysis.
A descriptive analysis was performed producing graphs, tables and frequency counts.
Rounding error – Percentage results have been rounded to the nearest whole per cent. Percentages in some graphs may total slightly more or less than 100%.

Capital Metro Communication and Engagement Survey
5 | P a g e © P i a z z a R e s e a r c h P t y L t d 2 0 1 4
SUMMARY OF MAIN FINDINGS
Level of public support – The majority (55%) of Canberra residents support the ACT Government plans to develop the Capital Metro light rail system for Canberra; 34% do not and 11% are undecided. Of the 34% who do not support the project, the cost of the system for the perceived benefits gained was the main reason for withholding support (52%), followed by their belief that there are alternative ways to improve public transport (e.g. improve bus services). Overall, the older people are the less likely they are to support the Capital Metro, although the majority across all age groups (apart from those aged 65 and above) are supportive. One-parent households with dependent children and couples with dependent children and are more supportive (70% and 65%) than those living in other household arrangements. Males are a little more likely to support the Capital Metro project (59%) than females (51%).
Perceived future challenges – For the Canberra community, the three most important future challenges for Government to take action to address were; improving the healthcare system and hospitals, creating more local jobs and improving public education. Improving public transport was equal fourth-most important (with housing affordability).
Awareness of the Capital Metro brand – 80% of respondents did not know the Capital Metro brand.
Awareness of the light rail concept - 96% were aware of what light rail was and most residents (86%) believed they knew the proposed route of the light rail project.
Community perceptions about Government motivation for light rail investment – Just over half of Canberra residents believe that the ACT Government is investing in light rail to upgrade and improve transport options and to reduce traffic congestion (53%). 10% believe the decision to pursue light rail is for political reasons only. Those who do not support the project are substantially more likely than supporters to be unsure of the Government’s reason for investing in light rail, or believe that the decision to invest is based on political reasons.
Useful communication / consultation channels - Television and radio, community newspapers and magazines, establishing an interactive website where residents can leave their comments and ideas for Government, and providing information with energy bills were considered the four most useful communication channels. Social media was not considered very useful by respondents for communicating information about the Capital Metro. A breakdown by non-supporters of the project shows they consider all communication channels to be less useful than supporters.
Perceived benefits of the Capital Metro – The majority of residents (51% to 69%) believed most of the potential benefits presented to them about the Capital Metro were real benefits. These included the benefits of; a more effective and reliable public transport system through integrating with ACTION Busses, an upgraded Northbourne Avenue, boosting the local economy and creating jobs and encouraging investment, and reducing car dependency. It is notable that there were substantial proportions who disagreed that these were real benefits (22% to 37%). Aspects less likely to be considered real benefits included; helping the city grow in a more compact and sustainable way, and that light rail will support a shift towards a healthier lifestyle. A

Capital Metro Communication and Engagement Survey
6 | P a g e © P i a z z a R e s e a r c h P t y L t d 2 0 1 4
breakdown of results shows that non-supporters of the project are substantially less likely to agree that there are any benefits to the Capital Metro project.
Community concerns – The cost of the system for the perceived benefits gained was by far the most common concern for the Canberra community (54%). The limited route of the Capital Metro was the second most common concern (12%). Non-supporters are substantially more likely (71%) than supporters (44%) to be concerned about the cost and affordability of the project.
Northbourne Avenue Trees – Most residents support the approach of replacing the current trees with new and longer lasting trees during the Capital Metro construction phase (69%); 22% do not and 9% are uncertain. A breakdown of results by supporters and non-supporters of the Capital metro shows non-supporters are less likely to support the approach to Northbourne Avenue trees (39%) compared to supporters (87%).
Most appealing communication messages – ‘Supporting jobs’, ‘An environmentally friendly transport system’, and ‘A better public transport system’ were the three most appealing messages to the community regarding the Capital Metro. Non-supporters and supporters had similar overall preferences for key messages.
Current use of public transport – 83% of residents drive to commute and travel around Canberra; 11% use public busses. The majority (57%) believed they would be more likely to use public transport if it involved a light rail system which was accessible to them. A strong trend is evident showing that the older people are, the less likely they are to report being encouraged to use public transport if it involved an accessible light rail system. Overall though, the majority of all age groups (other than those aged 65 and above) would be more likely to use public transport if it included light rail. The majority of all household types agreed overall, while couples with dependent children and group households without children are more likely than the other household types to be encouraged to use public transport if light rail was involved. The majority of residents in most Canberra suburbs report being more likely to use public transport if it involved an accessible light rail system. Suburbs having a majority of residents who are unsure or report they would not be more likely to use public transport if it involved a light rail system were mostly south of State Circle or near the industrial zone of Fyshwick.
Influencers – The highest proportion (46%) of residents believed their family and friends supported a new light rail system for Canberra. A substantial proportion (31%) did not.

Capital Metro Communication and Engagement Survey
7 | P a g e © P i a z z a R e s e a r c h P t y L t d 2 0 1 4
DETAILED RESULTS
FUTURE CHALLENGES
Q1. I’m going to read out a list of challenges that Canberra as a city might face in the future. On a scale of 0 = not at all important to 10 = extremely important; Can you please tell me how important it is for the ACT government to take action to address each challenge?
n = 1192, base max = 1186, base min = 1105
The Canberra community believed that most of the issues presented were at least somewhat important for the ACT Government to take improvement action on. In order of highest average importance score, the three most important future issues to respondents were; improving the healthcare system and hospitals, creating more local jobs and improving public education. Improving public transport was equal fourth-most important (with housing affordability) on a list of 11 future challenges presented.
5.8
6.5
6.8
7.0
7.3
7.3
7.4
7.4
7.6
7.9
8.2
0.0 1.0 2.0 3.0 4.0 5.0 6.0 7.0 8.0 9.0 10.0
Reduce the urban sprawl in Canberra
Prevent or reduce road congestion
Take action to address climate change
Maintain an attractive and entertaining Canberra
Diversify Canberra’s economy so it doesn’t rely so much on the Federal Government
Reduce householders’ living expenses
Improve public transport
Housing affordability
Improvements to public education
Create more local jobs
Improve the healthcare system and hospitals

Capital Metro Communication and Engagement Survey
8 | P a g e © P i a z z a R e s e a r c h P t y L t d 2 0 1 4
BRAND/COMMUNICATIONS
Q2. Do you know what light rail is?
N = 1192, base = 1190
Almost all respondents (96%) knew what light-rail was; only 4% did not.
Q3. Can you tell me what the name of the light rail project is?
n = 1192, base = 1191
Eighty percent (80%) of respondents did not know the correct name for the Capital Metro or answered incorrectly; 20% knew the project’s name.
96% 3% 1%
0% 10% 20% 30% 40% 50% 60% 70% 80% 90% 100%
Yes No Unsure
20% 80%
0% 10% 20% 30% 40% 50% 60% 70% 80% 90% 100%
Correct Incorrect or don't know

Capital Metro Communication and Engagement Survey
9 | P a g e © P i a z z a R e s e a r c h P t y L t d 2 0 1 4
Q4. Do you know where the light rail is going?
n = 1192, base = 1191
Most survey respondents believed they knew the proposed route of the Capital Metro (86%); 15% did not or were unsure.
Q5. Why do you think the Government is investing in light rail?
n = 1192, base = 1159
Overall 53% of Canberran’s believe the Government is investing in light rail to upgrade and improve transport options (32%) or to reduce traffic congestions (21%). Fifteen percent (13%) are unsure why and 10% consider the project is primarily for political reasons (commonly mentioning the Government’s association with the Greens).
86% 13% 2%
0% 10% 20% 30% 40% 50% 60% 70% 80% 90% 100%
Yes No Neither
3%
3%
3%
3%
5%
6%
10%
13%
21%
32%
0% 5% 10% 15% 20% 25% 30% 35%
Environmental issues.
Monetary reasons.
Improve infrastructure and create jobs.
General supporting comments.
General non-supporting comments.
Planning for the future.
Political reasons (incl association with Green Party)
Unsure
Reduce road traffic congestion.
To upgrade and improve transport options.

Capital Metro Communication and Engagement Survey
10 | P a g e © P i a z z a R e s e a r c h P t y L t d 2 0 1 4
Q5. Breakdown by supporters and non-supporters
n = 1192, base = 1158
A breakdown of this question shows a clear difference between those who support light rail and those who do not. Non-supporters have a high proportion that were unsure about why the Government was investing in light rail (21%) and a relatively high proportion who believed that the decision to invest in light rail was based on political reasons (20%). In contrast, supporters are much more likely to believe that the Government’s motivation to invest in light rail is to upgrade and improve transport options (40%) and to reduce road traffic congestion (27%).
40%
4%
27%
8%
6%
4%
2%
4%
1%
4%
22%
20%
12%
3%
21%
2%
4%
2%
13%
3%
0% 10% 20% 30% 40% 50%
To upgrade and improve transportoptions.
Political reasons (incl association withGreen Party)
Reduce road traffic congestion.
Planning for the future.
Unsure
Environmental issues.
Monetary reasons.
Improve infrastructure and create jobs.
General non-supporting comments.
General supporting comments.
supporter
non-supporters

Capital Metro Communication and Engagement Survey
11 | P a g e © P i a z z a R e s e a r c h P t y L t d 2 0 1 4
CONSULTATION/CHANNELS
Q6. I’m going to read out a list of different ways the ACT Government could communicate with you about the Capital Metro. On a scale of 0 = not at all useful to 10 = extremely useful, can you tell me how useful each of these ways would be to communicate information to you.
Base = 1192, max = 1176, min = 1094
Television and radio, community newspapers and magazines, establishing an interactive website where Canberrans can leave their comments and ideas for Government, and providing information with energy bills were considered the four most useful communication channels.
Social media, billboards in public locations and the Capital Metro website were considered the three least useful communication channels by respondents.
4.8
4.9
4.9
5.0
5.0
5.2
5.6
5.7
5.9
6.3
0.0 1.0 2.0 3.0 4.0 5.0 6.0 7.0 8.0 9.0 10.0
The Capital Metro website
Billboards in public locations
Social media (Facebook, twitter, online discussion groupsetc.)
Public meetings and forums held throughout Canberra
Talking face-to-face with Capital Metro staff at shoppingmalls in a display about the project?
Brochures delivered to your home
Information provided with your energy bills
An interactive website where you can leave your commentsand ideas for government
Community newspapers and magazines
Television and radio

Capital Metro Communication and Engagement Survey
12 | P a g e © P i a z z a R e s e a r c h P t y L t d 2 0 1 4
Q6. Breakdown by supporters and non-supporters
Base = 1192, max = 1175, min = 1093
Non-supporters generally viewed all communication channels for communicating information regarding the Capital Metro as less useful than supporters.
5.5
5.5
5.7
5.5
5.6
5.7
6.1
6.3
6.4
6.8
3.8
4.0
3.8
4.2
4.1
4.3
4.8
4.8
5.3
5.5
0.0 2.0 4.0 6.0 8.0
The Capital Metro website
Billboards in public locations
Social media (Facebook, twitter, onlinediscussion groups etc.)
Public meetings and forums heldthroughout Canberra
Talking face-to-face with Capital Metrostaff at shopping malls in a display about
the project?
Brochures delivered to your home
Information provided with your energybills
An interactive website where you canleave your comments and ideas for
government
Community newspapers and magazines
Television and radio
non-supporters
supporters

Capital Metro Communication and Engagement Survey
13 | P a g e © P i a z z a R e s e a r c h P t y L t d 2 0 1 4
BENEFITS
Respondents were asked to agree or disagree about whether they believed a list of potential benefits of the Capital Metro were real.
Q7. A more effective and reliable public transport system through integration with ACTION buses.
n = 1192, base = 1191
Sixty-two percent (63%) of respondents agreed the Capital Metro would provide a more effective and reliable public transport system; a quarter 25% disagreed.
Q8. Light rail will help to upgrade and uplift Northbourne Avenue
n = 1192, base = 1188
The majority (51%) believed light-rail would help to upgrade and uplift Northbourne Avenue, although a substantial proportion disagree (37%).
63% 25% 12%
0% 10% 20% 30% 40% 50% 60% 70% 80% 90% 100%
Agree Disagree Unsure
51% 37% 12%
0% 10% 20% 30% 40% 50% 60% 70% 80% 90% 100%
Agree Disagree Unsure

Capital Metro Communication and Engagement Survey
14 | P a g e © P i a z z a R e s e a r c h P t y L t d 2 0 1 4
Q9. The building of a light rail system in Canberra will boost the local economy by creating thousands of jobs and encouraging investment.
n = 1192, base = 1190
Fifty-three percent (52%) of respondents think building a light rail system will create jobs and boost the local economy; 33% disagree.
Q10. Light rail will support a reduction in car dependency
n = 1192, base = 1192
Most Canberran’s (51%) believe light-rail will reduce car dependency however 37% disagree.
52% 33% 15%
0% 10% 20% 30% 40% 50% 60% 70% 80% 90% 100%
Agree Disagree Unsure
51% 37% 13%
0% 10% 20% 30% 40% 50% 60% 70% 80% 90% 100%
Agree Disagree Unsure

Capital Metro Communication and Engagement Survey
15 | P a g e © P i a z z a R e s e a r c h P t y L t d 2 0 1 4
Q11. Light rail will help the city to grow in a more compact and sustainable way.
n = 1192, base = 1188
While the largest proportion (47%) of respondents think light rail will help the city to grow sustainably, a similar (slightly smaller proportion) disagree (40%).
Q12. Light rail will support a shift towards a healthier lifestyle, i.e. people walking to and from the stops.
n = 1192, base = 1186
Most people (46%) disagreed that light rail would support a shift towards a healthier lifestyle; (38%) agreed.
47% 40% 13%
0% 10% 20% 30% 40% 50% 60% 70% 80% 90% 100%
Agree Disagree Unsure
38% 46% 15%
0% 10% 20% 30% 40% 50% 60% 70% 80% 90% 100%
Agree Disagree Unsure

Capital Metro Communication and Engagement Survey
16 | P a g e © P i a z z a R e s e a r c h P t y L t d 2 0 1 4
Q13. What aspect of the light rail project is of concern for you? (open-ended question)
n = 1192, base = 871
The cost and affordability of the system was by far the most common concern about a light rail system, with more than half of respondents (54%) identifying this as a concern. Limited availability of the route to the current corridor was the next most commonly cited project concern (12%). There are also 15% of people who have no concern.
2%
2%
2%
3%
3%
3%
3%
12%
15%
54%
0% 10% 20% 30% 40% 50% 60%
Lack of demand and useage
Environmental concerns and impact on Northbourne Avenue
Lack of information
Infrastructure concerns and impact on existing transport
Construction time and disruption concerns
Perceived as not needed and with no benefits
Miscellaneous comments
Restricted / Limited route choice
No concerns
Cost / Affordability for perceived benefits

Capital Metro Communication and Engagement Survey
17 | P a g e © P i a z z a R e s e a r c h P t y L t d 2 0 1 4
Q13. Breakdown by supporters and non-supporters
n = 1192, base = 870
Non-supporters are substantially more likely (71%) than supporters (44%) to be concerned about the cost and affordability of the project. Supporters’ second-most common concern was the restricted route options for the Capital Metro.
44%
14%
23%
3%
2%
3%
3%
3%
1%
4%
71%
8%
2%
3%
4%
1%
2%
2%
6%
2%
0% 20% 40% 60% 80%
Cost, affordability and perceived benefits
Limited availability and route choice
No concerns
Construction time and disruptionconcerns
Lack of demand and useage
Lack of information
Infrastructure concerns and impact onexisting transport
Environmental concerns and impact onNorthbourne Avenue
Perceived as not needed and with nobenefits
Miscellaneous comments
supporters
non-supporters

Capital Metro Communication and Engagement Survey
18 | P a g e © P i a z z a R e s e a r c h P t y L t d 2 0 1 4
Q14. The current trees along Northbourne Avenue are reducing in number due to poor health and weather impact. Building light rail along Northbourne Ave may mean replacing the current trees with new and longer lasting trees. Do you support this approach?
n = 1192, base = 1190
Seventy percent (69%) of Canberran’s support replacing the current trees along Northbourne Avenue with longer lasting trees as part of the light rail construction. Twenty one per cent (22%) do not support this approach.
Breakdown by supporters and non-supporters (Q8 to Q12 and Q14 ): Perceived benefits of light rail
n = 1192, max= 1190, min = 1185
Non-supporters are much less likely to see any benefits of having a light rail system in Canberra.
69% 22% 9%
0% 10% 20% 30% 40% 50% 60% 70% 80% 90% 100%
Yes No Unsure
88%
78%
76%
75%
72%
58%
87%
25%
13%
18%
15%
12%
11%
39%
0% 20% 40% 60% 80% 100%
Q7. More effective, reliable transportsystem
Q8. Will help to upgrade NorthbourneAve
Q9. Will boost economy - jobs andinvestment
Q10. Support reduction in cardependency
Q11. Help city grow in compactsustainable way
Q12. Support shift towards healthierlifestyle
Q14. Support Northbourne Ave treesapproach
supporters
non-supporters

Capital Metro Communication and Engagement Survey
19 | P a g e © P i a z z a R e s e a r c h P t y L t d 2 0 1 4
MESSAGES
Q15. On a scale of 0 = not at all appealing to 10 = extremely appealing, can you tell me how appealing each of these messages about the Capital Metro is to you.
n = 1192, max = 1175, min = 1099
Of the messages tested, those considered most appealing were: ‘Supporting jobs’, ‘An environmentally friendly transport system’, and ‘A better public transport system’.
4.9
5.1
5.2
5.3
5.4
5.4
5.7
5.9
5.9
0.0 1.0 2.0 3.0 4.0 5.0 6.0 7.0 8.0 9.0 10.0
Encouraging smarter land use
Building a better entryway to Canberra
A cost effective transport solution
Economic Stimulus
Rejuvenating the city
Connecting Canberra
A better public transport system
An environmentally friendly transport system
Supporting jobs

Capital Metro Communication and Engagement Survey
20 | P a g e © P i a z z a R e s e a r c h P t y L t d 2 0 1 4
Q15. Breakdown by supporters and non-supporters
n = 1192, max = 1174, min = 1098
Non-supporters were substantially negative about any of the proposed messages regarding the Capital Metro. In relative terms though, the three messages most important to this group were ‘A better public transport system’, ‘An environmentally friendly transport system’, and ‘Supporting Jobs’.
6.0
6.4
6.5
6.6
6.7
6.8
7.0
7.1
7.2
3.1
3.0
2.8
3.5
3.2
3.1
3.3
4.0
4.1
0.0 2.0 4.0 6.0 8.0
Encouraging smarter land use
Building a better entryway to Canberra
Economic Stimulus
A cost effective transport solution
Rejuvenating the city
Connecting Canberra
Supporting jobs
An environmentally friendly transportsystem
A better public transport system
non-supporters
supporters

Capital Metro Communication and Engagement Survey
21 | P a g e © P i a z z a R e s e a r c h P t y L t d 2 0 1 4
USE OF PUBLIC TRANSPORT
Q16. How would you mostly get to work (or travel around Canberra if you don’t work)?
n = 1192, base = 1176
Eighty-five percent (83%) of people drive to travel around Canberra; 11% take busses.
Q17. Would you be more likely to use public transport if it involved a light rail system within easy walking distance or was accessible via other means?
Overall
n = 1192, base = 1187
The majority (57%) of respondents believe they would be more likely to use public transport if it involved a light rail system within easy walking distance or was accessible via other means. A substantial proportion though (34%) did not believe this would make them more likely to use public transport.
2% 3% 83% 11% 1%
0% 10% 20% 30% 40% 50% 60% 70% 80% 90% 100%
Walk Cycle Drive Take a bus Take a taxi
57% 34% 9%
0% 10% 20% 30% 40% 50% 60% 70% 80% 90% 100%
Yes No Unsure
Capital Metro Communication and Engagement Survey
22 | P a g e © P i a z z a R e s e a r c h P t y L t d 2 0 1 4
Q17 Breakdown: by Age
n = 1192, base = 1180
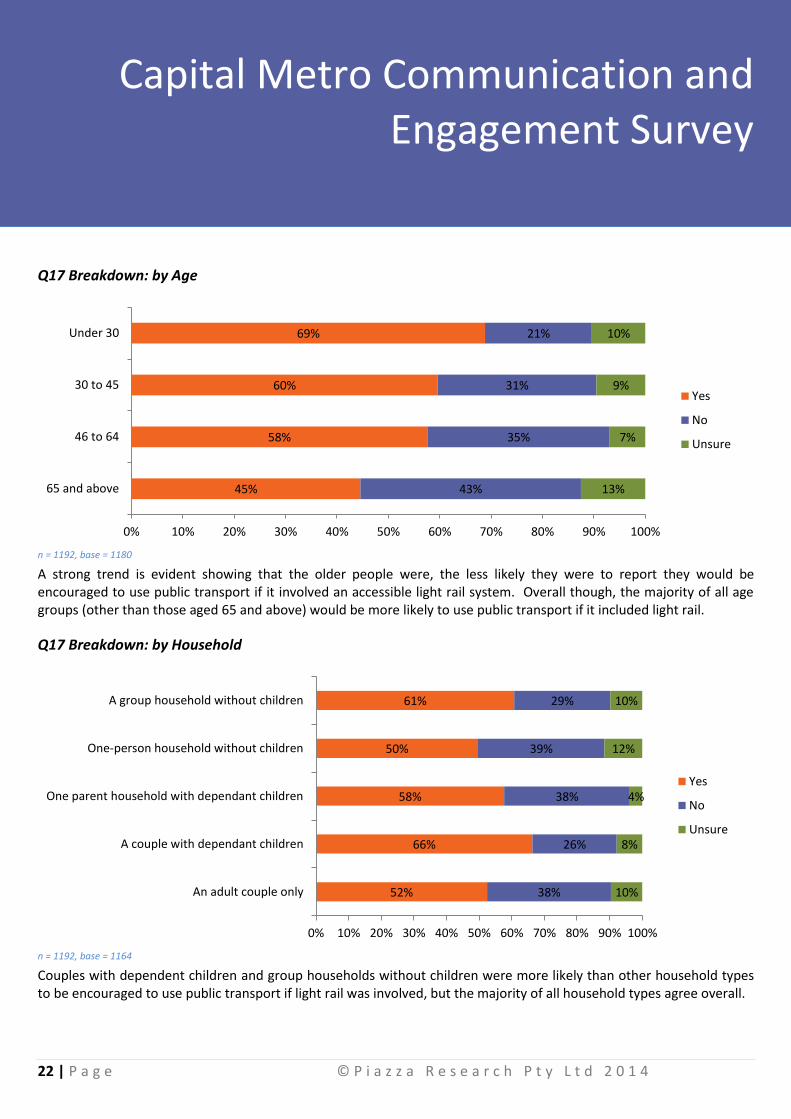
A strong trend is evident showing that the older people were, the less likely they were to report they would be encouraged to use public transport if it involved an accessible light rail system. Overall though, the majority of all age groups (other than those aged 65 and above) would be more likely to use public transport if it included light rail.
Q17 Breakdown: by Household
n = 1192, base = 1164
Couples with dependent children and group households without children were more likely than other household types to be encouraged to use public transport if light rail was involved, but the majority of all household types agree overall.
45%
58%
60%
69%
43%
35%
31%
21%
13%
7%
9%
10%
0% 10% 20% 30% 40% 50% 60% 70% 80% 90% 100%
65 and above
46 to 64
30 to 45
Under 30
Yes
No
Unsure
52%
66%
58%
50%
61%
38%
26%
38%
39%
29%
10%
8%
4%
12%
10%
0% 10% 20% 30% 40% 50% 60% 70% 80% 90% 100%
An adult couple only
A couple with dependant children
One parent household with dependant children
One-person household without children
A group household without children
Yes
No
Unsure

Capital Metro Communication and Engagement Survey
23 | P a g e © P i a z z a R e s e a r c h P t y L t d 2 0 1 4
Q17. Thematic map of postcodes of suburbs where the majority of residents would be more likely to use public transport if it involved an accessible light rail system.
n = 1192, base = 1186
The majority of residents in most Canberra suburbs report being more likely to use public transport if it involved an accessible light rail system. Suburbs having a majority of residents who are unsure or report they would not be more likely to use public transport were mostly south of State Circle or near the industrial zone of Fyshwick.

Capital Metro Communication and Engagement Survey
24 | P a g e © P i a z z a R e s e a r c h P t y L t d 2 0 1 4
CONCEPTUAL OPTION
Q18. Would you support extra money being spent on a light rail system rather than buses if you knew there would be more long-term benefits for Canberra e.g. cleaner environment, better access and more jobs and investment?
Overall
n = 1192, base = 1188
Assuming a light rail system would provide more long-term benefits for Canberra, 48% of respondents supported spending extra money on the light-rail system. A large proportion (although smaller) supported spending on buses rather than light rail (38%).
INFLUENCERS / SUBJECTIVE NORMS
Q19. Do you think your family and friends would want a new light rail system for Canberra?
Overall
n = 1192, base = 1189
The highest proportion (46%) of respondents believed their family and friends would want a new light-rail system for Canberra, although 31% do not. Just over a fifth (21%) were unsure about their friends’ and families’ views.
38% 48% 14%
0% 10% 20% 30% 40% 50% 60% 70% 80% 90% 100%
Spend on Busses Spend on Light Rail Unsure
46% 31% 23%
0% 10% 20% 30% 40% 50% 60% 70% 80% 90% 100%
Yes No Unsure

Capital Metro Communication and Engagement Survey
25 | P a g e © P i a z z a R e s e a r c h P t y L t d 2 0 1 4
Q19 Breakdown: by Age
n = 1192, base = 1182
Those under 30 years of age are more likely to believe that their friends and family would want a new light rail system for Canberra, while people aged 65 and over are least likely to believe this.
SUPPORT
Q20. Do you support the ACT Government plans to develop the Capital Metro light rail system for Canberra?
Overall
n = 1192, base = 1191
The majority (55%) of Canberra residents support the ACT Government plans to develop the Capital Metro light rail system for Canberra; 34% do not and 11% are undecided.
29%
47%
48%
75%
42%
34%
27%
18%
29%
20%
25%
6%
0% 10% 20% 30% 40% 50% 60% 70% 80% 90% 100%
65 and above
46 to 64
30 to 45
Under 30
Yes
No
Unsure
55% 34% 11%
0% 10% 20% 30% 40% 50% 60% 70% 80% 90% 100%
Yes No Unsure

Capital Metro Communication and Engagement Survey
26 | P a g e © P i a z z a R e s e a r c h P t y L t d 2 0 1 4
Q20 Breakdown: by Age
n = 1192, base = 1184
Q20 Breakdown: by Household
n = 1192, base = 1168
43%
54%
57%
77%
46%
36%
31%
16%
11%
10%
12%
8%
0% 10% 20% 30% 40% 50% 60% 70% 80% 90% 100%
65 and above
46 to 64
30 to 45
Under 30
Yes
No
Unsure
49%
65%
70%
52%
59%
43%
23%
18%
33%
19%
8%
11%
12%
15%
22%
0% 10% 20% 30% 40% 50% 60% 70% 80% 90% 100%
An adult couple only
A couple with dependant children
One parent household with dependant children
One-person household without children
A group household without children
Yes
No
Unsure

Capital Metro Communication and Engagement Survey
27 | P a g e © P i a z z a R e s e a r c h P t y L t d 2 0 1 4
Q20 Breakdown: by Gender
n = 1192, base = 1189
Males are a little more likely to support the Capital Metro project (59%) than females (51%).
59%
51%
28%
41%
13%
9%
0% 10% 20% 30% 40% 50% 60% 70% 80% 90% 100%
Male
Female
Yes
No
Unsure

Capital Metro Communication and Engagement Survey
28 | P a g e © P i a z z a R e s e a r c h P t y L t d 2 0 1 4
Q20. Thematic map of postcodes of support for the Capital Metro project
n = 1192, base = 1190
In terms of overall support for the project, the majority of residents from most postcodes across Canberra support the Capital Metro project (green colour). The suburbs in blue represent suburbs where the level of support is the same as the level of non-support (to within 5%) or the suburb has a majority of residents who are unsure. The few suburbs showing a majority of non-supporting residents (red) are within the inner-south or south of Canberra. Areas without sufficient data are not marked on the map.

Capital Metro Communication and Engagement Survey
29 | P a g e © P i a z z a R e s e a r c h P t y L t d 2 0 1 4
Reasons for not supporting the project; why do you say NO?
n = 1192, base = 126
A breakdown of those who do not support light rail shows the main reason for them not supporting it is a perception that the cost of the system might not outweigh the benefits provided (52%). A belief that there are alternative options which might be less expensive (e.g. improving existing bus services) is the second most commonly held belief (16%) for the non-supporter group.
6%
7%
8%
10%
16%
52%
0% 10% 20% 30% 40% 50% 60%
Demand and useage concerns
Overall viability and benefit to Canberra
Limited service and route choices
Limited benefits and not useful
Alternative options for funds, e.g. improving existing busservices
Cost V Possible benefits

Capital Metro Communication and Engagement Survey
30 | P a g e © P i a z z a R e s e a r c h P t y L t d 2 0 1 4
DEMOGRAPHICS
Q21. In what year were you born?
n = 1192, base = 1185
Q22. What is your highest level of education you have achieved so far?
n = 1192, base = 1189
16%
37%
41%
6%
0%
5%
10%
15%
20%
25%
30%
35%
40%
45%
65 and above46 to 6430 to 45Under 30
53%
16%
10%
20%
0% 0%
10%
20%
30%
40%
50%
60%
University LevelEducation (Bachelor and
higher)
Advanced diploma anddiploma level
Certificate level /technical / trade / TAFE
/ CIT
Secondary Education(Year 7 - 12)
Primary Education (Year1 to year 6)

Capital Metro Communication and Engagement Survey
31 | P a g e © P i a z z a R e s e a r c h P t y L t d 2 0 1 4
Q23. Would you describe this household as?
n = 1192, base = 1169
Q24. Gender (record)
n = 1192, base = 1190
44%
34%
4%
13%
4%
0%
5%
10%
15%
20%
25%
30%
35%
40%
45%
50%
An adult couple only A couple withdependant children
One parent householdwith dependant
children
One-person householdwithout children
A group householdwithout children
56% 44%
0% 10% 20% 30% 40% 50% 60% 70% 80% 90% 100%
Male Female

Capital Metro Communication and Engagement Survey
32 | P a g e © P i a z z a R e s e a r c h P t y L t d 2 0 1 4
Q25. What is your postcode?
Postcode (ACT) % sample size
2600 2% 25
2601 0% 3
2602 6% 72
2603 1% 15
2604 2% 27
2605 4% 43
2606 2% 25
2607 3% 41
2609 0% 3
2611 9% 112
2612 3% 34
2614 9% 113
2615 16% 195
2617 7% 85
2900 1% 9
2902 4% 53
2903 2% 29
2904 5% 60
2905 7% 88
2906 4% 52
2911 1% 12
2913 4% 52
2914 2% 28
others 2% 16 n = 1192, base = 1192
Data sample sizes that are significantly less than 30 are considered insufficient to represent the group1, and are marked as Red, which were not taken into account in the demographic breakdowns.
1 C. J. M. Maas and J. J. Hox, Sufficient Sample Sizes for Multilevel Modelling, Methodology: European Journal of Research Methods for Behavioural and Social
Sciences, 2005, 1(3), 86-92. The paper states that “a group size of 30 is normal in educational research”. Please see the paper for more detailed mathematical analysis.

Capital Metro Communication and Engagement Survey
33 | P a g e © P i a z z a R e s e a r c h P t y L t d 2 0 1 4
This report was produced by Piazza Research Pty Ltd Ph (02)6282 4963, for the ACT Government Environment and Sustainable Development Directorate. Lead Consultants: Grant Piazza, Dr Lu Jin
Project reference number: #060314