Embed Size (px)
Citation preview

215
This chapter investigates the main constraints to the development offixed-income and equity markets in MENA. Private fixed-incomeinstruments such as corporate bonds provide alternatives to bankfinance; mortgage-backed securities and mortgage-covered bonds pro-vide long-term funding for banks to expand housing finance. Well-developed government securities markets are a precondition for thesound development of private fixed-income markets, as they provide thebenchmark yield curve for pricing private issues and the institutionalinfrastructure required for market development and the management offinancial risks.
Local currency government bond markets have grown considerably inmany emerging markets, but they remain relatively undeveloped inMENA. Several common weaknesses explain the underdevelopment ofgovernment debt markets in the region. Most important among these arethe lack of development of money markets and a diversified institutionalinvestor base, opportunistic primary issuance practices, and captivedemand by banks, which dominate bond markets. These problems haveled to highly concentrated buy-and-hold portfolios by banks and state-owned institutions, poor price discovery, and lack of liquidity in second-ary markets.
Well-functioning equity markets can also complement the bankingsector and contribute to efficient resource allocation. Key functions ofequity markets include providing complementary funding for investmentprojects and an exit mechanism for entrepreneurs, discovering marketprices, privatizing state-owned enterprises, facilitating corporate restruc-turing, providing vehicles for savings and wealth accumulation, and pro-moting good corporate governance.
The findings of this chapter indicate that MENA equity marketsdo not perform their key functions adequately. Despite high marketcapitalization, markets do not provide a meaningful complement to
Capital Markets
CHAPTER 9
FAS_215-238.qxd 8/31/11 8:16 PM Page 215

bank finance for enterprises in most countries in the region, the qual-ity of price discovery seems generally poor, there is scope for furtheruse of equity markets for privatization of state-owned enterprises andcorporate restructuring, and corporate governance could be substan-tially improved.
This chapter is structured as follows. The first section examinesfixed-income markets in the region. The second section examinesequity markets.
Fixed-Income Markets
The Limited Development of Government Debt Markets outsidethe Gulf Cooperation Council
This section examines the current stage of development of governmentsecurities markets in non-GCC countries in the region and highlights keybottlenecks of market development.1 The focus is on five countries thathave government bond markets of minimum size and greater potential formarket development: the Arab Republic of Egypt, Jordan, Lebanon,Morocco, and Tunisia (MENA-5). These countries have sizable debt-to-GDP ratios and domestic tradable debt, and, to different degrees, haveimplemented measures to develop their debt markets (figures 9.1 and 9.2).However, the analysis is relevant for other countries in the region as well.
216 Financial Access and Stability
FIGURE 9.1
Total Central Government Debt as a Percentage of GDP, in SelectedCountries in the Middle East and North Africa, 2004–09
0
20
40
60
80
100
120
140
160
180
200
% o
f GDP
Egypt,Arab Rep.
JordanLebanon Morocco Tunisia AlgeriaSyrian ArabRepublic
domestic government debt external government debt
Source: World Bank database.
FAS_215-238.qxd 8/31/11 8:16 PM Page 216

Capital Markets 217
The analysis focuses on the five building blocks that sustain deep andliquid public debt markets: money markets, primary markets (issuancepolicy and placement mechanisms), secondary markets, the investor base,and clearing and settlement infrastructure. Market development inMENA requires actions in all key building blocks, from improvementsin monetary policy implementation and liquidity management toenhancements in issuance practices, price transparency, and clearing andsettlement. Measures to improve the role of mutual funds and foster for-eign investor presence are also critical to increase competition andinvestor diversification in these markets.
Money marketsThe preconditions for well-functioning money markets are missing inMENA, depriving banks of the ability to actively manage liquidity. Inadvanced economies, well-functioning money markets are the corner-stone of efficient domestic debt and equity markets. MENA moneymarkets are shallow, as a result of structural excess liquidity that is inef-fectively sterilized, the central bank’s choice of sterilization instru-ments that are not supportive of market development, and poor moneymarket operational arrangements.
Excess structural liquidity is not sterilized fully, as a result of difficul-ties in liquidity forecasting and the high costs of sterilization. Relatively
FIGURE 9.2
Total Central Government Debt in Selected Countries in the Middle East and North Africa, 2004–09
0
20
40
60
80
100
120
140
160
US$
billi
ons
Lebanon Egypt, ArabRep.
Jordan Morocco Tunisia Syrian ArabRepublic
Algeria
domestic government debt external government debt
Source: World Bank database.
FAS_215-238.qxd 8/31/11 8:16 PM Page 217

high reserve requirements are used in all countries in the region as a firstrecourse to absorb excess structural liquidity. The choice of additional ster-ilization instruments, mainly short-term auctioned deposits and overnightstanding facilities, is inadequate to support effective liquidity absorption.These instruments are used in advanced economies to fine-tune operationsor when liquidity forecasting errors are smaller. The operational frame-work to support money market transactions is unevenly developed inMENA-5. In their infrequent liquidity operations, central banks use an adhoc secured lending facility similar to a repurchase agreement. The inter-bank repo market is practically nonexistent, except in Morocco. In additionto the lack of incentives to manage liquidity actively, other regulatory, tax,and infrastructure constraints impede its development.
Primary marketsMENA-5 countries have basic market-oriented issuance policies, includ-ing the correct choice of instruments (discounted Treasury bills for theshort term, fixed-coupon Treasury bonds for the medium and longterm), but they prioritize low funding costs over market development. Asound issuance policy is the first step in a strategy to develop a liquiddomestic debt market. To different degrees and depending on the coun-try, key shortcomings are found in the maturity structure, auction calen-dars, concentration of demand, and lack of liability management tech-niques (table 9.1). The maturity structure is generally unbalanced andskewed toward the long term, which impedes the creation of liquid
218 Financial Access and Stability
TABLE 9.1
Main Features of Primary Public Debt Markets in MENA-5 Countries, 2008
Feature Egypt, Arab Rep. Jordan Lebanon Morocco Tunisia
Preannounced calendar
Yes No No Yes Yes
Compliance withcalendar
High n.a. n.a. Medium Medium
Reopenings Yes No No Yes YesBid-to-cover ratio 1.5 1.4 1.5 7.0 3.0Auction participation
15 exclusive primary dealers
Any financial institution
Banks Banks and 6 nonexclusiveprimary dealers
12 banks and 1 nonexclusiveprimary dealer
Treasury bonds aspercentage of totalbonds 36 61 94 76 98Average maturity(years) 2.1 2.0 1.7 5.9 5.3
Source: Ministries of finance and central banks (annual reports and web sites).
Note: n.a. = not applicable.
FAS_215-238.qxd 8/31/11 8:16 PM Page 218

Capital Markets 219
benchmarks at all points of the yield curve. With the exception of Egypt,countries do not comply with a predictable auction calendar, and there isirregular supply at auctions of the whole range of debt maturities. Theconcentration of demand by state banks and other state institutions low-ers the degree of competition in several countries. Countries in theregion make limited use of liability management techniques to consoli-date issues, enhance liquidity, and reduce rollover risk. All MENA-5countries conduct multiple price auctions.
The current debt term structure, which is biased toward long maturi-ties in most countries in the region, combined with the illiquidity of sec-ondary markets are the main obstacles to market development. Thoughextending the average debt maturity to reduce rollover risk is a legitimateobjective of debt management, from a market development perspective,longer maturities are desirable only as long as their issuance is sustainableand pricing is market based. Issuing long maturities too quickly withoutprice references at the shorter end of the yield curve creates uncertaintyover the pricing of Treasury bonds.
Without short-term price references, governments have been temptedto place their long-term debt at off-market prices. This practice has beenfacilitated in MENA-5 by captive demand resulting from excess liquidity;dominant state banks and institutions (for example, public pension funds);and lack of alternative investments. Relying on captive demand distortspricing. Although this strategy may lower the cost of debt in the shortterm and reduce rollover risk, it creates a vicious circle, further reducingmarket liquidity. It introduces a strong incentive for a buy-and-hold strat-egy, which avoids the realization of latent capital losses. It weakens thebalance sheet of financial intermediaries, even if losses are not realized,and increases liquidity risk in the financial sector, particularly in the eventof a liquidity crunch. Finally, it unnecessarily segments debt into pools oflocked-in portfolios, delaying reforms to create liquidity at the shorterend of the yield curve even further.
Secondary marketsSecondary markets are generally shallow in MENA-5 as a result of excessliquidity, inappropriate issuance policies, a nondiversified investor base,and a primary dealer system that does not perform its functions ade-quately. Therefore, reforms in all building blocks mentioned in thisreport are preconditions for improving secondary market liquidity andpricing. Government securities are traded predominantly in over-the-counter wholesale markets and marginally on exchanges. Reportingobligations are very minimal in all markets, as a result of low secondarymarket activity, and there are no pretrade price dissemination require-ments in any MENA market.
FAS_215-238.qxd 8/31/11 8:16 PM Page 219

Secondary markets in MENA-5 may be classified into three differentprofiles. In the first group, Egypt has the most active Treasury-bill marketand a gradually increasing trade volume in the Treasury-bond market,reflecting an improved issuance policy. In the second group, comprisingMorocco and Tunisia, the combination of long average maturity and lowsecondary market liquidity has led to a disproportionately high use ofrepos to manage liquidity. In Morocco, the general repo legal frameworkwork is robust, but the spot market to sustain credible valuation of collat-eral is missing. Repos account for 99 percent of all trading activity inMorocco. In Tunisia the legal framework is weaker. Formal repos have nottaken off there, although banks use an unregulated substitute called ventesà rémérés to manage liquidity. In the third group, Jordan and Lebanonhave almost no secondary market trading, as a result of excess liquidity, avery fragmented debt structure, and poor market infrastructure.
The common feature of all three primary dealer systems in MENA-5(Egypt, Morocco, and Tunisia) is that primary market obligations areenforced and secondary market obligations are not. In general, primarydealer programs can be very useful to ensure primary market placementsand supply liquidity in the secondary market. The lack of enforcement ofsecondary market obligations is in part explained by the structural diffi-culties of trading activity—it is unrealistic to enforce market-makingobligations as found in advanced markets. A potential solution is toreassess rules so that secondary market obligations are in line with thedegree of market development.
Investor baseA large and diversified investor base is important for ensuring high liq-uidity and stable demand in the fixed-income market. A heterogeneousinvestor base with different time horizons, risk preferences, and tradingmotives ensures active trading and stimulates liquidity, enabling the gov-ernment to execute its funding strategy under a wide range of marketconditions.
In Egypt, Jordan, and Lebanon, banks and state-owned entities aremore dominant buyers of domestic debt than in peer regions. In MENA-5, unlike many other emerging markets, there is no evidence of a declin-ing trend in the share of these entities in favor of institutional investors.Egypt, Jordan, and Lebanon have the least diversified investor bases, withbanks and state-owned entities holding more than 75 percent of issueddebt (table 9.2). The main drawback for debt market development is notthe predominant role of banks but the circumstances that make thembuy-and-hold investors. Under normal conditions, banks should tradetheir securities portfolio to support their liquidity management opera-tions. As explained above, excess liquidity and primary issuance policies
220 Financial Access and Stability
FAS_215-238.qxd 8/31/11 8:16 PM Page 220
Capital Markets 221
are not supportive of secondary market trading, and the lack of alterna-tive investments make banks buy and hold, reducing liquidity andinvestor diversification in public debt markets.
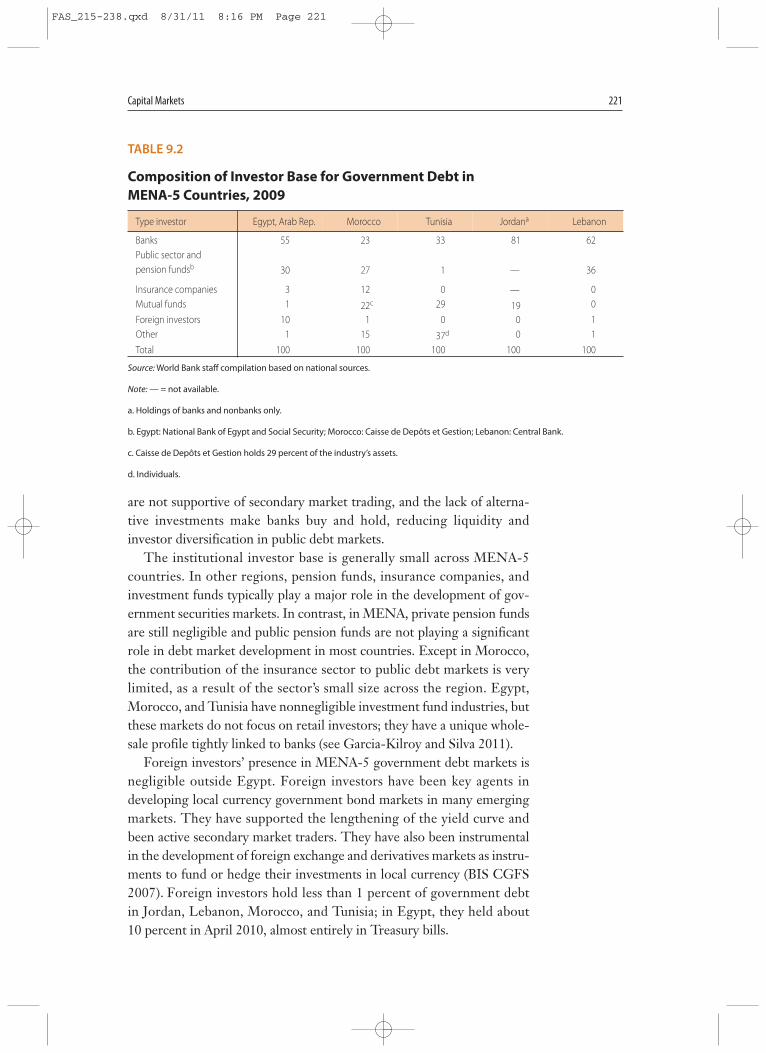
The institutional investor base is generally small across MENA-5countries. In other regions, pension funds, insurance companies, andinvestment funds typically play a major role in the development of gov-ernment securities markets. In contrast, in MENA, private pension fundsare still negligible and public pension funds are not playing a significantrole in debt market development in most countries. Except in Morocco,the contribution of the insurance sector to public debt markets is verylimited, as a result of the sector’s small size across the region. Egypt,Morocco, and Tunisia have nonnegligible investment fund industries, butthese markets do not focus on retail investors; they have a unique whole-sale profile tightly linked to banks (see Garcia-Kilroy and Silva 2011).
Foreign investors’ presence in MENA-5 government debt markets isnegligible outside Egypt. Foreign investors have been key agents indeveloping local currency government bond markets in many emergingmarkets. They have supported the lengthening of the yield curve andbeen active secondary market traders. They have also been instrumentalin the development of foreign exchange and derivatives markets as instru-ments to fund or hedge their investments in local currency (BIS CGFS2007). Foreign investors hold less than 1 percent of government debtin Jordan, Lebanon, Morocco, and Tunisia; in Egypt, they held about10 percent in April 2010, almost entirely in Treasury bills.
TABLE 9.2
Composition of Investor Base for Government Debt in MENA-5 Countries, 2009
Type investor Egypt, Arab Rep. Morocco Tunisia Jordana Lebanon
Banks 55 23 33 81 62Public sector and pension fundsb 30 27 1 — 36
Insurance companies 3 12 0 — 0Mutual funds 1 22c 29 19 0
Foreign investors 10 1 0 0 1Other 1 15 37d 0 1
Total 100 100 100 100 100
Source: World Bank staff compilation based on national sources.
Note: — = not available.
a. Holdings of banks and nonbanks only.
b. Egypt: National Bank of Egypt and Social Security; Morocco: Caisse de Depôts et Gestion; Lebanon: Central Bank.
c. Caisse de Depôts et Gestion holds 29 percent of the industry’s assets.
d. Individuals.
FAS_215-238.qxd 8/31/11 8:16 PM Page 221

MENA markets have not attracted foreign investors because of theirlimited investability (Garcia-Kilroy and Silva 2011). Only Egypt andMorocco have met the minimum conditions required by foreign investorsand for inclusion in the GEMX index, and they score among the lowestemerging markets. Although increased global integration through thepresence of foreign investors can increase volatility in the local debt mar-ket, as demonstrated by the recent global market turmoil, there are waysto mitigate this risk, as discussed in chapter 10.
Clearing and settlement infrastructureThe clearing and settlement infrastructure in MENA-5 is adequate forthe current stage of market development, but it needs significantupgrades to support more liquid and investable markets. Only Morocco’scentral securities depositary has the versatility required by wholesaleand over-the-counter government debt markets. All other countriesneed to formulate a roadmap for a phased upgrade of their existing sys-tems. An alternative option for some countries, such as Egypt, would beto follow the same strategy used for the real time gross settlement sys-tem and develop a state-of-the-art central securities depositary system.The rationale is the mutual dependency of both systems and the futureneed to have similar levels of information technology and operationalperformance.
The Negligible Size of Fixed-Income Marketsoutside the Gulf Cooperation Council
Underdeveloped government securities markets are a major constraintto the development of private fixed-income markets in MENA. Well-developed government securities markets provide a reliable benchmarkyield curve for pricing and developing private instruments. Well-developed government securities markets also provide the institutionalinfrastructure for capital markets, including experienced dealers and bro-kers, dealer financing, futures and options markets, clearing, settlement,book entry, and registry functions, as well as oversight and regulation.The lack of development of government debt markets in MENA alsohelps explain why private fixed-income markets have not developed.
Other regulatory and institutional constraints have also hindered thedevelopment of private fixed-income instruments. For example, no coun-try in the region issued covered bonds, as a result of the lack of enablinglegislation. Morocco is the first MENA country that is developing draftlegislation and holding consultations with market participants.
Securitization is in its infancy. Morocco and Tunisia were the firstcountries to develop a legal framework for securitization, in the early
222 Financial Access and Stability
FAS_215-238.qxd 8/31/11 8:16 PM Page 222

Capital Markets 223
2000s, but very few transactions were conducted. The subprime crisis of2007 stalled the infant market shortly after the first deals. The lack of fur-ther market development also reflects regulatory weaknesses, such as thelack of a housing price index, the absence of rating agencies, and flaws insecuritization structures, including concentration of roles by the loanoriginators, leading to conflicts of interest.
The Status of Fixed-Income Markets in the Gulf Cooperation Council
The GCC debt/sukuk market grew rapidly in the precrisis years.2 Theinvestment boom in Dubai led to corporate issues surpassing governmentissues in 2006 and 2007 (figure 9.3). The share of sukuk issues alsoincreased in this period (figure 9.4). When the global financial crisis hitthe region, in 2008, the GCC market in general and its corporate seg-ment in particular suffered a setback. The sukuk market entered a turbu-lent period, following a string of standstill announcements in the GCC,with the real estate giant Nakheel’s sukuk event in the United Arab Emi-rates the most prominent. The recent setback of the Islamic securitiesmarket has revealed challenges to the market’s growth.
FIGURE 9.3
Issuance of Debt/Sukuk Securities in the Gulf CooperationCouncil, 2003–09
14.6 13.5 13.7 12.419.7
13.1
52.6
0.7 4.911.4
28.1
28.3
9.6
20.1
0
10
20
30
40
50
60
70
80
2003 2004 2005 2006 2007 2008 2009
US$
billi
ons
15.3 18.4
25.1
40.5
72.7
48.0
22.7
sovereign corporate
Source: World Bank staff compilation based on data from the GCC Bond Market Survey and Markaz database, 2010.
FAS_215-238.qxd 8/31/11 8:16 PM Page 223

As a result of large debt/sukuk issues by corporations in the UnitedArab Emirates and issues by the federal government to finance its inter-vention in troubled corporations in Dubai, the United Arab Emiratesaccounts for the largest cumulative issuance in the GCC. Its issuancesamounted to 50 percent of total GCC stock in 2009 (figure 9.5, panela). A significant part of those issues financed real estate developmentprojects and banking operations in the United Arab Emirates. By con-trast, most of Kuwait’s issues were government bonds, which wereissued regularly for the central bank’s open market–type operations todrain liquidity from the banking system. The Qatari government’s largeissues with maturities of 5, 10, and 30 years totaled US$7 billion, put-ting it in third place in 2009.
Nearly three-quarters of GCC issues were denominated in U.S. dol-lars, with issuances concentrated in a few sectors. The United ArabEmirates and Qatari issues accounted for 98 percent of U.S. dollar–denominated GCC issues in 2009. Kuwaiti dinar–denominated issues rep-resented the largest outstanding amount among GCC currency issues in2009. The sectoral composition of the GCC debt/sukuk stock reveals thatamong corporate issues, the financial services and the real estate sectoraccounted for more than half of the outstanding amount, followed by theoil and gas sector and utilities (figure 9.5, panel b). This sectoral compo-sition is in line with the undiversified structure of GCC economies and issimilar to that of equity markets in the region (see next section).
224 Financial Access and Stability
FIGURE 9.4
Sukuk versus Conventional Debt Securities in the Gulf Cooperation Council, 2003–09
12 11 1228
40 36
1623
88 89 8872
60 64
8477
0
10
20
30
perc
ent
40
50
60
70
80
90
100
2003 2004 2005 2006 2007 2008 2009 total
sukuk conventional
Source: World Bank staff compilation based on data from the GCC Bond Market Survey and Markaz database, 2010.
FAS_215-238.qxd 8/31/11 8:16 PM Page 224

Capital Markets 225
Source: World Bank staff compilation based on data from the GCC Bond Market Survey and Markaz database, 2010.
FIGURE 9.5
Outstanding Debt/Sukuk Securities in the Gulf CooperationCouncil, 2009
United ArabEmirates,36.6, 50%
Qatar,15.3, 21%
Kuwait,14.0, 19%
Saudi Arabia,4.5, 6%
Bahrain, 2.0, 3%
Oman, 0.4, 1%
government,135.06, 55%
financialservices,
47.94, 20%
real estate,18.81, 8%
oil and gas, 15.28, 6%
power and utilities,11.98, 5%
transport,9.19, 4% others,
4.61, 2%
a. By country
b. By sector
FAS_215-238.qxd 8/31/11 8:16 PM Page 225

Islamic securities (sukuks) have been meeting the financial needs ofmany issuers in the Islamic world by observing the teachings of Islam inthe context of modern investment banking.3 The Islamic investmentbanking community has developed an array of sukuk structures to meetparticular investment, financing, or Sharia compliance needs. In allstructures, a special purpose vehicle is set up as the issuer of Islamicsecurities and the trustee of assets underlying the securities. The greatmajority of sukuks are variable rate securities, for which secondary mar-ket trading is thin. Fast-growing Islamic banks are the primary investorbase for sukuks.
The GCC sukuk market is entering a critical stage of its growth,following several years of high-paced expansion. Challenges for mar-ket development include the generally nascent nature of the GCCmarket, uncertainty about the legal treatment of Islamic characteris-tics of sukuks in a secular legal system, the unresolved nature of reli-gious legitimacy in Islamic securities structuring, and excess liquidityand the lack of government financing needs in the GCC. The bank-ruptcy resolution of sukuk defaults has not been clarified; it is relatedto the ranking of sukuk holders’ claims, creditors’ access to the under-lying assets, and the local enforceability of foreign legal decisions(Standard & Poor’s 2010). The workout of recent bankruptcy cases isexpected to set some precedence for resolution of bankrupt sukukissuers.
In many ways, the development agenda in the GCC is similar to thatof non-GCC countries, but budget surpluses and low debt in GCC coun-tries pose additional challenges for market development. In order to builda reliable benchmark yield curve, policy makers need to build their inter-nal debt management capacity, conduct regular and predictable issues,build an appropriate market structure, and introduce market making andrepos. Developing the market in GCC countries would involve over-funding the budget, entailing nonnegligible costs. Sustaining a liquidgovernment debt market would require that monetary, fiscal, anddebt/asset management policies be well coordinated. Market segmenta-tion between conventional and Islamic securities is another potentialproblem, as the cost of maintaining liquid benchmarks for both types ofsecurities could prove prohibitive.
There is significant potential for regional harmonization of marketregulation and infrastructure in the GCC. Primary areas for regional har-monization include accounting and auditing rules, intermediary licens-ing, and securities offering and trading. Likely areas for regional integra-tion or networking in market infrastructure would be those sensitive toeconomies of scale, in particular securities depositories and payment sys-tems. So far, progress has been limited.
226 Financial Access and Stability
FAS_215-238.qxd 8/31/11 8:16 PM Page 226

Capital Markets 227
Equity Markets
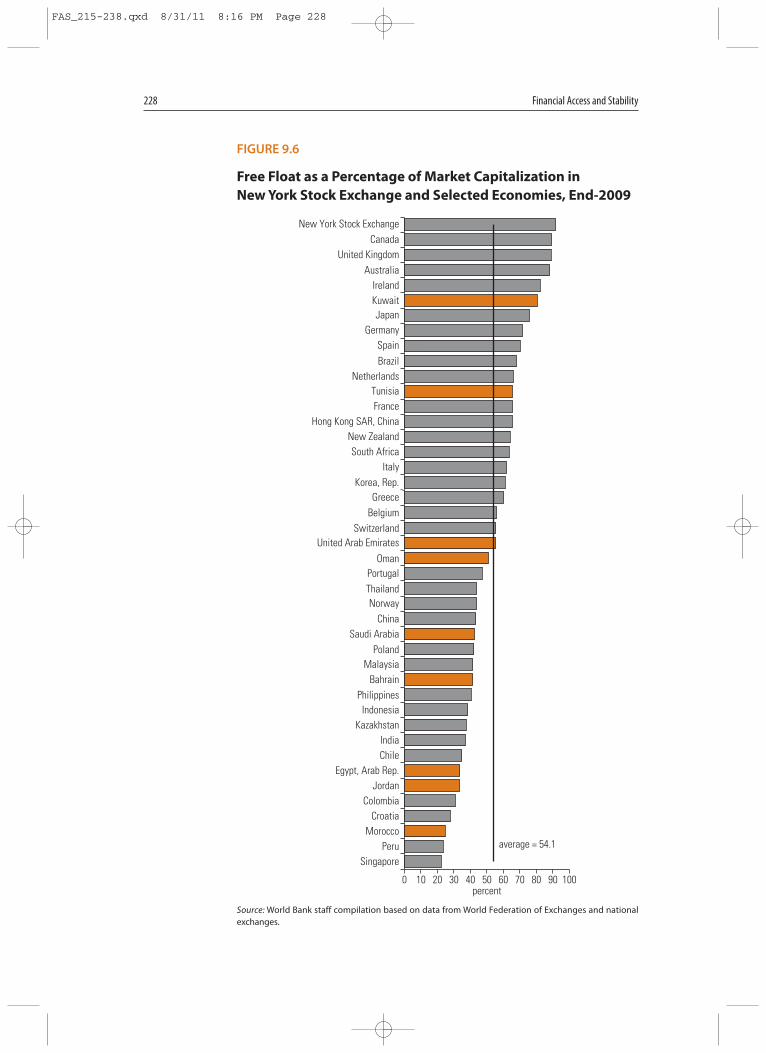
Market capitalization in MENA is large by international comparison, butfree floats are thin in many countries.4 Between 2005 and 2010, 1,500 ormore companies were listed on MENA’s major stock exchanges. Theirtotal market capitalization reached US$1.2 trillion in 2007, declining toUS$870 billion by end-2009, as a consequence of the global financial cri-sis. GCC countries account for half of MENA’s listed companies andthree-quarters of the region’s market capitalization. Free floats appearvery reasonable in Kuwait, Tunisia, and the United Arab Emirates butsmall in other MENA countries, especially outside the GCC (figure 9.6).Thin free floats often reflect large residual state shareholdings in (par-tially) privatized companies or large family shareholdings in companieswhose small public share offerings may have been motivated by the desirefor prestige or other factors, such as tax incentives.
Average market capitalization of listed firms varies widely across theregion. It is generally high in the GCC. The average is highest forfirms in Saudi Arabia (US$4.2 billion), Qatar (US$2.0 billion), andAbu Dhabi (US$1.5 billion). It is US$80 million–US$150 million forfirms in Jordan, Oman, and the West Bank and Gaza. Especially inGCC countries, where average market capitalizations exceed those inmost developed markets, equity markets are dominated by banks andlarge former state-owned enterprises. In both the GCC and the rest ofMENA, there is substantial potential for medium-size manufacturingand service firms to list and become active.
Financial institutions account for half of MENA’s market capitaliza-tion, a larger share than in any other region except Africa (table 9.3).Industry commands a smaller share of market capitalization than it doesin any other developed or emerging region, and the service sector’s shareis equal to that in Africa. This pattern reflects both the lack of economicdiversification in some countries, especially in the GCC, and the fact thatfirms in the industry and service sectors do not see advantages in listing.The transparency and disclosure requirements for listing are consider-able. Financial firms, especially banks, are generally subject to higherreporting requirements than nonfinancial firms, and some countriesrequire financial firms (banks in the Arab Republic of Syria, insurancecompanies in Saudi Arabia) to list. However, family-owned firms inindustry and services generally avoid the transparency and disclosurerequirements that accompany stock market listings. Industry and servicesector access to equity markets is especially low in Kuwait, Lebanon,Morocco, Qatar, Saudi Arabia, Syria, the United Arab Emirates, and theWest Bank and Gaza. The large share of financial institutions in Bahrainreflects that economy’s status as an offshore financial center.
FAS_215-238.qxd 8/31/11 8:16 PM Page 227
228 Financial Access and Stability
FIGURE 9.6
Free Float as a Percentage of Market Capitalization in New York Stock Exchange and Selected Economies, End-2009
average = 54.1
0 10 20 30percent
40 50 60 70 80 90 100
New York Stock ExchangeCanada
United KingdomAustralia
IrelandKuwaitJapan
GermanySpainBrazil
NetherlandsTunisiaFrance
Hong Kong SAR, ChinaNew ZealandSouth Africa
ItalyKorea, Rep.
GreeceBelgium
SwitzerlandUnited Arab Emirates
OmanPortugalThailandNorway
ChinaSaudi Arabia
PolandMalaysia
BahrainPhilippines
IndonesiaKazakhstan
IndiaChile
Egypt, Arab Rep.Jordan
ColombiaCroatia
MoroccoPeru
Singapore
Source: World Bank staff compilation based on data from World Federation of Exchanges and nationalexchanges.
FAS_215-238.qxd 8/31/11 8:16 PM Page 228

Capital Markets 229
Countries in the region generally compare very well with countriesoutside the region in market turnover (turnover/market capitalization),but high turnover ratios do not necessarily reflect effective price discov-ery. Turnover ratios in MENA look high controlling for GDP per capita,demographics, and status as an oil exporter (figure 9.7). Actual turnoverratios exceed predicted values by a wide margin in Saudi Arabia and areabove expectations in most other MENA countries. Countries in theregion also compare well in other indicators of market trading and liq-uidity, such as the ratio of turnover to GDP and the share of the top 10companies in turnover (see appendix C). However, the large volume oftrading revealed by these indicators does not necessarily reflect effectiveprice discovery or equity valuation, as discussed below.
This rest of this section explores how effective these large and activeMENA stock markets are in contributing to overall economic develop-ment. Although equity markets can be a valuable dynamic mechanismfor price discovery—facilitating capital investment, entrepreneurialequity finance, privatization, corporate restructuring, and corporategovernance—there are grounds for concern that MENA’s stock marketsare falling short in performing these functions.
Price Discovery
MENA equity markets display reasonable turnover indicators, but theydo not seem to perform well in price discovery. Developed equity mar-kets enjoying more disclosure and transparency, stronger governancestandards, and professional asset management should promote arbitragetrading based on information about a firm’s fundamentals. In such an
TABLE 9.3
Sectoral Composition of Market Capitalization, by World Region, 2009
(percent)
Region Financial Infrastructure Industry Services
East Asia and Pacific 28.0 33.1 29.9 9.0Europe and Central Asia 25.5 37.1 32.6 4.8
High-income OECD 22.8 32.0 33.1 12.1High-income non-OECD 40.4 26.2 20.0 13.4
Latin America and the Caribbean 40.7 28.8 25.3 5.3Middle East and North Africa 49.5 29.5 17.1 3.9
GCC average 47.1 31.4 16.8 4.8Non-GCC average 51.6 27.9 17.3 3.1
South Asia 22.4 36.7 36.4 4.4Sub-Saharan Africa 54.0 9.7 32.3 4.0
Source: World Bank staff calculations based on data from Bloomberg database.
Note: OECD = Organisation for Economic Co-operation and Development.
FAS_215-238.qxd 8/31/11 8:16 PM Page 229

environment, prices will incorporate more firm-specific information andco-move less with the market (Morck, Yeung, and Yu 2000). Two indica-tors of price synchronicity—the first measuring the co-movement ofstock prices, the second measuring the portion of stock returns explainedby the market (that is, the average R2 of a regression of a company’sbiweekly stock returns on overall market returns for the period2004–09)—were computed, in order to assess the quality of price discov-ery (see appendix B). The two indicators are highly correlated; the secondis used here, because it has been more extensively used in the empiricalliterature to measure price synchronicity and allows international com-parisons. Low R2 values indicate low levels of price synchronicity andsuggest an effective price discovery function. The results for MENA(table 9.4) are compared with a similar exercise for 40 countries outsidethe region (table 9.5) (Alves, Peasnell, and Taylor 2010).
230 Financial Access and Stability
FIGURE 9.7
Market Turnover in the Middle East and North Africa and inPeer Markets, 2008
Bahrain
Egypt, Arab Rep.Jordan
Kuwait
Lebanon
MoroccoOman Qatar
Saudi Arabia
Tunisia
United Arab Emirates
0
50
100
150
200
250
300
350
0 50 100 150 200 250 300 350
turn
over
ratio
, act
ual v
alue
turn
over
ratio
, act
ual v
alue
turnover ratio, predicted value
turnover ratio, predicted value
Bahrain
Egypt, Arab Rep.Jordan
Kuwait
Lebanon
Morocco
Oman
Qatar
Tunisia
United Arab Emirates
0
50
100
0 50 100
b. Expanded view
a. Full view
Source: Bank staff calculations based on data from World Federation of Exchanges and World Bank.
Note: Orange diamonds indicate countries in the region; grey diamonds indicate countries outside theregion.
FAS_215-238.qxd 8/31/11 8:16 PM Page 230

Capital Markets 231
The MENA indicators of price synchronicity seem very high byinternational comparison, suggesting that the price discovery function isnot very effective. They fluctuate over the sample period and spike inperiods of crisis, such as 2006 (the local GCC crisis) and 2008 (the globalcrisis). These fluctuations are expected, as the co-movement of stockprices increases in periods of boom and bust. However, the MENA mean(29 percent) is equal to the mean of the lowest-ranked country in the
TABLE 9.4
Portion of Biweekly Returns Explained by the Market in Selected Countriesin the Middle East and North Africa, 2004–09
Country 2004 2005 2006 2007 2008 2009Mean
2004–08
Bahrain 0.15 0.21 0.22 0.16 0.25 0.18 0.20Egypt, Arab Rep. 0.17 0.26 0.30 0.12 0.41 0.27 0.25Jordan 0.27 0.23 0.26 0.14 0.30 0.16 0.23Kuwait 0.21 0.14 0.31 0.16 0.37 0.32 0.25Lebanon 0.19 0.32 0.62 0.39 0.39 0.43 0.39Morocco 0.27 0.21 0.29 0.30 0.32 0.36 0.29Oman 0.21 0.22 0.27 0.17 0.41 0.27 0.26Qatar 0.30 0.56 0.38 0.30 0.53 0.51 0.43Saudi Arabia 0.33 0.18 0.54 0.37 0.52 0.50 0.41Tunisia 0.11 0.12 0.15 0.16 0.8 — 0.13United Arab Emirates 0.26 0.25 0.32 0.25 0.39 0.40 0.31Mean 0.22 0.25 0.33 0.23 0.36 0.34 0.29
Source: World Bank staff calculations based on data from Bloomberg database.
Note: — = not available.
TABLE 9.5
Portion of Weekly Returns Explained by the Market in Selected World Economies
Ranking portion of weekly returns explainedby the market in sample of 40 markets outsidethe Middle East and North Africa Ranking Economy R2 Ranking Economy R2
1 Canada 0.03 22 India 0.123 Ireland 0.04 24 Japan 0.125 United Kingdom 0.05 26 Indonesia 0.157 Peru 0.05 28 Mexico 0.179 Portugal 0.06 30 Italy 0.19
11 United States 0.06 32 Philippines 0.2013 Denmark 0.06 34 Poland 0.2215 Colombia 0.08 36 Taiwan, China 0.2217 Germany 0.08 38 Greece 0.2719 Netherlands 0.11 40 China 0.29
Source: Alves, Peasnell, and Taylor 2010.
Note: Means were calculated over the 1997–2004 period.
FAS_215-238.qxd 8/31/11 8:16 PM Page 231

international sample, and countries in the region generally fare poorly inthis comparison. Admittedly, the methodology has limitations. Forexample, the R2 captures factors other than the institutional quality ofthe equity market. In addition to bubbles and bursts, it could reflect thesize and composition of the market and idiosyncratic factors. The highR2 for countries in the region could partly reflect the large share of finan-cial firms, whose stock prices tend to move together.5 These possibilitiesnotwithstanding, the differences between countries in the region andother markets are impressive, suggesting weak price discovery.
The combination of strong trading volumes and weak price discoverymay reflect the large and active participation of uninformed retailinvestors and the lack of a well-developed base of private domestic insti-tutional investors. MENA’s base of private institutional investors is verysmall by international comparison (see chapters 3 and 8). Institutionalinvestors are more likely than individual investors to support efficientprice discovery by basing investment decisions on fundamental researchrather than rumor or sentiment. Institutional investors may also be lesslikely to be taken in by market manipulation. In 2008, individualinvestors accounted for 60–80 percent of the value of shares traded inDubai, Kuwait, Egypt, and Qatar and more than 90 percent in SaudiArabia (table 9.6). Reactive and only partially informed trading by indi-viduals investing on their own rather than through institutional investorsmay have contributed to high price synchronicity in the United ArabEmirates, Qatar, and Saudi Arabia. Other empirical research is consis-tent with this conclusion. For example, after examining the large volumeof trading in the Saudi Arabia stock exchange in the past decade, Haddadand Hakim (2008) conclude that such trading was dominated by unin-formed retail investors.
Foreign investors seem to have contributed to price discovery, buttheir presence in MENA is uneven. Relying more on fundamentals andless on rumor, foreign investors may aid price discovery. In many MENA
232 Financial Access and Stability
TABLE 9.6
Percentage of Retail and Institutional Investors in SelectedEconomies in the Middle East and North Africa, 2008
(percent)
Economy Retail investors Institutional investors
Saudi Arabia 91 9Dubai 80 20Kuwait 71 29Egypt, Arab Rep. 66 34Qatar 62 38
Source: World Bank staff compilation based on data from NCB Capital and EGX.
FAS_215-238.qxd 8/31/11 8:16 PM Page 232

Capital Markets 233
stock markets, foreign investors account for 30 percent or more of valuetraded (table 9.7). Foreign participation varies widely in the GCC, rang-ing from less than 10 percent in Kuwait and Saudi Arabia to 40–50 per-cent in Bahrain and Dubai. Major GCC markets limit foreign ownershipof shares in listed companies, though some countries have been gradu-ally relaxing these barriers. The limited presence of foreign investors inSaudi Arabia may have contributed to high price synchronicity, whiletrading by better-informed investment companies may have offsetKuwait’s nearly as low level of foreign investment and contributed tobetter price discovery. Conversely, relatively high levels of foreign trad-ing in Bahrain, Egypt, and Tunisia may partly explain the good rankingsfor price discovery within MENA. Appendix B provides an econometricanalysis of the determinants of stock price synchronicity for MENAmarkets. It suggests that the presence of foreign investors may havereduced price synchronicity (for the original analysis, see Mako, Feyen,and Sourrouille 2011).
Raising Entrepreneurial Finance
Initial public offering (IPO) activity was relatively high in some countriesin the region in the precrisis period, although IPOs were concentrated infinancial services and infrastructure. IPOs peaked in 2007–08, decliningsharply thereafter, as a result of the global financial crisis. During 2006–10,IPOs on MENA stock markets raised US$41.5 billion.6 However, fourGCC states (Saudi Arabia, the United Arab Emirates, Qatar, and Bahrain)accounted for 84 percent of this total. Relative to GDP, amounts raisedthrough IPOs in these countries in 2006–09 exceeded the worldwide
TABLE 9.7
Foreign Investor Share of Value Traded in Selected Markets inthe Middle East and North Africa, 2005–08 (percent)
Economy 2005 2006 2007 2008
Abu Dhabi n.a. n.a. n.a. 25.9Bahrain 52.2 57.7 48.0 47.7Dubai n.a. n.a. 32.0 37.9Egypt, Arab Rep. 30.3 30.2 31.7 30.0Jordan 12.8 14.0 22.9 20.8Kuwait n.a. n.a. n.a. 8.5Saudi Arabia n.a. n.a. n.a. 4.0Tunisia n.a. n.a. n.a. 33.0
Source: World Bank staff compilation based on data from NCB Capital and EGX.
Note: n.a. = not applicable.
FAS_215-238.qxd 8/31/11 8:16 PM Page 233

average (figure 9.8). As an offshore financial center with a large share offinancial listings, Bahrain ranks high. Non-GCC markets are noticeablybelow the worldwide average, with the exception of Jordan. More impor-tant, industry and services have accounted for a small share of IPOs:between 2006 and 2010, infrastructure accounted for 58 percent andfinancial services for 19 percent of total IPO amounts, whereas industryaccounted for 15 percent and services 8 percent (Mako, Feyen, andSourrouille 2011).
Some countries have tried to facilitate access to equity finance by smalland medium enterprises—so far with limited success. In Tunisia, forinstance, the stock exchange provides three tiers of listings, with varyinglisting requirements, to facilitate the listing of different-sized firms. Thenumber of listed firms actually declined slightly, however, from 77 at end-2008 to 76 at end-2009. To encourage small and medium enterprise IPOsin Egypt, in October 2007 the Egyptian Exchange established a separateand distinct board (NILEX) for small and medium enterprise listings.NILEX offers more flexible listing rules on the minimum number of IPOsubscribers and issued shares, audits (annual financial statements only),financial history, and listing fees. Despite these changes, as of end-2009,only nine small and medium enterprises had listed on NILEX, and nonehad raised equity finance through an IPO. Worldwide it has remaineddifficult to induce small and medium enterprises to raise equity financethrough IPOs. As of end-2011, at least 17 small and medium enterprisesand at least 1 IPO were listed.
Privatization
Several countries in the region have undertaken significant privatizationprograms over the past 10–20 years that included IPOs in the local stockmarket. However, the pricing for many privatization IPOs in the GCC hasbeen highly artificial, undermining development of local markets’ capac-ity to price new issues. Unlike the book-building process followed inother emerging markets, GCC markets have priced IPOs at an arbitrarypar value chosen by the government. In order to share hydrocarbon-based wealth with all citizens, GCC governments distributed the equityfrom state-owned enterprises at deep discounts to market value. Deepdiscount distributions resulted in massive oversubscriptions, creating theneed for a rationing process. There remains a huge potential for manyMENA governments to transfer shareholdings in numerous state enter-prises to private institutional and retail investors. To avoid retarding thedevelopment of the markets’ price discovery function, it will be impor-tant to follow a more traditional book-building approach to pricing pri-vatization IPOs.
234 Financial Access and Stability
FAS_215-238.qxd 8/31/11 8:16 PM Page 234

Capital Markets 235
FIGURE 9.8
Initial Public Offerings as a Percentage of GDP in SelectedCountries, 2006–09
0 1percent
2
SloveniaBahrain
SingaporeIndia
VietnamUnited Arab Emirates
NorwayUnited Kingdom
AustraliaIreland
Saudi ArabiaAustria
QatarJordan
BrazilKenyaChina
PolandKazakhstanSwitzerland
SpainMalaysiaColombia
Papua New GuineaMoroccoThailand
IsraelNigeriaCanada
Egypt, Arab Rep.Russian Federation
CyprusPanamaBulgaria
Korea, Rep.United States
IndonesiaGhanaTurkey
GermanyTunisia
PhilippinesOman
Syrian Arab RepublicItaly
PakistanNew Zealand
Czech RepublicMexico
BangladeshGreece
ChileKuwait
Argentina
4.5
Source: World Bank staff compilation based on data from the Arab Monetary Fund (AMF) for MENA coun-tries and the World Federation of Exchanges for other countries.
Note: IPO amounts from the AMF and World Federation of Exchanges are identical or reasonably close forBahrain, Egypt, Saudi Arabia, and the United Arab Emirates. For other MENA countries, World Federation ofExchanges data may include transactions (new listings, secondary offerings) that are not strictly IPOs.
FAS_215-238.qxd 8/31/11 8:16 PM Page 235

Corporate Governance
The ability of a country’s equity market to promote good corporate gov-ernance depends on opportunities for shareholders and other stakehold-ers to be aware of and influence events at listed companies. A 2008 surveyof 155 listed companies in 11 countries in the region found that not a sin-gle company could claim to follow best practice in corporate governance(IFC and Hawkamah 2008). Surveyed companies lack basics for effectiveboard oversight, such as a sufficient number of independent directors anda separate audit committee with a majority of independent directors thatreports to the board. Both internal and external audit practices are under-developed in many cases, and financial and other disclosure is spotty.Minority public shareholders may lack ready access to give voice and pro-tect their interests. A 2009 report focusing on corporate governance ofMENA banks confirms the need to upgrade boards of directors, improvenonfinancial disclosure, and control conflicts of interest and related-partytransactions (OECD, Hawkamah, and UAB 2009).
Notes
1. This section is based on Garcia-Kilroy and Silva (2011).2. This section is based on Endo (2011).3. The Accounting and Auditing Organization for Islamic Financial Institutions
(AAOIFI) defines sukuks as certificates of equal value representing undividedshares in the ownership of tangible assets, usufructs, services, or (in the own-ership of) the assets of particular projects or special investment activity.
4. This section is based on Mako, Feyen, and Sourrouille (2011). 5. Alves, Peasnell, and Taylor (2010) stress these limitations and the need to
account for confounding factors.6. MENA markets also support some level of secondary public offerings (SPOs)
but definitions of SPOs are not uniform in the region. Estimates of SPOs varywidely, perhaps because of differing definitions. Private placement–type SPOtransactions may account for 90 percent of SPO proceeds in the region.
References
Alves, P., K. Peasnell, and P. Taylor. 2010. “The Use of the R2 as a Measure ofFirm-Specific Information: A Cross-Country Critique.” Journal of BusinessFinance and Accounting 37 (1): 1–26.
BIS CGFS (Bank for International Settlements, Committee on the Global Finan-cial System). 2007. Report on Financial Stability and Local Currency Bond Mar-kets. Basel: BIS.
Endo, T. 2011. “Debt/Sukuk Market Development in the GCC Region.” WorldBank, Washington, DC.
236 Financial Access and Stability
FAS_215-238.qxd 8/31/11 8:16 PM Page 236

Capital Markets 237
Garcia-Kilroy, C., and A. C. Silva. 2011. “Reforming Government Debt Marketsin MENA.” Policy Research Working Paper 5611, World Bank, Washington,DC.
Haddad, M., and S. Hakim. 2008. “Irrational Exuberance in the Saudi StockExchange.” Paper presented at the 15th annual conference of the EconomicResearch Forum, Cairo, November 23–25.
IFC (International Finance Corporation) and Hawkamah Institute. 2008. A Cor-porate Governance Survey of Listed Companies and Banks across the Middle East andNorth Africa. Washington, DC: IFC; and Dubai: Hawkamah.
Mako, W. P., E. Feyen, and D. Sourrouille. 2011. “Arab Equity Markets.” WorldBank, Washington, DC.
Morck, R., B. Yeung, and W. Yu. 2000. “The Information Content of Stock Mar-kets: Why Do Emerging Markets Have Synchronous Stock Price Move-ments?” Journal of Financial Economics 58 (1–2): 215–60.
OECD (Organisation for Economic Cooperation and Development),Hawkamah, and UAB (Union of Arab Banks). 2009. Policy Brief on ImprovingCorporate Governance of Banks in the Middle East and North Africa. Global Cor-porate Governance Forum. Paris: OECD.
Standard & Poor’s. 2010.
FAS_215-238.qxd 8/31/11 8:16 PM Page 237