Embed Size (px)
Citation preview
Capital Markets: Observations and Insights Earnings Resurgence Spring 2017
Key Observations
Page 2
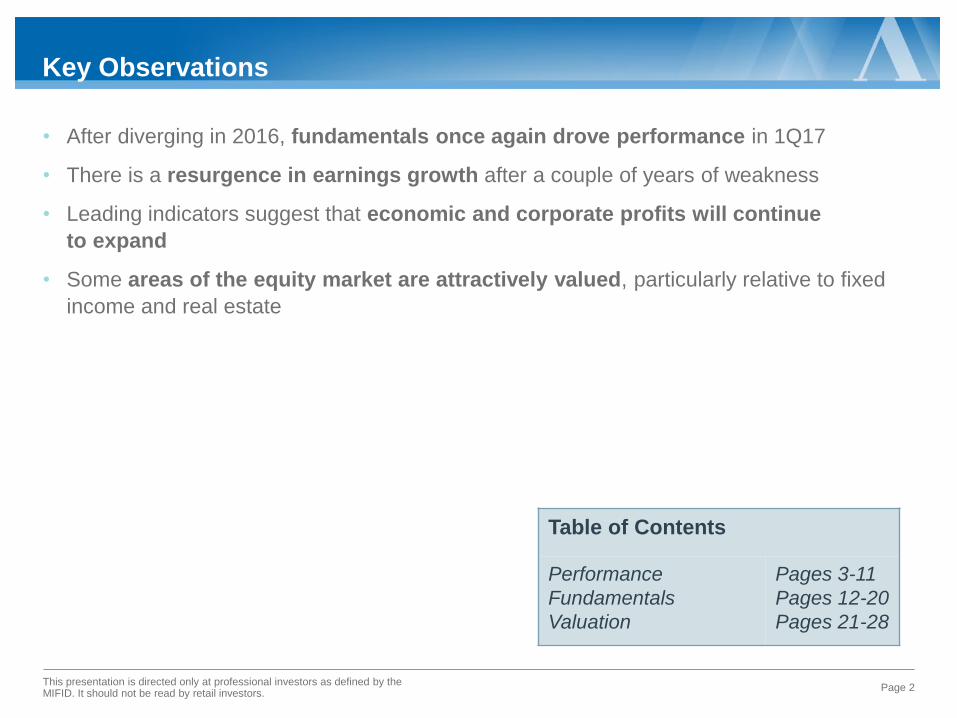
Table of Contents
Performance
Fundamentals
Valuation
Pages 3-11
Pages 12-20
Pages 21-28
• After diverging in 2016, fundamentals once again drove performance in 1Q17
• There is a resurgence in earnings growth after a couple of years of weakness
• Leading indicators suggest that economic and corporate profits will continue
to expand
• Some areas of the equity market are attractively valued, particularly relative to fixed
income and real estate
This presentation is directed only at professional investors as defined by the MIFID. It should not be read by retail investors.
Strong Fundamental Data Drove Performance
Performance
Page 3
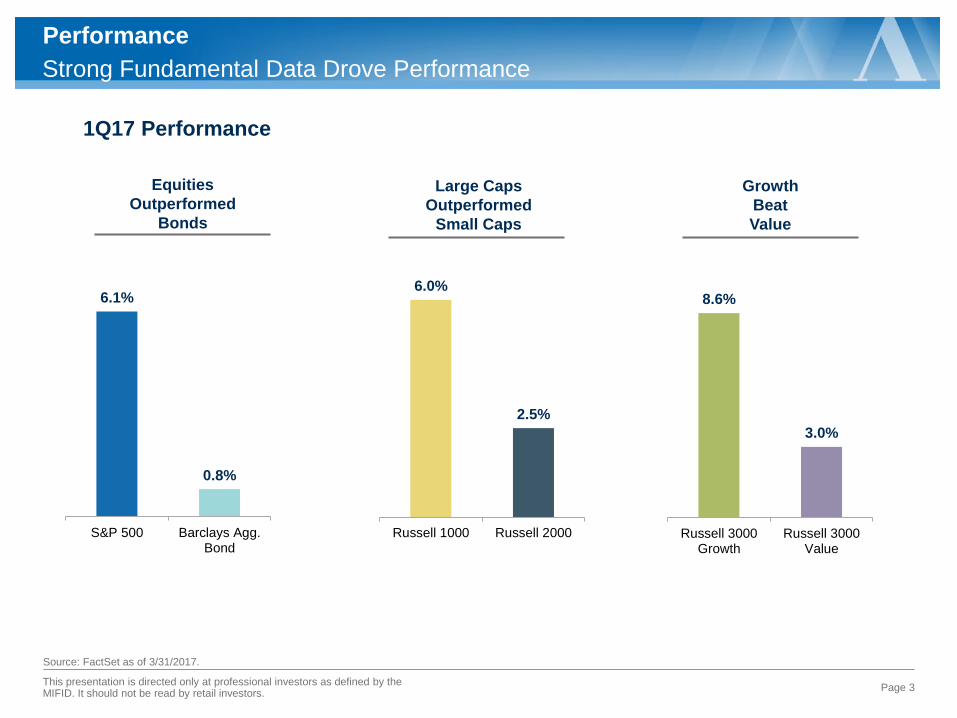
Source: FactSet as of 3/31/2017.
6.1%
0.8%
S&P 500 Barclays Agg.Bond
Equities
Outperformed
Bonds
Large Caps
Outperformed
Small Caps
Growth
Beat
Value
6.0%
2.5%
Russell 1000 Russell 2000
8.6%
3.0%
Russell 3000Growth
Russell 3000Value
1Q17 Performance
This presentation is directed only at professional investors as defined by the MIFID. It should not be read by retail investors.
-10
-5
0
5
10
15
20
25
30
Energ
y
Tele
com
Fin
ancia
ls
Industr
ials
Ma
teri
als
Utilit
ies
Techn
olo
gy
Co
nsum
er
Dis
cre
tio
nary
Co
nsum
er
Sta
ple
s
He
alth C
are
U.S. World
Growth Sectors Led in 1Q17
Performance
Page 4
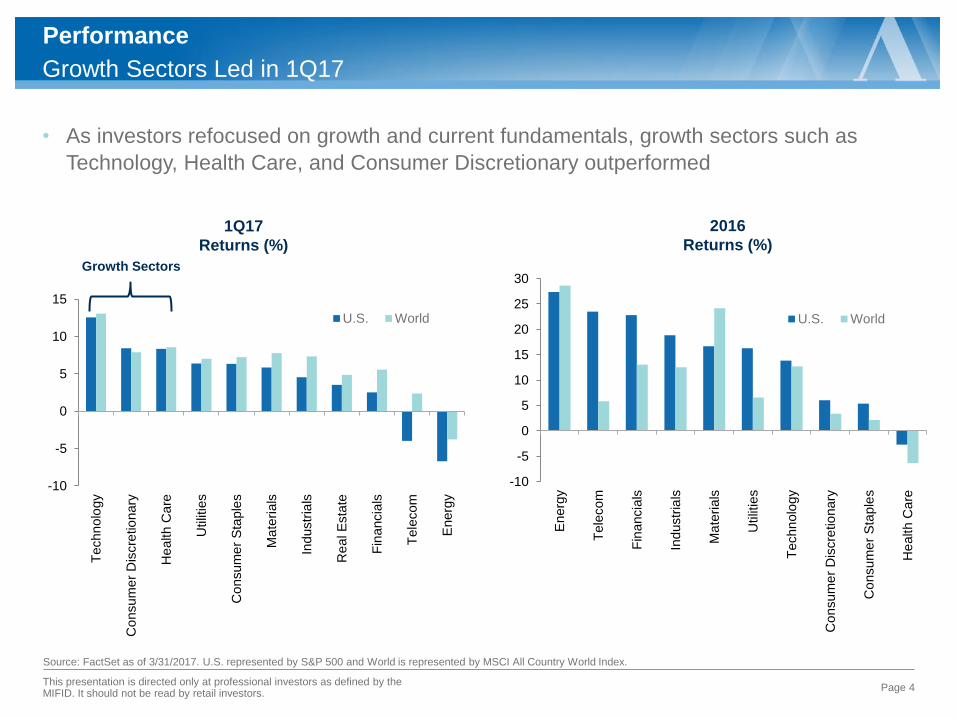
Source: FactSet as of 3/31/2017. U.S. represented by S&P 500 and World is represented by MSCI All Country World Index.
-10
-5
0
5
10
15
Techn
olo
gy
Co
nsum
er
Dis
cre
tio
nary
He
alth C
are
Utilit
ies
Co
nsum
er
Sta
ple
s
Ma
teri
als
Industr
ials
Re
al E
sta
te
Fin
ancia
ls
Tele
com
Energ
y
U.S. World
• As investors refocused on growth and current fundamentals, growth sectors such as
Technology, Health Care, and Consumer Discretionary outperformed
1Q17
Returns (%)
2016
Returns (%)
Growth Sectors
This presentation is directed only at professional investors as defined by the MIFID. It should not be read by retail investors.
0
20
40
60
80
100
-10
-5
0
5
10
15
Techn
olo
gy
Co
nsum
er
Dis
c
He
alth C
are
Utilit
ies
Co
nsum
er
Sta
ple
s
S&
P 5
00
Ma
teri
als
Industr
ials
Re
al E
sta
te
Fin
ancia
ls
Tele
com
Energ
y
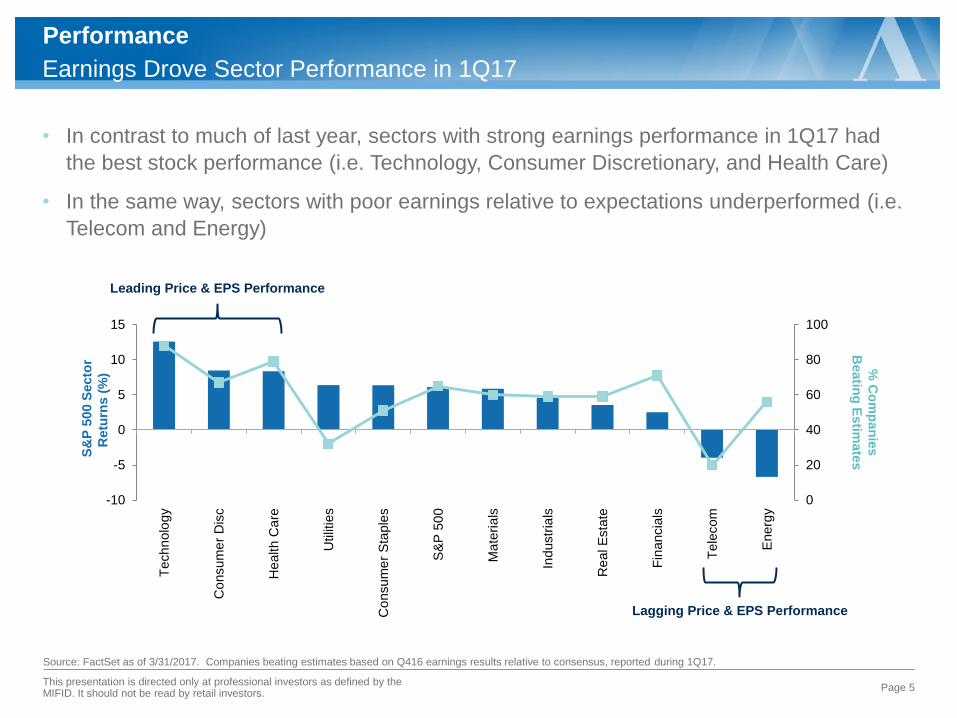
Earnings Drove Sector Performance in 1Q17
Performance
Page 5
Source: FactSet as of 3/31/2017. Companies beating estimates based on Q416 earnings results relative to consensus, reported during 1Q17.
S&
P 5
00 S
ecto
r
Retu
rns (
%)
% C
om
pan
ies
Beatin
g E
stim
ate
s
• In contrast to much of last year, sectors with strong earnings performance in 1Q17 had
the best stock performance (i.e. Technology, Consumer Discretionary, and Health Care)
• In the same way, sectors with poor earnings relative to expectations underperformed (i.e.
Telecom and Energy)
Lagging Price & EPS Performance
Leading Price & EPS Performance
This presentation is directed only at professional investors as defined by the MIFID. It should not be read by retail investors.
Page 6
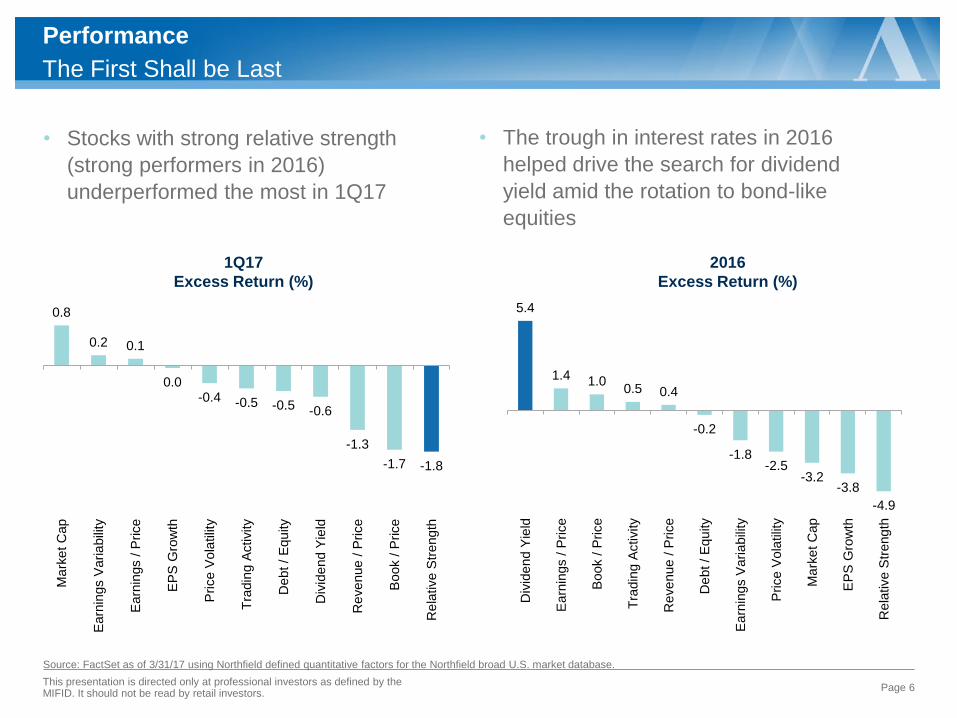
• Stocks with strong relative strength
(strong performers in 2016)
underperformed the most in 1Q17
The First Shall be Last
Performance
0.8
0.2 0.1
0.0 -0.4 -0.5 -0.5 -0.6
-1.3
-1.7 -1.8
Ma
rke
t C
ap
Earn
ings V
aria
bili
ty
Earn
ings / P
rice
EP
S G
row
th
Price V
ola
tilit
y
Tra
din
g A
ctivity
De
bt /
Equ
ity
Div
ide
nd Y
ield
Re
ve
nue
/ P
rice
Book / P
rice
Re
lative S
treng
th
1Q17
Excess Return (%)
5.4
1.4 1.0 0.5 0.4
-0.2
-1.8 -2.5
-3.2 -3.8
-4.9
Div
ide
nd Y
ield
Earn
ings / P
rice
Book / P
rice
Tra
din
g A
ctivity
Re
ve
nue
/ P
rice
De
bt /
Equ
ity
Earn
ings V
aria
bili
ty
Price V
ola
tilit
y
Ma
rke
t C
ap
EP
S G
row
th
Re
lative S
tre
ng
th
2016
Excess Return (%)
• The trough in interest rates in 2016
helped drive the search for dividend
yield amid the rotation to bond-like
equities
This presentation is directed only at professional investors as defined by the MIFID. It should not be read by retail investors.
Source: FactSet as of 3/31/17 using Northfield defined quantitative factors for the Northfield broad U.S. market database.
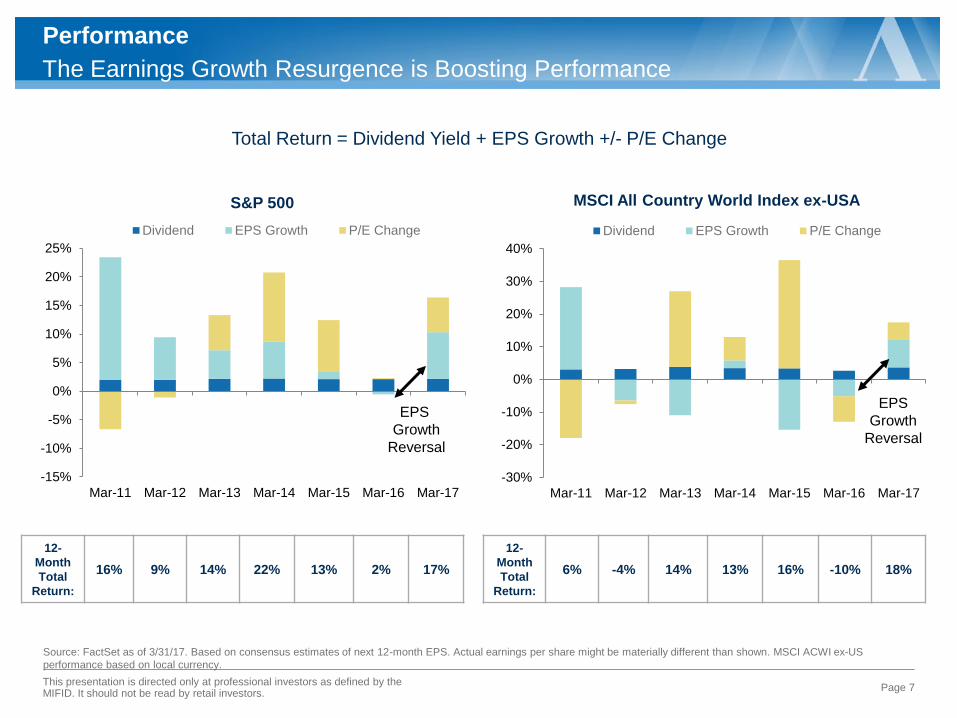
The Earnings Growth Resurgence is Boosting Performance
Performance
Page 7
Source: FactSet as of 3/31/17. Based on consensus estimates of next 12-month EPS. Actual earnings per share might be materially different than shown. MSCI ACWI ex-US
performance based on local currency.
Total Return = Dividend Yield + EPS Growth +/- P/E Change
-15%
-10%
-5%
0%
5%
10%
15%
20%
25%
Mar-11 Mar-12 Mar-13 Mar-14 Mar-15 Mar-16 Mar-17
Dividend EPS Growth P/E Change
12-
Month
Total
Return:
16% 9% 14% 22% 13% 2% 17%
12-
Month
Total
Return:
6% -4% 14% 13% 16% -10% 18%
S&P 500 MSCI All Country World Index ex-USA
-30%
-20%
-10%
0%
10%
20%
30%
40%
Mar-11 Mar-12 Mar-13 Mar-14 Mar-15 Mar-16 Mar-17
Dividend EPS Growth P/E Change
EPS
Growth
Reversal
This presentation is directed only at professional investors as defined by the MIFID. It should not be read by retail investors.
EPS
Growth
Reversal
74%
32% 30%
44% 39%
65%
93%
45% 42% 36%
43%
19%
Aug-5
6
De
c-6
1
Feb
-66
No
v-6
8
Jan-7
3
No
v-8
0
Aug-8
7
Jul-9
0
Ma
r-0
0
Oct-
07
Me
dia
n
Cu
rren
t
This presentation is directed only at professional investors as defined by the MIFID. It should not be read by retail investors.
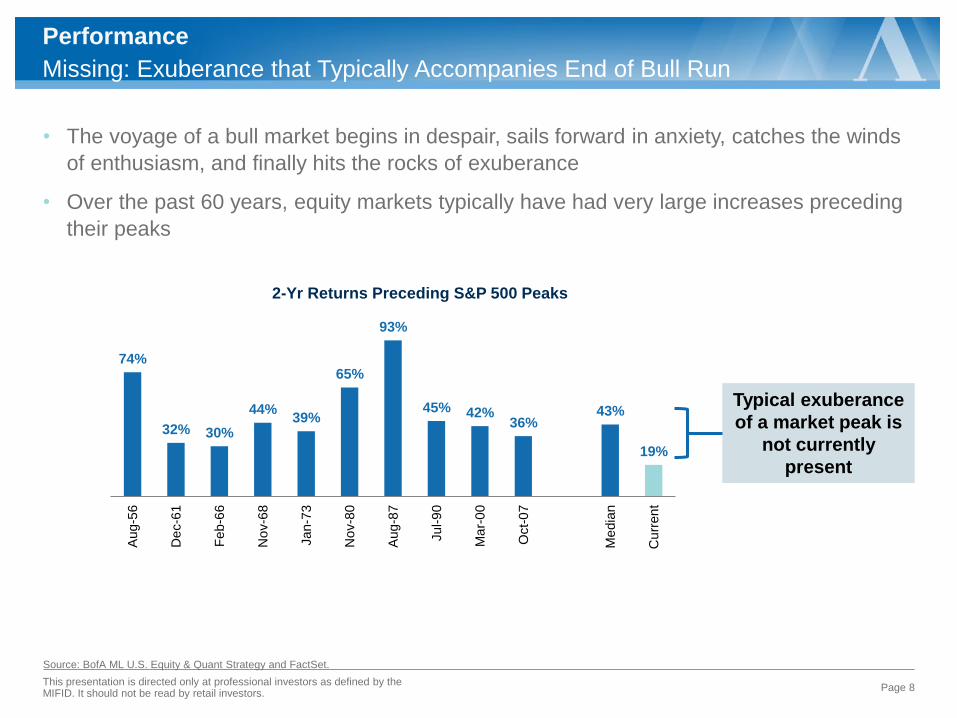
Missing: Exuberance that Typically Accompanies End of Bull Run
Source: BofA ML U.S. Equity & Quant Strategy and FactSet.
• The voyage of a bull market begins in despair, sails forward in anxiety, catches the winds
of enthusiasm, and finally hits the rocks of exuberance
• Over the past 60 years, equity markets typically have had very large increases preceding
their peaks
Page 8
Performance
Typical exuberance
of a market peak is
not currently
present
2-Yr Returns Preceding S&P 500 Peaks
0
2
4
6
8
10
12
14
1920 1934 1947 1961 1975 1988 2002 2016 2030
Dura
tion o
f B
ull
Mark
et (Y
ears
)
Year that Bull Market Ended
1990s Bull
Market
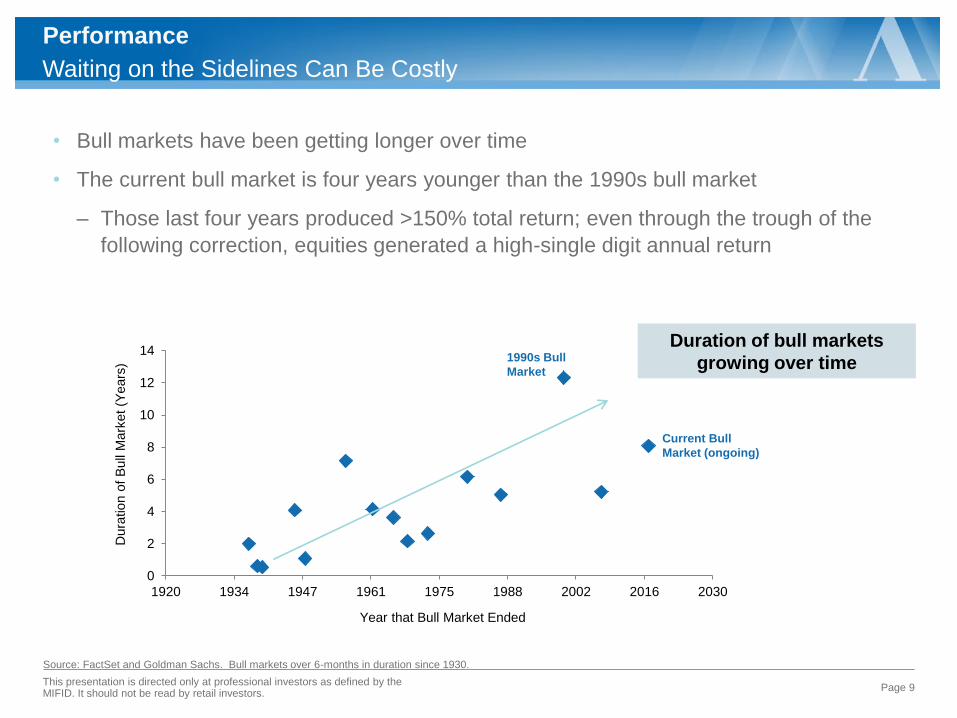
Waiting on the Sidelines Can Be Costly
Source: FactSet and Goldman Sachs. Bull markets over 6-months in duration since 1930.
• Bull markets have been getting longer over time
• The current bull market is four years younger than the 1990s bull market
‒ Those last four years produced >150% total return; even through the trough of the
following correction, equities generated a high-single digit annual return
Page 9
Performance
Duration of bull markets
growing over time
Current Bull
Market (ongoing)
This presentation is directed only at professional investors as defined by the MIFID. It should not be read by retail investors.
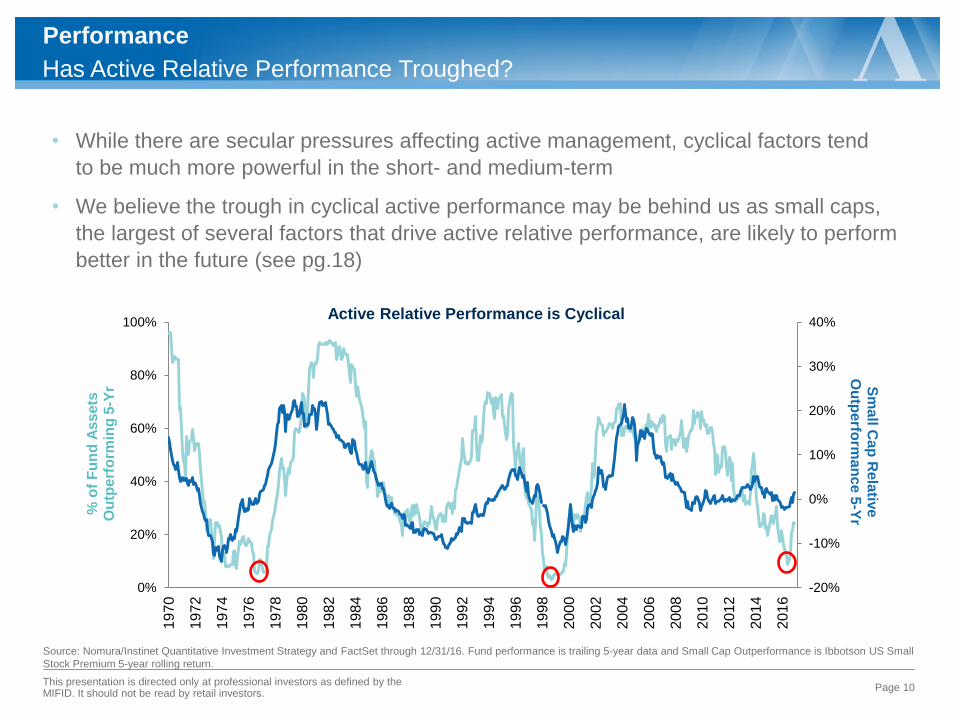
Has Active Relative Performance Troughed?
Source: Nomura/Instinet Quantitative Investment Strategy and FactSet through 12/31/16. Fund performance is trailing 5-year data and Small Cap Outperformance is Ibbotson US Small
Stock Premium 5-year rolling return.
Page 10
• While there are secular pressures affecting active management, cyclical factors tend
to be much more powerful in the short- and medium-term
• We believe the trough in cyclical active performance may be behind us as small caps,
the largest of several factors that drive active relative performance, are likely to perform
better in the future (see pg.18)
Performance
Active Relative Performance is Cyclical
-20%
-10%
0%
10%
20%
30%
40%
0%
20%
40%
60%
80%
100%
1970
1972
1974
1976
1978
1980
1982
1984
1986
1988
1990
1992
1994
1996
1998
2000
2002
2004
2006
2008
2010
2012
2014
2016
Sm
all C
ap
Re
lativ
e
Ou
tpe
rform
an
ce
5-Y
r %
of
Fu
nd
As
se
ts
Ou
tpe
rfo
rmin
g 5
-Yr
This presentation is directed only at professional investors as defined by the MIFID. It should not be read by retail investors.
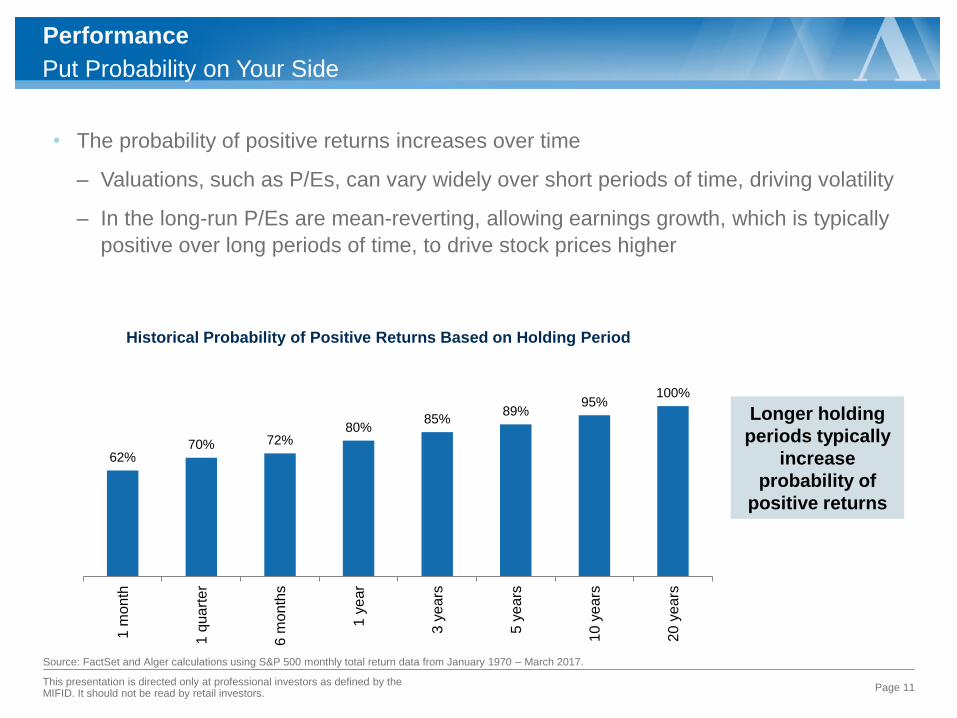
Put Probability on Your Side
Source: FactSet and Alger calculations using S&P 500 monthly total return data from January 1970 – March 2017.
• The probability of positive returns increases over time
‒ Valuations, such as P/Es, can vary widely over short periods of time, driving volatility
‒ In the long-run P/Es are mean-reverting, allowing earnings growth, which is typically
positive over long periods of time, to drive stock prices higher
Page 11
Performance
Historical Probability of Positive Returns Based on Holding Period
62% 70% 72%
80% 85%
89% 95%
100%
1 m
onth
1 q
ua
rte
r
6 m
onth
s
1 y
ear
3 y
ears
5 y
ears
10 y
ears
20 y
ears
Longer holding
periods typically
increase
probability of
positive returns
This presentation is directed only at professional investors as defined by the MIFID. It should not be read by retail investors.

$0
$1
$10
$100
$1,000
1
10
100
1,000
10,000
1900 1925 1950 1975 2000
S&
P 5
00 P
rice (
Lo
g S
cale
)
Source: FactSet, S&P, Robert Shiller. Data through March 31, 2017.
The Stock Market Engine Runs on Earnings Growth
This presentation is directed only at professional investors as defined by the MIFID. It should not be read by retail investors.
• “In the short run, the market is a voting machine, but in the long run, it is a weighing
machine.” –Ben Graham
• EPS growth has averaged approximately 6% annually over the past 50 years
Page 12
Fundamentals
In the short term,
sentiment/valuation drives
returns; in the long term,
stock prices grow
exponentially with earnings
2017
S&
P 5
00 E
PS
(Lo
g S
cale
)
$50
$75
$100
$125
$150
90
100
110
120
130
20
04
20
05
20
06
20
07
20
08
20
09
20
10
20
11
20
12
20
13
20
14
20
15
20
16
20
17
S&
P 5
00 E
PS
Lead
ing
Eco
no
mic
In
dex
17
Month
Lead
Source: FactSet, Conference Board.
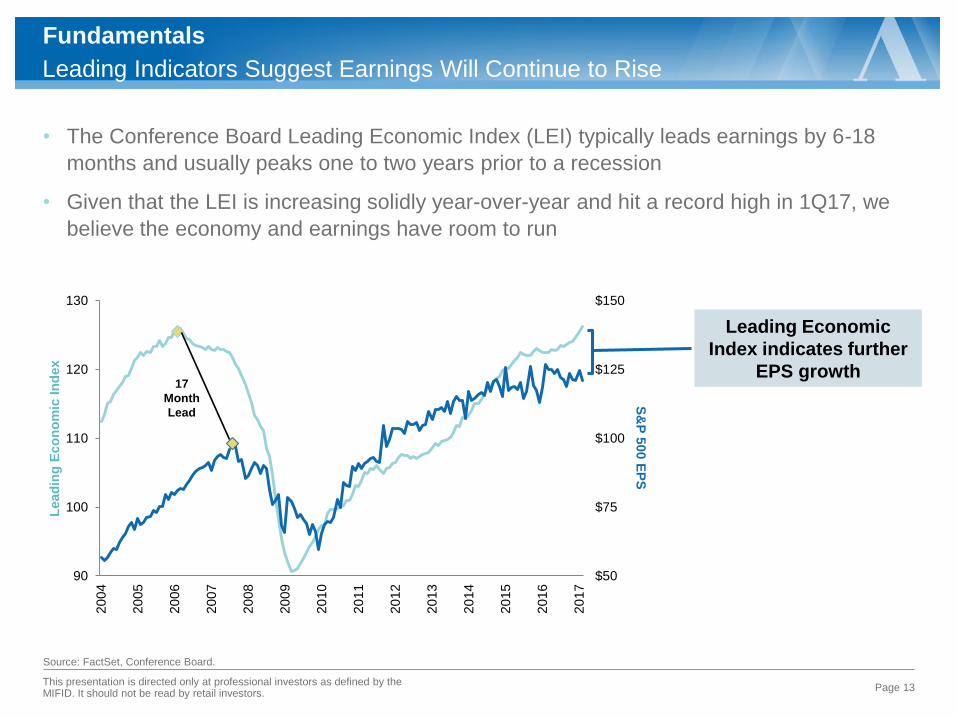
Leading Indicators Suggest Earnings Will Continue to Rise
This presentation is directed only at professional investors as defined by the MIFID. It should not be read by retail investors.
• The Conference Board Leading Economic Index (LEI) typically leads earnings by 6-18
months and usually peaks one to two years prior to a recession
• Given that the LEI is increasing solidly year-over-year and hit a record high in 1Q17, we
believe the economy and earnings have room to run
Page 13
Fundamentals
Leading Economic
Index indicates further
EPS growth
Page 14
Source: FactSet as of 3/31/17. Inflation represented by PCE Price Index ex-food and energy (year over year).
-2
0
2
4
6
8
10
12
14
16
18
20
19
66
19
69
19
72
19
75
19
78
19
81
19
84
19
87
19
90
19
93
19
96
19
99
20
02
20
05
20
08
20
11
20
14
20
17
Recession Fed Funds Effective Rate Inflation
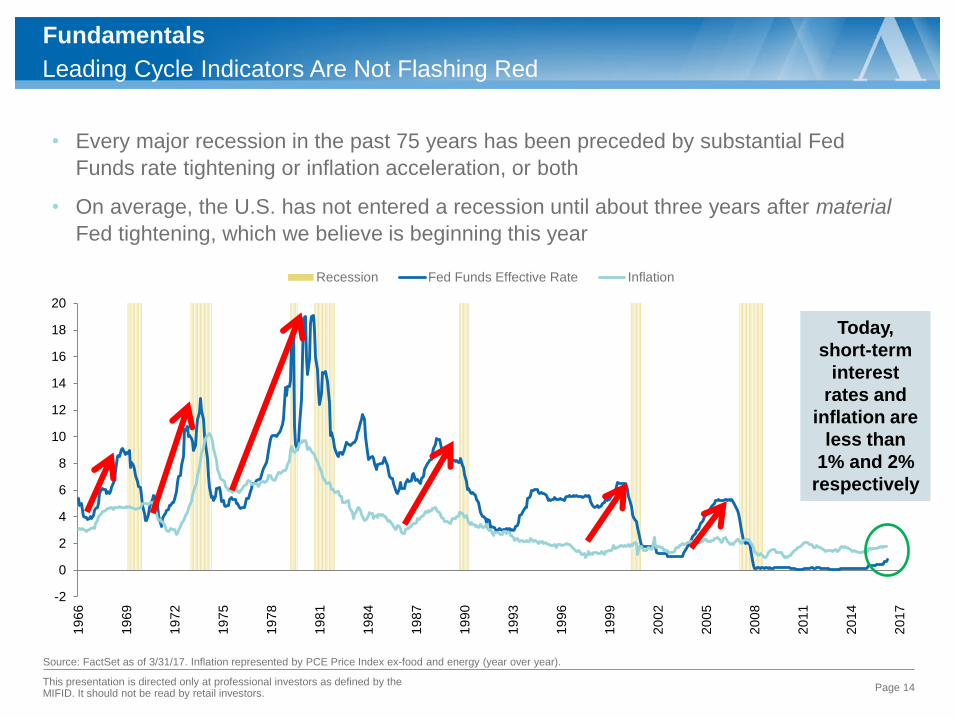
• Every major recession in the past 75 years has been preceded by substantial Fed
Funds rate tightening or inflation acceleration, or both
• On average, the U.S. has not entered a recession until about three years after material
Fed tightening, which we believe is beginning this year
Today,
short-term
interest
rates and
inflation are
less than
1% and 2%
respectively
Leading Cycle Indicators Are Not Flashing Red
Fundamentals
This presentation is directed only at professional investors as defined by the MIFID. It should not be read by retail investors.
Economic Outlook
• Strong consumer balance sheet
• Rising real disposable income
• Improving consumer and business confidence
• Fiscal stimulus
• Tightening monetary policy (U.S. and China)
• Political risk
• Rising U.S. dollar
• Increasing energy prices
Tailwinds
Headwinds
Page 15
Fundamentals
This presentation is directed only at professional investors as defined by the MIFID. It should not be read by retail investors.

Fiscal Policy Could Boost Earnings Materially
Source: Tax Foundation and Cornerstone Macro. “Consumer” is higher wages and “Business” is capital stock.
• A 10 percentage point decline in the corporate tax rate would likely boost S&P 500 EPS
by about 8%
• Business spending would likely benefit more than consumer spending given lower
corporate tax rates increase in enterprise cash flow higher business spending
‒ The Tax Foundation’s analysis of the Trump plan suggests that wages should increase
5% but capital stock (i.e. business spending) would be 20% higher!
Page 16
Fundamentals
5%
20%
Consumer Business
Impact of Trump Plan Relative to Baseline (Over a Decade)
Business spending to
outpace consumer spending
This presentation is directed only at professional investors as defined by the MIFID. It should not be read by retail investors.
Margins Set to Drive Earnings Higher
Fundamentals
Page 17
Source: BofA using current S&P 500 constituents through 12/31/16.
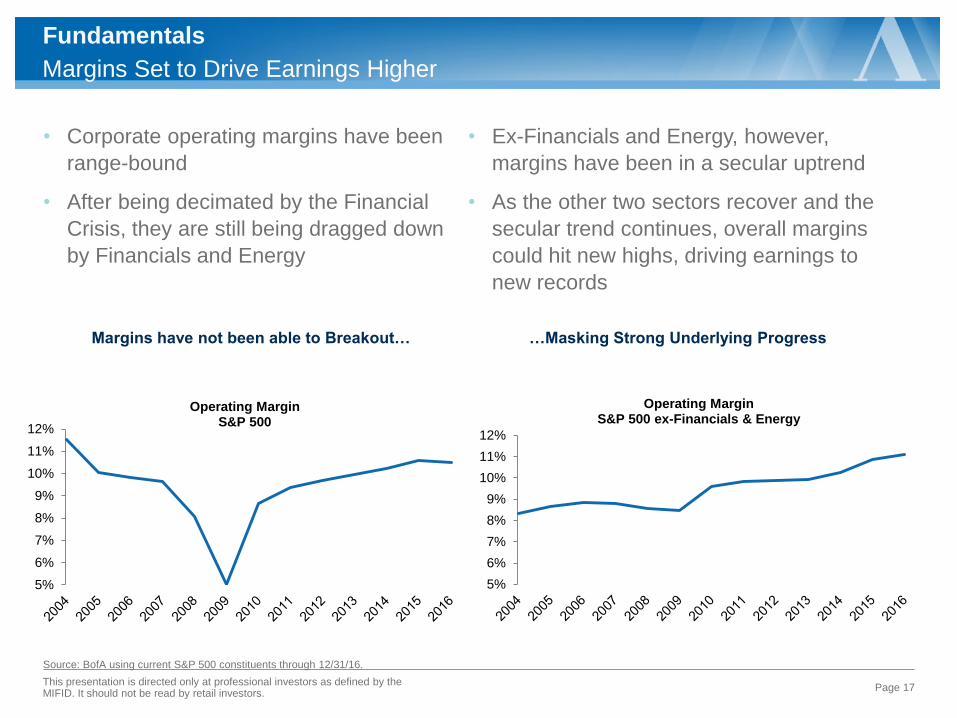
• Corporate operating margins have been
range-bound
• After being decimated by the Financial
Crisis, they are still being dragged down
by Financials and Energy
• Ex-Financials and Energy, however,
margins have been in a secular uptrend
• As the other two sectors recover and the
secular trend continues, overall margins
could hit new highs, driving earnings to
new records
Margins have not been able to Breakout…
5%
6%
7%
8%
9%
10%
11%
12%
Operating Margin S&P 500
5%
6%
7%
8%
9%
10%
11%
12%
Operating Margin S&P 500 ex-Financials & Energy
…Masking Strong Underlying Progress
This presentation is directed only at professional investors as defined by the MIFID. It should not be read by retail investors.
80
100
120
140
160
180
200
20
13
20
14
20
15
20
16
20
17
20
18
Earnings Per Share
Russell 2000 Russell 1000
Smaller Capitalization Stocks Poised to Outperform
Fundamentals
Page 18
Source: FactSet as of March 2017. EPS for 2017-2018 are consensus estimates and actual earnings per share might be materially different than shown.
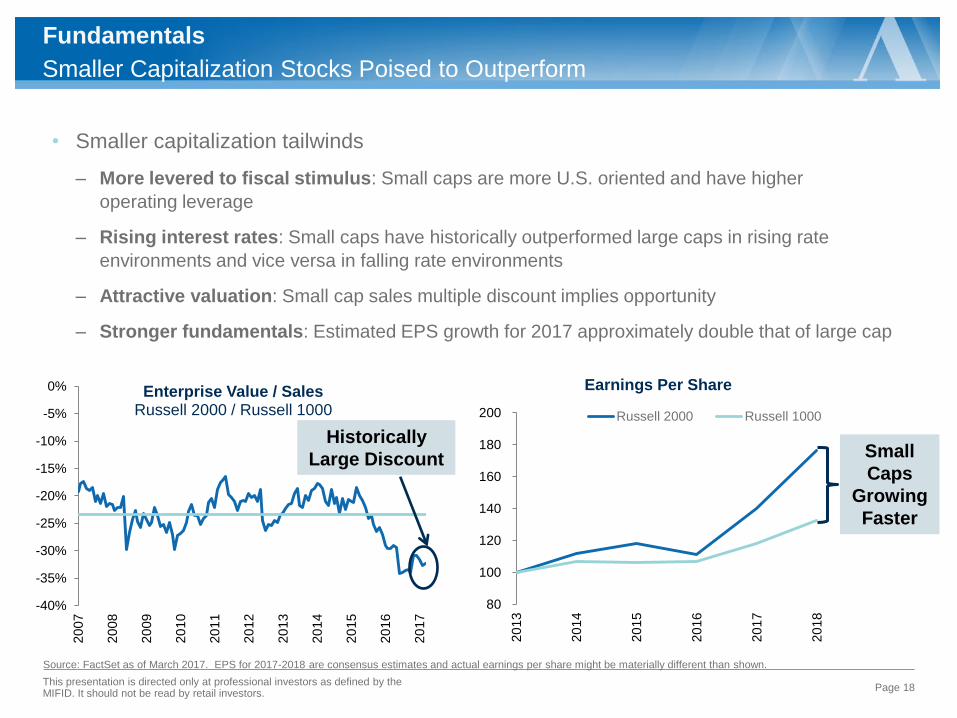
• Smaller capitalization tailwinds
‒ More levered to fiscal stimulus: Small caps are more U.S. oriented and have higher
operating leverage
‒ Rising interest rates: Small caps have historically outperformed large caps in rising rate
environments and vice versa in falling rate environments
‒ Attractive valuation: Small cap sales multiple discount implies opportunity
‒ Stronger fundamentals: Estimated EPS growth for 2017 approximately double that of large cap
-40%
-35%
-30%
-25%
-20%
-15%
-10%
-5%
0%
20
07
20
08
20
09
20
10
20
11
20
12
20
13
20
14
20
15
20
16
20
17
Enterprise Value / Sales Russell 2000 / Russell 1000
Historically
Large Discount Small
Caps
Growing
Faster
This presentation is directed only at professional investors as defined by the MIFID. It should not be read by retail investors.
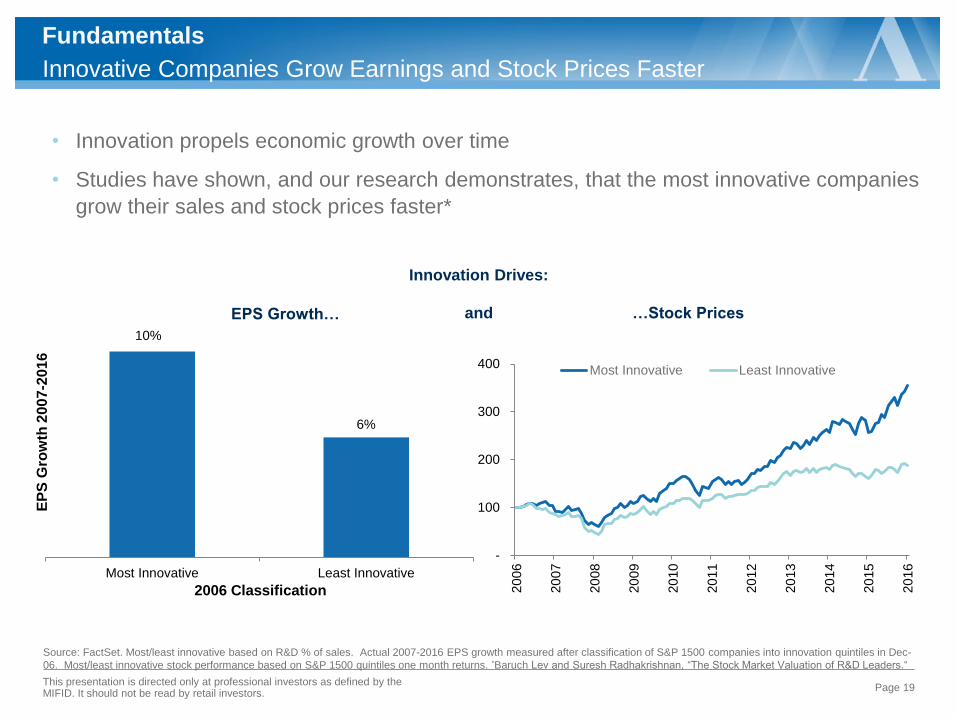
Innovative Companies Grow Earnings and Stock Prices Faster
Source: FactSet. Most/least innovative based on R&D % of sales. Actual 2007-2016 EPS growth measured after classification of S&P 1500 companies into innovation quintiles in Dec-
06. Most/least innovative stock performance based on S&P 1500 quintiles one month returns. *Baruch Lev and Suresh Radhakrishnan, “The Stock Market Valuation of R&D Leaders.“
• Innovation propels economic growth over time
• Studies have shown, and our research demonstrates, that the most innovative companies
grow their sales and stock prices faster*
Page 19
Fundamentals
10%
6%
Most Innovative Least Innovative
EP
S G
row
th 2
00
7-2
016
2006 Classification
EPS Growth…
-
100
200
300
400
20
06
20
07
20
08
20
09
20
10
20
11
20
12
20
13
20
14
20
15
20
16
Most Innovative Least Innovative
…Stock Prices
Innovation Drives:
and
This presentation is directed only at professional investors as defined by the MIFID. It should not be read by retail investors.
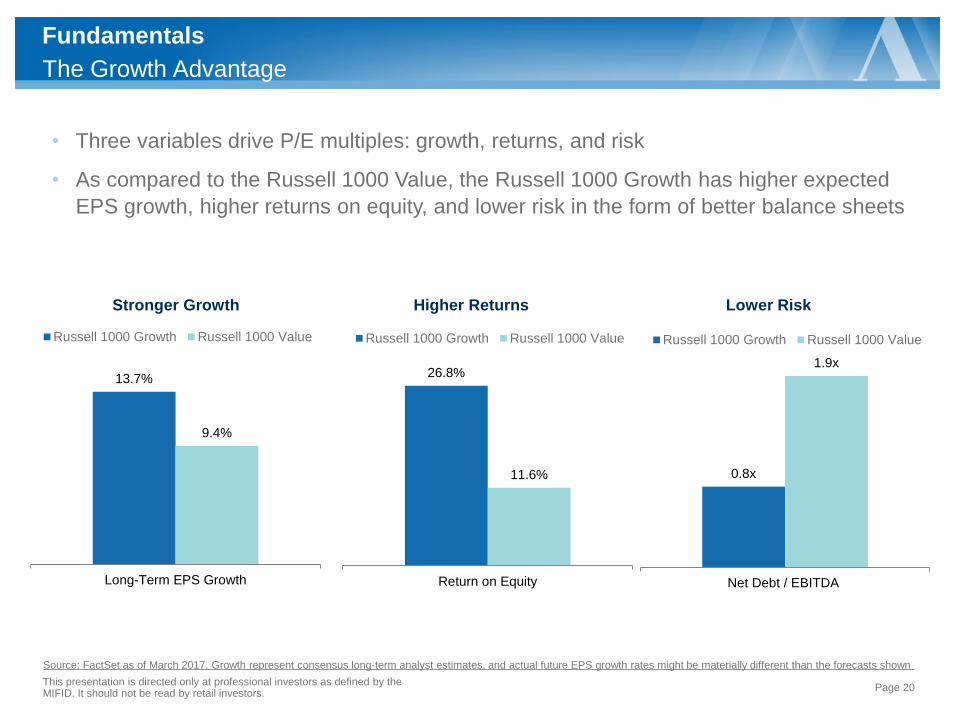
The Growth Advantage
Source: FactSet as of March 2017. Growth represent consensus long-term analyst estimates, and actual future EPS growth rates might be materially different than the forecasts shown
• Three variables drive P/E multiples: growth, returns, and risk
• As compared to the Russell 1000 Value, the Russell 1000 Growth has higher expected
EPS growth, higher returns on equity, and lower risk in the form of better balance sheets
Page 20
Fundamentals
This presentation is directed only at professional investors as defined by the MIFID. It should not be read by retail investors.
Stronger Growth
13.7%
9.4%
Long-Term EPS Growth
Russell 1000 Growth Russell 1000 Value
Higher Returns
26.8%
11.6%
Return on Equity
Russell 1000 Growth Russell 1000 Value
Lower Risk
0.8x
1.9x
Net Debt / EBITDA
Russell 1000 Growth Russell 1000 Value
-5%
0%
5%
10%
15%
20%
25%
5 10 15 20 25 30
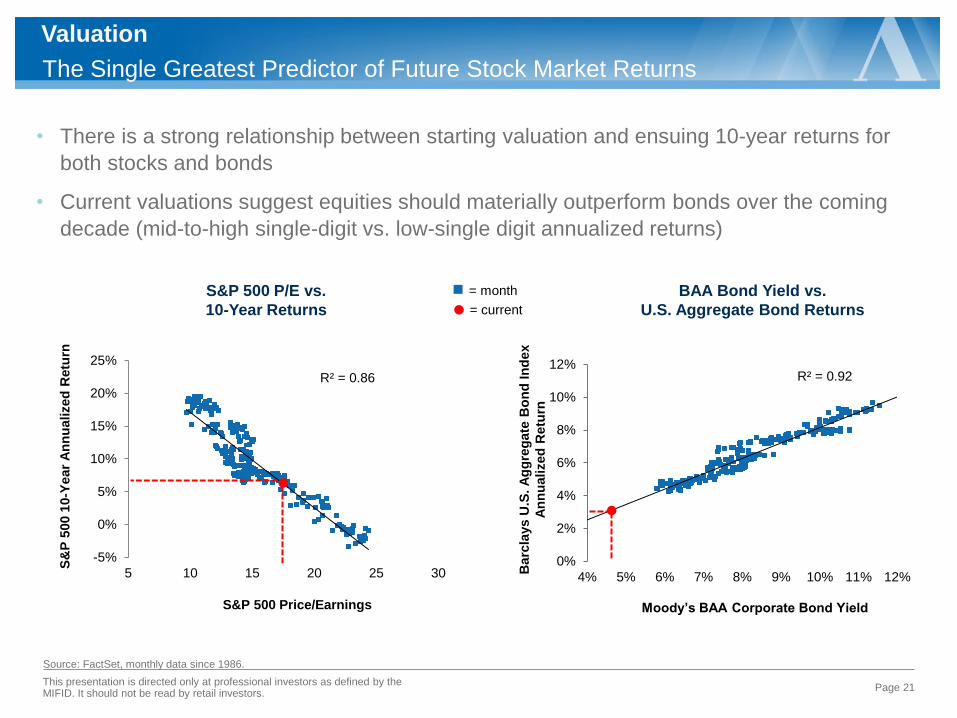
Source: FactSet, monthly data since 1986.
• There is a strong relationship between starting valuation and ensuing 10-year returns for
both stocks and bonds
• Current valuations suggest equities should materially outperform bonds over the coming
decade (mid-to-high single-digit vs. low-single digit annualized returns)
Page 21
S&P 500 P/E vs.
10-Year Returns
S&P 500 Price/Earnings
S&
P 5
00 1
0-Y
ear
An
nu
alized
Retu
rn
R² = 0.86
= month
0%
2%
4%
6%
8%
10%
12%
4% 5% 6% 7% 8% 9% 10% 11% 12%
BAA Bond Yield vs.
U.S. Aggregate Bond Returns
R² = 0.92
Barc
lays U
.S. A
gg
reg
ate
Bo
nd
In
dex
An
nu
alized
Retu
rn
Moody’s BAA Corporate Bond Yield
Valuation
The Single Greatest Predictor of Future Stock Market Returns
= current
This presentation is directed only at professional investors as defined by the MIFID. It should not be read by retail investors.
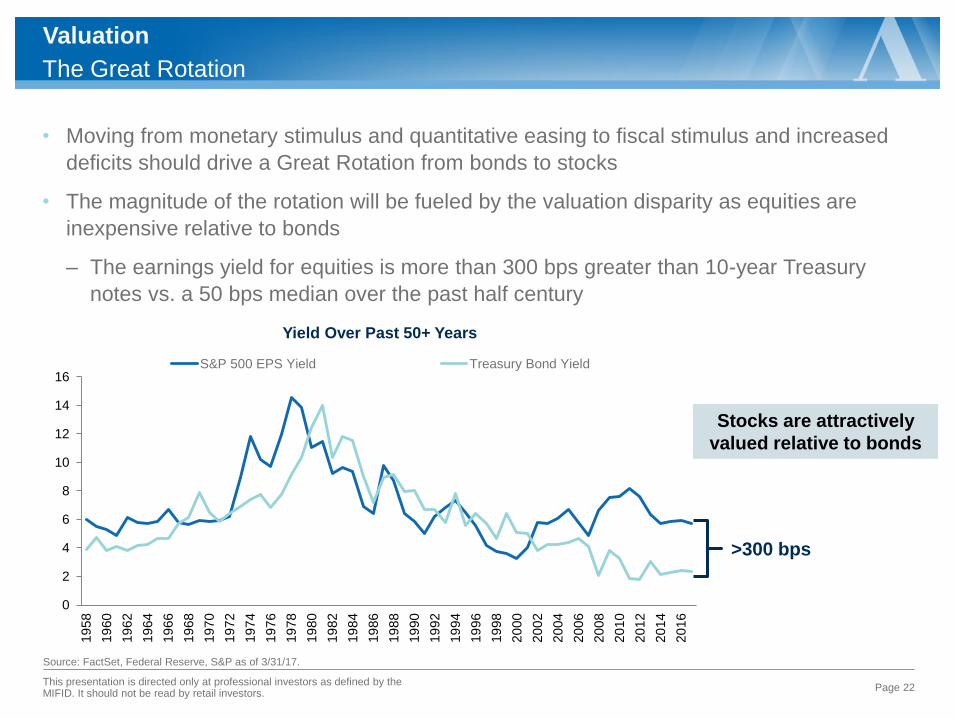
The Great Rotation
Valuation
Page 22
Source: FactSet, Federal Reserve, S&P as of 3/31/17.
• Moving from monetary stimulus and quantitative easing to fiscal stimulus and increased
deficits should drive a Great Rotation from bonds to stocks
• The magnitude of the rotation will be fueled by the valuation disparity as equities are
inexpensive relative to bonds
‒ The earnings yield for equities is more than 300 bps greater than 10-year Treasury
notes vs. a 50 bps median over the past half century
0
2
4
6
8
10
12
14
16
19
58
19
60
19
62
19
64
19
66
19
68
19
70
19
72
19
74
19
76
19
78
19
80
19
82
19
84
19
86
19
88
19
90
19
92
19
94
19
96
19
98
20
00
20
02
20
04
20
06
20
08
20
10
20
12
20
14
20
16
S&P 500 EPS Yield Treasury Bond Yield
>300 bps
Yield Over Past 50+ Years
Stocks are attractively
valued relative to bonds
This presentation is directed only at professional investors as defined by the MIFID. It should not be read by retail investors.
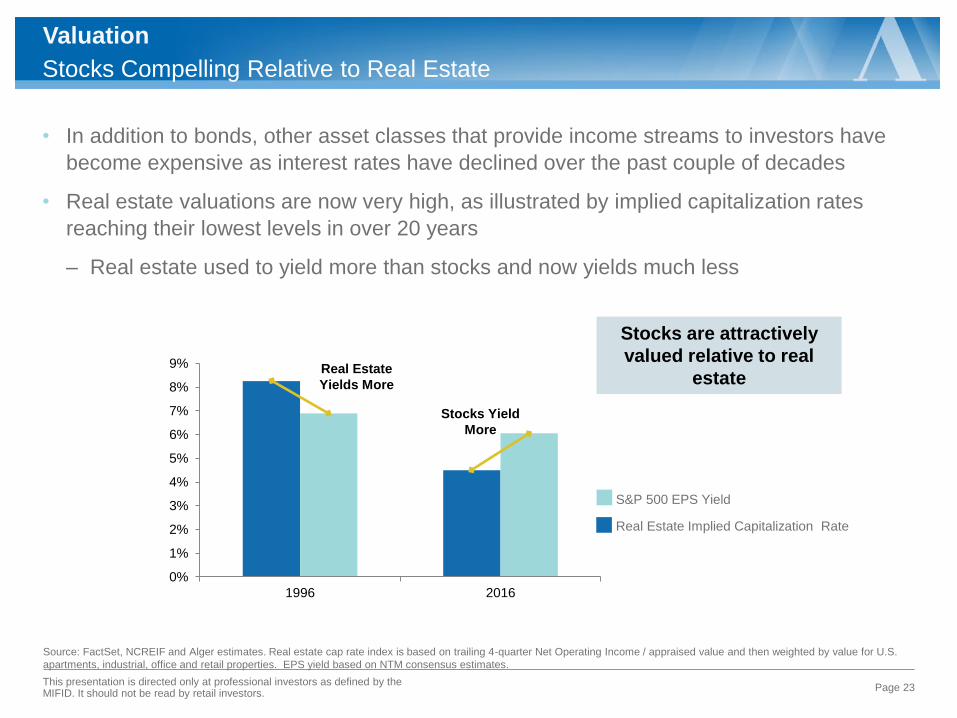
Stocks Compelling Relative to Real Estate
Valuation
Page 23 This presentation is directed only at professional investors as defined by the MIFID. It should not be read by retail investors.
Source: FactSet, NCREIF and Alger estimates. Real estate cap rate index is based on trailing 4-quarter Net Operating Income / appraised value and then weighted by value for U.S.
apartments, industrial, office and retail properties. EPS yield based on NTM consensus estimates.
• In addition to bonds, other asset classes that provide income streams to investors have
become expensive as interest rates have declined over the past couple of decades
• Real estate valuations are now very high, as illustrated by implied capitalization rates
reaching their lowest levels in over 20 years
‒ Real estate used to yield more than stocks and now yields much less
Stocks are attractively
valued relative to real
estate
S&P 500 EPS Yield
Real Estate Implied Capitalization Rate
0%
1%
2%
3%
4%
5%
6%
7%
8%
9%
1996 2016
Real Estate
Yields More
Stocks Yield
More
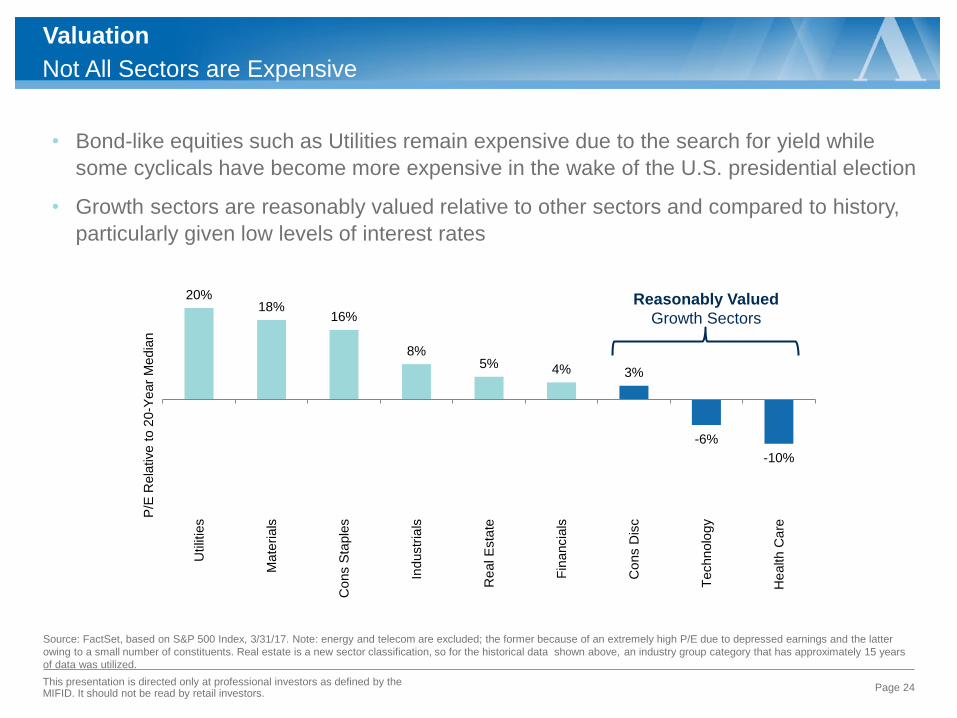
Not All Sectors are Expensive
Valuation
Page 24
Source: FactSet, based on S&P 500 Index, 3/31/17. Note: energy and telecom are excluded; the former because of an extremely high P/E due to depressed earnings and the latter
owing to a small number of constituents. Real estate is a new sector classification, so for the historical data shown above, an industry group category that has approximately 15 years
of data was utilized.
• Bond-like equities such as Utilities remain expensive due to the search for yield while
some cyclicals have become more expensive in the wake of the U.S. presidential election
• Growth sectors are reasonably valued relative to other sectors and compared to history,
particularly given low levels of interest rates
20%
18% 16%
8% 5% 4% 3%
-6%
-10%
Utilit
ies
Ma
teri
als
Co
ns S
taple
s
Industr
ials
Re
al E
sta
te
Fin
ancia
ls
Co
ns D
isc
Techn
olo
gy
He
alth C
are
Reasonably Valued
Growth Sectors
P/E
Rela
tive t
o 2
0-Y
ear
Media
n
This presentation is directed only at professional investors as defined by the MIFID. It should not be read by retail investors.
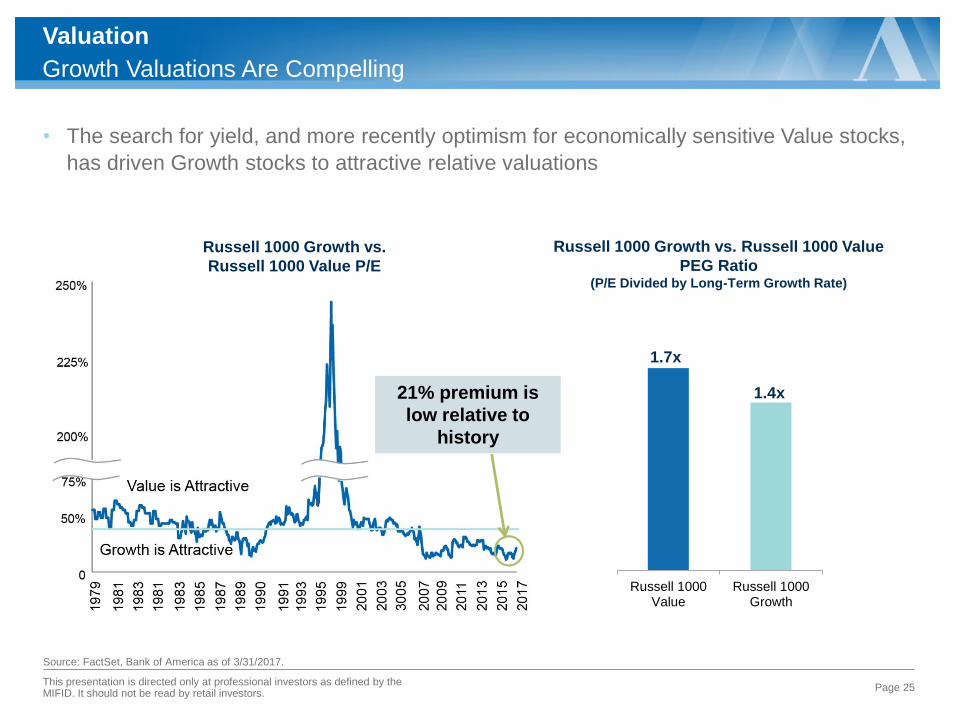
Growth Valuations Are Compelling
Valuation
Page 25
Source: FactSet, Bank of America as of 3/31/2017.
• The search for yield, and more recently optimism for economically sensitive Value stocks,
has driven Growth stocks to attractive relative valuations
This presentation is directed only at professional investors as defined by the MIFID. It should not be read by retail investors.
Russell 1000 Growth vs. Russell 1000 Value
PEG Ratio (P/E Divided by Long-Term Growth Rate)
Russell 1000Value
Russell 1000Growth
1.7x
1.4x
Russell 1000 Growth vs.
Russell 1000 Value P/E
21% premium is
low relative to
history
0
5
10
15
20
25
30
0 5 10 15
P/E
10-Year Yield
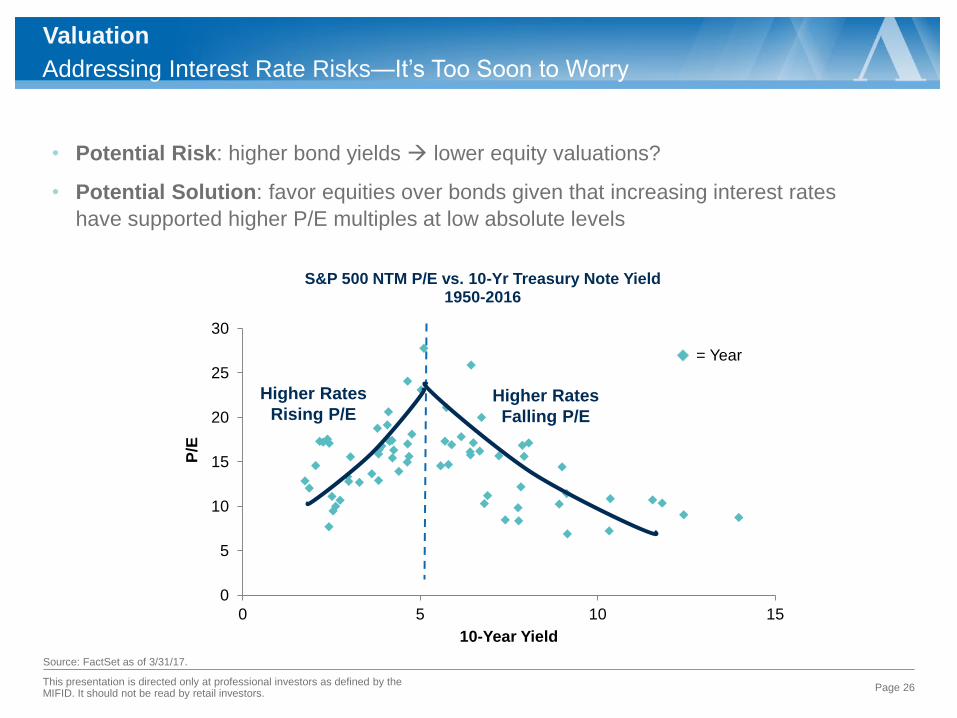
S&P 500 NTM P/E vs. 10-Yr Treasury Note Yield 1950-2016
= Year
Addressing Interest Rate Risks—It’s Too Soon to Worry
Valuation
Page 26
Source: FactSet as of 3/31/17.
Higher Rates
Rising P/E Higher Rates
Falling P/E
• Potential Risk: higher bond yields lower equity valuations?
• Potential Solution: favor equities over bonds given that increasing interest rates
have supported higher P/E multiples at low absolute levels
This presentation is directed only at professional investors as defined by the MIFID. It should not be read by retail investors.
-7%
-6%
-5%
-4%
-3%
-2%
-1%
0%
1%
2%
19
96
19
97
19
98
19
99
20
00
20
01
20
03
20
04
20
05
20
06
20
07
20
08
20
10
20
11
20
12
20
13
20
14
20
15
20
17
Average
0%
1%
2%
3%
4%
5%
6%
7%
8%
19
96
19
97
19
98
19
99
20
00
20
01
20
02
20
03
20
04
20
05
20
06
20
07
20
08
20
09
20
10
20
11
20
12
20
13
20
14
20
15
20
16
20
17
S&P 500 Dividend Yield S&P 500 Buyback Yield
Total Yield
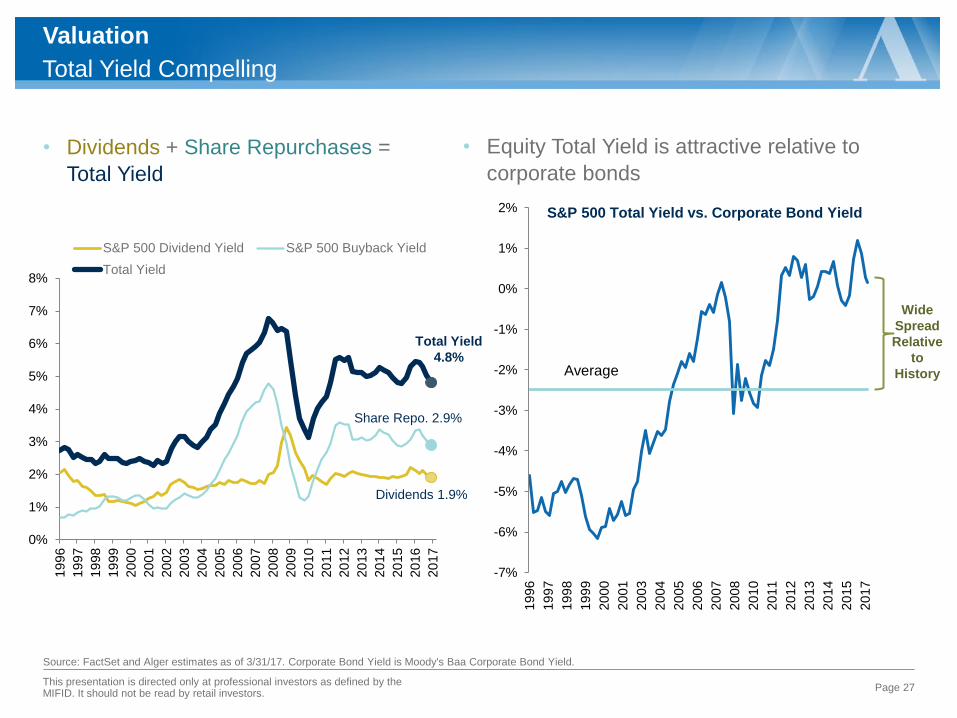
Total Yield Compelling
Valuation
Page 27
Source: FactSet and Alger estimates as of 3/31/17. Corporate Bond Yield is Moody's Baa Corporate Bond Yield.
• Dividends + Share Repurchases =
Total Yield
• Equity Total Yield is attractive relative to
corporate bonds
Share Repo. 2.9%
Total Yield
4.8%
Dividends 1.9%
Wide
Spread
Relative
to
History
S&P 500 Total Yield vs. Corporate Bond Yield
This presentation is directed only at professional investors as defined by the MIFID. It should not be read by retail investors.
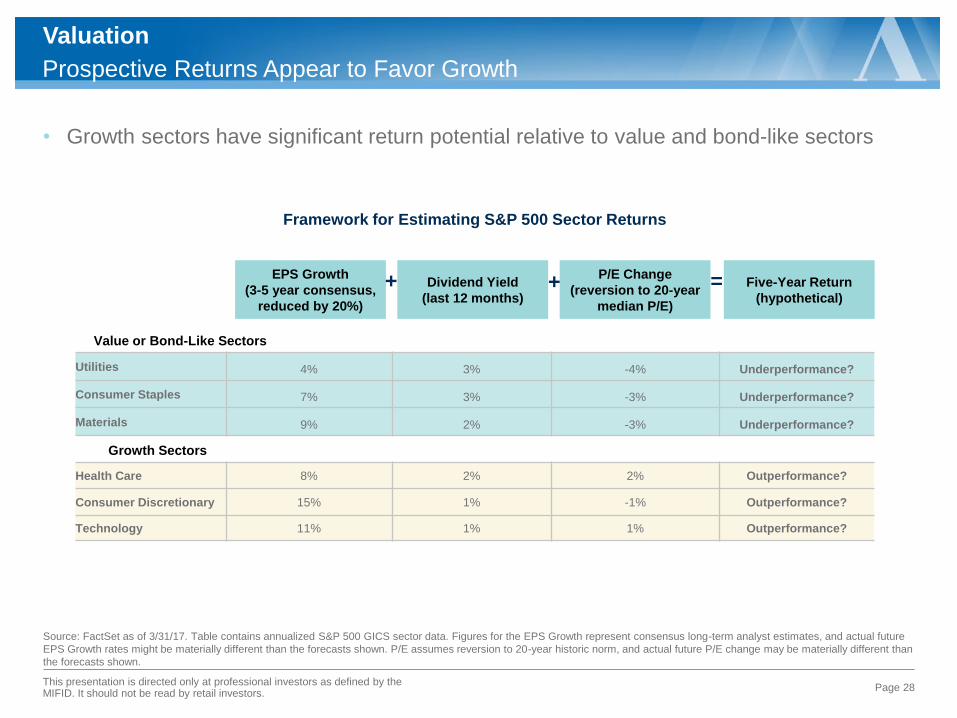
Prospective Returns Appear to Favor Growth
Valuation
Page 28
Source: FactSet as of 3/31/17. Table contains annualized S&P 500 GICS sector data. Figures for the EPS Growth represent consensus long-term analyst estimates, and actual future
EPS Growth rates might be materially different than the forecasts shown. P/E assumes reversion to 20-year historic norm, and actual future P/E change may be materially different than
the forecasts shown.
• Growth sectors have significant return potential relative to value and bond-like sectors
EPS Growth
(3-5 year consensus,
reduced by 20%)
Dividend Yield
(last 12 months)
P/E Change
(reversion to 20-year
median P/E)
Five-Year Return
(hypothetical) + + =
Framework for Estimating S&P 500 Sector Returns
Value or Bond-Like Sectors
Utilities 4% 3% -4% Underperformance?
Consumer Staples 7% 3% -3% Underperformance?
Materials 9% 2% -3% Underperformance?
Growth Sectors
Health Care 8% 2% 2% Outperformance?
Consumer Discretionary 15% 1% -1% Outperformance?
Technology 11% 1% 1% Outperformance?
This presentation is directed only at professional investors as defined by the MIFID. It should not be read by retail investors.
Disclosure
The views expressed are the views of Alger Management, Ltd. as of March 2017. Alger has used sources of information which it believes to be
reliable; however, this publication is not intended to be and does not constitute investment advice. These views are subject to change at any time and
they do not guarantee the future performance of the markets, any security, or any funds managed by Fred Alger Management, Inc. These views
should not be considered a recommendation to purchase or sell securities. Individual securities or industries/sectors mentioned, if any, should be
considered in the context of an overall portfolio and therefore reference to them should not be construed as a recommendation or offer to purchase or
sell securities. References to or implications regarding the performance of an individual security or group of securities are not intended as an
indication of the characteristics or performance of any specific sector, industry, security, group of securities, or a portfolio and are for illustrative
purposes only.
Risk Disclosures: Investing in the stock market involves gains and losses and may not be suitable for all investors. Growth stocks tend to be more
volatile than other stocks as the prices of growth stocks tend to be higher in relation to their companies’ earnings and may be more sensitive to
market, political and economic developments.
The S&P 500 Index is an unmanaged index generally representative of the U.S. stock market without regard to company size. The Russell 1000®
Growth Index is an unmanaged index designed to measure the performance of the largest 1000 companies in the Russell 3000 Index with higher
price-to-book ratios and higher forecasted growth values. The Russell 1000 Value Index measures the performance of those Russell 1000
companies with lower price-to-book ratios and lower forecasted growth values. The Russell 2000 Growth Index is an unmanaged index generally
representative of common stocks designed to track performance of small-capitalization companies with greater than average growth orientation. The
Russell 2000 Value Index is an unmanaged index generally representative of the small-cap value segment of the U.S. equity universe and measures
the performance of Russell 2000 companies with lower price-to-book ratios and lower forecasted growth values. The Russell 3000® Growth Index is
an unmanaged index designed to measure the performance of those Russell 3000® Index companies with higher price-to-book ratios and higher
forecasted growth values. The Russell 3000 Value Index is an unmanaged index generally representative of stocks from the Russell 3000 Index with
lower price-to-book ratios and lower expected growth rates. The indices presented are provided for illustrative purposes, reflect the reinvestment of
dividends and do not assess fees and expenses that would have the effect of reducing returns. Investors cannot invest directly in any index. The
index performance does not represent the returns of any portfolio advised by Fred Alger Management, Inc. and actual client results might differ
materially than the indices shown. Note that past performance is no guarantee of future results. Comparison to a different index might have
materially different results than those shown.
Alger Management, Ltd. (company house number 8634056, domiciled at 78 Brook Street, London W1K 5EF, UK) is authorised and regulated by the
Financial Conduct Authority, for the distribution of regulated financial products and services. La Française AM International has a signed agreement
with Alger Management Ltd, whereby La Française AM International is authorized to distribute Fred Alger Management Inc. products in Europe.
ALCAPPRESWIN-0417
Alger Management, Ltd. • 78 Brook Street, London, W1K 5EF • www.alger.com
Page 29 This presentation is directed only at professional investors as defined by the MIFID. It should not be read by retail investors.