Embed Size (px)
Citation preview

CAPITAL MARKETS, GLOBALIZATION, AND ECONOMIC DEVELOPMENT
Innovations in Financial Markets and Institutions
Editor: Mark Flannery, University of Florida
Other books in the series:
Das, Dilip K.:Asian Economy and Finance: A Post-Crisis Perspective
Anderson, Seth C. and Born, Jeffery A.:Closed-End Fund Pricing: Theories and Evidence
Hoshi, Takeo and Patrick, Hugh:Crisis and Change in the Japanese Financial System
Cummins, J. David and Santomero, Anthony M.:Changes in the Life Insurance Industry: Efficiency, Technology and Risk Management
Barron, J.M., and Staten, M.E.:Credit Life Insurance: A Re-Examination of Policy and Practice
Cottrell, A.F., Lawlor, M.S., Wood, J.H.:The Causes and Costs of Depository Institution Failures
Anderson, S., Beard, T.R., Born, J.:Initial Public Offerings: Findings and Theories
Anderson, S., and Born, J.:Closed-End Investment Companies
Kaufman, G.:Banking Structures in Major Countries
England, C.:Governing Banking’s Future
Hancock, D.:A Theory of Production for the Financial Firm
Gup, B.:Bank Mergers: Current Issues and Perspectives
CAPITAL MARKETS,
GLOBALIZATION, AND
ECONOMIC DEVELOPMENT
1 3

Library of Congress Cataloging-in-Publication Data
Gup, Benton E.Capital markets, globalization, and economic development.
Includes index.
ISBN 0-387-24564-2 e-ISBN 0-387-24563-4 Printed on acid-free paper.
C© 2005 Springer Science+Business Media, Inc.All rights reserved. This work may not be translated or copied in whole or in part withoutthe written permission of the publisher (Springer Science+Business Media, Inc., 233 SpringStreet, New York, NY 10013, USA), except for brief excerpts in connection with reviews orscholarly analysis. Use in connection with any form of information storage and retrieval,electronic adaptation, computer software, or by similar or dissimilar methodology nowknow or hereafter developed is forbidden.The use in this publication of trade names, trademarks, service marks and similar terms,even if the are not identified as such, is not to be taken as an expression of opinion as towhether or not they are subject to proprietary rights.
Printed in the United States of America.
9 8 7 6 5 4 3 2 1 SPIN 11054894
springeronline.com

To Jean, Lincoln, Andrew, Jeremy, and Carol.
CONTENTS
Preface ixAbout the Authors xi
1. Insights from a Global Survey on Bank Capital 1BENTON E. GUP
2. The Effects of Basel II on Developing Countries: A Summary of a Global Public GoodsNetwork eForum on Basel II 9BENTON E. GUP
3. Capital Games 17BENTON E. GUP
4. The International Transmission of Capital Shocks: Implictions of a Revised Basel Accordfor Developing Countries 31KEVIN T. JACQUES
5. Designing Banking Sector Safety Nets: The Australian Experience 45KEVIN DAVIS
6. Globalization and the Growth of International Stock Exchanges 59WILLIAM L. MEGGINSON AND NATALIE L. SUTTER
7. Globalization of the Bond and Stock Markets: The Japanese Casean International Perspective 77IOANA ALEXOPOULOU, GABE DE BONDT, AND ADRIAN VAN RIXTEL
8. Weekly Expected Credit Spreads in Latin-American Brady Bonds 109FRANCO PARISI, IKE MATHUR, AND JORGE URRUTIA
viii Contents
9. Rethinking Project Finance 129ANDREW H. CHEN
10. Impact of Globalization and Economic Development in Asia and Australia 145MOHAMED ARIFF
11. Globalization and the Changing Relationship Between Economic Developmentand Capital Markets: Innovations in Funding for Microfinance 161ALEXANDRA BERNASEK, RONNIE PHILLIPS, AND MICHAEL P. ROSS
12. Waiting for Capital: The Impact of Corruption in Indonesian Financial Markets 175GORDON MENZIES, CHRIS TERRY, AND ROWAN TRAYLER
13. Credit Ratings in China 193WINNIE P. H. POON
14. Finance and Development: Granger-Causality Tests for Prewar and Postwar U.S.A., U.K.,and Japan 207MASANORI AMANO
Index 219
PREFACE
The progression of globalization is affecting capital markets and economic development.In this context, globalization involves complex and controversial issues that must be dealtwith by governments, regulators, corporations (including banks), and investors. These issuesinclude, but are not limited to the extent to which countries around the world are acceptingthe Basel II bank capital regulations, the effects of globalization on stock and bond markets,new issues in project finance, the impact of corruption, and other important topics.
The book consists of fourteen articles contributed by authors from Australia, Asia, Europe,South America, and the U.S. who provide a wide range of insights that range from applied totheoretical issues. The contributors include academics, government officials, and regulators.Four of the fourteen articles in this book were presented at a special session “Capital Markets,Globalization, and Economic Development,” at the 2004 Financial Management Associationmeeting in New Orleans.

ABOUT THE AUTHORS
Ioana Alexopoulou is an Economist Statistician at the Capital Markets and Financial Struc-ture Division of the Directorate Monetary Policy of the European Central Bank. Her interestshave centered on implied volatility, credit risk and the corporate bond market. Her recentresearch has focused on the investigation and identification of financial stability issues inthe current macrofinancial developments. She has a publication “The New Basel CapitalAccord and its impact on Japanese Banking: A Qualitative Analysis” in The New BaselCapital Accord ed. Benton E. Gup. She is a graduate of Birkbeck College, University ofLondon.
Masanori Amano is a Professor of Economics at Chiba University, Japan. His Ph.D. isfrom Hitotusbashi University, Japan. He was a Research Scholar at the London School ofEconomics, and a Visiting Professor at The University of Alabama. His articles have appearedin numerous journals, and he is the author of a monograph—Money, Inflation, and Output:A Study in International Perspective.
Mohamed Ariff obtained his bachelors with honors from the University of Singapore. Hisgraduate studies were at University of Wisconsin-Madison and University of Queensland.After eleven years in the industry at divisional manager levels, he joined the national Univer-sity of Singapore in 1981, and left for Monash University to take a chair in Finance in 1996.His books and scholarly articles are on the financial economics of Asian capital markets andbanking systems. He has consulted for both private and public bodies, and has been awardedinternational fellowships/scholarship at Tokyo and Harvard universities and others. He holds

xii About the authors
an endowed visiting chair at the Universiti Putra Malaysia. He is the President Elect for2994-2006 of the Asian Finance Association.
Alexandra Bernasek is a Professor of Economics at Colorado State University. Her researchdeals with gender differences in risk aversion and the implications for financial decision-making. She has an on-going interest in the Grameen Bank in Bangladesh and the problemsof providing microcredit. She has published her research in books, academic journals, andpolicy briefs. She is currently a board member of the Eastern Economics Association, and isa member of the International Association for Feminist Economics.
Andrew H. Chen is the Distinguished Professor of Finance at Edwin L. Cox School ofBusiness, Southern Methodist University. Prior to coming to SMU, he taught at the OhioState University; University of California, Berkeley; and the State University of New Yorkat Buffalo. Dr. Chen’s research includs bank management and regulation, deposit insurance,derivatives pricing and regulation, corporate financial policy, project finance, and corporatepension strategy. He has edited and co-authored many books, and his more than 100 articleshave appeared in top academic and professional journals. He has served as chairman, director,and advisory director of several financial institutions and corporations. He a former Presidentof Financial Management Association International and a Director of the Asia-Pacific FinanceAssociation. Currently he serves as the Editor of Research in Finance, and a Managing Editorof the International Journal of Theoretical and Applied Finance.
Kevin Davis is the Commonwealth Bank Group Chair of Finance in the Department ofFinance, Faculty of Economics and Commerce, at The University of Melbourne, where hehas been professor since 1987. His research interests include financial markets and instru-ments, financial institutions management, financial regulation, financial engineering, cor-porate finance and valuation. In 2003 he was appointed by the Australian Federal Treasurer(as part of the Government’s response to the HIH Royal Inquiry) to prepare a report on“Financial System Guarantees” which was released in May 2004 for public consultation.
Gabe de Bondt is a Principal Economist at the Capital Markets and Financial StructureDivision of the Directorate Monetary Policy of the European Central Bank. Prior to joiningthe European Central Bank, he was Economist at De Nederlandsche Bank. His Ph.D. onfinancial structure and monetary policy transmission in European countries, as received fromthe University of Amsterdam, has been published by Edward Elgar. His research in the fieldof monetary economics, banking, finance, and financial markets has appeared in numerousjournals.
Benton E. Gup is the Robert Hunt Cochrane-Alabama Bankers Association Chair ofBanking at the University of Alabama. He also held banking chairs at the University of Tulsaand the University of Virginia. Dr. Gup is the author and or editor of twenty-three booksand more than ninety articles about banking and financial topics. He is an internationallyknown lecturer in executive development and graduate programs in Australia (Universityof Melbourne, University of Technology, Sydney), New Zealand (University of Auckland),Peru (University of Lima), and South Africa (Graduate School of Business Leadership). He
About the authors xiii
has been a visiting researcher at the Bank of Japan, and at Macquarie University, Sydney,Australia. Finally, he serves as a consultant to government and industry.
Kevin T. Jacques is a senior financial economist in the Office of Financial InstitutionsPolicy at the U.S. Treasury Department. In addition, he is an Adjunct Professor of Financeat Georgetown University. Previously, he taught at John Carroll University, and was a seniorfinancial economist at the Office of the Comptroller of the Currency. His publications haveappeared in the Journal of Banking and Finance, Journal of Financial Services Research, FederalReserve Bank of New York’s Economic Policy Review, Journal of Economics and Business, andthe Southern Economic Journal.
Ike Mathur is a Professor of Finance at Southern Illinois University. Previously he taughtat the Washington University and the University of Pittsburgh. He served as Interim Deanfor the College of Business, Chair of the Department of Finance, and Director of Doctoralprograms at SIUC. He is the author or co-author of over 100 refereed articles and 14 books.He serves on the editorial board of a number of journals and is the executive editor of Journalof International Financial Markets, Institutions & Money, and of Journal of Multinational FinancialManagement.
Bill Megginson is a Professor and holds the Rainbolt Chair in Finance at the University ofOklahoma’s Michael F. Price College of Business. He is also a voting member of the ItalianMinistry of Economics and Finance’s Global Advisory Committee on Privatization andScientific Advisor for the Privatization Barometer. Professor Megginson’s research interesthas focused in recent years on the privatization of state-owned enterprises, especially thoseprivatizations executed through public share offerings. He has articles in leading academicjournals, and received one of two Smith Breeden Distinguished Paper Awards for outstandingresearch published in the Journal of Finance during 1994. He is author or co-author of seventextbooks. He has also served as a privatization consultant for New York Stock Exchange,the OECD, the IMF, the World Federation of Exchanges and the World Bank.
Gordon Menzies completed a BEc(Hons) at the University of New England (UNE),after which he joined the Reserve Bank of Australia. He won a Bank scholarship to studyat the Australian National University, where he won the Robert Jones Prize for the bestMaster’s student. After a number of years working in the Reserve Bank of Australia in theEconomic Research Department, he won a Commonwealth Scholarship to undertake a DPhil at Oxford University. He joined the University of Technology, Sydney (UTS) as a SeniorLecturer in Economics. He has taught econometrics at UNE, economics at the AustralianNational University and was senior Economics Tutor at Christ Church College, Oxford.
Franco Parisi is an Associate Professor and holds the EuroAmerica Chair in Finance at theDepartment of Business and Finance, Business School, Universidad de Chile. Parisi has beena visiting professor at Rice University, the University of Alabama at Birmingham, and atthe University of Georgia. His publications are in International Finance Review, Multina-tional Financial Management, Emerging Market Review, Research in International Businessand Finance, Latin American Business Review, International Review of Financial Analysis,
xiv About the authors
El Trimester Economico, Revista de Analisis Economico, Cuadernos de Economıa, Estu-dios en Administracion. Also, Parisi was the Co-Editor in a Special Issue at the InternationalReview of Financial Analysis and Vice President for Latin America-South, BALAS 2003.
Ronnie J. Phillips is chair and Professor of Economics at Colorado State University. Hehas been a Visiting Scholar at the FDIC, the Comptroller of the Currency, and at the JeromeLevy Economics Institute of Bard College. He is a past president of the Association forEvolutionary Economics (AFEE). His publications on financial system issues have appearedin books, academic journals, newspapers, magazines, and public policy briefs.
Winnie P. H. Poon is an Associate Professor in the Department of Finance and Insurance atLingnan University in Hong Kong. She formerly taught for East Texas Baptist University andMississippi State University. And she was a Visiting Scholar at The University of Alabama.Her major research interest is in the area of corporate and bank credit ratings.
Michael P. Ross recently graduated with a B.S. in Business Administration, with a con-centration in Finance from Colorado State University. He is currently a law student in theColorado School of Law at the University of Colorado at Boulder.
Natalie Sutter is a graduate student in finance at the University of Oklahoma’s Michael F.Price’s College of Business. She has a Bachelor of Business Administration with a major inEconomics, a Bachelor of Accountancy, and a Juris Doctorate from the University of Okla-homa. She is licensed to practice law in the State of Oklahoma but is currently concentratingon her graduate studies.
Chris Terry is honorary Associate Professor at the University of Technology, Sydney. HisPhD is from New York University. He has taught a range of subjects, including CapitalMarkets, Public Finance and Microeconomics and co-written four textbooks in the areasof Financial Markets, Microeconomic Policy and Microeconomics as well as contributingmany chapters to books in these fields. Chris held various administrative positions includingHead of the Economics Department, Head of School of Finance and Economics, AssociateDean (Postgraduate Programs and Research).
Rowan Trayler is a Senior Lecturer in the School of Finance and Economics at the Uni-versity of Technology, Sydney. Previously, worked for Barclays Bank Australia Ltd, wherehe held several different positions including, Budget and Planning Manager, and was partof the team that helped establish the new bank in Australia. Since joining the Universityof Technology Rowan has been closely involved in the development of the postgraduateMaster of Business in Finance, lecturing at both the postgraduate and undergraduate level inBanking and Finance.
Jorge L. Urrutia is a Professor of Finance at the School of Business of Loyola UniversityChicago. He has more than fifty publications in academic journals, including the Journal ofFinancial and Quantitative Analysis, Journal of Banking and Finance, Journal of FuturesMarkets, Journal of Financial Services Research, and others. Professor Urrutia also has

About the authors xv
collaborated in several books. He is associate editor of the Latin American Business Review,Journal of Multinational Financial Management, International Journal of Finance. He wasVice President of Local Arrangements and Director of the Midwest Finance Association.He is currently President Elected of the Business Association for Latin American Studies,BALAS, and director in the North American Economics and Finance Association, NAEFA,and the Multinational Finance Society. Professor Urrutia has taught Chile, Colombia, ElSalvador, Japan, and in China as a Fulbright Scholar.
Adrian van Rixtel is a Principal Economist in the Directorate Monetary Policy of theEuropean Central Bank. Previously, he held positions at the De Nederlandsche Bank(Netherlands Central Bank) and private financial institutions both in London and Amsterdam.Mr. van Rixtel took his PhD at the Tinbergen Institute, Free University Amsterdam, inthe Netherlands. He has extensive experience covering Asian economies, in particular theJapanese economy, and held visiting scholar positions at the Bank of Japan and Ministry ofFinance. He has published a book on the Japanese banking crisis in 2002 with CambridgeUniversity Press (“Informality and Monetary Policy in Japan: The Political Economy of BankPerformance”). His research on Japan has been published in various articles and books anddiscussed in publications such as The Economist and Wall Street Journal.
1. INSIGHTS FROM A GLOBAL SURVEY ON BANK CAPITAL
BENTON E. GUP
1. INTRODUCTION
The 1988 Basel Capital Accord (Basel I) was widely accepted and applied around theworld. However, Basel I became outdated with respect to the risk management of largecomplex financial organizations (LCFOs). J.P. Morgan Chase & Co. and Citigroup areexamples of LCFOs. Thus, the New Basel Capital Accord (Basel II) was introduced in2001 to deal with LCFOs; and it is a work in progress that is expected to be imple-mented at year-end 2006. This article provides insights from a survey of countries aroundthe world to determine 1) whether they applied Basel I, and 2) are they going to applyBasel II?
The remainder of the article is divided into three parts. Part 2 provides an overview of theBasel Committee on Banking Supervision, Basel I and Basel II. Part 3 presents the results ofthe global survey. Part 4 provides the conclusions.
2. AN OVERVIEW OF THE BASEL COMMITTEE ON BANKING SUPERVISION
The Bank for International Settlements (BIS) was established in 1930 to deal with reparationpayments imposed on Germany by the Treaty of Versailles following the First World War.Over time, the BIS’s activities changed, and now it concentrates “on cooperation amongcentral banks and, increasingly, other agencies in pursuit of monetary and financial stability.”1
There are 55 central banks that are members of the BIS.Following failure of Bankhus I. D. Herstatt in Cologne, Germany, in 1974, the BIS
and banking regulators from the Group of 10 (G-10) countries established the Basel
2 Benton E. Gup
Committee on Banking Supervision.2 Currently the Basel Committee on Banking Supervi-sion includes central bankers and regulators from Belgium, Canada, France, Germany, Italy,Japan, Luxembourg, The Netherlands, Spain, Sweden, Switzerland, United Kingdom, andthe United States.
2.1. The 1988 Capital Accord
A cornerstone of the Basel Committee’s framework is the 1988 Capital Accord (Basel I)which provided for a minimum capital requirement of 8% for internationally active banks inorder to 1) ensure an adequate level of capital and 2) competitive equality. Basel I focusedexclusively on credit risk.
The BIS reported that more than 100 countries apply the 1988 Basel Capital Accordin their banking systems.3 However, the Basel Committee did not identify the countries.The 8% capital requirement was an arbitrary number—it was not based on studies of theeconomic capital needs of banks.
In the United States, the 8% Basel I capital requirements apply to all FDIC-insured banks,and similar rules were applied to savings associations. In addition, under the Federal DepositInsurance Corporation Improvement Act of 1991 (FDICIA), a total risk-based capital ratioof 8%–9.9% is considered “adequately capitalized,” while a ratio of 10% or more is “well-capitalized.” Banks with less than 8% risk-based capital are “undercapitalized” and subject toprompt correct action.
In the years that followed the 1988 Basel I Capital Accord, the U.S. experienced massivebank failures in the late 1980s and early 1990s. During the 1980–1996 period, 133 of theInternational Monetary Fund’s 181 member countries experienced significant banking sectorproblems, including those countries that signed on to the Basel Accord.4 Large banks in Japanbegan having problems beginning in 1990, and their problems had not been resolved by 2003.In the late 1990s and early 2000s, there were financial crises in Southeast Asia, Russia, Turkey,and Latin America where bank capital requirements may have had some impact. In the late1990s, the Basel Committee on Banking Supervision began to focus on “financial stabilityin the wave of economic integration and globalization.”5 Federal Reserve Governor Olson(2003) identified “the expanded use of securitization and derivatives in secondary marketsand vastly improved risk management systems” as two specific areas of change. In addition,regulatory capital arbitrage has undermined Basel I. LCFOs were of particular concern.6 Allof these factors suggest that changes in the capital requirements were needed, and they areforthcoming.
Therefore it was not surprising that bank regulators found that the Basel I leverage ratiowas no longer an appropriate measure of a bank’s capital adequacy because of changes thathave occurred in the banking system. Federal Reserve Vice Chairman Ferguson (2003a)said that “Basel I is too simplistic to adequately address the activities of our most complexbanking institutions.” He goes on to say “If we do not apply more risk-sensitive capitalrequirements to these very large institutions, the usefulness of capital adequacy regulationin constraining excessive risk-taking at these entities will continue to erode. Such erosionwould present U.S. bank supervisors with a highly undesirable choice. Either we would haveto accept the increased risk of instability in the banking system, or we would be forcedto adopt alternative—and more intrusive—approaches to the supervision and regulation ofthese institutions.”
1. Insights from a global survey on bank capital 3
2.2. The New Basel Capital Accord—Basel II
The New Basel Capital Accord (Basel II), proposed in January 2001, will replace Basel I whenit is implemented by year-end 2006. Basel II applies to holding companies (on a consolidatedbasis) that are parents of banking groups; but insurance subsidiaries are excluded in some G10 countries.7 While Basel I deals only with credit risk, Basel II incorporates market riskand operational risk. As previously noted, Basel II targets LCFOs, and as such, it was “notdesigned for banks in small unsophisticated developing countries.”8
In fact, it was not designed for many banks in developed countries either. In the UnitedStates, a “bifurcated” regulatory capital framework is proposed.9 Only about 10 internation-ally active “core banks” (and thrifts) with assets of $250 billion or more and/or cross-borderexposures of $10 billion or more will be required to comply with Basel II advanced inter-nal ratings based (A-IRB) approach to credit risk and the advanced measurement approach(AMA) approach to operational risk. The core banks will account for 99 percent of foreignassets and two-thirds of all assets of domestic U.S. banking organization.10 They could includeU.S. subsidiaries of foreign banking organizations that meet the core bank standards.11
Other U.S. banks may opt-in (“opt-in-banks”) to Basel II using the A-IRB and AMAapproaches. However, the remaining 7,700+ “general banks” in the U.S. will continue touse the Basel I capital standards.12
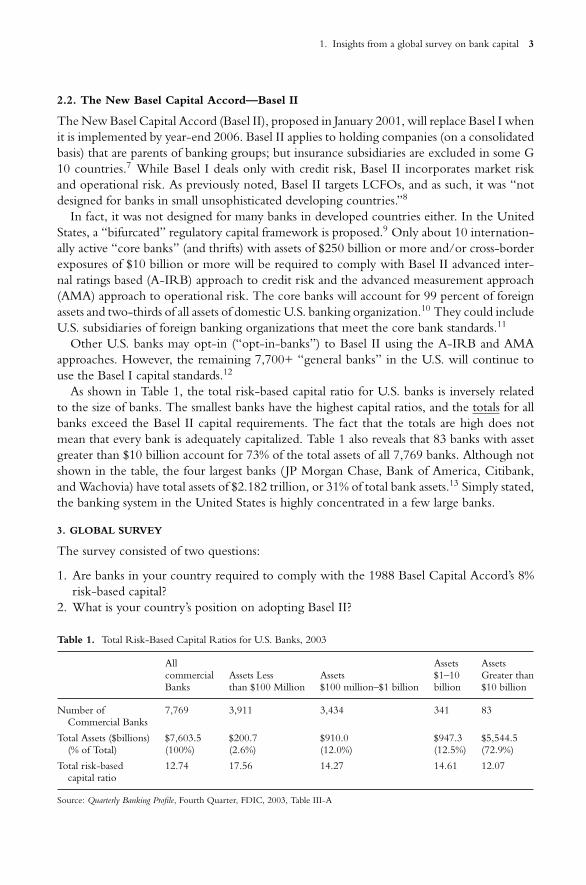
As shown in Table 1, the total risk-based capital ratio for U.S. banks is inversely relatedto the size of banks. The smallest banks have the highest capital ratios, and the totals for allbanks exceed the Basel II capital requirements. The fact that the totals are high does notmean that every bank is adequately capitalized. Table 1 also reveals that 83 banks with assetgreater than $10 billion account for 73% of the total assets of all 7,769 banks. Although notshown in the table, the four largest banks ( JP Morgan Chase, Bank of America, Citibank,and Wachovia) have total assets of $2.182 trillion, or 31% of total bank assets.13 Simply stated,the banking system in the United States is highly concentrated in a few large banks.
3. GLOBAL SURVEY
The survey consisted of two questions:
1. Are banks in your country required to comply with the 1988 Basel Capital Accord’s 8%risk-based capital?
2. What is your country’s position on adopting Basel II?
Table 1. Total Risk-Based Capital Ratios for U.S. Banks, 2003
All Assets Assetscommercial Assets Less Assets $1–10 Greater thanBanks than $100 Million $100 million–$1 billion billion $10 billion
Number of 7,769 3,911 3,434 341 83Commercial Banks
Total Assets ($billions) $7,603.5 $200.7 $910.0 $947.3 $5,544.5(% of Total) (100%) (2.6%) (12.0%) (12.5%) (72.9%)
Total risk-based 12.74 17.56 14.27 14.61 12.07capital ratio
Source: Quarterly Banking Profile, Fourth Quarter, FDIC, 2003, Table III-A
4 Benton E. Gup
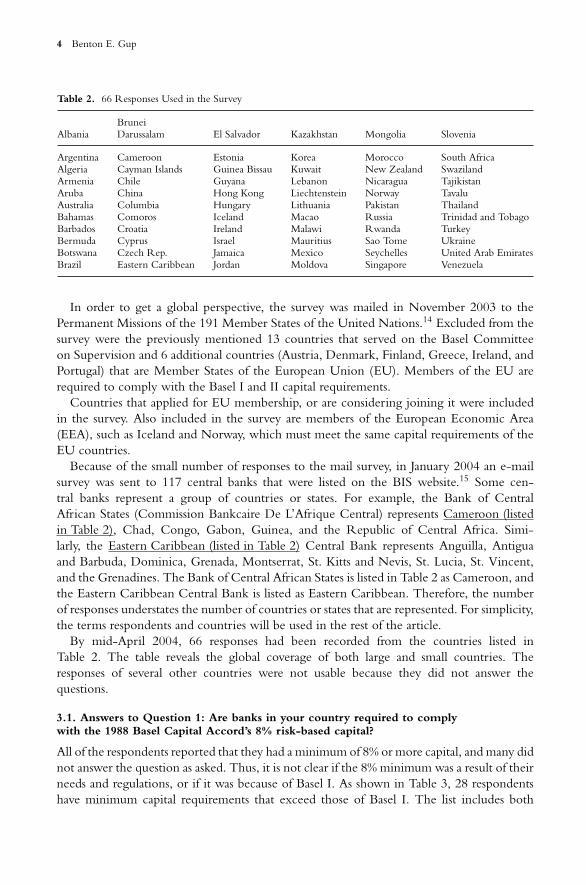
Table 2. 66 Responses Used in the Survey
BruneiAlbania Darussalam El Salvador Kazakhstan Mongolia Slovenia
Argentina Cameroon Estonia Korea Morocco South AfricaAlgeria Cayman Islands Guinea Bissau Kuwait New Zealand SwazilandArmenia Chile Guyana Lebanon Nicaragua TajikistanAruba China Hong Kong Liechtenstein Norway TavaluAustralia Columbia Hungary Lithuania Pakistan ThailandBahamas Comoros Iceland Macao Russia Trinidad and TobagoBarbados Croatia Ireland Malawi Rwanda TurkeyBermuda Cyprus Israel Mauritius Sao Tome UkraineBotswana Czech Rep. Jamaica Mexico Seychelles United Arab EmiratesBrazil Eastern Caribbean Jordan Moldova Singapore Venezuela
In order to get a global perspective, the survey was mailed in November 2003 to thePermanent Missions of the 191 Member States of the United Nations.14 Excluded from thesurvey were the previously mentioned 13 countries that served on the Basel Committeeon Supervision and 6 additional countries (Austria, Denmark, Finland, Greece, Ireland, andPortugal) that are Member States of the European Union (EU). Members of the EU arerequired to comply with the Basel I and II capital requirements.
Countries that applied for EU membership, or are considering joining it were includedin the survey. Also included in the survey are members of the European Economic Area(EEA), such as Iceland and Norway, which must meet the same capital requirements of theEU countries.
Because of the small number of responses to the mail survey, in January 2004 an e-mailsurvey was sent to 117 central banks that were listed on the BIS website.15 Some cen-tral banks represent a group of countries or states. For example, the Bank of CentralAfrican States (Commission Bankcaire De L’Afrique Central) represents Cameroon (listedin Table 2), Chad, Congo, Gabon, Guinea, and the Republic of Central Africa. Simi-larly, the Eastern Caribbean (listed in Table 2) Central Bank represents Anguilla, Antiguaand Barbuda, Dominica, Grenada, Montserrat, St. Kitts and Nevis, St. Lucia, St. Vincent,and the Grenadines. The Bank of Central African States is listed in Table 2 as Cameroon, andthe Eastern Caribbean Central Bank is listed as Eastern Caribbean. Therefore, the numberof responses understates the number of countries or states that are represented. For simplicity,the terms respondents and countries will be used in the rest of the article.
By mid-April 2004, 66 responses had been recorded from the countries listed inTable 2. The table reveals the global coverage of both large and small countries. Theresponses of several other countries were not usable because they did not answer thequestions.
3.1. Answers to Question 1: Are banks in your country required to complywith the 1988 Basel Capital Accord’s 8% risk-based capital?
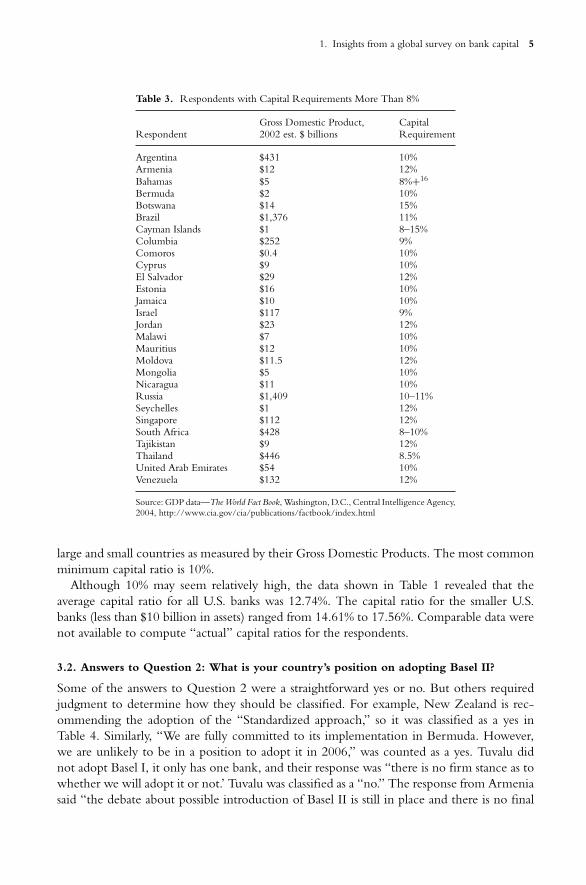
All of the respondents reported that they had a minimum of 8% or more capital, and many didnot answer the question as asked. Thus, it is not clear if the 8% minimum was a result of theirneeds and regulations, or if it was because of Basel I. As shown in Table 3, 28 respondentshave minimum capital requirements that exceed those of Basel I. The list includes both
1. Insights from a global survey on bank capital 5
Table 3. Respondents with Capital Requirements More Than 8%
Gross Domestic Product, CapitalRespondent 2002 est. $ billions Requirement
Argentina $431 10%Armenia $12 12%Bahamas $5 8%+16
Bermuda $2 10%Botswana $14 15%Brazil $1,376 11%Cayman Islands $1 8–15%Columbia $252 9%Comoros $0.4 10%Cyprus $9 10%El Salvador $29 12%Estonia $16 10%Jamaica $10 10%Israel $117 9%Jordan $23 12%Malawi $7 10%Mauritius $12 10%Moldova $11.5 12%Mongolia $5 10%Nicaragua $11 10%Russia $1,409 10–11%Seychelles $1 12%Singapore $112 12%South Africa $428 8–10%Tajikistan $9 12%Thailand $446 8.5%United Arab Emirates $54 10%Venezuela $132 12%
Source: GDP data—The World Fact Book, Washington, D.C., Central Intelligence Agency,2004, http://www.cia.gov/cia/publications/factbook/index.html
large and small countries as measured by their Gross Domestic Products. The most commonminimum capital ratio is 10%.
Although 10% may seem relatively high, the data shown in Table 1 revealed that theaverage capital ratio for all U.S. banks was 12.74%. The capital ratio for the smaller U.S.banks (less than $10 billion in assets) ranged from 14.61% to 17.56%. Comparable data werenot available to compute “actual” capital ratios for the respondents.
3.2. Answers to Question 2: What is your country’s position on adopting Basel II?
Some of the answers to Question 2 were a straightforward yes or no. But others requiredjudgment to determine how they should be classified. For example, New Zealand is rec-ommending the adoption of the “Standardized approach,” so it was classified as a yes inTable 4. Similarly, “We are fully committed to its implementation in Bermuda. However,we are unlikely to be in a position to adopt it in 2006,” was counted as a yes. Tuvalu didnot adopt Basel I, it only has one bank, and their response was “there is no firm stance as towhether we will adopt it or not.’ Tuvalu was classified as a “no.” The response from Armeniasaid “the debate about possible introduction of Basel II is still in place and there is no final
6 Benton E. Gup
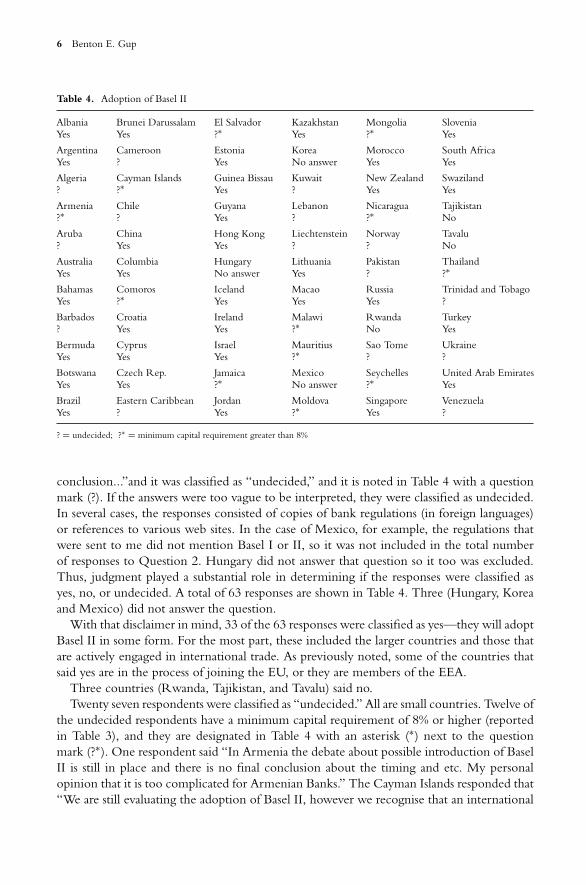
Table 4. Adoption of Basel II
Albania Brunei Darussalam El Salvador Kazakhstan Mongolia SloveniaYes Yes ?∗ Yes ?∗ Yes
Argentina Cameroon Estonia Korea Morocco South AfricaYes ? Yes No answer Yes Yes
Algeria Cayman Islands Guinea Bissau Kuwait New Zealand Swaziland? ?∗ Yes ? Yes Yes
Armenia Chile Guyana Lebanon Nicaragua Tajikistan?∗ ? Yes ? ?∗ No
Aruba China Hong Kong Liechtenstein Norway Tavalu? Yes Yes ? ? No
Australia Columbia Hungary Lithuania Pakistan ThailandYes Yes No answer Yes ? ?∗
Bahamas Comoros Iceland Macao Russia Trinidad and TobagoYes ?∗ Yes Yes Yes ?
Barbados Croatia Ireland Malawi Rwanda Turkey? Yes Yes ?∗ No Yes
Bermuda Cyprus Israel Mauritius Sao Tome UkraineYes Yes Yes ?∗ ? ?
Botswana Czech Rep. Jamaica Mexico Seychelles United Arab EmiratesYes Yes ?∗ No answer ?∗ Yes
Brazil Eastern Caribbean Jordan Moldova Singapore VenezuelaYes ? Yes ?∗ Yes ?
? = undecided; ?∗ = minimum capital requirement greater than 8%
conclusion...”and it was classified as “undecided,” and it is noted in Table 4 with a questionmark (?). If the answers were too vague to be interpreted, they were classified as undecided.In several cases, the responses consisted of copies of bank regulations (in foreign languages)or references to various web sites. In the case of Mexico, for example, the regulations thatwere sent to me did not mention Basel I or II, so it was not included in the total numberof responses to Question 2. Hungary did not answer that question so it too was excluded.Thus, judgment played a substantial role in determining if the responses were classified asyes, no, or undecided. A total of 63 responses are shown in Table 4. Three (Hungary, Koreaand Mexico) did not answer the question.
With that disclaimer in mind, 33 of the 63 responses were classified as yes—they will adoptBasel II in some form. For the most part, these included the larger countries and those thatare actively engaged in international trade. As previously noted, some of the countries thatsaid yes are in the process of joining the EU, or they are members of the EEA.
Three countries (Rwanda, Tajikistan, and Tavalu) said no.Twenty seven respondents were classified as “undecided.” All are small countries. Twelve of
the undecided respondents have a minimum capital requirement of 8% or higher (reportedin Table 3), and they are designated in Table 4 with an asterisk (∗) next to the questionmark (?∗). One respondent said “In Armenia the debate about possible introduction of BaselII is still in place and there is no final conclusion about the timing and etc. My personalopinion that it is too complicated for Armenian Banks.” The Cayman Islands responded that“We are still evaluating the adoption of Basel II, however we recognise that an international
1. Insights from a global survey on bank capital 7
centre with branches and subsidiaries of international banks some changes to the currentapproach must be expected.”
4. CONCLUSIONS
The 1988 Basel Capital Accord (Basel I) was a major step forward on the road toward theharmonization of bank capital regulations. All 66 of the countries that responded to thesurvey had 8% or higher minimum capital requirements. Basel II, however, appears to be abump in the road toward harmonization. In part, this is because the objectives of Basel I andII differ. Basel I was concerned with credit risk, the level of capital, and competitive equality.In contrast, Basel II is targeted at LCFOs, not small and medium size banks.
Thirty three of the respondents surveyed will use Basel II, and most of the remainingrespondents are undecided. The division closely follows country size. The larger countriesand those that are internationally active will apply it. The “undecided” group tends to besmaller countries and many of them have capital requirements that exceed those of BaselII. Therefore it is highly likely that some of these countries will use Basel II. Only threerespondents rejected it.
The most common criticisms by those considering Basel II are that it is too complicated,and not suitable for banks in small unsophisticated developing countries. In addition, theNorwegian Financial Services Association (2003) noted that Basel II has many areas “whicheither prescribes or opens up for relatively wide national discretions. In many instances suchdiscretion may be used to apply more lenient rules, and thus have the potential to createserious differences in competitive positions of national banking systems in the internationalmarket place. The result may well be increased regulatory arbitrage.”
Recall that one of the goals of Basel I was “competitive equality.” Smaller size banks inmany of the countries surveyed have minimum capital requirements that meet or exceedthose of Basel II, and they are not really affected by it. However, the information presentedhere suggests that Basel II may undermine that goal for medium and large size banks thatdon’t opt-in to Basel II using the A-IRB and AMA approaches.16
ENDNOTES
1. “BIS History,” http://www.bis.org/about/history.htm.2. For further information about Herstatt, see Gup (1998), Chapter 2.3. “The New Basel Capital Accord: An Explanatory Note,” 2001; also see: The Basel Committee on Banking
Supervision, http://www.bis.org/bcbs/aboutbcbs.htm4. Lindgren, et al., (1996). Also see Gup (1998; 1999).5. “BIS History, 2003.6. For further discussion of LCFOs, see Bliss 2002A and B; Herring, 2003; DeFerrari and Palmer, 2001.7. “The New Basel Capital Accord,” Consultative Document, January 2001.8. “Comments of the Caribbean Group of Bank Supervisors (CGSB) on the Third Consultative Paper on the
New Capital Accord,” (no date).9. Advanced Notice of Public Rule Making, Risk Capital Guidelines, August 4, 2003.
10. Ferguson, 2003b.11. Ferguson, 2003c.12. Olsen, 2003.13. Large Commercial Banks, Federal Reserve Statistical Release, December 31, 2003.14. Permanent Mission to the United Nations, 2003.15. See: http://www.bis.org/cbanks.htm16. The Financial Stability Institute published the results of a survey on non-Basel committee member countries
(Implementation. . . . 2004). Their results also suggest that Basel II will be accepted, at least in part, over timeby many nations.
8 Benton E. Gup
REFERENCES
Advanced Notice of Public Rule Making, Risk Capital Guidelines, 12 CFR Parts 3, 208, 325, 567, Federal Register,August 4, 2003, 45900–459888.
“BIS History,” http://www.bis.org/about/history.htm. June 2003.Bliss, R. R., (A) “Bankruptcy Law and Large Complex Financial Organizations,” Economic Perspectives, Federal
Reserve Bank of Chicago, First Quarter, 2003, 48–54.Bliss, R. R., (B), “Resolving Large Complex Financial Organization, “ Draft, Federal Reserve Bank of Chicago,
May 19, 2003.“Comments of the Caribbean Group of Bank Supervisors (CGSB) on the Third Consultative Paper on the New
Capital Accord,” Bank for International Settlements: http://www.bis.org/bcbs/cp3comments.htm (no date).DeFerrari, L. M., and D. E. Palmer, “Supervision of Large Complex Banking Organizations,” Federal Reserve Bulletin,
February 2001, 47–57.Ferguson, Roger W. Jr., Vice Chairman Federal Reserve Board, Testimony Before the Subcommittee on Domestic
and International Monetary Policy, Trade, and Technology, Committee on Financial Services, U.S. House ofRepresentatives, February 27, 2003 (a).
Ferguson, Roger W. Jr., Vice Chairman Federal Reserve Board, Testimony Before the Committee on Banking,Housing, and Urban Affairs, U.S. Senate June 18, 2003 (b).
Ferguson, Roger W. Jr., Vice Chairman Federal Reserve Board, “Concerns and Considerations for the PracticalImplementation of the New Basel Accord,” Remarks at the ICBI Risk Management 2003 Conference, Geneva,Switzerland, December 2, 2003 (c).
Gup, Benton E., Bank Failures in the Major Trading Countries of the World: Causes and Consequences, Westport, CT,Quorum Books, 1998.
Gup, Benton E., International Banking Crises: Large-Scale Failures, Massive Government Interventions, Westport, CT.,Quorum Books, 1999.
Herring, R., “International Financial Conglomerates: Implications for Bank Insolvency Regimes,” Wharton Schoolof Business, University of Pennsylvania, Draft, May 2003.
“Implementation of the New Capital Adequacy Framework in Non-Basel Committee Member Countries,” Finan-cial Stability Institute, Occasional Paper No. 4, Basel, Switzerland, Bank for International Settlements, July2004.
Large Commercial Banks, Federal Reserve Statistical Release, December 31, 2003: http://www.federalreserve.gov/releases/lbr/current/default.htm
Lindgren, Carl-Johan, Gillian Garcia, and Matthew I. Saal, Bank Soundness and Macroeconomic Policy, Washington,D.C., International Monetary Fund, 1996.
Norwegian Financial Services Association, “Comments on Consultative Document on the New Capital Accord(CP 3), March 7, 2003, www.bis.org.
Olsen, M. W., “Basel II: Its Implications for Second-Tier and Community-Size Banks” Remarks by Federal ReserveGovernor Mark W. Olson at the 2003 Banking Institute, Center for Banking and Finance, University of NorthCarolina, Charlotte, North Carolina, April 10, 2003.
“Overview of the New Basel Accord,” Consultative Document, Basel Committee on Banking Supervision, Bankfor International Settlements, Basel Switzerland, January 2001.
Permanent Mission to the United Nations, No. 289, New York, United Nations, February 2003.Quarterly Banking Profile, Fourth Quarter, FDIC, 2003.“The New Basel Capital Accord: An Explanatory Note,” Secretariat of the Basel Committee on Banking Super-
vision, Bank for International Settlements, Basel Switzerland, January 2001.“The New Basel Capital Accord,” Consultative Document, January 2001, 2–3; “Overview of the New Basel
Accord, January 2001, # 56, page 11.The World Fact Book, Washington, D.C., Central Intelligence Agency, 2004, http://www.cia.gov/cia/publications/
factbook/index.html
2. THE EFFECTS OF BASEL II ON DEVELOPING COUNTRIES: A SUMMARYOF A GLOBAL PUBLIC GOODS NETWORK EFORUM ON BASEL II
BENTON E. GUP
1. INTRODUCTION
During the May 26–June 14, 2004 period, Global Public Goods Network (gpgNet) held a dis-cussion forum (eForum) on International Financial Stability—Basel II: Accord or Discord.1
Over 250 participants from around the world registered for the e-Forum, but relativelyfew submitted comments or replies. This article summarizes some comments and providesexcerpts from others that were posted on the gpgNet web site for the eForum.2 They arepresented here in the order in which they were sent. No changes or corrections were madein the comments that are quoted. The full-texts of all of the comments are available on thatsame website.3
Several points suggested for debate included:
� What effects will Basel II have on developing countries?� What measures could be introduced to reduce the potential negative effects, such as taking
the diversification of risk into account?� Why have measures to curb its potential negative impact on developing countries not been
taken into account?
2. COMMENTS AND REPLIES
2.1. Mistakes in Basel Could Harm Developing Countries
The eForum began by asking participants to review a paper by Stephany Griffith-Jones,who argues that Basel II would significantly overestimate the risk of international banklending to developing economies.4 This would lead to the increased cost of borrowing by
10 Benton E. Gup
those countries, and to a decline in loans to the developing world. Stephany Griffith-Jonesand Stephen Spratt go on to say that sophisticated international banks have diversified theirportfolios, but Basel II does not take this risk reducing factor into account.5
2.2. Insights from a Global Survey on Bank Capital
Insights from a Global Survey on Bank Capital, by Benton E. Gup, revealed that of the66 countries that responded to the survey, all met or exceeded the 8% capital requirementsof Basel I.6 About half of the respondents would apply Basel II, and most of the remainingcountries were contemplating it. The fact that banks in many countries have excess regulatorycapital mitigates some of the effects of Basel II’s higher capital requirements for riskier loans.
2.3. Micro vs. Macro
Sunada Sen pointed out that Basel II is focused strictly on the micro-finance of banks; andit ignores the macro-economic aspects of global capital flows.7
2.4. Procyclicality
Paul Bance presented a paper on “Prudential Supervision Against Banking Procyclicality:A Critical Assessment of the Line of Defense of the Basel Committee.”8 He says that “TheNew Basel Capital Accord may heighten the procyclical impact of the financial systemthrough its proposal for a risk-sensitive regulatory framework. The line of defense of the BaselCommittee for Banking Supervision relies on a strengthened supervision mix of public andprivate discipline to carefully monitor banks’ positions and actions and to efficiently preventthem from adopting imprudent behaviors. This essay argues that the impact of increasingsupervision on banks’ prudential behavior is not monotonic through the economic cycleand may be counterproductive in some points of the cycle.”
2.5. Making a Fragile System More So
Avinash Persaud and Stephen Spratt argue that Basel II is too complex and places too muchemphasis on risk-sensitivity.9 “. . . the purpose of bank regulation is not to assess private risks:this is the job of the banks and the markets. The purpose regulation is to consider where socialrisks are different from private risks, and then to use regulatory capital to make those socialrisks internal to the bank. If the failure of a particular bank would have no negative effectson confidence in the financial system—if, for example, there would be no strong reason tobail out that institution—then it is not clear why we would regulate it any differently thanwe would regulate a non-financial corporate with concern for the health and safety of itsconsumers and employees. We regulate banks further because we are worried about theirspill-over risks. Sensitivity to private risks is a red-herring. Of course, it is what big bankswould like regulators to worry about, because then regulatory capital will be aligned totheir narrow risks. Instead regulatory capital should focus on the difference between internalassessments of risk and the regulators’ assessment of the wider social risks.”
They conclude by saying that “Basle’s prescriptions are at the root of its enormous com-plexity. Complexity is the avenue of capture. Faced with over 200 pages of complex rules andexceptions, the supervisors will be more easily manipulated, the consultants will be happilyemployed and the big banks will pick off smaller banks straining under the financial costs ofimplementation.”
2. The effects of basel II on developing countries 11
2.6. Benefits of International Diversification
Djamester Simarmata addressed the issue of international diversification10. “. . . we need moreinformation in order to shed more lights on the problem of financial flows to developingcountries from international banks. The problems are related to the following issues:
1) The procyclicality of the credits to the developing countries. At the boom times, thecredit will be abundants, but it will be scarce at the recessionary periods, where the needswere really mounting to push the economic growth.
2) The price of commodities in developing countries follows the boom and bust cycles,where the bust cycles were generally longer than the boom cycles. We need more infor-mation on the periods of these cycles between commodities and between countries. Bycommon sence we could concludes that the bust cycles will be in line with the recessionaryperiods in the developed countries.
3) How could we adjust the simultaneity of those cycles to help the economic growth of thedeveloping countries. Here comes the problem of procyclicalities of credits to the foreagain.
4) How could we manage the diversification issues in relation to the above issues on boom-bust of commodity prices, procyclicalities, and so on.”
“By regading the previous published risks by the BIS for several countries, the new Basel-IIcould give way to the reduction of risks, so that it could reduce the necessary loss provision.In that publication, it was shown for the year 2001 by the BCBS publication that the risksin Indonesia was leading to CAR (minimum capital requirements) of 12 percent, while thatfor Malaysia was only 4 percent. The Malaysian case show that if the internal situation wereconducive, the risks were low, leading to a required CAR of less than Basel-I one-size-fitall of 8 percent. From this point, there could be an incentive for developing countries tomanage their economy well following the Basel—II criteria leading to a low CAR.”
2.7. Strengthening Asia’s Financial System
Amador Honrado, Jr. presented the Asian Bankers’ Association position paper on Strength-ening Asia’s Financial Systems.”11 “1. The Asian Bankers’ Association (ABA) notes thatrecent developments, including significant declines in asset prices, the emergence of majorcorporate governance failures, renewed financial troubles in emerging markets and lingeringconcerns about security have generated an atmosphere of considerable uncertainty, aggra-vating the current economic weakness in key markets and threatening to delay the processof recovery in most Asian economies from the effects of the 1997–98 financial crisis.
2. We see the need for urgent action by individual governments and more active coopera-tion within bodies such as the Asia-Pacific Economic Cooperation (APEC) forum to restoreinvestor confidence in key markets while accelerating the resolution of bad debt problems andfurther strengthening Asia’s financial systems against risks of recurrent crisis and contagion.”
. . . “In the light of this situation, we see even greater urgency for the full implementationof measures we have recommended in the past to APEC Economic Leaders and FinanceMinisters, multilateral financial institutions, and financial authorities . . . We reiterate our callfor cooperative measures to assist bank supervisory authorities in preparing to implement thenew Basel Capital Accord.”
12 Benton E. Gup
2.8. Differing Goals
Frank Sammeth stated that “The problem is in fact complex because development policiesand banking on the one hand, and macroeconomic aspects of growth and microeconomicparticularities of capital flow and financial markets seem to collide.12
On the one side there is the urgent need of capital for development and on the other sidethe private banking system which is interested in lowering the risks of any credits given.
The main two questions are: does the BCA negatively affect capital flow to countries inneed of capital for growth, and if so what can be done to reduce those effects?
Before you can answer the second question you have of course to agree on the first one.The key is the method risk—assessing and—management which can differ whether you
represent the interests of a private bank or of a development organisation, because theperspective is different: creditors look at the projects themselves and its chances of successunder the aspect of risk, while international organisations have to include socio-economic,political, ethical and other aspects according to their mission. The result can be that a NGOor IO approves a project because of its long-term positive impact and sustainable effect onan aspect of development while a private investor may disapprove because he settles the risksto high and prefers to give not the credit.”
. . . “What are the different interests of the agents? Governments want to encourage privatebanks to lend to developing countries in order to relax national budgets affected by highunemployment and low growth rates. Banks want to minimize their risks, and of coursemake profit. Developing countries and agents or institutions in development cooperationare in need of capital and defend the long—run and global perspective of growth, includingqualitative aspects you see rarely in monetaristic or specific approaches.
The solution is a risk-calculation method which satisfies them all: governments, by beingsupported by private banks concerning the overall capital flow to developing countries; thebanks who are sure they are running low risks and the development agents who get morefunds.
So, finally, does Basel II go into that direction? I think yes, because it offers a commonapproach applicable to all agents, making internal or other ratings less crucial for decisionmaking. Secondly, if all banks implement Basel II, their practice will converge and will bemore predictable.”
2.9. Normal Times vs Crises
Ashima Goyal wrote that “In lending to emerging market economies we need to distinguishbetween risk in normal times and that in times of crises.13 In normal times risk is low,and portfolio diversification works to lower it further. Moreover the productivity of suchlending is high. The problem with sophisticated Var models is that they would overstate riskin such times, but cannot cover the sharp rise in systemic risk in times of crises. Systemic riskat such times is aggravated by herd behaviour which punishes countries for circumstancesthey are not wholly responsible for. Therefore individual or micro risk cover can never besufficient. Some macro intervention linked to a new international financial architecture hasto be designed to supplement Basel II.
Second we need to distinguish between sophisticated banks which will be able to lowerrisk cover and gain a competitive advantage over the others. The latter are largely small
2. The effects of basel II on developing countries 13
banks in emerging market economies. Since these tend to be tightly regulated by centralbanks, and are a major source of the portfolio diversifying type of credit to the small firmor farmer, there is a rationale for lowering their capital adequacy requirement while givingthem incentives to graduate to higher levels of sophistication. If Basel II increases their capitalrequirement it would be inefficient as well as inequitable.”
2.10. Adjusting Capital for Diversification
Stephen Spratt & Stephany Griffith-Jones responded to a question about correction factorfor the Capital Accord that would take diversification into account.14 “One such mechanismhas been proposed by the Spanish bank BBVA.
In A practical proposal for improving diversification treatment in Basel 2 the authors definea “correction factor” which measures the error made when using a single factor model—such as that envisaged in Basle 2—when in fact there are two (or three) factors affectingdiversification of the portfolio. These factors could be geographical areas (emerging vs. nonemerging economies), industrial activities or a combination of the two. The correction factoris defined as the ratio between the capital calculated with the two (or three factor model) andthe capital obtained with the single factor model. The paper then develops a diversificationindex to measure the degree of diversification in a portfolio (a diversification index of 35%indicates maximum diversification and 100% indicates maximum concentration), and theauthors demonstrate a clear relationship between the correction factor and the diversificationindex. In a situation of no diversification the discrepancy between the one-factor model (tobe used in the Basel 2 and which does not take account of the benefits of diversification)and the two and three factor models is zero: they produce the same result as there is nodiversification to take into account. However, as the level of diversification increases sodoes the discrepancy between the Basel 2 one-factor model and the more sophisticated twoand three factor models: as diversification increases the Basel 2 one-factor model becomesincreasingly inaccurate in its overestimation of the capital required.
In practical terms, the maximum capital savings for broad diversification in the BBVAempirical work (for both the two and three factor models) range from 16% to 21%. It isinteresting that these figures coincide with our own simulated calculations, suggesting thatsomething beyond a particular case is being captured here. In short, if a one risk factor modelis used as in Basel 2, it would require capital requirements to be higher than the two andthree factor models by between 16% and 21%, which can be seen as a proxy for the failureto take account of international diversification.
BBVA propose a simple practical adjustment mechanism that enables the introduction ofthe benefits of international diversification into Pillar1. The mechanism proposed consistsof using the correction coefficient so that regulatory capital is defined from the one factormodel currently proposed multiplied by this coefficient,
Capital adjusted for diversification = Capital defined by the one factor model× Correction coefficient
That is, a fully diversified bank would multiply their total regulatory capital by a coefficientto correct for diversification. In the BBVA study this would be 0.79 for the three factor model
14 Benton E. Gup
and 0.84 for the two factor. Our own simulations would suggest a correction coefficient inthe range of 0.77 to 0.80.
Much in the Accord decreases the incentives for international banks to lend to developingcountries. This proposal would offset that to some extent: banks that are already diversifiedwould face less of an incentive to withdraw from developing country lending, whilst thosethat are not currently engaged in such lending would face lower obstacles to becoming so.
2.11. Globalization of Financial Markets Is The Key
Jose Joaquin Morte Molina said that “One must admit, however, that many of the concernsthis forum have underlined are already occurring in the banking industry.15 Deutsche Banks,one of the leading international banks, has been systematically shrinking its loan portfolioat the same time that trading and investment assets account for the biggest part of its totalassets. In fact, due to capital requirements, the bank has been shifting business from traditionalbanking to investment banking with negative consequences not only for emerging marketsbut for the SME sector . . . in Germany!!!
My message today will be that while the biggest players are already engaged in a processabout how to do business in banking, it is important to analyze more broadly how financialsystems currently develops, both at national and at international level.”
. . . “In all, if the market approach is to be the result of the new Basel II accord, globalizationof financial markets is the key. Admittedly, with globalization, financial markets becomemore complex. But to reinforce financial stability we have to consider the increasing overlapand interaction between banks and securities markets, and between both of them and theinsurance sector.”
3. CONCLUDING COMMENTS
The principal intent of Basel II was to enhance the risk management systems of LargeComplex Financial Organizations (LCFOs) such as Citigroup, Deutsche Bank, and ABNAmro. By definition, LCFOs are internationally active, and their actions may affect somedeveloping countries. However, the Basel Committee did not address the needs of developingcountries. Nevertheless, Basel II will have a direct impact on those countries that adopt it andan indirect impact on the other countries. The comments presented here addressed issuesthat the Basel Committee should consider as Basel II evolves over time.
ENDNOTES
1. For further information about the gpgNet, see:http://www.sdnp.undp.org/gpgn/about.php. The gpgNet is hosted by the Office of Development Studies inthe United Nations Development Programme (UNDP). However the contents of this website do not, in anyway, reflect the views of UNDP, or the views of any of the Member States of the United Nations (UN).The “global public goods” concept is an emerging one, and gpgNet places it in the public domain for widerconsultation, study and debate.
2. The gpgNet web site for the eForum is: http://groups.undp.org/read/?forum=gpgnet-basel3. The dates shown below are the dates that the messages were listed on the website. Also see:
http://www.sdnp.undp.org/gpgn/index.php4. Stephany Griffith-Jones, Research Fellow and Professor at the Institute of Development Studies, Institute
of Development Studies, University of Sussex, Brighton, UK; May 27, 2004, http://www.ids.ac.uk/ids/news/Archive/Baselmistakes.html
5. Stephany Griffith-Jones and Stephen Spratt (Head of Research, Intelligence Capital), May 27, 2004.6. Benton E. Gup, University of Alabama, USA; May 27, 2004.

2. The effects of basel II on developing countries 15
7. Sunada Sen, Academy of Third World Studies, Jamia Millia, New Delhi, India, May 27, 2004.8. Paul Bance, Department of Economics, European University Institute, Florence, Italy May 28, 2004.9. Avinash Persaud, Investment Director, GAM London Ltd, UK Stephen Spratt, Head of Research, Intelligence
Capital, May 26, 2004.10. Djamester Simarmata, Faculty of Economics University of Indonesia, Jakarta, May 28, 2004.11. Amador Honrado, Jr., Assistant Deputy Secretary, Asian Bankers Association, May 28, 2004.12. Frank Sammeth, Paris, France, June 10, 2004.13. Ashima Goyal, Professor, Indira Gandhi Institute of Development Research Mumbai, India, June 11, 2004.14. Stephen Spratt & Stephany Griffith-Jones, June 14, 2004. —————————————–15. Jose Joaquin Morte Molina, Council of Europe Development Bank Paris, June 14, 2004.
3. CAPITAL GAMES
BENTON E. GUP
1. INTRODUCTION
Michael Moscow (1996), President of the Federal Reserve Bank of Chicago, said that thereare two approaches to regulation: the command and control approach, and the incentive compatibleapproach. Under the command and control approach, regulators tell banks what they can do—such as capital requirements—and what they cannot do. He goes on to point out some ofthe problems with the command and control approach. First, there is informational asymmetry,where regulations cannot be enforced if they require credible information about the firm thatis not readily available or is overly costly to obtain. A second problem is the law of unintendedconsequences by the regulated firms. Stated otherwise, the regulations may induce unintendedbehavior among the regulated firms that the regulators did not want. The third problemis implementation, which means that the rules may be overly restrictive. Collectively, theseproblems may result in banks seeking activities that have low regulatory capital requirementsand high risks and expected returns, and discourage them from activities that have highcapital requirements and lower expected returns. Accordingly, lower risk businesses will tendto move away from the banking sector.1
The incentive compatible approach provides guidelines and principles that can be used toachieve the desired goals.
Moscow (1996) goes on to say that because of the problems associated with commandand control, regulations are evolving toward an incentive compatible approach where thatattempts align the incentives of the firm’s owners with certain social goal. The 1988 BaselAccord is an example of the command and control approach with one standard—an 8%capital requirement applying to all banks. The New Basel Capital Accord (e.g., Basel II)
18 Benton E. Gup
contains elements of both command and control and the incentive compatible approaches.It too requires 8% capital, but it also provides alternative means for computing the requiredcapital. Nevertheless, because Basel II is both complex and costly to implement one wouldexpect both unintended consequences and implementation problems to emerge.
Some of the problems are associated with the complexity that comes about as a resultof Basel II’s increased emphasis on risk management processes. Comptroller of the Cur-rency John D. Hawke Jr. (February 27, 2003) stated that Basel II is a proposal “of immensecomplexity—greater complexity, in my view, than is reasonably needed to implement sen-sible capital regulation.” Hawke (March 3, 2003) went on to say that the hundreds of pagesof rules were “not written for bankers—or for that matter, by or for conventional bankexaminers. They’re written for mathematicians and economists—‘quants.’” The complexityhas costs, “for if legislators, customers, and market participants cannot penetrate the rules,can we expect them nonetheless to love and respect them?”
Hawke (February 27, 2003) went on to say that banks complying with Basel II will havelower capital requirements than smaller “non-Basel” banks which will put the smaller banksat a competitive disadvantage. In fact, a study by French (2003) shows that during most of atypical economic cycle, the risk-based capital requirements for Basel II banks will fall belowthat required under the Prompt Corrective Action (PCA) guidelines.
The cost for implementing Basel II ranges from an estimated $10 million for small banksto $150 or more for large banks.2 In addition, there will be ongoing costs for maintainingthe systems.
Given the arguments about regulatory structures, complexity, and costs, this article exam-ines how some banks and governments evade the capital regulations when it is in their bestinterest to do so. Stated otherwise, some banks engage in regulatory arbitrage, or as it is calledhere, capital games. This article describes capital games under both the 1988 Capital Accord,and Basel II. Basel II will required for only about 10 large banks in the U.S, and most of theremaining 7,800+ banks will continue to use the 1988 Capital Accord standards.
2. CAPITAL REQUIRED FOR A LOAN
An FDIC study by Burhouse, et al. (2003) explained how the capital standards have changedover time. The amount of capital required for a $100 commercial loan made prior to 1982was judgmental—there was no set percentage required. Under the 1988 Basel Accord, therequired capital the $100 loan was $8. Under the Basel II Advanced Internal Rating Based(IRB) approach, the required amount of capital can range from $0.37 to $41.65 dependingon the borrower’s credit rating, maturity of the loan, the probability of default (PD) reflectingthe borrower’s financial strength, the loss given default (LGD) indicating the severity of theloss, and other factors.
It follows that banks will avoid holding loans that require them to hold excessive capital.Alternatively, banks are creative, and they will structure loans in ways that will reduce capitalcharges. For example, a bank may issue a 364-day revolving commercial loan with the optionto renew it. Such a loan has a 4% capital requirement because the maturity is less than one year.This loan structure is preferable to the alternative of issuing a 2-year revolving commercialloan that has an 8% capital requirement.
Another choice is for banks to calculate or adjust the PD and LGD to meet their needs. It isimportant to recognize that two or more banks may evaluate the same loan differently. A Basel
3. Capital games 19
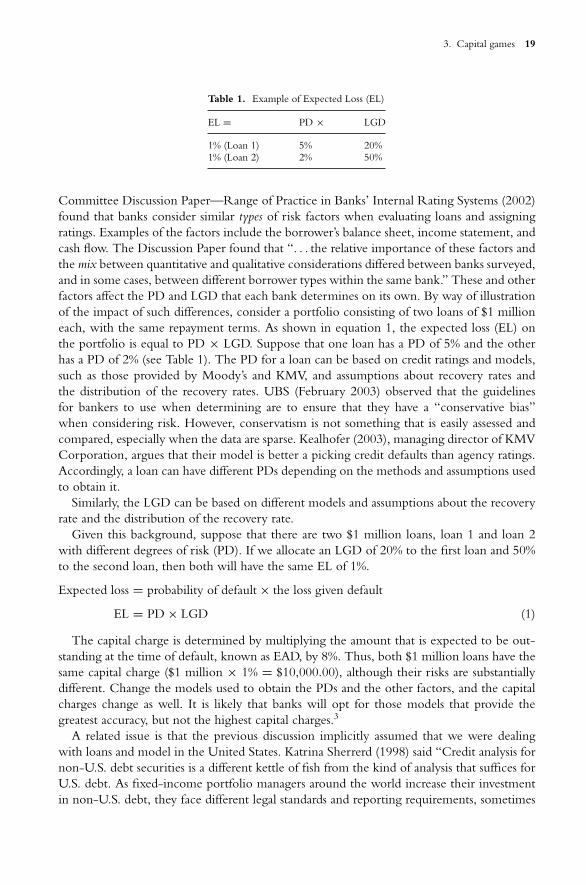
Table 1. Example of Expected Loss (EL)
EL = PD × LGD
1% (Loan 1) 5% 20%1% (Loan 2) 2% 50%
Committee Discussion Paper—Range of Practice in Banks’ Internal Rating Systems (2002)found that banks consider similar types of risk factors when evaluating loans and assigningratings. Examples of the factors include the borrower’s balance sheet, income statement, andcash flow. The Discussion Paper found that “. . . the relative importance of these factors andthe mix between quantitative and qualitative considerations differed between banks surveyed,and in some cases, between different borrower types within the same bank.” These and otherfactors affect the PD and LGD that each bank determines on its own. By way of illustrationof the impact of such differences, consider a portfolio consisting of two loans of $1 millioneach, with the same repayment terms. As shown in equation 1, the expected loss (EL) onthe portfolio is equal to PD × LGD. Suppose that one loan has a PD of 5% and the otherhas a PD of 2% (see Table 1). The PD for a loan can be based on credit ratings and models,such as those provided by Moody’s and KMV, and assumptions about recovery rates andthe distribution of the recovery rates. UBS (February 2003) observed that the guidelinesfor bankers to use when determining are to ensure that they have a “conservative bias”when considering risk. However, conservatism is not something that is easily assessed andcompared, especially when the data are sparse. Kealhofer (2003), managing director of KMVCorporation, argues that their model is better a picking credit defaults than agency ratings.Accordingly, a loan can have different PDs depending on the methods and assumptions usedto obtain it.
Similarly, the LGD can be based on different models and assumptions about the recoveryrate and the distribution of the recovery rate.
Given this background, suppose that there are two $1 million loans, loan 1 and loan 2with different degrees of risk (PD). If we allocate an LGD of 20% to the first loan and 50%to the second loan, then both will have the same EL of 1%.
Expected loss = probability of default × the loss given default
EL = PD × LGD (1)
The capital charge is determined by multiplying the amount that is expected to be out-standing at the time of default, known as EAD, by 8%. Thus, both $1 million loans have thesame capital charge ($1 million × 1% = $10,000.00), although their risks are substantiallydifferent. Change the models used to obtain the PDs and the other factors, and the capitalcharges change as well. It is likely that banks will opt for those models that provide thegreatest accuracy, but not the highest capital charges.3
A related issue is that the previous discussion implicitly assumed that we were dealingwith loans and model in the United States. Katrina Sherrerd (1998) said “Credit analysis fornon-U.S. debt securities is a different kettle of fish from the kind of analysis that suffices forU.S. debt. As fixed-income portfolio managers around the world increase their investmentin non-U.S. debt, they face different legal standards and reporting requirements, sometimes
20 Benton E. Gup
a scarcity of information, and political risk concerns that simply do not exist for the debtof the U.S. government, U.S. agencies, or companies domiciled in the U.S.” Although thisstatement was written for investment managers, it also applies to banks. Thus, even greateropportunities for regulatory arbitrage may exist in some foreign countries.
Karen Shaw Petrou (2003) argues that the capital treatment of Small- and Medium-SizedEnterprises (SMEs) is an arbitrage problem. SMEs are defined as firms with annual revenuesup to $50 million, far larger than small and medium size firms are defined in the U.S. UnderBasel II, they are treated the same as loans to individuals (i.e., retail credit) which has a farlower capital charge than large companies. However, they are riskier than large companies,in part, because they cannot be tracked by external credit rating agencies. Petrou (2003)states that banks in Europe can “arbitrage this low regulatory capital against other lenderswho must set aside appropriate economic capital.” The favorable treatment for SMEs cameabout when German Chancellor Schroeder threatened to take Germany out of the Baselnegotiations unless this special capital charge was included. Germany does not have U.S. stylegovernment agencies to support small and medium sized enterprises.
Finally, there is a competitive equality problem in the application of Basel II. The AdvancedInternal Rating Based (A-IRB) when it is adopted will only be required for about ten of thelargest U.S. banks, although others may chose to adopt it because of ratings pressure, and forother reasons.4 Stated otherwise, the major league banks use the A-IRB capital standards,and other banks have the choice of being in the major or minor league. The minor leaguebanks will continue to use the Basel I standards.
Some regional banks that this will put them at a competitive disadvantage because theywill have higher regulatory capital charges on residential mortgages, certain retail credits, andloans to small businesses than the A-IRB banks.
3. DEBT FOR EQUITY
Selling common stock is the most expensive way to increase bank capital, and it may dilute theexisting shareholders’ equity. An alternative is to issue trust preferred securities which havethe advantage of increasing capital and the return on equity (ROE) because of the increasedfinancial leverage.5 Additionally, they are treated as debt of the issuer for tax purposes, andas equity for bank regulatory purposes.
3.1. Trust Preferred Securities
More than 750 bank holding companies of all sizes have issued $76 billion in trust preferredstock that provides a tax advantage and counts up to 25% toward their Tier 1 capital subjectto the approval of the Federal Reserve.6 Trust preferred stock also can be used in Tier 2capital. Trust preferred stocks are traded under a variety of acronyms such as TOPRS (TrustOriginated Preferred Shares), QUIPS (Quarterly Income Preferred Shares, Pooled TrustPreferred Certificates), and Hybrid Preferred Securities.7 Trust preferred securities shouldnot be confused with adjustable rate preferred stock (ARPS) or money market preferredstock (MMPS) that are subject to a 15% limit in being counted toward Tier 1 capital for statebanks.8
Typically, the bank holding company (BHC) organizes a “trust” or special purpose entity(SPE) that is a non-taxpaying subsidiary, such as those listed in Table 2. SPEs also are referredto as “Special Purpose Vehicles,” (SPV) and “Variable Interest Entities (VIE). The trust
3. Capital games 21
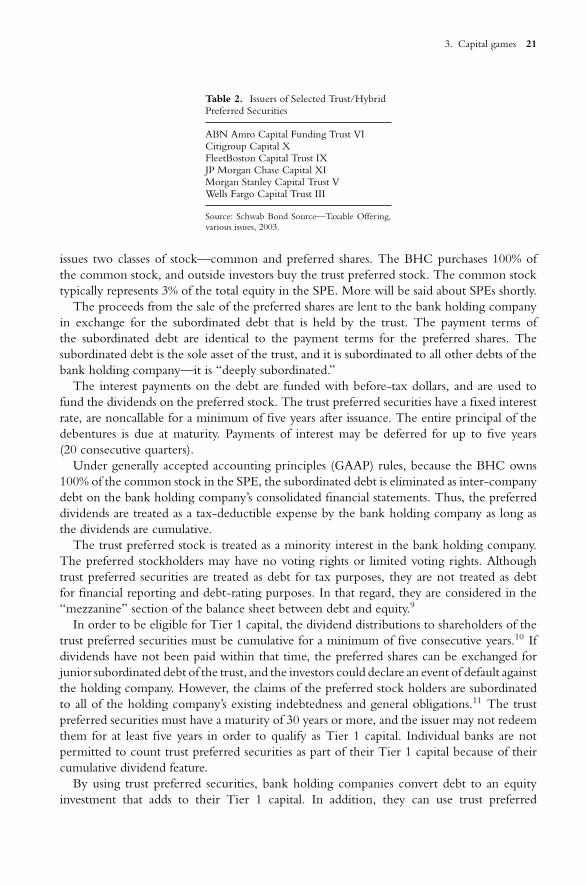
Table 2. Issuers of Selected Trust/HybridPreferred Securities
ABN Amro Capital Funding Trust VICitigroup Capital XFleetBoston Capital Trust IXJP Morgan Chase Capital XIMorgan Stanley Capital Trust VWells Fargo Capital Trust III
Source: Schwab Bond Source—Taxable Offering,various issues, 2003.
issues two classes of stock—common and preferred shares. The BHC purchases 100% ofthe common stock, and outside investors buy the trust preferred stock. The common stocktypically represents 3% of the total equity in the SPE. More will be said about SPEs shortly.
The proceeds from the sale of the preferred shares are lent to the bank holding companyin exchange for the subordinated debt that is held by the trust. The payment terms ofthe subordinated debt are identical to the payment terms for the preferred shares. Thesubordinated debt is the sole asset of the trust, and it is subordinated to all other debts of thebank holding company—it is “deeply subordinated.”
The interest payments on the debt are funded with before-tax dollars, and are used tofund the dividends on the preferred stock. The trust preferred securities have a fixed interestrate, are noncallable for a minimum of five years after issuance. The entire principal of thedebentures is due at maturity. Payments of interest may be deferred for up to five years(20 consecutive quarters).
Under generally accepted accounting principles (GAAP) rules, because the BHC owns100% of the common stock in the SPE, the subordinated debt is eliminated as inter-companydebt on the bank holding company’s consolidated financial statements. Thus, the preferreddividends are treated as a tax-deductible expense by the bank holding company as long asthe dividends are cumulative.
The trust preferred stock is treated as a minority interest in the bank holding company.The preferred stockholders may have no voting rights or limited voting rights. Althoughtrust preferred securities are treated as debt for tax purposes, they are not treated as debtfor financial reporting and debt-rating purposes. In that regard, they are considered in the“mezzanine” section of the balance sheet between debt and equity.9
In order to be eligible for Tier 1 capital, the dividend distributions to shareholders of thetrust preferred securities must be cumulative for a minimum of five consecutive years.10 Ifdividends have not been paid within that time, the preferred shares can be exchanged forjunior subordinated debt of the trust, and the investors could declare an event of default againstthe holding company. However, the claims of the preferred stock holders are subordinatedto all of the holding company’s existing indebtedness and general obligations.11 The trustpreferred securities must have a maturity of 30 years or more, and the issuer may not redeemthem for at least five years in order to qualify as Tier 1 capital. Individual banks are notpermitted to count trust preferred securities as part of their Tier 1 capital because of theircumulative dividend feature.
By using trust preferred securities, bank holding companies convert debt to an equityinvestment that adds to their Tier 1 capital. In addition, they can use trust preferred
22 Benton E. Gup
securities to retire more expensive debt, to fund acquisitions, and for common stock buybackprograms.
Many small banks issue trust preferred securities which are then securitized and sold toother small banks. Because banks are not allowed to have reciprocal cross-holdings of capital,the banks invest in investment pools of other small banks. They find the yields on thetrust preferred securities attractive in their investment portfolios, and some of them haveinvestment grade ratings. The bottom line is that the capital being raised by banks is fromother banks in the system that are taking advantage of taxes and capital rules to boost theircapital and improve their investment yields. Interestingly, small banks on average have excesscapital ratios. The average capital/asset ratios in 2002 4th Quarter for banks with assets of less$100 million was 17%, and for banks in the $100 million–$10 billion range was 14.3%.12
The OCC has cautioned banks that buy trust preferred securities that there is substantialrisk associated with them.13 Unlike federal funds that are sold by banks, trust preferredsecurities are not obligations of a bank. They are issued by subsidiaries of bank holdingcompanies and are deeply subordinated debt. Banks that have not documented their holdingsof unrated trust preferred securities are the equivalent of investment grade are in violationof 12 CFR 1.
4. SECURITIZATION
Securitization is a form of structured financing that is used to mitigate the portfolio risk ofa concentrated exposure by transferring that risk from a bank to outside investors who arewilling to take on the risk.14 The securitized cash flows are sold to investors under a varietyof names, including but not limited to collateralized debt obligations (CDOs), collateralizedmortgage obligations (CMOs), mortgage backed securities (MBS), planned amortizationclasses (PACs), interest-only (IOs) and principal-only (POs) strips. Only securitization in theUnited States is discussed here. Laws and rules concerning securitization in other countriesmay differ.
4.1. Benefits
The benefits of securitization include mitigating risk, reduced regulatory capital charges,obtaining lower cost financing, and improving their financial ratios. Richard Spillenkothen(1999), Director of the Division of Banking Supervision and Regulation at the Board ofGovernors of Federal Reserve System, argues that it is good that financial institutions havebecome more efficient in identifying and transferring risk to investors who are willing toaccept them. However, this process has permitted banks to “cherry pick” the lowest riskassets and securitizes them, “thereby reducing their capital requirements far more than theyreduce their remaining risks.” Despite these benefits, the Basel Committee on BankingSupervision Consultative Document on Asset Securitisation (2001) notes that securitizationhas the potential of increasing the overall risk profile of the bank if it is not carried out ina prudent manner. Ambrose, LaCour-Little, and Sanders (2003) find that the banks tend toretain the riskier loans and securitize the better quality loans.
4.2. Structure
Banks pool bank loans, credit card receivables, and commercial and residential mortgages,and then sell them to a special purpose vehicle (SPV). The sale of loans must be a “true sale,”
3. Capital games 23
in contrast to a collateralized borrowing arrangement. The sale removes the loans from thebank’s balance sheet. Thus, one use of securitization is to isolate legal liability and ownership.Nevertheless, the selling bank may still have a high-risk residual interest in the underlyingassets.15 Part of that risk may be what is called “implicit recourse” that also is known as“moral recourse,” that is discussed below.
4.2.1. Retained Interests
Examples of retained interests include cash collateral accounts, early amortization provisions,over-collateralization, and servicing rights.16 In cash collateral accounts, the bank depositsfunds with a trustee to be used if the proceeds from the collateralized loans are not sufficient tomake payments. Early amortization occurs if there is a negative event, then all payments fromloans are applied to the most senior securities. A negative event could be the insolvency of thebanks or a downgrading of the banks CAMELS rating by regulators.17 Over-collateralizationrefers to the bank transferring 5–10% more loans to the SPE than it is required to hold,depending on the degree of risk of those loans.
To illustrate how retained interest might be a problem, suppose that a bank holds a $100loan that has an 8% (i.e. $8) capital requirement. When the loan is sold, the bank no longerrequires the $8 capital. The bank also books a retained interest of $20 “gain on the sale.”Because of the retained interest, the bank is exposed to a downward valuation of the loan dueto inaccurate assumptions or changes in market conditions, as well as overstating its earnings.Further suppose the value of the retained interest falls to $10. The remaining capital may notcover the entire loss.
An OCC Bulletin (December 14, 1999) said “During recent examinations, our examin-ers have noted an unacceptable number of national banks with risk management systems orinternal control infrastructures insufficient to support the institution’s securitization activities.Particularly disturbing is the number of cases where the valuation of retained interests on abank’s balance sheet have not been in compliance with the standards prescribed instatementof Financial Accounting Standard No. 125, ‘Accounting for Transfers and Servicing of Finan-cial Assets and Extinguishments of Liabilities.’ In addition, several banks have inaccuratelyreported their risk-based capital by failing to appropriately account for recourse obligationsarising from securitization activities.”
As previously mentioned, some banks also have implicit recourse that arises when an insti-tution provides post-sale support to a securitization in excess of the contractual obligation.18
Implicit recourse can be used in connection with revolving securitizations, such as those usedfor credit cards and home equity lines of credit. These securitizations may provide that whencertain performance criteria reach specific levels, no new receivables can be sold into thesecuritization, and the principal on the bonds will begin to payout (i.e. early amortization).Once early amortization occurs, the bank could have difficulties using securitization as acontinuing source of funds.
By providing implicit recourse, the bank is signaling the market that it still holds some ofthe risks associated with securitization. When banking supervisors detect implicit recourse,they may require the bank to bring “back on the balance sheet” all of the assets in questionfor risk-based capital purposes. In other words, they must increase their capital ratios—whichdefeats one of the purposes of securitization.
24 Benton E. Gup
4.2.2. Special Purpose Entities (SPEs)
SPEs (also known as variable interest entities (VIEs) do not have to be consolidated on abank’s balance sheets as long as outside investors contribute 97% of the capital, most of whichis non-recourse debt. Under previous accounting rules, at least 3% equity risk capital hasto come from independent investors in order to keep the partnerships’ financial statementsoff the bank’s books. The accounting rules changed in 2003 and now 10% equity capital isrequired.19 Nevertheless, the stakeholder who holds most of the SPEs risks or rewards, mustconsolidate the SPE on its balance sheet, with some exceptions.20
Securitized assets can have their credit enhanced by the originators or third parties throughovercollateralization, early amortization, letters of credit, surety bonds, guarantees from insur-ance companies, and by other means. The originating banks may negotiate with rating agen-cies to determine what credit enhancements are necessary to get a particular rating. This isimportant because some regulated investors, such as insurance companies and pension plans,cannot invest in securities that do not have an investment grade rating.
The credit enhancements also protect the investors in the event of defaults on the under-lying loans. For all practical purposes, the credit enhancements and residual interests providethe equivalent of “economic capital” for securitized assets.21
The amount of economic capital depends on the quality of the loans being securitized,and what happens to those loans. For example, collateralized debt obligations (CDOs) canbe divided into three or more levels of risk or tranches. The lowest level of risk takes absorbsthe first losses, and if there are sufficient losses, they impinge on the next level of risk. It doesnot take many losses in a pool of 100 companies to wipe out the lowest tranche. The poorlevel of economic activity in recent years has resulted in large-scale downgrading of creditratings and widespread bond defaults in early 2003, amounting to $160 billion worldwide.22
Thus, the value of the economic capital has been undermined.The SPEs use investment bankers or underwriters to sell the securitized assets to outside
investors. However, some banks sell mortgage loans directly into the secondary market tothe Federal National Mortgage Association, Federal Home Loan Mortgage Corporation, theFederal Home Loan Banks, and to private sector issuers (e.g. Prudential, General ElectricCapital) and investors. The frequently retain the right to service the mortgage loans. AnInteragency Advisory on Mortgage Banking (2003) states that there are risks associated withservicing mortgage loans. The mortgage-servicing assets (MSA) can become impaired wheninterest rates fall and the loans are prepaid. The impairment can cause earnings volatilityand the erosion of capital. The Advisory goes on to talk about the valuation and hedging ofMSAs.
5. COVERED BONDS
Covered bonds, issued mostly by financial institutions in the European Union, are fullrecourse bonds that are secured by a pool of assets, such residential and commercial mort-gage loans or public sector loans, which remain on the issuing lending institution’s balancesheet.23 Some covered bonds are “structured.” Moody’s defines structured covered bonds asa covered bond where securitization techniques have been used to enhance its credit rating,or a secured bond issued against a pool of assets in a jurisdiction where there is no law dealingwith covered bonds.24
3. Capital games 25
Covered bonds are also known as “asset covered securities” (ACS) in France and Ireland,Cedulas Hipotecarias in Spain, and Pfandbriefe in Germany. The overcollateralized, highquality, low risk assets back the bonds throughout their life. They are usually issued byspecialized lenders.
The collateral behind the bonds is expected to have relatively low risks with respect tocredit, interest, and foreign exchange. In addition, in many cases the new collateral of similarquality may be substituted for the original collateral.
What is unique about covered bonds is that the EU standards allow banks that invest inthese bonds to have a 10% risk-based capital charge, which is less than the 20% capital chargefor investing in other high quality asset backed securities.25
6. RESTRUCTURING NONPERFORMING/DEFAULTED LOANS
There are many conventions for classifying nonperforming loans and provisioning for loanlosses. In the U.S., for example, the terms “substandard,” “doubtful,” and “loss” are used. TheBasel Committee’s “Quantitative Impact Study 3 Technical Guidance,” (2002, paragraph 399)skirts the term “nonperforming” by defining default of an obligor to have occurred wheneither or both of the following has occurred. 1) The bank considers that the obligor isunlikely to pay its credit obligation to the bank in full, without recourse by the bank to takeactions such as repossessing collateral. 2) When the obligor is 90 days or more past due onany material credit obligation to the bank. In some cases the 90 day benchmark is used forretail credits and 180 days for corporate credits.
When a loan is in default, the bank may charge-off the loan, or make a provision forlosses which may adversely affect the bank’s earnings or capital depending on the methodof provisioning used. Alternatively, banks can avoid charge-offs by restructuring those loansthat are or may become nonperforming loans. For example, a bank could make a secondloan to a nonperforming obligor that is sufficiently large to cover the payments of the loanthat is in default and some of the payments of the second loan.
In a related issue, some banks smooth their earnings by taking provisions for loan lossesand charge-offs net of recoveries when it is their advantage to do so.
7. GOVERNMENT INTERVENTION
Large scale failures of financial institutions and systemic crises are to be avoided at all costs.Accordingly, governments and regulators find creative ways to get around capital regulationsand to help some financial institutions survive. In this section we examine governmentintervention in the United States and in Japan.
7.1. United States
Market rates of interest soared in the late 1970s and early 1980s. The average interest rateon conventional existing-home mortgage loans increased from 9.70% in 1978 to 16.55% in1981.26 After 1982, interest rates declined—but the damage was done to the thrift industry.The thrifts were limited as to the types of investments they could make, and they borrowedshort-term funds to make long-term mortgage loans. The thrifts made long-term mortgageloans at low fixed-rates in the 1970s held them in their portfolios. Consequently, they facedhigher deposit rates and negative net interest margins when interest rates escalated. This gave
26 Benton E. Gup
rise to a “thrift crises.” From 1980–1990, about 1,000 thrift failures were resolved.27 Eventhe Federal Savings and Loan Insurance Corporation (FSLIC) was itself in finance distress.
Sheng (1996) states that “Regulators also granted an array of special capital and regulatoryforbearance measures that permitted thrifts to stay in business, sometimes for years, eventhrough they were insolvent.” The measures included lower capital and liquidity require-ments, net worth certificates and income certificates to boost the accounting capital, deferralson loan losses, liberal valuations of intangible assets, and so on. Thus, the thrifts regulatorycapital included subordinated debentures, intangibles, deferrals, and unrecognized losses aswell at tangible net worth.
Ultimately, FSLIC went bankrupt too, and was liquidated under the Financial InstitutionsReform, Recovery and Enforcement Act of 1989 (FIRREA). Estimates of the cost ofresolving the thrift crises in 1989 ranged from $80 billion to $150 billion.28 Later estimateswere over $200 billion.29 FIRREA restored the capital standards to their 1979 level.
7.2. Japan
The economic bubble in Japan burst in the late 1980s, and their economy suffered throughoutthe 1990s. In the late 1990s, the Japanese the government undertook reforms to return toeconomic growth.30 Part of the reform included the disposal of financial institution’s non-performing loans that threatened the stability of their financial system. The non-performingloans undermined banks’ profits and capital. The problem was exacerbated because the landacquired by banks as collateral for real estate loans could not be sold because of depressedreal estate prices. The government took several actions to deal with this problem. First, theydid not require the banks to write off their bad loans, creating the illusion that that the bankswere in better condition than they were. Second, several government-backed and privatecorporate reconstruction funds were established in 2002 to purchase non-performing loansfrom the banks. In addition, the Bank of Japan can provide “capital reinforcement” to ensurethe stability of the financial system.31
Another part of the reform package included using credits against future income taxpayments (i.e. deferred tax credits) to boost their Tier 1 capital.32 At the end of September2001, tax credits accounted for 50% of the Tier 1 capital of the major banks in Japan.33
Deferred taxes are a part of a bank’s income statement, and it is within a governments“national discretion” whether to count them as part of the Tier 1 capital.
Hakuo Yanagisawa (2002), Minister for Financial Services, Japan, said “the capital injectionis just like pouring cold water over the burning efforts by the management at the midst oftheir process to improve the sound financial status and promote profitability of each financialinstitution. We should understand that such an action would interrupt their devotion andspoil the sense of their duty towards active steps of structural reform of their own. Havingsaid so, however, I do not mean in any sense that I am indifferent to the serious situations ofthe Japanese financial system. I believe that we must not allow a Japanese financial crisis tohappen. In order to avoid any financial crisis, I will not hesitate to inject public capital intofinancial institutions when and if necessary.”
8. CONCLUSIONS
Bank regulators impose rules for safety and soundness on banks, and then both banks andthe regulators find ways to avoid, bend, or evade the rules when it is in their interest to do
3. Capital games 27
so. This article examined some of the common ways that both banks and regulators engagein capital games. Typically, it is the large complex financial organizations that engage in thegames. Small banks, at least in the United States, hold capital far in excess of the regulatoryrequirements.
Basel II is the newest game on the playing field, and it provides lots of opportunities toreduce capital requirements. In Europe, covered bonds are the latest fad in capital games. Inthe United States, some asset-backed commercial paper (ABCP) issued by SPEs is exemptfrom the risk-based capital rules.
As previously noted, bank regulators play capital games too. Examples of such interventionsinclude, but are not limited to the “thrift crises” in the U.S. and the faltering Japaneseeconomy.
Capital games are not necessarily bad. They are steps in the evolutionary process that isgoing on in our financial system.
ENDNOTES
1. See Frye (2001).2. Petrou (2003).3. For a discussion of capital charges under various approaches (1988 Accord, IRB, etc.) see “Basel II: Refinements
to the Framework” FitchRatings, February 6, 2003.4. Ferguson (February 27, 2003).5. Although not discussed here, National banks may invest in trust preferred securities if they meet the rating and
marketability requirements of 12 CFR Part 1. See “Interpretive Letter #777,” April 1997. Also see Harvey,Collins, and Wansley (2003) for a study of the pricing of trust preferred securities.
6. See Powell (2004), Kalser (1997), and the “Commercial Bank Examination Manual” (Section 3020) for details.7. See Jordan (2000) for details. In February 2003, Citigroup Capital Trust IX offered a Hybrid Preferred Security
though Charles Schwab & Co.8. Financial Institution Letters, “Authority of State Banks to Invest in Trust Preferred Securities, FDIC, FIL-16,
99, February 19, 1999.9. Frischmann and Warfield (1999).
10. Trust preferred stock issues covered by certain interest rate contracts for hedging are not eligible for Tier 1 capital.See Supervisory Letter, Derivative Contracts Hedging Trust Preferred Stock, March 28, 2002; “Approval ofthe Use of Certain Preferred Stock Instruments in Tier I Capital, October 21, 1996.”
11. Bank One Capital VI Prospectus (2001).12. FDIC Quarterly Banking Profile, Fourth Quarter, 2002, Table III-A.13. OCC Bulletin, “Unsafe and Unsound Investment Portfolio Practices,” May 22, 2002.14. For details about securitization, see Kendall and Fishman (1998), and Aidun (1995). For a discussion about
securitization and regulatory arbitrage, see Calomiris and Mason (2003), Higgins and Mason (2003). Calomirisand Mason (2003).
15. Bies (October 8, 2002); Interagency Guidance on Asset Securitization Activities (December 13, 1999).16. The Interagency Guidance on Asset Securitization Activities (December 13, 1999) points that although ser-
vicing rights are a retained interest of the seller, they have different risk-based capital requirements than theother retained interests; “Asset Securitisation,” (2001).
17. “Interagency Advisory on the Unsafe and Unsound Use of Covenants Tied to Supervisory Actions in Securi-tization Documents,” (May 23, 2002).
18. “Interagency Guidance on Implicit Recourse in Asset Securitizations,” (May 23, 2002); OCC Bulletin, “Inter-agency Questions and Answers on the Capital Treatment of Recourse, Direct Credit Substitutes, and ResidualInterests in Asset Securitizations,” (May 23, 2002); Higgins and Mason (2003) also discuss “implicit recourse,”in connection with securitization.
19. FASB Interpretation No. 46, January 2003, concerning Variable Interest Entities created after January 1, 2003.It is presumed that an equity investment of less than 10% of total assets is insufficient. This does not mean thatan equity investment of 10% or more is sufficient. The proper amount of equity depends on the activities ofthe VIE.
20. See OCC News Release NR 2003-72, (September 13, 2003). An exception is given for asset-backed com-mercial paper (ABCP). Also see OCC “Agencies Issue Rulemakings to Amend Risk-Based Capital Treatment
28 Benton E. Gup
of Exposures to Asset-Backed Commercial Paper Programs and Securitizations with Early Amortization Pro-visions,” Interim Final Rule (September 2003), Footnote 2.
21. “Asset Securitisation,” (2001).22. “Toxic Waste,” March 15, 2003.23. “The Market For Covered Bonds In Europe,” 2003; “Basel II Spurring Market Creativity?,” 2003.24. “European Structured Covered Bonds: Moody’s Rating Approach,” (April 10, 2003).25. The EU standard for covered bonds is outlined in article 22 (4) of the Undertakings for Collective Invest-
ments in Transferable Securities (UCITS) directive. In the U.S., special treatment is given in connection withasset-backed commercial paper (ABCP) programs (See OCC News Release NR 2003-72, (September 13,2003).
26. Statistical Abstract of the United States 1989, Table 823.27. Sheng, 1996; Resolving the Thrift Crises, 1993.28. Sheng, 1996.29. Cole, McKenzie, and White, 1995.30. See “The Challenge of Structural Reform. . . . ” Joint Report ( June 1998)31. “Emergency Countermeasure to Deflation,” (February, 2002).32. “Program for Financial Revival,” October, 2002).33. Toritani and Jones (2003).
REFERENCES
Aidun, Christopher K., “A Primer on Asset Securitization,” Journal of Commercial Lending, September 1995, 19–32.Ambrose, Bent W., and Michael LaCour-Little, and Anthony B. Sanders, “Does Regulatory Capital Arbitrage or
Asymmetric Information Drive Securitization,” Presented at the annual meeting of the Southern Finance Assoc.,Charleston, S.C., December 5, 2003.
“Approval of the Use of Certain Preferred Stock Instruments in Tier I Capital, October 21, 1996,” Federal ReserveBulletin, November 1996, 1112–1113.
“Asset Securitisation,” Consultative Document, Basel Committee on Banking Supervision, Basel, Switzerland,Bank for International Settlements, January 2001.
Bank One Capital VI, Prospectus Supplement, 7.20% Preferred Securities, October 11, 2000.Bartholomew, Philip F., Resolving the Thrift Crises, Washington, D.C., Congressional Budge Office, 1993.“Basel II: Refinements to the Framework,” Fitch Ratings, Credit Polity, Special Report, February 6, 2003, Com-
ments on Basel II, QIS 3, http://www.bis.org/bcbs/qis/qis3.htm#resp (visited 4/18/03).“Basel II Spurring Market Creativity?” Global Risk Regulator, June 2003, 5.Bies, Susan Schmidt, Remarks by Governor Bies at Thunderbird, The American Graduate School of International
Management, Glendale, Arizona, “Financial Markets and Corporate Governance in the United States and OtherCountries,” February 11, 2003.
Burhouse, Susan, John Feid, George Finch, and Keith Ligon, “Basel and the Evolution of Capital Regulation:Moving Forward and Looking Back,” For Your Information, Federal Deposit Insurance Corporation, January 14,2003,
Calomiris, Charles, and Joseph H. Mason, “Credit Card Securization and Regulatory Arbitrage,” EconPapers, FederalReserve Bank of Philadelphia, No. 03-07, 2003.
Cole, Rebel A., Joseph A. McKenzie, and Laurence J. White, “Deregulation Gown Awry: Moral Hazard and theSavings and Loan Industry,” appears in The Causes and Costs of Depository Institutions Failures, Allin F. Cottrell,Michael S. Lawlor, and John H. Wood, editors, Boston, MA., Kluwer Academic Publishers, 1995, 29–74.
“Commercial Bank Examination Manual,” Section 3000, Board of Governors of the Federal Reserve System,Washington, D.C., (May 2002). http://www.federalreserve.gov/boarddocs/SupManual/default.htm#cbem
“Emergency Countermeasure to Deflation,” The Ministry of Foreign Affairs of Japan, (February 27, 2002).www.mofa.go.jp/policy/economy/japan/measure0202.html (visited 2/20/03).
“European Structured Covered Bonds: Moody’s Rating Approach,” International Structured Finance, RatingMethodology, Moody’s Investors Service, April 10, 2003.
FASB Interpretation No. 46, Consolidation of Variable Interest Entities, an interpretation of ARB No. 51, FinancialAccounting Standards Board, January 2003.
FDIC Quarterly Banking Profile, Fourth Quarter, 2002, Table III-A http://www2.fdic.gov/qbp/2002dec/cb3.htmlFerguson, Roger W., Vice Chairman of the Board of Governors of the Federal Reserve System, Statement before
the Domestic and International Monetary Policy, Trade and Technology Subcommittee on Financial Services,U.S. House of Representatives, February 27, 2003.
Financial Institution Letters, “Authority of State Banks to Invest in Trust Preferred Securities, FDIC, FIL-16, 99,February 19, 1999.
3. Capital games 29
French, George, “Estimating the Capital Impact of Basel II in the United States,” For Your Information (FYI), FederalDeposit Insurance Corporation, December 8, 2003.
Frischmann, Peter J., and Terry D. Warfield, “Multiple Motivations and Effects—The Case of Trust PreferredStock,” Issues in Accounting Education Abstracts, Vol. 14, No. 2, May 1999.
Frye, Jon, “Weighting for Risk,” Capital Market News, Federal Reserve Bank of Chicago, December 2001, 1–3.Harvey, Keith D., M. Carry Collins, and James W. Wansley, “The Impact of Trust-Preferred Issuance on Bank
Default Risk and Cash Flow: Evidence from Debt and Equity Securities Markets, The Financial Review, 38, May2003, 235–256.
Hawke, John D., Jr., Comptroller of the Currency, Statement before the Subcommittee on Domestic and Inter-national Monetary Policy, Trade and Technology of the Committee on Financial Services, U.S. House ofRepresentatives, February 27, 2003.
Hawke, John D., Jr., Comptroller of the Currency, Remarks before the Institute of International Bankers, Wash-ington, D.C., March 3, 2003.
Higgins, Eric J., and Joseph R. Mason, “What is the Value of Recourse to Asset-Backed Securities? A ClinicalStudy of Credit Card Banks,” Working Papers, Federal Reserve Bank of Philadelphia, No. 00–06, April 2003.
“Interagency Advisory on Mortgage Banking,” Washington, D.C., Office of the Comptroller of the Currency,Federal Deposit Insurance Corporation, Board of Governors of the Federal Reserve System, Office of ThriftSupervision, February 25, 2003.
“Interagency Advisory on the Unsafe and Unsound Use of Covenants Tied to Supervisory Actions in Securiti-zation Documents,” Washington, D.C., Office of the Comptroller of the Currency, Federal Deposit InsuranceCorporation, Board of Governors of the Federal Reserve System, Office of Thrift Supervision, May 23, 2002.
“Interagency Guidance on Asset Securitization Activities,” Washington, D.C., Office of the Comptroller of theCurrency, Federal Deposit Insurance Corporation, Board of Governors of the Federal Reserve System, Officeof Thrift Supervision, December 13, 1999.
“Interagency Guidance on Implicit Recourse in Asset Securitizations,” Washington, D.C., Office of the Comptrollerof the Currency, Federal Deposit Insurance Corporation, Board of Governors of the Federal Reserve System,Office of Thrift Supervision, May 23, 2002.
“Interpretive Letter #777,” 12. U.S.C. 24(7)92, Office of the Comptroller of the Currency, Washington, DC, April1997.
Jordan, Paul, “Pooled Trust Preferred Stock,” Capital Market News, Federal Reserve Bank of Chicago, March 2000,6–7. www.chicagofed.org/publications/publicpolicystudies/ emergingissues/pdf/S&R-2000-2.pdf
Kalser, Kathy R., “Financial Markets,” Regional Outlook, Federal Deposit Insurance Corporation, Fourth Quarter,1997, 19–22.
Kealhofer, Stephen, “Quantifying Credit Risk I: Default Prediction,” Financial Analysts Journal, January/February2003, 30–44.
Kendall, Leon T., and Michael J. Fishman, A Primer on Securitization, Cambridge, Mass., The MIT Press, 1998.Moscow, Michael H., “The Regulation of Derivatives,” appears in Derivatives and Public Policy, Proceedings of a
Conference,” Chicago, Ill, Federal Reserve Bank of Chicago, 1996, 1–6.OCC Bulletin, “Interagency Guidance on Asset Securitization Activities,” OCC 99-46. Washington, D.C. Office
of the Comptroller of the Currency, December 14, 1999.OCC Bulletin, “Unsafe and Unsound Investment Portfolio Practices,” OCC 2002-19, May 22, 2002.OCC Bulletin, “Interagency Questions and Answers on the Capital Treatment of Recourse, Direct Credit Substi-
tutes, and Residual Interests in Asset Securitizations,” OCC 2002-22, May 23, 2002.OCC News Release, “Agencies Issue Rulemakings to Amend Risk-Based Capital Treatment of Exposures to Asset-
Backed Commercial Paper Programs and Securitizations with Early Amortization Provisions,” NR 2003-72,September 13, 2003.
OCC “Agencies Issue Rulemakings to Amend Risk-Based Capital Treatment of Exposures to Asset-Backed Com-mercial Paper Programs and Securitizations with Early Amortization Provisions” Interim Final Rule, (September2003). http://www.occ.treas.gov/ftp/release/2003-72a.pdf
Petrou, Karen Shaw, “Policy Issues in Complex Proposals Warrant Congressional Scrutiny,” Testimony before theDomestic and International Monetary Policy, Trade and Technology Subcommittee on Financial Services, U.S.House of Representatives, February 27, 2003.
“Program for Financial Revival—Revival of the Japanese Economy Through Resolving Non-Performing LoansProblems of Major Banks,” The Ministry of Foreign Affairs of Japan/Financial Services Agency, Japan, October30, 2002. www.mofa.go.jp/policy/economy/japan/program0120.html (visited 2/20/03).
Powell, Donald E., Chairman, FDIC, Remarks Before the Independent Community Bankers Association, SanDiego, CA; FDIC, Press Release PR-22-2004, March 16, 2004.
“Quantitative Impact Study 3 Technical Guidance,” Basel Committee on Banking Supervision, Basel Switzerland,Bank for International Settlements, October 2002.
30 Benton E. Gup
“Range of Practice in Banks’ Internal Rating Systems” Discussion Paper, Basel Committee on Banking Supervision,Basel Switzerland, Bank for International Settlements, January 2002.
Sheng, Andrew, “The United States: Resolving Systemic Crisis, 1981–1991, appears in Bank Restructuring: Lessonsfrom the 1980s, Andrew Sheng, editor, Washington, D.C., The World Bank, 1996, 71–86.
Sherrerd, Katrina F., “Forward” appears in Credit Analysis Around the World, Charlottesville, VA, Association forInvestment Management and Research (AIMR), 1998, v.
Spillenkothen, Richard, Director, Division of Banking Supervision and Regulation, “Banking Supervision andRegulation in the Next Millennium,” Remarks made at the New York State Banking Department, New York,New York, Board of Governors of the Federal Reserve System, Speech, October 25, 1999.
Statistical Abstract of the United States 1989, Washington, D.C., U.S. Department of Commerce, 1989.Supervisory Letter, Derivative Contracts Hedging Trust Preferred Stock, Board of Governors of the Federal Reserve
System, SR-02-10, March 28, 2002.“The Challenge of Structural Reform and Pursuing Dynamism in Society and Economy,” Joint Report by the
Social and Economic Outlook Committee and Economic Entity Role Committee, Economic Council, Japan,June 1998.
“The Market for Covered Bonds in Europe,” Deutsche Bank, Global Market Research, March 18, 2003.Toritani, Reiko, and Philip Jones, “Japanese Banks: Stormy New Year,” FitchRatings, January 16, 2003
(www.fitch.com).“Toxic Waste,” The Economist, March 15, 2003, 68–69.UBS AG, Financial Services Group, “The New Accord, Pillar 1—Quantitative Impact Study 3 Technical Guidance,”
Comment letter to the BIS, February 7, 2003, http://www.bis.org/bcbs/qis/qis3.htm#resp (visited 4/18/03).Yanagisawa, Hakuo, M.P., Minister for Financial Services, Japan, presentation at the Symposium on Building the
Financial System of the 21st Century: An Agenda for Japan and the United States Warrenton, Virginia September20, 2002. http://www.fsa.go.jp/statement/statement.html (visited 2/20/03).
4. THE INTERNATIONAL TRANSMISSION OF CAPITAL SHOCKS: IMPLICTIONSOF A REVISED BASEL ACCORD FOR DEVELOPING COUNTRIES
KEVIN T. JACQUES1
1. INTRODUCTION
In recent decades, financial sector reforms, technological innovation, and the continueddevelopment of new financial products and services have fostered a rapidly increasing inte-gration of worldwide financial markets and institutions. The importance of this integrationcan not be understated, as recent research has noted the significance of financial systemdevelopment, particularly as it relates to the banking system, in playing a vital role in theeconomic development of emerging countries. For example, Barth et al. (2004) note thatfinancial system development may contribute to economic growth by leading to greater effi-ciency in foreign banking markets, improving the accessibility of foreign individuals and firmsto financial goods and services, and providing foreign countries greater access to internationalcapital.
In contrast, while critics recognize the potential benefits of increased financial integration,they also note that financial globalization may result in increased fragility, particularly fordeveloping economies, and the financial crises of the 1980s and 1990s serve as a reminder ofthis heightened economic vulnerability and its implications for real economic activity. Forexample, Lindgren et al. (1996) argue that financial sector liberalization is a policy shock, andnote that the banking systems in a number of countries have experienced problems followingliberalization, while Schmukler (2004) notes that globalization can lead to financial crisesbeing transmitted from one country to another through broad channels of transmission—afinancial link being one of these channels.
While it is generally accepted that financial instability has associated with it negativeexternalities, Crockett (1997) notes that policymakers have a number of options in helping
32 Kevin T. Jacques
to promote global stability, one of which is through regulation. Recognizing that financialinstitutions in general, and banks in particular, play a critical role in the global integrationof markets, an important component of the international regulatory effort in recent yearshas been the work of the Basel Committee on Banking Supervision and the resulting BaselAccord. Adopted in 1988, the risk-based capital standards have as their purpose to makeregulatory capital requirements responsive to the credit risk in banks’ portfolios of assetsand off-balance sheet activities, and to establish among the member countries’ banks auniform definition and minimum regulatory level of capital. Over time, the 1988 Accord hasbecome the standard for banks worldwide, having been adopted in over 100 countries. Andwhile capital ratios in many of these country’s banking systems rose in the years followingthe introduction of the Accord, the standards have not been without problems as theirsimplified approach has failed to adequately differentiate between the credit risk of assets. Suchweaknesses resulted not only in regulatory arbitrage, but over time, in an increasing divergencebetween economic and regulatory capital requirements, thus making regulatory capital ratiosless reliable as a measure of the financial health of banking institutions (Ferguson, 2003).2
Given the current worldwide acceptance of the Basel Accord as the standard for capitalregulation, and the fact, as noted by Gup (2005), that many countries are expected to adoptthe forthcoming revised standards, a number of important policy questions need furtherexamination. One of the innovative features of the revised Accord is the explicit incorporationof credit ratings into the regulatory capital standards. With regard to global financial markets,such an innovation raises the issue of what the implications of a revised Accord will be forinternational bank lending. The existing research on the impact of the 1988 standards suggeststhat the revised Accord may have a significant impact on the asset allocation of internationally-active banks. In examining the 1988 Accord, Berger and Udell (1994) note that the risk-basedcapital standards may function as a regulatory tax, one which places a higher marginal taxrate on high credit risk assets than low credit risk assets, and as such, creates an incentivefor banks to reconfigure their asset allocation. Empirical evidence on implementation of the1988 standards by Furfine (2001), Jacques and Nigro (1997), Brinkmann and Horvitz (1995),Hall (1993), and Haubrich and Wachtel (1993) confirms that some banks responded to therisk-based requirements by not only decreasing their holdings of high credit risk assets, suchas business loans, but also by reallocating their assets towards lower risk-weighted governmentsecurities.
Also of importance, the link between regulatory capital requirements and bank lendingmeans that the risk-based standards may have implications for macroeconomic activity (Peekand Rosengren, 2000; Blum and Hellwig, 1995). With regard to the revised Accord, theincorporation of credit ratings into regulatory capital requirements raises the issue of increasedprocyclicality. Studies by Jacques (2004), Segoviano and Lowe (2002), Lowe (2002), Borio,Furfine, and Lowe (2000), and Altman and Saunders (2001) discuss how a regulatory capitalscheme that links minimum capital requirements to credit ratings introduces the possibility ofbanks responding to changes in ratings by altering their balance sheets, thereby accentuatingthe business cycle and increasing financial market instability. In addition, recent work byJacques and Schirm (2004) suggests that the revised Basel Accord may complicate the abilityof central bankers to undertake monetary policy.
While existing research suggests how the revised standards may influence bank balancesheets, the forthcoming changes to the Accord may be particularly important in developing
4. The international transmission of capital shocks 33
economies for a number of reasons. First, Chami et al. (2003) note that because banks arethe primary financial intermediaries in most developing economies, and given the explicitcapital-lending link created by the risk-based standards, changes in regulatory capital standardsmay induce changes in bank lending behavior, with important ramifications for economicactivity in developing economies. In support of this argument, Chiuri et al. (2001) provideevidence that enforcement of the 1988 Basel Accord led to significant decreases in creditin developing economies. Second, Ferri et al. (2001) conclude that the revised Accord willreduce capital requirements on corporate loans in OECD countries while simultaneouslyincreasing capital requirements on corporate loans in developing economies. Given thechanges in relative capital requirements, the revised standards may prompt banks to reducethe amount of credit supplied to borrowers in developing economies (Tanaka, 2003). Finally,Ferri et al. (2001) note that in developing economies corporate credit ratings are stronglylinked to the country’s sovereign rating. Given the reliance of the revised Accord on creditratings, and the fact that sovereign ratings have exhibited significant fluctuations duringrecent crises, Ferri et al. (2001) conclude that the revised Accord may exacerbate swingsin commercial lending in foreign countries, thereby further accentuating foreign businesscycles.
The purpose of this paper is to examine, in general, the international lending ramificationsof a revised Basel Accord—in particular, how it is likely to influence commercial lending indeveloping economies. Lending by banks from developed economies is an important sourceof credit availability in many emerging financial markets, as evidenced by the fact that totalforeign bank claims on borrowers in developing economies measured U.S. $275.1 billion inthe fourth quarter of 2003.3 But with regard to the risk-based capital standards, to date, mostexisting theoretical and empirical studies fail to recognize the potential impact of regulatorycapital requirements on international lending. Important exceptions are recent work byChiuri et al. (2002), Acharya (2001), and Peek and Rosengren (2000, 1997). The Peek andRosengren studies are particularly enlightening as they provide evidence that the risk-basedcapital standards play an important role in the international transmission of economic shocks(Peek and Rosengren, 1997), and that the standards resulted in a loan supply shock that hadsignificant economic effects (Peek and Rosengren, 2000). As the revised Accord is not duefor implementation until 2007, this paper contributes to the existing literature by providinga theoretical model of the international transmission of capital shocks to developing loanmarkets under the revised Accord, and comparing those changes to the response of banksunder the 1988 Accord.
2. THE REVISED ACCORD
As adopted in 1988, the risk-based capital standards explicitly link regulatory capital require-ments to primarily credit risk by assigning risk weights to broad categories of a bank’s on-balance sheet assets and off-balance sheet activities. Under the 1988 Accord, the risk-basedcapital standards contain four risk-weight categories: 0 percent for assets that are consideredto be free of credit risk; 20 percent for assets with low credit risk; 50 percent for assets withmoderate credit risk; and, 100 percent for high credit risk assets. A bank calculates its totalrisk-weighted assets as the sum of the dollar value of each asset or off-balance sheet activitymultiplied by the corresponding risk weight.4 In order to meet minimum regulatory capital
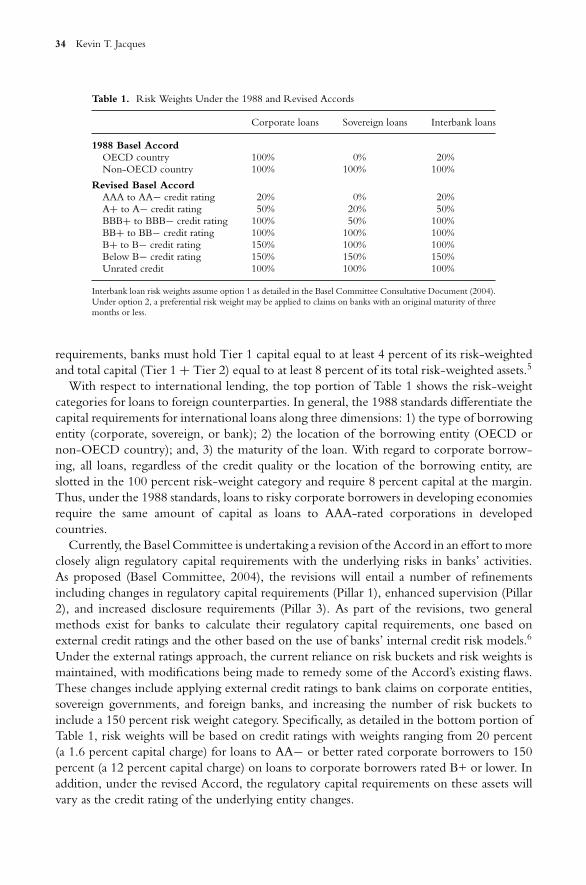
34 Kevin T. Jacques
Table 1. Risk Weights Under the 1988 and Revised Accords
Corporate loans Sovereign loans Interbank loans
1988 Basel AccordOECD country 100% 0% 20%Non-OECD country 100% 100% 100%
Revised Basel AccordAAA to AA− credit rating 20% 0% 20%A+ to A− credit rating 50% 20% 50%BBB+ to BBB− credit rating 100% 50% 100%BB+ to BB− credit rating 100% 100% 100%B+ to B− credit rating 150% 100% 100%Below B− credit rating 150% 150% 150%Unrated credit 100% 100% 100%
Interbank loan risk weights assume option 1 as detailed in the Basel Committee Consultative Document (2004).Under option 2, a preferential risk weight may be applied to claims on banks with an original maturity of threemonths or less.
requirements, banks must hold Tier 1 capital equal to at least 4 percent of its risk-weightedand total capital (Tier 1 + Tier 2) equal to at least 8 percent of its total risk-weighted assets.5
With respect to international lending, the top portion of Table 1 shows the risk-weightcategories for loans to foreign counterparties. In general, the 1988 standards differentiate thecapital requirements for international loans along three dimensions: 1) the type of borrowingentity (corporate, sovereign, or bank); 2) the location of the borrowing entity (OECD ornon-OECD country); and, 3) the maturity of the loan. With regard to corporate borrow-ing, all loans, regardless of the credit quality or the location of the borrowing entity, areslotted in the 100 percent risk-weight category and require 8 percent capital at the margin.Thus, under the 1988 standards, loans to risky corporate borrowers in developing economiesrequire the same amount of capital as loans to AAA-rated corporations in developedcountries.
Currently, the Basel Committee is undertaking a revision of the Accord in an effort to moreclosely align regulatory capital requirements with the underlying risks in banks’ activities.As proposed (Basel Committee, 2004), the revisions will entail a number of refinementsincluding changes in regulatory capital requirements (Pillar 1), enhanced supervision (Pillar2), and increased disclosure requirements (Pillar 3). As part of the revisions, two generalmethods exist for banks to calculate their regulatory capital requirements, one based onexternal credit ratings and the other based on the use of banks’ internal credit risk models.6
Under the external ratings approach, the current reliance on risk buckets and risk weights ismaintained, with modifications being made to remedy some of the Accord’s existing flaws.These changes include applying external credit ratings to bank claims on corporate entities,sovereign governments, and foreign banks, and increasing the number of risk buckets toinclude a 150 percent risk weight category. Specifically, as detailed in the bottom portion ofTable 1, risk weights will be based on credit ratings with weights ranging from 20 percent(a 1.6 percent capital charge) for loans to AA− or better rated corporate borrowers to 150percent (a 12 percent capital charge) on loans to corporate borrowers rated B+ or lower. Inaddition, under the revised Accord, the regulatory capital requirements on these assets willvary as the credit rating of the underlying entity changes.
4. The international transmission of capital shocks 35
3. THE MODEL
As noted earlier, existing research concludes that the 1988 Accord played a significant role inthe transmission of capital shocks in one country to the availability of credit in other countries.This occurred despite a regulatory capital framework that failed to differentiate between thecredit risk of corporate borrowers. Viewed from the perspective of capital standards as aregulatory tax, the question becomes how a revised Accord, one which differentiates businessloans on the basis of credit quality, will alter the international transmission of capital shocksand what the implications will be for credit availability in foreign countries.
To examine this issue, a one-period theoretical model of a representative bank is developedthat incorporates both the 1988 and revised standards. An internationally-active bank isassumed to be headquartered in a developed country (referred to as the domestic country),with a representative asset portfolio comprised of domestic corporate loans (LD), domesticgovernment securities (SD), and loans to foreign corporations (LF).7 The foreign loans areassumed to be made to corporations in a developing economy but are denominated in thecurrency of the lending country.8 In addition, the bank balance sheet contains deposits (DD)and capital (KD), both of which are assumed to be raised in the domestic market. As such,the traditional balance sheet condition requires:
LF + LD + SD = DD + KD (1)
The domestic and foreign loan markets are assumed to be imperfectly competitive with thebank facing a downward sloping demand curve for loanable funds such that:
LF = f0 − f1r FL (2)
LD = d0 − d1r DL (3)
where r FL and r D
L are the interest rates on foreign and domestic business loans, respectively.Given the nature of the respective markets, the bank’s loans are influenced by the interestrates it offers with the higher the interest rates the bank sets on loans, the more loansdecrease. A priori, f0, f1, d0, and d1 are expected to be positive, with f1 and d1 beinglarger the more competitive the loan markets.9 In addition, the bank may hold domesticgovernment securities. These securities are assumed to have no default risk, with the interestrate equaling r D
S , and recognizing that the safety of government securities, r DL > r D
S andr F
L > r DS .
On the funding side of the balance sheet, the bank holds deposits and capital. Similar tothe loan markets, the bank can influence the level of deposits raised in the domestic marketby the interest rate it offers, r D
D . Thus:
DD = c0 + c1r DD (4)
A priori, c1 is expected to be positive, as the higher the deposit rate the bank offers, thegreater the amount of deposits the bank raises.10 As a result of the imperfectly competitivenature of the domestic deposit market, the bank faces an increasing marginal cost of funds,
asdDD
drDD
> 0.
With regard to capital, given the short run nature of the model, it is assumed that the timeperiod is too short for the bank to adjust its equity capital. This assumption is consistent
36 Kevin T. Jacques
with the idea that adjusting equity capital may be costly (Stein, 1998; Myers and Majluf,1984), and theoretical and empirical evidence by Keeton (1989) and Jacques and Nigro(1997) that, subsequent to the implementation of the 1988 risk-based capital standards,capital-constrained banks found it extremely difficult to raise capital and thus adjusted theirportfolios primarily by reallocating or reducing assets. Under the revised Accord, banks mustmeet the risk-based capital requirement that:
KD ≥ γ FL LF + γ D
L LD (5)
where γ FL and γ D
L are the risk-based capital requirements on foreign and domestic loans,respectively, while government securities have a risk weight equal to zero. Under the 1988Basel Accord, γ F
L and γ DL are independent of credit quality with all foreign and domestic
commercial loans being slotted in the 100 percent risk-weight category. But the revisedAccord is more granular with γ F
L and γ DL being inversely related to the credit quality of the
corporate borrower.The domestic bank seeks to maximize profits (π) such that:
π = r FL LF + r D
L LD + r DS S D − r D
D DD (6)
Under the conditions detailed in equations (1) through (6), the Lagrangian is formed as:
£ = r FL LF + r D
L LD + r DS SD− r D
D DD + λ1[LF + LD + SD− DD− KD]
+ λ2[f0 − f1r F
L − LF] + λ3[d0− d1r D
L − LD] + λ4[c0 + c1r D
D − DD]+ λ5
[γ F
L LF + γ DL LD − KD]
(7)
with the necessary first-order conditions used to solve for the optimal allocation of LF, LD,SD, DD, r F
L , r DL , and r D
D .
4. RESULTS FOR CONSTRAINED AND UNCONSTRAINED BANKS
Given the capital-lending link created by the risk-based capital standards, and the incor-poration of credit ratings into the revised standards, one important issue that arises is howinternational commercial lending will respond to capital shocks under the revised Accord. Forthe purposes of this model, an adverse shock is assumed to occur in the developed country,independent of macroeconomic or financial conditions in the developing market, but causingthe capital of the bank in the developed economy to decrease. Under these conditions, incases where the revised risk-based capital standards are not binding (KD > γ F
L LF + γ DL LD),
it can be shown that:
dLD
dKD= 0 (8)
dLF
dKD= 0 (9)
dSD
dKD= 1 (10)
dDD
dKD= 0 (11)
4. The international transmission of capital shocks 37
Given the nonbinding nature of the risk-based capital standard, equations (8) and (9) showthat regulatory capital requirements on foreign and domestic loans do not enter the bankprofit maximization problem, with the bank choosing to sell securities rather than liquidateloans in the event of an adverse capital shock. Specifically, equations (10) and (11) suggestthat the bank responds to the capital shock by undertaking a dollar-for-dollar decrease indomestic government securities, with no change in deposits. The change in deposits equalszero because the bank faces an increasing marginal cost of deposits, while the decrease insecurities reflects the buffer stock theory of securities holdings ( James, 1995), in this caseinsulating the higher yielding, but more illiquid, foreign and domestic loans from the shock.
Alternatively, the bank is constrained by the revised Basel Accord if KD < γ FL LF + γ D
L LD.Recognizing the constraint introduced by the revised standards, it can be shown that thebank’s balance sheet responds to an adverse capital shock by:
dLD
dKD= d1γ
DL
f1γF 2
L + d1γD2
L
> 0 (12)
dLF
dKD= f1γ
FL
f1γF 2
L + d1γD2
L
> 0 (13)
d (LD + LF )dKD
= f1γFL + d1γ
DL
f1γF 2
L + d1γD2
L
> 1 (14)
dSD
dKD= − f1
(1 − γ F
L
)γ F
L − d1(1 − γ D
L
)γ D
L
f1γF 2
L + d1γD2
L
< 0 (15)
dDD
d K D= 0 (16)
The results in the capital-constrained case stand in stark contrast to those for an unconstrainedbank as they suggest significant differences in bank behavior. The results in equations (12)through (16) are particularly important as the Basel Committee’s recent third QuantitativeImpact Study (QIS3) suggests that some banks will experience a significant increase in capitalrequirements when the revised Accord is implemented (Basel Committee, 2003).
For the constrained bank, re-optimization of the balance sheet requires the bank to choosebetween raising deposits, reducing assets, reallocating the asset portfolio, or some combinationof the above. Similar to the unconstrained case, equation (16) shows that there is no changein deposits, as raising deposits will result in an increase in the marginal cost of funding, yetdo nothing to alleviate the constraining nature of the risk-based standards. But in contrastto an unconstrained bank, equation (15) suggests that the bank will respond to the capitalshock by increasing its holdings of government securities. Because government securitiesare considered default free and carry a zero percent risk weight, yet pay an interest rater D
S , substituting securities for higher risk-weighted assets helps the bank meet the minimumrisk-based requirements while also generating interest income.
Critical to an analysis of how the revised Accord influences credit availability is the questionof how the bank’s loan portfolio responds to the capital shock. Equations (12) and (13) showthat the capital shock causes the bank to not only reduce domestic business lending, butalso foreign business loans, with equation (14) showing that the decrease in total lending is
38 Kevin T. Jacques
more than dollar-for-dollar with the decrease in capital. The magnitude of the contractionfor both types of loans depends, in part, on the risk-based capital charges on domestic andforeign business loans. In this scenario, there is clearly a cost to holding a high risk loan asthe revised Accord requires the bank to hold γ F
L dollars of capital for each dollar of foreignloans and γ D
L dollars of capital for each dollar of domestic loans, yet at the margin requiresno capital for government securities. Given the nature of the constraint, the reduction inlending can be explained by the fact that the higher the risk-based capital charge on a loan,the larger the amount of capital freed up by reducing lending.
With regard to the impact of the revised standards on credit availability in the developingeconomy, two points are particularly noteworthy. First, consistent with empirical findingsby Peek and Rosengren (2000, 1997), equation (13) provides a theoretical foundation forhow, under the risk-based capital standards, an adverse shock to a bank’s capital spills over toforeign lending markets. Specifically, to the degree that the bank has a significant presence inthe developing economy’s financial market, the capital shock has a potentially large impact onthe supply of bank loans to businesses, as the reduction in business lending in the developingcountry partially insulates businesses in the developed economy from the full effect of thecapital shock. This is consistent with Schmukler’s (2004) argument that financial liberalizationprovides a mechanism for the propagation of economic shocks from developed to developingeconomies.
Second, consistent with Acharya’s (2001) “partial integration” of a developing economy’sbanking sector, the organizational structure of the foreign and domestic banking systemsplay a critical role in the degree to which economic shocks are transmitted to a developingeconomy’s credit market. This can be seen by noting the presence of d1 and f1 in equation(13). As noted earlier, the more competitive the banking system, the more choices borrowershave in obtaining credit, and the greater the value of f1. Beim and Calomiris (2001) note thetendency for financial institutions in developing economies to be state-owned or directed,thus suggesting a less competitive banking system with foreign corporate borrowers havingfewer available financing alternatives than in developed economies. In this case, financialliberalization of the credit market in the developing economy serves to make the marketmore competitive, this being signified by an increase in f1. To see the effect of liberalizationin this case note that:
d(
dLF
dKD
)d f1
= d1γFL γ D2
L(f1γ
F 2
L + d1γD2
L
)2 > 0 (17)
While equation (13) emphasized the international transmission of capital shocks, equation(17) shows that while increasing competition benefits the developing financial market, it alsohas a cost as, ceteris paribus, increasing the competitiveness of the developing credit marketalso increases the sensitivity of business lending in the developing economy to a capital shockemanating from the developed economy.
5. A COMPARISON WITH THE 1988 STANDARDS
Despite the risk invariant nature of regulatory capital charges on business loans under the 1988standards, the existing research shows that internationally-active banks may transmit capital
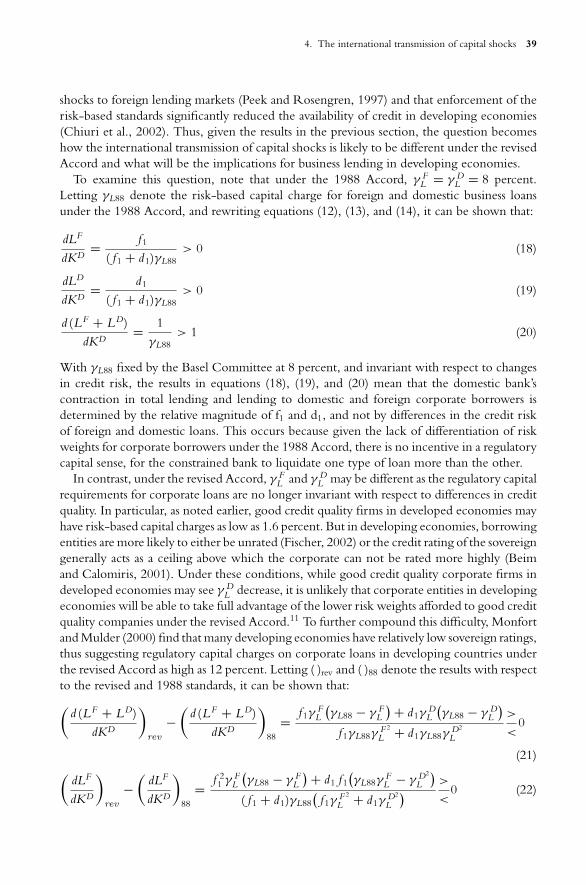
4. The international transmission of capital shocks 39
shocks to foreign lending markets (Peek and Rosengren, 1997) and that enforcement of therisk-based standards significantly reduced the availability of credit in developing economies(Chiuri et al., 2002). Thus, given the results in the previous section, the question becomeshow the international transmission of capital shocks is likely to be different under the revisedAccord and what will be the implications for business lending in developing economies.
To examine this question, note that under the 1988 Accord, γ FL = γ D
L = 8 percent.Letting γL88 denote the risk-based capital charge for foreign and domestic business loansunder the 1988 Accord, and rewriting equations (12), (13), and (14), it can be shown that:
dLF
dKD= f1
( f1 + d1)γL88> 0 (18)
dLD
dKD= d1
( f1 + d1)γL88> 0 (19)
d (LF + LD)dKD
= 1γL88
> 1 (20)
With γL88 fixed by the Basel Committee at 8 percent, and invariant with respect to changesin credit risk, the results in equations (18), (19), and (20) mean that the domestic bank’scontraction in total lending and lending to domestic and foreign corporate borrowers isdetermined by the relative magnitude of f1 and d1, and not by differences in the credit riskof foreign and domestic loans. This occurs because given the lack of differentiation of riskweights for corporate borrowers under the 1988 Accord, there is no incentive in a regulatorycapital sense, for the constrained bank to liquidate one type of loan more than the other.
In contrast, under the revised Accord, γ FL and γ D
L may be different as the regulatory capitalrequirements for corporate loans are no longer invariant with respect to differences in creditquality. In particular, as noted earlier, good credit quality firms in developed economies mayhave risk-based capital charges as low as 1.6 percent. But in developing economies, borrowingentities are more likely to either be unrated (Fischer, 2002) or the credit rating of the sovereigngenerally acts as a ceiling above which the corporate can not be rated more highly (Beimand Calomiris, 2001). Under these conditions, while good credit quality corporate firms indeveloped economies may see γ D
L decrease, it is unlikely that corporate entities in developingeconomies will be able to take full advantage of the lower risk weights afforded to good creditquality companies under the revised Accord.11 To further compound this difficulty, Monfortand Mulder (2000) find that many developing economies have relatively low sovereign ratings,thus suggesting regulatory capital charges on corporate loans in developing countries underthe revised Accord as high as 12 percent. Letting ( )rev and ( )88 denote the results with respectto the revised and 1988 standards, it can be shown that:(
d (LF + LD)dKD
)rev
−(
d (LF + LD)dKD
)88
= f1γFL
(γL88 − γ F
L
) + d1γDL
(γL88 − γ D
L
)f1γL88γ
F 2
L + d1γL88γD2
L
>
<0
(21)(dLF
dKD
)rev
−(
dLF
dKD
)88
= f 21 γ F
L
(γL88 − γ F
L
) + d1 f1(γL88γ
FL − γ D2
L
)( f1 + d1)γL88
(f1γ
F 2
L + d1γD2
L
) >
<0 (22)
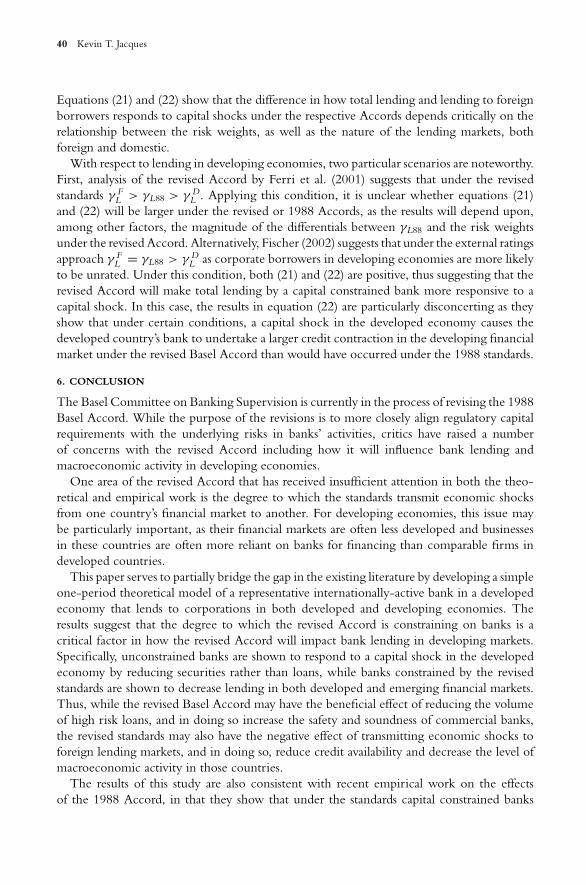
40 Kevin T. Jacques
Equations (21) and (22) show that the difference in how total lending and lending to foreignborrowers responds to capital shocks under the respective Accords depends critically on therelationship between the risk weights, as well as the nature of the lending markets, bothforeign and domestic.
With respect to lending in developing economies, two particular scenarios are noteworthy.First, analysis of the revised Accord by Ferri et al. (2001) suggests that under the revisedstandards γ F
L > γL88 > γ DL . Applying this condition, it is unclear whether equations (21)
and (22) will be larger under the revised or 1988 Accords, as the results will depend upon,among other factors, the magnitude of the differentials between γL88 and the risk weightsunder the revised Accord. Alternatively, Fischer (2002) suggests that under the external ratingsapproach γ F
L = γL88 > γ DL as corporate borrowers in developing economies are more likely
to be unrated. Under this condition, both (21) and (22) are positive, thus suggesting that therevised Accord will make total lending by a capital constrained bank more responsive to acapital shock. In this case, the results in equation (22) are particularly disconcerting as theyshow that under certain conditions, a capital shock in the developed economy causes thedeveloped country’s bank to undertake a larger credit contraction in the developing financialmarket under the revised Basel Accord than would have occurred under the 1988 standards.
6. CONCLUSION
The Basel Committee on Banking Supervision is currently in the process of revising the 1988Basel Accord. While the purpose of the revisions is to more closely align regulatory capitalrequirements with the underlying risks in banks’ activities, critics have raised a numberof concerns with the revised Accord including how it will influence bank lending andmacroeconomic activity in developing economies.
One area of the revised Accord that has received insufficient attention in both the theo-retical and empirical work is the degree to which the standards transmit economic shocksfrom one country’s financial market to another. For developing economies, this issue maybe particularly important, as their financial markets are often less developed and businessesin these countries are often more reliant on banks for financing than comparable firms indeveloped countries.
This paper serves to partially bridge the gap in the existing literature by developing a simpleone-period theoretical model of a representative internationally-active bank in a developedeconomy that lends to corporations in both developed and developing economies. Theresults suggest that the degree to which the revised Accord is constraining on banks is acritical factor in how the revised Accord will impact bank lending in developing markets.Specifically, unconstrained banks are shown to respond to a capital shock in the developedeconomy by reducing securities rather than loans, while banks constrained by the revisedstandards are shown to decrease lending in both developed and emerging financial markets.Thus, while the revised Basel Accord may have the beneficial effect of reducing the volumeof high risk loans, and in doing so increase the safety and soundness of commercial banks,the revised standards may also have the negative effect of transmitting economic shocks toforeign lending markets, and in doing so, reduce credit availability and decrease the level ofmacroeconomic activity in those countries.
The results of this study are also consistent with recent empirical work on the effectsof the 1988 Accord, in that they show that under the standards capital constrained banks
4. The international transmission of capital shocks 41
may transmit the effects of domestic capital shocks to foreign lending, thereby reducing theavailability of credit to corporate borrowers in those countries. But while shocks may bepropagated to developing financial markets under both versions of the Accord, the findingsof this study also show that under certain conditions regarding the difference in risk weightsand the structure of loan markets, foreign business lending will contract more under therevised Accord than under the 1988 standards, thus increasing financial instability. This issueshould be of considerable concern to international policymakers and regulators, as empiricalresearch on the 1988 Accord has already shown that it had a significant effect on creditavailability in emerging markets.
Finally, a word of caution is in order. Because the revised Accord is not due for imple-mentation until 2007 at the earliest, it is not clear in practice how internationally-activebanks will revise their asset allocation. But the results of the Basel Committee’s most recentquantitative impact study suggest that some internationally-active banks will see a significantincrease in their required regulatory capital levels. However, such studies are exercises incomparative statics, ignoring, as noted by Saidenburg and Schuermann (2004), the Lucas-style critique that the implementation of the revised Accord, in and of itself, will influ-ence bank portfolio composition and capital levels. Rather, if banks increase their bufferstocks of capital without a corresponding increase in risk in response to implementationof the revised Accord, then they are less likely to become constrained as a result of capi-tal shocks, thereby mitigating some of the potentially negative effects noted earlier. Underthese conditions, the revised Accord may have less impact on the international transmis-sion of shocks and the availability of credit in developing economies than did the 1988standards.
ENDNOTES
1. The views expressed are those of the author and do not necessarily reflect those of the U.S. Department of theTreasury. My thanks to editor Benton Gup for the idea underlying this paper, and Dan Nolle, Dave Schirmand Walter Simmons for their helpful comments. A special thanks to Matthew Watt for his expert editorialassistance.
2. For a discussion of regulatory capital arbitrage, see Jones (2000) and Jackson et al. (1999).3. See Bank for International Settlements (2004) for details.4. For off-balance sheet activities, the dollar value of the activity is converted to an on-balance sheet equivalent by
the use of credit conversion factors. The on-balance sheet equivalent is then multiplied by the correspondingrisk weight in the calculation of total risk-weighted assets.
5. Under the risk-based capital standards, capital has two definitions. Tier 1 capital is comprised mainly of commonstock and noncumulative perpetual preferred stock, while Tier 2 capital includes cumulative perpetual preferredstock, term subordinated debt, and the allowance for loan and lease losses.
6. External credit ratings are part of the standardized approach. Internal ratings are used in the foundation internalratings based approach and the advanced internal ratings based approach. This study focuses on the standardizedapproach. The revised Accord also applies capital charges based for operational and market risk. This study isonly concerned with the effects of the revised standards as it relates to credit risk. For more information on thevarious approaches see Basel Committee (2004).
7. For simplicity it is assumed that the domestic bank makes loans in the developing economy without establishinga branch, agency or subsidiary in the foreign country, or buying a foreign bank. Saunders and Cornett (2000)note a number of different forms of bank entry into foreign countries.
8. Because of this assumption, no allowance is made for incorporating foreign exchange rate risk into the model.9. Peek and Rosengren (1995) note that under perfect competition, the sensitivity of loan demand with respect
to changes in interest rates will be infinite. While the loan demand equations in this model and their modelare generally similar, the same conclusion would hold with respect to d1 and f1 in this model.
10. It is also the case that the more competitive the market for deposits, the greater is c1, with it being infiniteunder perfect competition as noted by Peek and Rosengren (1995).
42 Kevin T. Jacques
11. Fischer (2002) is careful to note that this may not occur for banks using the internal ratings based approach.This then raises competitive equity issues between banks on the standardized approach and those using theadvanced internal ratings based approach regarding the amount of capital that must be held against businessloans.
REFERENCES
Acharya, V.V., Competition Among Banks, Capital Requirements and International Spillovers, Economic Notes, Vol.30, No.3, November 2001, 337–358.
Altman, E. and A. Saunders, An Analysis and Critique of the BIS Proposal on Capital Adequacy and Ratings,Journal of Banking and Finance, Vol. 25, No. 1, January 2001, 1721–1742.
Barth, J.R., G. Caprio, and D.E. Nolle, Comparative International Characteristics of Banking, Economic and PolicyAnalysis Working Paper, Office of the Comptroller of the Currency, No. 2004-1, January 2004.
Bank for International Settlements, Consolidated Banking Statistics for the Fourth Quarter of 2003, April 2004.Basel Committee on Banking Supervision, International Convergence of Capital Measurement and Capital Stan-
dards: A Revised Framework, June 2004.Basel Committee on Banking Supervision, Quantitative Impact Study-3, Overview of Global Results, May 5, 2003.Beim, D.O. and C.W. Calomiris, Emerging Financial Markets, McGraw-Hill Irwin Publishing Co., 2001.Berger, A.N. and G.F. Udell, Did Risk-Based Capital Allocate Bank Credit and Cause a ‘Credit Crunch’ in the
United States? Journal of Money, Credit, and Banking, Vol. 26, No. 3, August 1994, 585–628.Blum, J. and M. Hellwig, The Macroeconomic Implications of Capital Adequacy Requirements for Banks, European
Economic Review, Vol. 39, No. 2, April 1995, 739–49.Borio, C., C. Furfine, and P. Lowe, Procyclicality of the Financial System and Financial Stability: Issues and Policy
Options, Bank for International Settlements conference Marrying the Macro- and Microprudential Dimensions of FinancialStability, BIS Papers No. 1, October 2000, 1–57.
Brinkmann, E.J., and P.M. Horvitz, Risk-Based Capital Standards and the Credit Crunch, Journal of Money, Creditand Banking, Vol. 27, No. 3, August 1995, 848–863.
Chami, R., M.S. Khan, and S. Sharma, Emerging Issues in Banking Regulation, IMF Working Paper WP/03/101,May 2003.
Chiuri, M.C., G. Ferri, and G. Majnoni, The Macroeconomic Impact of Bank Capital Requirements in EmergingEconomies: Past Evidence to Assess the Future, Journal of Banking and Finance, Vol. 26, No. 5, May 2002,881–904.
Chiuri, M.C., G. Ferri, and G. Majnoni, Enforcing the 1988 Basel Capital Requirements: Did it Curtail BankCredit in Emerging Economies? Economic Notes, Vol. 30, No. 3, November 2001, 399–419.
Crockett, A., Why is Financial Stability a Goal of Public Policy? Maintaining Financial Stability in a Global Economy,a symposium sponsored by the Federal Reserve Bank of Kansas City, August 1997, 7–36.
Ferguson, R., Remarks at the Risk Management Association’s Conference on Capital Management, Washington,D.C., April 9, 2003.
Ferri, G., L. Liu, and G. Majnoni, The Role of Rating Agency Assessments in Less Developed Countries: Impactof the Proposed Basel Guidelines, Journal of Banking and Finance, Vol. 25, No. 1, January 2001, 115–148.
Fischer, S., Implications of Basel II for Emerging Market Countries, William Taylor Memorial Lecture No. 7,Group of Thirty, September 2002, 7–20.
Furfine, C., Bank Portfolio Allocation: The Impact of Capital Requirements, Regulatory Monitoring, and Eco-nomic Conditions, Journal of Financial Services Research, Vol. 20, No. 1, September 2001, 33–56.
Gup, B., Insights From a Global Survey on Bank Capital, in Capital Markets, Globalization, and Economic Development,B. Gup ed., Kluwer Publishing Co., forthcoming 2005.
Hall, B., How Has the Basle Accord Affected Bank Portfolios? Journal of the Japanese and International Economies,Vol. 7, No. 4, December 1993, 8–40.
Haubrich, J.G. and P. Wachtel, Capital Requirements and Shifts in Commercial Bank Portfolios, Economic Review,Federal Reserve Bank of Cleveland, Vol. 29, No. 3, 1993, 2–15.
Jackson, P., C. Furfine, H. Groeneveld, D. Hancock, D. Jones, W. Perraudin, L. Radecki, and M. Yoneyama, CapitalRequirements and Bank Behaviour: The Impact of the Basle Accord, Basle Committee on Banking SupervisionWorking Papers, No. 1, April 1999.
Jacques, K.T., Procyclicality, Bank Lending, and the Macroeconomic Implications of a Revised Basel Accord. U.S.Department of the Treasury working paper, August 2004.
Jacques, K.T. and P. Nigro, Risk-Based Capital, Portfolio Risk, and Bank Capital: A Simultaneous EquationsApproach, Journal of Economics and Business, Vol. 49, No. 6, November/December 1997, 533–547.
Jacques, K.T. and D. Schirm, The Effectiveness of Monetary Policy Under a Revised Basel Accord, The New BaselCapital Accord, Benton Gup editor, Thomson South-Western Publishing Co., 2004, 217–238.
4. The international transmission of capital shocks 43
James, C., Discussion, Federal Reserve Bank of Boston Conference Series, Is Bank Lending Important for the Transmissionof Monetary Policy? Conference Series No. 39, June 1995, 76–79.
Jones, D., Emerging Problems with the Basel Capital Accord: Regulatory Capital Arbitrage and Related Issues,Journal of Banking and Finance, Vol. 24, No. 1–2, January 2000, 35–58.
Keeton, W.R., The New Risk-Based Capital Plan for Commercial Banks, Economic Review, Federal Reserve Bankof Kansas City, December 1989, 40–60.
Lindgren, C.J., G. Garcia, and M.I. Saal, Bank Soundness and Macroeconomic Policy, International Monetary Fund,1996.
Lowe, P., Credit Risk Measurement and Procyclicality, Bank for International Settlements Working Paper, No. 116,September 2002.
Monfort, B. and C. Mulder, Using Credit Ratings for Capital Requirements on Lending to Emerging MarketEconomies: Possible Impact of a New Basel Accord, IMF Working Paper WP/00/69, March 2000.
Myers, S. and N. Maljuf, Corporate Financing and Investment Decisions When Firms Have Information ThatInvestors do not Have, Journal of Financial Economics Vol. 13, No. 2, June 1984, 187–221.
Peek, J. and E. Rosengren, Collateral Damage: Effects of the Japanese Banking Crisis on Real Activity in the UnitedStates, American Economic Review, Vol. 90, No. 1, March 2000, 30–45.
Peek, J. and E. Rosengren, The International Transmission of Financial Shocks: The Case of Japan, AmericanEconomic Review, Vol. 87, No. 4, September 1997, 495–505.
Peek, J. and E. Rosengren, Bank Lending and the Transmission of Monetary Policy, Federal Reserve Bank of BostonConference Series, Is Bank Lending Important for the Transmission of Monetary Policy? Conference Series No. 39, June1995, 47–68.
Saidenburg, M. and T. Schuermann, The New Basel Capital Accord and Questions for Research, The New BaselCapital Accord, Benton Gup editor, Thomson South-Western Publishing Co., 2004, 97–124.
Saunders, A., Financial Institutions Management: A Modern Perspective, Irwin McGraw-Hill Publishing Co., 3rd edition,2000.
Schmukler, S.S., Financial Globalization: Gain and Pain for Developing Countries, Federal Reserve Bank of AtlantaEconomic Review, second quarter 2004, 39–66.
Segoviano, M.A. and P. Lowe, Internal Ratings, the Business Cycle and Capital Requirements: Some EvidenceFrom an Emerging Market Economy, Bank for International Settlements Working Paper, No. 117, September 2002.
Stein, J.C., An Adverse-Selection Model of Bank Asset and Liability Management with Implications for the Trans-mission of Monetary Policy, RAND Journal of Economics, Vol. 29, No. 3, Autumn 1998, 466–486.
Tanaka, M., The Macroeconomic Implications of the New Basel Accord, CESifo Economic Studies, Vol. 49, No. 2,Summer 2003, 217–232.
5. DESIGNING BANKING SECTOR SAFETY NETS:THE AUSTRALIAN EXPERIENCE
KEVIN DAVIS1
1. INTRODUCTION
At the start of 2004 Australia and New Zealand were the only two countries in the OECDwhich did not have some explicit form of deposit insurance. Given the trend world widetowards inclusion of deposit insurance as an integral component of the “safety net” associatedwith banking regulation it is of interest to examine why the Antipodean approach has, todate, been different. Indeed, a wide ranging official review of Australian financial sectorregulation conducted in 1997 (Wallis, 1997), explicitly recommended against introductionof deposit insurance.
More recently, however, the topic has reemerged as a matter for public policy debate,driven, perhaps unusually, not by developments in the banking sector, but by Australianexperience in the insurance industry. In March 2001, one of Australia’s largest insurancecompanies, HIH, failed with a shortfall of assets relative to policy and other liabilities estimatedto be in the order of AUD 4 billion (USD 2 billion at the exchange rate of the time). Althoughthere was no policy holder protection scheme in existence, the Australian government (aftera delay of several months) introduced a taxpayer funded compensation scheme for retailcustomers of the failed institution. The resulting cost to taxpayers is in the order of AUD800 million. In addition, two State governments assumed liability for payments to certainbeneficiaries under compulsory third party insurance policies (workers compensation, autoinsurance etc) written by HIH2, substantially increasing the cost borne by government.
This experience prompted a government initiated review of the case for deposit insurance,and several possible reasons can be identified. First, the HIH Royal Commission report (HIHRoyal Commission, 2003) recommended the introduction of a policy holder guarantee
46 Kevin Davis
scheme, thereby putting the issue of financial sector safety net arrangements firmly in thepublic policy debate. Second, as a result of the Wallis Report’s recommendations, Australiahas an integrated prudential supervisor, The Australian Prudential Regulation Authority(APRA), responsible for supervising deposit taking institutions, life and general insurance, andsuperannuation (pension) funds. To consider introducing a guarantee scheme as part of thesafety net relevant to some financial products provided by institutions supervised by APRAwithout at least considering the merits of similar schemes for products (such as deposits)provided by other institutions would seem shortsighted. This appears to be particularly sowhen the widespread international use of deposit insurance schemes is compared with therelatively limited use of policy holder protections schemes.
In addition to these specifically Australian features, the continued international growth ofdeposit insurance schemes since the Wallis Report, and the “best practice” pronouncementsof international agencies such as the IMF and World Bank in favor of (well designed) depositinsurance, perhaps suggested a need to review whether the negative view of the merits ofdeposit insurance of the Wallis Report was still warranted.
Following what has become common Australian practice towards the process of financialreform, the Australian Government initiated a Study of Financial System Guarantees inSeptember 2003 to provide opportunity for public consultation and debate on the topic,before any policy changes would be considered. A focus of the Study was which, if any,financial products (including insurance and deposits) had characteristics which would warrantthe introduction of guarantee schemes providing limited coverage to retail customers. Thischapter draws on that study (Davis, 2004) to review the issues involved in a consideration ofwhether deposit insurance is warranted as a component of a financial system safety net forAustralia.3
The case, it is argued, is finely balanced, with the relative weights to be attributed to variousarguments important and, in the absence of strong empirical evidence, open to debate. Itis suggested here that, on balance, a case exists for introduction of some form of depositinsurance scheme (with characteristics to be outlined subsequently), but it should be notedthat this conclusion is at variance to the views generally expressed by executives of deposittaking institutions and their industry associations as part of the public consultation process.It is unlikely that a policy decision on the issue will be made until some time in 2005.
The remainder of this chapter is structured as follows. Section 2 provides an overview ofthe Australian deposit taking sector and the approach to regulation, depositor protection,and failure resolution which has been followed to date. Section 3 draws on that experienceto review the merits of the arguments for and against introducing deposit insurance intothe Australian financial system. Section 4 considers some features of the type of schemewhich might be appropriate given the institutional characteristics of the deposit taking sector.Section 5 provides concluding remarks.
2. INDUSTRY STRUCTURE, REGULATION AND DEPOSITOR PROTECTION
The deposit taking sector in Australia consists of three segments: banks, building societiesand credit unions. All are subject to common licensing and regulation by APRA under thecategory of approved deposit-taking institutions (ADIs), with banks differentiated withinthat category primarily by a minimum capital size requirement. In practice, size, financialsophistication, range of activities, balance sheet structure, and organizational form (joint
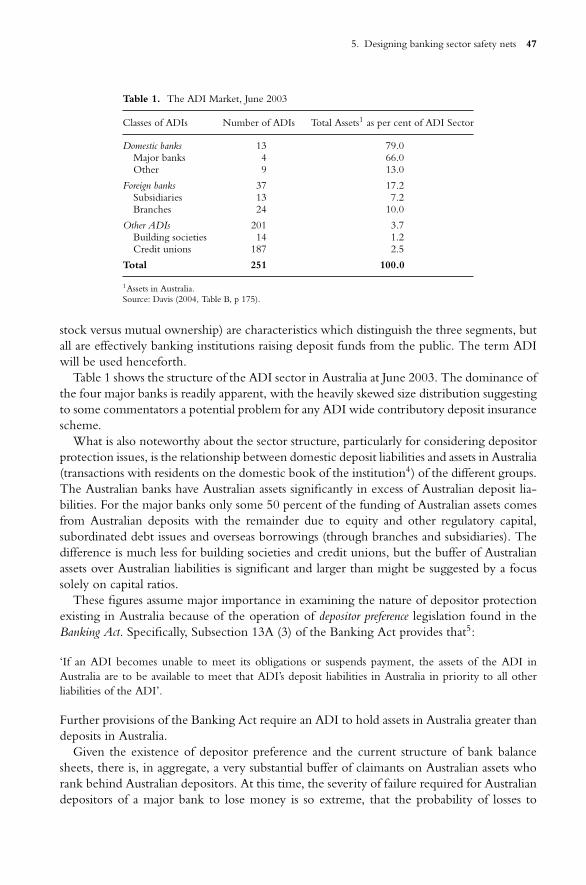
5. Designing banking sector safety nets 47
Table 1. The ADI Market, June 2003
Classes of ADIs Number of ADIs Total Assets1 as per cent of ADI Sector
Domestic banks 13 79.0Major banks 4 66.0Other 9 13.0
Foreign banks 37 17.2Subsidiaries 13 7.2Branches 24 10.0
Other ADIs 201 3.7Building societies 14 1.2Credit unions 187 2.5
Total 251 100.0
1Assets in Australia.Source: Davis (2004, Table B, p 175).
stock versus mutual ownership) are characteristics which distinguish the three segments, butall are effectively banking institutions raising deposit funds from the public. The term ADIwill be used henceforth.
Table 1 shows the structure of the ADI sector in Australia at June 2003. The dominance ofthe four major banks is readily apparent, with the heavily skewed size distribution suggestingto some commentators a potential problem for any ADI wide contributory deposit insurancescheme.
What is also noteworthy about the sector structure, particularly for considering depositorprotection issues, is the relationship between domestic deposit liabilities and assets in Australia(transactions with residents on the domestic book of the institution4) of the different groups.The Australian banks have Australian assets significantly in excess of Australian deposit lia-bilities. For the major banks only some 50 percent of the funding of Australian assets comesfrom Australian deposits with the remainder due to equity and other regulatory capital,subordinated debt issues and overseas borrowings (through branches and subsidiaries). Thedifference is much less for building societies and credit unions, but the buffer of Australianassets over Australian liabilities is significant and larger than might be suggested by a focussolely on capital ratios.
These figures assume major importance in examining the nature of depositor protectionexisting in Australia because of the operation of depositor preference legislation found in theBanking Act. Specifically, Subsection 13A (3) of the Banking Act provides that5:
‘If an ADI becomes unable to meet its obligations or suspends payment, the assets of the ADI inAustralia are to be available to meet that ADI’s deposit liabilities in Australia in priority to all otherliabilities of the ADI’.
Further provisions of the Banking Act require an ADI to hold assets in Australia greater thandeposits in Australia.
Given the existence of depositor preference and the current structure of bank balancesheets, there is, in aggregate, a very substantial buffer of claimants on Australian assets whorank behind Australian depositors. At this time, the severity of failure required for Australiandepositors of a major bank to lose money is so extreme, that the probability of losses to
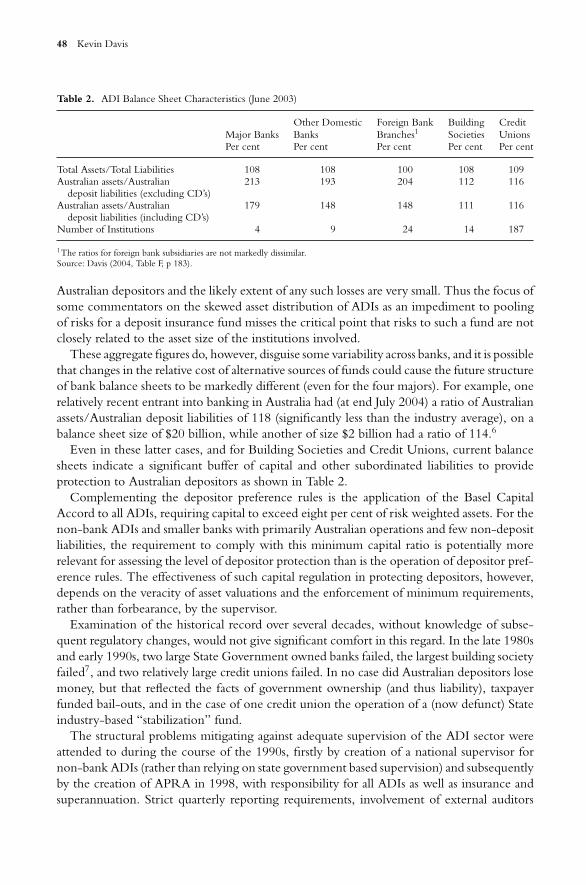
48 Kevin Davis
Table 2. ADI Balance Sheet Characteristics (June 2003)
Other Domestic Foreign Bank Building CreditMajor Banks Banks Branches1 Societies UnionsPer cent Per cent Per cent Per cent Per cent
Total Assets/Total Liabilities 108 108 100 108 109Australian assets/Australian 213 193 204 112 116
deposit liabilities (excluding CD’s)Australian assets/Australian 179 148 148 111 116
deposit liabilities (including CD’s)Number of Institutions 4 9 24 14 187
1The ratios for foreign bank subsidiaries are not markedly dissimilar.Source: Davis (2004, Table F, p 183).
Australian depositors and the likely extent of any such losses are very small. Thus the focus ofsome commentators on the skewed asset distribution of ADIs as an impediment to poolingof risks for a deposit insurance fund misses the critical point that risks to such a fund are notclosely related to the asset size of the institutions involved.
These aggregate figures do, however, disguise some variability across banks, and it is possiblethat changes in the relative cost of alternative sources of funds could cause the future structureof bank balance sheets to be markedly different (even for the four majors). For example, onerelatively recent entrant into banking in Australia had (at end July 2004) a ratio of Australianassets/Australian deposit liabilities of 118 (significantly less than the industry average), on abalance sheet size of $20 billion, while another of size $2 billion had a ratio of 114.6
Even in these latter cases, and for Building Societies and Credit Unions, current balancesheets indicate a significant buffer of capital and other subordinated liabilities to provideprotection to Australian depositors as shown in Table 2.
Complementing the depositor preference rules is the application of the Basel CapitalAccord to all ADIs, requiring capital to exceed eight per cent of risk weighted assets. For thenon-bank ADIs and smaller banks with primarily Australian operations and few non-depositliabilities, the requirement to comply with this minimum capital ratio is potentially morerelevant for assessing the level of depositor protection than is the operation of depositor pref-erence rules. The effectiveness of such capital regulation in protecting depositors, however,depends on the veracity of asset valuations and the enforcement of minimum requirements,rather than forbearance, by the supervisor.
Examination of the historical record over several decades, without knowledge of subse-quent regulatory changes, would not give significant comfort in this regard. In the late 1980sand early 1990s, two large State Government owned banks failed, the largest building societyfailed7, and two relatively large credit unions failed. In no case did Australian depositors losemoney, but that reflected the facts of government ownership (and thus liability), taxpayerfunded bail-outs, and in the case of one credit union the operation of a (now defunct) Stateindustry-based “stabilization” fund.
The structural problems mitigating against adequate supervision of the ADI sector wereattended to during the course of the 1990s, firstly by creation of a national supervisor fornon-bank ADIs (rather than relying on state government based supervision) and subsequentlyby the creation of APRA in 1998, with responsibility for all ADIs as well as insurance andsuperannuation. Strict quarterly reporting requirements, involvement of external auditors
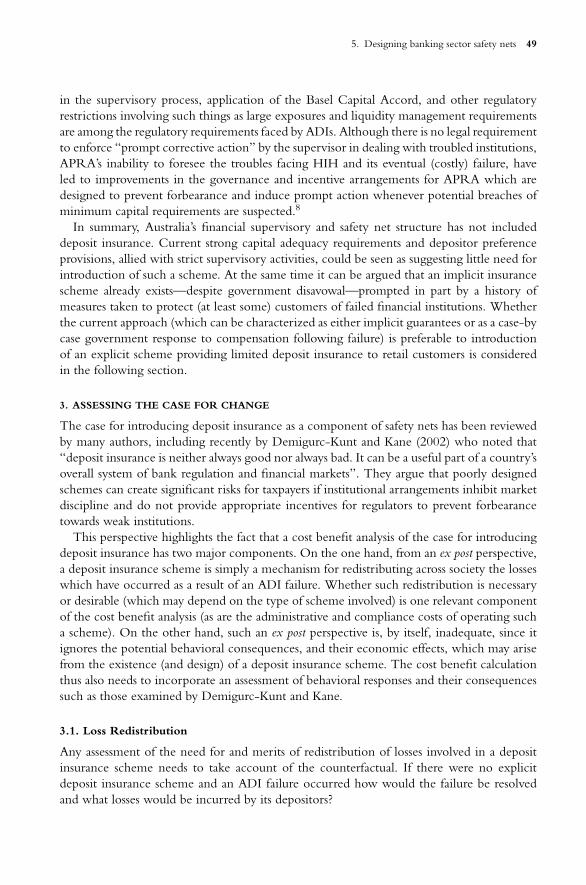
5. Designing banking sector safety nets 49
in the supervisory process, application of the Basel Capital Accord, and other regulatoryrestrictions involving such things as large exposures and liquidity management requirementsare among the regulatory requirements faced by ADIs. Although there is no legal requirementto enforce “prompt corrective action” by the supervisor in dealing with troubled institutions,APRA’s inability to foresee the troubles facing HIH and its eventual (costly) failure, haveled to improvements in the governance and incentive arrangements for APRA which aredesigned to prevent forbearance and induce prompt action whenever potential breaches ofminimum capital requirements are suspected.8
In summary, Australia’s financial supervisory and safety net structure has not includeddeposit insurance. Current strong capital adequacy requirements and depositor preferenceprovisions, allied with strict supervisory activities, could be seen as suggesting little need forintroduction of such a scheme. At the same time it can be argued that an implicit insurancescheme already exists—despite government disavowal—prompted in part by a history ofmeasures taken to protect (at least some) customers of failed financial institutions. Whetherthe current approach (which can be characterized as either implicit guarantees or as a case-bycase government response to compensation following failure) is preferable to introductionof an explicit scheme providing limited deposit insurance to retail customers is consideredin the following section.
3. ASSESSING THE CASE FOR CHANGE
The case for introducing deposit insurance as a component of safety nets has been reviewedby many authors, including recently by Demigurc-Kunt and Kane (2002) who noted that“deposit insurance is neither always good nor always bad. It can be a useful part of a country’soverall system of bank regulation and financial markets”. They argue that poorly designedschemes can create significant risks for taxpayers if institutional arrangements inhibit marketdiscipline and do not provide appropriate incentives for regulators to prevent forbearancetowards weak institutions.
This perspective highlights the fact that a cost benefit analysis of the case for introducingdeposit insurance has two major components. On the one hand, from an ex post perspective,a deposit insurance scheme is simply a mechanism for redistributing across society the losseswhich have occurred as a result of an ADI failure. Whether such redistribution is necessaryor desirable (which may depend on the type of scheme involved) is one relevant componentof the cost benefit analysis (as are the administrative and compliance costs of operating sucha scheme). On the other hand, such an ex post perspective is, by itself, inadequate, since itignores the potential behavioral consequences, and their economic effects, which may arisefrom the existence (and design) of a deposit insurance scheme. The cost benefit calculationthus also needs to incorporate an assessment of behavioral responses and their consequencessuch as those examined by Demigurc-Kunt and Kane.
3.1. Loss Redistribution
Any assessment of the need for and merits of redistribution of losses involved in a depositinsurance scheme needs to take account of the counterfactual. If there were no explicitdeposit insurance scheme and an ADI failure occurred how would the failure be resolvedand what losses would be incurred by its depositors?
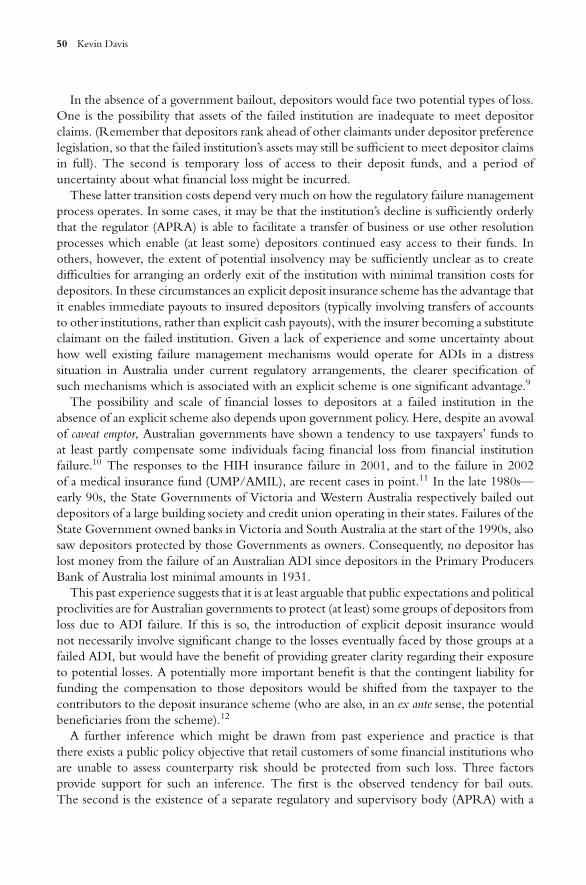
50 Kevin Davis
In the absence of a government bailout, depositors would face two potential types of loss.One is the possibility that assets of the failed institution are inadequate to meet depositorclaims. (Remember that depositors rank ahead of other claimants under depositor preferencelegislation, so that the failed institution’s assets may still be sufficient to meet depositor claimsin full). The second is temporary loss of access to their deposit funds, and a period ofuncertainty about what financial loss might be incurred.
These latter transition costs depend very much on how the regulatory failure managementprocess operates. In some cases, it may be that the institution’s decline is sufficiently orderlythat the regulator (APRA) is able to facilitate a transfer of business or use other resolutionprocesses which enable (at least some) depositors continued easy access to their funds. Inothers, however, the extent of potential insolvency may be sufficiently unclear as to createdifficulties for arranging an orderly exit of the institution with minimal transition costs fordepositors. In these circumstances an explicit deposit insurance scheme has the advantage thatit enables immediate payouts to insured depositors (typically involving transfers of accountsto other institutions, rather than explicit cash payouts), with the insurer becoming a substituteclaimant on the failed institution. Given a lack of experience and some uncertainty abouthow well existing failure management mechanisms would operate for ADIs in a distresssituation in Australia under current regulatory arrangements, the clearer specification ofsuch mechanisms which is associated with an explicit scheme is one significant advantage.9
The possibility and scale of financial losses to depositors at a failed institution in theabsence of an explicit scheme also depends upon government policy. Here, despite an avowalof caveat emptor, Australian governments have shown a tendency to use taxpayers’ funds toat least partly compensate some individuals facing financial loss from financial institutionfailure.10 The responses to the HIH insurance failure in 2001, and to the failure in 2002of a medical insurance fund (UMP/AMIL), are recent cases in point.11 In the late 1980s—early 90s, the State Governments of Victoria and Western Australia respectively bailed outdepositors of a large building society and credit union operating in their states. Failures of theState Government owned banks in Victoria and South Australia at the start of the 1990s, alsosaw depositors protected by those Governments as owners. Consequently, no depositor haslost money from the failure of an Australian ADI since depositors in the Primary ProducersBank of Australia lost minimal amounts in 1931.
This past experience suggests that it is at least arguable that public expectations and politicalproclivities are for Australian governments to protect (at least) some groups of depositors fromloss due to ADI failure. If this is so, the introduction of explicit deposit insurance wouldnot necessarily involve significant change to the losses eventually faced by those groups at afailed ADI, but would have the benefit of providing greater clarity regarding their exposureto potential losses. A potentially more important benefit is that the contingent liability forfunding the compensation to those depositors would be shifted from the taxpayer to thecontributors to the deposit insurance scheme (who are also, in an ex ante sense, the potentialbeneficiaries from the scheme).12
A further inference which might be drawn from past experience and practice is thatthere exists a public policy objective that retail customers of some financial institutions whoare unable to assess counterparty risk should be protected from such loss. Three factorsprovide support for such an inference. The first is the observed tendency for bail outs.The second is the existence of a separate regulatory and supervisory body (APRA) with a
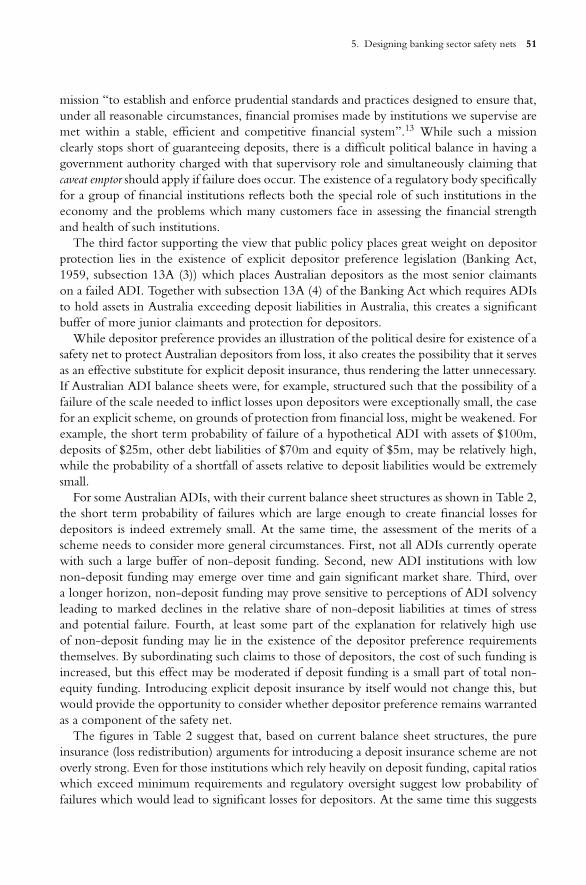
5. Designing banking sector safety nets 51
mission “to establish and enforce prudential standards and practices designed to ensure that,under all reasonable circumstances, financial promises made by institutions we supervise aremet within a stable, efficient and competitive financial system”.13 While such a missionclearly stops short of guaranteeing deposits, there is a difficult political balance in having agovernment authority charged with that supervisory role and simultaneously claiming thatcaveat emptor should apply if failure does occur. The existence of a regulatory body specificallyfor a group of financial institutions reflects both the special role of such institutions in theeconomy and the problems which many customers face in assessing the financial strengthand health of such institutions.
The third factor supporting the view that public policy places great weight on depositorprotection lies in the existence of explicit depositor preference legislation (Banking Act,1959, subsection 13A (3)) which places Australian depositors as the most senior claimantson a failed ADI. Together with subsection 13A (4) of the Banking Act which requires ADIsto hold assets in Australia exceeding deposit liabilities in Australia, this creates a significantbuffer of more junior claimants and protection for depositors.
While depositor preference provides an illustration of the political desire for existence of asafety net to protect Australian depositors from loss, it also creates the possibility that it servesas an effective substitute for explicit deposit insurance, thus rendering the latter unnecessary.If Australian ADI balance sheets were, for example, structured such that the possibility of afailure of the scale needed to inflict losses upon depositors were exceptionally small, the casefor an explicit scheme, on grounds of protection from financial loss, might be weakened. Forexample, the short term probability of failure of a hypothetical ADI with assets of $100m,deposits of $25m, other debt liabilities of $70m and equity of $5m, may be relatively high,while the probability of a shortfall of assets relative to deposit liabilities would be extremelysmall.
For some Australian ADIs, with their current balance sheet structures as shown in Table 2,the short term probability of failures which are large enough to create financial losses fordepositors is indeed extremely small. At the same time, the assessment of the merits of ascheme needs to consider more general circumstances. First, not all ADIs currently operatewith such a large buffer of non-deposit funding. Second, new ADI institutions with lownon-deposit funding may emerge over time and gain significant market share. Third, overa longer horizon, non-deposit funding may prove sensitive to perceptions of ADI solvencyleading to marked declines in the relative share of non-deposit liabilities at times of stressand potential failure. Fourth, at least some part of the explanation for relatively high useof non-deposit funding may lie in the existence of the depositor preference requirementsthemselves. By subordinating such claims to those of depositors, the cost of such funding isincreased, but this effect may be moderated if deposit funding is a small part of total non-equity funding. Introducing explicit deposit insurance by itself would not change this, butwould provide the opportunity to consider whether depositor preference remains warrantedas a component of the safety net.
The figures in Table 2 suggest that, based on current balance sheet structures, the pureinsurance (loss redistribution) arguments for introducing a deposit insurance scheme are notoverly strong. Even for those institutions which rely heavily on deposit funding, capital ratioswhich exceed minimum requirements and regulatory oversight suggest low probability offailures which would lead to significant losses for depositors. At the same time this suggests
52 Kevin Davis
that the pure insurance costs of a scheme, and resulting premium rates for participants, wouldbe relatively low. If both potential benefits and costs associated with the loss redistributionfunction are small, greater importance may attach to the assessment of other benefits andcosts associated with introduction of a scheme.
Among the other costs are the administrative and compliance costs associated with anyscheme. These costs include the resource costs associated with supervision and investigationby the deposit insurer. In Australia, such activities are undertaken by APRA and fundingfor those activities raised by levies on ADIs. Hence the incremental costs of supervision andinvestigation are potentially minimal (if not zero). Other administrative costs depend uponthe type of scheme adopted, and there is scope for scheme design which would keep suchcosts very low. Finally, compliance and reporting costs would appear to be little changedfrom those currently incurred as a result of the supervisory process.
3.2. Behavioral Consequences and their Economic Effects
Two main types of potential behavioral effects can be identified, one beneficial and onedetrimental. The beneficial effect often underpins the argument for explicit deposit insuranceas a mechanism for reducing bank runs and systemic financial crises. As demonstrated byDiamond and Dybvig (1983), the “sequential servicing” characteristic of bank deposits andliquidity production activities of banks, exposes even initially solvent banks to the possibilityof destructive runs. In addition, the inability of depositors to distinguish specific from generalfactors affecting bank solvency creates the risk of contagion. Deposit insurance is one potentialsolution to this problem.
In practice, the limits placed on deposit insurance coverage, with the objective of encour-aging market discipline by larger (wholesale) depositor stakeholders with the capacity toassess risk, works to reduce the force of this argument. Banks remain at risk of runs inducedby actions of wholesale depositors or other creditors. Nevertheless, the protection affordedto retail depositors has the beneficial effect of reducing the possibility of runs or contagionarising from this source.
The detrimental effect most commonly pointed to is the potential for moral hazard involv-ing increased risk taking, to exploit the benefits of a guarantee, with potentially adverseconsequences for financial system stability. Demigurc-Kunt and Detragiache (2000) note apositive correlation between the existence of deposit insurance and financial sector insta-bility from an international study, but point to the important role of weak institutional andregulatory structures in leading to that result.
It is worth examining the moral hazard argument in more detail, to see how institutionalarrangements in the Australian financial sector affect its practical significance. To do so, notethat incentives for risk taking and /or reduced monitoring could, in principle, arise for ADIstakeholders such as insured depositors, uninsured depositors, other creditors, ADI owners,ADI managers, and ADI supervisors. Such incentives need to be compared with those arisingunder the alternative, current, regulatory structure and safety net.
To the extent that the current regulatory structure is viewed by retail depositors as involvingimplicit guarantees over ADI deposits, a move to an explicit scheme would not be expectedto lead to any significant increase in incentives for risk taking and reduced monitoring byretail, insured, depositors. If instead, retail depositors perceive that caveat emptor prevails, itis possible that explicit insurance could lead to greater willingness to place deposits with
5. Designing banking sector safety nets 53
ADIs offering higher than average interest rates without concern for, or need to assess,the default risk of the ADI. Whether retail depositors have the ability (or access to reliable,understandable information) to effectively assess such risk is a moot point. More generally forsuch an outcome, it is necessary that governance and regulatory arrangements give incentivesto, and permit, ADI management to increase risk taking in this manner. This is consideredshortly.
For depositors who would not be insured under an explicit scheme and for other cred-itors, the introduction of a limited explicit scheme may lead to increased monitoring andsensitivity to ADI risk, if current perceptions are of implicit guarantees and potential bailouts if an ADI fails. Gropp and Vesala (2001) interpret observed changes in interest ratemargins in European countries following the introduction of explicit schemes as evidenceof such reactions consistent with replacement of a system of implicit guarantees. If caveatemptor is believed to currently apply, there would not appear to be any strong arguments tosuggest that the risk sensitivity and monitoring of such stakeholders would be significantlyaffected.
Textbook analysis of the moral hazard arising from deposit insurance focuses upon thebenefits accruing to ADI owners (equity holders) from increased risk taking when the pricingof deposit insurance is not appropriately risk related or is underpriced. Removal of suchadverse incentives for increased risk taking can be achieved by ensuring risk based pricingof deposit insurance, although the ability to successfully implement risk based pricing whenADIs have private information has been questioned (Chan, Greenbaum and Thakor, 1992).
In the absence of risk based pricing, ADI owners can benefit if ADI managers take actionswhich increase the value of the implicit put option reflected in the deposit insurance con-tract. However, given the separation between ownership and management which prevailsin Australian ADIs because of dispersed ownership, the ability of owners to direct manage-ment to act in such a way is extremely limited. Indirect incentives may nevertheless existthrough the contracting and governance arrangements and through equity market forces. Itis therefore necessary to consider the incentives for management to increase risk taking toexploit the deposit insurance scheme and the constraints which exist to prevent them fromdoing so.
Whether an ADI’s management with minimal equity stake in the ADI has incentivesto increase risk to exploit deposit insurance depends upon issues such as compensationdesign, reputational considerations, governance arrangements and entrenchment. As Maceyand O’Hara (2003) note, “managers are not perfect agents of risk-preferring shareholders.Managers are fixed claimants to that portion of their compensation designated as salary. Inaddition, managerial incentives for risk-taking are reduced, since managers have investedtheir nondiversifiable human capital in their jobs.” Nevertheless, stock market pressures andequity linked compensation structures may give rise to some incentives to increased risktaking which is not counteracted by discipline from other fixed claimants such as depositors.If that is the case, the role of the ADI regulator becomes important in limiting moral hazard.
Some authors, such as Kane (2002) have focused on the possibility that regulatory author-ities may face inadequate incentives and accountability arrangements which cause them toengage in forbearance towards troubled institutions. The critical issue here, however, is thedesign of such arrangements rather than the existence or non-existence of an explicit schemeper se.
54 Kevin Davis
In summary, while moral hazard is a potential issue arising from introduction of an explicitdeposit insurance scheme, there appears to be little reason to believe that it is a necessaryconsequence which cannot be ameliorated by careful scheme design (including risk basedpricing and limited coverage) and attention to governance and incentive arrangements withinADIs and the prudential regulator.
3.3. Other Consequences
In addition to loss redistribution and behavioral effects which might arise from introductionof an explicit scheme, several other important consequences need to be considered. Insureddepositors are saved the resource costs of attempting to monitor the solvency of ADIs, whichare, arguably, sufficiently high for retail depositors as to make effective monitoring impossible.Deposit insurance can also affect competitive dynamics in the ADI industry and more broadly.To the extent that implicit guarantees are believed to exist but apply only to some groupsof ADIs, resulting competitive inequities could be reduced. At the same time, entry of newADIs might be facilitated (perhaps excessively so) since potential customers would place lessemphasis on a history of prudent management when deposit insurance applies also to newentrants and provides them with some instant “charter value”. Competition between ADIsand other financial institutions could also be enhanced if implicit guarantees over bank nondeposit liabilities are perceived to exist and are effectively removed.
Much of the preceding discussion has involved considering whether implicit guaran-tees already exist for ADIs. Even if government protection of depositors does not involveautomatic implicit guarantees, there is still the potential for governments to intervene andcompensate depositors at failed institutions on a case by case basis in response to politicalpressure. An explicit guarantee scheme does not preclude similar political reaction, but doesprovide a clear, pre specified, “line in the sand” behind which a government can stand toresist political pressure for more widespread compensation involving costs to the taxpayer.
3.4. An Assessment
On balance, the case for introduction of deposit insurance in Australia is finely balanced,primarily because the safety net provided by depositor preference provisions (combined withcurrent balance sheet structures) works to limit potential losses to Australian depositors ifan ADI fails. Nevertheless, the scope for significant future changes to occur in (existingand future entrant) ADI balance sheet structures suggests that a possible role for some suchredistribution mechanism should not be ruled out on these grounds. Provided that thoseinstitutions which create little risk of calls on such a scheme incur appropriately minimalcosts from operation of such a scheme, their low probability of costly failure does not, ofitself, create a case for not introducing such a scheme covering all ADIs.
Given the current role of depositor preference in weakening the case for explicit depositinsurance, it is the other considerations which, in this author’s view, tip the balance in favor ofsuch a scheme. Important among these is a perception that implicit guarantees are believed toprevail by much of the community and that this belief is more strongly held in the case of largeinstitutions. Shifting to an explicit limited guarantee could then have potentially beneficialeffects for market discipline, competition and government resolve not to engage in morewidespread bail outs at tax-payer expense. Also important is the opportunity provided byan explicit scheme to reduce potential disruption to affected insured depositors when an
5. Designing banking sector safety nets 55
ADI fails. Finally, removing an anomaly that has a prudential supervisor monitoring ADIson behalf of retail consumers who are unable to do so effectively, but who are still exposedto losses if the institution fails would seem to have merit.
In practice, finance industry lobby groups and senior management have generally expressedstrong opposition to introduction of a deposit insurance scheme. Although concerns aboutmoral hazard are often mentioned, more emphasis should be placed on perceptions aboutnecessity and cost. One reason is concerns about the total cost of such a scheme. A secondreason is the fear that their institutions and customers will incur an unfair share of costs—generally premised on their perception that their institution will not be one which fails. Athird possible reason is that (at least) some ADIs already have “free” deposit insurance (andcompetitive advantages) because of the existence of implicit guarantees.
Since the significance of such concerns depends upon the precise nature of any schemeintroduced, it is important to consider briefly the type of scheme which might warrantintroduction.
4. DESIGNING AN EFFECTIVE AND ACCEPTABLE SCHEME
Historical experience, industry structure, current balance sheet structures, and an effectiveregulatory and supervisory process all suggest that the number of Australian ADIs whichmight fail and create claims on a deposit insurance fund within a time frame of, say, a decade,is quite small. In such circumstances, there are cost minimization grounds for consideringadoption of some form of a “post funded” scheme. In such schemes, immediate compensationto insured depositors at a failed institution is funded by the scheme temporarily borrowingfrom the Government budget or using pre-arranged lines of credit and ADIs are subsequentlylevied to pay off that debt. In a financial sector where ADI failures are expected to berare events (less than one or two per decade), and where failure management remains theresponsibility of the prudential supervisor, a legislated and well designed post funded schemecan remain largely dormant for much of the time and be “brought off the shelf ” as requiredto facilitate payments to insured depositors and determine and collect levies in the event ofa failure. The scheme replaces insured depositors as a claimant on the fund and, with othercreditors, awaits the outcome of (and perhaps has some influence on) the failure managementprocess undertaken by APRA. Ongoing administration costs are minimized and the risksof expense generating activities by managers of the pool of funds accumulating under apre-funded scheme14 are reduced.
Conventional wisdom appears to favor pre-funded schemes, but it is important to be awareof the key differences between pre and post funded schemes. In fact, at the level of theory,they are very similar. A pre-funded scheme typically has a target level of reserves (such as1.25 per cent of insured deposits for the US FDIC), achieved by levying annual premiumson ADIs until that target level is reached. When depleted by an ADI failure the fund isbuilt up again from annual premiums on remaining ADIs. A post-funded scheme operatesin essentially the same way except that the target level of funds is zero, with the fund debtfollowing a failure gradually reduced by levies on remaining ADIs. Unlike a private insurer,where capital (the fund balance) determines the probability of fund insolvency and abilityto meet claims, a government backed deposit insurance scheme with guaranteed access tocredit and the ability to compulsorily impose future levies on ADIs, does not necessarilyhave the same requirements for a minimum capital level.
56 Kevin Davis
From this perspective the main difference is simply that a pre funded scheme involves thefund managing a stock of assets which would otherwise be retained by and managed by theindividual ADI contributors.15 Ownership of that stock of assets and entitlement to returnson the assets may vary between the two schemes, but this depends on precise structuringof the scheme. Macroeconomic asset market consequences of ongoing portfolio choice andportfolio adjustments involved in financing payouts also might vary, but not necessarily. Bothschemes involve payments by remaining ADIs following a failure to restore the fund toits desired target level, and there is no reason to expect that a more rapid restoration (andthus higher annual rate of payment) would be required under one scheme relative to theother.
What then are the differences between pre and post funded schemes which lead to thewidespread preference for pre funded schemes. One concern is whether risk based premiumscan be applied in the case of a post-funded scheme. In principle, and in practice, there isno reason to believe that this cannot be done. It would require the regulatory authorityto annually assess and advise ADIs of their current risk grading and implications for levies(perhaps based on an historical average of risk grades and asset size) should they be required.Perhaps more relevant, in this regard, is the concern that ADI managers may not be assensitive to risk based contingent liabilities as they would be to risk related annual premiumsinvolving ongoing cash outflows. Assessing the merits of that concern is difficult, but suchbehavior is difficult to reconcile with a view of ADI managers as financial sophisticates ableto recognize the essential similarity between the two situations. Although one differenceis that the contingent liability disappears for institutions which have failed, ADI managerscontemplating increased risk taking with increased risk of failure are still faced with the nonzero probability that failure of another institution would leave them exposed to higher leviesbecause of a higher risk rating.
Another reason for aversion to post funded schemes appears to arise from notions of equityand fairness. In a post funded scheme no contributions have been received from the failedADI prior to its failure. To the extent that failure is driven by external events rather thanexcessive risk taking by the ADI in question this concern has little basis. For example, ifa thousand ADIs all operated with economic capital such that the risk of failure was 1 in500 p.a., there would be an average of two failures p.a. drawn randomly from the population.Ex post the stakeholders in failed ADIs may lose less than if premiums had been paid priorto failure and payouts were the same in both cases, but this difference can be resolved byadjusting the payout arrangements to involve only partial coverage of insured deposits. If onthe other hand, failure reflects increased risk taking relative to the average, the argument mayhave some merit. Assuming that regulators could identify such risk taking (as is necessaryif risk based pricing in a pre funded scheme is to occur), this suggests a role for possibleregulatory action such as increased capital requirements. Alternatively, when combined withconcerns about the lack of ADI management sensitivity to risk related contingent liabilitiesassociated with post funding, it may suggest a role for some small amount of risk related prefunding.
Also relevant to the choice between pre and post funding is the question of whether thereare resulting differences in the ability of regulators to pursue alternative methods of resolvingtroubled institutions. With pre-funding it may be possible to use fund assets to facilitate atransfer of business of a distressed institution as a least cost resolution method, which maynot be as administratively feasible when post-funding is used. Here a key issue relates to the
5. Designing banking sector safety nets 57
governance arrangements of a scheme and its interaction with the prudential regulator indecision making regarding the resolution process.
A further consideration relevant to the choice between pre and post funding lies in theproblems in determining appropriate contribution levels in a financial system where failureshave been infrequent such that reliable estimates of the probability of failure and loss givenfailure are hard to estimate with confidence. In such circumstances, post funding may havesome advantages in terms of industry acceptability.
On balance, and contrary to international trends, there appears to be a case for a postfunded scheme. Some small amount of pre-funding could be envisaged for reasons discussedabove, although the potential for this to increase administrative costs needs to be recognized.
5. CONCLUSION
Judged by the history of the past seventy years, in which no Australian depositor has lostmoney from an ADI failure, it might be thought the performance of the existing regulatorystructure and safety net indicate no need for the introduction of deposit insurance in Australia.However, to adopt that view is to ignore the possibility that the existing system has imposedcosts which could be reduced by an alternative approach. Such costs include the possibledistortions to competitive neutrality resulting from implicit guarantees, their effects on marketdiscipline, and contingent (and in some cases actual) obligations for taxpayers.
Nevertheless, the alternative of a limited deposit insurance scheme is not without potentialcosts including redistributional effects due to errors in pricing, administrative costs, andmoral hazard. However, it has been argued here that careful scheme design, allied with theinstitutional and regulatory structure of the Australian financial sector can reduce such costsand tip the balance in favor of introducing an explicit scheme.
To some commentators, the heavily skewed distribution of the ADI industry in which fourmajor banks hold 66 per cent of ADI assets is seen a potential impediment to an effectivescheme. However, concerns that such size differences create excessive concentrations ofrisk and thus prevent the operation of a fairly priced deposit insurance scheme incorrectlyassociate asset size with risks imposed on a scheme which provides limited insurance of asubset of (deposit) liabilities.
On balance, it appears that a post funded scheme has some advantages over a pre fundedscheme in the Australian context—although (it has been argued) many of the oft-claimeddifferences are more imagined than real. These advantages include minimization of admin-istrative and compliance costs in an environment where failures are expected to be few andfar between. Also important, however, is the likelihood of less industry opposition to a postfunded scheme in which risks of growth of bureaucracy and concerns about the settingof unfair premiums (given uncertainty about true insurance costs) are reduced. Given theconspicuous lack of support for (and in many cases strong opposition to) introduction of anexplicit scheme by senior executives in the Australian ADI industry, the fact that, on closeexamination, many of the perceived differences between pre and post funded schemes areimaginary is a blessing in disguise.
ENDNOTES
1. I would like to take this opportunity to thank the officers of the Australian Treasury, Reserve Bank of Australia,and Australian Prudential Regulation Authority who worked with me on the Study of Financial System Guarantees(Davis, 2004) on which this chapter is based.
58 Kevin Davis
2. HIH only operated in those markets in the states where private rather than government insurance was possible.3. A recent perspective from the Reserve Bank of New Zealand on the rationale for the absence of deposit
insurance in New Zealand can be found at http://www.rbnz.govt.nz/banking/Regulation/0154814.html4. For the definition of a bank’s domestic book see http://www.apra.gov.au/Statistics/Monthly-Banking-Statistics.
cfm5. This provision does not apply to branches of foreign banks.6. The banks referred to are ING Australia and Elders Rural Bank respectively. Source: APRA Monthly Banking
Statistics, http://www.apra.gov.au/Statistics/Monthly-Banking-Statistics.cfm7. Kane and Kaufman (1993) provide an analysis.8. Details of the changes made in the Australian Prudential Regulation Authority Amendment Act 2003 can be
found in APRA (2003).9. APRA has a range of failure management powers including directions powers, external administration pow-
ers, compulsory transfer of business powers, and the ability to apply to the Federal Court for wind-up andappointment of a liquidator who would be subject to direction by the court.
10. Another tendency has been to provide compensation to individuals who face losses from lack of (or under)insurance following bushfires and other natural disasters.
11. See Davis (2004, Appendix 4.3) for details.12. It is, of course, possible that governments may choose to bail out uninsured depositors, thus weakening the
force of these arguments.13. See http://www.apra.gov.au/aboutAPRA/14. In a pre funded scheme, ADIs are charged regular premiums to build up a stock of fund reserves out of which
payments to insured depositors can be made in the event of a failure.15. In both cases, ADIs have contingent liabilities to make future payments as determined by the scheme manager
which are necessary to restore the fund to its target balance.
REFERENCES
APRA, A new act: A Review of APRA’s New Governance Structure, APRA Insight, 3rd Quarter/4th Quarter2003, 2–5. http://www.apra.gov.au/Insight/Insight-3rd-Quarter-2003.cfm
Chan, Y., Greenbaum, S.I., Thakor A.V., Is Fairly Priced Deposit Insurance Possible, Journal of Finance, Vol. 47,No.1, 1992, 227–445.
Davis, K., Study of Financial System Guarantees, March 2004. http://fsgstudy.treasury.gov.au/content/default.asp.Demirguc-Kunt, A., Detragiache, E., Does Deposit Insurance Increase Banking System Stability? An Empirical
Investigation, IMF Working Paper, January 2000.Demirguc-Kunt, A., Kane, E.J., Deposit Insurance Around the Globe: Where Does it Work?, Journal of Economic
Perspectives, Vol. 16, No. 2, 2002, 175–195.Diamond, D.W., Dybvig, P.H., Bank Runs, Deposits Insurance and Liquidity, Journal of Political Economy, Vol. 91
(3), 1983, 401–419.Gropp, R., Vesala, J., Deposit Insurance and Moral Hazard: Does the Counterfactual Matter?, European Central Bank
Working Paper, No. 47, March 2001. http://www.ecb.int/pub/wp/ecbwp047.pdf.HIH Royal Commission, The Failure of HIH Insurance. http://www.hihroyalcom.gov.au/finalreport/index.htmKane, E.J., Using Deferred Compensation to Strengthen the Ethics of Financial Regulation, Journal of Banking and
Finance, Vol. 26, September 2002, 1919–33.Kane, E.J., Kaufman, G.G., Incentive Conflict in Deposit-institution Regulation: Evidence from Australia, Pacific-
Basin Finance Journal, Vol. I, 1993, 13–29.Macey, J.R., O’Hara, M., The Corporate Governance of Banks, FRBNY Economic Policy Review, April 2003,
91–107.Wallis, S., Financial System Inquiry Final Report, Australian Government Publishing Service, March 1997.
6. GLOBALIZATION AND THE GROWTH OF INTERNATIONALSTOCK EXCHANGES
WILLIAM L. MEGGINSON AND NATALIE L. SUTTER
1. INTRODUCTION
Recent economic research shows that large, efficient capital markets promote rapid economicgrowth. Research by Levine (1997), Demirguc-Kunt and Maksimovic (1998), Levine andZervos (1998), Rajan and Zingales (1998), Subrahmanyam and Titman (1998), Beck, Levine,and Loayza (2000), Henry (2000a and b), Wurgler (2000), Bekaert and Harvey (2000), andothers have documented a direct link between capital market development and economicgrowth.
Capital market-based finance has been increasing in importance, both absolutely andrelative to financial intermediary-based finance, in developed and developing countries overthe past two decades. Capital markets are winning the contest with financial intermediaries tobecome the dominant sources of external financing for companies throughout the developedworld. Capital markets seem likely to dominate the future of corporate finance in bothdeveloped and developing countries.
While experience and observation have driven much of the reassessment of the optimalrole of capital markets in capital finance, academic research has also been important sinceit now strongly favors capital markets over banks. The most important paper in the streamof research documenting that capital markets are essential for good corporate governanceis the influential survey article by Levine (1997). Additional papers by Levine and Zervos(1998), Rajan and Zingales (1998), Demirguc-Kunt and Maksimovic (1998), Henry (2000b),and Bekaert and Harvey (2000) all provide direct or indirect support for the capital marketoptimality hypothesis. The “law and finance” literature developed by La Porta, Lopez-de-Silanes, Shleifer, and Vishny (1997, 1998, 2000, and 2002) also emphasizes the importance of
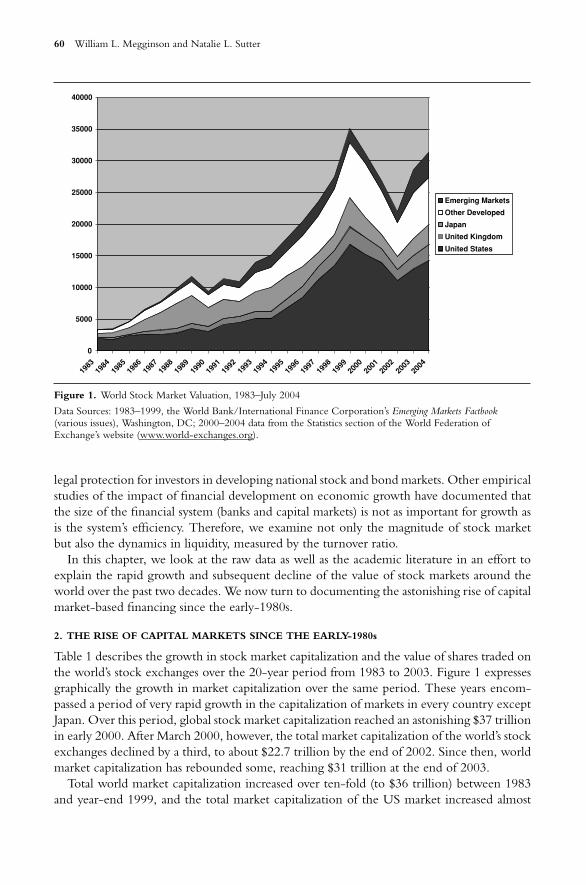
60 William L. Megginson and Natalie L. Sutter
0
5000
10000
15000
20000
25000
30000
35000
40000
1983
1984
1985
1986
1987
1988
1989
1990
1991
1992
1993
1994
1995
1996
1997
1998
1999
2000
2001
2002
2003
2004
Emerging Markets
Other Developed
Japan
United Kingdom
United States
Figure 1. World Stock Market Valuation, 1983–July 2004
Data Sources: 1983–1999, the World Bank/International Finance Corporation’s Emerging Markets Factbook(various issues), Washington, DC; 2000–2004 data from the Statistics section of the World Federation ofExchange’s website (www.world-exchanges.org).
legal protection for investors in developing national stock and bond markets. Other empiricalstudies of the impact of financial development on economic growth have documented thatthe size of the financial system (banks and capital markets) is not as important for growth asis the system’s efficiency. Therefore, we examine not only the magnitude of stock marketbut also the dynamics in liquidity, measured by the turnover ratio.
In this chapter, we look at the raw data as well as the academic literature in an effort toexplain the rapid growth and subsequent decline of the value of stock markets around theworld over the past two decades. We now turn to documenting the astonishing rise of capitalmarket-based financing since the early-1980s.
2. THE RISE OF CAPITAL MARKETS SINCE THE EARLY-1980s
Table 1 describes the growth in stock market capitalization and the value of shares traded onthe world’s stock exchanges over the 20-year period from 1983 to 2003. Figure 1 expressesgraphically the growth in market capitalization over the same period. These years encom-passed a period of very rapid growth in the capitalization of markets in every country exceptJapan. Over this period, global stock market capitalization reached an astonishing $37 trillionin early 2000. After March 2000, however, the total market capitalization of the world’s stockexchanges declined by a third, to about $22.7 trillion by the end of 2002. Since then, worldmarket capitalization has rebounded some, reaching $31 trillion at the end of 2003.
Total world market capitalization increased over ten-fold (to $36 trillion) between 1983and year-end 1999, and the total market capitalization of the US market increased almost
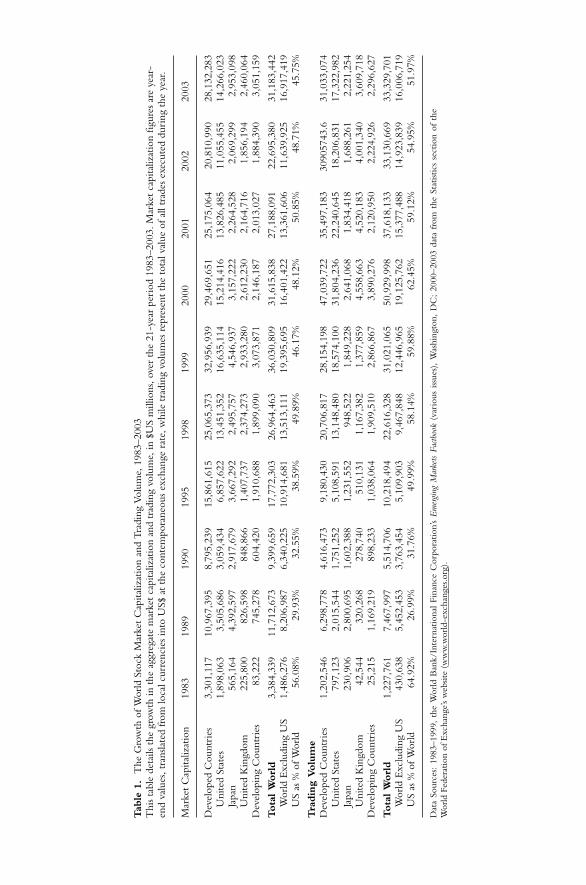
Tab
le1.
The
Gro
wth
ofW
orld
Stoc
kM
arke
tC
apita
lizat
ion
and
Tra
ding
Volu
me,
1983
–200
3T
his
tabl
ede
tails
the
grow
thin
the
aggr
egat
em
arke
tca
pita
lizat
ion
and
trad
ing
volu
me,
in$U
Sm
illio
ns,o
ver
the
21-y
ear
peri
od19
83–2
003.
Mar
ket
capi
taliz
atio
nfig
ures
are
year
-en
dva
lues
,tra
nsla
ted
from
loca
lcur
renc
ies
into
US$
atth
eco
ntem
pora
neou
sex
chan
gera
te,w
hile
trad
ing
volu
mes
repr
esen
tth
eto
talv
alue
ofal
ltra
des
exec
uted
duri
ngth
eye
ar.
Mar
ket
Cap
italiz
atio
n19
8319
8919
9019
9519
9819
9920
0020
0120
0220
03
Dev
elop
edC
ount
ries
3,30
1,11
710
,967
,395
8,79
5,23
915
,861
,615
25,0
65,3
7332
,956
,939
29,4
69,6
5125
,175
,064
20,8
10,9
9028
,132
,283
Uni
ted
Stat
es1,
898,
063
3,50
5,68
63,
059,
434
6,85
7,62
213
,451
,352
16,6
35,1
1415
,214
,416
13,8
26,4
8511
,055
,455
14,2
66,0
23Ja
pan
565,
164
4,39
2,59
72,
917,
679
3,66
7,29
22,
495,
757
4,54
6,93
73,
157,
222
2,26
4,52
82,
069,
299
2,95
3,09
8U
nite
dK
ingd
om22
5,80
082
6,59
884
8,86
61,
407,
737
2,37
4,27
32,
933,
280
2,61
2,23
02,
164,
716
1,85
6,19
42,
460,
064
Dev
elop
ing
Cou
ntri
es83
,222
745,
278
604,
420
1,91
0,68
81,
899,
090
3,07
3,87
12,
146,
187
2,01
3,02
71,
884,
390
3,05
1,15
9
Tota
lW
orl
d3,
384,
339
11,7
12,6
739,
399,
659
17,7
72,3
0326
,964
,463
36,0
30,8
0931
,615
,838
27,1
88,0
9122
,695
,380
31,1
83,4
42W
orld
Exc
ludi
ngU
S1,
486,
276
8,20
6,98
76,
340,
225
10,9
14,6
8113
,513
,111
19,3
95,6
9516
,401
,422
13,3
61,6
0611
,639
,925
16,9
17,4
19U
Sas
%of
Wor
ld56
.08%
29.9
3%32
.55%
38.5
9%49
.89%
46.1
7%48
.12%
50.8
5%48
.71%
45.7
5%
Tra
din
gVolu
me
Dev
elop
edC
ount
ries
1,20
2,54
66,
298,
778
4,61
6,47
39,
180,
430
20,7
06,8
1728
,154
,198
47,0
39,7
2235
,497
,183
3090
5743
.631
,033
,074
Uni
ted
Stat
es79
7,12
32,
015,
544
1,75
1,25
25,
108,
591
13,1
48,4
8018
,574
,100
31,8
04,2
3622
,240
,645
18,2
06,8
3117
,322
,982
Japa
n23
0,90
62,
800,
695
1,60
2,38
81,
231,
552
948,
522
1,84
9,22
82,
641,
068
1,83
4,41
81,
688,
261
2,22
1,25
4U
nite
dK
ingd
om42
,544
320,
268
278,
740
510,
131
1,16
7,38
21,
377,
859
4,55
8,66
34,
520,
183
4,00
1,34
03,
609,
718
Dev
elop
ing
Cou
ntri
es25
,215
1,16
9,21
989
8,23
31,
038,
064
1,90
9,51
02,
866,
867
3,89
0,27
62,
120,
950
2,22
4,92
62,
296,
627
Tota
lW
orl
d1,
227,
761
7,46
7,99
75,
514,
706
10,2
18,4
9422
,616
,328
31,0
21,0
6550
,929
,998
37,6
18,1
3333
,130
,669
33,3
29,7
01W
orld
Exc
ludi
ngU
S43
0,63
85,
452,
453
3,76
3,45
45,
109,
903
9,46
7,84
812
,446
,965
19,1
25,7
6215
,377
,488
14,9
23,8
3916
,006
,719
US
as%
ofW
orld
64.9
2%26
.99%
31.7
6%49
.99%
58.1
4%59
.88%
62.4
5%59
.12%
54.9
5%51
.97%
Dat
aSo
urce
s:19
83–1
999,
the
Wor
ldB
ank/
Inte
rnat
iona
lFi
nanc
eC
orpo
ratio
n’s
Em
ergi
ngM
arke
tsFa
ctboo
k(v
ario
usiss
ues)
,W
ashi
ngto
n,D
C;
2000
–200
3da
tafr
omth
eSt
atist
ics
sect
ion
ofth
eW
orld
Fede
ratio
nof
Exc
hang
e’s
web
site
(ww
w.w
orld
-exc
hang
es.o
rg).
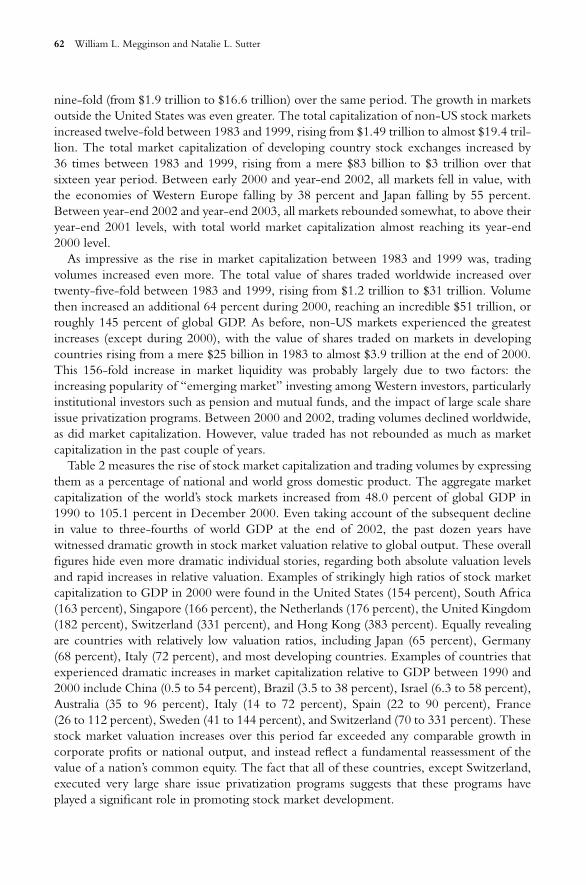
62 William L. Megginson and Natalie L. Sutter
nine-fold (from $1.9 trillion to $16.6 trillion) over the same period. The growth in marketsoutside the United States was even greater. The total capitalization of non-US stock marketsincreased twelve-fold between 1983 and 1999, rising from $1.49 trillion to almost $19.4 tril-lion. The total market capitalization of developing country stock exchanges increased by36 times between 1983 and 1999, rising from a mere $83 billion to $3 trillion over thatsixteen year period. Between early 2000 and year-end 2002, all markets fell in value, withthe economies of Western Europe falling by 38 percent and Japan falling by 55 percent.Between year-end 2002 and year-end 2003, all markets rebounded somewhat, to above theiryear-end 2001 levels, with total world market capitalization almost reaching its year-end2000 level.
As impressive as the rise in market capitalization between 1983 and 1999 was, tradingvolumes increased even more. The total value of shares traded worldwide increased overtwenty-five-fold between 1983 and 1999, rising from $1.2 trillion to $31 trillion. Volumethen increased an additional 64 percent during 2000, reaching an incredible $51 trillion, orroughly 145 percent of global GDP. As before, non-US markets experienced the greatestincreases (except during 2000), with the value of shares traded on markets in developingcountries rising from a mere $25 billion in 1983 to almost $3.9 trillion at the end of 2000.This 156-fold increase in market liquidity was probably largely due to two factors: theincreasing popularity of “emerging market” investing among Western investors, particularlyinstitutional investors such as pension and mutual funds, and the impact of large scale shareissue privatization programs. Between 2000 and 2002, trading volumes declined worldwide,as did market capitalization. However, value traded has not rebounded as much as marketcapitalization in the past couple of years.
Table 2 measures the rise of stock market capitalization and trading volumes by expressingthem as a percentage of national and world gross domestic product. The aggregate marketcapitalization of the world’s stock markets increased from 48.0 percent of global GDP in1990 to 105.1 percent in December 2000. Even taking account of the subsequent declinein value to three-fourths of world GDP at the end of 2002, the past dozen years havewitnessed dramatic growth in stock market valuation relative to global output. These overallfigures hide even more dramatic individual stories, regarding both absolute valuation levelsand rapid increases in relative valuation. Examples of strikingly high ratios of stock marketcapitalization to GDP in 2000 were found in the United States (154 percent), South Africa(163 percent), Singapore (166 percent), the Netherlands (176 percent), the United Kingdom(182 percent), Switzerland (331 percent), and Hong Kong (383 percent). Equally revealingare countries with relatively low valuation ratios, including Japan (65 percent), Germany(68 percent), Italy (72 percent), and most developing countries. Examples of countries thatexperienced dramatic increases in market capitalization relative to GDP between 1990 and2000 include China (0.5 to 54 percent), Brazil (3.5 to 38 percent), Israel (6.3 to 58 percent),Australia (35 to 96 percent), Italy (14 to 72 percent), Spain (22 to 90 percent), France(26 to 112 percent), Sweden (41 to 144 percent), and Switzerland (70 to 331 percent). Thesestock market valuation increases over this period far exceeded any comparable growth incorporate profits or national output, and instead reflect a fundamental reassessment of thevalue of a nation’s common equity. The fact that all of these countries, except Switzerland,executed very large share issue privatization programs suggests that these programs haveplayed a significant role in promoting stock market development.
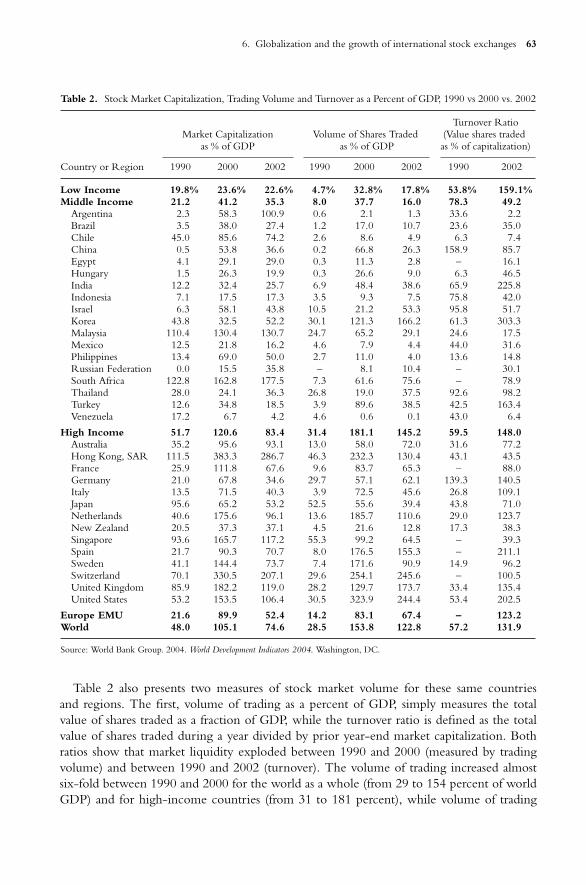
6. Globalization and the growth of international stock exchanges 63
Table 2. Stock Market Capitalization, Trading Volume and Turnover as a Percent of GDP, 1990 vs 2000 vs. 2002
Turnover RatioMarket Capitalization Volume of Shares Traded (Value shares traded
as % of GDP as % of GDP as % of capitalization)
Country or Region 1990 2000 2002 1990 2000 2002 1990 2002
Low Income 19.8% 23.6% 22.6% 4.7% 32.8% 17.8% 53.8% 159.1%Middle Income 21.2 41.2 35.3 8.0 37.7 16.0 78.3 49.2
Argentina 2.3 58.3 100.9 0.6 2.1 1.3 33.6 2.2Brazil 3.5 38.0 27.4 1.2 17.0 10.7 23.6 35.0Chile 45.0 85.6 74.2 2.6 8.6 4.9 6.3 7.4China 0.5 53.8 36.6 0.2 66.8 26.3 158.9 85.7Egypt 4.1 29.1 29.0 0.3 11.3 2.8 – 16.1Hungary 1.5 26.3 19.9 0.3 26.6 9.0 6.3 46.5India 12.2 32.4 25.7 6.9 48.4 38.6 65.9 225.8Indonesia 7.1 17.5 17.3 3.5 9.3 7.5 75.8 42.0Israel 6.3 58.1 43.8 10.5 21.2 53.3 95.8 51.7Korea 43.8 32.5 52.2 30.1 121.3 166.2 61.3 303.3Malaysia 110.4 130.4 130.7 24.7 65.2 29.1 24.6 17.5Mexico 12.5 21.8 16.2 4.6 7.9 4.4 44.0 31.6Philippines 13.4 69.0 50.0 2.7 11.0 4.0 13.6 14.8Russian Federation 0.0 15.5 35.8 – 8.1 10.4 – 30.1South Africa 122.8 162.8 177.5 7.3 61.6 75.6 – 78.9Thailand 28.0 24.1 36.3 26.8 19.0 37.5 92.6 98.2Turkey 12.6 34.8 18.5 3.9 89.6 38.5 42.5 163.4Venezuela 17.2 6.7 4.2 4.6 0.6 0.1 43.0 6.4
High Income 51.7 120.6 83.4 31.4 181.1 145.2 59.5 148.0Australia 35.2 95.6 93.1 13.0 58.0 72.0 31.6 77.2Hong Kong, SAR 111.5 383.3 286.7 46.3 232.3 130.4 43.1 43.5France 25.9 111.8 67.6 9.6 83.7 65.3 – 88.0Germany 21.0 67.8 34.6 29.7 57.1 62.1 139.3 140.5Italy 13.5 71.5 40.3 3.9 72.5 45.6 26.8 109.1Japan 95.6 65.2 53.2 52.5 55.6 39.4 43.8 71.0Netherlands 40.6 175.6 96.1 13.6 185.7 110.6 29.0 123.7New Zealand 20.5 37.3 37.1 4.5 21.6 12.8 17.3 38.3Singapore 93.6 165.7 117.2 55.3 99.2 64.5 – 39.3Spain 21.7 90.3 70.7 8.0 176.5 155.3 – 211.1Sweden 41.1 144.4 73.7 7.4 171.6 90.9 14.9 96.2Switzerland 70.1 330.5 207.1 29.6 254.1 245.6 – 100.5United Kingdom 85.9 182.2 119.0 28.2 129.7 173.7 33.4 135.4United States 53.2 153.5 106.4 30.5 323.9 244.4 53.4 202.5
Europe EMU 21.6 89.9 52.4 14.2 83.1 67.4 – 123.2World 48.0 105.1 74.6 28.5 153.8 122.8 57.2 131.9
Source: World Bank Group. 2004. World Development Indicators 2004. Washington, DC.
Table 2 also presents two measures of stock market volume for these same countriesand regions. The first, volume of trading as a percent of GDP, simply measures the totalvalue of shares traded as a fraction of GDP, while the turnover ratio is defined as the totalvalue of shares traded during a year divided by prior year-end market capitalization. Bothratios show that market liquidity exploded between 1990 and 2000 (measured by tradingvolume) and between 1990 and 2002 (turnover). The volume of trading increased almostsix-fold between 1990 and 2000 for the world as a whole (from 29 to 154 percent of worldGDP) and for high-income countries (from 31 to 181 percent), while volume of trading
64 William L. Megginson and Natalie L. Sutter
increased almost eight-fold (from 4.7 to 33 percent of GDP) for low-income countries.Several middle-income countries witnessed truly spectacular increases in trading volumes,including China (0.2 to 67 percent of GDP), South Africa (7.3 to 62 percent), Turkey (3.9 to90 percent), and Korea (30 to 121 percent). As impressive as these gains are, however, theyare dwarfed by the rise in trading volumes in developed economies such as the Netherlands(14 to 186 percent of GDP), Spain (8 to 177 percent), Sweden (7.4 to 172 percent), HongKong (46 to 232 percent), Switzerland (30 to 254 percent), and the United States (31 to324 percent). From 2000 to 2002, these gains fell somewhat, with world trading volume as apercent of GDP falling from 154% to 123%, with each income group of countries falling bysimilar percentages. Low income countries fell from 33% to 18%. The middle income groupfell from 38% to 16%, and high income countries’ trading volume as a percent of GDP fellfrom 181% to 145%.
The trading volume measure is obviously inflated by the dramatic increase in average stockvalues between 1990 and 2000, so the turnover ratio is perhaps a better measure of the trueincrease in the frequency of trading and thus the true liquidity of a nation’s stock market.This measure, not surprisingly, shows a much smaller increase than does the value of sharestrading, though the ratio more than doubles between 1990 and 2002 for the world andfor both low-income and high-income countries. Additionally, several individual countriesexperienced dramatic increases in turnover, although other countries see a net decline.In these cases, share valuations increased sharply, increasing the value of shares traded, butthe frequency of trading either remained constant or fell. However, most large countriesexperienced significant increases in the turnover ratio, with the most notable increase beingthat of the United States, where the value of shares traded as a percent of prior year’scapitalization increased from 53 to 202.5 percent. In summary, the Great Bull Market of the1990s dramatically increased the overall capitalization and volume of trading of the world’sstock markets, and much of the growth that occurred between 1990 and 2000 remains intacttoday.
Another way of measuring the rise of capital markets is to examine whether their shareof annual corporate financing activity has grown relative to that of other sources of funding.Table 3 details the phenomenal growth in the total value of securities issuance over theperiod 1990-2002. This table clearly shows that the annual volume of global security issueshas surged over the past dozen years, both worldwide and in the United States. Worldwideofferings of debt and equity securities totaled $504 billion in 1990 (and barely $300 billionin 1988); by 2001, this figure had increased eight-fold to $4.11 trillion, before droppingslightly to $3.90 trillion in 2002. And these figures do not include privatizations, since theseare almost always secondary issues that do not raise capital for the firm itself. Even thoughsecurity offerings by United States issuers accounted for two-thirds or more of the globaltotal throughout this period, that still implies that non-US security issues increased from$191 billion in 1990 to $1.20 trillion in 2001 (and $1.12 trillion in 2002). Such a massiveincrease in global security issuance is unprecedented in modern financial history, thoughdomestic bond issues often surge during major wars. The rise in non-US offerings alsocompletely dwarfs the increase in bank financing since 1990.
We conclude this examination of the growing importance of capital markets by brieflysummarizing the most incredible increase in the total volume of merger and acquisition
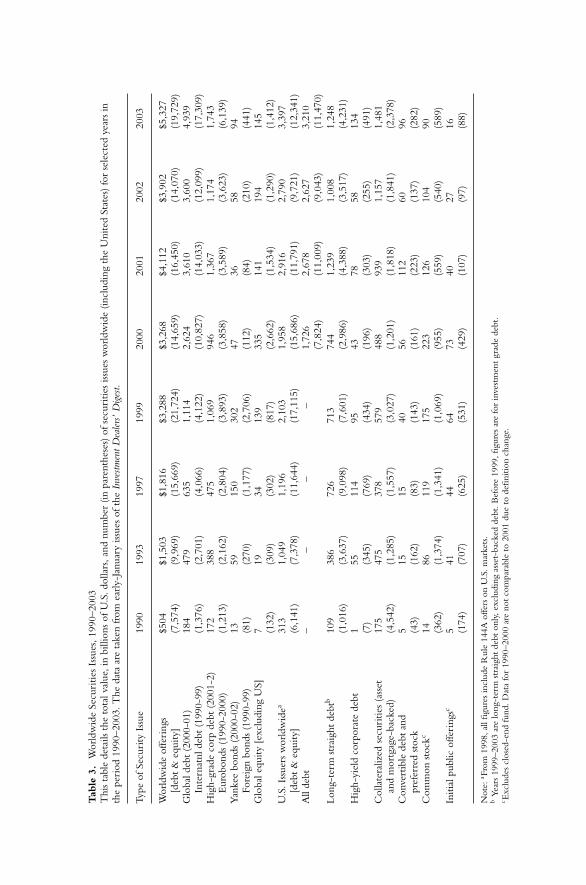
Tab
le3.
Wor
ldw
ide
Secu
ritie
sIs
sues
,199
0–20
03T
his
tabl
ede
tails
the
tota
lval
ue,i
nbi
llion
sof
U.S
.dol
lars
,and
num
ber
(inpa
rent
hese
s)of
secu
ritie
siss
ues
wor
ldw
ide
(incl
udin
gth
eU
nite
dSt
ates
)fo
rse
lect
edye
ars
inth
epe
riod
1990
–200
3.T
heda
taar
eta
ken
from
earl
y-Ja
nuar
yiss
ues
ofth
eIn
vestm
entD
eale
rs’
Dig
est.
Type
ofSe
curi
tyIs
sue
1990
1993
1997
1999
2000
2001
2002
2003
Wor
ldw
ide
offe
ring
s$5
04$1
,503
$1,8
16$3
,288
$3,2
68$4
,112
$3,9
02$5
,327
[deb
t&
equi
ty]
(7,5
74)
(9,9
69)
(15,
669)
(21,
724)
(14,
659)
(16,
450)
(14,
070)
(19,
729)
Glo
bald
ebt
(200
0-01
)18
447
963
51,
114
2,62
43,
610
3,60
04,
939
Inte
rnat
nlde
bt(1
990-
99)
(1,3
76)
(2,7
01)
(4,0
66)
(4,1
22)
(10,
827)
(14,
033)
(12,
099)
(17,
309)
Hig
h-gr
ade
corp
debt
(200
1-2)
172
388
475
1,06
994
61,
367
1,17
41,
743
Eur
obon
ds(1
990-
2000
)(1
,213
)(2
,162
)(2
,804
)(3
,893
)(3
,858
)(3
,589
)(3
,623
)(6
,139
)Y
anke
ebo
nds
(200
0-02
)13
5915
030
247
3658
94Fo
reig
nbo
nds
(199
0-99
)(8
1)(2
70)
(1,1
77)
(2,7
06)
(112
)(8
4)(2
10)
(441
)G
loba
lequ
ity[e
xclu
ding
US]
719
3413
933
514
119
414
5(1
32)
(309
)(3
02)
(817
)(2
,662
)(1
,534
)(1
,290
)(1
,412
)U
.S.I
ssue
rsw
orld
wid
ea31
31,
049
1,19
62,
103
1,95
82,
916
2,79
03,
397
[deb
t&
equi
ty]
(6,1
41)
(7,3
78)
(11,
644)
(17,
115)
(15,
686)
(11,
791)
(9,7
21)
(12,
341)
All
debt
––
––
1,72
62,
678
2,62
73,
210
(7,8
24)
(11,
009)
(9,0
43)
(11,
470)
Long
-ter
mst
raig
htde
btb
109
386
726
713
744
1,23
91,
008
1,24
8(1
,016
)(3
,637
)(9
,098
)(7
,601
)(2
,986
)(4
,388
)(3
,517
)(4
,231
)H
igh-
yiel
dco
rpor
ate
debt
155
114
9543
7858
134
(7)
(345
)(7
69)
(434
)(1
96)
(303
)(2
55)
(491
)C
olla
tera
lized
secu
ritie
s(a
sset
175
475
378
579
488
939
1,15
71,
481
and
mor
tgag
e-ba
cked
)(4
,542
)(1
,285
)(1
,557
)(3
,027
)(1
,201
)(1
,818
)(1
,841
)(2
,378
)C
onve
rtib
lede
btan
d5
1515
4056
112
6096
pref
erre
dst
ock
(43)
(162
)(8
3)(1
43)
(161
)(2
23)
(137
)(2
82)
Com
mon
stoc
kc14
8611
917
522
312
610
490
(362
)(1
,374
)(1
,341
)(1
,069
)(9
55)
(559
)(5
40)
(589
)In
itial
publ
icof
feri
ngsc
541
4464
7340
2716
(174
)(7
07)
(625
)(5
31)
(429
)(1
07)
(97)
(88)
Not
e:a F
rom
1998
,all
figur
esin
clud
eR
ule
144A
offe
rson
U.S
.mar
kets
.b
Year
s19
99–2
003
are
long
-ter
mst
raig
htde
bton
ly,e
xclu
ding
asse
t-ba
cked
debt
.Bef
ore
1999
,figu
res
are
for
inve
stm
ent
grad
ede
bt.
c Exc
lude
scl
osed
-end
fund
.Dat
afo
r19
90–2
000
are
not
com
para
ble
to20
01du
eto
defin
ition
chan
ge.
66 William L. Megginson and Natalie L. Sutter
activity that occurred between 1990 and 2000. The total value of announced mergers andacquisitions on US stock markets rose from less than $200 billion in 1990 (and less than$160 billion in 1991) to over $3.45 trillion in 2000. Even though the 1980s were considereda very active period for M&A, the 1990s dwarfed that decade’s total as well as any otherin American history. The total value of M&A for the decade topped $5 trillion, with two-thirds of that occurring in 1998 and 1999 alone. While takeovers have always played animportant role in the United States, the rise in M&A activity in Europe during the 1990swas even more dramatic. From less than $50 billion annually in the late-1980s, the totalvalue of M&A involving a European target reached $592 billion in 1998, before more thandoubling to $1.22 trillion in 1999—rivaling the US total. As noted, the global value of M&Aactivity in 2000 reached $3.45 trillion, or about ten percent of world GDP. As with marketcapitalization, the total value of M&A activity in the United States and other developedeconomies has contracted sharply since 2000, though 2002’s global total of $1.2 trillionwas still the fifth most active year in history. If and when stock valuations recover to early2000 levels, it seems likely that M&A activity will once more take off.
3. PRIVATIZATION’S IMPACT ON STOCK MARKET GROWTH
Privatization programs have significantly, often dramatically, impacted the development ofmost non-US stock markets. Share issue privatizations have also truly transformed shareownership patterns of investors in many different countries.
While it is very difficult to establish a direct, cause and effect relationship between SIPprograms and stock market development, indirect evidence suggests that the impact hasbeen very significant. At the end of 1983, the total market capitalization of the handful ofBritish, Chilean, and Singaporean firms that had been privatized by then was far less than$50 billion. By the end of May 2000, the 152 privatized firms listed in either the BusinessWeek “Global 1000” ranking of the most valuable companies in developed-nation stockmarkets or in the Business Week “Top 200 Emerging Market Companies” ranking had atotal market capitalization of $3.31 trillion. This was equal to approximately 13 percent ofthe combined market capitalization of the firms on the two lists, but was equal to over27 percent of the non-US total. This is because American firms accounted for 484 of theGlobal 1000 firms—and $13.1 trillion of the $23.9 trillion Global 1000 total capitalization inMay 2000.
The total valuation of privatized companies fell sharply during 2001 and 2002, declin-ing to $2.83 trillion in May 2002. However, the valuations of non-privatized companiesdeclined even more, to $17.74 trillion. By May 2003, the total valuation of the 195 priva-tized firms on the two Business Week lists had rebounded to $3.24 trillion, but the value of the1005 non-privatized companies on the combined 2003 lists continued to decline, falling to$14.58 trillion. Therefore, the privatized companies significantly increased their proportionalshare of year 2003 global stock market value from 14.5 to 18.2 percent, and raised their shareof the non-US total valuation increased even more, from 30.4 percent to 38.6 percent. ByMay 2004, the Global 1000 list contained 151 privatized companies, worth $3.175 trillion.These companies comprised 15% of the Global 1000 companies’ total market valuation of$21 trillion. This implies that investors who purchased privatization share offerings have fared
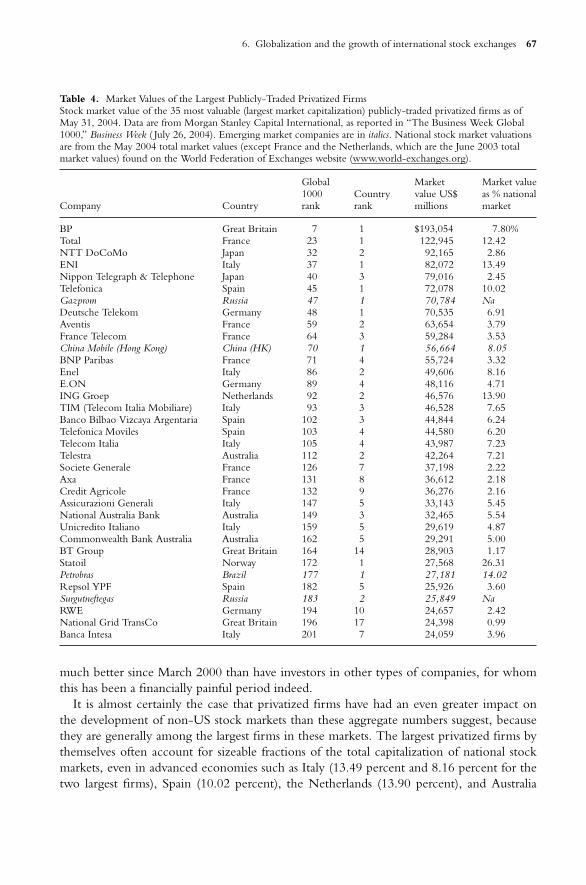
6. Globalization and the growth of international stock exchanges 67
Table 4. Market Values of the Largest Publicly-Traded Privatized FirmsStock market value of the 35 most valuable (largest market capitalization) publicly-traded privatized firms as ofMay 31, 2004. Data are from Morgan Stanley Capital International, as reported in “The Business Week Global1000,” Business Week ( July 26, 2004). Emerging market companies are in italics. National stock market valuationsare from the May 2004 total market values (except France and the Netherlands, which are the June 2003 totalmarket values) found on the World Federation of Exchanges website (www.world-exchanges.org).
Global Market Market value1000 Country value US$ as % national
Company Country rank rank millions market
BP Great Britain 7 1 $193,054 7.80%Total France 23 1 122,945 12.42NTT DoCoMo Japan 32 2 92,165 2.86ENI Italy 37 1 82,072 13.49Nippon Telegraph & Telephone Japan 40 3 79,016 2.45Telefonica Spain 45 1 72,078 10.02Gazprom Russia 47 1 70,784 NaDeutsche Telekom Germany 48 1 70,535 6.91Aventis France 59 2 63,654 3.79France Telecom France 64 3 59,284 3.53China Mobile (Hong Kong) China (HK) 70 1 56,664 8.05BNP Paribas France 71 4 55,724 3.32Enel Italy 86 2 49,606 8.16E.ON Germany 89 4 48,116 4.71ING Groep Netherlands 92 2 46,576 13.90TIM (Telecom Italia Mobiliare) Italy 93 3 46,528 7.65Banco Bilbao Vizcaya Argentaria Spain 102 3 44,844 6.24Telefonica Moviles Spain 103 4 44,580 6.20Telecom Italia Italy 105 4 43,987 7.23Telestra Australia 112 2 42,264 7.21Societe Generale France 126 7 37,198 2.22Axa France 131 8 36,612 2.18Credit Agricole France 132 9 36,276 2.16Assicurazioni Generali Italy 147 5 33,143 5.45National Australia Bank Australia 149 3 32,465 5.54Unicredito Italiano Italy 159 5 29,619 4.87Commonwealth Bank Australia Australia 162 5 29,291 5.00BT Group Great Britain 164 14 28,903 1.17Statoil Norway 172 1 27,568 26.31Petrobras Brazil 177 1 27,181 14.02Repsol YPF Spain 182 5 25,926 3.60Surgutneftegas Russia 183 2 25,849 NaRWE Germany 194 10 24,657 2.42National Grid TransCo Great Britain 196 17 24,398 0.99Banca Intesa Italy 201 7 24,059 3.96
much better since March 2000 than have investors in other types of companies, for whomthis has been a financially painful period indeed.
It is almost certainly the case that privatized firms have had an even greater impact onthe development of non-US stock markets than these aggregate numbers suggest, becausethey are generally among the largest firms in these markets. The largest privatized firms bythemselves often account for sizeable fractions of the total capitalization of national stockmarkets, even in advanced economies such as Italy (13.49 percent and 8.16 percent for thetwo largest firms), Spain (10.02 percent), the Netherlands (13.90 percent), and Australia
68 William L. Megginson and Natalie L. Sutter
(7.21 percent). In emerging markets such as Mexico (14.86 percent), China (8.05 percent),Brazil (14.02 percent), and Russia, individual privatized firms often account for very largefraction of the total national market capitalization.
Tables 5 and 6 present similar rankings for the non-US firms in the two Business Weeklists, but details which of the ten most valuable companies in a nation’s stock market areprivatized firms. These tables clearly reveal the relative importance of SIPs in most non-USstock markets. Privatized firms are the most valuable companies in 12 of the 21 developedmarkets on the Global 1000 list and in 12 of 20 Top 200 Emerging Markets. Privatizedcompanies have the highest market values in four of the largest non-US markets—Britain,France, Germany, and Italy—as well as in three of the largest emerging markets—China,India, and Brazil. They are the second most valuable firms in Finland, Taiwan, South Africa,and Malaysia. Privatized companies are the first and second most valuable companies in twocountries, Brazil and Indonesia, and they occupy the three (or more) top slots in France,Italy, Norway, Portugal, China, Russia, India, Poland, Hungary, and the Czech Republic.
In an attempt to measure what part of the increased liquidity of world stock markets isdriven by privatization, Boutchkova and Megginson (2000, henceforth B&M) generate theturnover ratios for individual markets and regress these on the number of privatization dealsfor each country in a particular year. B&M specifically pick the turnover ratio, defined as thetotal value of trading divided by prior year-end total market capitalization, as their measureof stock market liquidity because it reflects increases in both the value of shares traded and thestock market capitalization measures—rather than just measuring absolute growth in tradingvolume. In other words, it is a conservative measure of the growth in liquidity. Furthermore,as Levine and Zervos (1998) point out, liquidity is one of the few robust stock market-basedpredictors of long-run economic growth.
B&M find that each privatization deal leads to a 2.3 percent increase in a national market’sturnover ratio in the first post-divestment year, and a 1.7 percent increase the followingyear. Even with these strong results, B&M cannot show econometrically that privatizationprograms have been the primary cause of the growth, documented above, in the liquidityof stock and bond markets outside the United States. Conventional causality tests requirea system of equations specifying the precise relationship between market liquidity and thescale and format (asset sale versus share offering) of privatization programs. Absent such afully developed model of the privatization/market development relationship, they implicitlyassume that privatization is exogenous to the level of stock market development, yet thisseems unlikely to be completely true. In fact, Megginson, Nash, Netter, and Poulsen (2004)show that a government’s decision to privatization is exogenous to the level of stock marketdevelopment. This implies that governments choose share offerings as a means of developingtheir stock markets. On the other hand, B&M’s sample consists only of countries with suffi-ciently liquid markets to allow governments to employ share offerings as their privatizationmethod, so by construction they only examine the effect of privatization on stock marketliquidity after some critical level of liquidity has been reached. Thus the decision to privatize,conditional on that critical level of market development, can be assumed to be independentof liquidity. Given that privatization is exogenous in our setting, and the significance of theprivatization coefficients in the liquidity regression estimates, B&M conclude that privati-zation improves stock market development. A more general framework, where all countries
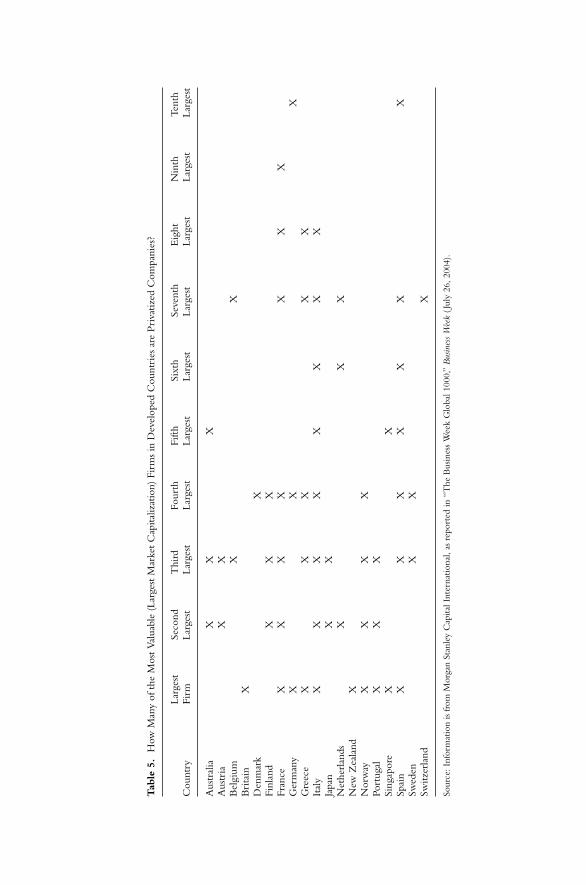
Tab
le5.
How
Man
yof
the
Mos
tVa
luab
le(L
arge
stM
arke
tC
apita
lizat
ion)
Firm
sin
Dev
elop
edC
ount
ries
are
Priv
atiz
edC
ompa
nies
?
Larg
est
Seco
ndT
hird
Four
thFi
fthSi
xth
Seve
nth
Eig
htN
inth
Tent
hC
ount
ryFi
rmLa
rges
tLa
rges
tLa
rges
tLa
rges
tLa
rges
tLa
rges
tLa
rges
tLa
rges
tLa
rges
t
Aus
tral
iaX
XX
Aus
tria
XX
Bel
gium
XX
Bri
tain
XD
enm
ark
XFi
nlan
dX
XX
Fran
ceX
XX
XX
XX
Ger
man
yX
XX
Gre
ece
XX
XX
XIt
aly
XX
XX
XX
XX
Japa
nX
XN
ethe
rlan
dsX
XX
New
Zea
land
XN
orw
ayX
XX
XPo
rtug
alX
XX
Sing
apor
eX
XSp
ain
XX
XX
XX
XSw
eden
XX
Switz
erla
ndX
Sour
ce:I
nfor
mat
ion
isfr
omM
orga
nSt
anle
yC
apita
lInt
erna
tiona
l,as
repo
rted
in“T
heB
usin
ess
Wee
kG
loba
l100
0,”
Bus
ines
sW
eek
(Jul
y26
,200
4).
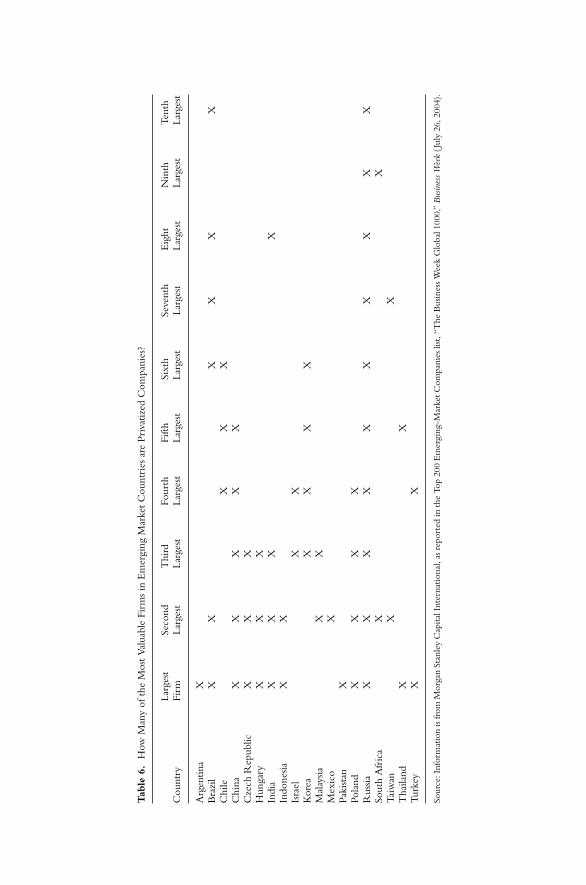
Tab
le6.
How
Man
yof
the
Mos
tVa
luab
leFi
rms
inE
mer
ging
Mar
ket
Cou
ntri
esar
ePr
ivat
ized
Com
pani
es?
Larg
est
Seco
ndT
hird
Four
thFi
fthSi
xth
Seve
nth
Eig
htN
inth
Tent
hC
ount
ryFi
rmLa
rges
tLa
rges
tLa
rges
tLa
rges
tLa
rges
tLa
rges
tLa
rges
tLa
rges
tLa
rges
t
Arg
entin
aX
Bra
zil
XX
XX
XX
Chi
leX
XX
Chi
naX
XX
XX
Cze
chR
epub
licX
XX
Hun
gary
XX
XIn
dia
XX
XX
Indo
nesia
XX
Isra
elX
XK
orea
XX
XX
Mal
aysia
XX
Mex
ico
XPa
kist
anX
Pola
ndX
XX
XR
ussia
XX
XX
XX
XX
XX
Sout
hA
fric
aX
XT
aiw
anX
XT
haila
ndX
XTu
rkey
XX
Sour
ce:I
nfor
mat
ion
isfr
omM
orga
nSt
anle
yC
apita
lInt
erna
tiona
l,as
repo
rted
inth
eTo
p20
0E
mer
ging
-Mar
ketC
ompa
nies
list,
“The
Bus
ines
sWee
kG
loba
l100
0,”
Bus
ines
sWee
k(J
uly
26,2
004)
.
6. Globalization and the growth of international stock exchanges 71
are in the sample regardless of their level of financial development, and where both marketliquidity and the privatization decision are modeled endogenously, would provide morerigorous conclusions, but must await future researchers.
One aspect of privatization programs which has to date attracted surprisingly little academicinterest is its observed ability to massively increase the total number of shareholders in acountry. In many cases, a single privatizing share issue will yield over 1,000,000 shareholders,usually in countries with little tradition of share ownership by individual investors. In fact,governments explicitly design SIP offers to attract individual citizen/investors, and they favorcertain groups (especially the employees of companies being privatized) with preferential shareallocations and pricing. Many governments have also voiced a desire to promote an “equityculture” amongst their citizenry—meaning a greater willingness to support entrepreneurshipthrough share ownership—as one of the chief rationales for adopting privatization programs.B&M therefore examine the pattern of share ownership in privatized firms, and also studyhow this ownership structure evolves over time.
The fact that governments are able to entice large numbers of investors to return forsubsequent share offerings suggests that share issue privatization programs are indeed creatingstock markets capable of absorbing large new stock issues, just as the governments hadhoped.
4. INVESTOR PROTECTION AND GROWTH OF STOCK MARKETS
While several authors have commented on the importance of legal systems to effective cor-porate governance, the works of La Porta, Lopez-de-Silanes, Shleifer, and Vishny (hereafterLLSV) have had unprecedented impact due to their number and the fact that the papers havebeen published in very prestigious academic journals. Using a sample of 49 countries, LLSV(1997) show that countries with poorer investor protection—measured both by the characterof legal rules and the quality of law enforcement—have smaller and less liquid capital markets.This is true for both debt and equity markets, suggesting that stock and bond markets arecomplements rather than supplements, and both require the proper legal infrastructure toreach maturity. LLSV (1997) also show that French civil law countries offer much poorerinvestor protection than do common law countries, and LLSV (1998) describe why this is so.They examine the investor protection characteristics of the world’s four basic legal systems(English common law, French civil law, German civil law, and Scandinavian law), and find thatthe common law countries offer by far the greatest protection to non-controlling investors.Further, LLSV (1998) document (and provide a rationale for) the fact that ownership con-centration is highest in countries offering poor investor protection, which is consistent withthe idea that small, diversified shareholders are unlikely to be important in countries thatfail to protect outside investors. In a specific investigation of the ownership structures of thelargest publicly traded companies in the world’s developed economies, La Porta, Lopez-de-Silanes, and Shleifer (1999) show that dispersed ownership structures are common only inthe U.S., Japan, and Britain. Effective family control over even the largest companies, oftenexercised through pyramidal share ownership structure, is the norm everywhere else. La Porta(2000) also find that dividend policies in different nations are related to the agency costs ofdifferent ownership structures. Table 7 reproduces key results from LLSV (1997) showing theimpact of a nation’s legal system on economic growth and financial market size and depth.
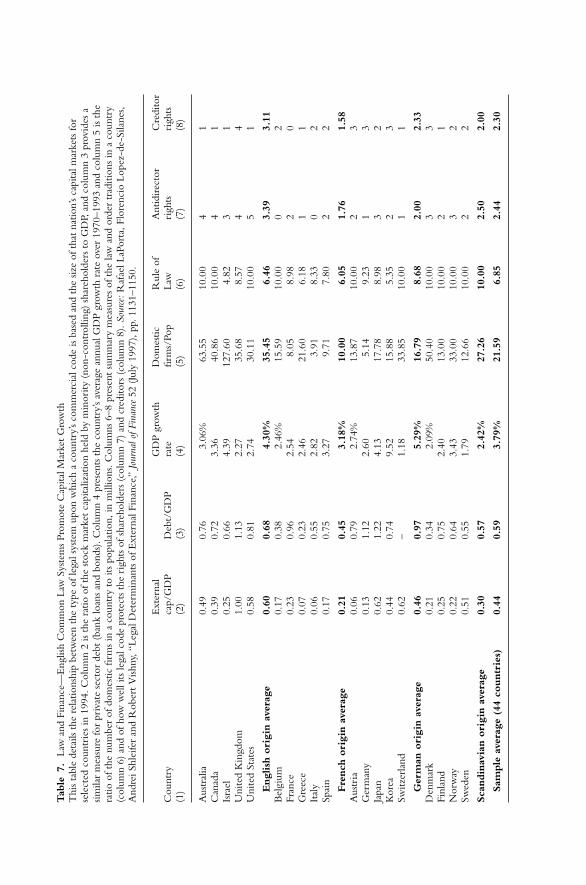
Tab
le7.
Law
and
Fina
nce—
Eng
lish
Com
mon
Law
Syst
ems
Prom
ote
Cap
italM
arke
tG
row
thT
his
tabl
ede
tails
the
rela
tions
hip
betw
een
the
type
ofle
gals
yste
mup
onw
hich
aco
untr
y’s
com
mer
cial
code
isba
sed
and
the
size
ofth
atna
tion’
sca
pita
lmar
kets
for
sele
cted
coun
trie
sin
1994
.Col
umn
2is
the
ratio
ofth
est
ock
mar
ket
capi
taliz
atio
nhe
ldby
min
ority
(non
-con
trol
ling)
shar
ehol
ders
toG
DP,
and
colu
mn
3pr
ovid
esa
simila
rm
easu
refo
rpr
ivat
ese
ctor
debt
(ban
klo
ans
and
bond
s).C
olum
n4
pres
ents
the
coun
try’
sav
erag
ean
nual
GD
Pgr
owth
rate
over
1970
–199
3an
dco
lum
n5
isth
era
tioof
the
num
ber
ofdo
mes
ticfir
ms
ina
coun
try
toits
popu
latio
n,in
mill
ions
.Col
umns
6–8
pres
ent
sum
mar
ym
easu
res
ofth
ela
wan
dor
der
trad
ition
sin
aco
untr
y(c
olum
n6)
and
ofho
ww
elli
tsle
galc
ode
prot
ects
the
righ
tsof
shar
ehol
ders
(col
umn
7)an
dcr
edito
rs(c
olum
n8)
.Sou
rce:
Raf
aelL
aPor
ta,F
lore
ncio
Lope
z-de
-Sila
nes,
And
reiS
hlei
fer
and
Rob
ert
Vish
ny,“
Lega
lDet
erm
inan
tsof
Ext
erna
lFin
ance
,”Jo
urna
lofF
inan
ce52
(Jul
y19
97),
pp.1
131–
1150
.
Ext
erna
lG
DP
grow
thD
omes
ticR
ule
ofA
ntid
irec
tor
Cre
dito
rC
ount
ryca
p/G
DP
Deb
t/G
DP
rate
firm
s/Po
pLa
wri
ghts
righ
ts(1
)(2
)(3
)(4
)(5
)(6
)(7
)(8
)
Aus
tral
ia0.
490.
763.
06%
63.5
510
.00
41
Can
ada
0.39
0.72
3.36
40.8
610
.00
41
Isra
el0.
250.
664.
3912
7.60
4.82
31
Uni
ted
Kin
gdom
1.00
1.13
2.27
35.6
88.
574
4U
nite
dSt
ates
0.58
0.81
2.74
30.1
110
.00
51
Engl
ish
ori
gin
aver
age
0.60
0.68
4.30
%35
.45
6.46
3.39
3.11
Bel
gium
0.17
0.38
2.46
%15
.59
10.0
00
2Fr
ance
0.23
0.96
2.54
8.05
8.98
20
Gre
ece
0.07
0.23
2.46
21.6
06.
181
1It
aly
0.06
0.55
2.82
3.91
8.33
02
Spai
n0.
170.
753.
279.
717.
802
2
Fre
nch
ori
gin
aver
age
0.21
0.45
3.18
%10
.00
6.05
1.76
1.58
Aus
tria
0.06
0.79
2.74
%13
.87
10.0
02
3G
erm
any
0.13
1.12
2.60
5.14
9.23
13
Japa
n0.
621.
224.
1317
.78
8.98
32
Kor
ea0.
440.
749.
5215
.88
5.35
23
Switz
erla
nd0.
62–
1.18
33.8
510
.00
11
Ger
man
ori
gin
aver
age
0.46
0.97
5.29
%16
.79
8.68
2.00
2.33
Den
mar
k0.
210.
342.
09%
50.4
010
.00
33
Finl
and
0.25
0.75
2.40
13.0
010
.00
21
Nor
way
0.22
0.64
3.43
33.0
010
.00
32
Swed
en0.
510.
551.
7912
.66
10.0
02
2
Sca
ndin
avia
nori
gin
aver
age
0.30
0.57
2.42
%27
.26
10.0
02.
502.
00
Sam
ple
aver
age
(44
countr
ies)
0.44
0.59
3.79
%21
.59
6.85
2.44
2.30
6. Globalization and the growth of international stock exchanges 73
Empirical studies by LLSV and others support their proposition that a nation’s legal systeminfluences the optimal ownership structures of publicly listed companies, and that ownershipstructure “matters.” La Porta (1999) find that the size of a nation’s government is related toits efficiency, honesty (the legal system again), and the demographic make-up of its citizenry.LLSV (2002) document that countries with the greatest legal protection for investors alsoassign the highest valuation to publicly-traded shares. The clear implication of this find-ing is that individual investors are more willing to entrust their savings to capital marketinvestments when they are confident that their wealth will not be expropriated by insiders.Demirguc-Kunt and Maksimovic (1998) show that in countries whose legal systems scorehigh on an efficiency index, a greater proportion of firms use long-term external financing.Since their measure of efficiency is different from LLSV’s, the results are not a direct testof the LLSV hypothesis that common law countries offer better investor protection thancivil law countries (especially since France receives higher efficiency scores than Britain).Nonetheless, Demirguc-Kunt and Maksimovic document that an active stock market andlarge banking sector are associated with externally financed firm growth, and that companiesin countries with weak financial sectors are unable to fund maximum achievable growth.Finally, though Coffee (1999) takes issue with LLSV’s focus on the transcending importanceof a nation’s system of corporate law—he emphasizes differences in national securities lawsand regulations—he agrees that the commercial legal system is a vitally important part of aneffective corporate governance system.
The past three decades have witnessed a nearly incredible increase in the liquidity and effi-ciency of capital markets in the United States, Great Britain, Switzerland, and the Nether-lands. Most other countries have experienced far less dramatic growth in trading volumeand securities issuance volume (though capitalization has increased comparably). Not coin-cidentally, the four countries listed above all have large funded (private) pension systems andthe largest number of active institutional investors, especially pension funds. These investorsbring a number of active institutional investors, especially pension funds. These investorsbring a number of significant strengths to the market with them. They are sophisticatedfinancial analysts, they command significant (often vast) resources, and they have the cloutto demand that corporate managers perform effectively and attend to shareholders’ inter-ests. Countries wishing to develop an effective corporate governance system should bothencourage the growth of domestic institutional investors and attract participation by foreigninstitutions.
5. CONCLUSION
Recent financial history can be encapsulated in a phrase: the rise of global capital markets.Our research documents the following key points: (1) the fraction of total domestic credit
provided by the banking sector, as a percent of GDP, has increased only modestly since1990 for the world as a whole, as well as for most major country groupings. During the1990-2000 period, stock market capitalization as a percent of GDP increased from 48 to 105percent for the world as a whole, though it has declines by perhaps a third since then, and from52 to 121 percent for high income countries. (2) Share issue privatizations (SIPs) contributedsignificantly to the nearly eleven-fold increase, from $3.4 trillion to $35.0 trillion, in the totalcapitalization of the world’s stock markets that occurred between 1983 and 2000. Duringthat same period, the aggregate valuation of SIPs grew from less than $50 billion to over
74 William L. Megginson and Natalie L. Sutter
$3.3 trillion—about 13 percent of the world’s total, but over 27 percent of the non-U.S. total.Though the aggregate valuation of the world’s stock markets declined to about $18 trillionby year-end 2002, privatized firms have fared much better than other companies and theynow account for a significantly higher fraction of total non-U.S. market value (38.6 percentin May 2003) than in 2000. SIPs also played a significant role in the even more dramaticincrease in global stock market trading volume, from $1.23 trillion in 1983 to $33.1 trillion in2002. (3) Privatizations have significantly improved stock market liquidity during the last tenyears. On average, each additional privatization deal is associated with a 2.3 percent increaseover the first year and a 1.7 percent increase over the second year in the turnover ratio of therespective stock market.
From 1990 to 2000, stock markets all over the world increased in value (measured bothby market capitalization and trading volume, in absolute measures, and when standardizedby GDP) at an unprecedented rate. The large number of SIPs and the large number of newinvestors these privatizations bring to the market are largely responsible for this increase,especially in the developing markets. But following 2000, the world markets again fell intandem. There was no massive government takeovers of private firms, so what was thecause of this decline? It is a testament to the increasingly global nature of capital marketsand national economies. Recessions or economic downturns are no longer felt by only thecountry (and possibly its neighbors). They have become global events.
REFERENCES
Beck, Thorsten, Ross Levine, and Norman Loayza, “Finance and the Sources of Growth,” Journal of FinancialEconomics 58, pp. 261–300 (2000).
Bekaert, Geert and Campbell Harvey, “Foreign Speculators and Emerging Equity Markets,” Journal of Finance 55,pp. 565–613 (2000).
Boutchkova, Maria K. and William L. Megginson, “Privatization and the Rise of Global Capital Markets,” FinancialManagement 29, pp. 31–76 (2000).
Coffee, John C., Jr., “Privatization and Corporate Governance: The Lessons from Securities Market Failure,” Journalof Corporation Law 25, pp. 1–39 (1999).
Demirguc-Kunt, Asli and Vojislav Maksimovic, “Law, Finance, and Firm Growth,” Journal of Finance 53, pp. 2107–2137 (1998).
Henry, Peter Blair, “Do Stock Market Liberalizations Cause Investment Booms?” Journal of Financial Economics 58,pp. 301–334 (2000a).
Henry, Peter Blair, “Stock Market Liberalization, Economic Reform, and Emerging Market Equity Prices,” Journalof Finance 55, pp. 529–564 (2000b).
La Porta, Rafael, “The Quality of Government,” Journal of Law, Economics, and Organization 15, pp. 222–279 (1999).La Porta, Rafael, “Agency Problems and Dividend Policies around the World,” Journal of Finance 55, pp. 1–33
(2000).La Porta, Rafael, Florencio Lopez-de-Silanes, and Andrei Shleifer, “Corporate Ownership around the World,”
Journal of Finance 54, pp. 471–517 (1999).La Porta, Rafael, Florencio Lopez-de-Silanes, Andrei Shleifer, and Robert W. Vishny, “Legal Determinants of
External Finance,” Journal of Finance 52, pp. 1131–1150 (1997).La Porta, Rafael, Florencio Lopez-de-Silanes, Andrei Shleifer, and Robert W. Vishny, “Law and Finance,” Journal
of Political Economy 106, pp. 1113–1155 (1998).La Porta, Rafael, Florencio Lopez-de-Silanes, Andrei Shleifer, and Robert W. Vishny, “Investor Protection and
Corporate Governance,” Journal of Financial Economics 58, pp. 3–27 (2000).La Porta, Rafael, Florencio Lopez-de-Silanes, Andrei Shleifer, and Robert W. Vishny, “Investor Protection and
Corporate Valuation,” Journal of Finance 57, pp. 1147–1170 (2002).Levine, Ross, “Financial Development and Economic Growth: Views and Agenda,” Journal of Economic Literature
35, pp. 688–726 (1997).Levine, Ross and Sara Zervos, “Stock Markets, Banks, and Economic Growth,” American Economic Review 88,
pp. 537–558 (1998).

6. Globalization and the growth of international stock exchanges 75
Megginson, William L., Robert C. Nash, Jeffry M. Netter, and Annette B. Poulsen, “The Choice between Privateand Public Markets: Evidence from Privatization,” Journal of Finance (2004, forthcoming).
Rajan, Raghuram G. and Luigi Zingales, “Financial Dependence and Growth,” American Economic Review 88,pp. 559–586 (1998).
Subrahmanyam, Avanidhar and Sheridan Titman, “The Going Public Decision and the Development of FinancialMarkets,” Journal of Finance 54, pp. 1045–1082 (1998).
Wurgler, Jeffrey, “Financial Markets and the Allocation of Capital,” Journal of Financial Economics 58, pp. 187–214(2000).
7. GLOBALIZATION OF THE BOND AND STOCK MARKETS: THE JAPANESECASE—AN INTERNATIONAL PERSPECTIVE
IOANA ALEXOPOULOU, GABE DE BONDT, AND ADRIAN VAN RIXTEL1
1. INTRODUCTION
By almost any economic standard, the post-war economic development of Japan can becharacterised as a success. In particular during the second half of the eighties, this success gaverise to many publications which declared Japan the new economic and financial superpowerof the world (van Rixtel, 2002). Especially with respect to financial services, Japan wasincreasingly perceived as a threat, as its banks established important positions in overseasmarkets and the behaviour of Japanese investors could determine the success or failure ofsovereign paper auctions in many parts of the world (Burstein, 1988; Viner, 1988; Duser,1990). The globalization of Japanese finance started to become a topic of intense academicdiscussion. After the “first wave” of Japanese goods such as television sets and cars floodingforeign markets, a “second wave” of Japanese financial services and even a “third wave”consisting of the advance of Japanese financial conglomerates abroad were observed (Wrightand Pauli, 1987; van Rixtel, 1989).
However, with the economic and financial crisis that took hold of Japan during thepast 15 years or so, the financial globalization of Japan became less of an issue, as Japanesepolicymakers concentrated first and foremost on domestic issues. Possibly the major exceptionwas the introduction of the “Big Bang” deregulation package towards the end of the nineties,which incorporated certain reform measures aimed at improving the position of Tokyoas an international financial centre. As a result of the collapse of the “Bubble” economy,Japanese banks became saddled with huge amounts of non-performing loans and in effectmany retreated from overseas markets. The parallel fall in stock prices reduced significantlythe interest of foreign investors to invest in Japan. The turnabout in Japan’s economic and
78 Ioana Alexopoulou, Gabe de Bondt, and Adrian van Rixtel
especially its financial fortunes became reflected in a growing number of publications thatdoubted the “superpower” status of the Japanese financial system (Wood, 1993; Dattel, 1994;van Rixtel, 1997; Katz, 1998; Posen, 1998).
As history always takes its turn, the recent economic and financial stabilisation of Japanseems to have changed the strong inward focus of Japan’s policymakers, financial institutionsand markets during the crisis years to a somewhat more outward oriented look. In otherwords, there appears to be renewed interest in the globalization of the Japanese financialsystem and the position of Tokyo as an international centre of finance (Ministry of Finance,2003; Japan Center for International Finance, 2004). Therefore, in our view, it seems tobe the right moment to address the process of globalization in relation to Japan’s financialmarkets in both qualitative and quantitative terms.
Globalization has always been a topic of high interest to policy makers, economists, andacademics, but particularly in the past few years, it has been at the centre of heated debates(Stiglitz, 2002; Wolf, 2004). In our view, globalization can be defined as the expansionof domestic markets and activities into a world-wide system (Rutherford, 2002). Today,globalization means that increasingly economic activity takes place within world-wide mar-kets, often electronically. Globalization encompasses the internationalisation of products andservices by firms. It has enabled investments in financial markets to be carried out on aninternational basis and has come about as a result of major improvements in computer andtelecommunication technology and important deregulation processes. In general, it appearsthat countries that take advantage of free movements of goods and services, capital and labour,can thrive on aggregate activity. However, sound macroeconomic policies are necessary andconsequences for financial markets and financial stability need to be closely watched (Bordo,2002; Wolf, 2004). Not surprisingly, globalization, and particularly financial globalization,has received considerable attention from central bankers (Matsushita, 1996; Greenspan, 1998;Issing, 1997; Trichet, 2004).
This chapter focuses on the impact of globalization on the bond and stock markets, thetwo most important financial markets, from a predominant Japanese perspective. The caseof Japan is compared with that of the United States and Germany. These three industrialisedeconomies had the three most important floating exchange rates in the post-Bretton Woodsera. In addition, they are the three biggest economies and visible traders of the world (TheEconomist, 2004). For example, Japan, the United States and Germany together accountedfor around 30% of world exports in 2003.
We start with a selective review of globalization studies and follow with some key factsof financial globalization in Japan, followed by the United States and Germany. Our focus isparticularly on Japan, and consequently we discuss in much greater detail the globalizationof its financial markets. On the basis of a number of indicators, we show that, from a morestructural perspective, the globalization of the Japanese financial system has been stalled tosome extent in recent years. However, the empirical analysis based on the movement ofbond and stock market prices shows that the Japanese bond and stock markets have beensignificantly affected by globalization. The worldwide process of globalization of the bondand stock markets is for around 50% reflected in domestic developments in the Japanese bondand stock markets. The impact of globalization on financial markets in Japan is found to besomewhat less than in the United States and Germany. Our results suggest that globalizationhas particularly occurred directly after the collapse of the Bretton Woods system in the stock
7. Globalization of the Bond and Stock Markets 79
market and some time later in the bond market. These findings imply that globalization had,has and will have an impact on the most important financial asset prices not only in Japan,but in the US and Germany as well and thus on economic growth in these countries.
2. GLOBALIZATION STUDIES
This section describes a selective review of recent studies on financial market globalization.2
We describe the main findings of the literature examining the globalization of financialmarkets, in particular financial liberalisation and integration, and its impact on economicgrowth.
While ample evidence exists that financial liberalisation and integration positively affecteconomic growth, this relation is not in all cases robust (Klein and Olivei, 1999; Levine, 2001;Edison et al., 2002a and 2002b; McLean and Shrestha, 2002; Agenor, 2003; Kaminsky andSchmukler, 2003; Klein, 2003; Fratzscher and Bussiere, 2004). There is some evidence thatthe positive impact of globalization is conditional upon the existence of relatively developeddomestic financial institutions and a sound macroeconomic policy. For example, Bailliu(2000) finds evidence that capital inflows foster higher economic growth, above and beyondany effects on the investment rate, but only for industrialised economies where the bankingsector has reached a certain level of development. These results suggest that the domesticfinancial sector plays a pivotal role in ensuring that international capital flows do indeedpromote economic growth in developing countries. Also the open economy’s choice of themonetary regime might play a role (Obstfeld and Taylor, 2002).
From a historical perspective, Bordo and Murshid (2002) argue that financial market shockswere more globalised before 1914 compared to the present. Also Lothian (2002) concludesthat the globalization of financial markets is not a new phenomenon but that it began muchearlier and has continued, albeit with periodic interruptions and reversals, for many centuries.Goetzmann et al. (2001) show that international equity market correlation coefficients havechanged over time, with peaks in the late 19th century, the Great Depression, and the late20th century. Periods of free capital flows are associated with high correlations. Rousseauand Sylla (2001) show that the correlation between financial factors and economic growthwas the strongest over the 80 years preceding the Great Depression.
Transmission of financial crises or shocks as well as contagion in financial markets havealso taken a lot of attention in the academic literature (for an overview of the literature see:Hartman et al., 2003). With respect to Japan, Peek and Rosengren (1997) investigated theinternational transmission of financial shocks by assessing the impact of the sharp decline inJapanese stock prices during the nineties on the US economy, through its influence on USbranches of Japanese banks. They conclude that the contraction in Japanese bank lendingcaused by the decline in Japanese stock prices was transmitted internationally to the US, asUS branches of Japanese banks reduced lending at the time of declines in their parents’ capitalpositions. In another paper, Peek and Rosengren assess more specifically the impact of theJapanese banking crisis on economic activity in the US (Peek and Rosengren, 2000). Byidentifying the banking problems in Japan as an exogenous loan supply shock to the US, theyfind a clear negative effect on construction activity in major commercial real estate marketsin the US.
With respect to other investigations of the international transmission of financial shocksand contagion, Dungey et al. (2002) found that financial turbulence like the LTCM crisis
80 Ioana Alexopoulou, Gabe de Bondt, and Adrian van Rixtel
led to higher volatility in the developing markets. They also found that contagion effectsare widely distributed across both developed and developing countries. Peiro et al. (1998)examined the relationship between the New York, Tokyo and Frankfurt stock markets.They concluded that New York is the most influential stock market, in the sense of affectingthe other markets, and Tokyo is found to be the market the most sensitive to externaldevelopments. Kim and Rogers (1995) examined stock price spill-overs and the impact ofmarket liberalization measures between Korea, Japan and the United States. They confirmthat volatility spill-overs from developing to emerging markets are the most significant ones.King and Wadhwani (1990), in the same vein, showed that empirical evidence suggests thatan increase in volatility leads in turn to an increase in financial contagion. They confirmedthat after the October 1987 stock market crash, the correlation between various stock marketsincreased significantly. Finally, Domanski and Kremer (2000) employ the switching ARCHmethodology to investigate the co-movements between bond and stock market returns. Theyconclude that contagion leads to a significant increase in the cross-market correlation duringstates of financial market turmoil and hence, contagion differs from mere “interdependence”in the sense that it demands a stronger-than-normal market linkage during periods of highmarket volatility.
The remainder of this chapter differs in two markedly ways from previous studies. First,the globalization studies mentioned above typically analyse a large set of emerging and/orindustrialised countries. In contrast, our study focuses on the three major industrialisedcountries, i.e. the United States, Germany and Japan, with special attention to the latter. Weexclusively examine the interlinkages between three advanced economies with the world’sleading currency areas. Second, the direct impact of financial market globalization on eco-nomic growth is not examined. Instead, we concentrate on the impact of globalization onthe prices of the most important financial markets, i.e. the bond and stock markets. Thesefinancial asset prices, in turn, are known to affect economic growth. The period analysed isthe post-Bretton Woods era, which is the most relevant period for the current internationalfinancial system.
3. THE JAPANESE EXPERIENCE
This section describes the experience of Japan with financial globalization together with thatof the United States and Germany. To be able to understand Japan’s experience with financialglobalization in comparative perspective, this section starts with an analysis of the process offinancial reform in Japan.
3.1. Financial Reform and the Globalization of the Japanese Financial System
3.1.1. Financial Reform
Until the end of the sixties, the pace of financial reform in Japan was slow. From 1973,this changed by the transition to the floating exchange rate system and the rise of inflationthroughout the world. Furthermore, the first oil crisis that marked the end of the highgrowth period in Japan resulted in large issues of government bonds to finance the risingpublic borrowing requirements. The shift to lower economic growth and higher levels ofpublic debt, combined with the increasing accumulation of financial assets by individuals,the growth of internal reserves of Japanese companies and increasing monetary growth,
7. Globalization of the Bond and Stock Markets 81
raised the degree of interest rate sensitivity in the private non-financial sector (Suzuki, 1987;Eijffinger and van Rixtel, 1992; van Rixtel, 2002). Furthermore, the Japanese financialstructure changed slowly but steadily, as the dependence of non-financial firms on bankborrowing was reduced, and other sources of corporate finance such as internal financeand direct finance became more important (Calder, 1993; Horiuchi, 1996). As regards thelatter, this implied a development towards corporate financing through the money and capitalmarkets, in particular the Eurobond markets, in which the issuance conditions for Japanesecompanies were significantly less restrictive than in Japan itself.3 Furthermore, the shift tothe floating exchange rate system stimulated the globalization of finance and resulted in asubstantial increase of international capital flows. Finally, the rapid progress of computer andinformation technology resulted in lower costs of financial innovations and higher profitopportunities for financial institutions.
The process of financial reform resulted in a gradual decrease of the degree of regulationof the Japanese financial system. The traditional segmentation of the activities of financialinstitutions became increasingly blurred, as banks and securities companies started to operatemore and more on each other’s business territories. Furthermore, the city and major regionalbanks diverted their operations towards smaller- and medium-sized companies, forcing thesmaller banks and credit co-operatives to look for new business opportunities, as will beexplained in the next section. Also the traditional segmentation between short- and long-term lending by respectively commercial banks and long-term financial institutions wasin practice not followed anymore. All in all, the Japanese financial system started to moveslowly but steadily towards a universal banking system. In addition, the regulatory authoritiesembarked on a carefully orchestrated path of abolition of interest rate controls, and alsothe regulation of the entry of financial markets was gradually lifted. Finally, the degreeof international openness of the Japanese financial system was improved, and internationalcapital could move easier in and out of Japan.
This process of financial reform, thus starting towards the end of the seventies and stillongoing, has been of the utmost importance for the globalization of the Japanese financialsystem. Due to the abolition of foreign exchange regulations, capital could flow in and out ofthe country more easily and swiftly, a process that was further aided by the lifting of interestrate controls. Further financial liberalisation measures made Japanese financial markets moreattractive for foreign financial institutions and investors.
3.1.2. Globalization
In the context of this chapter, the most important aspect of the financial reform process wasthe globalization of the Japanese financial system, in other words the gradual but increasingdevelopment of international financial relations of Japan with the rest of the world, includingthe opening of national financial markets to non-residents. Under financial globalization,Japanese financial markets have become more and more integrated with world markets, andboth Japanese financial institutions and corporations can now freely choose among variousnational financial systems to conduct their financial transactions. In Japan, in particular theenactment of a new Foreign Exchange and Foreign Trade Control Law in December 1980,which provided freedom of international transactions unless explicitly prohibited (freedomin principle), promoted this process. However, the new law failed to liberalise completelyinternational financial transactions, as broad discretion was given to the ministries to introduce
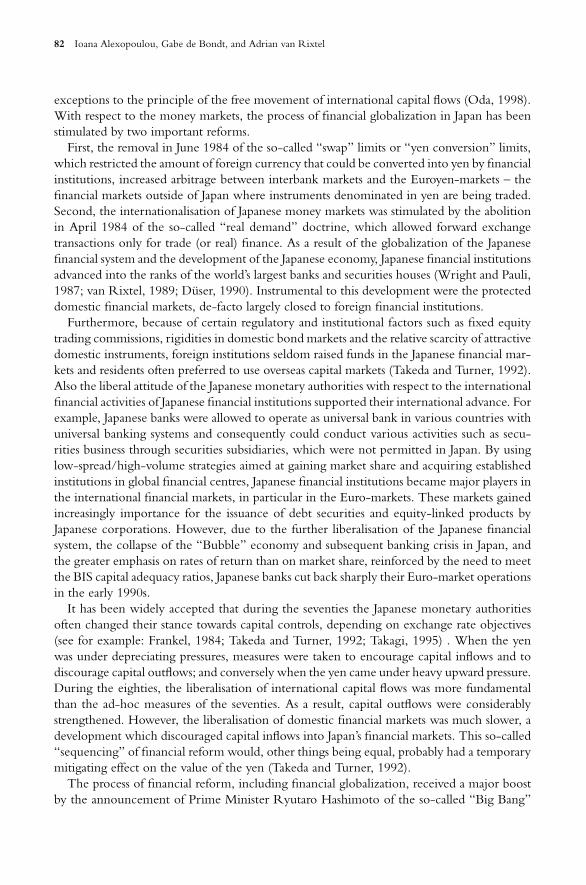
82 Ioana Alexopoulou, Gabe de Bondt, and Adrian van Rixtel
exceptions to the principle of the free movement of international capital flows (Oda, 1998).With respect to the money markets, the process of financial globalization in Japan has beenstimulated by two important reforms.
First, the removal in June 1984 of the so-called “swap” limits or “yen conversion” limits,which restricted the amount of foreign currency that could be converted into yen by financialinstitutions, increased arbitrage between interbank markets and the Euroyen-markets – thefinancial markets outside of Japan where instruments denominated in yen are being traded.Second, the internationalisation of Japanese money markets was stimulated by the abolitionin April 1984 of the so-called “real demand” doctrine, which allowed forward exchangetransactions only for trade (or real) finance. As a result of the globalization of the Japanesefinancial system and the development of the Japanese economy, Japanese financial institutionsadvanced into the ranks of the world’s largest banks and securities houses (Wright and Pauli,1987; van Rixtel, 1989; Duser, 1990). Instrumental to this development were the protecteddomestic financial markets, de-facto largely closed to foreign financial institutions.
Furthermore, because of certain regulatory and institutional factors such as fixed equitytrading commissions, rigidities in domestic bond markets and the relative scarcity of attractivedomestic instruments, foreign institutions seldom raised funds in the Japanese financial mar-kets and residents often preferred to use overseas capital markets (Takeda and Turner, 1992).Also the liberal attitude of the Japanese monetary authorities with respect to the internationalfinancial activities of Japanese financial institutions supported their international advance. Forexample, Japanese banks were allowed to operate as universal bank in various countries withuniversal banking systems and consequently could conduct various activities such as secu-rities business through securities subsidiaries, which were not permitted in Japan. By usinglow-spread/high-volume strategies aimed at gaining market share and acquiring establishedinstitutions in global financial centres, Japanese financial institutions became major players inthe international financial markets, in particular in the Euro-markets. These markets gainedincreasingly importance for the issuance of debt securities and equity-linked products byJapanese corporations. However, due to the further liberalisation of the Japanese financialsystem, the collapse of the “Bubble” economy and subsequent banking crisis in Japan, andthe greater emphasis on rates of return than on market share, reinforced by the need to meetthe BIS capital adequacy ratios, Japanese banks cut back sharply their Euro-market operationsin the early 1990s.
It has been widely accepted that during the seventies the Japanese monetary authoritiesoften changed their stance towards capital controls, depending on exchange rate objectives(see for example: Frankel, 1984; Takeda and Turner, 1992; Takagi, 1995) . When the yenwas under depreciating pressures, measures were taken to encourage capital inflows and todiscourage capital outflows; and conversely when the yen came under heavy upward pressure.During the eighties, the liberalisation of international capital flows was more fundamentalthan the ad-hoc measures of the seventies. As a result, capital outflows were considerablystrengthened. However, the liberalisation of domestic financial markets was much slower, adevelopment which discouraged capital inflows into Japan’s financial markets. This so-called“sequencing” of financial reform would, other things being equal, probably had a temporarymitigating effect on the value of the yen (Takeda and Turner, 1992).
The process of financial reform, including financial globalization, received a major boostby the announcement of Prime Minister Ryutaro Hashimoto of the so-called “Big Bang”
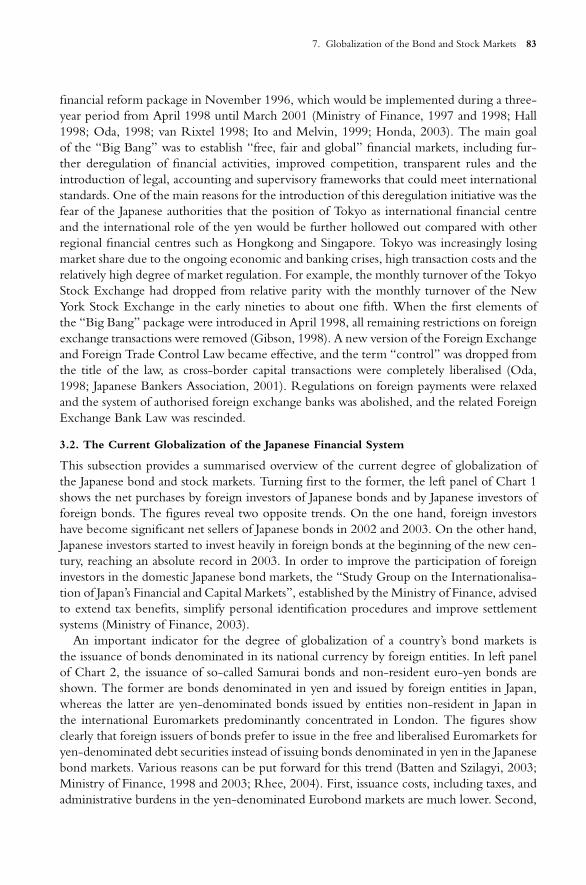
7. Globalization of the Bond and Stock Markets 83
financial reform package in November 1996, which would be implemented during a three-year period from April 1998 until March 2001 (Ministry of Finance, 1997 and 1998; Hall1998; Oda, 1998; van Rixtel 1998; Ito and Melvin, 1999; Honda, 2003). The main goalof the “Big Bang” was to establish “free, fair and global” financial markets, including fur-ther deregulation of financial activities, improved competition, transparent rules and theintroduction of legal, accounting and supervisory frameworks that could meet internationalstandards. One of the main reasons for the introduction of this deregulation initiative was thefear of the Japanese authorities that the position of Tokyo as international financial centreand the international role of the yen would be further hollowed out compared with otherregional financial centres such as Hongkong and Singapore. Tokyo was increasingly losingmarket share due to the ongoing economic and banking crises, high transaction costs and therelatively high degree of market regulation. For example, the monthly turnover of the TokyoStock Exchange had dropped from relative parity with the monthly turnover of the NewYork Stock Exchange in the early nineties to about one fifth. When the first elements ofthe “Big Bang” package were introduced in April 1998, all remaining restrictions on foreignexchange transactions were removed (Gibson, 1998). A new version of the Foreign Exchangeand Foreign Trade Control Law became effective, and the term “control” was dropped fromthe title of the law, as cross-border capital transactions were completely liberalised (Oda,1998; Japanese Bankers Association, 2001). Regulations on foreign payments were relaxedand the system of authorised foreign exchange banks was abolished, and the related ForeignExchange Bank Law was rescinded.
3.2. The Current Globalization of the Japanese Financial System
This subsection provides a summarised overview of the current degree of globalization ofthe Japanese bond and stock markets. Turning first to the former, the left panel of Chart 1shows the net purchases by foreign investors of Japanese bonds and by Japanese investors offoreign bonds. The figures reveal two opposite trends. On the one hand, foreign investorshave become significant net sellers of Japanese bonds in 2002 and 2003. On the other hand,Japanese investors started to invest heavily in foreign bonds at the beginning of the new cen-tury, reaching an absolute record in 2003. In order to improve the participation of foreigninvestors in the domestic Japanese bond markets, the “Study Group on the Internationalisa-tion of Japan’s Financial and Capital Markets”, established by the Ministry of Finance, advisedto extend tax benefits, simplify personal identification procedures and improve settlementsystems (Ministry of Finance, 2003).
An important indicator for the degree of globalization of a country’s bond markets isthe issuance of bonds denominated in its national currency by foreign entities. In left panelof Chart 2, the issuance of so-called Samurai bonds and non-resident euro-yen bonds areshown. The former are bonds denominated in yen and issued by foreign entities in Japan,whereas the latter are yen-denominated bonds issued by entities non-resident in Japan inthe international Euromarkets predominantly concentrated in London. The figures showclearly that foreign issuers of bonds prefer to issue in the free and liberalised Euromarkets foryen-denominated debt securities instead of issuing bonds denominated in yen in the Japanesebond markets. Various reasons can be put forward for this trend (Batten and Szilagyi, 2003;Ministry of Finance, 1998 and 2003; Rhee, 2004). First, issuance costs, including taxes, andadministrative burdens in the yen-denominated Eurobond markets are much lower. Second,
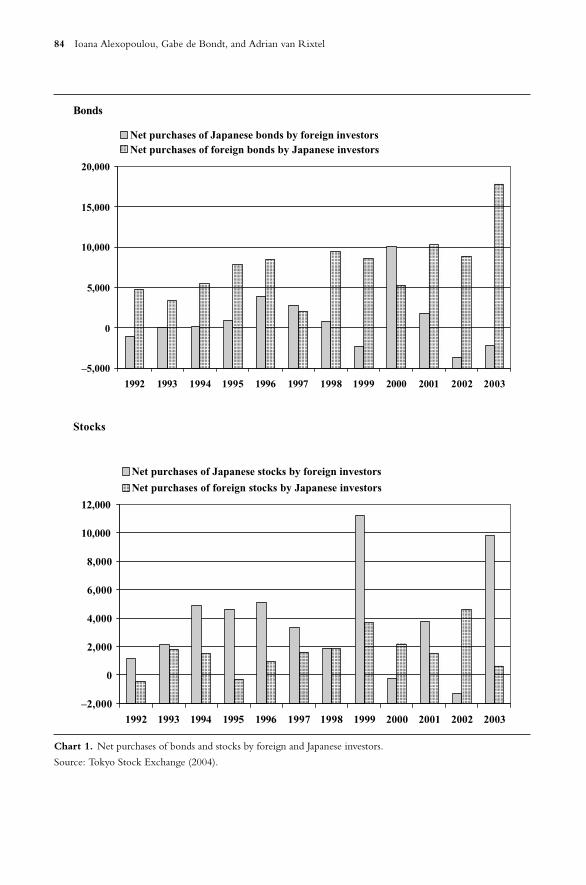
84 Ioana Alexopoulou, Gabe de Bondt, and Adrian van Rixtel
Bonds
–5,000
0
5,000
10,000
15,000
20,000
1992 1993 1994 1995 1996 1997 1998 1999 2000 2001 2002 2003
Net purchases of Japanese bonds by foreign investorsNet purchases of foreign bonds by Japanese investors
Stocks
–2,000
0
2,000
4,000
6,000
8,000
10,000
12,000
1992 1993 1994 1995 1996 1997 1998 1999 2000 2001 2002 2003
Net purchases of Japanese stocks by foreign investors
Net purchases of foreign stocks by Japanese investors
Chart 1. Net purchases of bonds and stocks by foreign and Japanese investors.
Source: Tokyo Stock Exchange (2004).
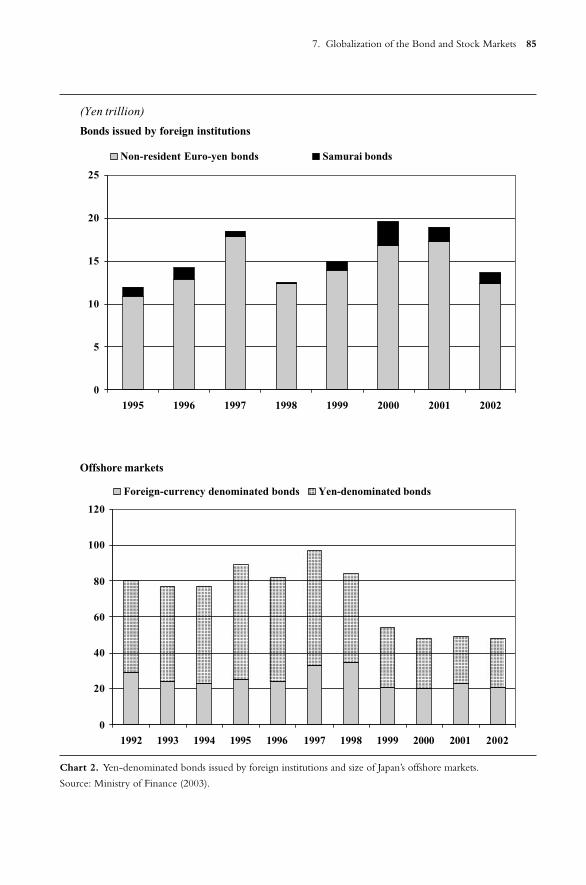
7. Globalization of the Bond and Stock Markets 85
(Yen trillion)
Bonds issued by foreign institutions
0
5
10
15
20
25
1995 1996 1997 1998 1999 2000 2001 2002
Non-resident Euro-yen bonds Samurai bonds
Offshore markets
0
20
40
60
80
100
120
1992 1993 1994 1995 1996 1997 1998 1999 2000 2001 2002
Foreign-currency denominated bonds Yen-denominated bonds
Chart 2. Yen-denominated bonds issued by foreign institutions and size of Japan’s offshore markets.
Source: Ministry of Finance (2003).
86 Ioana Alexopoulou, Gabe de Bondt, and Adrian van Rixtel
these markets offer much greater flexibility in issuance terms and conditions than the domesticJapanese bond markets. Third, clearing and settlement procedures are much more flexible inthe Eurobond markets; in general, their institutional infrastructure is superior compared withthat of the Japanese markets. Finally, the Japanese bond markets suffer from an insufficientinternationalisation of the yen and a lack of participation by foreign institutions. A largenumber of proposals to revitalize the fund procurement function of the Samurai markethave been made recently (see the various studies mentioned above). Some improvementsimplemented in 2003 related to the work of the “Study Group on the Internationalisationof Japan’s Financial and Capital Markets” and included the lifting of the requirement oflisting at a Japanese stock exchange and the permission for foreign issuers to participate inthe private-placement market in Japan (Ministry of Finance, 2003).
Regarding other aspects of the globalization of financial markets, the right panel of Chart 2provides an overview of the development of bond market activity related to Japan’s OffshoreMarket ( JOM), established in December 1986. The rise or decline of offshore markets is aninteresting indicator to assess the degree of globalization of domestic financial markets, as inprinciple these markets are among the most liberalised and free financial markets for foreignparticipants in a particular financial system. It is rather clear that Japan’s offshore markets havenot been an unequivocal success: in 2002, the amounts outstanding of both foreign currencyand yen denominated bonds in these markets were around half of their peaks achieved in1997. Turning to the stock market, the left panel of Chart 3 shows that the number offoreign companies listed at the Tokyo Stock Exchange has significantly and consistentlydropped over the past eight years. Both in the absolute number of foreign companies listedin 2003 and decline in foreign listings since 1996, Tokyo is by far the worst performer.In terms of newly listed foreign companies, Japan ranks also considerably below one of itsmain Asian competitors, i.e. Singapore. Regarding the role of the Japanese stock market as asource of corporate finance in terms of the total amount of funds procured by all listed firms(including Japanese and foreign) both as initial public offerings (IPO’s) and secondary publicofferings (SPO’s), it has remained generally in fifth place in the world since the mid-nineties(Ministry of Finance, 2003).
The right panel of Chart 1 provides an overview of the net purchases of Japanese stocks byforeign investors and of foreign stocks by Japanese investors. It is shown that in both 2000 and2002, foreign investors were net sellers of Japanese stocks. It is clear that with the uncertaintyabout the development of the Japanese economy and the resolution of the banking crisis,the volatility of net purchases of Japanese equity by foreign investors increased considerably.The “Study Group on the Internationalisation of Japan’s Financial and Capital Markets” hasmade several recommendations, including strengthening the co-operation between Japaneseand foreign stock exchanges and extending trading hours, in order to promote non-residentinvestment in the Japanese stock market (Ministry of Finance, 2003). The net purchasesof foreign stocks by Japanese investors increased steadily from the mid-nineties onwards,reaching record figures in 2002, but then fell sharply in 2003. This could possibly be explainedpartly by the enhanced prospects of recovery of the Japanese economy and stabilisation ofthe banking problems.
For reference purposes, the right panel of Chart 3 shows stock market capitalisation as apercentage of GDP in Japan, the United States and Germany. The figures for Japan clearlyshow the rise and collapse of the “Bubble” in the second of the eighties and first half of
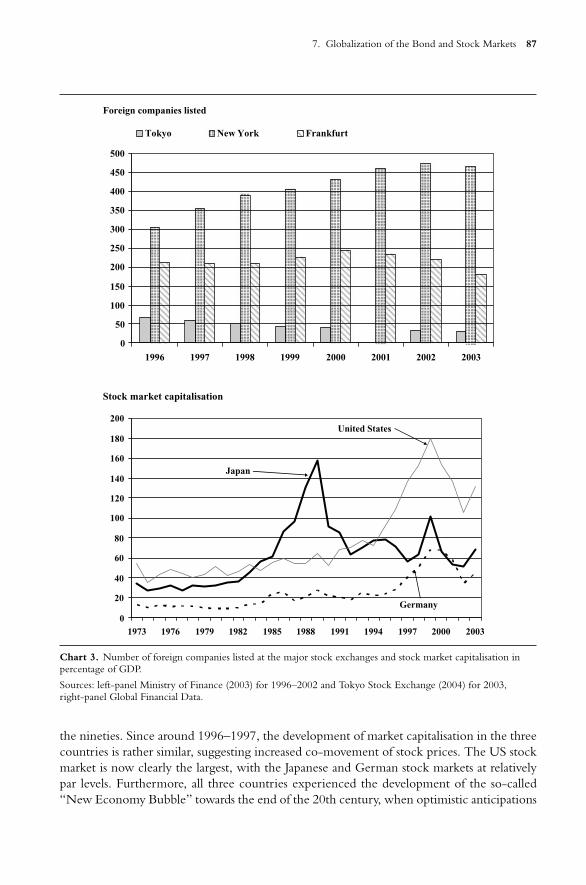
7. Globalization of the Bond and Stock Markets 87
0
50
100
150
200
250
300
350
400
450
500
Foreign companies listed
1996 1997 1998 1999 2000 2001 2002 2003
Tokyo New York Frankfurt
Stock market capitalisation
0
20
40
60
80
100
120
140
160
180
200
1973 1976 1979 1982 1985 1988 1991 1994 1997 2000 2003
Japan
United States
Germany
Chart 3. Number of foreign companies listed at the major stock exchanges and stock market capitalisation inpercentage of GDP.
Sources: left-panel Ministry of Finance (2003) for 1996–2002 and Tokyo Stock Exchange (2004) for 2003,right-panel Global Financial Data.
the nineties. Since around 1996–1997, the development of market capitalisation in the threecountries is rather similar, suggesting increased co-movement of stock prices. The US stockmarket is now clearly the largest, with the Japanese and German stock markets at relativelypar levels. Furthermore, all three countries experienced the development of the so-called“New Economy Bubble” towards the end of the 20th century, when optimistic anticipations
88 Ioana Alexopoulou, Gabe de Bondt, and Adrian van Rixtel
of big rewards being made possible by technological developments such as the Internet andE-commerce drove stock prices to very high levels.
Finally, the degree of globalization of a financial system can be measured by the devel-opment of the number of participating foreign financial institutions and of the number ofdomestic firms which have physical presence in overseas financial markets. The left panelof Chart 4 indicates that, with the only exception of insurance companies, there has beena trend of a diminishing presence of foreign financial firms in Japan since the mid-nineties,particular of foreign banks and securities firms. Around the announcement and subsequentintroduction of the first elements of the “Big Bang” financial reform package in 1996–1998,there was a slight increase or stabilisation in the number of foreign financial institutions inJapan, as it raised expectations of improved business opportunities and possible greater marketshares (see: Harner, 2000). A number of foreign firms established business tie-ups or allianceswith Japanese financial institutions and some foreign banks (re)listed at the Tokyo StockExchange. A major success-story was the takeover of the failed Long-Term Credit Bank ofJapan by a consortium led by Ripplewood Holdings from the USA in March 2000 into thenew Shinsei Bank (see Tett, 2004). Furthermore, foreign financial institutions managed toestablish obtain a solid position in the Japanese life insurance market: the number of foreignlife insurance companies increased from 6 in 1995 to 18 in 2002, and their market sharegrew from 13% in 1992 to 34% in 2001 (Ministry of Finance, 2003). For the rest, however, itlooks like a considerable number of foreign financial firms reached the conclusion that it wasmore profitable to withdraw from Japanese financial markets and that more has to be donebefore Tokyo’s position as an international financial centre is truly attractive. This assessmentis shared by the conclusions of a recent questionnaire conducted by the Japan Center forInternational Finance ( JCIF) among foreign financial institutions operating in Japan. Themain conclusion was that respondents “. . . appreciate the direction of the reforms, but feelthat the degree of liberalisation and internationalisation is inadequate, and that the progressof the reforms is too slow” ( JCIF, 2004). Thus, to a considerable extent and in spite of somemoderate improvements, this assessment is still in line with conclusions reached in similarquestionnaires conducted by the JCIF respectively 16 and 20 years ago ( JCIF, 1988 and1984). Also the conclusion of MoF’s “Study Group on the Internationalisation of Japan’sFinancial and Capital Markets” is rather clear: “. . . It cannot be denied that the status ofJapan as an international financial centre has been declining in recent years” (Ministry ofFinance, 2003; see also Reszat, 2003).
Finally, the right panel of Chart 4 shows the presence of Japanese banks abroad. For allthree categories of overseas presence, i.e. foreign branches, representative offices and offices,there has been a substantial decline. This was mainly due to severe rationalisation measures,implemented in light of the banking crisis in Japan. These measures were often compulsory inorder to obtain public financial support. All in all, the figures point at a significant withdrawalof Japanese banks from overseas markets.
3.3. Financial Globalization in a Comparative Perspective
Table 1 provides a summary overview in comparative terms of the main financial liberalisationmeasures with respect to the capital account and the stock market in Japan, the United States,and Germany. Broadly speaking, capital account restrictions were in place in these countriesin the (early) 1970s, but, in comparison, stock markets were more liberalised in general.
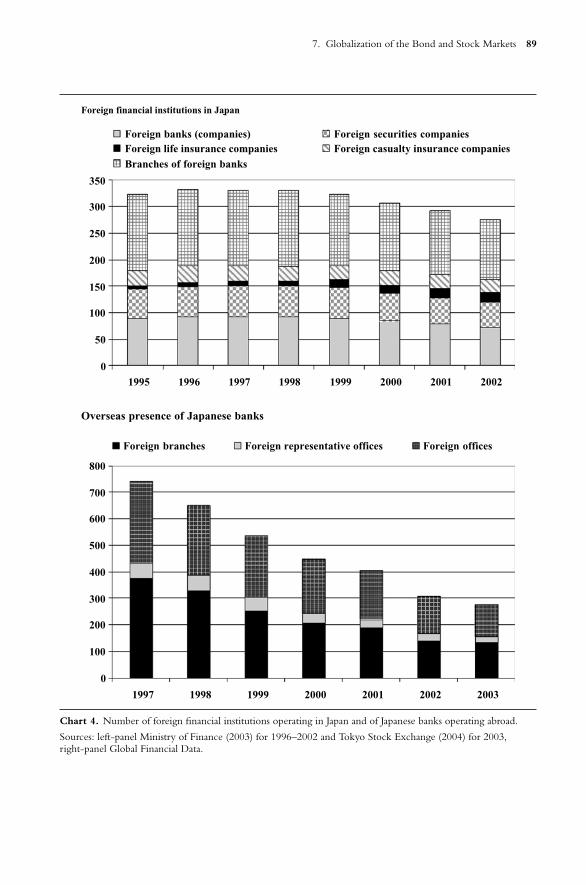
7. Globalization of the Bond and Stock Markets 89
0
50
100
150
200
250
300
350
1995 1996 1997 1998 1999 2000 2001 2002
Foreign banks (companies) Foreign securities companiesForeign life insurance companies Foreign casualty insurance companies
Branches of foreign banks
Overseas presence of Japanese banks
0
100
200
300
400
500
600
700
800
1997 1998 1999 2000 2001 2002 2003
Foreign branches Foreign representative offices Foreign offices
Foreign financial institutions in Japan
Chart 4. Number of foreign financial institutions operating in Japan and of Japanese banks operating abroad.
Sources: left-panel Ministry of Finance (2003) for 1996–2002 and Tokyo Stock Exchange (2004) for 2003,right-panel Global Financial Data.
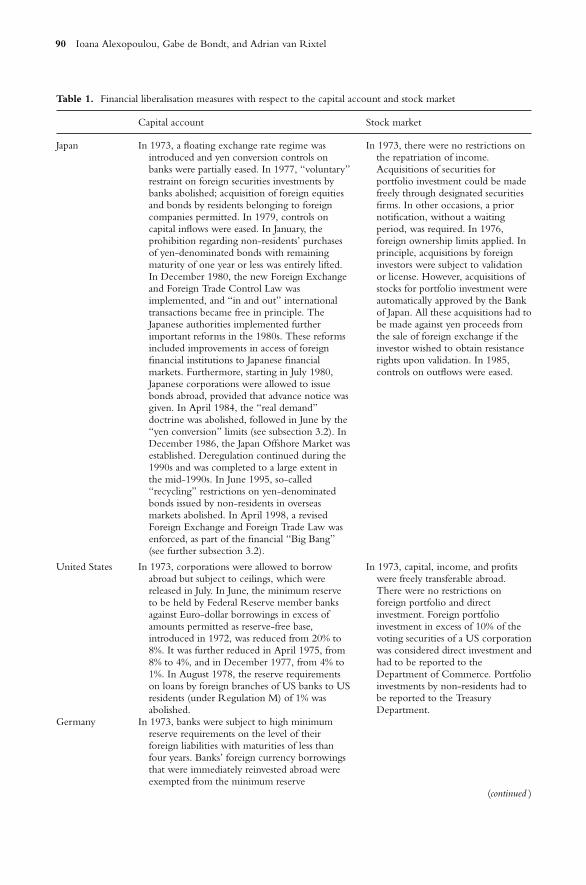
90 Ioana Alexopoulou, Gabe de Bondt, and Adrian van Rixtel
Table 1. Financial liberalisation measures with respect to the capital account and stock market
Capital account Stock market
Japan In 1973, a floating exchange rate regime wasintroduced and yen conversion controls onbanks were partially eased. In 1977, “voluntary”restraint on foreign securities investments bybanks abolished; acquisition of foreign equitiesand bonds by residents belonging to foreigncompanies permitted. In 1979, controls oncapital inflows were eased. In January, theprohibition regarding non-residents’ purchasesof yen-denominated bonds with remainingmaturity of one year or less was entirely lifted.In December 1980, the new Foreign Exchangeand Foreign Trade Control Law wasimplemented, and “in and out” internationaltransactions became free in principle. TheJapanese authorities implemented furtherimportant reforms in the 1980s. These reformsincluded improvements in access of foreignfinancial institutions to Japanese financialmarkets. Furthermore, starting in July 1980,Japanese corporations were allowed to issuebonds abroad, provided that advance notice wasgiven. In April 1984, the “real demand”doctrine was abolished, followed in June by the“yen conversion” limits (see subsection 3.2). InDecember 1986, the Japan Offshore Market wasestablished. Deregulation continued during the1990s and was completed to a large extent inthe mid-1990s. In June 1995, so-called“recycling” restrictions on yen-denominatedbonds issued by non-residents in overseasmarkets abolished. In April 1998, a revisedForeign Exchange and Foreign Trade Law wasenforced, as part of the financial “Big Bang”(see further subsection 3.2).
In 1973, there were no restrictions onthe repatriation of income.Acquisitions of securities forportfolio investment could be madefreely through designated securitiesfirms. In other occasions, a priornotification, without a waitingperiod, was required. In 1976,foreign ownership limits applied. Inprinciple, acquisitions by foreigninvestors were subject to validationor license. However, acquisitions ofstocks for portfolio investment wereautomatically approved by the Bankof Japan. All these acquisitions had tobe made against yen proceeds fromthe sale of foreign exchange if theinvestor wished to obtain resistancerights upon validation. In 1985,controls on outflows were eased.
United States In 1973, corporations were allowed to borrowabroad but subject to ceilings, which werereleased in July. In June, the minimum reserveto be held by Federal Reserve member banksagainst Euro-dollar borrowings in excess ofamounts permitted as reserve-free base,introduced in 1972, was reduced from 20% to8%. It was further reduced in April 1975, from8% to 4%, and in December 1977, from 4% to1%. In August 1978, the reserve requirementson loans by foreign branches of US banks to USresidents (under Regulation M) of 1% wasabolished.
In 1973, capital, income, and profitswere freely transferable abroad.There were no restrictions onforeign portfolio and directinvestment. Foreign portfolioinvestment in excess of 10% of thevoting securities of a US corporationwas considered direct investment andhad to be reported to theDepartment of Commerce. Portfolioinvestments by non-residents had tobe reported to the TreasuryDepartment.
Germany In 1973, banks were subject to high minimumreserve requirements on the level of theirforeign liabilities with maturities of less thanfour years. Banks’ foreign currency borrowingsthat were immediately reinvested abroad wereexempted from the minimum reserve
(continued )
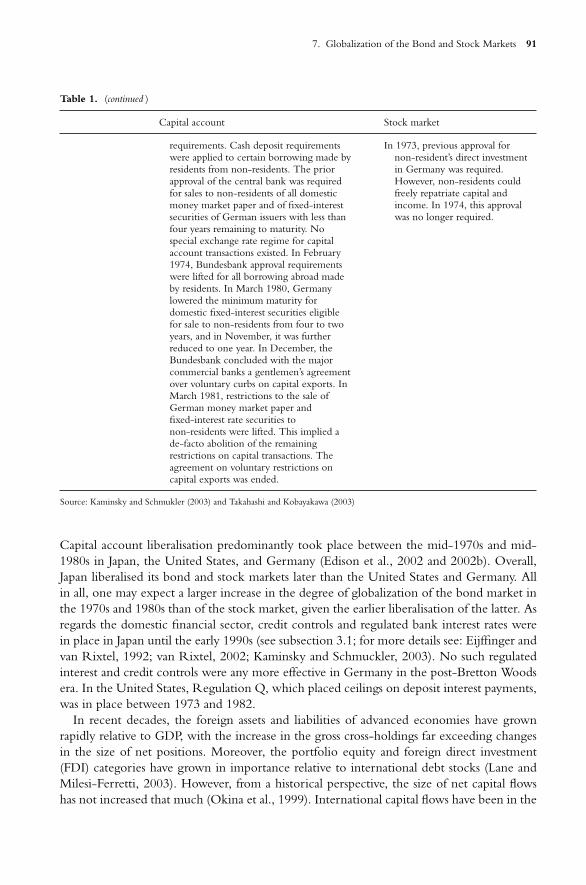
7. Globalization of the Bond and Stock Markets 91
Table 1. (continued )
Capital account Stock market
requirements. Cash deposit requirementswere applied to certain borrowing made byresidents from non-residents. The priorapproval of the central bank was requiredfor sales to non-residents of all domesticmoney market paper and of fixed-interestsecurities of German issuers with less thanfour years remaining to maturity. Nospecial exchange rate regime for capitalaccount transactions existed. In February1974, Bundesbank approval requirementswere lifted for all borrowing abroad madeby residents. In March 1980, Germanylowered the minimum maturity fordomestic fixed-interest securities eligiblefor sale to non-residents from four to twoyears, and in November, it was furtherreduced to one year. In December, theBundesbank concluded with the majorcommercial banks a gentlemen’s agreementover voluntary curbs on capital exports. InMarch 1981, restrictions to the sale ofGerman money market paper andfixed-interest rate securities tonon-residents were lifted. This implied ade-facto abolition of the remainingrestrictions on capital transactions. Theagreement on voluntary restrictions oncapital exports was ended.
In 1973, previous approval fornon-resident’s direct investmentin Germany was required.However, non-residents couldfreely repatriate capital andincome. In 1974, this approvalwas no longer required.
Source: Kaminsky and Schmukler (2003) and Takahashi and Kobayakawa (2003)
Capital account liberalisation predominantly took place between the mid-1970s and mid-1980s in Japan, the United States, and Germany (Edison et al., 2002 and 2002b). Overall,Japan liberalised its bond and stock markets later than the United States and Germany. Allin all, one may expect a larger increase in the degree of globalization of the bond market inthe 1970s and 1980s than of the stock market, given the earlier liberalisation of the latter. Asregards the domestic financial sector, credit controls and regulated bank interest rates werein place in Japan until the early 1990s (see subsection 3.1; for more details see: Eijffinger andvan Rixtel, 1992; van Rixtel, 2002; Kaminsky and Schmuckler, 2003). No such regulatedinterest and credit controls were any more effective in Germany in the post-Bretton Woodsera. In the United States, Regulation Q, which placed ceilings on deposit interest payments,was in place between 1973 and 1982.
In recent decades, the foreign assets and liabilities of advanced economies have grownrapidly relative to GDP, with the increase in the gross cross-holdings far exceeding changesin the size of net positions. Moreover, the portfolio equity and foreign direct investment(FDI) categories have grown in importance relative to international debt stocks (Lane andMilesi-Ferretti, 2003). However, from a historical perspective, the size of net capital flowshas not increased that much (Okina et al., 1999). International capital flows have been in the
92 Ioana Alexopoulou, Gabe de Bondt, and Adrian van Rixtel
post Bretton-Woods era even at lower levels than before World War I, at least as measuredby the current account balances of twelve countries in terms of GDP (Bordo et al., 1998).
The nature of international capital flows has, however, dramatically changed. Nowadays,capital flows predominantly relate to the industrial and services private sectors, whereas beforeWorld War I, it was the public sector or state guaranteed firms such as railroads and miningcompanies, i.e. entities with tangible and therefore relatively transparent assets. Furthermore,before World War I, international capital flows were predominantly related to bonds, whereasnow the balance between bonds and equity is around fifty-fifty. While trade liberalisationhas continued for a longer period, more dramatic changes have occurred in recent years inthe financial sphere (Greenspan, 1998). World financial markets undoubtedly are far moreefficient today than ever before. Advances in communication and information technologyhave allowed the development of new financial instruments and risk-management techniques,enabling today a wider range of financial and non-financial firms to manage their financialrisks more effectively.
4. EMPIRICAL ANALYSIS
This section presents an empirical analysis of the globalization of the bond and stock markets.The case of Japan is compared with the experiences of the United States and Germany. Theexchange rates of these three industrialised economies have formed the world’s main currencyareas after the collapse of the Bretton Woods system, i.e., the Japanese yen, the US dollar,and the D-Mark (later replaced by the euro). We look at both government bond yields andstock market returns, i.e. the first moment of the most important asset prices, as well as atbond and stock market volatility, i.e. the second moments of bond and stock prices.
4.1. Bond and Stock Market Prices
4.1.1. Principal Component Analysis
Inspired by Fase and Vlaar (1998) and Bordo and Murshid (2002), our globalization measuresfor bond and stock market prices are based on so-called principal component analyses.Principal component analysis transforms a set of correlated series into a smaller subset ofuncorrelated series, each describing a common factor of the original series. This is donein a manner that aims to capture most of the variation in the data. For the three countriesconsidered here, i.e. Japan, the United States and Germany, three principal components canbe extracted. These principal components are ordered by the fraction of the total variancethat they explain. The first principal component represents the best possible one-dimensionalimage of the multidimensional space of the three original country series. The explanatorypower of the first principal component will be larger, the closer the correlations betweenthe original series, or the more strongly they reflect the same feature. Hence, the fraction ofthe variance that can be attributed to the first principal component provides a good measureof the overall degree of co-movement in the data. In our case, the first principal componentis interpreted as a measure for financial globalization.
The principal components can be based on both the correlation matrix and the covariancematrix. In our analysis, the former will be applied, as all series are weighted equally. Animportant condition for the use of this technique is that the original series are statisticallystationary. As this is the case only for changes in bond and stock market prices, we examine
7. Globalization of the Bond and Stock Markets 93
the monthly change in the long-term government bond yield and the monthly growth rateof the total stock market return index, i.e. the monthly stock market return.
The sample period for bond and stock market prices starts in 1967 since ten-year govern-ment bond yields are not available before for Germany and Japan. In fact, we use for Japanthe seven-year government bond yield between 1967 and 1971. This period starts just beforethe collapse of the Bretton Woods system, formally in 1973 and de-facto in 1971 after the“Nixon shock”. Our sample period broadly matches with the second wave of globalizationas argued by Baldwin and Martin (1999) and Bordo and Murshid (2002). They define twowaves of globalization: the pre-World War I classical gold standard era of 1820/1880–1914and the post-Bretton Woods era.
4.1.2. Bond Market Prices
Applying a principal component analysis to the changes in the ten-year government bondyields in Japan, the United States and Germany, the first principal component captures 58% ofthe total variation in these three country series. Much of the co-movement in the changes inlong-term government bond yields during our sample can be attributed to the first principalcomponent, which we have labelled as our globalization measure. However, there is stilla significant degree of unexplained co-movement, which is captured by the “non-global”principal components two and three. These other two principal components explain eacharound 20% of the total variation in the monthly change in the government bond yieldsof the three countries considered. The implicit country weights corresponding to the firstprincipal component are 0.52 for Japan and around 0.6 for the United States and Germany.These values suggest that Japan is around 20% less important for globalization than the UnitedStates and Germany, which are found to be equally important for our globalization measure.One should, however, be aware that end-of-month data are used, implying that this principalcomponent analysis does not take into account daily and weekly responses of national bondyields to global developments.
Has globalization (increasingly) affected the pricing in the bond markets of the threecountries considered? Given the fact that globalization is not a one-off event, but an ongoingprocess, we estimate the impact of the first principal component, excluding the weight ofthe country considered, by using ever larger subsets of the sample data. Our first sample startsin January 1967 and ends in January 1973, the year of the collapse of the Bretton Woodssystem. We then subsequently add one additional observation to the data set to compute theglobalization impact on the long-term government bond yield considered. We repeat thisprocess until we have used all observations up to March 2004 (see Chart 5).
Two observations emerge from the chart. First, globalization has a significant impact onbond market prices. The level of the effect of globalization on the bond market pricing isnowadays in Japan lower (0.3) than in Germany (0.4) and the United States (0.7). Accordingto our results, the US bond market operates the most globally. Second, a significant rise in theglobalization impact is observed around the early 1980s in all three countries. This findingsuggests a regime switch around this time, in line with a sharp reduction of capital restrictionsaround 1980, for example in Japan with the adoption of a new Foreign Exchange and ForeignTrade Control Law in December 1980 (see Section 3). In Japan, the globalization impactcontinued to slightly increase in the 1980s and 1990s and seems to have come to an end atthe beginning of the new century. This would be in line with the finalisation of the major
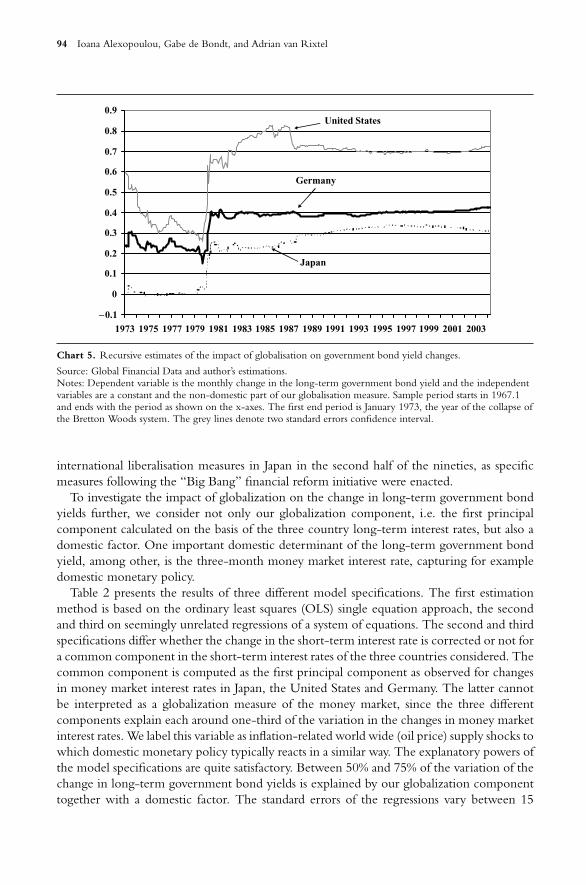
94 Ioana Alexopoulou, Gabe de Bondt, and Adrian van Rixtel
–0.1
0
0.1
0.2
0.3
0.4
0.5
0.6
0.7
0.8
0.9
1973 1975 1977 1979 1981 1983 1985 1987 1989 1991 1993 1995 1997 1999 2001 2003
United States
Germany
Japan
Chart 5. Recursive estimates of the impact of globalisation on government bond yield changes.
Source: Global Financial Data and author’s estimations.Notes: Dependent variable is the monthly change in the long-term government bond yield and the independentvariables are a constant and the non-domestic part of our globalisation measure. Sample period starts in 1967.1and ends with the period as shown on the x-axes. The first end period is January 1973, the year of the collapse ofthe Bretton Woods system. The grey lines denote two standard errors confidence interval.
international liberalisation measures in Japan in the second half of the nineties, as specificmeasures following the “Big Bang” financial reform initiative were enacted.
To investigate the impact of globalization on the change in long-term government bondyields further, we consider not only our globalization component, i.e. the first principalcomponent calculated on the basis of the three country long-term interest rates, but also adomestic factor. One important domestic determinant of the long-term government bondyield, among other, is the three-month money market interest rate, capturing for exampledomestic monetary policy.
Table 2 presents the results of three different model specifications. The first estimationmethod is based on the ordinary least squares (OLS) single equation approach, the secondand third on seemingly unrelated regressions of a system of equations. The second and thirdspecifications differ whether the change in the short-term interest rate is corrected or not fora common component in the short-term interest rates of the three countries considered. Thecommon component is computed as the first principal component as observed for changesin money market interest rates in Japan, the United States and Germany. The latter cannotbe interpreted as a globalization measure of the money market, since the three differentcomponents explain each around one-third of the variation in the changes in money marketinterest rates. We label this variable as inflation-related world wide (oil price) supply shocks towhich domestic monetary policy typically reacts in a similar way. The explanatory powers ofthe model specifications are quite satisfactory. Between 50% and 75% of the variation of thechange in long-term government bond yields is explained by our globalization componenttogether with a domestic factor. The standard errors of the regressions vary between 15
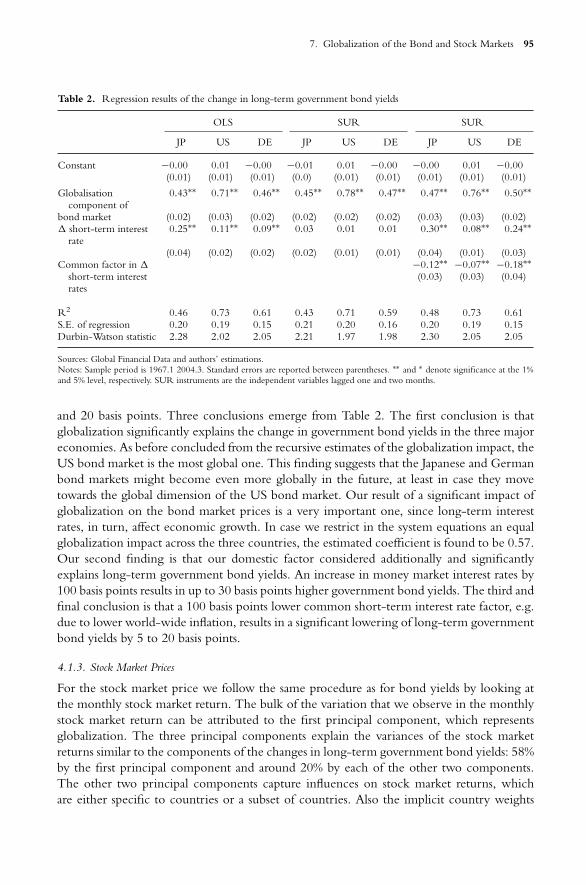
7. Globalization of the Bond and Stock Markets 95
Table 2. Regression results of the change in long-term government bond yields
OLS SUR SUR
JP US DE JP US DE JP US DE
Constant −0.00 0.01 −0.00 −0.01 0.01 −0.00 −0.00 0.01 −0.00(0.01) (0.01) (0.01) (0.0) (0.01) (0.01) (0.01) (0.01) (0.01)
Globalisation 0.43∗∗ 0.71∗∗ 0.46∗∗ 0.45∗∗ 0.78∗∗ 0.47∗∗ 0.47∗∗ 0.76∗∗ 0.50∗∗component of
bond market (0.02) (0.03) (0.02) (0.02) (0.02) (0.02) (0.03) (0.03) (0.02)� short-term interest 0.25∗∗ 0.11∗∗ 0.09∗∗ 0.03 0.01 0.01 0.30∗∗ 0.08∗∗ 0.24∗∗
rate(0.04) (0.02) (0.02) (0.02) (0.01) (0.01) (0.04) (0.01) (0.03)
Common factor in � −0.12∗∗ −0.07∗∗ −0.18∗∗short-term interest (0.03) (0.03) (0.04)rates
R2 0.46 0.73 0.61 0.43 0.71 0.59 0.48 0.73 0.61S.E. of regression 0.20 0.19 0.15 0.21 0.20 0.16 0.20 0.19 0.15Durbin-Watson statistic 2.28 2.02 2.05 2.21 1.97 1.98 2.30 2.05 2.05
Sources: Global Financial Data and authors’ estimations.Notes: Sample period is 1967.1 2004.3. Standard errors are reported between parentheses. ∗∗ and ∗ denote significance at the 1%and 5% level, respectively. SUR instruments are the independent variables lagged one and two months.
and 20 basis points. Three conclusions emerge from Table 2. The first conclusion is thatglobalization significantly explains the change in government bond yields in the three majoreconomies. As before concluded from the recursive estimates of the globalization impact, theUS bond market is the most global one. This finding suggests that the Japanese and Germanbond markets might become even more globally in the future, at least in case they movetowards the global dimension of the US bond market. Our result of a significant impact ofglobalization on the bond market prices is a very important one, since long-term interestrates, in turn, affect economic growth. In case we restrict in the system equations an equalglobalization impact across the three countries, the estimated coefficient is found to be 0.57.Our second finding is that our domestic factor considered additionally and significantlyexplains long-term government bond yields. An increase in money market interest rates by100 basis points results in up to 30 basis points higher government bond yields. The third andfinal conclusion is that a 100 basis points lower common short-term interest rate factor, e.g.due to lower world-wide inflation, results in a significant lowering of long-term governmentbond yields by 5 to 20 basis points.
4.1.3. Stock Market Prices
For the stock market price we follow the same procedure as for bond yields by looking atthe monthly stock market return. The bulk of the variation that we observe in the monthlystock market return can be attributed to the first principal component, which representsglobalization. The three principal components explain the variances of the stock marketreturns similar to the components of the changes in long-term government bond yields: 58%by the first principal component and around 20% by each of the other two components.The other two principal components capture influences on stock market returns, whichare either specific to countries or a subset of countries. Also the implicit country weights
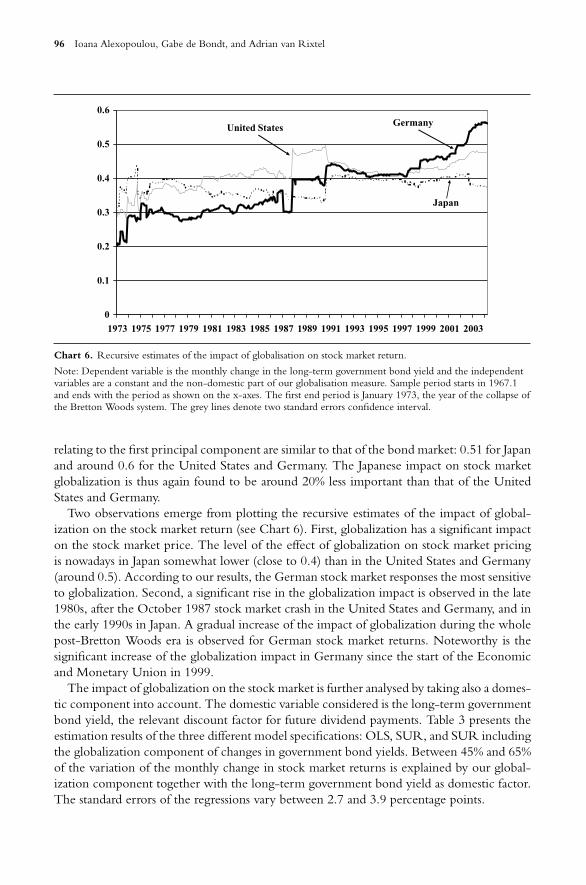
96 Ioana Alexopoulou, Gabe de Bondt, and Adrian van Rixtel
0
0.1
0.2
0.3
0.4
0.5
0.6
1973 1975 1977 1979 1981 1983 1985 1987 1989 1991 1993 1995 1997 1999 2001 2003
Japan
GermanyUnited States
Chart 6. Recursive estimates of the impact of globalisation on stock market return.
Note: Dependent variable is the monthly change in the long-term government bond yield and the independentvariables are a constant and the non-domestic part of our globalisation measure. Sample period starts in 1967.1and ends with the period as shown on the x-axes. The first end period is January 1973, the year of the collapse ofthe Bretton Woods system. The grey lines denote two standard errors confidence interval.
relating to the first principal component are similar to that of the bond market: 0.51 for Japanand around 0.6 for the United States and Germany. The Japanese impact on stock marketglobalization is thus again found to be around 20% less important than that of the UnitedStates and Germany.
Two observations emerge from plotting the recursive estimates of the impact of global-ization on the stock market return (see Chart 6). First, globalization has a significant impacton the stock market price. The level of the effect of globalization on stock market pricingis nowadays in Japan somewhat lower (close to 0.4) than in the United States and Germany(around 0.5). According to our results, the German stock market responses the most sensitiveto globalization. Second, a significant rise in the globalization impact is observed in the late1980s, after the October 1987 stock market crash in the United States and Germany, and inthe early 1990s in Japan. A gradual increase of the impact of globalization during the wholepost-Bretton Woods era is observed for German stock market returns. Noteworthy is thesignificant increase of the globalization impact in Germany since the start of the Economicand Monetary Union in 1999.
The impact of globalization on the stock market is further analysed by taking also a domes-tic component into account. The domestic variable considered is the long-term governmentbond yield, the relevant discount factor for future dividend payments. Table 3 presents theestimation results of the three different model specifications: OLS, SUR, and SUR includingthe globalization component of changes in government bond yields. Between 45% and 65%of the variation of the monthly change in stock market returns is explained by our global-ization component together with the long-term government bond yield as domestic factor.The standard errors of the regressions vary between 2.7 and 3.9 percentage points.
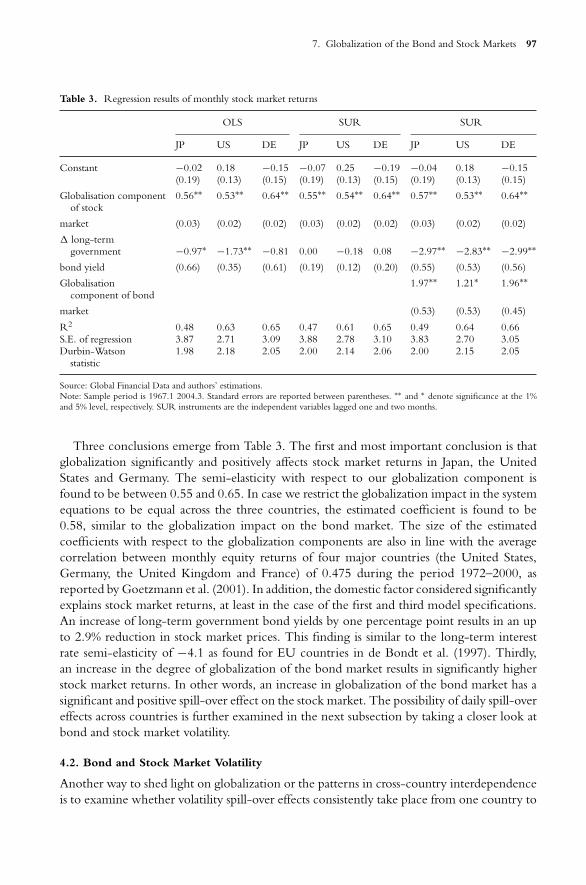
7. Globalization of the Bond and Stock Markets 97
Table 3. Regression results of monthly stock market returns
OLS SUR SUR
JP US DE JP US DE JP US DE
Constant −0.02 0.18 −0.15 −0.07 0.25 −0.19 −0.04 0.18 −0.15(0.19) (0.13) (0.15) (0.19) (0.13) (0.15) (0.19) (0.13) (0.15)
Globalisation component 0.56∗∗ 0.53∗∗ 0.64∗∗ 0.55∗∗ 0.54∗∗ 0.64∗∗ 0.57∗∗ 0.53∗∗ 0.64∗∗of stock
market (0.03) (0.02) (0.02) (0.03) (0.02) (0.02) (0.03) (0.02) (0.02)
� long-termgovernment −0.97∗ −1.73∗∗ −0.81 0.00 −0.18 0.08 −2.97∗∗ −2.83∗∗ −2.99∗∗
bond yield (0.66) (0.35) (0.61) (0.19) (0.12) (0.20) (0.55) (0.53) (0.56)
Globalisation 1.97∗∗ 1.21∗ 1.96∗∗component of bond
market (0.53) (0.53) (0.45)
R2 0.48 0.63 0.65 0.47 0.61 0.65 0.49 0.64 0.66S.E. of regression 3.87 2.71 3.09 3.88 2.78 3.10 3.83 2.70 3.05Durbin-Watson 1.98 2.18 2.05 2.00 2.14 2.06 2.00 2.15 2.05
statistic
Source: Global Financial Data and authors’ estimations.Note: Sample period is 1967.1 2004.3. Standard errors are reported between parentheses. ∗∗ and ∗ denote significance at the 1%and 5% level, respectively. SUR instruments are the independent variables lagged one and two months.
Three conclusions emerge from Table 3. The first and most important conclusion is thatglobalization significantly and positively affects stock market returns in Japan, the UnitedStates and Germany. The semi-elasticity with respect to our globalization component isfound to be between 0.55 and 0.65. In case we restrict the globalization impact in the systemequations to be equal across the three countries, the estimated coefficient is found to be0.58, similar to the globalization impact on the bond market. The size of the estimatedcoefficients with respect to the globalization components are also in line with the averagecorrelation between monthly equity returns of four major countries (the United States,Germany, the United Kingdom and France) of 0.475 during the period 1972–2000, asreported by Goetzmann et al. (2001). In addition, the domestic factor considered significantlyexplains stock market returns, at least in the case of the first and third model specifications.An increase of long-term government bond yields by one percentage point results in an upto 2.9% reduction in stock market prices. This finding is similar to the long-term interestrate semi-elasticity of −4.1 as found for EU countries in de Bondt et al. (1997). Thirdly,an increase in the degree of globalization of the bond market results in significantly higherstock market returns. In other words, an increase in globalization of the bond market has asignificant and positive spill-over effect on the stock market. The possibility of daily spill-overeffects across countries is further examined in the next subsection by taking a closer look atbond and stock market volatility.
4.2. Bond and Stock Market Volatility
Another way to shed light on globalization or the patterns in cross-country interdependenceis to examine whether volatility spill-over effects consistently take place from one country to
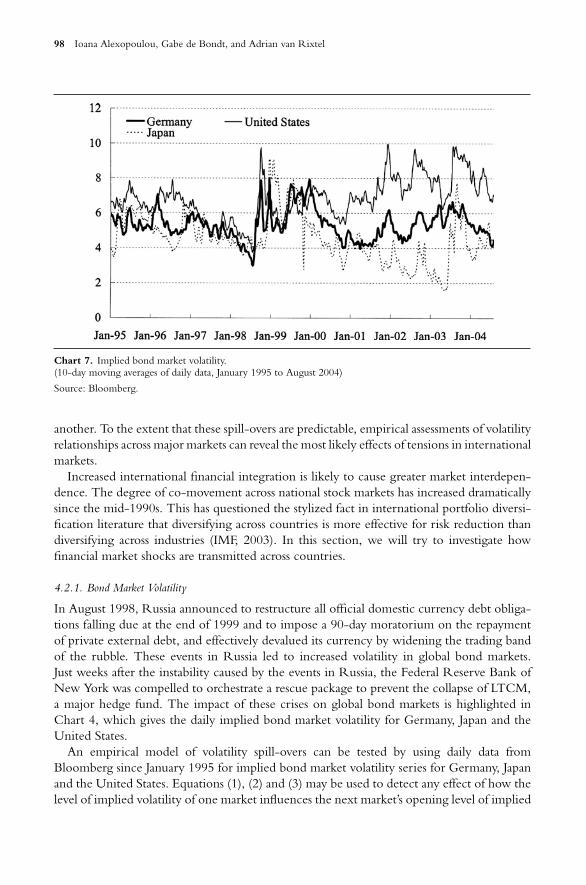
98 Ioana Alexopoulou, Gabe de Bondt, and Adrian van Rixtel
Chart 7. Implied bond market volatility.(10-day moving averages of daily data, January 1995 to August 2004)
Source: Bloomberg.
another. To the extent that these spill-overs are predictable, empirical assessments of volatilityrelationships across major markets can reveal the most likely effects of tensions in internationalmarkets.
Increased international financial integration is likely to cause greater market interdepen-dence. The degree of co-movement across national stock markets has increased dramaticallysince the mid-1990s. This has questioned the stylized fact in international portfolio diversi-fication literature that diversifying across countries is more effective for risk reduction thandiversifying across industries (IMF, 2003). In this section, we will try to investigate howfinancial market shocks are transmitted across countries.
4.2.1. Bond Market Volatility
In August 1998, Russia announced to restructure all official domestic currency debt obliga-tions falling due at the end of 1999 and to impose a 90-day moratorium on the repaymentof private external debt, and effectively devalued its currency by widening the trading bandof the rubble. These events in Russia led to increased volatility in global bond markets.Just weeks after the instability caused by the events in Russia, the Federal Reserve Bank ofNew York was compelled to orchestrate a rescue package to prevent the collapse of LTCM,a major hedge fund. The impact of these crises on global bond markets is highlighted inChart 4, which gives the daily implied bond market volatility for Germany, Japan and theUnited States.
An empirical model of volatility spill-overs can be tested by using daily data fromBloomberg since January 1995 for implied bond market volatility series for Germany, Japanand the United States. Equations (1), (2) and (3) may be used to detect any effect of how thelevel of implied volatility of one market influences the next market’s opening level of implied
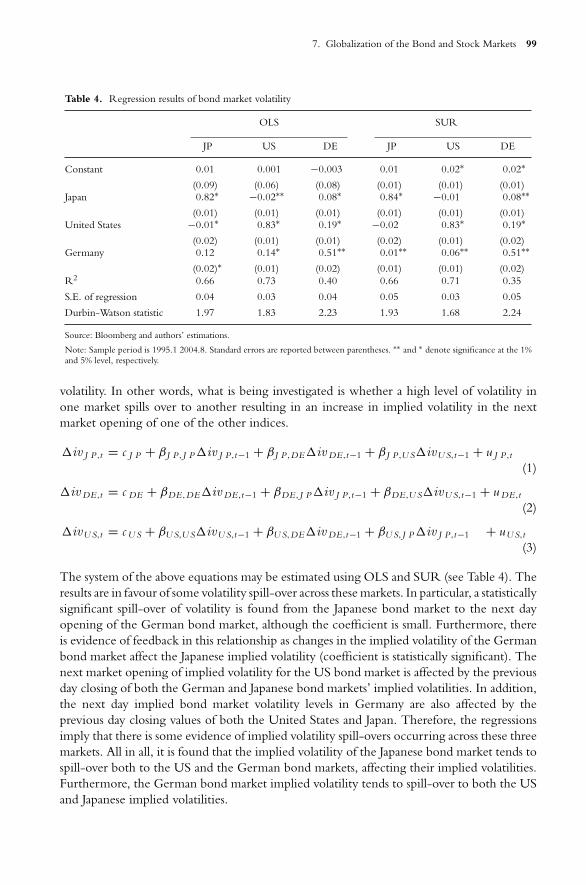
7. Globalization of the Bond and Stock Markets 99
Table 4. Regression results of bond market volatility
OLS SUR
JP US DE JP US DE
Constant 0.01 0.001 −0.003 0.01 0.02∗ 0.02∗
(0.09) (0.06) (0.08) (0.01) (0.01) (0.01)Japan 0.82∗ −0.02∗∗ 0.08∗ 0.84∗ −0.01 0.08∗∗
(0.01) (0.01) (0.01) (0.01) (0.01) (0.01)United States −0.01∗ 0.83∗ 0.19∗ −0.02 0.83∗ 0.19∗
(0.02) (0.01) (0.01) (0.02) (0.01) (0.02)Germany 0.12 0.14∗ 0.51∗∗ 0.01∗∗ 0.06∗∗ 0.51∗∗
(0.02)∗ (0.01) (0.02) (0.01) (0.01) (0.02)R2 0.66 0.73 0.40 0.66 0.71 0.35
S.E. of regression 0.04 0.03 0.04 0.05 0.03 0.05
Durbin-Watson statistic 1.97 1.83 2.23 1.93 1.68 2.24
Source: Bloomberg and authors’ estimations.
Note: Sample period is 1995.1 2004.8. Standard errors are reported between parentheses. ∗∗ and ∗ denote significance at the 1%and 5% level, respectively.
volatility. In other words, what is being investigated is whether a high level of volatility inone market spills over to another resulting in an increase in implied volatility in the nextmarket opening of one of the other indices.
�iv J P ,t = c J P + β J P , J P �iv J P ,t−1 + β J P ,DE�iv DE,t−1 + β J P ,U S�ivU S,t−1 + u J P ,t
(1)
�iv DE,t = c DE + βDE,DE�iv DE,t−1 + βDE, J P �iv J P ,t−1 + βDE,U S�ivU S,t−1 + u DE,t
(2)
�ivU S,t = c U S + βU S,U S�ivU S,t−1 + βU S,DE�iv DE,t−1 + βU S, J P �iv J P ,t−1 + uU S,t
(3)
The system of the above equations may be estimated using OLS and SUR (see Table 4). Theresults are in favour of some volatility spill-over across these markets. In particular, a statisticallysignificant spill-over of volatility is found from the Japanese bond market to the next dayopening of the German bond market, although the coefficient is small. Furthermore, thereis evidence of feedback in this relationship as changes in the implied volatility of the Germanbond market affect the Japanese implied volatility (coefficient is statistically significant). Thenext market opening of implied volatility for the US bond market is affected by the previousday closing of both the German and Japanese bond markets’ implied volatilities. In addition,the next day implied bond market volatility levels in Germany are also affected by theprevious day closing values of both the United States and Japan. Therefore, the regressionsimply that there is some evidence of implied volatility spill-overs occurring across these threemarkets. All in all, it is found that the implied volatility of the Japanese bond market tends tospill-over both to the US and the German bond markets, affecting their implied volatilities.Furthermore, the German bond market implied volatility tends to spill-over to both the USand Japanese implied volatilities.
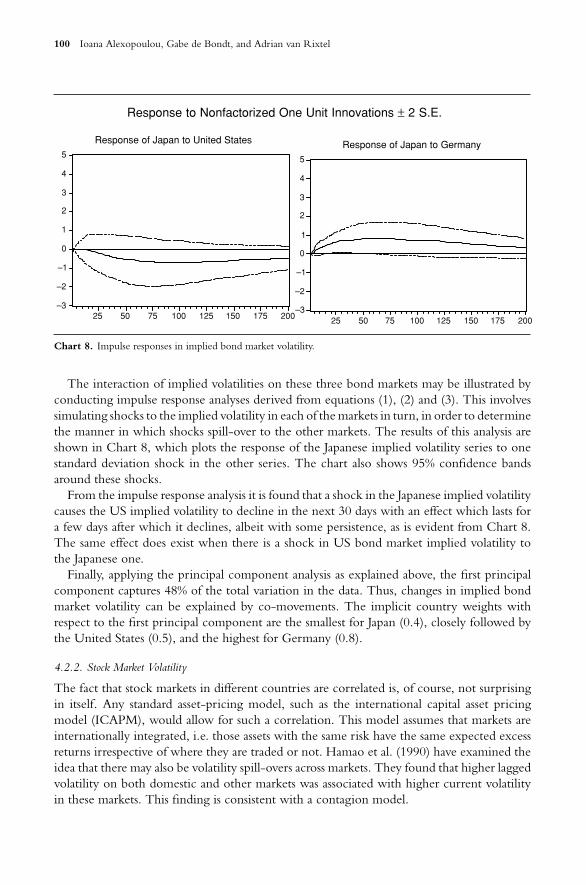
100 Ioana Alexopoulou, Gabe de Bondt, and Adrian van Rixtel
–3
–2
–1
0
1
2
3
4
5
25 50 75 100 125 150 175 200
Response of Japan to Germany
–3
–2
–1
0
1
2
3
4
5
25 50 75 100 125 150 175 200
Response of Japan to United States
Response to Nonfactorized One Unit Innovations ± 2 S.E.
Chart 8. Impulse responses in implied bond market volatility.
The interaction of implied volatilities on these three bond markets may be illustrated byconducting impulse response analyses derived from equations (1), (2) and (3). This involvessimulating shocks to the implied volatility in each of the markets in turn, in order to determinethe manner in which shocks spill-over to the other markets. The results of this analysis areshown in Chart 8, which plots the response of the Japanese implied volatility series to onestandard deviation shock in the other series. The chart also shows 95% confidence bandsaround these shocks.
From the impulse response analysis it is found that a shock in the Japanese implied volatilitycauses the US implied volatility to decline in the next 30 days with an effect which lasts fora few days after which it declines, albeit with some persistence, as is evident from Chart 8.The same effect does exist when there is a shock in US bond market implied volatility tothe Japanese one.
Finally, applying the principal component analysis as explained above, the first principalcomponent captures 48% of the total variation in the data. Thus, changes in implied bondmarket volatility can be explained by co-movements. The implicit country weights withrespect to the first principal component are the smallest for Japan (0.4), closely followed bythe United States (0.5), and the highest for Germany (0.8).
4.2.2. Stock Market Volatility
The fact that stock markets in different countries are correlated is, of course, not surprisingin itself. Any standard asset-pricing model, such as the international capital asset pricingmodel (ICAPM), would allow for such a correlation. This model assumes that markets areinternationally integrated, i.e. those assets with the same risk have the same expected excessreturns irrespective of where they are traded or not. Hamao et al. (1990) have examined theidea that there may also be volatility spill-overs across markets. They found that higher laggedvolatility on both domestic and other markets was associated with higher current volatilityin these markets. This finding is consistent with a contagion model.
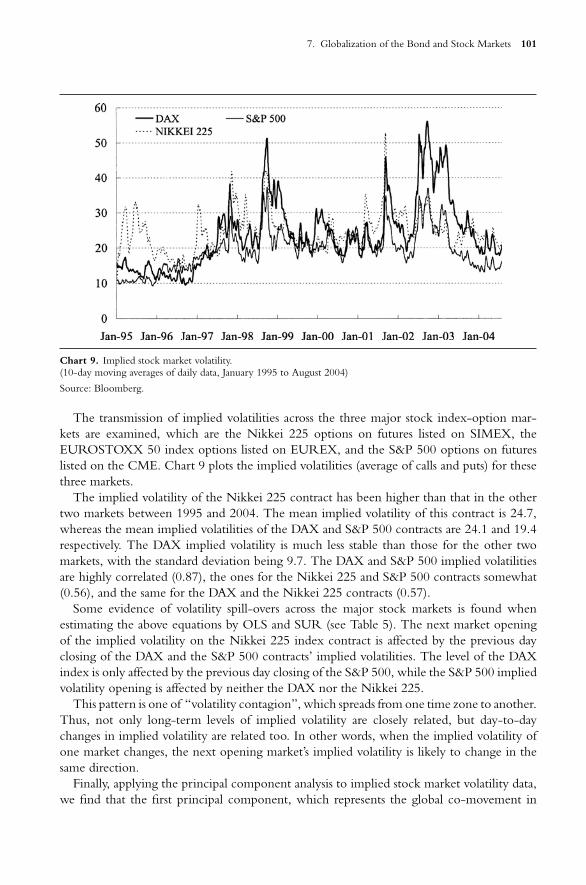
7. Globalization of the Bond and Stock Markets 101
Chart 9. Implied stock market volatility.(10-day moving averages of daily data, January 1995 to August 2004)
Source: Bloomberg.
The transmission of implied volatilities across the three major stock index-option mar-kets are examined, which are the Nikkei 225 options on futures listed on SIMEX, theEUROSTOXX 50 index options listed on EUREX, and the S&P 500 options on futureslisted on the CME. Chart 9 plots the implied volatilities (average of calls and puts) for thesethree markets.
The implied volatility of the Nikkei 225 contract has been higher than that in the othertwo markets between 1995 and 2004. The mean implied volatility of this contract is 24.7,whereas the mean implied volatilities of the DAX and S&P 500 contracts are 24.1 and 19.4respectively. The DAX implied volatility is much less stable than those for the other twomarkets, with the standard deviation being 9.7. The DAX and S&P 500 implied volatilitiesare highly correlated (0.87), the ones for the Nikkei 225 and S&P 500 contracts somewhat(0.56), and the same for the DAX and the Nikkei 225 contracts (0.57).
Some evidence of volatility spill-overs across the major stock markets is found whenestimating the above equations by OLS and SUR (see Table 5). The next market openingof the implied volatility on the Nikkei 225 index contract is affected by the previous dayclosing of the DAX and the S&P 500 contracts’ implied volatilities. The level of the DAXindex is only affected by the previous day closing of the S&P 500, while the S&P 500 impliedvolatility opening is affected by neither the DAX nor the Nikkei 225.
This pattern is one of “volatility contagion”, which spreads from one time zone to another.Thus, not only long-term levels of implied volatility are closely related, but day-to-daychanges in implied volatility are related too. In other words, when the implied volatility ofone market changes, the next opening market’s implied volatility is likely to change in thesame direction.
Finally, applying the principal component analysis to implied stock market volatility data,we find that the first principal component, which represents the global co-movement in
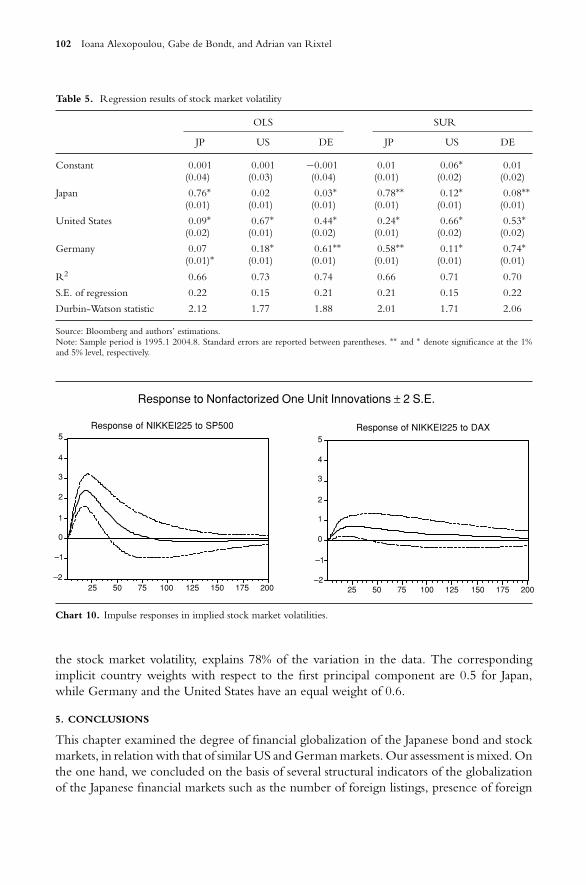
102 Ioana Alexopoulou, Gabe de Bondt, and Adrian van Rixtel
Table 5. Regression results of stock market volatility
OLS SUR
JP US DE JP US DE
Constant 0.001 0.001 −0.001 0.01 0.06∗ 0.01(0.04) (0.03) (0.04) (0.01) (0.02) (0.02)
Japan 0.76∗ 0.02 0.03∗ 0.78∗∗ 0.12∗ 0.08∗∗(0.01) (0.01) (0.01) (0.01) (0.01) (0.01)
United States 0.09∗ 0.67∗ 0.44∗ 0.24∗ 0.66∗ 0.53∗(0.02) (0.01) (0.02) (0.01) (0.02) (0.02)
Germany 0.07 0.18∗ 0.61∗∗ 0.58∗∗ 0.11∗ 0.74∗(0.01)∗ (0.01) (0.01) (0.01) (0.01) (0.01)
R2 0.66 0.73 0.74 0.66 0.71 0.70
S.E. of regression 0.22 0.15 0.21 0.21 0.15 0.22
Durbin-Watson statistic 2.12 1.77 1.88 2.01 1.71 2.06
Source: Bloomberg and authors’ estimations.Note: Sample period is 1995.1 2004.8. Standard errors are reported between parentheses. ∗∗ and ∗ denote significance at the 1%and 5% level, respectively.
–2
–1
0
1
2
3
4
5
25 50 75 100 125 150 175 200
Response of NIKKEI225 to DAX
–2
–1
0
1
2
3
4
5
25 50 75 100 125 150 175 200
Response of NIKKEI225 to SP500
Response to Nonfactorized One Unit Innovations ± 2 S.E.
Chart 10. Impulse responses in implied stock market volatilities.
the stock market volatility, explains 78% of the variation in the data. The correspondingimplicit country weights with respect to the first principal component are 0.5 for Japan,while Germany and the United States have an equal weight of 0.6.
5. CONCLUSIONS
This chapter examined the degree of financial globalization of the Japanese bond and stockmarkets, in relation with that of similar US and German markets. Our assessment is mixed. Onthe one hand, we concluded on the basis of several structural indicators of the globalizationof the Japanese financial markets such as the number of foreign listings, presence of foreign
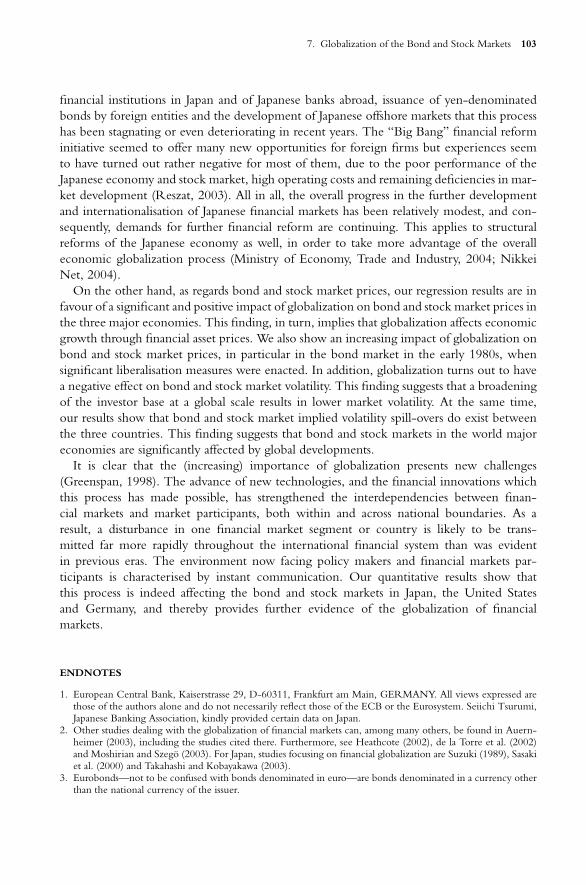
7. Globalization of the Bond and Stock Markets 103
financial institutions in Japan and of Japanese banks abroad, issuance of yen-denominatedbonds by foreign entities and the development of Japanese offshore markets that this processhas been stagnating or even deteriorating in recent years. The “Big Bang” financial reforminitiative seemed to offer many new opportunities for foreign firms but experiences seemto have turned out rather negative for most of them, due to the poor performance of theJapanese economy and stock market, high operating costs and remaining deficiencies in mar-ket development (Reszat, 2003). All in all, the overall progress in the further developmentand internationalisation of Japanese financial markets has been relatively modest, and con-sequently, demands for further financial reform are continuing. This applies to structuralreforms of the Japanese economy as well, in order to take more advantage of the overalleconomic globalization process (Ministry of Economy, Trade and Industry, 2004; NikkeiNet, 2004).
On the other hand, as regards bond and stock market prices, our regression results are infavour of a significant and positive impact of globalization on bond and stock market prices inthe three major economies. This finding, in turn, implies that globalization affects economicgrowth through financial asset prices. We also show an increasing impact of globalization onbond and stock market prices, in particular in the bond market in the early 1980s, whensignificant liberalisation measures were enacted. In addition, globalization turns out to havea negative effect on bond and stock market volatility. This finding suggests that a broadeningof the investor base at a global scale results in lower market volatility. At the same time,our results show that bond and stock market implied volatility spill-overs do exist betweenthe three countries. This finding suggests that bond and stock markets in the world majoreconomies are significantly affected by global developments.
It is clear that the (increasing) importance of globalization presents new challenges(Greenspan, 1998). The advance of new technologies, and the financial innovations whichthis process has made possible, has strengthened the interdependencies between finan-cial markets and market participants, both within and across national boundaries. As aresult, a disturbance in one financial market segment or country is likely to be trans-mitted far more rapidly throughout the international financial system than was evidentin previous eras. The environment now facing policy makers and financial markets par-ticipants is characterised by instant communication. Our quantitative results show thatthis process is indeed affecting the bond and stock markets in Japan, the United Statesand Germany, and thereby provides further evidence of the globalization of financialmarkets.
ENDNOTES
1. European Central Bank, Kaiserstrasse 29, D-60311, Frankfurt am Main, GERMANY. All views expressed arethose of the authors alone and do not necessarily reflect those of the ECB or the Eurosystem. Seiichi Tsurumi,Japanese Banking Association, kindly provided certain data on Japan.
2. Other studies dealing with the globalization of financial markets can, among many others, be found in Auern-heimer (2003), including the studies cited there. Furthermore, see Heathcote (2002), de la Torre et al. (2002)and Moshirian and Szego (2003). For Japan, studies focusing on financial globalization are Suzuki (1989), Sasakiet al. (2000) and Takahashi and Kobayakawa (2003).
3. Eurobonds—not to be confused with bonds denominated in euro—are bonds denominated in a currency otherthan the national currency of the issuer.
104 Ioana Alexopoulou, Gabe de Bondt, and Adrian van Rixtel
REFERENCES
Agenor, P.R., 2003, Benefits and costs of international financial integration: theory and facts, World Economy, 26,8, 1089–1118.
Aggarwal, R., 1993, An overview of Japanese finance: uniqueness in an age of global integration, in: S.R. Stansell(ed.), International Financial Market Integration, Blackwell, Oxford and Cambridge, 42–56.
Auernheimer, L. (ed.), 2003, International Financial Markets: The Challenge of Globalization, Bush School Series inthe Economics of Public Policy, volume 3, University of Chicago Press, Chicago and London.
Baldwin, R.E. and P. Martin, 1999, Two waves of globalization: superficial similarities, fundamental differences,NBER Working Paper, 6904.
Bailliu, J., 2000, Private capital flows, financial development, and economic growth in developing countries, Bankof Canada Working Paper, 2000-15.
Batten, J.A. and P.G. Szilagyi, 2003, Why Japan Needs to Develop its Corporate Bond Market, International Journalof the Economics of Business, 10(1), 83–108.
Bondt, de G.J., P.J.A. van Els and A.C.J. Stockman, 1997, EUROMON: a macroeconometric multi-country modelfor the EU, DNB Staff Reports, 17.
Bordo, M.D., 2002, Globalization in historical perspective, Business Economics, 37, 1, 20–29.Bordo, M.D., B. Eichengreen and J. Kim, 1998, Was there really an earlier period of international financial integration
comparable to today?, NBER Working Paper, 6738.Bordo, M.D. and A.P. Murshid, 2002, Globalization and changing patterns in the international transmission of
shocks in financial markets, NBER Working Paper, 9019.Burstein, D., 1988, Yen! Japan’s New Financial Empire and Its Threat to America, New York: Simon and Schuster.Calder, K.E., 1993, Strategic Capitalism: Private Business and Public Purpose in Japanese Industrial Finance, Princeton:
Princeton University Press.Dattel, E., 1994, The Sun that Never Rose: The Inside Story of Japan’s Failed Attempt at Global Financial Dominance,
Chicago: Probus Publishing Co.Domanksi, D. and M. Kremer, 2000, The dynamics of international asset price linkages and their effects on German
stock and bond markets, International Financial Markets and the Implications for Monetary and Financial Stability, BISConference Papers, No. 8, March, 134–158.
Dungey, M., R. Fry, B. Gonzalez-Hermosillo and V. Martin, 2002, International contagion effects from the Russiancrisis and the LCTM near-collapse, IMF Working Papers, WP/02/74.
Duser, J.T., 1990, International Strategies of Japanese Banks: The European Perspective, Houndmills, Basingstoke: MacMil-lan.
The Economist, 2004, Pocket World in Figures.Edison, H.J., R. Levine, L. Ricci and T. Sloek, 2002, International financial integration and economic growth,
Journal of International Money and Finance, 21, 6, 749–776.Edison, H.J., R. Levine, L. Ricci and T. Sloek, 2002, Capital account liberalization and economic performance:
survey and synthesis, NBER Working Paper, 9100.Edison, H.J. and F.E. Warnock, 2003, A simple measure of the intensity of capital controls, Journal of Empirical
Finance, 10, 1–2, 81–103.Eichengreen, B. and D. Leblang, Capital account liberalization and growth: was Mr. Mahathir right?, International
Journal of Finance and Economics, 8, 3, 205–224.Fase, M.M.G. and P.J.G. Vlaar, 1998, International convergence of capital market interest rates, De Economist, 146,
2, 257–269.Fratzscher, M. and M. Bussiere, 2004, Financial openness and growth: short-run gain, long-run pain?, ECB Working
Paper, 348.Frankel, J., 1984, The Yen/Dollar Agreement: Liberalizing Japanese Capital Markets, Institute for International
Economics, Policy Analyses in International Economics, No. 9, Washington, DC: Institute for International Eco-nomics.
Fukao, M., 2004, Financial deregulations, weakness of market discipline and market development: Japan’s experience,in J.P.H. Fan, M. Hanazaki, and J. Teranishi (eds.), Designing Financial Systems in East Asia and Japan, 120–151.
Gibson, M.S., 1998, Big Bang Deregulation and Japanese Corporate Governance: A Survey of the Issues, Board ofGovernors of the Federal Reserve System, International Finance Discussion Papers, no. 624.
Goetzmann, W.N., L. Li and K.G. Rouwenhorst, 2001, Long-term global market correlations, NBER WorkingPaper, 8612.
Goldstein, M. and M. Mussa, 1993, The Integration of World Capital Markets, IMF Working Papers, WP/93/95,December.
Greenspan, A., 1998, The globalization of finance, Cato Journal, 17(3), 243–250.Hall, M.J.B., 1998, Financial Reform in Japan—Causes and Consequences, Cheltenham, UK: Edward Elgar.
7. Globalization of the Bond and Stock Markets 105
Hamao, Y., R. Masulis, and V. Ng, 1990, Correlations in price changes and volatility across international stockmarkets, The Review of Financial Studies, 3, 281–307.
Harner, S.M., 2000, Japan’s Financial Revolution—And How American Firms Are Profiting, Armonk, New York: M.E.Sharpe.
Hartmann, P., S. Straetmans and C. de Vries, 2003, Asset market linkages in crisis periods, Review of Economics andStatistics, 86, 1, 313–326.
Hassler, J., 1999, Does increased international influence cause higher stock market volatility?, Scandinavian Journalof Economics, 101, 1, 1–9.
Heathcote, J., 2002, Financial globalization and real regionalization, NBER Working Paper Series, 9292.Higashi, C. and G.P. Lauter, 1990, The Internationalization of the Japanese Economy, 2nd edition, Dordrecht: Kluwer
Academic Publishers.Honda, E., 2003, Financial deregulation in Japan, Japan and the World Economy, 15, 135–140.Horiuchi, A., 1996, Financial Fragility and Recent Developments in the Japanese Safety Net, revised version of
paper prepared for the 71st Annual Western Economic Association International Conference, San Francisco,June.
Horiuchi, A., 2003, The Big Bang financial system reforms: implications for corporate governance, inAmyx, J. and P. Drysdale (eds.), Japanese Governance: Beyond Japan Inc., London: Routledge Curzon, 77–95.
Hoshi, T. and A.K. Kashyap, 2001, Corporate Financing and Governance in Japan, Cambridge, MA/London: The MITPress.
IMF, 2003, Is Financial Globalization harmful for Developing Countries.Issing, O., 1997, Globalization of financial markets—challenges for monetary policy, Stevenson Lecture, 12 may.Ito, T. and M. Melvin, 1999, Japan’s Big Bang and the Transformation of Financial Markets, NBER Working Paper
Series, 7247.Japan Center for International Finance, 1984, Study on the Internationalization of Tokyo’s Money Markets, JCIF
Policy Study Series, No. 1, June.Japan Center for International Finance, 1988, Tokyo as a Center of World Finance: Its Evaluation and Future Tasks,
JCIF Policy Study Series, No. 11, October.Japan Center for International Finance, 2004, Assessment and Strategies of Foreign Financial Institutions in Japan regarding
the Tokyo Financial/Capital Market, Tokyo: Japan Center for International Finance.Japanese Bankers Association, 2001, The Banking System in Japan, Tokyo: Japanese Bankers Association.Kaminsky, G. and S. Schmukler, 2003, Short-run pain, long-run gain: the effects of financial liberalisation, IMF
Working Paper, 34.Katz, R., 1998, Japan: The System that Soured—The Rise and Fall of the Japanese Economic Miracle, Armonk:
M.E. Sharpe.Kim, S.W. and J.H. Rogers, 1995, International stock price spillovers and market liberalization: evidence from
Korea, Japan, and the United States, International Finance Discussion Papers, Board of Governors of the FederalReserve System, 499.
King, M.A., and S. Wadhwani, 1990, Transmission of Volatility between stock markets, The Review of FinancialStudies, 3 (1), 5–33.
Kinyu Zaisei Jijo, 2003, Ginko—Shoken no naigai shinshutsu jokyo, Kinyu Zaisei Jijo, 8(4), Tokyo, 66–67 (in Japanese:Financial and Fiscal Developments, The development of the domestic and international expansion of banks andsecurities firms).
Klein, M.W., 2003, Capital account openness and the varieties of growth experience, NBER Working Paper,9500.
Klein, M. and G. Olivei, 1999, Capital account liberalization, financial depth, and economic growth, Federal ReserveBank of Boston Working Paper, 99/06.
Lane, P. and G.M. Milesi-Ferretti, 2003, International financial integration, IMF Working Paper, 03/86.Levine, R., 2001, International financial liberalization and economic growth, Review of International Economics, 9,
4, 688–702.Lothian, J.R., 2002, The internationalization of money and finance and the globalization of financial markets,
Journal of International Money and Finance, 21, 699–724.Maddision, A., 2001, The World Economy. Historical Statistics, OECD, Paris.Matsushita, Y., 1996, Financial innovation, financial market globalization and monetary policy management, speech, Yomiuri
International Economic Society, Tokyo, 11 October.McLean, B. and S. Shrestha, 2002, International financial liberalisation and economic growth, Reserve Bank of
Australia Research Discussion Paper, 2002–03.Mikitani, R. and A.S. Posen (eds.), 2000, Japan’s Financial Crisis and its Parallels to U.S. Experience, Special Report
13, Washington, DC: Institute for International Economics.
106 Ioana Alexopoulou, Gabe de Bondt, and Adrian van Rixtel
Ministry of Economy, Trade and Industry, 2004, White Paper on International Economy and Trade 2004, Tokyo:Ministry of Economy, Trade and Industry.
Ministry of Finance, 1997, Financial System Reform: Toward the Early Achievement of Reform, June 13th, Tokyo: Ministryof Finance.
Ministry of Finance, 1998, Internationalization of the Yen (Interim Report), Council on Foreign Exchange and OtherTransactions, Subcouncil on the Internationalization of the Yen, November.
Ministry of Finance, 2003, Enhancing Japan’s Status as an International Financial Center, Study Group on the Interna-tionalization of Japan’s Financial and Capital Markets, July.
Moshirian, F. and G. Szego, 2003, Markets and institutions: Global perspectives, Journal of Banking & Finance, 27,1213–1218.
Nikkei Net, 2004, Japan Needs More Reform To Utilize Globalization Benefits, 16 July.Obstfeld, M. and A.M. Taylor, 2002, Globalization and capital markets, NBER Working Paper, 8846.Oda, H., 1998, The Reform of the Financial System in Japan, Zeitschrift fur Japanisches Recht, Z39, No. 6,
3–18.Okina, K., M. Shirakawa and S. Shiratsuka, 1999, Financial market globalization: present and future, Monetary and
Economic Studies, 17, 3, 1–40.Peek, J. and Rosengren, E.S., 1997, The International Transmission of Financial Shocks: The Case of Japan, American
Economic Review, 87(4), 495–505.Peek, J. and Rosengren, E.S., 2000, Collateral Damage: Effects of the Japanese Bank Crisis on Real Activity in the
United States, American Economic Review, 90(1), 30–45.Peiro, A., J. Quesada and E. Uriel, 1998, Transmission of movements in stock markets, The European Journal of
Finance, 4, 331–343Posen, A.S., 1998, Restoring Japan’s Economic Growth, Washington, DC: Institute for International Economics.Reszat, B., 2003, Japan’s Financial Markets: The Lost Decade, Hamburg Institute of International Economics Discussion
Paper, 231, June.Rhee, S.G., 2004, Further reforms of the JGB market for the promotion of regional bond markets, in Fan, J.P.H,
Hanazaki, M. and J. Teranishi (eds.), Designing Financial Systems in East Asia and Japan, 316–334.Rixtel, A.A.R.J.M. van, 1989, De Derde Golf: de opmars van de Japanse financiele conglomeraten, Intermediair,
25(34), August 25th, 67–73 (in Dutch: The Third Wave: the advance of Japanese financial conglomerates).Rixtel, A.A.R.J.M. van, 1997, The Evolution of the Japanese Financial System and Monetary Policy: The Rise
and Collapse of the New Financial Superpower Myth, in Boonstra, W.W. and S.C.W. Eijffinger (eds.), Banks,Financial Markets and Monetary Policy, Amsterdam: NIBE, 57–98.
Rixtel, A.A.R.J.M. van, 1998, Het financiele hervormingsproces in Japan: Van stricte regulering to de ‘Big Bang’, Financiele &Monetaire Studies, 16(3), Groningen: Wolters-Noordhoff (in Dutch: The process of financial reform in Japan:From strict regulation to the ‘Big Bang’).
Rixtel, A.A.R.J.M. van, 2002, Informality and Monetary Policy in Japan: The Political Economy of Bank Performance,Cambridge: Cambridge University Press.
Rutherford, D., 2002, Dictionary of Economics, Second Edition, Routledge.Rousseau, P.L. and R. Sylla, 2001, Financial systems, economic growth, and globalization, NBER Working Paper,
8323.Sasaki, H., S. Yamaguchi and T. Hisada, 2000, The globalization of financial markets and monetary policy, in
International Financial Markets and the Implications for Monetary and Financial Stability, BIS Conference Papers, No. 8,March, 57–78.
Suzuki, Y., 1987, The Japanese Financial System, Oxford: Clarendon Press.Stiglitz, J., 2000, Capital market liberalisation, economic growth and instability, World Development, 25, 1075–1086.Stiglitz, J., 2002, Globalization and Its Discontents, London: Allen Lane.Stulz, R.M., 1999, Globalization of equity markets and the cost of capital, NBER Working Paper, 7021.Suzuki, Y., 1989, Japan’s Economic Performance and International Role, Tokyo: University of Tokyo Press.Takagi, S., 1995, Structural Changes in Japanese Long-term Capital Flows, in M. Okabe (ed.), The Structure of the
Japanese Economy: Changes on the Domestic and International Fronts, Houndmills, Basingstoke: MacMillan Press,435–458.
Takahashi, W. and S. Kobayakawa, 2003, Globalization: Role of Institution Building in the Japanese FinancialSector, Bank of Japan Working Paper Series, No.03-E-7, December.
Takeda, M. and P. Turner, 1992, The Liberalization of Japan’s Financial Markets: Some Major Themes, BIS EconomicPapers, no. 34.
Tett, G., 2004, Saving the Sun: Shinsei and the Battle for Japan’s Future, Random House Business Books.Tokyo Stock Exchange, 2004, Fact Book 2004, Tokyo: Tokyo Stock Exchange.Torre, A. de la, E.L. Yeyati and S.L. Schmukler, 2002, Financial Globalization: Unequal Blessings, International
Finance, 5(3), 335–357.

7. Globalization of the Bond and Stock Markets 107
Trichet, J.-C., 2004, The transformation of the international financial architecture to meet the challenges ofglobalization, Arthur Burns Memorial Lecture.
Viner, A., 1988, The Financial Samurai: The Emerging Power of Japanese Money, London: Kogan Page.Wolf, M., 2004, Why Globalization Works, John Wiley and Sons.Wood, C., 1993, The Bubble Economy: The Japanese Economic Collapse, Tokyo: Charles E. Tuttle.Wright, R.W. and G.A. Pauli, 1987, The Second Wave: Japan’s Global Assault on Financial Services, London: Waterlow
Publishers.
8. WEEKLY EXPECTED CREDIT SPREADS IN LATIN-AMERICAN BRADY BONDS
FRANCO PARISI, IKE MATHUR, AND JORGE URRUTIA1
1. INTRODUCTION
Since 1990, following the introduction of the Brady Bonds, debt market of emergent econ-omy was liquid, until the Asian crisis. As a matter of fact, until 1998, Brady Bonds representedover 30% of total traded volume of emerging countries’ debt market. These debt instrumentswere designed within the Brady Plan2, which consisted of a rearrangement of the emerg-ing countries’ debts. These economies could convert debt of commercial banks (originatedfrom the debt crisis of the 1980’s) into government bonds. The high traded volume3 and theimportance of this instrument allow the market to use the Brady Bond yields as a source ofinformation about the sovereign risk of emerging countries.
This research is focused on distinguishing whether or not the Latin American weeklyBrady Bond’s credit spread can be forecasted using a reduced number of international orlocal financial variables. To answer this question, we study the weekly credit spread BradyBonds from Argentina, Brazil, Mexico and Venezuela.
We have chosen a reduced set of financial variables that belong to Brady Bond issuercountries and the US economy, and they are likely to contain information about weeklyvariation in the expected credit spread of the bonds. The chosen variables are the inverserelative wealth, bond betas, US term spread, and the real US Treasury Bond yield, similar toIlmanen (1995). The first two instruments are specific proxies for time-varying risk aversionand time-varying risk, and the last two instruments are alternative proxies for the overallexpected credit spread. Also, earlier studies, such as Borbine and Forni (1997), report evidenceof the Mexican crisis influence in the Brady Bond market. Thus, in order to capture thatshock and the Asian crisis, we have designed two dummy variables.
110 Franco Parisi, Ike Mathur, and Jorge Urrutia
Our results indicate that US inverse relative wealth (INVRELW) is positively correlated tothe weekly Brady Bonds credit spread, for both the Par and Discount. The US bond beta hasa positive relation with the studied variables. We found a positive and significant relationshipbetween the intertemporal interest rate structure proxy and the credit spreads in the sample.For the real interest rate proxy, we observe a negative and significant relationship where asubstitution effect between Brady Bonds and Treasury Bonds takes place. The dummies arehighly significant, capturing the effects of the financial crises.
The predictability patterns of the weekly Latin American Brady Bond credit spreads arevery similar, and the US instruments are better predictors than local instruments. The regres-sion coefficients are similar through the different weekly Brady Bond credit spreads analyzed,and the results for Par and Discount bonds are also similar. That is why we study the comove-ments between the weekly Brady Bond’s credit spread from Argentina, Brazil, Mexico, andVenezuela. In fact, Barbone and Forni (1997), using a cointegration analysis of the excessBrady Bond’s returns, found evidence about comovements. We used a Singular Latent Vari-able Model (SLVM), for the case of the credit spreads of Latin American countries studied.Our results validated that the weekly Latin American Brady Bond credit’s spreads seem tobe perfectly correlated. A possible source of these comovements could be the variations ofthe predictive instruments and a herd behavior of investors.
This paper is structured in four parts. After the introduction, we discuss in section IIthe motivation of the predictive instruments. In section III, we present a description ofthe predictable variation of Latin-American Brady Bonds and the meaning of our findings.In section IV we discuss the description of common variations in Latin-American BradyBonds and some possible explanations for such performance. In section V we present ourconclusions.
2. MOTIVATING THE PREDICTIVE INSTRUMENTS
In this section, we discuss the variables that may help to determine the expected creditspread of the Brady Bonds studied. For this purpose, it is important to know some particularcharacteristics of the Latin-American debt markets. Kaplan (1998) establishes that BradyBonds, through their history, have had returns similar to low grade corporate US bonds, butwith a higher risk. The author found significant correlations between Brady Bond marketand US stocks and bonds market, for both Par and Discount. Thus, Brady Bonds play animportant role diversifying risk for international investors. As a result, it would be logical tothink that the predictability of the weekly Brady Bond credit spread could be explained byUS variables. Those instruments should be useful explaining both the US bond and stockmarkets, implying that the Brady Bonds could be a kind of international junk bond4.
Several empirical studies analyze the predictability of the bond returns. Fama and French(1989) and Chen (1991) argued that the variance of the US asset returns is related to eco-nomic conditions. As a matter of fact, the stocks and bonds expected returns tend to behigher in contractive periods of the economic cycle and lower in peaks of the cycle. Keimand Stambaugh (1986) and Fama and French (1989) show that variables such as dividendyield and term spread can predict the excess bond returns in stocks and bonds in the US. Thepredictive ability over the excess bond returns studied in Ilmanen (1995) has been superiorcompared to earlier studies. Ilmanen (1995) chose financial variables that are reasonable deter-minants of the expected bond risk premia. The instrument choices include specific proxies for
8. Weekly expected credit spreads in Latin-American Brady Bonds 111
time-varying risk aversion, time-varying risk, as well as two US overall proxies for theexpected bond risk premia (term spread and real bond yield ).
Earlier studies such as Lauterbash (1989) and DeBondt and Bange (1992) attempt to explainthe time-variation in bond expected returns, analyzing several measures of time-varying risk.Such measures cannot explain the observed countercyclical patterns in expected returns. Inthis article, we intend to identify whether wealth-dependent relative risk aversion (RRA),rather than time-varying risk, causes this pattern. Chen (1991) argues that investors are morerisk averse and require a higher compensation for holding risky assets when their wealth isrelatively low. The time-varying risk aversion and time-varying risk can cause a temporarytime-varying for the risk premium. However, we propose, similar to Ilmanen (1995); that theRRA vary inversely with the relative wealth, and that variation explains the cyclical patternsobserved in the expected returns of assets. As an agent’s wealth declines, he or she becomesincreasingly risk averse. The higher the risk aversion, the higher compensation demanded tohold risky assets, such as stocks and long term bonds. Accordingly, the proxy for overall RRAlevel is the inverse relative wealth of the stock market. We discuss a model in which RRAvaries with wealth and then describe the empirical proxy for the wealth-dependentRRA. Marcus (1989) presents a two-period, two-asset model in which identical agentshave the utility function shown in equation (1).
U(W) = (W − ω)1−γ
1 − γ, (1)
where W is wealth, ω is subsistence wealth, and γ is a positive constant. This functionimplies wealth-dependent RRA level:
RRA = −W(Uw)′′
Uw= −γ
1 − (ω/W)(2)
where (UW)′′ symbolizes the second derivation of the wealth-dependent utility function.Rational agents never let their wealth reach or fall below subsistence level because they sufferinfinite disutility when ω = W. As an agent’s wealth declines toward the subsistence level,he or she becomes increasingly risk averse. In contrast to this situation, as wealth increases,RRA approaches γ asymptotically.
When ω = 0, the function reduces to a power utility function, which exhibits constantRRA. Thus, decreasing RRA is a direct consequence of assuming a positive subsistencelevel. In the Marcus model, RRA and the expected market premium risk vary inverselywith absolute wealth level. It is more plausible that the subsistence level varies over time andthe RRA varies inversely with relative wealth5.
For the analysis, we use INVRELW (the ratio between the past wealth and current wealth)as a proxy for the aggregate RRA level. This choice is an approximation of a utility functionwith a subsistence level that varies with past wealth. The inverse ratio captures some of thenonlinearity in the RRA equation, where RRA is more sensitive to changes in wealth atlower wealth levels. A significant positive relation between INVRELW and future asset returnsshould exist because many asset pricing models imply that expected asset risk premiums arepositively related to the aggregate RRA level.
In this analysis, we use as an empirical proxy of the aggregate wealth the MSCI6 index foreach of the countries analyzed. It is well known that the stock market represents only a small
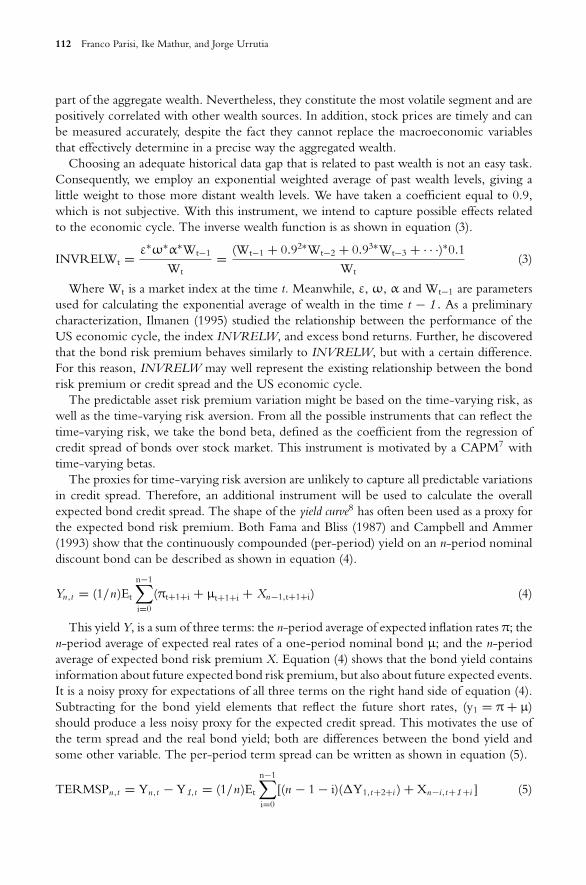
112 Franco Parisi, Ike Mathur, and Jorge Urrutia
part of the aggregate wealth. Nevertheless, they constitute the most volatile segment and arepositively correlated with other wealth sources. In addition, stock prices are timely and canbe measured accurately, despite the fact they cannot replace the macroeconomic variablesthat effectively determine in a precise way the aggregated wealth.
Choosing an adequate historical data gap that is related to past wealth is not an easy task.Consequently, we employ an exponential weighted average of past wealth levels, giving alittle weight to those more distant wealth levels. We have taken a coefficient equal to 0.9,which is not subjective. With this instrument, we intend to capture possible effects relatedto the economic cycle. The inverse wealth function is as shown in equation (3).
INVRELWt = ε∗ω∗α∗Wt−1
Wt= (Wt−1 + 0.92∗Wt−2 + 0.93∗Wt−3 + · · ·)∗0.1
Wt(3)
Where Wt is a market index at the time t. Meanwhile, ε, ω, α and Wt−1 are parametersused for calculating the exponential average of wealth in the time t − 1 . As a preliminarycharacterization, Ilmanen (1995) studied the relationship between the performance of theUS economic cycle, the index INVRELW, and excess bond returns. Further, he discoveredthat the bond risk premium behaves similarly to INVRELW, but with a certain difference.For this reason, INVRELW may well represent the existing relationship between the bondrisk premium or credit spread and the US economic cycle.
The predictable asset risk premium variation might be based on the time-varying risk, aswell as the time-varying risk aversion. From all the possible instruments that can reflect thetime-varying risk, we take the bond beta, defined as the coefficient from the regression ofcredit spread of bonds over stock market. This instrument is motivated by a CAPM7 withtime-varying betas.
The proxies for time-varying risk aversion are unlikely to capture all predictable variationsin credit spread. Therefore, an additional instrument will be used to calculate the overallexpected bond credit spread. The shape of the yield curve8 has often been used as a proxy forthe expected bond risk premium. Both Fama and Bliss (1987) and Campbell and Ammer(1993) show that the continuously compounded (per-period) yield on an n-period nominaldiscount bond can be described as shown in equation (4).
Yn,t = (1/n)Et
n−1∑i=0
(πt+1+i + µt+1+i + Xn−1,t+1+i) (4)
This yield Y, is a sum of three terms: the n-period average of expected inflation rates π; then-period average of expected real rates of a one-period nominal bond µ; and the n-periodaverage of expected bond risk premium X. Equation (4) shows that the bond yield containsinformation about future expected bond risk premium, but also about future expected events.It is a noisy proxy for expectations of all three terms on the right hand side of equation (4).Subtracting for the bond yield elements that reflect the future short rates, (y1 = π + µ)should produce a less noisy proxy for the expected credit spread. This motivates the use ofthe term spread and the real bond yield; both are differences between the bond yield andsome other variable. The per-period term spread can be written as shown in equation (5).
TERMSPn,t = Yn,t − Y1,t = (1/n)Et
n−1∑i=0
[(n − 1 − i)(�Y1,t+2+i ) + Xn−i,t+1+i ] (5)
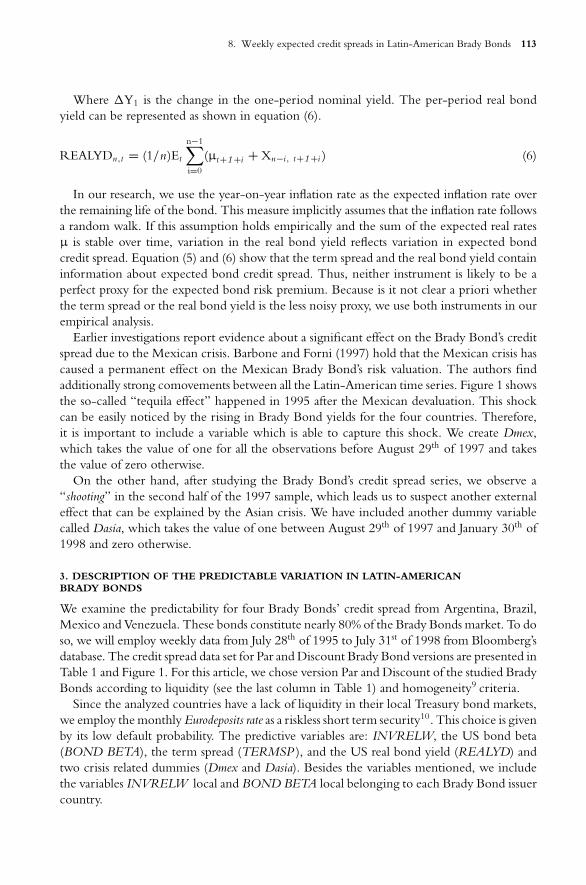
8. Weekly expected credit spreads in Latin-American Brady Bonds 113
Where �Y1 is the change in the one-period nominal yield. The per-period real bondyield can be represented as shown in equation (6).
REALYDn,t = (1/n)Et
n−1∑i=0
(µt+1+i + Xn−i, t+1+i ) (6)
In our research, we use the year-on-year inflation rate as the expected inflation rate overthe remaining life of the bond. This measure implicitly assumes that the inflation rate followsa random walk. If this assumption holds empirically and the sum of the expected real ratesµ is stable over time, variation in the real bond yield reflects variation in expected bondcredit spread. Equation (5) and (6) show that the term spread and the real bond yield containinformation about expected bond credit spread. Thus, neither instrument is likely to be aperfect proxy for the expected bond risk premium. Because is it not clear a priori whetherthe term spread or the real bond yield is the less noisy proxy, we use both instruments in ourempirical analysis.
Earlier investigations report evidence about a significant effect on the Brady Bond’s creditspread due to the Mexican crisis. Barbone and Forni (1997) hold that the Mexican crisis hascaused a permanent effect on the Mexican Brady Bond’s risk valuation. The authors findadditionally strong comovements between all the Latin-American time series. Figure 1 showsthe so-called “tequila effect” happened in 1995 after the Mexican devaluation. This shockcan be easily noticed by the rising in Brady Bond yields for the four countries. Therefore,it is important to include a variable which is able to capture this shock. We create Dmex,which takes the value of one for all the observations before August 29th of 1997 and takesthe value of zero otherwise.
On the other hand, after studying the Brady Bond’s credit spread series, we observe a“shooting” in the second half of the 1997 sample, which leads us to suspect another externaleffect that can be explained by the Asian crisis. We have included another dummy variablecalled Dasia, which takes the value of one between August 29th of 1997 and January 30th of1998 and zero otherwise.
3. DESCRIPTION OF THE PREDICTABLE VARIATION IN LATIN-AMERICANBRADY BONDS
We examine the predictability for four Brady Bonds’ credit spread from Argentina, Brazil,Mexico and Venezuela. These bonds constitute nearly 80% of the Brady Bonds market. To doso, we will employ weekly data from July 28th of 1995 to July 31st of 1998 from Bloomberg’sdatabase. The credit spread data set for Par and Discount Brady Bond versions are presented inTable 1 and Figure 1. For this article, we chose version Par and Discount of the studied BradyBonds according to liquidity (see the last column in Table 1) and homogeneity9 criteria.
Since the analyzed countries have a lack of liquidity in their local Treasury bond markets,we employ the monthly Eurodeposits rate as a riskless short term security10. This choice is givenby its low default probability. The predictive variables are: INVRELW, the US bond beta(BOND BETA), the term spread (TERMSP ), and the US real bond yield (REALYD) andtwo crisis related dummies (Dmex and Dasia). Besides the variables mentioned, we includethe variables INVRELW local and BOND BETA local belonging to each Brady Bond issuercountry.
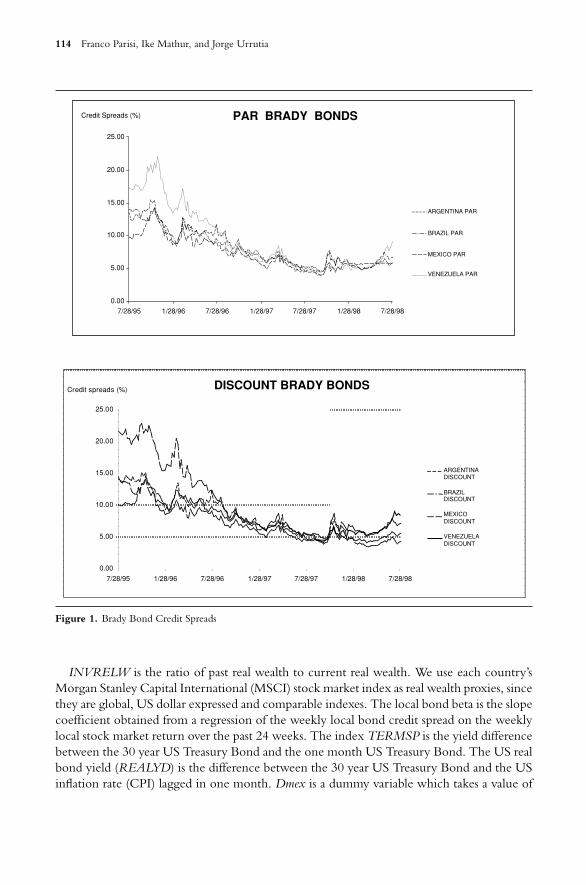
114 Franco Parisi, Ike Mathur, and Jorge Urrutia
DISCOUNT BRADY BONDS
0.00
5.00
10.00
15.00
20.00
25.00
7/28/95 1/28/96 7/28/96 1/28/97 7/28/97 1/28/98 7/28/98
Credit spreads (%)
ARGENTINADISCOUNT
BRAZILDISCOUNT
MEXICODISCOUNT
VENEZUELADISCOUNT
PAR BRADY BONDS
0.00
5.00
10.00
15.00
20.00
25.00
7/28/95 1/28/96 7/28/96 1/28/97 7/28/97 1/28/98 7/28/98
Credit Spreads (%)
ARGENTINA PAR
BRAZIL PAR
MEXICO PAR
VENEZUELA PAR
Figure 1. Brady Bond Credit Spreads
INVRELW is the ratio of past real wealth to current real wealth. We use each country’sMorgan Stanley Capital International (MSCI) stock market index as real wealth proxies, sincethey are global, US dollar expressed and comparable indexes. The local bond beta is the slopecoefficient obtained from a regression of the weekly local bond credit spread on the weeklylocal stock market return over the past 24 weeks. The index TERMSP is the yield differencebetween the 30 year US Treasury Bond and the one month US Treasury Bond. The US realbond yield (REALYD) is the difference between the 30 year US Treasury Bond and the USinflation rate (CPI) lagged in one month. Dmex is a dummy variable which takes a value of
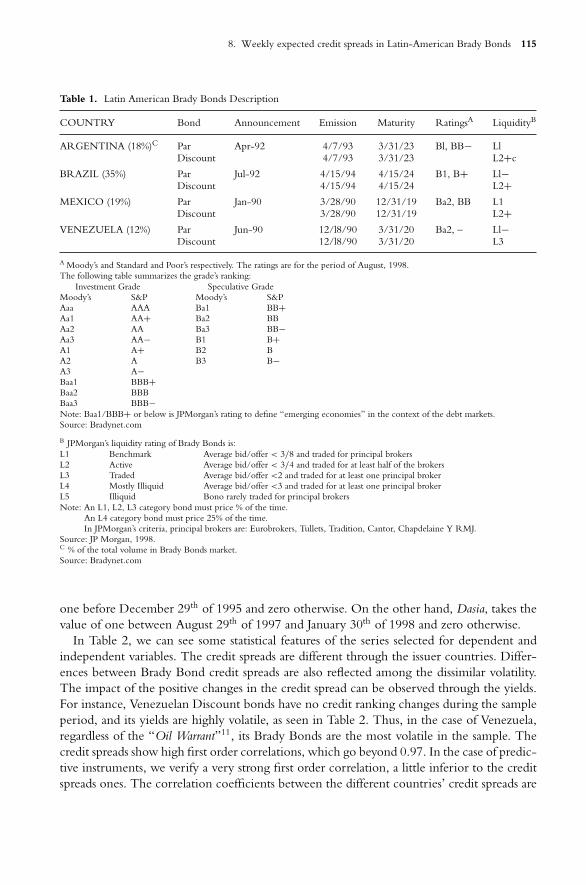
8. Weekly expected credit spreads in Latin-American Brady Bonds 115
Table 1. Latin American Brady Bonds Description
COUNTRY Bond Announcement Emission Maturity RatingsA LiquidityB
ARGENTINA (18%)C Par Apr-92 4/7/93 3/31/23 Bl, BB− LlDiscount 4/7/93 3/31/23 L2+c
BRAZIL (35%) Par Jul-92 4/15/94 4/15/24 B1, B+ Ll−Discount 4/15/94 4/15/24 L2+
MEXICO (19%) Par Jan-90 3/28/90 12/31/19 Ba2, BB L1Discount 3/28/90 12/31/19 L2+
VENEZUELA (12%) Par Jun-90 12/l8/90 3/31/20 Ba2, – Ll−Discount 12/l8/90 3/31/20 L3
A Moody’s and Standard and Poor’s respectively. The ratings are for the period of August, 1998.The following table summarizes the grade’s ranking:
Investment Grade Speculative GradeMoody’s S&P Moody’s S&PAaa AAA Ba1 BB+Aa1 AA+ Ba2 BBAa2 AA Ba3 BB−Aa3 AA− B1 B+A1 A+ B2 BA2 A B3 B−A3 A−Baa1 BBB+Baa2 BBBBaa3 BBB−Note: Baa1/BBB+ or below is JPMorgan’s rating to define “emerging economies” in the context of the debt markets.Source: Bradynet.com
B JPMorgan’s liquidity rating of Brady Bonds is:L1 Benchmark Average bid/offer < 3/8 and traded for principal brokersL2 Active Average bid/offer < 3/4 and traded for at least half of the brokersL3 Traded Average bid/offer <2 and traded for at least one principal brokerL4 Mostly Illiquid Average bid/offer <3 and traded for at least one principal brokerL5 Illiquid Bono rarely traded for principal brokersNote: An L1, L2, L3 category bond must price % of the time.
An L4 category bond must price 25% of the time.In JPMorgan’s criteria, principal brokers are: Eurobrokers, Tullets, Tradition, Cantor, Chapdelaine Y RMJ.
Source: JP Morgan, 1998.C % of the total volume in Brady Bonds market.Source: Bradynet.com
one before December 29th of 1995 and zero otherwise. On the other hand, Dasia, takes thevalue of one between August 29th of 1997 and January 30th of 1998 and zero otherwise.
In Table 2, we can see some statistical features of the series selected for dependent andindependent variables. The credit spreads are different through the issuer countries. Differ-ences between Brady Bond credit spreads are also reflected among the dissimilar volatility.The impact of the positive changes in the credit spread can be observed through the yields.For instance, Venezuelan Discount bonds have no credit ranking changes during the sampleperiod, and its yields are highly volatile, as seen in Table 2. Thus, in the case of Venezuela,regardless of the “Oil Warrant”11, its Brady Bonds are the most volatile in the sample. Thecredit spreads show high first order correlations, which go beyond 0.97. In the case of predic-tive instruments, we verify a very strong first order correlation, a little inferior to the creditspreads ones. The correlation coefficients between the different countries’ credit spreads are
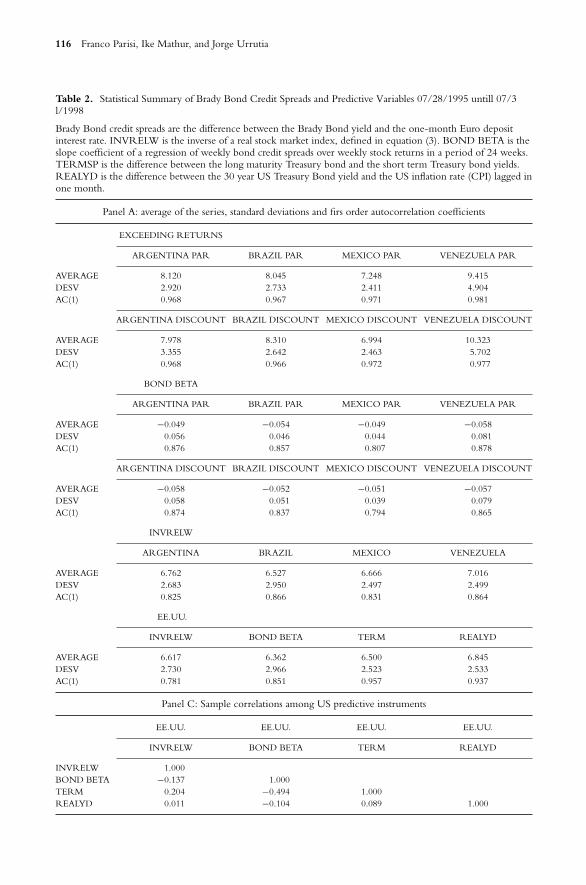
116 Franco Parisi, Ike Mathur, and Jorge Urrutia
Table 2. Statistical Summary of Brady Bond Credit Spreads and Predictive Variables 07/28/1995 untill 07/3l/1998
Brady Bond credit spreads are the difference between the Brady Bond yield and the one-month Euro depositinterest rate. INVRELW is the inverse of a real stock market index, defined in equation (3). BOND BETA is theslope coefficient of a regression of weekly bond credit spreads over weekly stock returns in a period of 24 weeks.TERMSP is the difference between the long maturity Treasury bond and the short term Treasury bond yields.REALYD is the difference between the 30 year US Treasury Bond yield and the US inflation rate (CPI) lagged inone month.
Panel A: average of the series, standard deviations and firs order autocorrelation coefficients
EXCEEDING RETURNS
ARGENTINA PAR BRAZIL PAR MEXICO PAR VENEZUELA PAR
AVERAGE 8.120 8.045 7.248 9.415DESV 2.920 2.733 2.411 4.904AC(1) 0.968 0.967 0.971 0.981
ARGENTINA DISCOUNT BRAZIL DISCOUNT MEXICO DISCOUNT VENEZUELA DISCOUNT
AVERAGE 7.978 8.310 6.994 10.323DESV 3.355 2.642 2.463 5.702AC(1) 0.968 0.966 0.972 0.977
BOND BETA
ARGENTINA PAR BRAZIL PAR MEXICO PAR VENEZUELA PAR
AVERAGE −0.049 −0.054 −0.049 −0.058DESV 0.056 0.046 0.044 0.081AC(1) 0.876 0.857 0.807 0.878
ARGENTINA DISCOUNT BRAZIL DISCOUNT MEXICO DISCOUNT VENEZUELA DISCOUNT
AVERAGE −0.058 −0.052 −0.051 −0.057DESV 0.058 0.051 0.039 0.079AC(1) 0.874 0.837 0.794 0.865
INVRELW
ARGENTINA BRAZIL MEXICO VENEZUELA
AVERAGE 6.762 6.527 6.666 7.016DESV 2.683 2.950 2.497 2.499AC(1) 0.825 0.866 0.831 0.864
EE.UU.
INVRELW BOND BETA TERM REALYD
AVERAGE 6.617 6.362 6.500 6.845DESV 2.730 2.966 2.523 2.533AC(1) 0.781 0.851 0.957 0.937
Panel C: Sample correlations among US predictive instruments
EE.UU. EE.UU. EE.UU. EE.UU.
INVRELW BOND BETA TERM REALYD
INVRELW 1.000BOND BETA −0.137 1.000TERM 0.204 −0.494 1.000REALYD 0.011 −0.104 0.089 1.000
8. Weekly expected credit spreads in Latin-American Brady Bonds 117
far above the ground and move between 0.94 and 0.98, for Par and Discount bonds. On theother hand, the US predictive variables, in general, are not correlated.
Now we shall investigate whether Brady Bond credit spreads can be predicted using aUS data set, as well as analyse whether the differences among Par and Discount forecastsare significant in our predictive model. Finally, through a restricted model12, we determinethe convenience of using US variables instead of local instruments. Table 3 shows the resultof multiple regressions of US instruments over Brady Bond credit spreads, both for Par andDiscount13. Multiple regressions let us see the predictive power of the variables Dmex, Dasia,TERMSP, REALYD, INVRELW and BOND BETA. As expected, US instruments are ableto predict the weekly Latin-American Brady Bond credit spreads. We observe that suchinstruments concurrently explain between 77.86% and 81.32% of the variation in Par bondreturns for the different selected countries. For Discount version we also see a high predictingability, capturing nearly 78.69% to 80.90% of the variations. It is interesting to notice thatthe R2 for the Argentinean Par and Discount bonds cases does not significantly rise abovethe rest of the countries. This result is different than Kaplan (1998), who finds much highercorrelations (almost double of the remaining studied countries) between Argentinean bondsand the US stocks and bond market.
The positive and significant coefficients of US INVRELW for all the regressions areconsistent with our hypothesis. As expected, INVRELW shows a countercyclical patternin relation to stock market (our wealth proxy). Therefore, the higher US INVRELW, thehigher the Brady Bonds credit spreads of all the Latin-American countries. The positiveand significant coefficients for US BOND BETA and TERMSP are also consistent withour hypothesis. In other words, the variation of the Brady Bonds credit spread for all thecountries follows positively the risk variation in time. Moreover, it is consistent with otherempirical studies, which acknowledge the predictive ability of the bond returns in manycountries14. Also, the studied Brady Bonds are backed by US Treasury bills, so the TERMSPshould capture the movements of these instruments within international markets. Therefore,TERMSP should have some influence over the Brady Bond credit spreads. Regarding thevariable REALYD, we can appreciate that for all the regressions, the coefficients are alwaysnegative and significant. The explanation does not seem simple, since in earlier studiesREALYD was a noisy proxy for the credit spread. As mentioned previously, the studiedBrady Bonds are backed by US Treasury bills, so we would expect a positive effect of theseinstruments over the Brady Bond credit spreads even though it is reasonable that a substitutioneffect exists between the Brady Bond returns and the 30 year US Treasury Bonds. As a matterof fact, in periods of crisis, international investors shelter in US Treasury Bonds instead ofLatin-American debt instruments, while in peak periods, international investors look foranother investment and diversification options (Kaplan, 1998), increasing the demand forLatin-American bonds. Thus, the substitution effect might dominate the REALYD effectover risk premium, generating a negative movement between the Brady Bond credit spreadsand the 30 year US Treasury Bonds. The dummies are capturing possible effects of financialshocks in the Brady Bond studied. As seen in Table 3, the Dmex coefficients are positiveand significant, confirming the impact of the Mexican crisis over the Brady Bond returns,increasing the credit risks in all the Latin-American issuer countries. In the case of Dasia,the coefficients are negative and significant, which implies the substitution effect generatedbetween Asian and Latin-American debt instruments15.
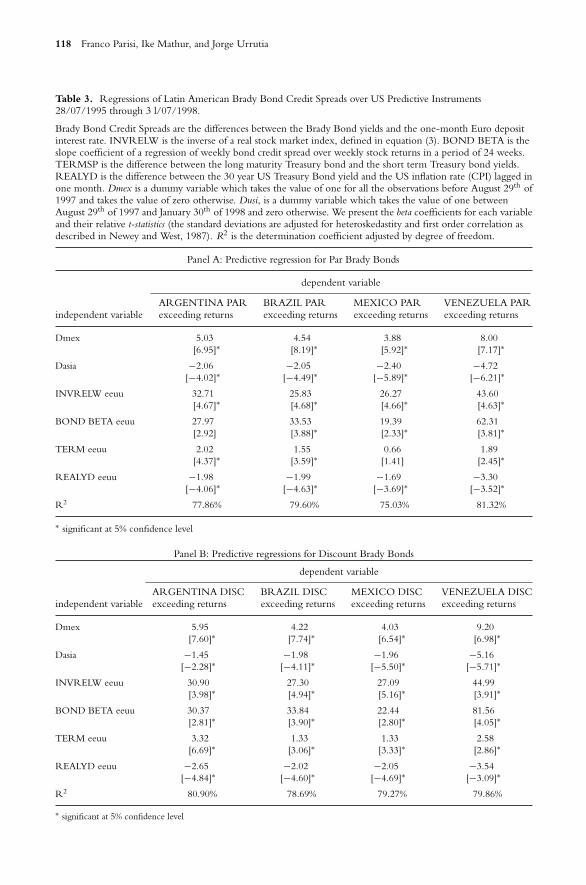
118 Franco Parisi, Ike Mathur, and Jorge Urrutia
Table 3. Regressions of Latin American Brady Bond Credit Spreads over US Predictive Instruments28/07/1995 through 3 l/07/1998.
Brady Bond Credit Spreads are the differences between the Brady Bond yields and the one-month Euro depositinterest rate. INVRELW is the inverse of a real stock market index, defined in equation (3). BOND BETA is theslope coefficient of a regression of weekly bond credit spread over weekly stock returns in a period of 24 weeks.TERMSP is the difference between the long maturity Treasury bond and the short term Treasury bond yields.REALYD is the difference between the 30 year US Treasury Bond yield and the US inflation rate (CPI) lagged inone month. Dmex is a dummy variable which takes the value of one for all the observations before August 29th of1997 and takes the value of zero otherwise. Dusi, is a dummy variable which takes the value of one betweenAugust 29th of 1997 and January 30th of 1998 and zero otherwise. We present the beta coefficients for each variableand their relative t-statistics (the standard deviations are adjusted for heteroskedastity and first order correlation asdescribed in Newey and West, 1987). R2 is the determination coefficient adjusted by degree of freedom.
Panel A: Predictive regression for Par Brady Bonds
dependent variable
ARGENTINA PAR BRAZIL PAR MEXICO PAR VENEZUELA PARindependent variable exceeding returns exceeding returns exceeding returns exceeding returns
Dmex 5.03 4.54 3.88 8.00[6.95]∗ [8.19]∗ [5.92]∗ [7.17]∗
Dasia −2.06 −2.05 −2.40 −4.72[−4.02]∗ [−4.49]∗ [−5.89]∗ [−6.21]∗
INVRELW eeuu 32.71 25.83 26.27 43.60[4.67]∗ [4.68]∗ [4.66]∗ [4.63]∗
BOND BETA eeuu 27.97 33.53 19.39 62.31[2.92] [3.88]∗ [2.33]∗ [3.81]∗
TERM eeuu 2.02 1.55 0.66 1.89[4.37]∗ [3.59]∗ [1.41] [2.45]∗
REALYD eeuu −1.98 −1.99 −1.69 −3.30[−4.06]∗ [−4.63]∗ [−3.69]∗ [−3.52]∗
R2 77.86% 79.60% 75.03% 81.32%
∗ significant at 5% confidence level
Panel B: Predictive regressions for Discount Brady Bonds
dependent variable
ARGENTINA DISC BRAZIL DISC MEXICO DISC VENEZUELA DISCindependent variable exceeding returns exceeding returns exceeding returns exceeding returns
Dmex 5.95 4.22 4.03 9.20[7.60]∗ [7.74]∗ [6.54]∗ [6.98]∗
Dasia −1.45 −1.98 −1.96 −5.16[−2.28]∗ [−4.11]∗ [−5.50]∗ [−5.71]∗
INVRELW eeuu 30.90 27.30 27.09 44.99[3.98]∗ [4.94]∗ [5.16]∗ [3.91]∗
BOND BETA eeuu 30.37 33.84 22.44 81.56[2.81]∗ [3.90]∗ [2.80]∗ [4.05]∗
TERM eeuu 3.32 1.33 1.33 2.58[6.69]∗ [3.06]∗ [3.33]∗ [2.86]∗
REALYD eeuu −2.65 −2.02 −2.05 −3.54[−4.84]∗ [−4.60]∗ [−4.69]∗ [−3.09]∗
R2 80.90% 78.69% 79.27% 79.86%
∗ significant at 5% confidence level
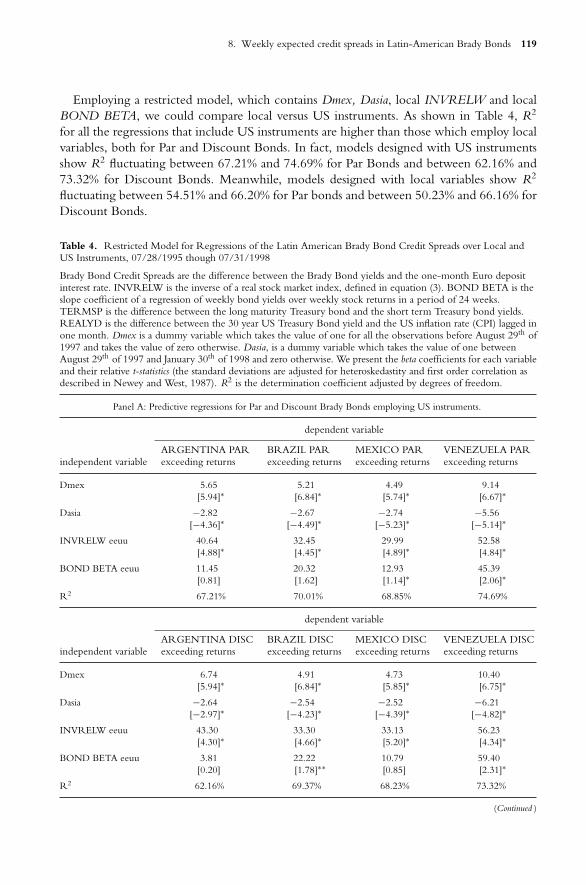
8. Weekly expected credit spreads in Latin-American Brady Bonds 119
Employing a restricted model, which contains Dmex, Dasia, local INVRELW and localBOND BETA, we could compare local versus US instruments. As shown in Table 4, R2
for all the regressions that include US instruments are higher than those which employ localvariables, both for Par and Discount Bonds. In fact, models designed with US instrumentsshow R2 fluctuating between 67.21% and 74.69% for Par Bonds and between 62.16% and73.32% for Discount Bonds. Meanwhile, models designed with local variables show R2
fluctuating between 54.51% and 66.20% for Par bonds and between 50.23% and 66.16% forDiscount Bonds.
Table 4. Restricted Model for Regressions of the Latin American Brady Bond Credit Spreads over Local andUS Instruments, 07/28/1995 though 07/31/1998
Brady Bond Credit Spreads are the difference between the Brady Bond yields and the one-month Euro depositinterest rate. INVRELW is the inverse of a real stock market index, defined in equation (3). BOND BETA is theslope coefficient of a regression of weekly bond yields over weekly stock returns in a period of 24 weeks.TERMSP is the difference between the long maturity Treasury bond and the short term Treasury bond yields.REALYD is the difference between the 30 year US Treasury Bond yield and the US inflation rate (CPI) lagged inone month. Dmex is a dummy variable which takes the value of one for all the observations before August 29th of1997 and takes the value of zero otherwise. Dasia, is a dummy variable which takes the value of one betweenAugust 29th of 1997 and January 30th of 1998 and zero otherwise. We present the beta coefficients for each variableand their relative t-statistics (the standard deviations are adjusted for heteroskedastity and first order correlation asdescribed in Newey and West, 1987). R2 is the determination coefficient adjusted by degrees of freedom.
Panel A: Predictive regressions for Par and Discount Brady Bonds employing US instruments.
dependent variable
ARGENTINA PAR BRAZIL PAR MEXICO PAR VENEZUELA PARindependent variable exceeding returns exceeding returns exceeding returns exceeding returns
Dmex 5.65 5.21 4.49 9.14[5.94]∗ [6.84]∗ [5.74]∗ [6.67]∗
Dasia −2.82 −2.67 −2.74 −5.56[−4.36]∗ [−4.49]∗ [−5.23]∗ [−5.14]∗
INVRELW eeuu 40.64 32.45 29.99 52.58[4.88]∗ [4.45]∗ [4.89]∗ [4.84]∗
BOND BETA eeuu 11.45 20.32 12.93 45.39[0.81] [1.62] [1.14]∗ [2.06]∗
R2 67.21% 70.01% 68.85% 74.69%
dependent variable
ARGENTINA DISC BRAZIL DISC MEXICO DISC VENEZUELA DISCindependent variable exceeding returns exceeding returns exceeding returns exceeding returns
Dmex 6.74 4.91 4.73 10.40[5.94]∗ [6.84]∗ [5.85]∗ [6.75]∗
Dasia −2.64 −2.54 −2.52 −6.21[−2.97]∗ [−4.23]∗ [−4.39]∗ [−4.82]∗
INVRELW eeuu 43.30 33.30 33.13 56.23[4.30]∗ [4.66]∗ [5.20]∗ [4.34]∗
BOND BETA eeuu 3.81 22.22 10.79 59.40[0.20] [1.78]∗∗ [0.85] [2.31]∗
R2 62.16% 69.37% 68.23% 73.32%
(Continued )
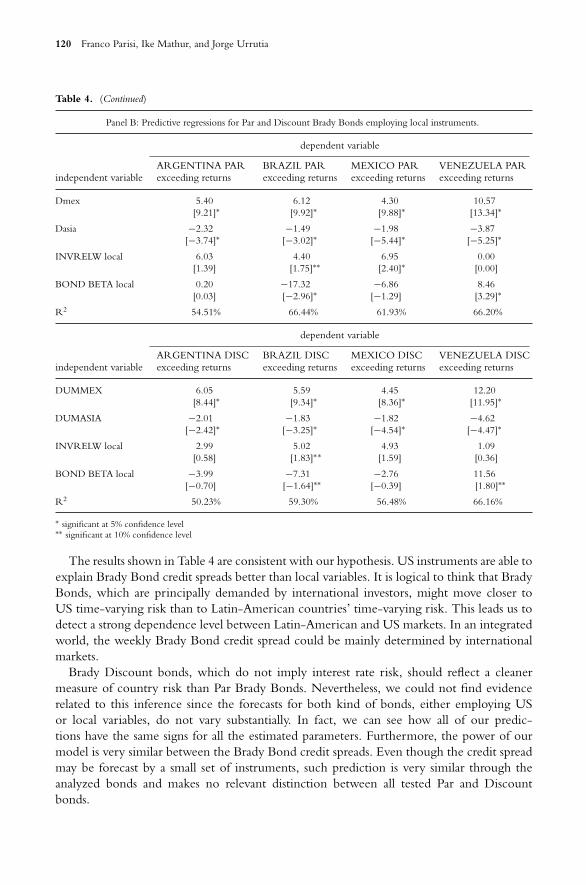
120 Franco Parisi, Ike Mathur, and Jorge Urrutia
Table 4. (Continued)
Panel B: Predictive regressions for Par and Discount Brady Bonds employing local instruments.
dependent variable
ARGENTINA PAR BRAZIL PAR MEXICO PAR VENEZUELA PARindependent variable exceeding returns exceeding returns exceeding returns exceeding returns
Dmex 5.40 6.12 4.30 10.57[9.21]∗ [9.92]∗ [9.88]∗ [13.34]∗
Dasia −2.32 −1.49 −1.98 −3.87[−3.74]∗ [−3.02]∗ [−5.44]∗ [−5.25]∗
INVRELW local 6.03 4.40 6.95 0.00[1.39] [1.75]∗∗ [2.40]∗ [0.00]
BOND BETA local 0.20 −17.32 −6.86 8.46[0.03] [−2.96]∗ [−1.29] [3.29]∗
R2 54.51% 66.44% 61.93% 66.20%
dependent variable
ARGENTINA DISC BRAZIL DISC MEXICO DISC VENEZUELA DISCindependent variable exceeding returns exceeding returns exceeding returns exceeding returns
DUMMEX 6.05 5.59 4.45 12.20[8.44]∗ [9.34]∗ [8.36]∗ [11.95]∗
DUMASIA −2.01 −1.83 −1.82 −4.62[−2.42]∗ [−3.25]∗ [−4.54]∗ [−4.47]∗
INVRELW local 2.99 5.02 4.93 1.09[0.58] [1.83]∗∗ [1.59] [0.36]
BOND BETA local −3.99 −7.31 −2.76 11.56[−0.70] [−1.64]∗∗ [−0.39] [1.80]∗∗
R2 50.23% 59.30% 56.48% 66.16%
∗ significant at 5% confidence level∗∗ significant at 10% confidence level
The results shown in Table 4 are consistent with our hypothesis. US instruments are able toexplain Brady Bond credit spreads better than local variables. It is logical to think that BradyBonds, which are principally demanded by international investors, might move closer toUS time-varying risk than to Latin-American countries’ time-varying risk. This leads us todetect a strong dependence level between Latin-American and US markets. In an integratedworld, the weekly Brady Bond credit spread could be mainly determined by internationalmarkets.
Brady Discount bonds, which do not imply interest rate risk, should reflect a cleanermeasure of country risk than Par Brady Bonds. Nevertheless, we could not find evidencerelated to this inference since the forecasts for both kind of bonds, either employing USor local variables, do not vary substantially. In fact, we can see how all of our predic-tions have the same signs for all the estimated parameters. Furthermore, the power of ourmodel is very similar between the Brady Bond credit spreads. Even though the credit spreadmay be forecast by a small set of instruments, such prediction is very similar through theanalyzed bonds and makes no relevant distinction between all tested Par and Discountbonds.
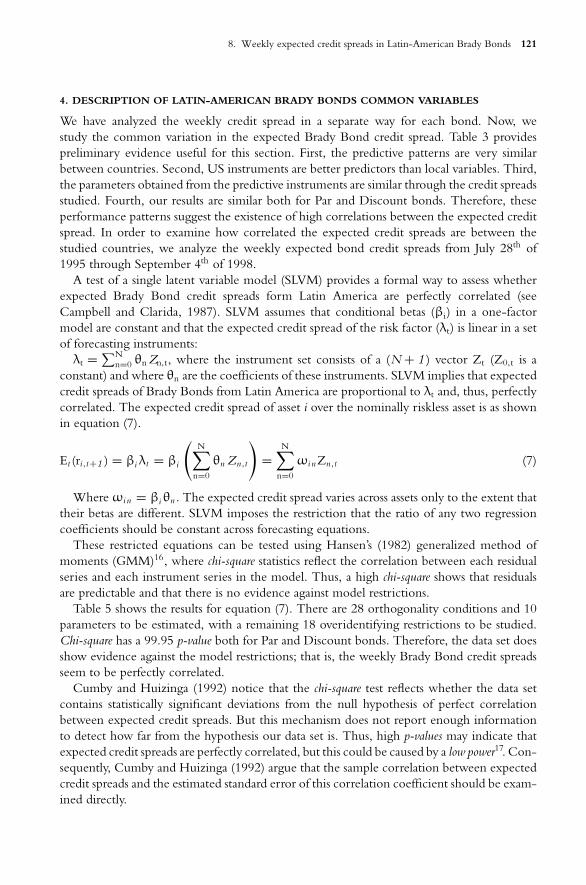
8. Weekly expected credit spreads in Latin-American Brady Bonds 121
4. DESCRIPTION OF LATIN-AMERICAN BRADY BONDS COMMON VARIABLES
We have analyzed the weekly credit spread in a separate way for each bond. Now, westudy the common variation in the expected Brady Bond credit spread. Table 3 providespreliminary evidence useful for this section. First, the predictive patterns are very similarbetween countries. Second, US instruments are better predictors than local variables. Third,the parameters obtained from the predictive instruments are similar through the credit spreadsstudied. Fourth, our results are similar both for Par and Discount bonds. Therefore, theseperformance patterns suggest the existence of high correlations between the expected creditspread. In order to examine how correlated the expected credit spreads are between thestudied countries, we analyze the weekly expected bond credit spreads from July 28th of1995 through September 4th of 1998.
A test of a single latent variable model (SLVM) provides a formal way to assess whetherexpected Brady Bond credit spreads form Latin America are perfectly correlated (seeCampbell and Clarida, 1987). SLVM assumes that conditional betas (βi) in a one-factormodel are constant and that the expected credit spread of the risk factor (λt) is linear in a setof forecasting instruments:
λt = ∑Nn=0 θn Zn,t, where the instrument set consists of a (N + 1 ) vector Zt (Z0,t is a
constant) and where θn are the coefficients of these instruments. SLVM implies that expectedcredit spreads of Brady Bonds from Latin America are proportional to λt and, thus, perfectlycorrelated. The expected credit spread of asset i over the nominally riskless asset is as shownin equation (7).
Et (ri,t+1 ) = βi λt = βi
(N∑
n=0
θn Zn,t
)=
N∑n=0
ωi nZn,t (7)
Where ωi n = βi θn . The expected credit spread varies across assets only to the extent thattheir betas are different. SLVM imposes the restriction that the ratio of any two regressioncoefficients should be constant across forecasting equations.
These restricted equations can be tested using Hansen’s (1982) generalized method ofmoments (GMM)16, where chi-square statistics reflect the correlation between each residualseries and each instrument series in the model. Thus, a high chi-square shows that residualsare predictable and that there is no evidence against model restrictions.
Table 5 shows the results for equation (7). There are 28 orthogonality conditions and 10parameters to be estimated, with a remaining 18 overidentifying restrictions to be studied.Chi-square has a 99.95 p-value both for Par and Discount bonds. Therefore, the data set doesshow evidence against the model restrictions; that is, the weekly Brady Bond credit spreadsseem to be perfectly correlated.
Cumby and Huizinga (1992) notice that the chi-square test reflects whether the data setcontains statistically significant deviations from the null hypothesis of perfect correlationbetween expected credit spreads. But this mechanism does not report enough informationto detect how far from the hypothesis our data set is. Thus, high p-values may indicate thatexpected credit spreads are perfectly correlated, but this could be caused by a low power17. Con-sequently, Cumby and Huizinga (1992) argue that the sample correlation between expectedcredit spreads and the estimated standard error of this correlation coefficient should be exam-ined directly.
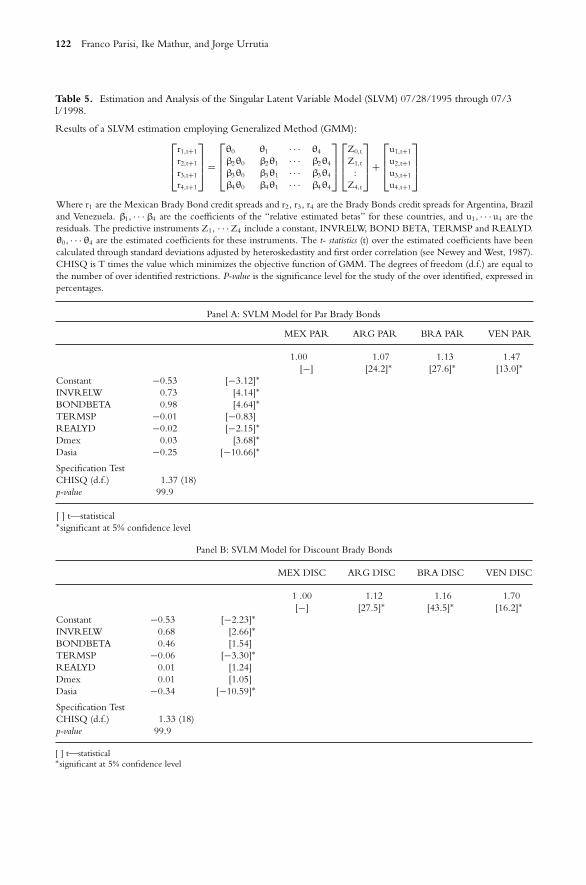
122 Franco Parisi, Ike Mathur, and Jorge Urrutia
Table 5. Estimation and Analysis of the Singular Latent Variable Model (SLVM) 07/28/1995 through 07/3l/1998.
Results of a SLVM estimation employing Generalized Method (GMM):⎡⎢⎢⎣
r1,t+1
r2,t+1
r3,t+1
r4,t+1
⎤⎥⎥⎦ =
⎡⎢⎢⎣
θ0 θ1 · · · θ4
β2θ0 β2θ1 · · · β2θ4
β3θ0 β3θ1 · · · β3θ4
β4θ0 β4θ1 · · · β4θ4
⎤⎥⎥⎦
⎡⎢⎢⎣
Z0,t
Z1,t
:Z4,t
⎤⎥⎥⎦ +
⎡⎢⎢⎣
u1,t+1
u2,t+1
u3,t+1
u4,t+1
⎤⎥⎥⎦
Where r1 are the Mexican Brady Bond credit spreads and r2, r3, r4 are the Brady Bonds credit spreads for Argentina, Braziland Venezuela. β1, · · · β4 are the coefficients of the “relative estimated betas” for these countries, and u1, · · · u4 are theresiduals. The predictive instruments Z1, · · · Z4 include a constant, INVRELW, BOND BETA, TERMSP and REALYD.θ0, · · · θ4 are the estimated coefficients for these instruments. The t- statistics (t) over the estimated coefficients have beencalculated through standard deviations adjusted by heteroskedastity and first order correlation (see Newey and West, 1987).CHISQ is T times the value which minimizes the objective function of GMM. The degrees of freedom (d.f.) are equal tothe number of over identified restrictions. P-value is the significance level for the study of the over identified, expressed inpercentages.
Panel A: SVLM Model for Par Brady Bonds
MEX PAR ARG PAR BRA PAR VEN PAR
1.00 1.07 1.13 1.47[−] [24.2]∗ [27.6]∗ [13.0]∗
Constant −0.53 [−3.12]∗
INVRELW 0.73 [4.14]∗
BONDBETA 0.98 [4.64]∗
TERMSP −0.01 [−0.83]REALYD −0.02 [−2.15]∗
Dmex 0.03 [3.68]∗
Dasia −0.25 [−10.66]∗
Specification TestCHISQ (d.f.) 1.37 (18)p-value 99.9
[ ] t—statistical∗significant at 5% confidence level
Panel B: SVLM Model for Discount Brady Bonds
MEX DISC ARG DISC BRA DISC VEN DISC
1 .00 1.12 1.16 1.70[−] [27.5]∗ [43.5]∗ [16.2]∗
Constant −0.53 [−2.23]∗
INVRELW 0.68 [2.66]∗
BONDBETA 0.46 [1.54]TERMSP −0.06 [−3.30]∗
REALYD 0.01 [1.24]Dmex 0.01 [1.05]Dasia −0.34 [−10.59]∗
Specification TestCHISQ (d.f.) 1.33 (18)p-value 99.9
[ ] t—statistical∗significant at 5% confidence level
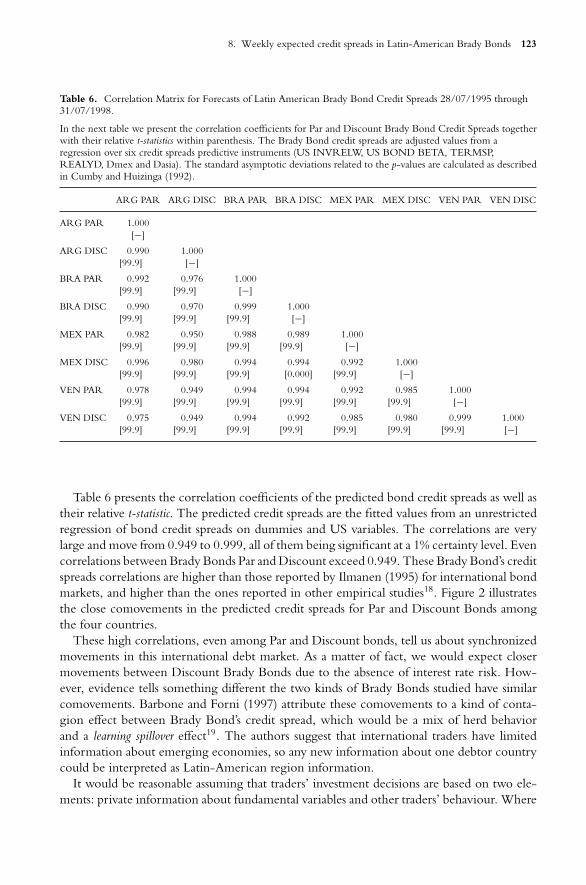
8. Weekly expected credit spreads in Latin-American Brady Bonds 123
Table 6. Correlation Matrix for Forecasts of Latin American Brady Bond Credit Spreads 28/07/1995 through31/07/1998.
In the next table we present the correlation coefficients for Par and Discount Brady Bond Credit Spreads togetherwith their relative t-statistics within parenthesis. The Brady Bond credit spreads are adjusted values from aregression over six credit spreads predictive instruments (US INVRELW, US BOND BETA, TERMSP,REALYD, Dmex and Dasia). The standard asymptotic deviations related to the p-values are calculated as describedin Cumby and Huizinga (1992).
ARG PAR ARG DISC BRA PAR BRA DISC MEX PAR MEX DISC VEN PAR VEN DISC
ARG PAR 1.000[−]
ARG DISC 0.990 1.000[99.9] [−]
BRA PAR 0.992 0.976 1.000[99.9] [99.9] [−]
BRA DISC 0.990 0.970 0.999 1.000[99.9] [99.9] [99.9] [−]
MEX PAR 0.982 0.950 0.988 0.989 1.000[99.9] [99.9] [99.9] [99.9] [−]
MEX DISC 0.996 0.980 0.994 0.994 0.992 1.000[99.9] [99.9] [99.9] [0.000] [99.9] [−]
VEN PAR 0.978 0.949 0.994 0.994 0.992 0.985 1.000[99.9] [99.9] [99.9] [99.9] [99.9] [99.9] [−]
VEN DISC 0.975 0.949 0.994 0.992 0.985 0.980 0.999 1.000[99.9] [99.9] [99.9] [99.9] [99.9] [99.9] [99.9] [−]
Table 6 presents the correlation coefficients of the predicted bond credit spreads as well astheir relative t-statistic. The predicted credit spreads are the fitted values from an unrestrictedregression of bond credit spreads on dummies and US variables. The correlations are verylarge and move from 0.949 to 0.999, all of them being significant at a 1% certainty level. Evencorrelations between Brady Bonds Par and Discount exceed 0.949. These Brady Bond’s creditspreads correlations are higher than those reported by Ilmanen (1995) for international bondmarkets, and higher than the ones reported in other empirical studies18. Figure 2 illustratesthe close comovements in the predicted credit spreads for Par and Discount Bonds amongthe four countries.
These high correlations, even among Par and Discount bonds, tell us about synchronizedmovements in this international debt market. As a matter of fact, we would expect closermovements between Discount Brady Bonds due to the absence of interest rate risk. How-ever, evidence tells something different the two kinds of Brady Bonds studied have similarcomovements. Barbone and Forni (1997) attribute these comovements to a kind of conta-gion effect between Brady Bond’s credit spread, which would be a mix of herd behaviorand a learning spillover effect19. The authors suggest that international traders have limitedinformation about emerging economies, so any new information about one debtor countrycould be interpreted as Latin-American region information.
It would be reasonable assuming that traders’ investment decisions are based on two ele-ments: private information about fundamental variables and other traders’ behaviour. Where
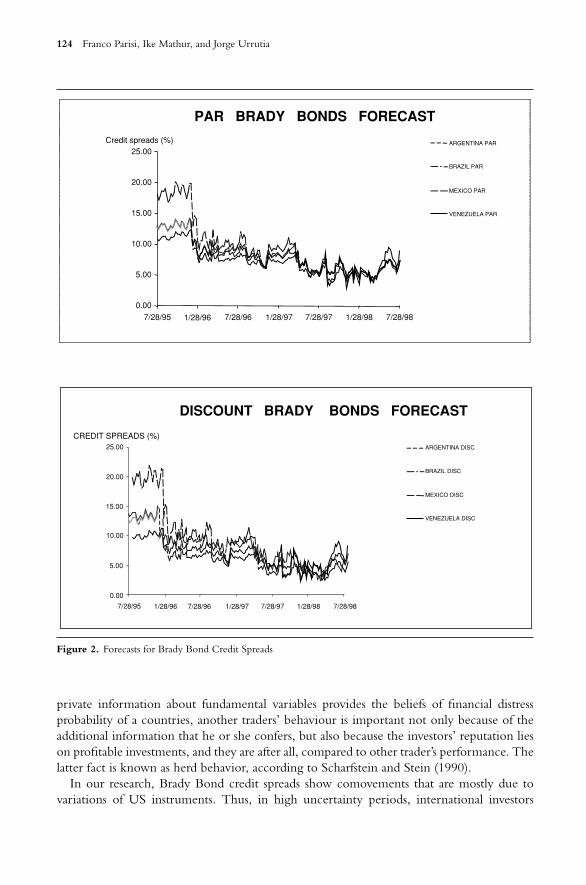
124 Franco Parisi, Ike Mathur, and Jorge Urrutia
PAR BRADY BONDS FORECAST
0.00
5.00
10.00
15.00
20.00
25.00
7/28/95 1/28/96 7/28/96 1/28/97 7/28/97 1/28/98 7/28/98
Credit spreads (%) ARGENTINA PAR
BRAZIL PAR
MEXICO PAR
VENEZUELA PAR
DISCOUNT BRADY BONDS FORECAST
0.00
5.00
10.00
15.00
20.00
25.00
7/28/95 1/28/96 7/28/96 1/28/97 7/28/97 1/28/98 7/28/98
CREDIT SPREADS (%)ARGENTINA DISC
BRAZIL DISC
MEXICO DISC
VENEZUELA DISC
Figure 2. Forecasts for Brady Bond Credit Spreads
private information about fundamental variables provides the beliefs of financial distressprobability of a countries, another traders’ behaviour is important not only because of theadditional information that he or she confers, but also because the investors’ reputation lieson profitable investments, and they are after all, compared to other trader’s performance. Thelatter fact is known as herd behavior, according to Scharfstein and Stein (1990).
In our research, Brady Bond credit spreads show comovements that are mostly due tovariations of US instruments. Thus, in high uncertainty periods, international investors
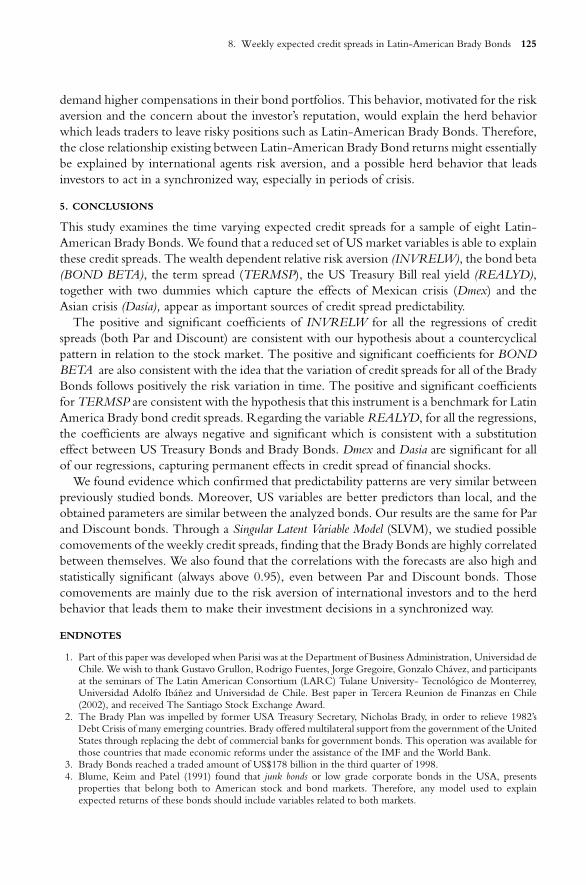
8. Weekly expected credit spreads in Latin-American Brady Bonds 125
demand higher compensations in their bond portfolios. This behavior, motivated for the riskaversion and the concern about the investor’s reputation, would explain the herd behaviorwhich leads traders to leave risky positions such as Latin-American Brady Bonds. Therefore,the close relationship existing between Latin-American Brady Bond returns might essentiallybe explained by international agents risk aversion, and a possible herd behavior that leadsinvestors to act in a synchronized way, especially in periods of crisis.
5. CONCLUSIONS
This study examines the time varying expected credit spreads for a sample of eight Latin-American Brady Bonds. We found that a reduced set of US market variables is able to explainthese credit spreads. The wealth dependent relative risk aversion (INVRELW), the bond beta(BOND BETA), the term spread (TERMSP), the US Treasury Bill real yield (REALYD),together with two dummies which capture the effects of Mexican crisis (Dmex) and theAsian crisis (Dasia), appear as important sources of credit spread predictability.
The positive and significant coefficients of INVRELW for all the regressions of creditspreads (both Par and Discount) are consistent with our hypothesis about a countercyclicalpattern in relation to the stock market. The positive and significant coefficients for BONDBETA are also consistent with the idea that the variation of credit spreads for all of the BradyBonds follows positively the risk variation in time. The positive and significant coefficientsfor TERMSP are consistent with the hypothesis that this instrument is a benchmark for LatinAmerica Brady bond credit spreads. Regarding the variable REALYD, for all the regressions,the coefficients are always negative and significant which is consistent with a substitutioneffect between US Treasury Bonds and Brady Bonds. Dmex and Dasia are significant for allof our regressions, capturing permanent effects in credit spread of financial shocks.
We found evidence which confirmed that predictability patterns are very similar betweenpreviously studied bonds. Moreover, US variables are better predictors than local, and theobtained parameters are similar between the analyzed bonds. Our results are the same for Parand Discount bonds. Through a Singular Latent Variable Model (SLVM), we studied possiblecomovements of the weekly credit spreads, finding that the Brady Bonds are highly correlatedbetween themselves. We also found that the correlations with the forecasts are also high andstatistically significant (always above 0.95), even between Par and Discount bonds. Thosecomovements are mainly due to the risk aversion of international investors and to the herdbehavior that leads them to make their investment decisions in a synchronized way.
ENDNOTES
1. Part of this paper was developed when Parisi was at the Department of Business Administration, Universidad deChile. We wish to thank Gustavo Grullon, Rodrigo Fuentes, Jorge Gregoire, Gonzalo Chavez, and participantsat the seminars of The Latin American Consortium (LARC) Tulane University- Tecnologico de Monterrey,Universidad Adolfo Ibanez and Universidad de Chile. Best paper in Tercera Reunion de Finanzas en Chile(2002), and received The Santiago Stock Exchange Award.
2. The Brady Plan was impelled by former USA Treasury Secretary, Nicholas Brady, in order to relieve 1982’sDebt Crisis of many emerging countries. Brady offered multilateral support from the government of the UnitedStates through replacing the debt of commercial banks for government bonds. This operation was available forthose countries that made economic reforms under the assistance of the IMF and the World Bank.
3. Brady Bonds reached a traded amount of US$178 billion in the third quarter of 1998.4. Blume, Keim and Patel (1991) found that junk bonds or low grade corporate bonds in the USA, presents
properties that belong both to American stock and bond markets. Therefore, any model used to explainexpected returns of these bonds should include variables related to both markets.
126 Franco Parisi, Ike Mathur, and Jorge Urrutia
5. Several recent studies formalize the idea that the subsistence level varies over time because of individualconsumers’ adaptive tastes.
6. This index was created by Morgan Stanley. The purpose of this index is to homologate 60% of the stock marketsof each of the countries that are monitored.
7. Capital Asset Pricing Model.8. The yield curve is a curve constructed from riskless bond returns.9. All Brady Bonds studied in this article are backed up in principal with US Treasury Bonds Zero coupons, bullet
amortization and guaranteed interests for over one year, and are renewable.10. We made use of eurodeposits because this instrument is unaffected by local interest rates.11. Those countries with a strong relationship with the oil price have established some guarantees related to some
oil exportation indexes.12. The utilization of a restricted model is suggested by the author since it is impossible to construct a faithful
TERMSP and REALYD series for Latin America. This fact is explained by the inexistence of riskless instrumentsthat have a long enough maturity.
13. The t-statistics over the estimated parameters have been calculated with standard deviations adjusted for het-eroskedasticity and first order autocorrelation (see Newey and West, 1987).
14. See Fama and French (1989).15. Cumby and Pastine (2000) find a fall in Brady returns from August 1998, the date which Russia announced
payment cessations and devaluation. This fact, produced by the Asian crisis, shows us that this shock affectednegatively in a second stage the excess Brady Bond returns, increasing the risk premium for all the Latin-American countries.
16. This method is built on the orthogonality of the regression residuals ui,t+1 with the instrument set Zt . Givena sample of T observations, the GMM forms a vector of M(N + 1 ) orthogonality conditions g = vec(u’Z),where u is the T∗ M matrix of residuals and Z is the T∗(N + 1 ) matrix of instruments. An algorithm searchesfor parameter values that minimize the quadratic form (multiplied by T) serving as a measure for goodness offit for the model. It is asymptotically chi-square distributed with degrees of freedom equal to the number ofoveridentifying restrictions.
17. In statistical terms, a low power means the probability of a type II error, which implies not rejecting the falsehypothesis.
18. See Campbell and Clarida (1987) and Cumby and Huizinga (1992) whose studies analyzed correlations withininternational currency markets, stock markets, currency returns and international bond return markets.
19. Barbone and Forni (1997) study reactions in Brady Bonds markets due to the Mexican crisis, across time series.
REFERENCES
Barbone, L. and L. Forni (1997). Are markets learning? Behavior in the Secondary Market for Brady Bonds. CentralEurope Department, World Bank.
Blume, M., D. Keim and S. Patel (1989). Returns and Volatility of Low-Grade Bonds. Journal of Finance 46, 49–74.Campbell, J. and J. Ammer (1993). What Moves the Stock and Bond Markets? A Variance Decomposition for
Long-Term Asset Returns. Journal of Finance 48, 3–37.Campbell, J. and R. Clarida (1987). The Term Structure of Euromarket Interest Rates: an Empirical Examination.
Journal of Monetary Economics 19, 25–44.Chen, N. (1991). Financial Investment Opportunities and the Macro economy. Journal of Finance 46, 529–554.Cumby, R. and J. Huizinga (1992). Investigating the Correlation of Unobserved Expectations, Expected Returns
in Equity and Foreign Exchange Markets and other Examples. Journal of Monetary Economics 30, 217–253.Cumby, R. and T. Pastine (2000). Emerging Market Debt: Measuring Credit Quality and Examining Relative
Pricing, Georgetown University.DeBondt, W. and M. Bange (1992). Inflation Forecast Errors and Time Variation in Term Premia. Journal of Financial
and Quantitative Analysis 27, 479–496.Fama, E. and R. Bliss (1987). The Information in Long Maturity Forward Rates. American Economic Review 77,
680–692.Fama, E. and K. French (1989). Business Condition and Expected Returns on Stocks and Bonds. Journal of Financial
Economics 25, 23–49.Hansen, L. (1982). Large Sample Properties of Generalized Method of Moments Estimators. Econometrica 50,
1029–1054.Hodrick, R. (1987). The Empirical Evidence on the Efficiency of Forward and Futures Foreign Exchange Markets
(Harwood Academic Publishers, New York).Ilmanen, A. (1995). Time Varying Expected Returns in International Bonds Markets. Journal of Finance 50, 481–506.

8. Weekly expected credit spreads in Latin-American Brady Bonds 127
Kaplan, P. (1998). Stocks, Brady Bonds, and Currencies, Investment Opportunities in Latin America, NorthwesternUniversity.
Keim, D. and K. Strambaugh (1986). Predicting Returns in the Bond and the Stock Markets. Journal of FinancialEconomics 17, 357–390.
Lauterbash, B. (1989). Consumption Volatility, Production Volatility, Spot-Rate Volatility, and the Returns onTreasury Bills and Bonds. Journal of Financial Economics 24, 155–179.
Mankiw, G. (1986). The Term Structure of Interest Rate Revisited. Brooking Papers on Economic Activity, 61–110.Marcus, A. (1989). An Equilibrium Theory of Excess Volatility and Mean Reversion in Stock Market Prices.
NBER Working paper 3106.Newey, W. and K. West (1987). A Simple, Positive Semi-Definitive, Heteroscedasticity and Autocorrelation Con-
sistent Covariance Matrix. Econometrica 55, 703–708.Scharfstein, D. and J. Stein (1990). Herd Behavior and Investment. American Economic Review 80.
9. RETHINKING PROJECT FINANCE
ANDREW H. CHEN1
1. INTRODUCTION
The successful development of large-scale infrastructure projects such as power plants, road-ways, bridges, dams, seaports, airports, and telecommunications networks is vitally importantfor economic growth in developed and developing countries alike. Consequently, ensuringthat such projects are successfully undertaken and completed should be a top economicpriority, particularly for the governments of developing countries. In the past decade, thescale of global capital investment in infrastructure projects has increased rapidly. Esty (2004)points out that the total project-financed investments worldwide grew at a compound annualrate of almost 20% through most of the 1990s and reached $165 billion in 2003.2 Most large-scale infrastructure projects, by their very nature involving massive capital investment, longcompletion times, and high levels of risks,3 present formidable financial challenges to devel-oping countries of the world. Infrastructure development cannot succeed without adequatefinancing, and it is clear that large-scale infrastructure development in developing economiessurely requires substantial amounts of technology and capital from developed countries inNorth America and Europe.
Although historically we have witnessed a number of large and successful infrastructureprojects, we have also seen many spectacular failures. In their study of sixty engineeringprojects with an average size of $1 billion undertaken around the world between 1980 and2000, Miller and Lessard (2000) found that almost 40% of them performed poorly and wereeither abandoned completely or restructured due to severe financial crisis.4 In their morerecent study of the performance of large transport infrastructure projects, Flyvbjerg et al.(2003) found that cost overruns of 50% to 100% and revenue shortfalls of 20% to 70% werenot uncommon.5
130 Andrew H. Chen
The typical approaches to financing large-scale infrastructure projects are well-known.Projects are typically financed on a stand-alone basis, giving rise to an independent projectcompany for the purpose of financing the construction, operation, and maintenance ofa specific public investment project. The project company exists as a legally independententity, usually has a clearly-defined lifespan, and most often is financed with equity capitalfrom one or a small number of firms and with project loans from a consortium of banks.The current practice of creating project companies with the structural attributes of highleverage and concentrated equity ownership has led to Esty’s recent conclusion that “Projectfinance, as it turns out, just happens to be a particularly interesting and effective settingin which to illustrate the simple yet critical idea that ‘structure matters’ ”.6 I believe thatexisting approaches to financing infrastructure projects are largely to blame for some of thefailures of large-scale investment projects in the world. Existing approaches are based oninherently flawed economic justifications. If the financing problems that have repeatedlyplagued infrastructure projects are to be solved, we must consider new approaches.
This paper is organized as follows. Section 2 discusses some of the shortcomings of existingapproaches to infrastructure financing. Section 3 discusses the benefits of financing infras-tructure projects through the capital markets and describes innovations in issuing projectbonds, project stocks, and project preferred stocks. Finally, the paper concludes with a briefsummary.
2. EXISTING APPROACHES TO INFRASTRUCTURE FINANCINGAND THEIR SHORTCOMINGS
Currently, there exist two main approaches to financ ng infrastructure projects. The firstapproach is one that I will call the Build-Own-Operate (BOO) approach; and the secondapproach is widely known as the Build-Operate-Transfer (BOT) or the Public-Private-Partnership(PPP) approach.
2.1. The BOO Approach
In many countries, especially those with planned economies, major infrastructure projectsare built, owned, and operated by the government. The procedure for a particular publicinvestment project usually begins with government estimates of the total cost of undertakingthe project, including costs of project construction and project operations and maintenance.The government then evaluates, compares, and chooses from available financing alternatives.The set of financing alternatives usually includes public funds spent on the hired projectcompanies, domestic and international bank loans, and privately-placed project bonds. Notsurprisingly, jurisdiction over the aforementioned steps falls under the influence of domesticpoliticians. There are several problems inherent in this basic approach. First, bidding oninfrastructure projects is often subject to bribery and corruption. Second, deciding upon acomplex financing structure requires much negotiation and re-negotiation that can causedelays or even project halts. Third, approval of funding for state-owned projects must oftennavigate through lengthy and bureaucratic political processes. And fourth, upon completionof project construction, actual operation and maintenance are often inefficient by virtueof the state’s ownership of the project. Indeed, we can draw lessons from the numerousprivatizations of state-owned infrastructure projects over the past few decades. We know that
9. Rethinking project finance 131
such privatizations occurred largely because state-owned enterprises (SOEs) suffered frominefficiency and poor performance stemming from a lack of proper incentives and rewardsystems for managers and workers.
It is worth pointing out that the privatization of even some well functioning publicly-owned infrastructure projects can arise from other reasons such as the government’s budgetaryneeds. As Baglole (2003) has recently stated concerning privatization in Hong Kong: “Tohelp reduce a record budget deficit, the government plans to sell partial stakes or securitizerevenues from major assets over the next 18 months, from its airport to its tunnels and evenits housing department. The program could raise anywhere from $14 billion to $40 billionin coming years, depending on what goes on the block, and would put Hong Kong at theforefront of privatization efforts globally.”7
Experience with such privatizations suggests that creating immediate private ownership ofa public project among a diverse group of investors–both domestic and from abroad—maylead to a quicker, more successful type of infrastructure financing. In later sections, I willillustrate how this rapid financing may be accomplished through the capital markets.
2.2. The BOT or the PPP Approach
In order to tap investment capital from private sectors while improving the efficiency ofpublic investment projects, governments in many countries have been widely encouragedto apply Build-Operate-Transfer (BOT) or Public-Private-Partnership (PPP)8 approaches toencourage the participation of private sectors in infrastructure development. Although BOT(or PPP) is unique to the infrastructure project and to the locale, the basic approach involvesawarding a project to a company that operates it for twenty-five to thirty-five years beforeit is transferred back to the government. The sole difference between BOT and PPP lies inthe two approaches’ output criteria. In the PPP model, unlike with BOT, the governmentbuys services from project companies at agreed-upon prices and thus has a greater influencein production decisions. As a result, project companies are not overly exposed to changingmarket conditions for the outputs. Nevertheless, use of the BOT model is widespread inmany countries. As of May 2004, there were 240 BOT projects in East Asia and 240 inSouth America.9 As for the PPP approach, it is reported that, since the early 1990s, the UKhas signed over 569 contracts with an overall value of 52.6 billion pounds having been spenton PPP projects.10 Compared to the BOO approach, the newer BOT and PPP approachescan undoubtedly improve the efficiency of infrastructure financing. However, as I will arguebelow, both the BOT and the PPP approaches still suffer from some serious shortcomingsthat can hinder the performances of infrastructure projects around the world.
2.2.1. Inefficient Bidding Processes
In BOT and PPP project bidding, domestic and foreign project companies usually submit bidsfor the entire project to government agencies, which make the final selection. Therefore, theprocess is not immune from the influence of domestic politicians and concomitant briberyand corruption. For example, Mr. Estrada, the former President of the Philippines, statedthat it was his administration’s policy not to grant BOT projects any government guarantee,and he confirmed that Mr. Jimenez, a former businessman, offered him $14 million for adirect government guarantee on the multibillion dollars Caliraya-Botocan-Kalayaan (CBK)
132 Andrew H. Chen
hydropower project which he had declined. Mr. Estrada further stated that Mr. Ramos, theformer President of the Philippines, and Mr. Abrille, the former Philippine ambassador toArgentina, had lobbied for IMPSA (Industrias Metalurgicas Pescarmona Sociedad Anonima)for the CBK project, and that IMPSA contract was not formally consummated in his twoand a half years in office. Nevertheless, it took the new administration only a few days toconclude the deal.11
While it is true that using public tenders in BOT and PPP project bidding processescan increase efficiency in project cost reduction, the governments of some countries oftenimpose restrictions on bidding that work against their own best intentions. Instead of allow-ing open tenders for projects, some governments, based upon their criteria, negotiate anddirectly assign project contracts to closely-tied investment companies. According to the WorldBank’s mid-1999 reports on the impact of the Southeast Asian financial crisis, a number ofgovernments and enterprises in the region had to incur debts of billions of U.S. dollars dueto bad negotiations in BOT investment projects. For example, Indonesia and the Philip-pines incurred some US $10 billion and US $6 billion in bad debt, respectively, from BOTinvestments.12
It is worthwhile to note that some governments now employ new measures to promoteand increase capital investment via the BOT format. For example, it was reported thatthe Taiwan Cabinet’s Public Construction Commission finalized a plan of allocating quotasconcerning BOT projects each government agency should sign up with private investorseach year and offering monetary awards to government employees with superb performancein winning BOT contracts.13
2.2.2. Imperfect Project Contracts
Asian countries in particular have frequently invited firms and contractors from abroad toinvest in their infrastructure projects under the BOT and PPP approaches. Because theseforeign firms and contractors often possess advanced technologies and vast amounts of capital,domestic politicians may seek to provide enticements via the “red carpet,” i.e., financialincentives allowing the creation of tax-free bonds for infrastructure; or multi-year tax holidaysfor infrastructure investment. However, a red carpet, if not carefully maintained, can beeasily transformed into so much red tape. For example, the Hong-Kong based HopewellHoldings secured an ambitious road and train system BOT project in Bangkok in the early1990s for a 30-year operation with concession of taxes and other benefits. The total worthof this road and rail project was approximately $4 billion. However, in January 1998 theThai Government, citing major delays and cost overruns, ordered the disengagement ofHopewell from Bangkok’s BOT project. In the end, the Thai government was only willingto reimburse Hopewell a fraction of the $600 million the infrastructure company had spenton the project.14
Another instance of unsuccessful BOT infrastructure project involved the U.S. firm Con-gentrix Energy Inc. Congentrix had been invited by the Indian government to join withHong Kong’s China Light and Power Ltd. as a partner in the project. In 1992, the twocompanies were to invest in and develop a $1.6 billion Mangalore power project in the southIndia state of Karnataka. The project was designated as a “fast-track” project, which enti-tled it to federal financial guarantees. Mangalore Power Co. (MPC), the company set up byCongentrix and China Light and Power to develop the project, waited for over 7 years to get
9. Rethinking project finance 133
clearance for executing the project. During those years, MPC spent more than $20 millionand fought several public interest litigations for two years, eventually prevailing. However,there was a pending two-year-old suit alleging the payment of $13.8 million in bribes toIndian officials. After a lower court ordered an investigation into the allegations of corrup-tion, MPC appealed to the Supreme Court in April 1998, and the justices reserved the casefor judgment in January 1999. MPC waited for almost a year without a verdict; as a result,Cogentrix quit the project on December 9, 1999.15 On December 13, 1999, four days afterCogentrix announced its withdrawal from the power project, the Supreme Court of Indiagave a judgment in favor of MPC.16
These examples illustrate that sometimes a very lengthy time is required to conduct nego-tiations and renegotiations among project companies, foreign and domestic banks, and politi-cians of the host country. Companies engaged in a project will typically bear almost all ofthe risks—both financial and political—yet will lack adequate diversification. Therefore,countries in which the political processes of project approval are mired in red tape will havedifficulty in attracting foreign project companies for infrastructure projects.
The PPP approach to project finance is also often subject to political risks. For example,Enron Corporation built a $2.9 billion power plant in Maharashtra, India that resulted inconsiderable controversy in 2001. Enron’s plan was the first of the “fast-track” PPP powerprojects signed in 1995 and the only one to have been successfully implemented in India.The Dabhol Power Company (DPC), in which Enron held a 65 percent share, and its solecustomer, the Maharashtra State Electricity Board (MSEB), had been in dispute on the issueof tariffs. MSEB owed DPC $45 million in unpaid bills; and DPC insisted the tariff—threetimes higher than that typically levied by Indian power producers—reflected high capitalcosts, rising fuel costs, and the depreciation of the rupee since the contract was signed in1995. DPC had issued a preliminary notice to cancel its contract with MSEB. As a result,the Indian and foreign banks decided to force the closure of the Enron power plan for a yearin June 2001 to give the two partners in the project a chance to discuss and reconcile theirdifferences.17
The above examples underscore the fact that any project company in BOT or PPP financ-ing which engages in direct investment on infrastructures invariably must deal with bureau-cratic red tape and political risk because, ultimately, the key decisions rest in the hands ofhost-country politicians.
In addition, changes in political administration can have an ex-post impact on the viabilityof agreed-upon BOT or PPP contracts. For example, at the urging of the World Bank andthe International Monetary Fund, the government of Turkey adopted in 2000 the BOTapproach to its electricity sector. However, in 2003 the new Turkish government licensed72 new power plants with outputs ranging up to 1,120MW, and at the same time it movedto cancel 30 BOT projects with a combined capacity of 2,846MW due to high outputcosts.18
It is also important to point out that the enforcement of contracts agreed to by theproject companies and the governments under BOT or PPP laws is often subject to thejudicial interpretation of the courts. For example, the Supreme Court of the Philippineson January 21 of 2004 issued a resolution affirming its May 5, 2003 decision declaring asnull and void Piatco’s (Philippine International Air Terminals Co.) BOT contracts in theNAIA-3 (Terminal-3 at the Ninoy Aquino International Airport) project, which was valued
134 Andrew H. Chen
at $650 million.19 The ruling had a significant impact on various parties involved. Pistco’sGerman partner, which has written off some $313 million in its investment in the Terminal-3project, vowed to pursue its claims on the facility.20 It has also been argued that the proprietyof security arrangements for the investments in the project, particularly those provided byinternational financing institutions (e.g., the Asian Development Bank and World Bank’sInternational Financing Corp., which had approved a $440-million loan package for theproject) should not be left to the court’s decision.21
2.2.3. Lack of Diversification and Liquidity in Project Finance
The number of participants in project finance under the BOT or PPP approaches is usuallyvery small, giving rise to substantial illiquidity and risk concentration. For instance, somegovernments usually allow private firms to apply either singly or through the formation ofa consortium that is restricted to four members for tenders. The number of members in thelending bank consortium is also usually quite small. Therefore, the BOT and PPP approachesdo not provide the benefits of risk sharing in the face of high project risks. For instance, theTaiwan government launched a BOT project for a high-speed rail link between Taipei andthe CKS International Airport in 1997. But the two contractors, Evertransit InternationalCo. and BES Engineering Corp., both abandoned the project citing financial problems andtechnical difficulties. As a result, the government scrapped the project in April 2003 after sixyears of planning.22
In addition to problems of illiquidity under the BOT and the PPP approaches, any contractthat permits private firms to operate projects for twenty-five to thirty-five years and thentransfer them to the government creates severe management incentive problems. As one caneasily see, managers of project companies under either a BOT or a PPP contract would haveample incentives over the length of the project to engage in managerial misbehavior andself-dealing behavior before turning over the project to the government.
Motivated by the above observations regarding the shortcomings of current practice ofusing the BOT and PPP approaches, I now propose a new approach—one that brings withit correct financial tools and proper economic incentives—that holds out the promise ofimproving the critical process of infrastructure project financing in developed and developingcountries around the world.
My message in this paper is a simple one. Successful financing of major infrastructuredevelopments is too important and too vital to the rapid economic growth of many countriesin the world to be simply left to the hands of politicians. Instead, project finance should beguided by the capital market’s invisible hand. And a key part of such financing must comefrom financial innovation. The fundamental challenge of infrastructure financing, then, ishow to match the massive demand for capital investments in the world with a supply ofcapital from millions of private investors through project securities available on a global scale.
3. A NEW APPROACH TO PROJECT FINANCE THROUGH CAPITAL MARKETS
Since the widely-used BOT and PPP approaches have not produced satisfactory results interms of the performance of large-scale infrastructure projects around the world in the pastdecade, a new approach is needed. The capital markets provide fundamental opportuni-ties for risk-sharing among millions of private investors through financial innovations. As
9. Rethinking project finance 135
I have noted in Chen (2002), motivations for financial innovation are no doubt complexand diverse, but they can be best understood by the simple acronym TRICKME, in which:‘T’ stands for reduction of taxes and transactions costs; ‘R’ for circumvention of bad reg-ulations; ‘I’ for reduction of informational asymmetry; ‘C’ for market completion’ ‘K’ forknowledge advancement; ‘M’ for marketing efforts for new products and new processes,and ‘E’ for financial engineering.23 This acronym captures the idea that newly-developedfinancial instruments can be used to enable financing infrastructures in a way that will reduceagency costs arising from bureaucratic regulations and informational asymmetries. It is myview that the operation of the capital market’s invisible hand will prove undoubtedly tobe the most efficient and most successful way to achieve desired results in infrastructuredevelopment.
The core of the new approach to financing infrastructure is the idea that the economiccosts and benefits of infrastructure projects can and should be determined by placing theproject financing in the hands of millions of private investors from the start. In other words, Iadvocate using the invisible hand—the capital market—to determine the economic value of aninfrastructure project and to provide the necessary capital for its construction and operation.By utilizing initial public offerings (IPOs) of project bonds, project stocks and project preferredstocks, the true “private participation” of the infrastructure projects for economic develop-ments can be achieved immediately, thus reducing substantially the lack of diversificationand lack of liquidity faced by both shareholders and bank creditors in the BOT or the PPPapproaches. Before discussing in more detail some financial innovations relevant to IPOs ofproject bonds, project stocks and project preferred stocks, I first would like to highlight someof the key benefits of the proposed approach:
1) Issuing project bonds, project stocks, and project preferred stocks in both domestic andforeign capital markets would attract funds from millions of investors at home and abroad,24
thereby helping to ensure ample funding and strong interest in and awareness of theinfrastructure projects on a global scale. As a result, a “globalization” of an infrastructureproject can be achieved.
2) Sufficient numbers of bonds and equity shares of the project company can be issued toestablish reasonable unit prices of project financing instruments, thereby ensuring broadparticipation in the domestic as well as foreign capital markets. It is important to note thata high degree of community interest in the domestic country is necessary for the ultimatesuccess of the infrastructure project.25
3) Placing ownership immediately in private investors’ hands fosters efficiency and liquidityin the market for claims on the future cash flows of the infrastructure projects.
4) Publicly-traded project stocks would provide a foundation for granting stock optionsto construction workers and project operation employees that could help to improveincentives and productivity at the construction phase as well as at the operational phase.Consequently, the currently widespread problems of cost overrun and inefficiency can bereduced.
5) The governments in the host country will be allocated for some units of project securities,so the true public-private-partnership can be achieved at the very beginning of any newinfrastructure project which will reduce a great deal of agency problems and agency costswe have mentioned before.
136 Andrew H. Chen
3.1. Issuing Project Bonds with Event Risk Provisions
In general, the private ownership of infrastructure through the BOT or PPP format involvesboth shareholders as well as bondholders. However, their numbers are small as they arerepresented by project companies created by small shareholders represented by domestic andforeign firms and the small number of creditors represented by domestic and internationallending banks. Without a large number of diverse private investors that hold project equityshares and project bonds, the benefits of risk sharing and liquidity cannot be obtained.Therefore, in addition to project stocks, a large number of project bonds and project preferredstocks should also be issued at initial public offerings. The project bonds should have tax-freestatus in order to attract private domestic and foreign bond-investors. Furthermore, varioustypes of project bonds can be structured to have different maturities and priorities in orderto attract different kinds of private bond-investors worldwide.
Just like corporate bonds, project bonds may be subject to some unforeseen adverse shockssuch as wars, political upheaval, tax law changes, earthquakes, oil price shocks, exchange-ratefluctuations, etc. Occurrence of such event risks would affect the total value of infrastructureand consequently the value of project bonds and hence bondholders’ wealth. Typically, thecorporate bondholders in the United States have protected their wealth from certain types ofevent risks in the late 1980s and the early 1990s by demanding that new bond issues shouldinclude “poison puts” or “event-risk provisions”26 in their indentures. Also, Standard &Poor’s Corporation started to add the “event risk” rating to its credit risk rating of corporatebonds in the beginning of the 1990s. The categories of event-risk rating range from thestrongest protection against event risk (E1) to the insignificant or no protection against eventrisk (E5).27
Let me now describe two financial innovations that have been incorporated in thecovenants of corporate bonds first introduced in the early 1990s. These innovations oncorporate bonds can be applied to the project bonds in financing infrastructure I have dis-cussed earlier. For convenience, the first kind of innovation in the covenants of bonds will becalled “protective put-type” bonds with “bearish” event-risk provisions. Bonds with bearishevent risk provisions are similar to regular puttable bonds. However, there is a key differencebetween these two types of bonds, namely, that the exercise of a put option attached to theformer is triggered by the occurrence of an external risk event, while the exercise of theput option attached to the latter is determined by bondholders. We can refer to the secondkind of innovation in the covenants of corporate bonds as “conversion call-type” bonds thathave “bullish” event-risk provisions. Bonds with “bullish” event risk provisions are similarto regular convertible bonds. Again, the difference between the two depends on the triggerpoint for the conversion.28
3.1.1. Project Bonds with Bearish Event-Risk Provisions
Project bonds with bearish event-risk provisions should protect bondholders from wealthloss due to the occurrence of some designated events such as wars, changes in politicalsystems, changes in world oil prices, and changes in foreign exchange rates that might causea significant decline in the economic value of an infrastructure project and hence a drasticdowngrade in the rating of project bonds. If this has occurred, then the project bond haseffectively matured and the bondholders have the right to ask the issuer or guarantors for
9. Rethinking project finance 137
immediate payment of the principal amount of the bond and the accrued interest. This iswhy a project bond with bearish event-risk provisions can be viewed as a puttable bond andshould have a value greater than that of the straight project bond. The bearish event-riskprovisions should therefore serve to make investing in the project more attractive to bothdomestic and foreign private bond investors.
3.1.2. Project Bonds with Bullish Event-Risk Provisions
Project bonds with bullish event-risk provisions can provide bondholders with opportunitiesfor wealth gains by converting debt into equity upon the occurrence of some designated event.These bullish events can include: favorable changes in exchange rates, favorable changes intax laws, and favorable changes in energy prices that have resulted in a significant increasein the economic value of an infrastructure project, especially the value of equity shares. Ifsuch an event occurs, then the holders of project bonds with bullish event-risk provisionscan immediately convert the debt into equity shares.
3.1.3. Other Economic Implications of Project Bonds with Event-Risk Provisions
Issuing project bonds that include event-risk provisions may have some other importanteconomic implications for an infrastructure project. First, in the presence of bearish event-risk provisions, managers and stockholders of project companies are less likely to engage inproject restructuring activities that might enhance equity value at the expense of bondholders.Therefore, with event-risk provisions in project bond indentures, agency problems betweenbondholders and stockholders of project companies and their associated agency costs can bereduced. As a result, the decrease in deadweight costs should improve the overall efficiencyof infrastructure projects.
Second, the inclusion of event-risk provisions in project bond contracts should be a deter-rent to the politicians’ attempts to make undesirable policy changes in the host countries.Thus, a more stable economic growth can be expected.
Third, project bonds with event-risk provisions in the contracts will make them moreattractive to both the domestic and foreign private bond-investors because they representa package of project bonds and the attached put/call options to the investors. Thus, theexplicit costs of debt financing for an infrastructure project will be lower with the inclusionof event-risk provisions in its debt.
3.2. Financing with Project Stocks
Any infrastructure project can be financed by the mechanism of initial public offerings ofproject securities—stocks and bonds. With the assistance of some internationally reputableinvestment bankers, the economic value of an infrastructure project could be estimated withreasonable accuracy, and certainly as easily as estimating the value to any potential foreigndirect investor interested in the project. The possibility of wider participation in the projectwould also reduce the financial risks borne by a wider base of investors, and hence the costsof raising the required capital for the project would be lower. Thus, a world-wide IPO ofproject stocks would raise funds for the project from global private investors immediately. Theinvisible hand of the global capital markets would work better in financing the infrastructureproject than the visible hands of the domestic politicians.
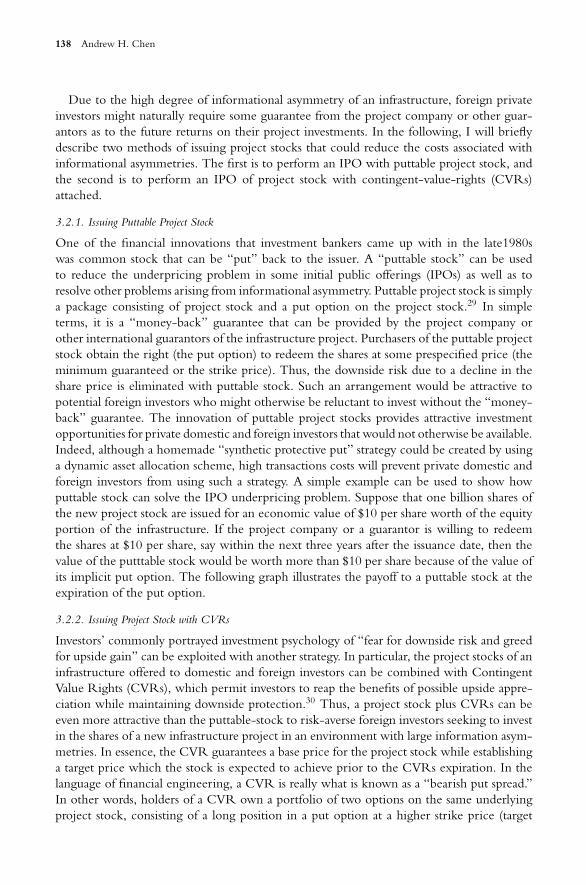
138 Andrew H. Chen
Due to the high degree of informational asymmetry of an infrastructure, foreign privateinvestors might naturally require some guarantee from the project company or other guar-antors as to the future returns on their project investments. In the following, I will brieflydescribe two methods of issuing project stocks that could reduce the costs associated withinformational asymmetries. The first is to perform an IPO with puttable project stock, andthe second is to perform an IPO of project stock with contingent-value-rights (CVRs)attached.
3.2.1. Issuing Puttable Project Stock
One of the financial innovations that investment bankers came up with in the late1980swas common stock that can be “put” back to the issuer. A “puttable stock” can be usedto reduce the underpricing problem in some initial public offerings (IPOs) as well as toresolve other problems arising from informational asymmetry. Puttable project stock is simplya package consisting of project stock and a put option on the project stock.29 In simpleterms, it is a “money-back” guarantee that can be provided by the project company orother international guarantors of the infrastructure project. Purchasers of the puttable projectstock obtain the right (the put option) to redeem the shares at some prespecified price (theminimum guaranteed or the strike price). Thus, the downside risk due to a decline in theshare price is eliminated with puttable stock. Such an arrangement would be attractive topotential foreign investors who might otherwise be reluctant to invest without the “money-back” guarantee. The innovation of puttable project stocks provides attractive investmentopportunities for private domestic and foreign investors that would not otherwise be available.Indeed, although a homemade “synthetic protective put” strategy could be created by usinga dynamic asset allocation scheme, high transactions costs will prevent private domestic andforeign investors from using such a strategy. A simple example can be used to show howputtable stock can solve the IPO underpricing problem. Suppose that one billion shares ofthe new project stock are issued for an economic value of $10 per share worth of the equityportion of the infrastructure. If the project company or a guarantor is willing to redeemthe shares at $10 per share, say within the next three years after the issuance date, then thevalue of the putttable stock would be worth more than $10 per share because of the value ofits implicit put option. The following graph illustrates the payoff to a puttable stock at theexpiration of the put option.
3.2.2. Issuing Project Stock with CVRs
Investors’ commonly portrayed investment psychology of “fear for downside risk and greedfor upside gain” can be exploited with another strategy. In particular, the project stocks of aninfrastructure offered to domestic and foreign investors can be combined with ContingentValue Rights (CVRs), which permit investors to reap the benefits of possible upside appre-ciation while maintaining downside protection.30 Thus, a project stock plus CVRs can beeven more attractive than the puttable-stock to risk-averse foreign investors seeking to investin the shares of a new infrastructure project in an environment with large information asym-metries. In essence, the CVR guarantees a base price for the project stock while establishinga target price which the stock is expected to achieve prior to the CVRs expiration. In thelanguage of financial engineering, a CVR is really what is known as a “bearish put spread.”In other words, holders of a CVR own a portfolio of two options on the same underlyingproject stock, consisting of a long position in a put option at a higher strike price (target
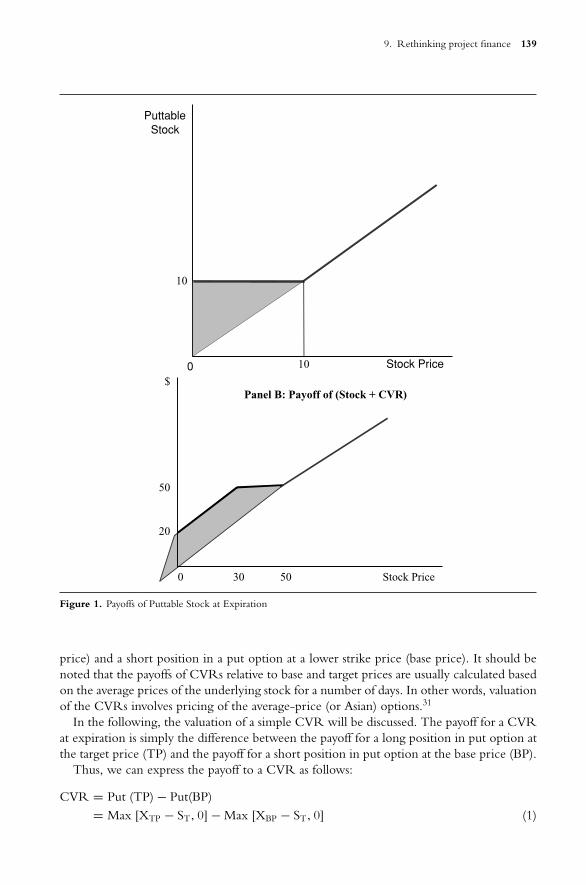
9. Rethinking project finance 139
0 10
10
PuttableStock
Stock Price
$
0 30 50 Stock Price
50
20
Panel B: Payoff of (Stock + CVR)
Figure 1. Payoffs of Puttable Stock at Expiration
price) and a short position in a put option at a lower strike price (base price). It should benoted that the payoffs of CVRs relative to base and target prices are usually calculated basedon the average prices of the underlying stock for a number of days. In other words, valuationof the CVRs involves pricing of the average-price (or Asian) options.31
In the following, the valuation of a simple CVR will be discussed. The payoff for a CVRat expiration is simply the difference between the payoff for a long position in put option atthe target price (TP) and the payoff for a short position in put option at the base price (BP).
Thus, we can express the payoff to a CVR as follows:
CVR = Put (TP) − Put(BP)= Max [XTP − ST, 0] − Max [XBP − ST, 0] (1)

140 Andrew H. Chen
where,
XTP = the exercise price of a put option at the target price;XBP = the exercise price of a put option at the base price;
ST = the price of project stock at the expiration.
Figure 2 depicts the payoffs at expiration for holding a CVR (Panel A) and holding botha CVR and project stock (Panel B). Let us assume that the base price is $30 and the targetprice is $50. As Figure 2 shows, the payoff for a CVR at expiration is simply the differencebetween the payoff for a long position in put at the target price (TP) = $50 and the payofffor a short position in put at the base price (BP) = $30.
An example will illustrate how the stock-plus-CVR combination preserves the downsideprotection and at the same time enjoys the upside potential. Assume again that the equityportion of an infrastructure project is worth $10 billion and that 1 billion shares of projectstocks are offered in the local and global capital markets at a price of $10 per share. If thebase price is set at $30 per share and the target price is set at $50 per share, then at the CVRexpiration date (e.g., 3 years after the date of issue) the market value of the package will beas follows in Table 1.
3.3. Financing with Redeemable and Convertible Project Preferred Stocks
Project preferred stock has features similar to both project stocks and project bonds of theproject company. It resembles a project bond in that it promises to pay to its holder fixeddividends each year, and it also resembles a project bond in that it does not have the votingpower regarding the management of the project company. Project preferred stock is an equityinvestment in the sense that failure to pay the dividend does not precipitate bankruptcy ofthe project company.
In addition to issuing the ordinary project preferred stocks, the project company can alsoissue redeemable project preferred stocks that are callable by the project company within somepredetermined period of time. By issuing the redeemable project preferred stocks, the projectcompany has effectively acquired call options on the preferred stocks from the investors andpaid the call premiums in terms of promising higher preferred dividends than that on theordinary project preferred stocks. This callable project preferred stock will be the same aswhat known as PERCS, the Preferred Equity Redemption Cumulative Stocks, employedby many major “blue chip” companies such as General Motors, Sears, Texas Instruments,
Table 1. The Value of (Stock + CVRs) at Expiration Date
Stock Price Short Put Long Put Stock + CVR($) @$30 @$50 ($)
0 −30 +50 +205 −25 +45 +25
30 0 +20 +5040 0 +10 +5050 0 0 +5080 0 0 +80
100 0 0 +100
9. Rethinking project finance 141
$
0 30 50 Stock Price
20
Panel A: Payoff of CVR
BP = $30TP = $50
$
0 30 50 Stock Price
50
20
Panel B: Payoff of (Stock + CVR)
Figure 2. The Payoffs of CVR and (Stock+CVR) at Expiration
Citicorp and others in the recent past. A recent empirical analysis of PERCS has shown thatit provides the advantages in transaction costs and taxes to its investors.32
Furthermore, the project company can also issue convertible project preferred stocks thatcan be converted into project stocks at options of their holders. The convertible project
142 Andrew H. Chen
preferred stocks can be attractive to certain types of preferred stock investors in the domesticand global capital markets.
4. CONCLUSION
In this paper, I have described some of the major problems associated with current practiceof using the BOT and PPP approaches to finance infrastructure projects in the world. I haveargued that such problems can be avoided–or at least significantly reduced–if the projectfinancing is undertaken with the invisible hand of the capital markets. Therefore, I dis-agree with Esty’s (2004) assertion that “. . . the growing use of project finance challenges theModigliani and Miller’s (1958) ‘irrelevance’ proposition, the idea that corporate financingdecisions do not affect firm value under certain conditions.”
Of course, access to well-functioning and globally linked capital markets is a prerequisitefor raising capital in the fashion I have proposed. In other words, for any nation to develop andfinance infrastructure projects most effectively, its capital markets will have to exhibit the keycharacteristics of well-functioning capital markets, including freedom from insider tradingand security manipulation, advanced bodies of corporate and securities law, effective contractenforcement, well-developed accounting standards, and transparent disclosure of accountingand financial information. The development of capital markets, legal systems, and accountingsystems are themselves important infrastructure projects vital to the economic growth of acountry.33 If economies in the world can achieve such development, then we can hope thatfinancial innovations of the sort I have discussed earlier will be even more useful in facilitatingthe financing of infrastructure development in any nation.
ENDNOTES
1. I am grateful to Mark Chen, Frank Fabozzi, John Kensinger, John Martin and Soushan Wu for helpful commentson earlier versions of the paper and to Jacqueline McLelland for her excellent research assistance.
2. See Esty (2004).3. Some of the project risks are discussed in Fabozzi and Nevitt (2000).4. See Miller and Lessard (2000).5. See Flyvbjerg et al. (2003).6. See Esty (2004).7. See Joel Baglole, “Hong Kong Plans Another Handover,” Wall Street Journal, 10/17/2003.8. See Bradford (2001). The PPP approach outgrew from the U.K. government’s Private Finance Initiative (PFI)
program launched in the early 1990s that aimed at bringing private equipment and services and private fundsinto the field of public utilities. The PFI structures have grown and now represented more than 15% of theU.K. government’s total equipment expenditures.
9. Source: Financial Times, 5/12/2004.10. Source: China Post, 10/3/2003.11. Source: BusinessWorld (Philippines) 1/15/2003.12. Source: Financial Times, 3/6/2003.13. Source: Taiwan Economic News, 2/20/2003.14. Source: Financial Times, 11/4/98.15. Source: Wall Street Journal, 12/10/99.16. Source: Financial Times, 12/26/99.17. Source: Financial Times, 6/8/2001.18. Source: Platts Energy Economist, March 2003.19. Source: BusinessWorld (Philippines), 2/2/2004.20. Source: Manila Standard, 5/7/2003.21. Source: BusinessWorld (Philippines), 2/2/2004.22. Source: Global News Wire, 10/3/2003.
9. Rethinking project finance 143
23. See, Chen (1997). Miller (1986) claims that the prime motivators for financial innovations in the past arefrequent and unanticipated changes in regulatory and tax codes.
24. The project securities can be issued at relatively small unit prices to attract both domestic and foreign investors.The project investors will include individual investors, investment banks, commercial banks, mutual funds,insurance companies, and even governments.
25. The Thai people used to call the Hopewell’s road and train system BOT project in Bangkok the “hopeless”project. Clearly, lack of community interest in the project was one of the key factors contributed to its failure.
26. They have been dubbed “poison” because they may make a company indigestible for a hostile bidder.27. The event-risk bond covenant ratings are an outgrowth of the Standard & Poor’s Event Risk Task Force (1989)
that investigated bondholders’ protection against event risk due to takeovers or recapitalizations.28. The contingent-claim analysis has been applied to formulate the valuation models for bonds with various
event-risk provisions in Bicksler and Chen (1992).29. See, for example Chen and Kensinger (1988) for more discussion and analysis of the downside protection and
upside potential of puttable stocks.30. See, for example Chen and Kensinger (1992), and Chen, Chen and Laiss (1993) for the discussion and analysis
of using CVRs to reduce the agency costs of asymmetric information in corporate mergers and acquisitions.The CVRs were used by Dow Chemical Co. to acquire Marion Laboratories in 1989, and by the Frenchgovernment in its Rhone Poulenc S.A.’s acquisition of Rorer Group Inc. in 1990. In 1993, the Pension BenefitGuaranty Corp. issued CVRs to the creditors of LTV Corp. in order to get them to approve a settlement ofLTV’s lengthy bankruptcy. In 1994, Viacom used CVRs in its acquisition of Paramount Communications Inc.And the most recent usage of CVRs was in General Mills’ successful acquisition of Pillsbury from Diageo inOctober 2001.
31. See Chen, Chen and Laiss (1993) for the discussion of proposed methods of pricing Asian options and thereferences therein. They have analysized the prices of Marion Merrell Dow’s CVRs based upon an applicationof a closed-form analytical approximation for the valuation of arithmetic options.
32. See Chen et al. (1994).33. Merton (1990) presents an excellent and thorough discussion of this point.
REFERENCES
1. Bicksler, J., Chen, A., Pricing Corporate Debt with Event-risk Provisions, International Review of FinancialAnalysis, Vol. 1, 1992, 51–63.
2. Bradford, M., The British Model of Private Finance Initiative and Public-Private Partnership Ten Years Later:Toward International Extension in the Defense Sector? The Journal of Structured and Project Finance, Fall 2001,61–71.
3. Chen, A., A New Perspective on Infrastructure Financing in Asia, Pacific-Basin Finance Journal, Vol. 10, 2002,157–165.
4. Chen, A., Chen K., Laiss, B., Pricing Contingent Value Rights: Theory and Practice, Journal of FinancialEngineering, Vol. 2, 1993, 155–173.
5. Chen, A., Kensinger, J., Puttable Stock: A New Innovation in Equity Financing. Financial Management, Vol. 17,1988, 27–37.
6. Chen, A., Kensinger, J., Uncommon Equity, Journal of Applied Corporate Finance, Vol. 1, 1992, 36–43.7. Esty, B., Why Study large Projects? An Introduction to Research on Project Finance, European Financial Man-
agement, Vol. 10, 2004, 213–224.8. Esty, B., Megginson, W., Creditor Rights, Enforcement, and Debt Ownership Structure: Evidence from the
Global syndicated Loan Market, Journal of Financial and Quantitative Analysis, Vol. 38, 2003, 37–59.9. Fabozzi, F., Nevitt, P., Project Financing, 7th ed. (London: Euromoney, 2000).
10. Flyvbjerg, B., Bruzelius, N., Rothengatter, W., Megaprojects and Risk: an Anatomy of Ambition (Port ChesterNY: Cambridge University Press, 2003).
11. Merton, R., The Financial System and Economic Performance, Journal of Financial Services Research, 1990,263–300.
12. Miller, M. H., Financial Innovation: the Last Twenty Years and the Next, Journal of Financial and QuantitativeAnalysis, Vol. 21, 1986, 459–471.
13. Miller, R., Lessard, D., The Strategic Management of Large Engineering Projects (Cambridge MA: MIT Press, 2000).14. Modigliani, F., Miller, M., The Cost of Capital, Corporation Finance and the Theory of Investment, American
Economic Review, Vol. 53, June 1958, 261–97.
10. IMPACT OF GLOBALIZATION AND ECONOMIC DEVELOPMENTIN ASIA AND AUSTRALIA
MOHAMED ARIFF
1. INTRODUCTION
At the start of this century, Asia consists of a very large land mass with about 32 significantcountries1 with very different economic and social achievements. In fact it is difficult to talkof a typical Asian nation even in economic terms as the economic structures are very differentas well. There is no similarity in describing Asian countries of the kind one could take forgranted when describing, for example, most of the 25 OECD countries, based on a set ofopen trading policies and relatively similar income levels. Add Australia as an Asian regionalcountry—this is the trend since 1984 among international economists to group the largeAustralian continent as it is increasingly becoming trade-linked to Asian nations more andmore through the same globalization forces—the description of an Asian composite is evenmore confusing. However, globalization has affected Asia and Australia in telling mannerthat it is possible to describe the changes that globalization has brought to the countries inthis vast region.
We can start this description by first looking at the gross domestic products. If one wereto add the GDP of the more successful of the Asian economies that had partaken of glob-alization as a means to secure growth and social well-being, the reader would find that thecombined income of some 10 countries ( Japan; China; India; Korea; Australia; Taiwan;Thailand; Indonesia; Pakistan; Malaysia) is equal to that of the European Union nations orthe U.S.A. Yet, with all that economic clout, these ten nations in Asia are still poor countriesexcepting Australia and Japan. In comparing the Asian countries, one needs to be mindfulof this paradox, and hence devise a sensible means of making useful comparisons in thischapter.
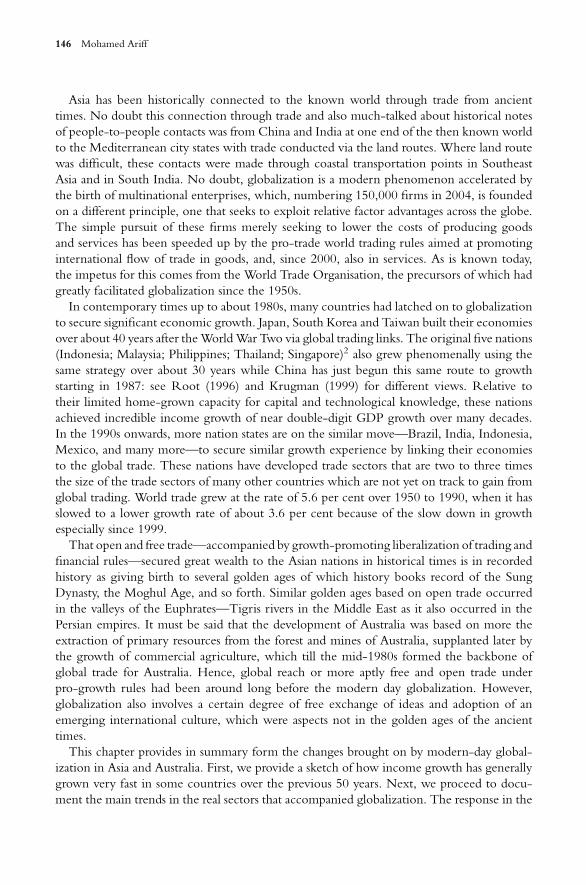
146 Mohamed Ariff
Asia has been historically connected to the known world through trade from ancienttimes. No doubt this connection through trade and also much-talked about historical notesof people-to-people contacts was from China and India at one end of the then known worldto the Mediterranean city states with trade conducted via the land routes. Where land routewas difficult, these contacts were made through coastal transportation points in SoutheastAsia and in South India. No doubt, globalization is a modern phenomenon accelerated bythe birth of multinational enterprises, which, numbering 150,000 firms in 2004, is foundedon a different principle, one that seeks to exploit relative factor advantages across the globe.The simple pursuit of these firms merely seeking to lower the costs of producing goodsand services has been speeded up by the pro-trade world trading rules aimed at promotinginternational flow of trade in goods, and, since 2000, also in services. As is known today,the impetus for this comes from the World Trade Organisation, the precursors of which hadgreatly facilitated globalization since the 1950s.
In contemporary times up to about 1980s, many countries had latched on to globalizationto secure significant economic growth. Japan, South Korea and Taiwan built their economiesover about 40 years after the World War Two via global trading links. The original five nations(Indonesia; Malaysia; Philippines; Thailand; Singapore)2 also grew phenomenally using thesame strategy over about 30 years while China has just begun this same route to growthstarting in 1987: see Root (1996) and Krugman (1999) for different views. Relative totheir limited home-grown capacity for capital and technological knowledge, these nationsachieved incredible income growth of near double-digit GDP growth over many decades.In the 1990s onwards, more nation states are on the similar move—Brazil, India, Indonesia,Mexico, and many more—to secure similar growth experience by linking their economiesto the global trade. These nations have developed trade sectors that are two to three timesthe size of the trade sectors of many other countries which are not yet on track to gain fromglobal trading. World trade grew at the rate of 5.6 per cent over 1950 to 1990, when it hasslowed to a lower growth rate of about 3.6 per cent because of the slow down in growthespecially since 1999.
That open and free trade—accompanied by growth-promoting liberalization of trading andfinancial rules—secured great wealth to the Asian nations in historical times is in recordedhistory as giving birth to several golden ages of which history books record of the SungDynasty, the Moghul Age, and so forth. Similar golden ages based on open trade occurredin the valleys of the Euphrates—Tigris rivers in the Middle East as it also occurred in thePersian empires. It must be said that the development of Australia was based on more theextraction of primary resources from the forest and mines of Australia, supplanted later bythe growth of commercial agriculture, which till the mid-1980s formed the backbone ofglobal trade for Australia. Hence, global reach or more aptly free and open trade underpro-growth rules had been around long before the modern day globalization. However,globalization also involves a certain degree of free exchange of ideas and adoption of anemerging international culture, which were aspects not in the golden ages of the ancienttimes.
This chapter provides in summary form the changes brought on by modern-day global-ization in Asia and Australia. First, we provide a sketch of how income growth has generallygrown very fast in some countries over the previous 50 years. Next, we proceed to docu-ment the main trends in the real sectors that accompanied globalization. The response in the
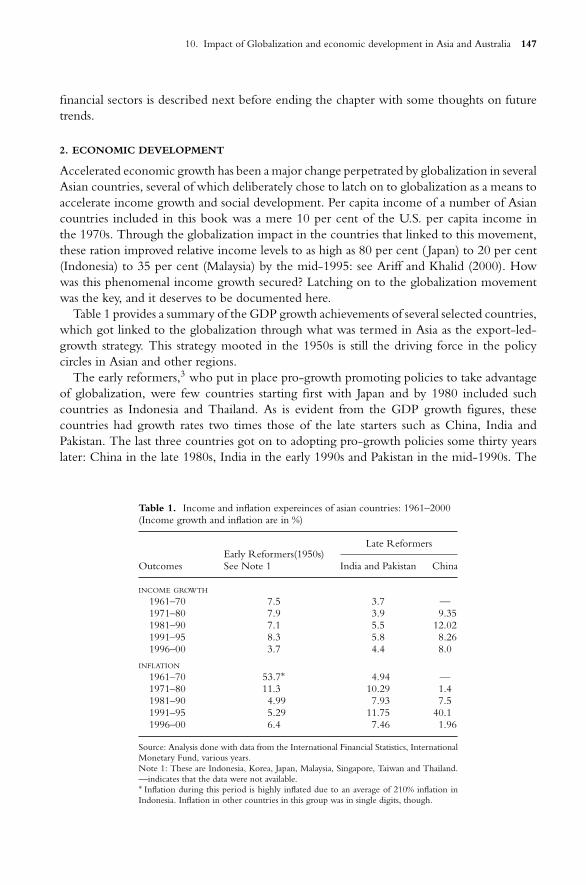
10. Impact of Globalization and economic development in Asia and Australia 147
financial sectors is described next before ending the chapter with some thoughts on futuretrends.
2. ECONOMIC DEVELOPMENT
Accelerated economic growth has been a major change perpetrated by globalization in severalAsian countries, several of which deliberately chose to latch on to globalization as a means toaccelerate income growth and social development. Per capita income of a number of Asiancountries included in this book was a mere 10 per cent of the U.S. per capita income inthe 1970s. Through the globalization impact in the countries that linked to this movement,these ration improved relative income levels to as high as 80 per cent ( Japan) to 20 per cent(Indonesia) to 35 per cent (Malaysia) by the mid-1995: see Ariff and Khalid (2000). Howwas this phenomenal income growth secured? Latching on to the globalization movementwas the key, and it deserves to be documented here.
Table 1 provides a summary of the GDP growth achievements of several selected countries,which got linked to the globalization through what was termed in Asia as the export-led-growth strategy. This strategy mooted in the 1950s is still the driving force in the policycircles in Asian and other regions.
The early reformers,3 who put in place pro-growth promoting policies to take advantageof globalization, were few countries starting first with Japan and by 1980 included suchcountries as Indonesia and Thailand. As is evident from the GDP growth figures, thesecountries had growth rates two times those of the late starters such as China, India andPakistan. The last three countries got on to adopting pro-growth policies some thirty yearslater: China in the late 1980s, India in the early 1990s and Pakistan in the mid-1990s. The
Table 1. Income and inflation expereinces of asian countries: 1961–2000(Income growth and inflation are in %)
Late Reformers
Outcomes See Note 1 India and Pakistan ChinaEarly Reformers(1950s)
INCOME GROWTH
1961–70 7.5 3.7 —1971–80 7.9 3.9 9.351981–90 7.1 5.5 12.021991–95 8.3 5.8 8.261996–00 3.7 4.4 8.0
INFLATION
1961–70 53.7∗ 4.94 —1971–80 11.3 10.29 1.41981–90 4.99 7.93 7.51991–95 5.29 11.75 40.11996–00 6.4 7.46 1.96
Source: Analysis done with data from the International Financial Statistics, InternationalMonetary Fund, various years.Note 1: These are Indonesia, Korea, Japan, Malaysia, Singapore, Taiwan and Thailand.—indicates that the data were not available.∗ Inflation during this period is highly inflated due to an average of 210% inflation inIndonesia. Inflation in other countries in this group was in single digits, though.
148 Mohamed Ariff
growth experience of the late starters, except for China, has been lack-lustre prior to thereforms.
One vital statistics of orderly economic development is the control of inflation. The averageinflation rates of the early reformers indicate that the high inflation experiences of earlieryears had been quickly brought under control by the reforms to the financial and monetaryregimes in the reforming countries. The reader would also note that the late reformers hadto grapple with high inflation in their economies in the earlier periods. Only with reformsof the kind learned from the early reformers, these late comers manage to control inflationto an orderly level of single digit in the 1990s. Hence, globalization has perpetrated not justincome growth, but also led these countries to learn to put their economies through orderlyprice experiences by reforming their monetary and financial regimes. Monetary stability isa hallmark found in high-growth economies in Asia.
The process that secured the high growth recorded in the table needs to be describedfirst. The process was a strategic decision by early reformers to latch on to the globalizationmovement that was picking up speed in the 1950s and 1960s. The first to adopt this strategywas Japan, very soon South Korea followed especially after the Korean War of 1954, thenTaiwan in the 1960s. The world trading rules of preferential trading arrangements had justbeen promoted by the GATT rounds of talks. That greatly facilitated exports to the developedcountries, often at preferential terms in textiles, consumer goods, and small scale machineries.With the high cost of production in developed countries, capital-rich firms started to locateproduction plants in Thailand, Indonesia as much as they did so in Korea, and Japan. This ishow it started in the 1950s with electo-mechanical goods production, then with electronics,these days with bio-tech, accounting services, and technology products.
3. CHANGES IN THE REAL SECTOR
The changes brought on by globalization had important effects on the real sectors of theeconomies. A phenomenal change was the increasing contribution of industrial sector tothe economic pie. For example, manufacturing was a mere 15 per cent of many countries(example Malaysia in 1960s). By the year 1995, some of these countries had increased theindustrial sector to 35 per cent and the agriculture began to lose its dominance. India managedto build slowly an industrial capacity that is described as the eight largest pool of technicalmanpower in the World.
Those countries that realised that prosperity could be improved by open and multilateraltrade started to open up the real sectors to capital flows and technology flows starting fromthe early 1960s. Tariff rates which were close to 100 per cent in the 1950s, started to rolldown, first for those goods that the globalised world wanted to manufacture in foreign lands,then for more and more items of goods. By the start of this century, the early reformers hadreduced the average tariff to fewer than 5 per cent, all within 40 years! Compare this averagewith the average of about 25 or more percent for tariff levels in countries that did not adoptfast enough reforms in the Asian countries. Australia moved in 1984 and again in 1997–2000to reduce the tariff levels to its present very low level of under 5 per cent: see reports of theWTO and the World Bank.
With tariff reduction, firms were facing increasing international competition from pro-ducers from other parts of the world. This had the beneficial effect in Asia of improving theefficiency of production while it also helped to improve the technology adoption needed
10. Impact of Globalization and economic development in Asia and Australia 149
to secure efficiency. Next came the waves of multinationals, given permission to own andoperate production with majority ownership. This had led to changes in management ofcorporations, adoption of new techniques, entry into new products, and enlarged market-ing of hitherto local based goods. The quality of the goods increased as did also the pricescharged. No longer could monopolies dish out shoddy goods in many of these economies.This has been a sea change in the production sector and marketing of products in the realsector.
3.1. Global Openness & Free Trade Areas
In the mid-1980s grew an awareness to speed up the real sector development through moreradical schemes than the GATT-Uruguay rounds of trade-increasing rules. Note that theworld trade had already grown at a fast phase of about 6 per cent by then, and there wasexpectations building up for faster growth. This led to a series of market-friendly reforms—generally grouped under freer trading rules—that spawned new trading groups for free trade.
The big impetus came from the Canada-U.S. free trade agreement, later expanded to theSouth and Central Americas. In Asia, the Asian Free Trade Area (AFTA) was announced,which by year 2006, would become a large area of free trade for manufacturing, and fortrading. In the year 2004, China is showing interest in joining this free trade area. Thismeans that the real sector would be increasingly linked among the economies as diverse asthose of industrialised Japan and Korea to the growth areas of ASEAN economies to thoseof low cost producers such as Pakistan in the West to India and Indonesia in the South andChina and Vietnam in the East. Trade openness has always worked to improve incomes ofpeoples: WTO (1995).
3.2. Privatization
Several Asian countries have a large government presence in production of goods and services.Take China’s economy, which in 1979 had 80 per cent of outputs from state enterprises.This has now been camouflaged by the increased private sector outputs of internationalfirms producing under joint ventures. By year 1999, the output by private sector has grownto 55 per cent of China’s output. At the central government level, there are 27,000 statefirms depending on state subsidy in the annual budget as well as funding by state banks inChina. India’s central government has about 150 large enterprises. Australia, with the leastamount of government presence, also has some significant telecommunications and otherproducing units. In the years starting from 1984 and ending at about 1995, many Asiancountries adopted a change, in the face of globalization—also to pay off debt—to speed upprivatization of state firms. Singapore passed laws to divest its 305 firms, which they didslowly and successfully. Malaysia divested most of its 905 firms between 1985 to 1995. Theseare few cases in this vast continent. Most of the countries are still reluctant to divest stateenterprises.
India and China came much later to the scene on this issue. The state firms are the providersof much of the welfare benefits to retired workers in China. In India, state firms act as theemployment sink for the party in power. It is understandable for these reasons why theywere reluctant to divest state firms. Indonesia was awash with good income over 1970–1996.The New Order Regime of Suharto in power for 32 years in that country did not divestthe state firms as it was not on the agenda given the good cheer in that economy that things
150 Mohamed Ariff
were going well. When the dictatorship fell in May 1998, and the country went into deeppolitical and attendant debt problems, now there is talk of selling the state firms when themarket price is right as soon as the country gets on its foot. The election in October 2004has produced a strong mandate on a popular leader, and the national development front thisman is putting together promises to speed up the sale of state assets since the economy needsto get off the overhang of state firms.
The upshot of selecting a few countries to discuss this important issue in this discussion is topoint out that the governments of almost all countries are reluctant today to divest state firmsat the same speed as some did in the 1984–1996 era. Depressed price for capital assets is onemain reason, which is stalling the governments. The second reason is the process of sale bysealed-bid-offer is not favored by many governments although some governments (Australiaand Malaysia included) had chosen this method as the least costly and most transparent. Othergovernments and government bureaucracy with different agenda from divestment programsprefer to negotiate deals and sell them on bilaterally negotiated price. This is opposed to bythe private sector as well as the civilian population as not being transparent. Nevertheless,there is no decision by the governments on this issue. A third reason given in recent years hasbeen aggressively promoted: this is the desire to retain state firms. Both India and China wantto reform the state firms to become efficient bulwarks since to dismantle the more efficientones would be to undo years of investment and know-how embodied in these firms. In thecase of India, the more efficient firms as judged by an independent evaluator and such firmswill be retained to become major corporations while the poor performers will be sold off.China wishes to retain 1000 of the state firms to become the competitors to the multinationalfirms that would increasingly enter that economy as more openness occurs in that economy.
If there is a lesson to be learned from the massive divestment in Germany from its unifi-cation, it is that the reform of the state sector is a key to economic well being, and sustaineddevelopment. It appears that most Asian countries are awaiting the asset markets to go up invalue—all markets had gone down since the IT bubble in 1999 and in the world economicslowdown after the 2001 terrorism alert. Excepting China and India, one would expect theglobal trend of more privatization may occur in Asia in the near future as the economies arebeginning to recover and the asset markets are slowly recovering.4
3.3. Moving Up the Value-Added Chain
The entry of China in the real sector production for the world is changing the peckingorder of the Asia’s more successful economies. Within about 12 years of China’s experimentwith market economy, given its comparative advantage, the several Asian economies losttheir competitiveness, and began to lose export: World Bank (1998). Australia for example isincreasingly becoming a full-scale machine manufacturer exporting high value-added itemswhile its primary produces are finding their way wherever there is global trade reformsand low tariff. The ASEAN countries are now moving production to cover more value-added manufacturing. While still dominant in microelectronics, these countries have begunto move up the skill levels to make higher end products. India is increasingly linking withmachinery production, consumer durables while moving slowly from consumable productionfor exports.
This is in line with what happened over many years. Winding the clock back some30 years, many Asean countries moved at that time from labour-intensive production to
10. Impact of Globalization and economic development in Asia and Australia 151
value-added production as much as away from primary production to industrial outputs. In1975, about 90 per cent of exports of Indonesia, for example, were primary produce: in 1996,its exports were about 50 per cent manufactured goods. Other countries such as Malaysiamoved to export 90 per cent as manufactured goods by 1995. Given these experiences,the ASEAN countries—total of about 380 million people with a large market place—willbe a key global player in manufacturing at the higher end in the decades to come. Korea,Germany and Japan are investing heavily in the Asian and Australian region on more andmore value-added production facilities.
4. FINANCIAL REFORMS
Real sector reforms were the first moves most early reformers undertook to latch on to theemerging globalization during the last 55 years. For those who made timely decisions to openup the real sectors—about 10 key nations in Asia and Australia—had made very importantgains in outputs. Per capita income of these countries had gone up. At the simple level,many of these countries, which started as poor countries 55 years ago, had moved up theladder to become rich countries ( Japan, Korea and Singapore) or middle-income countries(Malaysia, Thailand and Taiwan). Countries such as Indonesia had by 1996 reduced povertyto 10 million out of its then 200 million population; China’s GDP has gone up threefold ormore. India’s middle class has grown from some 78 million people to over 250 million inthe last 50 years. Nevertheless these countries are still classified as poor countries: the BostonConsulting company has made several reports on Asian middle classes. How about financialreforms?
There are several studies on individual country efforts to reform the financial sectors:Among them is a serious study of Korea (Cole and Park, 1983). Financial reforms—reformsin banking and financial markets—started to occur on the back of real sector reforms. Theearliest reformers in financial sector were the Philippines (in central banking); Malaysia(direct financial markets); Singapore (international financial center); Australia (both pruden-tial reforms and exchange rates). India has moved, since introducing the 1991–94 packageof financial reforms, to address the financial sector, whereas China is still reluctant to reformits rather moribund banking and the capital markets as much as it is unwilling to reform itsexchange rate regime. What changes did financial sector go through? This is discussed underdifferent headings that follow.
4.1. Exchange Rate Reforms
Globalization had its worst effect via the exchange rate. The World Bank analysis (Aghevli,Khan and Montiel, 1991) points to some major issues on exchange rate management. I wouldadd to this the bad habit of many countries to depress exchange rates to gain competitiveadvantage in trade.5 After all exchange rate is the value outsiders place on the wealth ofa country. With the demise of the Bretton Woods fixed-parity in 1971–73, most Asiancountries (Australia included) were thrown into disarray. Most countries were on fixedexchange rate system, and the value of currency is a key determinant of how well thetrade sector would be competitive with other countries. Japanese Yen emerged as a majorcurrency by the mid-1970s, but Japan managed its currency guardedly to give it an advantagein trade. This was stopped in 1983/84 with the Plaza Accord that made Japan work with the
152 Mohamed Ariff
major nations to let its currency appreciate slowly to reflect its parity levels. In fact the Yenappreciated from about 240 Yen to a dollar to about 85 Yen by the end of 1980s.
Australia moved in 1984 to free float the currency. From its value then of A$0.80 to a US$,the currency had settled over time to A$1.40 to US$ in 2004. New Zealand dollar was alsofree floated. These were the three important currencies to be affected seriously by the glob-alization movement. Other currencies, mostly less important than these three, were manageddifferently. Most of them chose to manage the currency, defending the currency if it wentagainst a favoured position set by the central bank as desirable (largely dictated to by the gov-ernments). Managed regimes fared so badly that, when the 1997–98 financial crisis came, theworst hit economies were those of the managed regimes: Indonesian currency lost 75 percentof its value; Malaysia 35 per cent; etc. The IMF free floated the Korean won, the Philippinepeso, the Thai baht and the Indonesian rupiah. For a brief period in 1997–98 the Singaporedollar was free floated, but it reverted to managed float in 1999: according to the WorldBank annual reports, most countries have elected to either fix or manage currencies.
Most Asian currencies had declined in value over the last 55 years: the exception beingthe Yen and Singapore dollar. The Japanese Yen which was 9600 Yen to a dollar in 1950s,improved steadily to its present level of about 110 yen to a dollar. The Singapore currencyimproved from S$3.20 to a dollar in 1970s to S$1.75 in 2004. The opposite is true of theRupiah, which went from 150 Rupiah to a dollar in 1950 to the current 8800 rupiah to adollar. In the last six year, on the back of the huge current account surplus, hence buildingUS$350 billion foreign reserves, China’s currency is overly undervalued in its fixed rate.
The undervaluation is estimated to be about 25–30 per cent, using trade-weightedexchange rate under parity conditions. Just as Japan manages in the early 1980s to usethe currency wedge to keep its trade favorable, China is doing the same. If it were to revaluethe Chinese Yuan to current market value, then it could slow its rapid economic growth,and arrest some of the excesses of the growth that are considered unwelcome for sustaineddevelopment in that country. But when the exchange rate is revalued, then the trade ingoods will decline. But the good impact of this would be to spread the globalization effectthat is mostly moving to China, to elsewhere as well, and help develop more regions of Asia(as well as other world regions such as Brazil in Latin America).
Most of the Asian currencies are either fixed or managed. Given the cost of managingthe exchange rate—Thailand lost US$38 billion in June–July, 1997 to defend its currency—it is timely to consider free floating the currencies at least in the cases of those countrieswith large economic base. Free float will let the currency find its own levels as happened toAustralian dollar, and not act as the weak chain that breaks every time there is a crisis, andthe business sector then suffers the most from this policy. With free floating would comemore market-based currency risk management techniques. Forward markets would developas would futures contracts that could be used for risk managing the currency effect on trade.In some countries—South Korea, Thailand, etc.—this has already occurred since 1997, andis considerably facilitating firms to manage the currency risk in the market place while thegovernment is freed from having to defend the currency to protect business.
4.2. Capital Market Reforms
There are about 90 stock markets in the world along with about 45 futures markets. At thestart of 1950, there were merely six respectable stock markets in Asia, no futures markets at all.
10. Impact of Globalization and economic development in Asia and Australia 153
In year 2004, about 22 countries have developed stock markets while there are about a dozenfutures markets, some of which such as the Tokyo and Sydney futures markets are thriving.How did this happen on the back of globalization? With trade that followed globalizationcame the demand for money. The financial sector had to accommodate the internationalflow of money as much as it had to find sources of capital for the increasing demand forcapital in the private sector connected to the rest of the world trade. Thus, capital marketreforms had to follow soon as the banking sector was reasonably established.
As a result of this imperative, capital market development occurred quite in pace witheconomic development. Japan again led the way in this. Its share market is the world’ssecond largest capitalised market with exchanges mainly in Tokyo (70% of trade) and Osakathat caters to some 4000 top firms. Australia had had a thriving market as well, based onmining and agriculture, which today is expanded to include manufacturing and services aswell as properties and other sectors. This market is the size of that of Hong Kong, which isanother important capital market.
Then there is the Korean market, newly created. Over the last 14 years, China markets(Shanghai and Shenzen) emerged. While these are large markets, there are also moderatesized well developed markets in Singapore, Kuala Lumpur, Bangkok, Bombay, Aucklandand Taipei. These markets had developed over the last 40 years to become major contribu-tors to the local economies. Finally, with the global trend, other countries had spruced uptheir markets or set new markets afresh (Vietnam in 1999 for example). These markets inBangladesh, or Indonesia or Sri Lanka are there not yet fully developed, but on the road togrowth as the underlying economies are reformed, and with that economic development isimproving.
Some of the Asian economies, particularly those that had more open currency regimes, haddeveloped futures markets to trade currencies, treasuries, and stock index futures contracts.These are found in Japan, Australia, South Korea, Thailand, Malaysia, Singapore, and Taiwan.Some of them also trade option contracts on shares or share indices (Malaysia; Singapore andThailand). These markets are growing in importance for firms to manage risk. These futuresmarkets provide a place for mutual funds to manage risk as these also let currency riskto be traded off. Currency contracts are not yet that liquid, and it would take some timeto become more efficient, nevertheless, the global developments in this regard is growth-promoting.
4.3. Banking Reforms & Consolidation
Most of the Asian economies depend on bank financing for their working capital needsand long term funds. While this is true of most countries, the three exceptions are those ofAustralia, Japan and Malaysia. In these three countries, about 40 per cent of funds are raiseddirectly from the stock/money markets. In all others, it is safe to make a broad generalisationthat almost three-quarters or more of the fund needs are met by the banking system. So,banks are dominant financiers, and their relative efficiency is of great importance to serviceand sustain growth. That underscores the importance of an efficient competitive bankingsystem for meeting the fund needs of the private sector, which has increasingly come to themarket to raise money, as the capital markets develop. The second fact of the banking is theextent to which banking sectors are reformed in Asian countries. In this regard, it couldbe said that not many good examples of a fully reformed banking sector could be found
154 Mohamed Ariff
in abundance, except perhaps the banking system in Hong Kong, Australia and Singapore.BankWatch.com provides a lot of information on contemporary banking, and is a valuablesource.
For our purpose of how globalization is affecting the banking system, we may start with asimple classification that would suffice for this purpose. First there are relatively well-reformedbanking systems in few economies: Australia has a good prudential system implemented since1992, and a relatively developed banking that is competitive within limits (Australia promotesfew-big-banks-is-better than many small banks policy). The two financial centres in HongKong and Singapore has developed very efficient banking sectors as collection centres formanaging money (about 20% of currency trade of about US$1.9 trillion takes place in thesecentres) and capital flows. Singapore also houses the Asian dollar market with some US$500billion in assets, which grew out of a 1968 law that exempted withholding tax for foreigndepositors. Japan has a well developed network of banks with about 300 institutions: amongthe top 100 banks in the world are 40 Japanese banks. We shall call these banking systemsas the ones that had evolved with globalization to accommodate the demands of the privatesector relatively efficiently.
Next we have the banking systems that are relatively reformed but are in smaller economies:in Malaysia, Philippines, Thailand, South Korea, Taiwan and New Zealand. Policy changeshave been introduced in al these countries to remove entry barriers to banking, improveflow of capital, and competition among local banks by easier branching rules, and access todeposits, etc. in these cases. For example, South Korea eased entry requirements for foreignbanks as early as 1970s, and increased competition among banks, and promoted specialisedforeign exchange banks. This helped the economy in its formative years of the 1970s and1980s to meet the high demand for capital when this economy was growing without anyrecession for 20 years at the break-neck speed of 10–11 per cent per annum.
Malaysia revamped the banking laws, and promoted competition among banks. However,the government connected banks failed to respond to efficiency improving rules, and had tobe saved more than once to keep them in business. Nevertheless, with the consolidation ofthe share capital of some 95 institutions into ten major banking groups (more like the U.S.case of holding company) in year 2002, the way is paved for the banks to be more resilientin the face of financial crisis. The newly consolidated banks are robust enough to withstandeconomic demands at hard time as these have core capital of about 14 per cent and haveless than 5 per cent non-performing loans. This case of reform and consolidation is worthwatching by other Asian economies.
The third set of countries have very entrenched often not pro-growth policies in develop-ing the banking system. At one end is such banking systems as those of China and Vietnam(two urgently needing reforms as they are fast becoming global players). At the other end arebanking systems with entrenched government banks: India, Indonesia, and Pakistan are goodexamples. In these economies and few others, the state had retarded the growth of privatesector banks for a long time. In Indonesia, it was not until 1988–89 that reforms ended thedominance of state banks. In India, it was not until 1994 that the private sector banks arebeginning to play greater roles, while the entrenched state banks still continue to play majorroles. In China, the reforms have been cosmetic in spawning more government banks tofinance agriculture and industrial activities, but there is but three private banks licensed only
10. Impact of Globalization and economic development in Asia and Australia 155
a few years ago. Add to this the non-performing loans problem from state-owned firms, wehave a disaster waiting to happen in the banking system.
As may be seen from these three differing approaches, it appears that the globalization hadonly brought in changes to the banking sector in few countries. The entrenched positions ofbanking systems in some countries require urgent study and consideration of reforms of thekind that the first group undertook many decades ago. Globalization calls for such reforms,but, given internal factors, many countries are preventing these reforms from taking placesoonest possible. Cosmetic reforms in the structure of banking are insufficient. (a) Freedomto enter the market and to branch at reasonable cost is essential to promote competition. (b)Capital requirements to establish banks must be reasonable and not exorbitant as is the case insome countries. (c) Prudential laws needs to be established, and a separated regulatory bodyset up to oversee compliance: no longer is it feasible to call upon the central bank to manageboth inflation as well as intermediation. (d) Credit evaluation quality must be enhanced vianew stringent laws (related party lending; restriction on large shareholdings; etc) along withgood institutional training in business schools for bank employees. (e) There is a need toaddress the non-performing loans problem in many Asian countries with strict complianceto international norms of 3 per cent unserviced loans in three months. (f ) There is a needto carefully implement the Basle II Accord in the years to come. If not anything, thereought to be a level playing field for the countries playing in the global trading world. Somecountries are brave enough to open the financial sector (including insurance) to competitionfrom multinational firms, but the number of Asian countries joining this is few. This has tochange.
4.4. Credit Rating
In a far-reaching report in the aftermath of the Asian financial crisis, the banking fragility andweak credit culture as well as infant capital markets: Asian Development Bank (1998). Creditrating is very slow to take root in most Asian countries. In one of the chapters of this book,China’s slow road to credit rating is explained. The story is the same for most countries, theexception being few: Australia; Japan; Korea; Malaysia; Taiwan; Thailand. In some of thecountries (exception being Japan and Australia), where there has been greater credit ratingexperiences, it is commonly found that the ratings done by international players (Standardand Poor for example) and local players cater to both local and international audience. Thisis excellent as it gives consistent rating, and credit decisions are easier to make. However,in others, the local rating agencies grade only for the local market players. Often this showsas inflated rating by the locals compared with the international players. This is contrary togood business practice, and does not augur well for transparent rating.
In countries, where there is no public access to rating at all, there is great deal of riskthat is not made known in financial transactions. This is where most changes are needed.Corporations need to be rated and the ratings must be accessible to the public as is the casein Australia and in Japan. So long as rating is confidential, which is mostly the case in Asia,it is not conducive to good credit practices developing in an globalized world of financialtransactions. More need to be done in this regard.
However, in relation to sovereign rating, the international rating companies have verygood rating services for most countries in Asia. Most Asian countries score within the range
156 Mohamed Ariff
of C to B in sovereign ratings although there are some countries such as Australia and Indiawhich has better rating. Sovereign ratings have been watched avidly whenever economiccrisis besets countries. For example, the Asian financial crisis in 1997 led to sovereign ratingsof about five countries seriously decline to very low ratings. With economic recovery, forexample, of Thailand, the rating went from low C minus to B over a two-year period in1999.
4.5. Market Making and Efficiency Improvements
The development of direct markets accompanied the globalization movement. For a story ofhow Thailand established its market, see Agtmael (1994). Much of Asia was familiar with thestock markets as some of them had such markets for a long time: in Shanghai; Melbourne;Calcutta-Bombay; Singapore; etc. It was not till 1960s, and later that countries took activeroles to create direct markets, that would become more competitive, more attuned to theneeds of local firms, and generally more efficient over time. Asian bourses chose to speed upthe restructuring and market-making procedures in line with the more developed marketsin the world.
The more established markets in Tokyo, Hong Kong, Melbourne, Singapore and Calcutta-Bombay (Shanghai was closed down by the Communists in 1949) continued to evolveinto major markets by modernising their facilities.6 For example, these markets introducedcomputerised order books early in the 1960s and 1970s on so that the trade could be speeded;these also made it possible for trade to be booked to the floor (until all but Tokyo changed toscreen trading in the 1990s) speedily. The transaction costs which used to be about 4 per centroundtrip fell slowly to today’s under 2 per cent transaction costs. More market informationwas released, and the bourses expanded at the rate of about 10 per cent per annum.
Unlike these major markets, the smaller ones had to restructure themselves. The last 40years have seen a flurry of activities to set up share markets in many countries. One exampleis that of the Malaysian market. The domestic trading took place in a newly-establishedmarket in Kuala Lumpur in 1960 with parallel trades in Singapore for the companies fromboth economies. In 1973, with the introduction of two different currencies for the twocountries, the trading in Kuala Lumpur became more and more on domestic firms. In 1983,the double-listing arrangement was withdrawn, and the Kuala Lumpur market had showntremendous growth since then, which peaked in 1997/98. By year 2004, there were about900 firms listed. This represents a phenomenal growth of a capital market. In some good yearsthis market provided about 35 to 50 per cent of the fund needs by the Malaysian economy:this is a phenomenal success story. Another such market is that of Thailand. The expertsfrom Australia helped to set up the Thailand’s stock exchange in 1960s. By year 2004, thismarket provided a place for capital raising and stock-bond trading.
The South Korean economy was expanding at the rate of about 11 per cent for most of1960s to 1980s. This augured well for the development of the stock market in that country.The Seoul stock exchange has close to 1000 firms listed and traded. It suffered a bubble-bustexperience in 1988, and therefore investors had grown to be very cautious in capital marketinvestments in this economy with perennial shortage of capital for the high-growth firms.Taiwan also developed a vibrant stock market for its very diversified economy based uponsmall-is-good philosophy of nurturing small-to-medium enterprises, which make consumer
10. Impact of Globalization and economic development in Asia and Australia 157
items and consumer durables as well as high quality computers for the world market. Taiwanis an example of a country that has mostly benefited from the globalization. Its trade withthe world is the highest in per capita terms compared with any other country.
Meanwhile, the markets in Bombay (India), Colombo (Sri Lanka), Dhaka (Bangladesh),Karachi (Pakistan), Manila (Philippines) and Jakarta (Indonesia) grew at much slower phasefor two reasons. First, these countries were not as vigorously affected by the globalizationmovement as were the other major markets. In fact these countries had not latched onto the global trading until about the late 1980s, almost 25 years after the early reformersdid. Hence, the capital market developments were much muted as these countries onlyexperienced income growth rates of about 3–4 per cent until the growth rate went up inthe 1990s with economic reforms. The growth rates of the capital markets was rather slow,much of the gains reflecting the slow economic growth and the large inflation premium builtinto the prices in these high-inflation countries.
The story of growth in the China’s capital market is an outstanding one. First, the poli-cymakers made it a priority to grow the capital markets as quickly as they could. For thatreason, they established two markets one near Hong Kong and one in the old city of Shanghaiin 1991. Prior to the official start of the trading of stocks—the first company listed was theBeijing Departmental Store—in that year, bond and stock trading was done on off-the-floorbasis since 1985 at Shenzen to train and learn this capitalist method. Since then, the listing hasgrown to some 1200 firms by year 2004. Liquidity is still weak, but the market for listing thefirms is well-established in China after 14 years of modern experience with capital marketin this Communist nation.
In summarising an assessment of the several markets, it can be said that the experience ofAsian and Australian capital markets had been very mixed. Consistent with this experience,the efficiency of these markets vary from very efficient (Hong Kong as an example) to prettyinefficient (Shanghai). Why? Efficiency is measured using the Fama efficiency paradigm: amarket is efficient if there is (a) an absence of historical information affecting current pricesand (b) public information being converted to price signals speedily. Strictly performed, suchtests show that the markets that were situated in countries most affected by global trade andhigh economic growth as well as the fact that these markets were in the private sector, areefficient. Such efficient markets are: Bombay; Singapore; Kuala Lumpur; Australia; HongKong; Seoul; Tokyo; and Bangkok. Studies in scholarly journals indicate that these marketsare pretty efficient, and are capable also of raising sizeable amounts of capital for firms listedin these markets.
The liquidity in Asian markets is moderately high. The most liquid market in New YorkStock Exchange trades US$800 million trade per firm per year. The liquidity of the above-named Asian markets would average anywhere between US$350 to US$450 million in mostof these markets. The liquidity of the markets in other economies with less exposure tothe global movements is well below US$200 million per firm per year. These markets arefound in Karachi, Colombo, Dhaka, Jakarta, Philippines, Vietnam, and other Asian count-ries.
In brief, globalization has affected the development of the capital markets in dramaticmanner. The countries that latched on to the global trading had the most beneficial changesfrom this development. The others, who joined in the late 1980s are beginning to have
158 Mohamed Ariff
favourable changes occurring in their markets. China is one example. Another is that ofIndonesia, where, with the reforms introduced in 1994, the stock market has improved itslisting and its liquidity. The Vietnamese are experimenting with their new market over thelast five years, and more countries will join in this experiment as the globalization affectsthem.
In the cases of the more liquid and more efficient markets, portfolio investments is made byforeign funds as part of their diversification program. Markets in Malaysia, Korea, Thailand,Australia and Hong Kong are among the more favored locations for this activity. Again thisis a late development of globalization leading to global flow of capital that funds domesticmarkets. However, there have been some bad experiences with portfolio flows especially ifthese funds pull out suddenly. At such times as it happened in Seoul in 1988/89 and in KualaLumpur and Bangkok in 1997/98, markets may register huge corrections to the detrimentof the local investors who are left to hold assets at low prices. This problem requires solution,and capital controls imposed on short term capital flow is one method of overcoming theentry of such destabilising effects of portfolio flows. No global solution has been agreedupon although there are a number of suggestions on the table. Overall, the portfolio flowshave helped to improve liquidity in otherwise very shallow markets. The flow of this formof capital, though short term in nature in Asian markets, augments the already heavy foreigndirect investment capital of about US$96 billion a year that is coming to mostly China andfew other countries.
5. THE FUTURE
Any traveller across Asia and Australia—it would a long and expensive travel over exoticlands and peoples—would notice one important physical fact. That is the relative abundanceof creature comforts in the few countries that had latched on the globalization in trade andcapital. The absence of such creature comforts is quite striking when one travels in Hanoi,or in Colombo, or in Karachi, cities situated in countries that did not make a consciousdecision long time ago to latch on to the globalization in trade and capital. Why doesone feel more comfortable in Tokyo, or Hong Kong or Kuala Lumpur or Melbourne isbecause of the wealth that the early decision to latch on to the globalization brought to thesecountries. The early adopters—who made reforms and liberalization as the continuing themeto promote growth—of globalization have benefited much more than the later adopters, wecall the latter the reluctant reformers: see Ariff (1996).
One glimmer of hope is that the reluctant reformers have also joined in the race inthe 1990s as did China in the 1980s. Early indications are that the decision to reform andliberalize, though at much slower speed than desirable in India and Vietnam for example, hadhad salutary effects. Income growth is improving for these late reformers, trade is increasing,as does capital flows especially since 2002, when the World is beginning to settle after thegreat financial crisis of the 1997–98 and after conflicts relating to the September 11 andterrorism. The future of globalization is assured, and with that more social well-being willcome. The stumbling blocks are the continuing uncertainty and the attendant war footingin many countries. However, it is good to be hopeful that the last 55-year experience willcontinue in the same direction. Two well-known commentators had made specific suggestionfor the Southeast Asian nations as the way forward: Arnt and Hill (1998). The more-ready-to-liberalize nations have followed this advice avidly, and are on the road to recovery. While,
10. Impact of Globalization and economic development in Asia and Australia 159
freer trade is a major structure for securing greater prosperity, it is also pertinent that greateropening of the markets—I mean here both the real and financial markets—occurs steadily toestablish market economies and reduce the overhang of state production. These are beginningto take place, and will be speeded once the recoveries seen in many countries become full-blown in the near future.
ENDNOTES
1. There are more than 32 sovereign nations in the vast region of Australasia, a term that is being popularisedin recent years to describe Asia, and the Pacific Asian countries. In this book, coverage is given to far fewercountries that had actually made a connection to globalisation to imrove their well-being. Most countries arestill either ignoring (North Korea) or blissfully unaware of what globalisation could help achieve connection tothe rest of the World.
2. Add to this list the following nations as members of this important trading group: Vietnam; Cambodia; Myanmar;Laos. Recent annual report of the ASEAN secretariat provides a long list of items on which tariff reduction ismaking this trading group a truly free-trading area.
3. The term early reformers refer to a group of eight economies ( Japan, Indonesia, Hong Kong, Malaysia, Singapore,South Korea, Taiwan, and Thailand) which pioneered the export-led growth strategy that secured for thesecountries an early advantage to link to the global trade in goods and capital as well as technology. The latereformers are those economies that began to adopt liberalization in the 1980s. There are several countries,because mainly of political reasons, unable to latch on to the globalisation in trade and capital to secure theirgrowth path.
4. Share markets had declined across Asia (exception Australia) by about 40-60 per cent in the aftermath ofthe IT bubble since 1999. It is only in year 2004, has some upward movement taken place. If the currentasset price movements—still short of the highs of 1997—hold, it is very likely that major state firms will belisted in the years ahead to raise badly needed revenues in countries such as Indonesia, India, Malaysia, and soforth.
5. Exchange rate management was widely practiced to give trade advantage by the Japanese and the Koreans inthe 1970s, which led to the Plaza Accord in 1984, which eliminated this problem. It is again occurring thistime in China. China’s devaluation of its currency by almost 35 per cent in the early 1990s led to them gettingthe advantage in trade, and the ripple effect of that was the slow hollowing out of the hitherto establishedmanufacturing areas in many countries in Asia. China took, until September, 2004, a hard stand that China’scurrency is not undervalued to give it an advantage in trade. They made a statement 10 days prior to the G8meeting that they would consider reforms in exchange rate. Only the future will yield if this will lead to exchangerate reform.
6. These were exchanges set up by the colonial powers to facilitate trade more than to finance local enterprises.However, the working of these markets provided valuable lessons for share market trading, and to list more andmore local firms as the local economies began to demand more capital.
REFERENCES
Aghevli, Bijan B., Mohsin Khan and Peter Montiel (1991), ‘Exchange Rate Policy in Developing Countries: SomeAnalytical Issues’, IMF Occasional Paper No. 78, Washington: International Monetary Fund.
Agtmael, Antoine W. van (1994), ‘Thailand: From Mini-Market to Leading Emerging Market’, in Keith K.H. Parkand Antoine W. van Agtmael (eds.), The World’s Emerging Stock Markets: Structure, Developments, Regulations andOpportunities, Singapore: Heinemann Asia, pp. 121–142.
Ariff, Mohamed (1996), ‘Effects of Financial Liberalization on Four Southeast Asian Financial Markets, 1973–94’,ASEAN Economic Bulletin, 12(3) pp. 325–338.
Ariff, M., and A. Khalid (2000), Liberalization, Growth, and the Asian Financial Crisis, Edward Elgar Publishing,Cheltenham, United Kingdom.
Arndt and Hall (eds.) (1998), Southeast Asia’s Economic Crisis: Origins, Lessons, and the Way Forward, Singapore:Institute of Southeast Asian Studies.
Asian Development Bank (1998), Report of the Working Group on Strengthening International Financial Systems, October,Manila: Asian Development Bank.
BankWatch releases in the Internet (www.bankWatch.com)Cole, David C. and Yung Chul Park (1983), Financial Development in Korea, 1945–78, Cambridge, Massachusetts:
Harvard University Press.

160 Mohamed Ariff
Krugman, Paul (1999), ‘What Happened to Asia’, in Global competition and integration, Sato R; RamachandranR.V. and Mino, K. (eds). Boston, Kluwer Academic Publishers, pp. 315–328.
Root, H. (1996), Small Countries Big Lesson: Governance and the Rise of East Asia, Hong Kong: Oxford UniversityPress.
World Bank (1998), East Asia: the road to recovery, Washington, DC: World Bank.(WTO) World Trade Organisation (1995), Regionalism and the World Trading System, Geneva: World Trade Organi-
zation.
11. GLOBALIZATION AND THE CHANGING RELATIONSHIP BETWEENECONOMIC DEVELOPMENT AND CAPITAL MARKETS: INNOVATIONSIN FUNDING FOR MICROFINANCE
ALEXANDRA BERNASEK, RONNIE J. PHILLIPS, AND MICHAEL P. ROSS
1. INTRODUCTION
The process of economic globalization is having profound effects on capital markets andeconomic development. Capital markets around the world are becoming more integratedand opportunities for borrowing and lending internationally are expanding. At the sametime developing countries are finding they have fewer opportunities to obtain grants andsubsidized loans and are becoming more reliant on international capital markets as a sourceof funds for development projects. What the implications of such a significant change willbe for economic development are as yet unknown.
The purpose of this paper is to present a specific case study that illustrates the phenomenondescribed above and to consider some of the broader implications a case such as this mayhave for economic development and for capital markets. The deal we describe took placein early 2004 between three parties, a development organization that makes micro loans tothe poor, an international bank and a non-profit organization dedicated to promoting thegrowth of microfinance initiatives world-wide. The deal created what was essentially a newfinancial instrument that securitized a pool of micro loans and was then sold to investors.The microfinance institution (MFI) gained access to funds to lend out to poor borrowersand international investors gained access to a new investment opportunity.
The chapter will proceed as follows. In the next section we will present a brief overviewof the role of microfinance in economic development. Following that we will describe indetail the securitization deal that was done in 2004 between SHARE of India, the ICICBank, and Grameen Foundation USA. The implications for the microfinance industry will
162 Alexandra Bernasek, Ronnie J. Phillips, and Michael P. Ross
be discussed in the next section. In the final section we will consider possible implicationsof this kind of deal for economic development more broadly.
2. MICROFINANCE AND ECONOMIC DEVELOPMENT
What began in 1976 as an experiment by an economics professor at Chittagong University inBangladesh became a revolution in approaching the task of poverty alleviation in developingcountries. Muhammad Yunus is the economics professor whose experiment lending smallamounts of money to the rural poor to be used for small scale self-employment activitiesevolved in a specialized financial institution, the Grameen Bank in Bangladesh, and theproliferation world wide of what are known as microfinance or microcredit institutions.
It is widely accepted by economists that there are failures in the area of providing credit—especially for micro-entrepreneurs. Though in theory there would be no unmet credit needsin a perfectly competitive market, in the real world transactions costs and asymmetric infor-mation (when one party to a transaction possesses information not available to anotherparty) result in markets that are not perfectly competitive and credit rationing—Mushinskiand Phillips (2002).
Yunus identified lack of access to financial resources as the main cause of poverty in therural areas of Bangladesh. He observed that poor people had skills, were engaged in productiveactivities, and worked hard. Their inability to get ahead, he reasoned, came from their lackof access to working capital. The poor did not have access to formal capital markets becauseof their lack of physical collateral and were forced instead to rely on local moneylenders andtraders and middlemen who generally charged interest rates of 10–20 percent per month.By studying the circumstances of the poor Yunus was able to create an innovative financialinstitution designed specifically to meet the needs of the self-employed poor.
The innovation that Yunus came up with was in the nature of the lending scheme thathe devised. In the absence of physical collateral, Grameen Bank made loans to self-formedgroups of borrowers, such that each group agreed to guarantee repayment of the loans of allits members. If a group member were to default on a loan then s/he would lose access tofuture loans from the bank and for the remaining group members to maintain their accessto future loans they would have to repay not only their own loans but also the loan ofthe defaulting member. The group lending scheme, by utilizing social collateral instead ofphysical collateral, was able to overcome problems of adverse selection and moral hazardthat traditional formal financial institutions argued made it impossible from them to providecredit to the poor—Varian (1990), Stiglitz (1990).
The costs of such a scheme are high, for example groups are required to attend weeklymeetings with bank representative at which they make payments and receive disbursements.Loans are small, on average about US$120 and a paid back over a period of one year infifty weekly installments of principal and two weeks of interest payments. Borrowers haveto choose investment activities that generate a regular stream of revenues. The bank workerstravel to the meetings with the borrowers, not the other way around. The high degree ofcontact with bank representatives is necessary in ensuring that loans stayed out of default. Italso reinforces the fiscal discipline that is necessary for poor lenders to remain soluble—Yunus(2003, p. 63). All in all the success of the scheme is seen in the repayment rate on loans whichhas consistently remained at around 98 percent; exceptionally high by any banking standards.
11. Globalization and the changing relationship 163
It has been over 20 years since the Grameen Bank gained its status as an official financialinstitution. Over that time the Bank has expanded considerably. As of August 2004, overUS$4.5 billion has been disbursed in loans to members—Grameen Bank Monthly Update,August 2004. The repayment rate on loans is 98.89 percent. There are over 3.7 millionmembers of Grameen Bank and the Bank operates in 46,620 villages throughout the country.In addition to microenterprise loans, the Bank makes home loans, higher education loansand offers members life insurance. There are 74,422 village cell phones being operated bymembers as the result of a special loan program.
Grameen Bank really created a revolution in thinking about poverty alleviation in devel-oping countries. In start contrast to the indirect “trickle-down” approach to developmenthere you have a “bottom-up” injection of credit directly into entrepreneurial activities ofthe poorest and most marginalized people in developing countries. And in contrast to theview that access to resources should be given to men, providing women with access toresources was revealed to be a more effective use of those resources for poverty alleviationamong children. The Grameen experience suggests that it takes a borrower on average about10 years of borrowing from the bank to raise her family out of poverty and that once donethat economic progress is sustained over the long run—Bernasek (2003).
Microfinance has become a central element in economic development strategies aroundthe world. The Microcredit Summit, a group that met in 2002 dedicated to expandingaccess to credit for the poor world wide, set a goal of bringing microcredit to 100 millionborrowers by 2005 and working to link lending institutions around the world—Abe (2003).According to its report as of December 31, 2002 there were 2,572 microcredit institutionsworld wide and a total of 67,606,080 clients had been reached with a current loan. Of thattotal, 41,594,778 clients were among the poorest when they started the program. The poorestare classified as being in the lower half of those living below their country’s poverty line, orbelow $1 a day. The number of poorest borrowers reached is up 55% from the year earlier.The rate of growth in loans for the poorest is currently averaging 40%—Daley-Harris (2003).
Most micro-lending institutions are similar in they way they operate. Two of the majorconcerns that all microcredit institutions share are issues of profitability and sustainability.From the start there was skepticism on the part of many that credit could be provided to thepoor in an efficient and cost effective manner. The skeptics believed that not only wouldoperational costs be substantial, but default costs would also be excessive. The Grameen Bankexperience with this is instructive. Muhammad Yunus always emphasized the need for theBank to be financially sustainable and over the years as the institution evolved he maintainedand even intensified that financial discipline. Today he argues that Grameen Bank is not onlyfinancially sustainable it is “profitable”—Yunus (2003). Over the years however Grameen hasrelied on grants, loans at well below market rates and revenue from investments in assets otherthan loans to borrowers. It is significant to note that it is only relatively recent that GrameenBank has been able to sustain borrowing to obtain funds at market interest rates—Gibbonsand Meehan (2002).
In discussions of financial sustainability the possibility of simply increasing interest ratescharged on loans is raised. Experience suggests that this measure is fine when increasesare small enough to be fairly easily absorbed by the borrowers in their real payments—CGAP (2002, p. 10). In general this remains a problematic strategy though which canincrease the risk of default by borrowers—Stiglitz and Weiss (1981). Other suggestions
164 Alexandra Bernasek, Ronnie J. Phillips, and Michael P. Ross
include integrating operations into existing bank branches, reducing bank contact withborrowers, or other measures to reduce the administrative costs. Here again experiencesuggests that the high administrative cost of making micro loans is a necessary component inensuring high repayment rates of borrowers. The avenue that is being explored more recentlyand which offers some hope is in obtaining sufficient loanable funds at reasonable cost incapital markets to allow microfinance institutions to increase the volume of their lending.That is the essence of the $4.3 million deal executed by ICICI, SHARE, and Grameen USAin January of 2004 to which we will soon turn.
Despite reaching over 67 million borrowers through 2002 there are millions more whowant and need access to capital through a micro-lending institution. Many micro financeinstitutions (MFIs) have the desire and the demand to grow. What they lack is the capacity andcapital to grow. MFIs do not usually operate as traditional banks operate. They are typicallynot classified as depository institutions that take client deposits and use them as lending capital.Instead they focus on lending only and are able to free themselves of many governmentalrestrictions that are placed on traditional banks. The problem with this is that it becomesmuch more difficult to generate capital for lending purposes. Most of the capital that MFIslend, particularly in the early stages, comes from contributions by governments or otherphilanthropic organizations and individuals and loans from governments and institutions thatincur interest at below market rates. As an MFI matures it is able to become more profitableand can start funding its own lending—Gibbons and Meehan (2002, p. 234). They are evenable to borrow in more traditional commercial lending markets receiving unsubsidized loansat market rates. This is clearly preferable from an operational basis as it demonstrates an abilityto exist outside of the unreliable world of voluntary contributions.
The primary problem with this restrictive model of growth is that it is a slow processthat leaves little room for increasing the volume of the lending that is so important forthe MFI’s financial sustainability and for its mission in reaching as many of the poor withcredit as possible. Those MFIs that seek to reach a greater number of people and acceleratetheir growth rates are faced with significant upfront costs that place downward pressureon profitability. This not only prohibits strong gains in growth rates it makes it even moredifficult as investors become reluctant to invest in less profitable assets.
The lack of capital is by far the most critical constraint in the process. The ConsultativeGroup to Assist the Poorest (CGAP) published an article entitled “Water, Water Every-where but Not a Drop to Drink”, which sought to assess the funding environment forMFIs. The study found that funding for the sector was on the rise but many high-potentialMFIs were not receiving the funding they needed. CGAP suggested that the reason for thiswas that “much of the supply of funds to microfinance is ineffective—narrowly targetedand poorly structured.” The first problem CGAP identified was that donors were reluctantto invest in the lesser known organizations even though they had a great deal of potential.Instead funds were funneled to the established MFIs who had already proven their success.This results in the more mature MFIs receiving subsidized funds while the small MFIs strug-gle to find the capital necessary to scale-up their operations—Gibbons and Meehan (2002,p. 233). Such an environment would benefit a great deal if commercial investors had greateraccess to these markets. If this were the case investors could seek out those organizations,large or small, with strong management, high potential for growth, and a commitment totransparency, in which to invest.

11. Globalization and the changing relationship 165
There are a number of creative solutions that have been offered up for this particularproblem. David Gibbons and Jennifer Meehan in their paper suggest the use of quasi-equity,such as subordinated debt, convertible debt, preferred stock, and Special Drawing Rights—Gibbons and Meehan (2002, p. 229). These are all effective instruments and should be utilizedby those in the microcredit industry. The instrument that will be discussed in this paper is ofsimilar value. The method this paper will focus on is the securitization of loans. This processwill provide a means to inject capital quickly into the sector and will provide many otheradditional benefits.
3. THE SHARE/ICIC BANK/GRAMEEN USA SECURITIZATION DEAL
Before turning the specifics of the deal between SHARE, ICIC Bank and GRAMEEN USAwe will provide a little background on the various organizations. ICICI is a commercial bankthat operates in the Indian market. SHARE is a microlending organization that also operatesin India. SHARE is a g Grameen-style organization and represents one of the largest MFIsin the world. Grameen Foundation USA is an offshoot of the Grameen Bank. The GrameenFoundation operates in the United States and is charged with the task of assisting MFIs aroundthe world in securing funds for expansion and operations. In the deal we discuss, a portionof SHARE’s portfolio of loans was sold to the ICICI bank and the Grameen Foundationprovided funds that served as a guarantee for the pool of loans involved in the transac-tion.
In describing the nature of the financial instrument created in the SHARE/ICIC/GRAMEEN USA deal it is necessary to understand how the Asset Backed Securities (ABS)market functions. One of the largest markets included in the ABS market is the Mort-gage Backed Securities (MBS) market—Fabozzi (1996, p. 301) which will be used here forillustration purposes.
Mortgage loans are most often 30 year loans that incur interest using the simple interestdeclining balance method. Under this method interest is only charged on the remainingprinciple balance. If payments are made according to the schedule the effective rate will bethe same as the stated rate. This type of loan represents a fixed-rate, level-payment, fullyamortized loan. Each payment is of equal size. The difference of the full monthly loanpayment and the portion of the loan that is used to pay interest represents the amount usedto reduce the principle of the loan. These payments are designed so that the last loan paymentreduces the principle to zero—Fabozzi (1996, p. 216).
In order for individuals to invest effectively the loans are securitized through the use of amortgage passthrough security. The security is created when a holder of loans pools themtogether and sells shares of the pool. The cash flows of the security depend on the cash flowsof the underlying pool of loans. If any delinquency or default is suffered on any one loan theloss is spread out over all shareholders. There are a number of other features that can varyfrom one deal to another.
The Asset Backed Securities market represents the use of similar procedures applied toa variety of other assets, including manufactured housing, receivables, auto loans, studentloans, etc. One important feature often used is credit enhancement. Credit enhancementrefers to the credit support provided for one or more of the bondholders—Fabozzi (1996,p. 301). Securitizations are frequently split in to multiple classes or tranches. Credit enhance-ment allows the senior tranches to receive a higher credit rating than they would without the

166 Alexandra Bernasek, Ronnie J. Phillips, and Michael P. Ross
enhancements. Enhancement can come in the form of external or internal enhancement.The level of enhancement required can vary and is often determined by the ratingagency.
An external enhancement is created when a third-party agrees to supply a guaranteethat provides for first loss protection against losses in the pool up to a specified amount—Fabozzi (1996, p. 291) This is precisely what was done in the ICICI securitization deal.Asset Backed Securities are called such because they are typically protected with real assets.However, in the case of microcredit, there is no asset backing the pool. It is important tonote that even if the loans were used to purchase assets the purchaser would still not haveclaim to those assets under the contract created in the India securitization—The Economist(2004). Such protections would likely be included in all future contracts. This protects theborrowers from facing the loss of their property if they had difficulty paying their loan.Investors would likely not want claim to such assets anyway as they carry very little valueand would be difficult and costly to secure. In place of real assets the purchasers of the poolrequire the external enhancements be sufficient to protect them relative to the risk they areassuming. The India deal required an 8% first loss protection. For the $4.3 million pool ofloans this amounted to $350,000. Of this $350,000, $325,000 was provided by the US basednon-profit organization Grameen Foundation USA. With Grameen Foundation USA pro-viding 93% of the required cash collateral SHARE was able to maximize the securitizationdeal without the use of its own capital. This also provided an opportunity for GrameenFoundation USA benefactors to leverage their contributions at a rate exceeding 12 to1–GFUSA Press Release, (2004). The use of this form of enhancement was slightly dif-ferent in this particular deal in the sense that the cash was provided up front rather than justa paper guarantee. In that sense it is much like the reserve funds enhancement describedbelow.
There are a number of methods used for internal credit enhancements and they are fre-quently more complicated than external enhancements. The various forms applicable to themicrocredit market are described below.
3.1. Reserve Funds
This form of enhancement can come in two forms; cash reserve funds and excess servicingspread. Under the cash reserve funds format a straight deposit of cash generated from theissuance proceeds is held back for protection. The cash is a portion of the underwritingprofits and are deposited in money market instruments. Cash reserve funds are frequentlyused along side external enhancements.
3.2. Overcollateralization
When overcollateralization is used more loans are included in the pool than what the origi-nator is getting funds for. Essentially the originator is adding an equity kicker that gives thepurchaser some head room in case a portion of the pool was to default.
3.3. Senior-Subordinated Structure
As mentioned earlier tranches are simply classes of assets that are components of a largersecuritization deal. When a senior-subordinated structure exists there is a senior tranche and

11. Globalization and the changing relationship 167
at least one subordinated tranche. For example if we were to apply the India deal the structurecould look like the following:
Senior tranche: $3,870,000Subordinated tranche: $430,000
This means that the first $430,000 of losses is absorbed by the subordinated tranche and thesenior tranche does not experience any losses. There can be more than one tranche underthis structure; in fact there are usually many tranches in any given securitization deal. Themost subordinated tranche will always experience first loss until it is completely exhausted,at which point the next tranche will begin to experience losses.
All of this is significant for the securitization of microcredit loans because the processwould be much the same for those assets. A lending and servicing institution like GrameenBank or SHARE could select a pool of loans for securitization. The loans would be chosenbased on a set of criterion. This is necessary to insure that the securities can be effec-tively analyzed by potential investors and especially by the rating agencies. There are manypotential criteria but the following is a partial list that highlights some of the most impor-tant:
a. Payment terms—the loans in the pool must have the same payment terms, preferablyall the loans would be collected on a simple interest, declining-balance, fully amortizedbasis.
b. Recent history of loan—the loan should not have suffered delinquency or default inthe last six months
c. Maximum size of loan—a cap should be determined, over which loans cannot beincluded in the pool. This would encourage organizations particularly interested in pro-viding access to capital for the poor and very poor to participate in guaranteeing the loans.It would also allow banks in developing nations to fulfill government requirements that acertain percentage of their portfolio be invested in the very poor, as was the case in theICICI deal.
Interestingly in the SHARE securitization there was very little in the way of criteria thatwere used to select the loans. Rather than handpicking loans that were qualified for the poolSHARE simply chose 26 different branches. The only real criteria was that the branchesnot be encumbered by any type of lien or any other encumbrance that would complicatethe transfer of ownership to ICICI. The loans from all of these branches, regardless of theirstatus, were included in the pool. The sale of these loans accounted for 25% of SHARE’sportfolio, the implications of which will be discussed later in the paper.1
While there were no criteria used in selecting loans for this particular securitization thiswill become a more important issue in the future. A process for selection will becomenecessary to ensure the quality of loans included in any particular securitization. As thesecuritizations become more common in frequency and larger in size there becomes thepotential for the originator to “cherry-pick” the loans that will be included in the pool.Under these circumstances they could choose the more “at risk” loans in the pool thatthey securitize and keep the lower risk or higher yielding loans in their own portfolio. Asmentioned earlier a set of criteria for choosing the loans will expedite the rating process and

168 Alexandra Bernasek, Ronnie J. Phillips, and Michael P. Ross
allow the instruments to get to market more quickly, which is of particular interest since theloans are frequently for no longer than 50 weeks.
SHARE was required to provide some funds in reserve to provide some indemnity toICICI. The first pool of funds they were required to provide was for prepayment indemnity.This is likely more a result of the bank’s unfamiliarity with micro-credit than the provisionof protection for a real concern. With microcredit, unlike many other forms of debt, the riskof prepayment is almost nil. Since so many borrowers live on a near day-to-day basis they arenot likely to have the resources to prepay. The likelihood of a borrower somehow refinancingtheir loan is highly unlikely as well. There is already a short supply of microcredit loans andMFIs are not seeking to take clients away from their “competitors.” Even the original issueris not likely to refinance any debt as this is done only in extreme circumstances where therewould be no way for the borrower to make their payments if a restructuring of the loan wasnot completed (for example after a natural disaster).
The second form of enhancement SHARE was required to include was a stamp dutyindemnity. In India banks are required to charge a stamp duty on every loan that is issued.Since SHARE is not considered a bank they have not had to levy these stamp duties. At thetime the deal was executed it was unclear if ICICI would have to pay the stamp duties onthe microcredit loans they were absorbing into their portfolio. In order to avoid the burdenof paying these duties ICICI required SHARE to provide an indemnity that would coverthe full costs of the duties.
Once a pool of qualified loans is selected the MFI can then contract to sell the loans to abank or other investment entity. Ownership of the loan would then be transferred to the poolbuyer. This transfer of ownership is significant to both buyers. The MFI no longer carriesthe loan in its portfolio, thus it also no longer carries the loan’s risk in its portfolio. If any,or all, of the loans in the pool were to fall in to delinquency or default the MFI would notsuffer any losses. Instead the pool buyer has taken on all of the risk of default. The advantageto the buyer is that they are able to obtain a return that is higher than the prevailing marketreturn.
Although the loans are no longer owned by the MFI the organization will continue toservice the loans. The borrowers would not notice any difference in the way the day-to-dayoperations of their particular MFI. Staff from the MFIs would continue to provide servicesto borrowers whose loans were sold. The payments would also be made in the same manner.Under the new structure however the MFI would pass the income from the pooled loanson to the supervising trust that facilitates the bonds.
In order to cover the costs of managing the loans the MFI would receive a servicing fee.This fee would likely come in the form of a spread. For instance, the loan rate that the MFIcharges its borrowers could be 16% and the rate that the pass-through owners receive couldbe 10%. The MFI would use the difference of 6% to cover its administrative costs. The spreadon the loans is high because the administration costs on microcredit loans are proportionatelyhigher than more conventional loans that would carry a much narrower spread. Since theloans are amortized the cash flow from the loan that consists of interest payments declinesas the loan ages. The fees that the loan servicer receives are simply a portion of the interestpayments and will thus also decline as the loan ages. Such a payment schedule would requireMFIs to budget for this declining level of cash-inflows even as servicing costs are remainingthe same. The short lives of the loans should alleviate any burden this places on the MFI.
11. Globalization and the changing relationship 169
After a securitization is completed the MFI is left with a lump sum payment from the saleof its pool. This capital is now available for the MFI to lend to new borrowers. Under normalconditions there would be no way for an MFI to use its loans as means of leverage in raisingcapital for additional loans, but with the use of derivatives they become very productiveassets. The rapidity with which this cycle can complete itself allows for tremendous growthreaching the demand that is, at this point, far outpacing the supply. Growth of this kindis much more organic than simply growth from philanthropic contributions and subsidizedloans. It is also likely to be more sustainable than relying on contributions from third partieswhich allows the MFIs and their pools to receive higher ratings and thus enhancing the endproduct securities.
Rating becomes a significant issue in the derivative industry. Most investors make theirrisk/return decisions based on the ratings provided from the major rating agencies. Thethree major rating agencies consist of Moody’s Investors Services, Inc., Standard & Poor’sCorporation, and Fitch. They each assign ratings based on a standardized scale that representsthe likelihood of default—Fabozzi (1996, p. 19). The ratings can have a significant impacton the price of the bonds from a securitization deal. The criteria on which the bonds wouldlikely be rated would be similar to those mentioned earlier in regard to screening loans to beincluded in the pools. The analysis would focus on the extent to which the loans in a poolfulfill those criteria. This is not a static process as the agencies can change their ratings atany time if there is concern that certain ratios are falling out of line with initial expectations.The agencies would also likely analyze the ability of the MFI’s to ensure that borrowers donot become delinquent in their loans and the efficiency with which they are servicing theloans. The solvency of the MFI also becomes important to the agencies, particularly if theyare providing any kind of enhancement or guarantee for the loans.
4. IMPLICATIONS FOR MICROFINANCE AND DEVELOPMENT
Clearly this kind of financial instrument has the potential to impact the microfinance industryprofoundly. It could, if popularly adopted, change the face of the industry all-together. Inconsidering some of the possible implications of such deals on the microfiance industryand on the goals of development we will begin by mentioning some possible limits onthe adoption of such instruments by investors in international capital markets. The mostimportant questions would seem to be “Will securitization provide the resources for thedesired growth in the microfinance industry?”
While securitization demonstrates great prospects there has been little to no use of it untilthe most recent deals. In a paper prepared as part of a USAID Best Practices Project thecosts of executing a securitization are of concern as they can become prohibitively highand prevent a securitization from being even a break-even investment—Bass (2000). Thecosts are so high primarily due to information gathering, analysis, and monitoring. With somany loans it becomes costly to keep up-to-date information on them. Investors want thisinformation so that they know the status of their investment and whether or not there isthe potential for losses to go beyond the guarantees. The cost for this type of informationis on the decline as more and more of the servicing gets recorded electronically on a timelybasis. The speed of transmission of this information to rating agencies and investors will inturn continue to accelerate and drive costs down. In the India securitization it seems thatICICI was not concerned with obtaining information on individual loans from SHARE.

170 Alexandra Bernasek, Ronnie J. Phillips, and Michael P. Ross
Instead they had confidence in the track record of SHARE and agreed to purchase a poolof loans on which much of the information was likely an aggregate. While this strategy ofselecting pools will persist in the short term, as securitizations become more common andsophisticated there will probably be a divergence from such simplistic selection. In the case ofmore sophisticated pooling scenarios, which could in turn result in higher ratings, criterionlike those suggested above may become necessary.
While it is now evident that securitization is possible for microcredit it is less clear whatthe market looks like on the other end. In order for securitizations to have the desired impactthere must be a sufficient number of investors who would purchase such instruments. Whileat first glance it would seem that the short life span of the loans would prohibit the poolsfrom becoming marketable on a large scale, in fact there are many investors who are bothwilling and in need of short term investment instruments that are of high quality.
Another issue when considering the final investors is the creation of a secondary marketor some other market for the intermediary to sell the instruments to. In order for a realsecondary market to exist it must be large, liquid, have easy access to information, and bestandardized. These are all hurdles that microcredit securitization will have to overcome. Themicrocredit industry on a whole is very large. There are billions of dollars being lent andbillions more that could be lent. The challenge will be getting a large volume of these loanspooled and securitized. It will be a slow process but as the trend picks up a sufficiently sizedsecondary market could be created in a matter of a few years. Liquidity is a product of sizeand quantity of buyers. As the market grows there will be more investors drawn to it. Witha larger number of investors comes an increased level of liquidity. There are many investorswho could be interested in these instruments, both in the countries where the loans areoriginated and elsewhere.
As for ICICI one of the driving factors behind their participation in a microcredit securi-tization was to help fulfill requirements of the Indian government. In India many banks areencouraged to direct 40% of their lending to “priority sectors.” In many cases microfinancefulfills that designation. This provides banks that are looking to move closer to that percent-age to do so in an efficient and profitable manner. Ready access to information that is timelyand accurate is still a concern for much of this industry. At this point it is really dependantupon the individual organization. As an organization grows and matures it also become moresophisticated in its information technologies by necessity. For the larger, more establishedMFIs information is less of an issue. However, until the knowledge and infrastructure that isnecessary for good information is passed on to the less mature organizations they will havegreater difficulty participating in the securitization market.
Standardization is truly where the microcredit industry will face challenges. Standardizationis important because it allows investors to compare one instrument to another in an accuratemanner. The primary ways in which loans should be standardized are the length of timefor which the loans are made, the method by which the loans are collected (amortizedover the period of the loan), and the method by which the default rate is measured. TheMicrobanking Bulletin recognized the importance of this problem and made it the focus oftheir November 2002 issue. “Standardization is a challenge when we consider the number ofparties involved and the different perspectives of each. Agreeing to common standards alsoimplies that we will need to change current practices, sometimes used for years. This exercisetherefore requires an open-mind and understanding that the benefits of standardization for the
11. Globalization and the changing relationship 171
sector by far outweigh the inconveniences of going through the exercise.” These commentsby the editor of the Microbanking Bulletin demonstrate the concern that the issue hasgenerated, as we would expect. The true test will be the extent to which individual MFIsadopt the standardized operating and reporting guidelines. Gaining access to internationalcapital markets will clearly provide and incentive for that to take place.
In the near term large-scale standardization and the creation of a secondary market withwidth and depth is unlikely. Instead much of the financing for securitizations is likely tocome through private placements. In a private placement a bank, like ICICI would purchasethe pool of loans for their own portfolio, or would issue certificates that serve as claimsto the pools cash flows to one or two large investors. This form of securitization allowsindividual deals to occur without fitting in to rigid industry-wide standards that are requiredfor secondary market instruments. Particularly with short-term instruments there is likely asufficiently sized market to support the number of micro-loans that could theoretically besecuritized. Either way interest in investing in emerging market securities continues to grow.With real interest rates in the developing nations remaining at very low levels investors areseeking out high quality investments in emerging markets that offer a healthier return. Netprivate credit flows, which is primarily composed of bond purchases, is expected to reach$45 billion in 2004 in emerging market economies—IIF (2004, p. 11).
Clearly of major importance in considering more widespread use of securitization of microloans is anticipating the impact it is like to have on the MFIs and on the borrowers. As itis still early and there is little evidence to turn to for an answer it is difficult to fully assessthe impact. Despite this lack of experience there is good reason to believe that securitizationwill have little impact on the day to day operation of MFIs, although it could transform thecurrent structure of the MFIs in significant ways. On a day-to-day basis there is really littleto change. The loans must still be serviced and paid back. The MFI employees know this,the purchasers know this, and most importantly the borrowers know this. If anything it willcreate even greater pressure for the MFIs to operate efficiently and to keep all loans current.While the MFI will no longer have the loans on their balance sheet it is still of interest tothem that the loans get paid back. If they demonstrate that their loans are good investmentsit will become easier and less costly to have them securitized. This is of great significance inmicrocredit as the loans are only 50 weeks in length and thus the MFI has a whole new poolof loans every year.
The MFI now has an obligation to ensure that the current pool of loans fulfills the buyer’sexpectations. As a result there is now a second party interested in the repayment of theloan and the emphasis on efficiency and loan repayment is reinforced. One of the possibleoutcomes of intense repayment pressures is coercion of borrowers. While that is a dangerin the absence of this kind of securitization deal it is clearly intensified when the MFI itselfcomes under pressure from investors—Bernasek (2003). This is something that should bemonitored and closely and safeguards put in place to ensure that it does not occur.
One likely area of conflict is the refinancing or restructuring of a loan. A great risk indeveloping nations is that of a catastrophic event. Whether this be an act of God or an act ofgovernment the status on a large number of loans is generally affected. In the event of naturaldisasters for example, MFIs have frequently had to restructure loans with longer repaymentperiods in order to ensure full repayment of the loan. MFIs are often pressured to forgiveloans under such circumstances but Grameen Bank has insisted on loan restructuring rather
172 Alexandra Bernasek, Ronnie J. Phillips, and Michael P. Ross
than loan forgiveness in such circumstance and in general that seems to be the norm. Nonethe less it is not clear whether or not the securitization of loans would give an MFI pause inrestructuring loans, on a large scale or even on an individual basis. Because of the pressure puton the guarantees backing the securitizations in the event of a restructuring MFIs flexibilityin restructuring loans may be diminished. Given that the ability of an MFI to restructureloans in the event of some catastrophic event affecting borrowers is necessary for maintaininghigh repayment rates and ultimately for the sustainability of the MFI, securitizations willhave to provide some mechanism for accommodating such loan restructuring.
On a larger scale and over a longer term securitization could dramatically impact MFIs.If an MFI were to securitize most to all of their loans they would become purely a servicingcompany. If an MFI were to change its strategic direction in this respect the impact couldtrickle down to the individual borrowers. As a servicer the MFI would have the incentiveto take on only those loans that it can include in pools that will later be securitized. Higherrisk borrowers could be left behind as their loans would be undesirable to include in such apool. If they were included they could potentially reduce the repayment rate and thus causethe buyer to require higher amounts of protection in future securitizations.
In order to ensure that the original mission of the MFI is not lost, it may consider keepingsome loans on its own balance sheet so that an emphasis on the poorest is not lost in theinterest of high quality loans. If interest rates on the loans are sufficiently high the MFIs couldinclude some higher risk loans in their pools. While this would add to the risk involved withthe securitization, interest rates may be sufficiently high to compensate the investor forthe added risk. Securitization could also give those organizations interested in reaching thepoorest of the poor the opportunity to encourage lending to those borrowers. If they enterthe market seeking to purchase pools composed of loans, at least 50% of which are made tothe poorest borrowers, they could essentially create the impetus MFIs need to increase theirlending to such borrowers.
The fact that the loans expire in one year can actually serve as an advantage to MFIs insecuritization deals. Each year the MFI can reevaluate how much of its portfolio it wantsto securitize. If it decides that keeping a portion of its portfolio would be of use they cansimply withhold it from the next year’s securitization. Securitization also allows the MFIsto be strategically flexible. Theoretically the funds that an MFI raises from a securitizationare not committed. If the MFI feels that more money needs to be spent on infrastructureupgrades, efficiency improvements, or other operating expenses rather than new loans theycan simply adjust their allocation.
Ultimately the question of how much of their loan portfolios MFIs should securitizearises. While there is the potential for an MFI to securitize its entire portfolio is this themost advantageous thing for them to do? Will MFIs lose control over their operations withmore of their loans securitized? The influence of purchasers of these securities is somewhatanalogous to the influence of shareholders on management. There is the potential for aconflict of interest between borrowers and investors. If an MFI is regularly securitizing most,or all, of its portfolio and is relying on the proceeds of securitizations to keep its rate ofgrowth high will face greater pressure to abide by the wishes of secondary purchasers and thesecuritizing institutions. MFIs generally face similar pressures from donors. They attempt tobalance the expectations and requirements of donors with their own vision of how best tolend to their borrowers.
11. Globalization and the changing relationship 173
While balancing their own interests with those of providers of funds is not new for MFIs,the additional pressure from investors and securitizing institutions may negatively impact thesupport that MFIs currently receive. Philanthropic organizations, generous individuals, andsocially oriented government programs are currently significant contributors to the successand growth of MFIs. As an MFI utilizes securitization more and more conflicts with donorsmay result. Often times donors have preferred to see their money going directly to lendingrather than to operational expenses. That attitude could transfer to the securitizations as thefunds would likely be used for guarantees and enhancements rather than going directly toborrowers. MFIs will face the challenge of education donors about the potential benefits ofsuch an arrangement. If donors were to see that their funds could be leveraged on a 10 to1 basis or better they may be even more inclined to contribute than before. MFIs abilitiesto reconcile potentially conflicting interests are then likely to be factors in the success ofsecuritization.
5. CONCLUSION
The potential for the microfinance industry to benefit from greater access to internationalcapital markets through securitization deals like the one negotiated by SHARE, ICIC Bankand Grameen Foundation USA is significant. There are also significant challenges involvedin the widespread use of such financial instruments for Microfinance Institutions and forinternational investors. And while it is too early to anticipate the likelihood of such a devel-opment it is clear that experiments like this one will continue to emerge as the process ofeconomic globalization facilitates opportunities for closer ties between investors in the Northand entrepreneurs in the South.
What are the implications of this for economic development more broadly? microfinanceseems to be a particularly good candidate for innovative funding opportunities throughinternational capital markets. The industry makes loans to poor people who engage in highlyproductive, albeit small-scale activities, and the poor borrowers repay the loans at an incrediblyhigh rate. A win-win outcome is potentially created as more funds are made available forsuch loans and international investors gain access to a new investment opportunity. Howmany other candidates are there likely to be for such an outcome?
Traditional development projects such as investments in infrastructure, health and educa-tion are unlikely to be good candidates for international investment. These long term socialinvestments will continue to depend on governments and their access to funds. Developingcountry governments, most of which are debt burdened, are unlikely to be able to raisethe money needed for such investments in international capital markets. In this case thereis no real alternative to increased development assistance from developed countries and asignificant reduction in the debt burdens of the developing countries.
A closer connection between the process of economic development and internationalcapital markets appears to offer opportunities for innovative ways of funding certain kinds ofdevelopment projects. In this case we have seen the possibilities for the microfinance industry.If new opportunities for funding can be created for this strategic development area and forothers like it, there is reason to be hopeful about the pursuit of economic development inthis era of economic globalization. That being said, if the areas in which such opportunitiesare unlikely to be significant then it will be important to bolster funding for development
174 Alexandra Bernasek, Ronnie J. Phillips, and Michael P. Ross
with the more traditional means of official development assistance and loans from multilateralinstitutions.
ENDNOTE
1. The information on the details of the Share/ICIC/Grameen Foundation USA deal was provided to the authorsvia interviews with a representative of Grameen Foundation USA.
REFERENCES
Abe, Kiyoshi, Microcredit for the Poorest Countries, in The Future of Banking, edited by Benton E. Gup, QuorumBooks, 2003, 317–332.
Bass, Jacqueline. Innovations in Microfinance. Washington, D.C.: USAID, 2000.Bernasek, A. Banking on Social Change: Grameen Bank Lending to Women, International Journal of Politics, Culture
and Society, Vol. 16, no. 3, Spring 2003, 369–385.Consultative Group to Assist the Poorest (CGAP). Occasional Paper: Microcredit Interest Rates. Washington, D.C.,
2002.Daley-Harris, Sam. State of the Microcredit Summit Campaign Report 2003.The Economist. Shuffling the Buffalo. Vol. 370 Issue 8361, February 7, 2004.Fabozzi, Frank J. Fixed Income Securities. New York: John Wiley & Sons, 1996.Gibbons, David S., and Jennifer W. Meehan. “Financing Microfinance for Poverty Reduction.” In Pathways out
of Poverty: Innovations in Microfinance for the Poorest Families. Ed. Sam Daley-Harris. Bloomfield, CT: KumarianPress, 2002.
Grameen Foundation USA. Grameen Foundation USA Announces Historic $4.3 Million Securitization Deal inIndia. Washington, D.C.: Grameen Foundation USA, 2004.
Grameen Bank Monthly Update for August 2004, Statement No. 1, Issue No. 296, September 15, 2004.Institute of International Finance, Inc. Capital Flows to Emerging Market Economies. Washington, D.C.: IIF, 2004.Microbanking Bulletin. Focus on Standardization. 2002. http://www.mixmbb.org/en/Mushinski, D. and R. Phillips. Microcredit in the International Encyclopedia of Business and Management, London,
Thomson Learning, 2002.Stiglitz, J. E. and A. Weiss, Credit Rationing in Markets With Imperfect Information, American Economic Review,
vol. 171, 1981, 393–410.Stiglitz, J., Peer Monitoring and Credit Markets, World Bank Economic Review, vol. 4, no. 3, 1990, 351–366.Varian, H. R. Monitoring Agents With Other Agents. Journal of Institutional and Theoretical Economics, vol. 146,
no. 1, 1990, 153–174.Yunus, Muhammad. Banker to the Poor: Microlending and thee Battle Against World Poverty. New York, Public Affairs,
2003.Yunus, Muhammad. Grameen Bank at a Glance. The Grameen Bank web site: http://www.grameen-info.org/
banldGBGlance.htm, 2004.
12. WAITING FOR CAPITAL: THE IMPACT OF CORRUPTION IN INDONESIANFINANCIAL MARKETS
GORDON MENZIES, CHRIS TERRY, AND ROWAN TRAYLER
1. INTRODUCTION
Over the two decades prior to the 1997 Asian Crisis the Indonesian archipelago experienceda sustained period of economic growth, doubling real output per capita and lifting millionsout of poverty—Sarel, (1997). This spectacular economic performance made the events of thesubsequent years all the more surprising. The collapse of the Indonesian rupiah, the disastrousrevaluation of foreign-currency-denominated debt, and the resulting political upheaval areall well documented—IMF, (2002).
One concerning legacy of the crisis has been the surprisingly persistent current accountsurpluses, with their attendant capital outflows. For example, the IMF pencilled in a currentaccount figure near zero for 2001, while the actual outcome was around 5 per cent of GDP.It is arguably inappropriate for a country at Indonesia’s stage of development to be exportingcapital. Non-sovereign borrowers have made some tentative progress in gaining access toworld capital markets, although the recovery of capital inflows has been slower than in othercrisis-affected countries—IMF, (2002). In 2002, Indonesia was the only country in South-East Asia to record a net outflow of foreign direct investment—Economist, (2003b). Thecurrent account is projected to remain in surplus by over 2 per cent of GDP in 2004, withprivate capital outflows of around the same magnitude—IMF, (2004a).
The crisis also highlighted corruption as a key issue in the political and economic life ofIndonesia. Many of the practices of so-called ‘Crony Capitalism’ remained hidden duringthe relatively prosperous years prior to the crisis. But the extent of corruption, and itsdisastrous effects, are now well and truly under international gaze. Table 1 shows internationalcomparisons of different measures of corruption and governance.
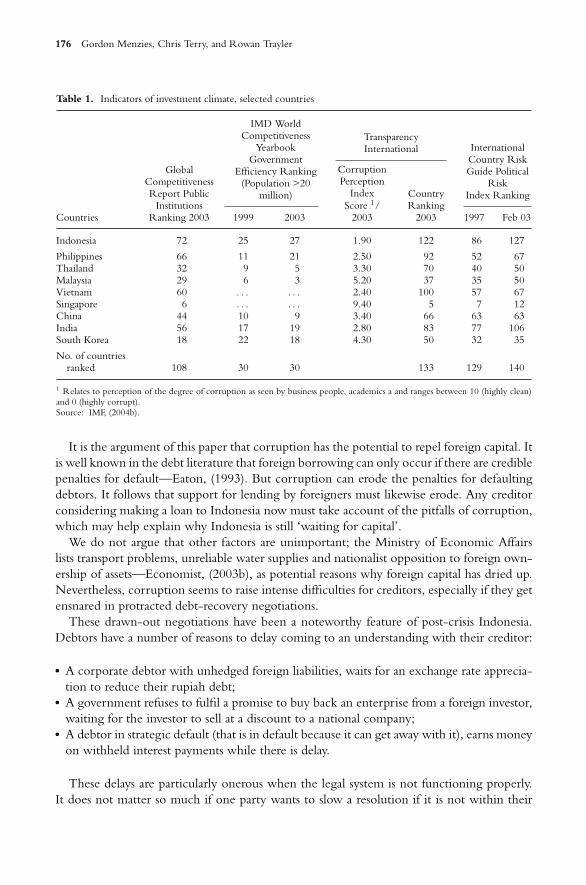
176 Gordon Menzies, Chris Terry, and Rowan Trayler
Table 1. Indicators of investment climate, selected countries
InternationalCountry RiskGuide Political
RiskIndex Ranking
TransparencyInternational
IMD WorldCompetitiveness
YearbookGovernment
Efficiency Ranking(Population >20
million)
Countries
GlobalCompetitivenessReport Public
InstitutionsRanking 2003 1999 2003
CorruptionPerception
IndexScore 1/
2003
CountryRanking
2003 1997 Feb 03
Indonesia 72 25 27 1.90 122 86 127
Philippines 66 11 21 2.50 92 52 67Thailand 32 9 5 3.30 70 40 50Malaysia 29 6 3 5.20 37 35 50Vietnam 60 . . . . . . 2.40 100 57 67Singapore 6 . . . . . . 9.40 5 7 12China 44 10 9 3.40 66 63 63India 56 17 19 2.80 83 77 106South Korea 18 22 18 4.30 50 32 35
No. of countriesranked 108 30 30 133 129 140
1 Relates to perception of the degree of corruption as seen by business people, academics a and ranges between 10 (highly clean)and 0 (highly corrupt).Source: IMF, (2004b).
It is the argument of this paper that corruption has the potential to repel foreign capital. Itis well known in the debt literature that foreign borrowing can only occur if there are crediblepenalties for default—Eaton, (1993). But corruption can erode the penalties for defaultingdebtors. It follows that support for lending by foreigners must likewise erode. Any creditorconsidering making a loan to Indonesia now must take account of the pitfalls of corruption,which may help explain why Indonesia is still ‘waiting for capital’.
We do not argue that other factors are unimportant; the Ministry of Economic Affairslists transport problems, unreliable water supplies and nationalist opposition to foreign own-ership of assets—Economist, (2003b), as potential reasons why foreign capital has dried up.Nevertheless, corruption seems to raise intense difficulties for creditors, especially if they getensnared in protracted debt-recovery negotiations.
These drawn-out negotiations have been a noteworthy feature of post-crisis Indonesia.Debtors have a number of reasons to delay coming to an understanding with their creditor:
� A corporate debtor with unhedged foreign liabilities, waits for an exchange rate apprecia-tion to reduce their rupiah debt;
� A government refuses to fulfil a promise to buy back an enterprise from a foreign investor,waiting for the investor to sell at a discount to a national company;
� A debtor in strategic default (that is in default because it can get away with it), earns moneyon withheld interest payments while there is delay.
These delays are particularly onerous when the legal system is not functioning properly.It does not matter so much if one party wants to slow a resolution if it is not within their
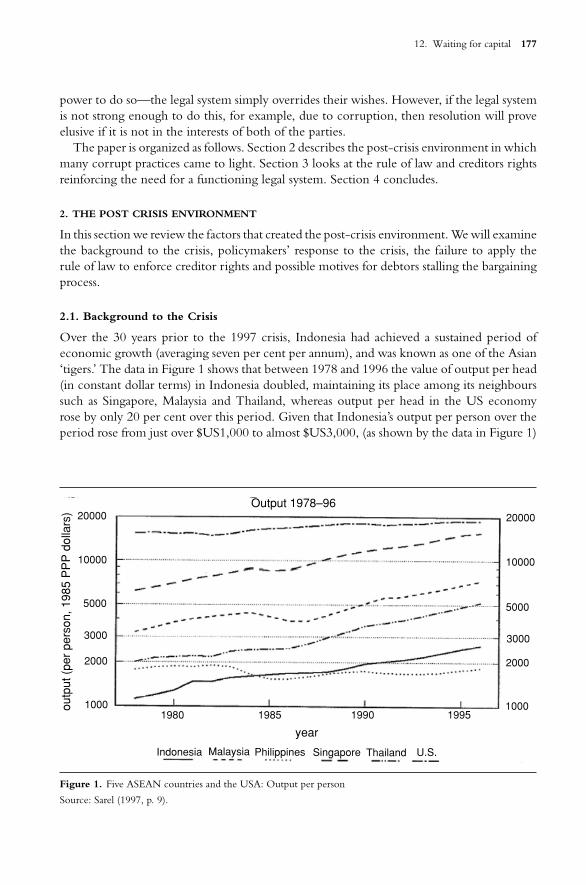
12. Waiting for capital 177
power to do so—the legal system simply overrides their wishes. However, if the legal systemis not strong enough to do this, for example, due to corruption, then resolution will proveelusive if it is not in the interests of both of the parties.
The paper is organized as follows. Section 2 describes the post-crisis environment in whichmany corrupt practices came to light. Section 3 looks at the rule of law and creditors rightsreinforcing the need for a functioning legal system. Section 4 concludes.
2. THE POST CRISIS ENVIRONMENT
In this section we review the factors that created the post-crisis environment. We will examinethe background to the crisis, policymakers’ response to the crisis, the failure to apply therule of law to enforce creditor rights and possible motives for debtors stalling the bargainingprocess.
2.1. Background to the Crisis
Over the 30 years prior to the 1997 crisis, Indonesia had achieved a sustained period ofeconomic growth (averaging seven per cent per annum), and was known as one of the Asian‘tigers.’ The data in Figure 1 shows that between 1978 and 1996 the value of output per head(in constant dollar terms) in Indonesia doubled, maintaining its place among its neighbourssuch as Singapore, Malaysia and Thailand, whereas output per head in the US economyrose by only 20 per cent over this period. Given that Indonesia’s output per person over theperiod rose from just over $US1,000 to almost $US3,000, (as shown by the data in Figure 1)
19801000ou
tput
(pe
r pe
rson
, 198
5 P
PP
dol
lars
)
2000
3000
5000
10000
20000
Indonesia Malaysia Philippines Singapore Thailand U.S.
1985
year
Output 1978–96
1990 19951000
2000
3000
5000
10000
20000
Figure 1. Five ASEAN countries and the USA: Output per person
Source: Sarel (1997, p. 9).
178 Gordon Menzies, Chris Terry, and Rowan Trayler
it is an emerging economy, and, given its population of over 235 million, Indonesia is a verylarge emerging economy.
During the mid 1990s the outstanding growth performance of the Asian tigers attractedconsiderable attention in the literature, especially the issue of how long these economiescould sustain their superior growth rates. Krugman, (1994) suggested that growth in Asiawas the result of the growth in inputs with very little contribution from improvements inthe productivity of their inputs (that is, their total factor product, TFP) and that there arelimits to the mobilisation of inputs, which would result in a decline in the growth rates ofthese economies.
“The newly industrializing countries of Asia, like the Soviet Union of the 1950s, haveachieved rapid growth in a large part through an astonishing mobilization of resources. Onceone accounts for the role of rapidly growing inputs in these countries’ growth, one findslittle left to explain. Asian growth, like that of the Soviet Union in its high-growth era, seemsto be driven by extraordinary growth in inputs like labor and capital rather than by gains inefficiency”—Krugman, (1994).
This view was shared by others, such as Young, (1995), who attempted to decomposethe source of growth between the rate of factor accumulation and improvements in factorproductivity and concluded that the latter played a very small role as a source of growthin these Asian economies. According to this view, growth rates in these economies wouldnot be sustained and this might infer (if, coincidentally, the predicted slow-down in produc-tivity occurred at the time of the financial crisis) that their post-crisis growth performancewould not return to their pre-crisis rate. To some degree Indonesia’s post-crisis experience isconsistent with this expectation. However other studies, such as that by Sarel, (1997) foundthat total factor productivity was a more important contributor to growth in most ASEANcountries (including Indonesia).
Sarel’s study covered the period 1978–96 and confirmed that growth in inputs, especiallycapital, was the major source of growth, but more importantly found that the contributionof TFP was underestimated by researchers such as Young. According to Sarel’s study, theaverage annual growth in TFP was 2.2 per cent in Singapore, 2.0 per cent in Thailand andMalaysia and 1.2 per cent in Indonesia, which compare very favourably to the US rate of0.3 per cent—Sarel, (1997).
In Indonesia’s case, real GDP grew by an average annual rate of 8 per cent in the six yearsbefore the 1997 financial crisis, when real GDP fell by 13 per cent (in 1998), and, has grownat around 4 per cent over the post-crisis period to 2003. Hence, on this issue hindsight showsthat Krugman’s assessment was too pessimistic, especially if one accepts that other mattershave contributed to the economy’s growth rate not returning to the 7 per cent experience. Itwould seem that structural and governance problems are the more likely causes of the slowerrecovery in Indonesia.
2.2. Policymakers’ Response
According to Grenville, (2004), “The Indonesian crisis was surprising both in the event andpuzzling afterwards. This was a country that had experienced three decades of 7% annualgrowth, that had coped successfully with a series of setbacks, that had one of the longestserving and most experienced teams of economic policy makers, that had no serious macro
12. Waiting for capital 179
imbalances, and had adequate foreign exchange reserves. Why did it experience a crisis farmore serious—in terms of the fall in the exchange rate, the damage to the banking system,the fall in GDP and the tardiness of the recovery . . . —than its Asian neighbours?”
Some of the reasons that have subsequently been advanced to explain its impact were wellknown prior to the crisis.
First, there was the failure to apply the rule of law because of corruption, especially inthe forms of rent-seeking behaviour by politicians (and their cronies), bureaucrats and thecourts—Robinson and Hadiz, (2004). Second, as reported by the Independent EvaluationOffice (IEO), there was an unsound banking system, due to imprudent and related-partylending and ineffectual prudential supervision due in part to cronyism and corruption -IEO,(2003). Finally, there were the potentially unstable capital inflows. According to Grenville,(2004) Indonesia’s “ . . . pre-crisis capital inflow was potentially volatile because it was largelyherd driven, led by portfolio managers more interested in diversifying and rebalancing theirportfolios than in making fine judgements about risk. ‘Emerging markets’ had become themarket favourites. . . . The problem was that these markets were tiny, and were not able toabsorb such flows easily.”
The IMF acknowledged as reported by The Independent Evaluation Office (IEO), (2003),that its surveillance of the Indonesian economy failed to raise the alarm “ . . . because the crisisoccurred against the background of sound macroeconomic fundamentals, including goodexport growth performance, relative price stability, and broad fiscal balance. There werevulnerabilities . . . in the form of sector weaknesses, highly leveraged corporate balance sheets,weak public and corporate sector governance, and rising short-term unhedged externalindebtedness.”
The IMF’s surveillance of member countries is conducted annually under Article IVof the Articles of Agreement and covers “the country’s economic policies and potentialvulnerabilities.” This is routine surveillance, as opposed to the surveillance involved whenfinancial support is provided to assist with adjustment programs such as the arrangements theIMF established with the Indonesian government.
Indonesia’s crisis (and that of neighbouring countries) was perceived as an exchange rateand financial account crisis (that is, a massive fall in capital inflow and a massive rise incapital outflow) due to a loss of confidence by domestic and foreign investors. An elementof contagion was involved, triggered by the depreciation of the Thai baht and a substantialincrease in foreign-currency short-term funding—IEO, (2003). However, even during thefirst five months of the crisis (that is from July to November 1997) there were a rangeof views about the true value of the rupiah. Lehman Brothers expressed confidence inAugust 1997 that the currency shocks would be temporary and a senior executive of StanleyMorgan Asia predicted on 5 November 1997 that the rupiah, when trading at 3,900 rupiahto one US$, would settle at 3,100 rupiah to one US dollar—Robinson and Hadiz, (2004).Goldman Sachs’ in its November 1997 “Emerging Markets Currency Report” expressedsimilar sentiments and it was reported that hedge funds were investing in rupiah denominateassets in the expectation that the currency had ‘overshot’—IEO, (2003).
As noted by Grenville, the crisis unexpectedly deepened into a serious economic andsocial crisis due to the 13 per cent fall in real GDP in 1998 which increased unemploymentand returned many people to poverty (Table 2). It also caused systemic insolvency within
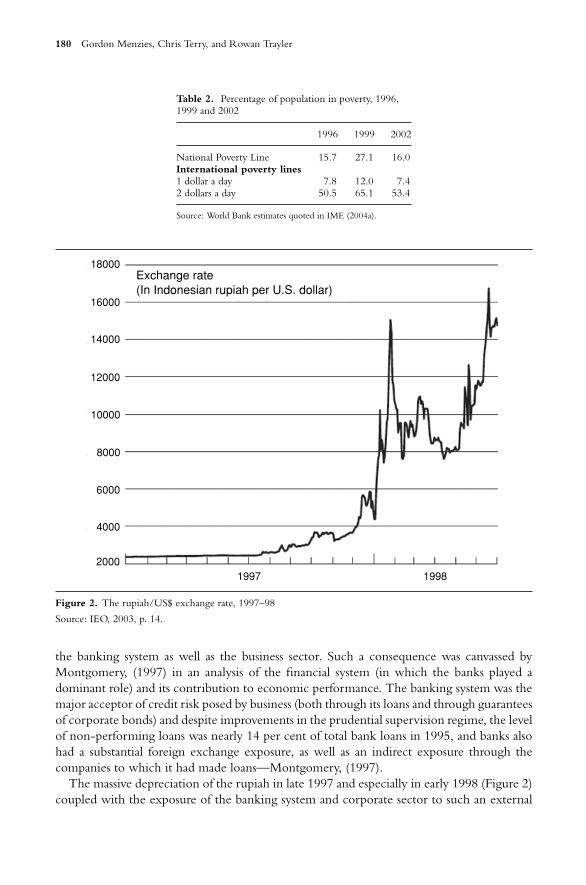
180 Gordon Menzies, Chris Terry, and Rowan Trayler
Table 2. Percentage of population in poverty, 1996,1999 and 2002
1996 1999 2002
National Poverty Line 15.7 27.1 16.0International poverty lines1 dollar a day 7.8 12.0 7.42 dollars a day 50.5 65.1 53.4
Source: World Bank estimates quoted in IMF, (2004a).
20001997 1998
4000
6000
8000
10000
12000
14000
16000
18000Exchange rate(In Indonesian rupiah per U.S. dollar)
Figure 2. The rupiah/US$ exchange rate, 1997–98
Source: IEO, 2003, p. 14.
the banking system as well as the business sector. Such a consequence was canvassed byMontgomery, (1997) in an analysis of the financial system (in which the banks played adominant role) and its contribution to economic performance. The banking system was themajor acceptor of credit risk posed by business (both through its loans and through guaranteesof corporate bonds) and despite improvements in the prudential supervision regime, the levelof non-performing loans was nearly 14 per cent of total bank loans in 1995, and banks alsohad a substantial foreign exchange exposure, as well as an indirect exposure through thecompanies to which it had made loans—Montgomery, (1997).
The massive depreciation of the rupiah in late 1997 and especially in early 1998 (Figure 2)coupled with the exposure of the banking system and corporate sector to such an external
12. Waiting for capital 181
shock propelled the economy into recession. While some banks suffered runs, the paymentsystem ultimately survived due to the government eventually agreeing to extend a blanketguarantee of deposits.
Indonesia sought the support of international agencies, such as the IMF and the WorldBank and this was provided in the form of funding together with agreed programs of reformand policies that intend to help redress the underlining problems. These undertakings wereset out in letters of intent (LOI) by the government of Indonesia, having regard to priornegotiations with the IMF about its conditions.
Prior to mid 1997 the value of the rupiah was set by Bank Indonesia (the central bank)on a crawling peg basis. In July 1997 the Bank responded to speculative pressure on therupiah motivated by the depreciation of the Thai baht, by tightening monetary policy andsupporting the currency in the foreign exchange market (by selling some of its holdings offoreign exchange reserves). In August 1997 it decided to float the rupiah (having regard toIMF advice) and substantially increased the interest rate on its one-month certificates (from11.625% to 30%) and in September the government tightened fiscal policy (by deferringexpenditure on large infrastructure projects). Over this period the rupiah depreciated frombeing worth around 2,000 rupiah equal to one US dollar to around 3,000 rupiah to one USdollar. This was a serious depreciation of the currency, but in hindsight it was dwarfed bythe eventual 80 per cent decline (Figure 2).
In September 1997 the Indonesian government approached the IMF about their cur-rency concerns to establish “precautionary” funding (that is, funding that is not intendedto be drawn down, but could be) as a response to their concerns. The IMF suggested anumber of policies the government could adopt that would help to restore confidence inthe rupiah. However, by October the government, concerned by the depreciating currency,sought a three-year “Stand-By-Arrangement” with the IMF to replace the precautionaryarrangement. This was concluded in early November 1997 for SDR7.34 billion (equivalentto $US10 billion) with $US6 billion to be drawn down by March 1998.
The amount of the funding was based on an assessment of the scale of Indonesia’s balanceof payments problem, part of which could be estimated (this being a proportion of foreignshort-term funding that would not be rolled over given the currency’s depreciation), as wellas funding available to Indonesia from other external sources (such as the World Bank andthe Asian Development Bank). In broad terms, the main determinant of the amount andtiming of financial support was confidence, of both foreign and domestic investors, sincetheir decisions largely determined the extent of the net capital outflow.
The financial (or capital) account balance swung from a surplus to a deficit after 1997,due to “large-scale capital flight by domestic residents”—IEO, (2003, Annexure 1). Capitalinflows fell dramatically, contributing to the crisis (Figure 3).
Under the November 1997 arrangement, Indonesia was required to maintain its tightmonetary and fiscal policies, close and liquidate 16 problem banks (another 34 were subjectto Bank Indonesia’s rehabilitation program) and implement a number of structural reformsthat would improve efficiency and transparency. The purpose of the arrangement was toprovide the capacity for the government to restore confidence in the currency, which wasperceived at the time to be the essential problem. Initially the measures seemed to be effectiveas the rupiah stabilised at around 3,500 rupiah to one US dollar, but confidence in thearrangement was eroded when the Indonesian President decided not to comply with the
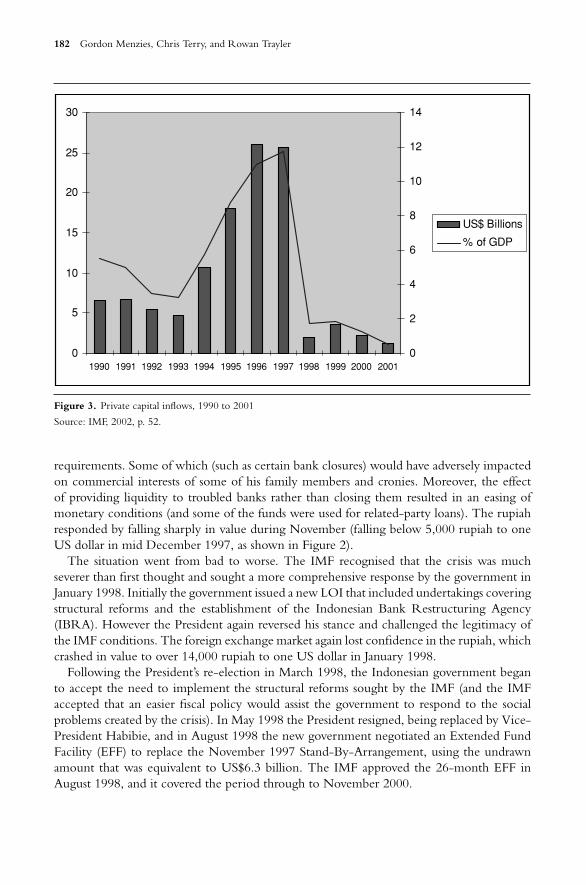
182 Gordon Menzies, Chris Terry, and Rowan Trayler
0
5
10
15
20
25
30
1990 1991 1992 1993 1994 1995 1996 1997 1998 1999 2000 20010
2
4
6
8
10
12
14
US$ Billions
% of GDP
Figure 3. Private capital inflows, 1990 to 2001
Source: IMF, 2002, p. 52.
requirements. Some of which (such as certain bank closures) would have adversely impactedon commercial interests of some of his family members and cronies. Moreover, the effectof providing liquidity to troubled banks rather than closing them resulted in an easing ofmonetary conditions (and some of the funds were used for related-party loans). The rupiahresponded by falling sharply in value during November (falling below 5,000 rupiah to oneUS dollar in mid December 1997, as shown in Figure 2).
The situation went from bad to worse. The IMF recognised that the crisis was muchseverer than first thought and sought a more comprehensive response by the government inJanuary 1998. Initially the government issued a new LOI that included undertakings coveringstructural reforms and the establishment of the Indonesian Bank Restructuring Agency(IBRA). However the President again reversed his stance and challenged the legitimacy ofthe IMF conditions. The foreign exchange market again lost confidence in the rupiah, whichcrashed in value to over 14,000 rupiah to one US dollar in January 1998.
Following the President’s re-election in March 1998, the Indonesian government beganto accept the need to implement the structural reforms sought by the IMF (and the IMFaccepted that an easier fiscal policy would assist the government to respond to the socialproblems created by the crisis). In May 1998 the President resigned, being replaced by Vice-President Habibie, and in August 1998 the new government negotiated an Extended FundFacility (EFF) to replace the November 1997 Stand-By-Arrangement, using the undrawnamount that was equivalent to US$6.3 billion. The IMF approved the 26-month EFF inAugust 1998, and it covered the period through to November 2000.
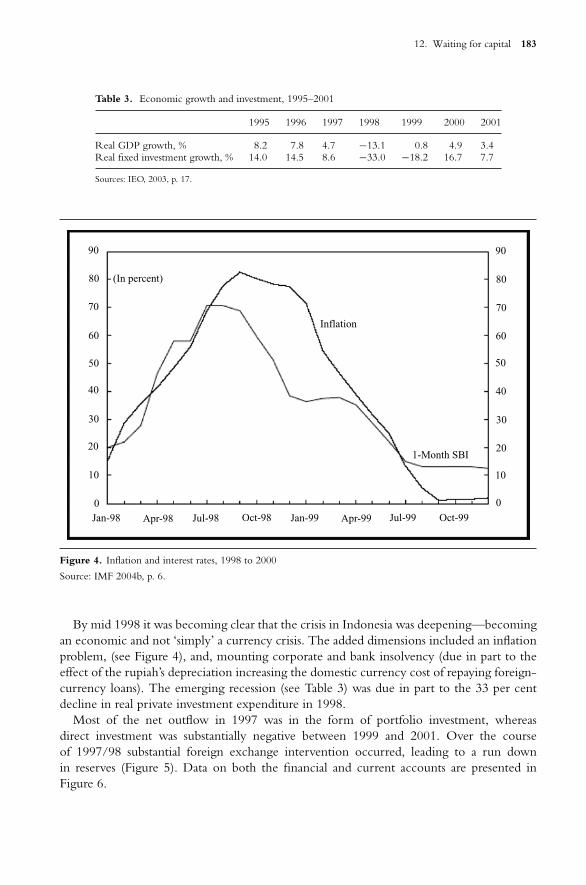
12. Waiting for capital 183
Table 3. Economic growth and investment, 1995–2001
1995 1996 1997 1998 1999 2000 2001
Real GDP growth, % 8.2 7.8 4.7 −13.1 0.8 4.9 3.4Real fixed investment growth, % 14.0 14.5 8.6 −33.0 −18.2 16.7 7.7
Sources: IEO, 2003, p. 17.
70
60
50
40
30
20
10
0Jan-98 Apr-98 Jul-98 Oct-98 Jan-99 Apr-99 Jul-99 Oct-99
0
10
20
30
40
50
60
70
80
90
80
90
(In percent)
Inflation
1-Month SBI
Figure 4. Inflation and interest rates, 1998 to 2000
Source: IMF 2004b, p. 6.
By mid 1998 it was becoming clear that the crisis in Indonesia was deepening—becomingan economic and not ‘simply’ a currency crisis. The added dimensions included an inflationproblem, (see Figure 4), and, mounting corporate and bank insolvency (due in part to theeffect of the rupiah’s depreciation increasing the domestic currency cost of repaying foreign-currency loans). The emerging recession (see Table 3) was due in part to the 33 per centdecline in real private investment expenditure in 1998.
Most of the net outflow in 1997 was in the form of portfolio investment, whereasdirect investment was substantially negative between 1999 and 2001. Over the courseof 1997/98 substantial foreign exchange intervention occurred, leading to a run downin reserves (Figure 5). Data on both the financial and current accounts are presented inFigure 6.
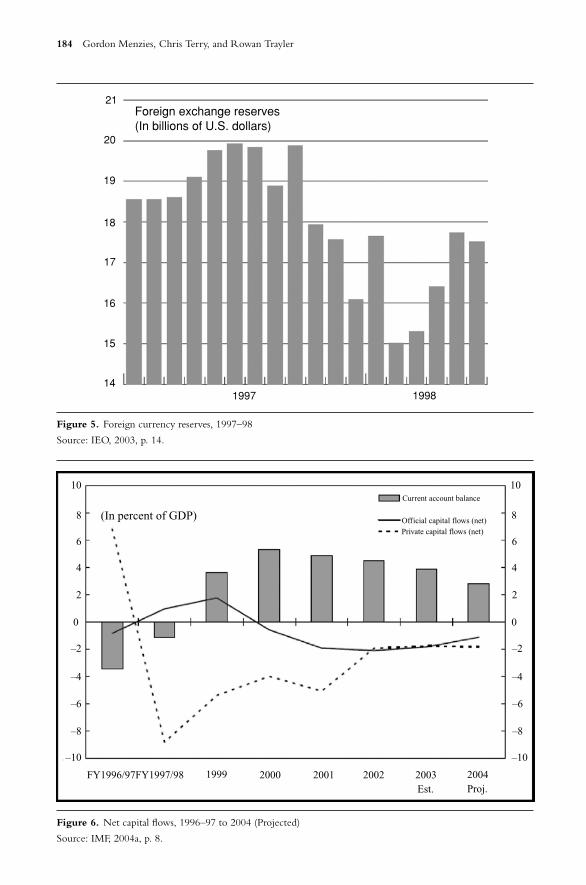
184 Gordon Menzies, Chris Terry, and Rowan Trayler
141997
15
16
17
18
20
21Foreign exchange reserves(In billions of U.S. dollars)
19
1998
Figure 5. Foreign currency reserves, 1997–98
Source: IEO, 2003, p. 14.
FY1996/97FY1997/98 1999 2000 2001 2002 2003 2004Est. Proj.
–10
–8
–6
–4
–2
00
2
4
6
8
10
–10
–8
–6
–4
–2
2
4
6
8
10
(In percent of GDP)
Current account balance
Official capital flows (net)
Private capital flows (net)
Figure 6. Net capital flows, 1996–97 to 2004 (Projected)
Source: IMF, 2004a, p. 8.
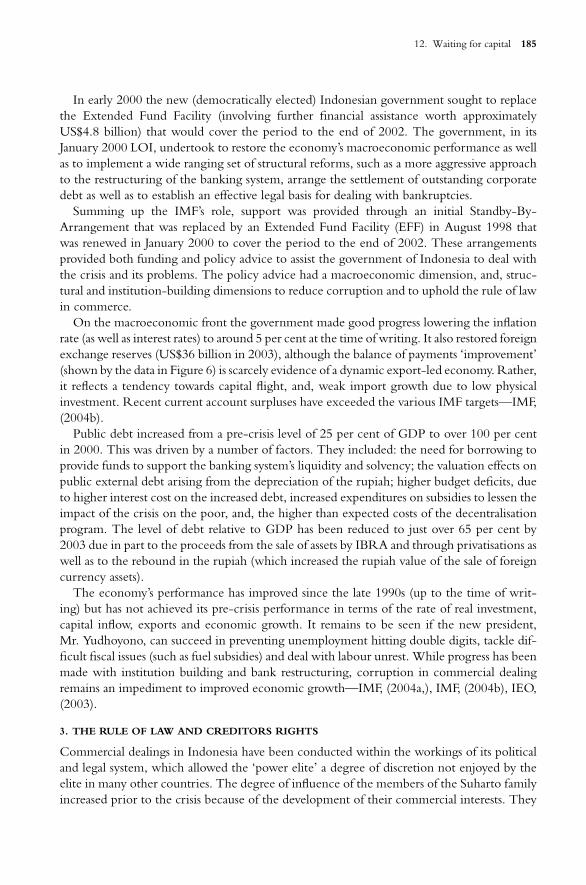
12. Waiting for capital 185
In early 2000 the new (democratically elected) Indonesian government sought to replacethe Extended Fund Facility (involving further financial assistance worth approximatelyUS$4.8 billion) that would cover the period to the end of 2002. The government, in itsJanuary 2000 LOI, undertook to restore the economy’s macroeconomic performance as wellas to implement a wide ranging set of structural reforms, such as a more aggressive approachto the restructuring of the banking system, arrange the settlement of outstanding corporatedebt as well as to establish an effective legal basis for dealing with bankruptcies.
Summing up the IMF’s role, support was provided through an initial Standby-By-Arrangement that was replaced by an Extended Fund Facility (EFF) in August 1998 thatwas renewed in January 2000 to cover the period to the end of 2002. These arrangementsprovided both funding and policy advice to assist the government of Indonesia to deal withthe crisis and its problems. The policy advice had a macroeconomic dimension, and, struc-tural and institution-building dimensions to reduce corruption and to uphold the rule of lawin commerce.
On the macroeconomic front the government made good progress lowering the inflationrate (as well as interest rates) to around 5 per cent at the time of writing. It also restored foreignexchange reserves (US$36 billion in 2003), although the balance of payments ‘improvement’(shown by the data in Figure 6) is scarcely evidence of a dynamic export-led economy. Rather,it reflects a tendency towards capital flight, and, weak import growth due to low physicalinvestment. Recent current account surpluses have exceeded the various IMF targets—IMF,(2004b).
Public debt increased from a pre-crisis level of 25 per cent of GDP to over 100 per centin 2000. This was driven by a number of factors. They included: the need for borrowing toprovide funds to support the banking system’s liquidity and solvency; the valuation effects onpublic external debt arising from the depreciation of the rupiah; higher budget deficits, dueto higher interest cost on the increased debt, increased expenditures on subsidies to lessen theimpact of the crisis on the poor, and, the higher than expected costs of the decentralisationprogram. The level of debt relative to GDP has been reduced to just over 65 per cent by2003 due in part to the proceeds from the sale of assets by IBRA and through privatisations aswell as to the rebound in the rupiah (which increased the rupiah value of the sale of foreigncurrency assets).
The economy’s performance has improved since the late 1990s (up to the time of writ-ing) but has not achieved its pre-crisis performance in terms of the rate of real investment,capital inflow, exports and economic growth. It remains to be seen if the new president,Mr. Yudhoyono, can succeed in preventing unemployment hitting double digits, tackle dif-ficult fiscal issues (such as fuel subsidies) and deal with labour unrest. While progress has beenmade with institution building and bank restructuring, corruption in commercial dealingremains an impediment to improved economic growth—IMF, (2004a,), IMF, (2004b), IEO,(2003).
3. THE RULE OF LAW AND CREDITORS RIGHTS
Commercial dealings in Indonesia have been conducted within the workings of its politicaland legal system, which allowed the ‘power elite’ a degree of discretion not enjoyed by theelite in many other countries. The degree of influence of the members of the Suharto familyincreased prior to the crisis because of the development of their commercial interests. They
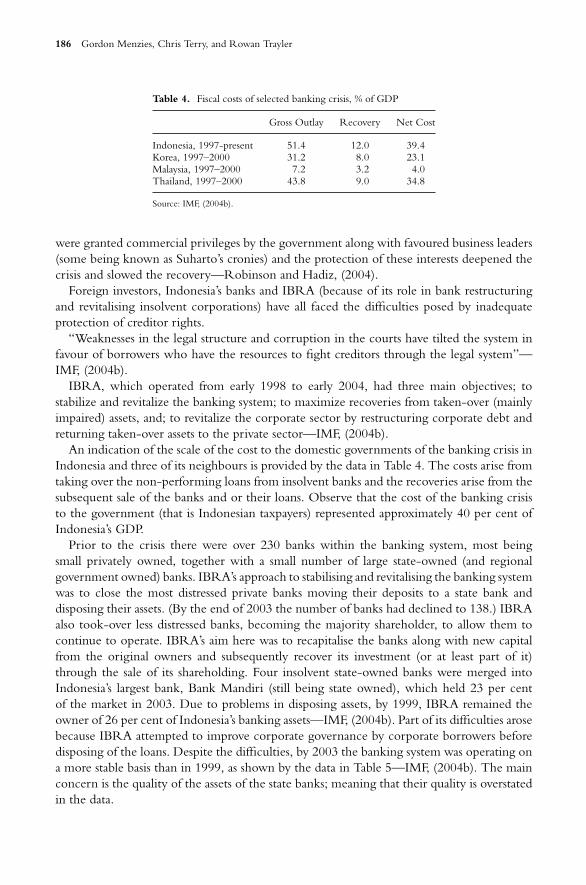
186 Gordon Menzies, Chris Terry, and Rowan Trayler
Table 4. Fiscal costs of selected banking crisis, % of GDP
Gross Outlay Recovery Net Cost
Indonesia, 1997-present 51.4 12.0 39.4Korea, 1997–2000 31.2 8.0 23.1Malaysia, 1997–2000 7.2 3.2 4.0Thailand, 1997–2000 43.8 9.0 34.8
Source: IMF, (2004b).
were granted commercial privileges by the government along with favoured business leaders(some being known as Suharto’s cronies) and the protection of these interests deepened thecrisis and slowed the recovery—Robinson and Hadiz, (2004).
Foreign investors, Indonesia’s banks and IBRA (because of its role in bank restructuringand revitalising insolvent corporations) have all faced the difficulties posed by inadequateprotection of creditor rights.
“Weaknesses in the legal structure and corruption in the courts have tilted the system infavour of borrowers who have the resources to fight creditors through the legal system”—IMF, (2004b).
IBRA, which operated from early 1998 to early 2004, had three main objectives; tostabilize and revitalize the banking system; to maximize recoveries from taken-over (mainlyimpaired) assets, and; to revitalize the corporate sector by restructuring corporate debt andreturning taken-over assets to the private sector—IMF, (2004b).
An indication of the scale of the cost to the domestic governments of the banking crisis inIndonesia and three of its neighbours is provided by the data in Table 4. The costs arise fromtaking over the non-performing loans from insolvent banks and the recoveries arise from thesubsequent sale of the banks and or their loans. Observe that the cost of the banking crisisto the government (that is Indonesian taxpayers) represented approximately 40 per cent ofIndonesia’s GDP.
Prior to the crisis there were over 230 banks within the banking system, most beingsmall privately owned, together with a small number of large state-owned (and regionalgovernment owned) banks. IBRA’s approach to stabilising and revitalising the banking systemwas to close the most distressed private banks moving their deposits to a state bank anddisposing their assets. (By the end of 2003 the number of banks had declined to 138.) IBRAalso took-over less distressed banks, becoming the majority shareholder, to allow them tocontinue to operate. IBRA’s aim here was to recapitalise the banks along with new capitalfrom the original owners and subsequently recover its investment (or at least part of it)through the sale of its shareholding. Four insolvent state-owned banks were merged intoIndonesia’s largest bank, Bank Mandiri (still being state owned), which held 23 per centof the market in 2003. Due to problems in disposing assets, by 1999, IBRA remained theowner of 26 per cent of Indonesia’s banking assets—IMF, (2004b). Part of its difficulties arosebecause IBRA attempted to improve corporate governance by corporate borrowers beforedisposing of the loans. Despite the difficulties, by 2003 the banking system was operating ona more stable basis than in 1999, as shown by the data in Table 5—IMF, (2004b). The mainconcern is the quality of the assets of the state banks; meaning that their quality is overstatedin the data.
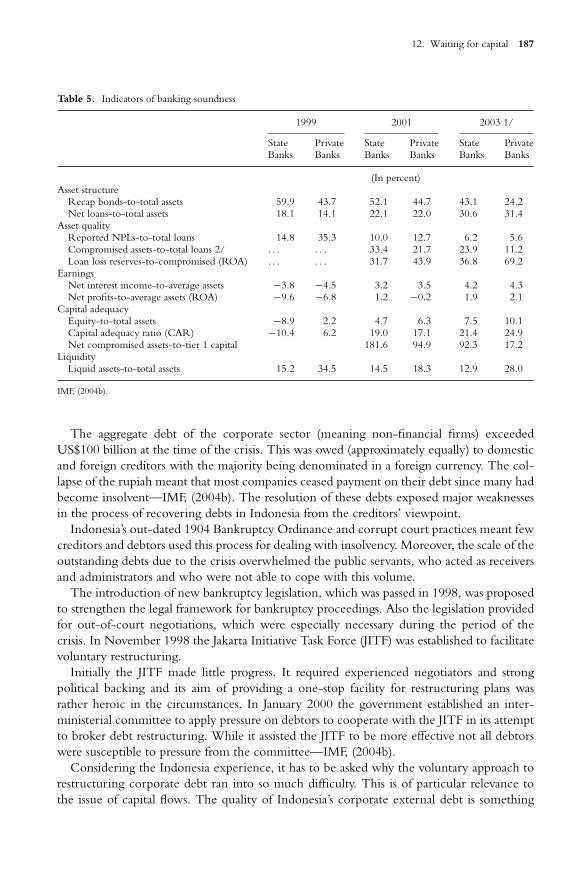
12. Waiting for capital 187
Table 5. Indicators of banking soundness
1999 2001 2003 1/
State Private State Private State PrivateBanks Banks Banks Banks Banks Banks
(In percent)Asset structure
Recap bonds-to-total assets 59.9 43.7 52.1 44.7 43.1 24.2Net loans-to-total assets 18.1 14.1 22.1 22.0 30.6 31.4
Asset qualityReported NPLs-to-total loans 14.8 35.3 10.0 12.7 6.2 5.6Compromised assets-to-total loans 2/ . . . . . . 33.4 21.7 23.9 11.2Loan loss reserves-to-compromised (ROA) . . . . . . 31.7 43.9 36.8 69.2
EarningsNet interest income-to-average assets −3.8 −4.5 3.2 3.5 4.2 4.3Net profits-to-average assets (ROA) −9.6 −6.8 1.2 −0.2 1.9 2.1
Capital adequacyEquity-to-total assets −8.9 2.2 4.7 6.3 7.5 10.1Capital adequacy ratio (CAR) −10.4 6.2 19.0 17.1 21.4 24.9Net compromised assets-to-tier 1 capital 181.6 94.9 92.3 17.2
LiquidityLiquid assets-to-total assets 15.2 34.5 14.5 18.3 12.9 28.0
IMF, (2004b).
The aggregate debt of the corporate sector (meaning non-financial firms) exceededUS$100 billion at the time of the crisis. This was owed (approximately equally) to domesticand foreign creditors with the majority being denominated in a foreign currency. The col-lapse of the rupiah meant that most companies ceased payment on their debt since many hadbecome insolvent—IMF, (2004b). The resolution of these debts exposed major weaknessesin the process of recovering debts in Indonesia from the creditors’ viewpoint.
Indonesia’s out-dated 1904 Bankruptcy Ordinance and corrupt court practices meant fewcreditors and debtors used this process for dealing with insolvency. Moreover, the scale of theoutstanding debts due to the crisis overwhelmed the public servants, who acted as receiversand administrators and who were not able to cope with this volume.
The introduction of new bankruptcy legislation, which was passed in 1998, was proposedto strengthen the legal framework for bankruptcy proceedings. Also the legislation providedfor out-of-court negotiations, which were especially necessary during the period of thecrisis. In November 1998 the Jakarta Initiative Task Force (JITF) was established to facilitatevoluntary restructuring.
Initially the JITF made little progress. It required experienced negotiators and strongpolitical backing and its aim of providing a one-stop facility for restructuring plans wasrather heroic in the circumstances. In January 2000 the government established an inter-ministerial committee to apply pressure on debtors to cooperate with the JITF in its attemptto broker debt restructuring. While it assisted the JITF to be more effective not all debtorswere susceptible to pressure from the committee—IMF, (2004b).
Considering the Indonesia experience, it has to be asked why the voluntary approach torestructuring corporate debt ran into so much difficulty. This is of particular relevance tothe issue of capital flows. The quality of Indonesia’s corporate external debt is something
188 Gordon Menzies, Chris Terry, and Rowan Trayler
of an ‘advertisement’ for Indonesia’s potential investors, with the problems of the day it isnot surprising that there was an exit of capital. In mid-2002, the IMF estimated that overhalf of the estimated $US55 billion of corporate external debt was distressed. To understandthe difficulties faced by a voluntary approach, it is useful to review the so-called LondonApproach, which the Jakarta Initiative sought to emulate.
The London approach to corporate restructuring is a set of conventions developed inthe United Kingdom over the last three decades of the 20th Century. From the mid-1970sto mid-1980s, the Bank of England involved itself directly with corporate workouts. Overtime, it divested itself of the formal powers to do so, preferring instead to adopt the role of‘honest broker’ in situations of corporate distress. The so called “London Rules” involve anapproach to crisis management, and a long term reform agenda. The two guiding principalsof the London Approach are:
Creditors had to be prepared to seek a non-judicial solution and support an independent review of thecompany’s viability. While the review was in process a creditor standstill was in force, and the companiescontinued to trade normally. The Bank of England acted as a facilitator of this crucial first stage.
Depending upon the result of the review above; the principal creditors formed a joint view about thelong-term viability of the company. If viable, new money was provided on an agreed basis from all thecreditors (often a pro-rate arrangement) and measures such as interest holidays, extension of maturities,or debt-equity swaps were also considered. These measures were conditioned on a long term businessplan which may have involved management changes, sales of assets or divisions, or even the takeoverof the company.
The application of the London Approach to Indonesia has been made difficult by thelarge number of creditors involved in loan packages, the lack of an ‘honest broker’ with thestature of the Bank of England, the weaknesses in the legal framework, and the corruptionor theft of original loan documents—Meyerman, (2000). Anecdotal evidence obtained bythe one of the authors from an IBRA officer confirms this practice. They indicated it wassometimes possible to pay a ‘fee’ to a bank employee to tamper with loan documents, reducingthe amount or other loan conditions. Most fundamentally, however, the London approachrelies on voluntary agreement, and, as we outlined in the introduction, debtors have manyreasons to stall deals. We now return to this issue, examining the potential reasons in somedetail.
3.1. To Stall or not to Stall
Two factors have acted together to make it possible for debtors to delay negotiated agreementsin Indonesia. First, the foregoing discussion implies that the crisis was of such a magnitudethat the ill-prepared governmental, financial and legal entities were simply overwhelmed. Ina chaotic environment, strategic default became possible. Second, if the debtors were thefavoured business leaders—the Cronies—they were afforded a protection that allowed themto ignore the legitimate demands of creditors—Robinson and Hadiz, (2004).
However, it is one thing to say that delay was possible; it is another to say that it was in thedebtors’ interests. There were a number of scenarios where debtor delay seemed optimal.
There were opportunities for theft of assets that required owners to remain in controlof their business. For example, if the owners of a business or bank faced few ‘self-denying
12. Waiting for capital 189
ordinances’ within their business, and had a free financial hand, they could engage in asset-stripping. Perhaps as a result of this, some debtors were concerned that IBRA would sellloans on a basis that would allow them to be swapped for equity, loosening the control ofthe owners.
The changing macroeconomic environment (meaning variables such as interest rates andthe value of the rupiah) complicated the process of valuing loan contracts and provided amotive for strategic non-cooperation by debtors. For example, consider a corporate debtorthat held unhedged $US liabilities. They may have been reluctant to wind the business up atan unfavourable exchange rate. Drawing out negotiations with the creditors had an optionvalue for them. Seen from their perspective, if the exchange rate appreciated subsequently,they could then have wound up the business at a favourable exchange rate, or, used theircontrol of the company to expatriate funds in an illegitimate manner. Either way, there isan option value of waiting. The expected value of the currency change does not have to bepositive for there to be an option value of waiting. All that is required is that the debtor canput off valuing the assets should the exchange rate go against them (i.e. depreciate).
Companies that were likely to be sold also had some incentives to draw out the process.Consider the owner of an enterprise that was under the control of a bank asset restructuringagency, such as the former Indonesian Bank Restructuring Agency (IBRA). It may havebeen that delays in payment, or legal misadventures, signalled to foreign purchasers that theenterprise was risky, thereby reducing demand by foreigners. Further suppose that when itcame time for the agency to sell, the owner had a domestic associate waiting in the wings tobuy the enterprise. It was not unheard of for the original owners of banks to attempt to buythem back at fire-sale prices from IBRA. The Economist, (2003a) reports a case in whichBank Central Asia (BCA) was allegedly sold to its original owners, beating a bid from theUK bank, Standard Chartered. The report also sites rumours of originalowner of two otherbanks, Bank Lippo and Bank Internasional Indonesia biding to buy their banks.
More generally, any financial misappropriation allows the guilty party to gain the use ofthe funds until they are called to account by the legal system. If the legal system is corruptible,then the guilty party may succeed in delaying proceedings by illegal means.
The case of Tri Polyta seems to have proceeded along these lines. One of the originalowners of the petrochemical company was former President Suharto’s son, Bambang. Fouryears ago, the firm stopped paying interest on $US185 million worth of bonds. More recently,a consortium of creditors had filed a bankruptcy suit seeking to foreclose on the assets, amidallegations that Tri Polyta could pay its creditors. The consortium of creditors receivedsupport from a US Federal Court, which ordered that interest and principal be repaid.However, an Indonesian District Court refused to uphold the US decision—Jakarta Post,(2003).
The Tri Polyta case for Indonesia is that devoting resources towards voluntary agreementinitiatives, such as the Jakarta Initiative Task Force, may have no effect if vested interests aregaining from the continuance of strategic default.
4. CONCLUSION
The 1998 bankruptcy legislation established a new Commercial Court to deal withbankruptcy cases in a transparent way and provided for the appointment of ad hoc judgeswith expertise in bankruptcy matters. The transparency was to be achieved by publishing the
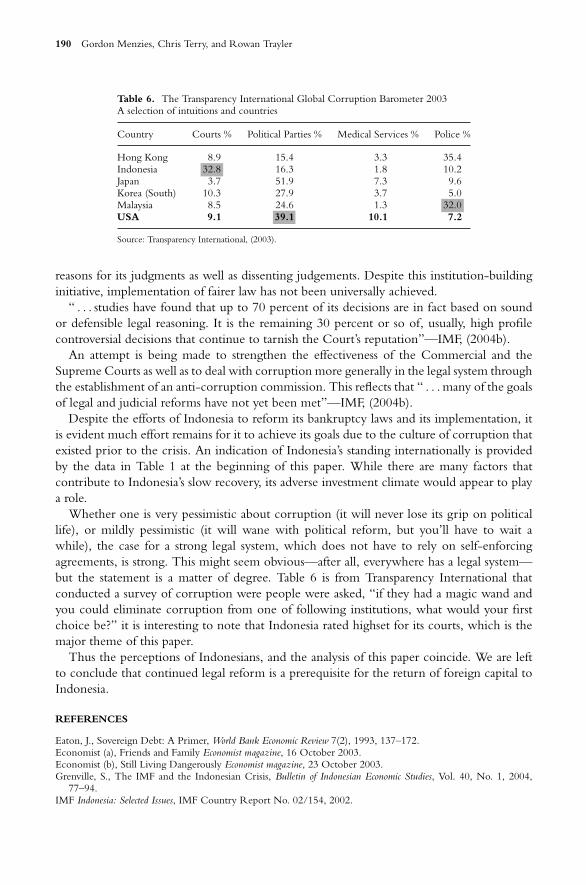
190 Gordon Menzies, Chris Terry, and Rowan Trayler
Table 6. The Transparency International Global Corruption Barometer 2003A selection of intuitions and countries
Country Courts % Political Parties % Medical Services % Police %
Hong Kong 8.9 15.4 3.3 35.4Indonesia 32.8 16.3 1.8 10.2Japan 3.7 51.9 7.3 9.6Korea (South) 10.3 27.9 3.7 5.0Malaysia 8.5 24.6 1.3 32.0USA 9.1 39.1 10.1 7.2
Source: Transparency International, (2003).
reasons for its judgments as well as dissenting judgements. Despite this institution-buildinginitiative, implementation of fairer law has not been universally achieved.
“ . . . studies have found that up to 70 percent of its decisions are in fact based on soundor defensible legal reasoning. It is the remaining 30 percent or so of, usually, high profilecontroversial decisions that continue to tarnish the Court’s reputation”—IMF, (2004b).
An attempt is being made to strengthen the effectiveness of the Commercial and theSupreme Courts as well as to deal with corruption more generally in the legal system throughthe establishment of an anti-corruption commission. This reflects that “ . . . many of the goalsof legal and judicial reforms have not yet been met”—IMF, (2004b).
Despite the efforts of Indonesia to reform its bankruptcy laws and its implementation, itis evident much effort remains for it to achieve its goals due to the culture of corruption thatexisted prior to the crisis. An indication of Indonesia’s standing internationally is providedby the data in Table 1 at the beginning of this paper. While there are many factors thatcontribute to Indonesia’s slow recovery, its adverse investment climate would appear to playa role.
Whether one is very pessimistic about corruption (it will never lose its grip on politicallife), or mildly pessimistic (it will wane with political reform, but you’ll have to wait awhile), the case for a strong legal system, which does not have to rely on self-enforcingagreements, is strong. This might seem obvious—after all, everywhere has a legal system—but the statement is a matter of degree. Table 6 is from Transparency International thatconducted a survey of corruption were people were asked, “if they had a magic wand andyou could eliminate corruption from one of following institutions, what would your firstchoice be?” it is interesting to note that Indonesia rated highset for its courts, which is themajor theme of this paper.
Thus the perceptions of Indonesians, and the analysis of this paper coincide. We are leftto conclude that continued legal reform is a prerequisite for the return of foreign capital toIndonesia.
REFERENCES
Eaton, J., Sovereign Debt: A Primer, World Bank Economic Review 7(2), 1993, 137–172.Economist (a), Friends and Family Economist magazine, 16 October 2003.Economist (b), Still Living Dangerously Economist magazine, 23 October 2003.Grenville, S., The IMF and the Indonesian Crisis, Bulletin of Indonesian Economic Studies, Vol. 40, No. 1, 2004,
77–94.IMF Indonesia: Selected Issues, IMF Country Report No. 02/154, 2002.
12. Waiting for capital 191
IMF (a), Staff Report, Indonesia 2004 Article IV Consultation and Post-program monitoring discussion, IMF CountryReport 04/188, 2004.
IMF (b), Indonesia: Selected Issues, IMF Country Report No. 04/189, 2004.Independent Evaluation Office (IEO), The IMF and Recent Capital Account Crises: Indonesia, Korea and Brazil, IMF,
2003.Jakarta Post, JSX Delists Tri Polyta, Gives Kopitime 3 Months Grace, Jakarta Post, 8 July 2003.Krugman, P., The Myth of Asia’s Miracle, Foreign Affairs, Vol. 73, November–December 1994, 72–78.Lovitt, J., Galtung, F., Transparency International releases first TI Global Corruption Barometer survey, developed
with Gallup International, Transparency International Global Corruption Barometer, 3 July 2003, 1–6.Meyerman, G., The London Approach and Corporate Restructuring in East Asia, Managing Financial and Corporate
Distress: Lessons from Asia, eds. Adams, Charles, Litan, Robert E., and Pomerleano, Michael, Brookings InstitutionPress, Washington D.C., 2000, 299–324.
Montgomery, J., The Indonesian Financial System: Its Contribution to Economic Performance, and key PolicyIssues, IMF Working Paper, WP/97/45, 1997.
Reserve Bank of Australia, Asian Capital Flows, Bulletin, August 2004, 56–61.Robinson, Richard and Verdi R. Hadiz, Reorganising Power in Indonesia, RoutledgeCurzon, London, 2004.Sarel, M., Growth and Productivity in ASEAN Countries, IMF Working Paper, WP/97/97, 1997.Transparency International: HTTP://WWW.transparency.orgYoung, A., Tyranny of Numbers: Confronting the Statistical Realities of the East Asian Growth Experience, Quarterly
Journal of Economics, Vol. 110, August 1995, 641–80.
13. CREDIT RATINGS IN CHINA
WINNIE P. H. POON
1. INTRODUCTION
The total amount of outstanding corporate bonds in China is relatively low in compari-son to other major Asian financial markets. According to PR Newswire (2003), the totaloutstanding amount in China was RMB1133 billion (about US$16 billion) in 2002, whichrepresents about 1.3% of the country’s GDP compared to at least 10% of the respective GDPin other Asian markets. Although the corporate bond market in China is very underdevel-oped, its potential for growth is substantial because the market demand for bond investmentis increasing. The considerable growth potentials of the market and surging trends in cor-porate bonds are substantiated by the research findings from the Shenzhen Stock Exchange,China as in February 2003 (PR Newswire, 2003). The findings of this research report byShenzhen Stock Exchange indicate that, the demand from institutional investors could go upto RMB94 billion (over US$11 billion). On the supply side, corporations would considerraising RMB140 to 279 billion (about US$19.9 to 33.7 billion) from the bond market.
In addition, Thomson Financial believes that China is a potentially lucrative market withvast unfilled funding needs (Lunsford, 2004). Until January 2004, the international ratingagencies have rated fewer than 100 Chinese firms when there are more than eight millioncorporations and over 100 banks desiring capital with which to expand (Baglole, 2004;and Lunsford, 2004). If the Chinese regulatory authorities allow foreign credit agenciesto rate their domestic bonds and open up the rating industry for more competition, thenthe opportunity for credit rating business will be huge. At present, Chinese bonds thatare offered only to the domestic market do not require international credit ratings, unlessthey intend to raise capital from international capital markets or to cross-list on a foreign
194 Winnie P. H. Poon
stock exchange. For example, China Petroleum & Chemical Corp. and Huaneng PowerInternational Inc., which are listed on the New York Stock Exchange, have requested creditratings from Standard and Poor’s Ratings Services (one of the four “Nationally RecognizedStatistical Ratings Organizations” (NRSROs) in the U.S.). Moreover, none of the foreigncredit ratings are officially recognized by the regulatory bodies in China.
The World Bank has recommended that China develop a sophisticated bond market tomake use of its large amount of private funds and reduce its dependence on infrastructureprojects in the State budget (China Daily, 1998b). Rating agencies perform an importantrole in the development of bond markets. One of the major problems that has hindered thegrowth of the Chinese bond market is the absence of “authentic” issuer ratings on bonds(China Daily, 1998a). There seems to be a general consensus among Chinese practitionersabout the growing need for “authentic” credit ratings for issuers in China’s rating industry(China Daily, 1998b).
Kennedy (2003) believes that the domestic credit rating agencies in China have not hadany effect on the decisions of investors of Chinese corporate bonds, and he attributes thatto Chinese government control of the corporate bond market. Investors do not seem topay attention to their ratings, and even an AAA rating is of little value to some speculators(Kennedy, 2003). Some investors may ask whether or not a bond issue is guaranteed by thegovernment or not, but are not concerned about its credit rating. If most investors fail to takecredit ratings seriously, the development of the rating industry will be slow or even impeded(China Daily, 1998b).
The main purpose of this paper to present an in-depth study of the credit ratings in Chinabecause they are very crucial to the potentially lucrative, but underdeveloped, Chinese bondmarket. Section 2 provides the regulatory framework for the bond market and the creditrating industry in China. Their recent developments are reviewed in Section 3. Section 4describes the major domestic rating agencies, and Section 5 contrasts the long-term issuerratings that are assigned by local and international rating agencies. The significant issues ofthe credit ratings in China are discussed in Section 6. The conclusions and recommendationsare given in Section 7.
2. REGULATORY FRAMEWORK
The regulatory framework for the bond market and the credit rating industry in China aredescribed in this section. Figure 1, which is based on EIU (2003), provides an overviewof China’s financial system. In addition, Standard and Poor’s (2003) provides a thoroughdiscussion of China’s market infrastructure, legal infrastructure, regulatory framework, andinformational infrastructure in its country governance study of China. The State Councilhas ultimate and overruling authority over all regulatory bodies in the financial sector. TheNational Development and Reform Commission (NDRC), which is supervised by the StateCouncil, is responsible for the research into and overseas implementation of nationwidestrategic planning. Companies that raise capital from domestic or overseas financial marketsmust obtain approval from the NDRC (S&P’s, 2003).
Since 1983, the People’s Bank of China (PBOC), the central bank, has served dual rolesas the regulator of the financial industry, especially the banking regulator, and the managerof monetary policy. The State Council set up the China Banking Regulatory Commission(CBRC) in March 2003 following a decision by the National People’s Congress standing
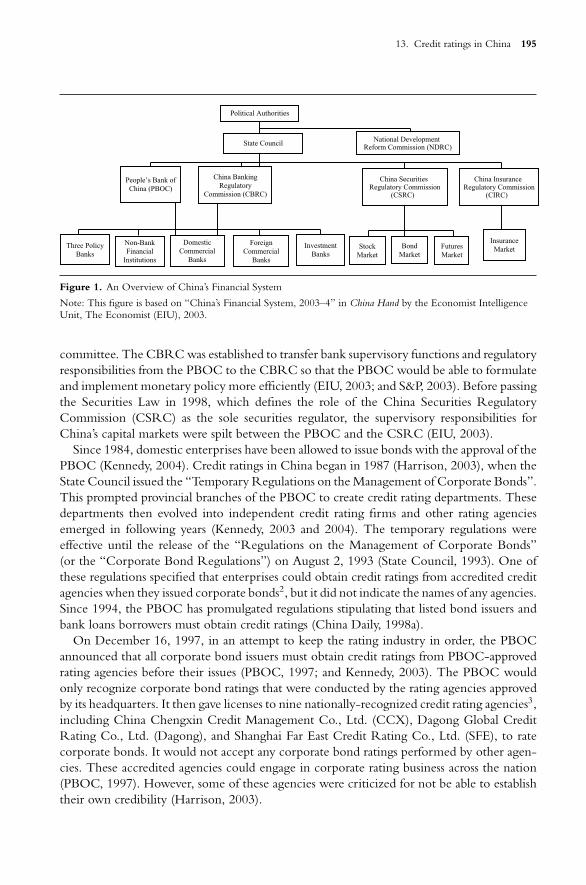
13. Credit ratings in China 195
Non-BankFinancial
Institutions
ForeignCommercial
Banks
InvestmentBanks
Three PolicyBanks
National DevelopmentReform Commission (NDRC)
DomesticCommercial
Banks
Political Authorities
State Council
People’s Bank ofChina (PBOC)
China BankingRegulatory
Commission (CBRC)
China SecuritiesRegulatory Commission
(CSRC)
China InsuranceRegulatory Commission
(CIRC)
StockMarket
BondMarket
InsuranceMarketFutures
Market
Figure 1. An Overview of China’s Financial System
Note: This figure is based on “China’s Financial System, 2003–4” in China Hand by the Economist IntelligenceUnit, The Economist (EIU), 2003.
committee. The CBRC was established to transfer bank supervisory functions and regulatoryresponsibilities from the PBOC to the CBRC so that the PBOC would be able to formulateand implement monetary policy more efficiently (EIU, 2003; and S&P, 2003). Before passingthe Securities Law in 1998, which defines the role of the China Securities RegulatoryCommission (CSRC) as the sole securities regulator, the supervisory responsibilities forChina’s capital markets were spilt between the PBOC and the CSRC (EIU, 2003).
Since 1984, domestic enterprises have been allowed to issue bonds with the approval of thePBOC (Kennedy, 2004). Credit ratings in China began in 1987 (Harrison, 2003), when theState Council issued the “Temporary Regulations on the Management of Corporate Bonds”.This prompted provincial branches of the PBOC to create credit rating departments. Thesedepartments then evolved into independent credit rating firms and other rating agenciesemerged in following years (Kennedy, 2003 and 2004). The temporary regulations wereeffective until the release of the “Regulations on the Management of Corporate Bonds”(or the “Corporate Bond Regulations”) on August 2, 1993 (State Council, 1993). One ofthese regulations specified that enterprises could obtain credit ratings from accredited creditagencies when they issued corporate bonds2, but it did not indicate the names of any agencies.Since 1994, the PBOC has promulgated regulations stipulating that listed bond issuers andbank loans borrowers must obtain credit ratings (China Daily, 1998a).
On December 16, 1997, in an attempt to keep the rating industry in order, the PBOCannounced that all corporate bond issuers must obtain credit ratings from PBOC-approvedrating agencies before their issues (PBOC, 1997; and Kennedy, 2003). The PBOC wouldonly recognize corporate bond ratings that were conducted by the rating agencies approvedby its headquarters. It then gave licenses to nine nationally-recognized credit rating agencies3,including China Chengxin Credit Management Co., Ltd. (CCX), Dagong Global CreditRating Co., Ltd. (Dagong), and Shanghai Far East Credit Rating Co., Ltd. (SFE), to ratecorporate bonds. It would not accept any corporate bond ratings performed by other agen-cies. These accredited agencies could engage in corporate rating business across the nation(PBOC, 1997). However, some of these agencies were criticized for not be able to establishtheir own credibility (Harrison, 2003).
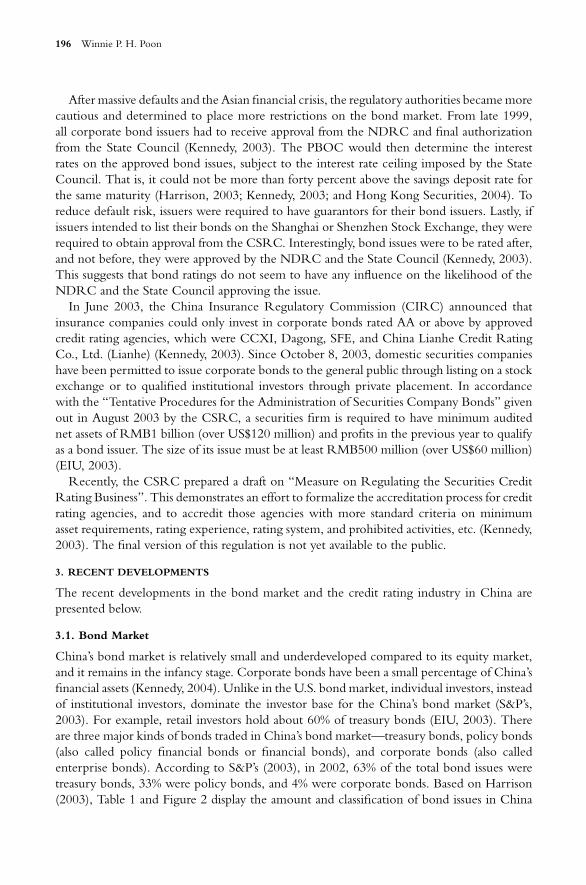
196 Winnie P. H. Poon
After massive defaults and the Asian financial crisis, the regulatory authorities became morecautious and determined to place more restrictions on the bond market. From late 1999,all corporate bond issuers had to receive approval from the NDRC and final authorizationfrom the State Council (Kennedy, 2003). The PBOC would then determine the interestrates on the approved bond issues, subject to the interest rate ceiling imposed by the StateCouncil. That is, it could not be more than forty percent above the savings deposit rate forthe same maturity (Harrison, 2003; Kennedy, 2003; and Hong Kong Securities, 2004). Toreduce default risk, issuers were required to have guarantors for their bond issuers. Lastly, ifissuers intended to list their bonds on the Shanghai or Shenzhen Stock Exchange, they wererequired to obtain approval from the CSRC. Interestingly, bond issues were to be rated after,and not before, they were approved by the NDRC and the State Council (Kennedy, 2003).This suggests that bond ratings do not seem to have any influence on the likelihood of theNDRC and the State Council approving the issue.
In June 2003, the China Insurance Regulatory Commission (CIRC) announced thatinsurance companies could only invest in corporate bonds rated AA or above by approvedcredit rating agencies, which were CCXI, Dagong, SFE, and China Lianhe Credit RatingCo., Ltd. (Lianhe) (Kennedy, 2003). Since October 8, 2003, domestic securities companieshave been permitted to issue corporate bonds to the general public through listing on a stockexchange or to qualified institutional investors through private placement. In accordancewith the “Tentative Procedures for the Administration of Securities Company Bonds” givenout in August 2003 by the CSRC, a securities firm is required to have minimum auditednet assets of RMB1 billion (over US$120 million) and profits in the previous year to qualifyas a bond issuer. The size of its issue must be at least RMB500 million (over US$60 million)(EIU, 2003).
Recently, the CSRC prepared a draft on “Measure on Regulating the Securities CreditRating Business”. This demonstrates an effort to formalize the accreditation process for creditrating agencies, and to accredit those agencies with more standard criteria on minimumasset requirements, rating experience, rating system, and prohibited activities, etc. (Kennedy,2003). The final version of this regulation is not yet available to the public.
3. RECENT DEVELOPMENTS
The recent developments in the bond market and the credit rating industry in China arepresented below.
3.1. Bond Market
China’s bond market is relatively small and underdeveloped compared to its equity market,and it remains in the infancy stage. Corporate bonds have been a small percentage of China’sfinancial assets (Kennedy, 2004). Unlike in the U.S. bond market, individual investors, insteadof institutional investors, dominate the investor base for the China’s bond market (S&P’s,2003). For example, retail investors hold about 60% of treasury bonds (EIU, 2003). Thereare three major kinds of bonds traded in China’s bond market—treasury bonds, policy bonds(also called policy financial bonds or financial bonds), and corporate bonds (also calledenterprise bonds). According to S&P’s (2003), in 2002, 63% of the total bond issues weretreasury bonds, 33% were policy bonds, and 4% were corporate bonds. Based on Harrison(2003), Table 1 and Figure 2 display the amount and classification of bond issues in China
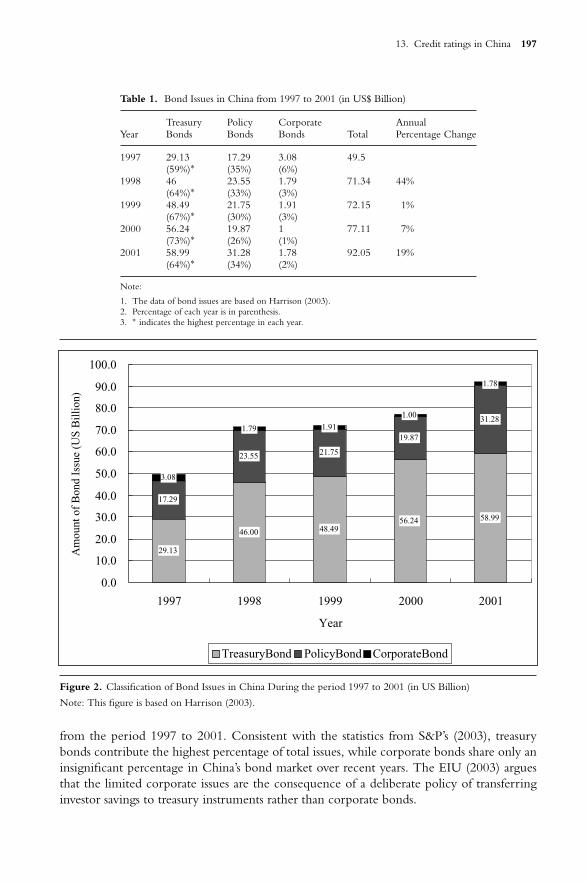
13. Credit ratings in China 197
Table 1. Bond Issues in China from 1997 to 2001 (in US$ Billion)
Treasury Policy Corporate AnnualYear Bonds Bonds Bonds Total Percentage Change
1997 29.13 17.29 3.08 49.5(59%)∗ (35%) (6%)
1998 46 23.55 1.79 71.34 44%(64%)∗ (33%) (3%)
1999 48.49 21.75 1.91 72.15 1%(67%)∗ (30%) (3%)
2000 56.24 19.87 1 77.11 7%(73%)∗ (26%) (1%)
2001 58.99 31.28 1.78 92.05 19%(64%)∗ (34%) (2%)
Note:
1. The data of bond issues are based on Harrison (2003).2. Percentage of each year is in parenthesis.3. ∗ indicates the highest percentage in each year.
29.13
46.00 48.4956.24 58.99
17.29
23.55 21.75
19.87
31.28
3.08
1.79 1.91
1.00
1.78
0.0
10.0
20.0
30.0
40.0
50.0
60.0
70.0
80.0
90.0
100.0
1997 1998 1999 2000 2001
Year
Am
ount
of
Bon
d Is
sue
(US
Bil
lion
)
TreasuryBond PolicyBond CorporateBond
Figure 2. Classification of Bond Issues in China During the period 1997 to 2001 (in US Billion)
Note: This figure is based on Harrison (2003).
from the period 1997 to 2001. Consistent with the statistics from S&P’s (2003), treasurybonds contribute the highest percentage of total issues, while corporate bonds share only aninsignificant percentage in China’s bond market over recent years. The EIU (2003) arguesthat the limited corporate issues are the consequence of a deliberate policy of transferringinvestor savings to treasury instruments rather than corporate bonds.
198 Winnie P. H. Poon
Policy bonds occupied about one-third of the market from 1997 to 2002. They are called“policy bonds” because they are issued by the three policy banks in China: the ChinaDevelopment Bank, the Agricultural Development Bank of China, and the Export-ImportBank of China (ChinaBond, 2004). These banks were established in 1994 to channel fundsfrom the government to the state sectors, and to carry out projects assigned by the NDRCand other central government bodies (EIU, 2003). Most of their funding is raised by bondissues. Examining the annual percentage change, there is an upward trend in the overall bondissues, which is mainly caused by the expansion in the treasury bond sector.
As of June 2004, only local companies had been allowed to issue bonds in China. It isexpected that foreign companies will have the opportunity to issue bonds in the coming years(Hong Kong Securities, 2004). With reference to Harrison (2003), a Chinese company canissue bearer or registered bonds if it meets the following conditions.
� For a company that it can limit by shares, it should have at least RMB30 million (aboutUS$3.6 million) of net assets. For a limited liability company, the minimum net assets areRMB60 million (about US$7.2 million).
� The total amount of the bonds does not exceed 40 percent of the company’s net assets.� The average profits that can be distributed over the previous three years are sufficient to
pay one year’s interest on the bonds.� The funds are utilized in a way that is consistent with state industrial policy.� The interest rate on the bonds does not exceed 140 percent of the savings deposit rate for
the same maturity.
Limited improvement has been made in the development of a secondary debt market (EIU,2003). Although foreign banks that are licensed for renminbi trading have been allowed toparticipate in trading bonds in the interbank market since October 1998, in general, domesticbonds are not available to foreigners (EIU, 2003).
3.2. Credit Rating Industry
As mentioned in the previous section, credit ratings began in China in 1987 (Harrison,1987). There are about 20 domestic rating agencies in China, but most of them are small andlack advanced technology (China Daily, 1998b). They attempt to seek expertise and employthe rating methodologies of international credit rating agencies (Kennedy, 2003). The majorcredit rating agencies in China are described in the next section.
In addition to local rating agencies, the top three international rating agencies, Moody’sInvestors Service (Moody’s), Standard and Poor’s Ratings Services (S&P’s), and Fitch RatingsLtd. (Fitch) have approached the nascent credit rating industry in China in their own waysin recent years. Fitch formed a joint venture with CCX in 1999 and divested its 30% sharein 2004. Moody’s signed a two-phase co-operative agreement with Dagong in 1999. OnFebruary 12, 2003, to prepare for further development or independent credit research workin China, Moody’s set up Beijing Moody’s Venture Information Technology Service Ltd.(BMVITS) in Beijing (SinoCast, 2003). Standard and Poor’s has been active in assigning bothinteractive ratings (solicited ratings) and pi4 ratings (unsolicited ratings) to the major Chinesebanks and the Chinese companies listed on international stock exchanges such as the New
13. Credit ratings in China 199
York Stock Exchange (NYSE), the London Stock Exchange (LSE), and the Stock Exchangeof Hong Kong Limited (SEHK).
Some analysts or institutional investors cast doubt on the creditability of rating work inChina per se because they fear that the domestic accounting standards5, emergent regulations,poor corporate governance, government intervention and lack of transparency reduce thereliability of rating results (Baglole, 2004). They believe that the rating work in China is notvery useful if it is based on possibly inaccurate information. Therefore, they are unwillingto value the credit rating work in China, and in particular, they give little credence to thework of domestic rating agencies (Baglole, 2004).
4. MAJOR CREDIT RATING AGENCIES IN CHINA
The major players in China’s domestic corporate bond business are Shanghai Far East CreditRating Co., Ltd., China Chengxin International Credit Rating Co., Ltd., Dagong GlobalCredit Rating Co., Ltd., and China Lianhe Credit Rating Co., Ltd. (Kennedy, 2003).Kennedy (2003 and 2004) provides interesting discussions on the role of China’s credit ratingagencies. A concise description of these four agencies and the newly established XinhuaFinancial Network are presented in the following.
4.1. Shanghai Far East Credit Rating Co., Ltd. (SFE)
Shanghai Far East Credit Rating Co., Ltd. was founded in March 1988. The major share-holders of SFE are the Shanghai Academy of Social Sciences and Shanghai Huyin FinancialInformation Consultation Center. The company has more than 50 staff members consistingof academics, accountants, and economists. It has several functional departments includingthe Credit Rating Department, the Securities Rating Department, and the Project Assess-ment Department, etc. SFE obtained permission from the PBOC to rate domestic corporatebonds in 1997. In addition, the Shanghai Branch of the PBOC has granted SFE the qual-ification to rate enterprises that apply for bank loans by issuing loan certificates to them(these are known as “bank loan certificate ratings”). As of July 2004, it had rated 1,104enterprises that issue long-term or short-term bonds, and has issued approximately 2,000loan certificate ratings. The Xinhua Financial Network of Xinhua Finance in Hong Kongand SFE formed a strategic alliance called “XFN-Far East China Credit Rating” (XFN-FarEast) to conduct credit rating analyses in 2002. They assign issuer ratings to listed companiesin China and Hong Kong based on publicly available information. Similar to S&P’s, theylabel these unsolicited ratings as “PI” ratings (SFE, 2004). In December 2003 SFE becamethe first Chinese member of the Association of Credit Rating Agencies in Asia6 (ACRAA)(XFN, 2004).
4.2. Xinhua Financial Network (XFN) of Xinhua Finance
Xinhua Finance was incorporated in November 1999 and is headquartered in Hong Kong. Itsworldwide offices with more than 280 employees, are located in major cities such as Beijing,Tokyo, New York, Chicago, and London. Xinhua Finance provides financial services throughits 12 international offices and 19 regional news bureaus around the globe. Through its fourcore divisions—indices, financial news, ratings, and investor relations—it aims to becomean internationally recognized source of information and data on the Chinese markets. Toprovide China’s financial information for institutional investors, and to transmit financial data
200 Winnie P. H. Poon
to the rest of the world in a manner that is similar to Bloomberg in the West, the XinhuaFinancial Network (XFN) was founded in 2000 (The Economist, 2003; and Flannery 2004).The Xinhau News Agency (Xinhua), the official news agency in China, owns 20% of XFN(Flannery, 2004). As mentioned above, XFN joined with SFE to form XFN-Far East, whichgives issuer credit ratings to listed companies. As of May 2004, XFN-Far East had rated morethan 170 Chinese companies listed on the Shanghai Stock Exchange and the Shenzhen StockExchange in China, the Stock Exchange of Hong Kong, the New York Stock Exchange,and the Singapore Stock Exchange, etc. Xinhua-Far East strives to adopt international ratingstandards to assign issuer ratings based on its unique knowledge of the Chinese market (XFN,2004).
4.3. China Chengxin Credit Management Co., Ltd. (CCX) and China Chengxin
International Credit Rating Co., Ltd. (CCXI)
Both China Chengxin Credit Management Co., Ltd. and China Chengxin InternationalCredit Rating Co., Ltd. (CCXI) are based in Beijing. China Chengxin Securities RatingCo., Ltd. was established on October 8, 1992 and was approved by the PBOC to conductbusinesses in credit rating, investment advisory, and information services. It was renamedas China Chengxin Credit Management Co., Ltd. (CCX) in 2002. In the credit ratingbusiness, CCX issues ratings on loan certificates, financial institutions, corporate bonds, andinvestment funds, etc. (CCX, 2004).
To improve its existing rating technique and adopt the latest international rating method-ology, CCX set up CCXI, the first Sino-foreign credit rating agency, with Fitch on August24, 1999 with the approval of the PBOC and the Ministry of Foreign Trade and EconomicCorporation (CCXI, 2004). However, on July 19, 2004, Fitch announced that it had divestedits 30% interest in CCXI to align with its global strategy of securing majority control overits overseas subsidiaries. Fitch’s Beijing Representative Office is now responsible for its ratingactivities in China (Fitch, 2004).
4.4. Dagong Global Credit Rating Co., Ltd. (Dagong)
Dagong Global Credit Rating Co., Ltd. was initiated in 1989 and registered in Beijing in1994 with the State Administration of Industry and Commerce under the approval of ChinaState Economic and Trade Commission and the PBOC (Dagong, 2004; and Moody’s, 1999).It has branches in major cities in China including Shanghai, Shenzhen, Xian, and Jilin. Inaddition to offering information and consulting services to various industries, Dagong is oneof the major providers of credit ratings on corporate bonds, convertible bonds, insurancecompanies, and asset-backed securities, etc (Dagong, 2004). In anticipation of the emergingdebt market in China, Moody’s signed a co-operative agreement with Dagong on July 30,1999 to meet the growing demand for education and training in credit analysis (Moody’s,1999; and Xinhua, 1999). Dagong expected that the co-operation would help to bridge thegap in rating standards between China and other countries. Two phases of co-operation wereplanned in the agreement (Xinhua, 1999). First, Dagong and Moody’s would jointly developa rating system customized for China’s domestic capital markets. Moody’s would provideDagong with technical assistance in credit analysis, credit research, and credit training, but itwould not be engaged in the rating of any specific project with Dagong (Moody’s, 1999; and
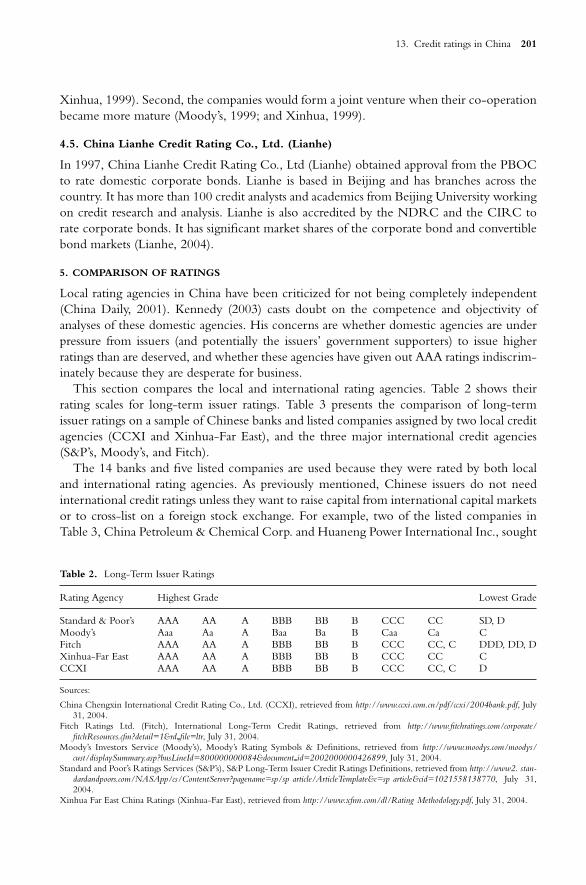
13. Credit ratings in China 201
Xinhua, 1999). Second, the companies would form a joint venture when their co-operationbecame more mature (Moody’s, 1999; and Xinhua, 1999).
4.5. China Lianhe Credit Rating Co., Ltd. (Lianhe)
In 1997, China Lianhe Credit Rating Co., Ltd (Lianhe) obtained approval from the PBOCto rate domestic corporate bonds. Lianhe is based in Beijing and has branches across thecountry. It has more than 100 credit analysts and academics from Beijing University workingon credit research and analysis. Lianhe is also accredited by the NDRC and the CIRC torate corporate bonds. It has significant market shares of the corporate bond and convertiblebond markets (Lianhe, 2004).
5. COMPARISON OF RATINGS
Local rating agencies in China have been criticized for not being completely independent(China Daily, 2001). Kennedy (2003) casts doubt on the competence and objectivity ofanalyses of these domestic agencies. His concerns are whether domestic agencies are underpressure from issuers (and potentially the issuers’ government supporters) to issue higherratings than are deserved, and whether these agencies have given out AAA ratings indiscrim-inately because they are desperate for business.
This section compares the local and international rating agencies. Table 2 shows theirrating scales for long-term issuer ratings. Table 3 presents the comparison of long-termissuer ratings on a sample of Chinese banks and listed companies assigned by two local creditagencies (CCXI and Xinhua-Far East), and the three major international credit agencies(S&P’s, Moody’s, and Fitch).
The 14 banks and five listed companies are used because they were rated by both localand international rating agencies. As previously mentioned, Chinese issuers do not needinternational credit ratings unless they want to raise capital from international capital marketsor to cross-list on a foreign stock exchange. For example, two of the listed companies inTable 3, China Petroleum & Chemical Corp. and Huaneng Power International Inc., sought
Table 2. Long-Term Issuer Ratings
Rating Agency Highest Grade Lowest Grade
Standard & Poor’s AAA AA A BBB BB B CCC CC SD, DMoody’s Aaa Aa A Baa Ba B Caa Ca CFitch AAA AA A BBB BB B CCC CC, C DDD, DD, DXinhua-Far East AAA AA A BBB BB B CCC CC CCCXI AAA AA A BBB BB B CCC CC, C D
Sources:
China Chengxin International Credit Rating Co., Ltd. (CCXI), retrieved from http://www.ccxi.com.cn/pdf/ccxi/2004bank.pdf, July31, 2004.
Fitch Ratings Ltd. (Fitch), International Long-Term Credit Ratings, retrieved from http://www.fitchratings.com/corporate/fitchResources.cfm?detail=1&rd file=ltr, July 31, 2004.
Moody’s Investors Service (Moody’s), Moody’s Rating Symbols & Definitions, retrieved from http://www.moodys.com/moodys/cust/displaySummary.asp?busLineId=800000000084&document id=2002000000426899, July 31, 2004.
Standard and Poor’s Ratings Services (S&P’s), S&P Long-Term Issuer Credit Ratings Definitions, retrieved from http://www2. stan-dardandpoors.com/NASApp/cs/ContentServer?pagename=sp/sp article/ArticleTemplate&c=sp article&cid=1021558138770, July 31,2004.
Xinhua Far East China Ratings (Xinhua-Far East), retrieved from http://www.xfnn.com/dl/Rating Methodology.pdf, July 31, 2004.
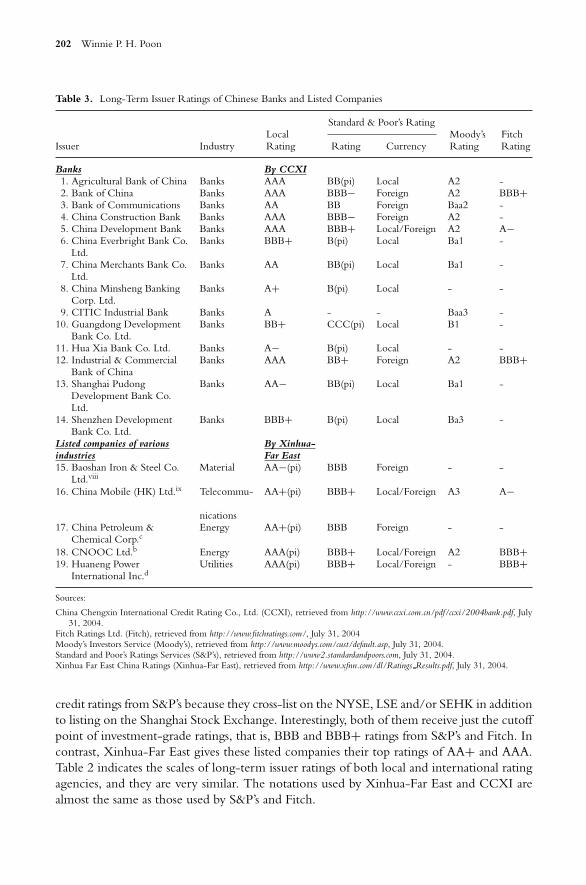
202 Winnie P. H. Poon
Table 3. Long-Term Issuer Ratings of Chinese Banks and Listed Companies
Standard & Poor’s Rating
Issuer IndustryLocalRating Rating Currency
Moody’sRating
FitchRating
Banks By CCXI1. Agricultural Bank of China Banks AAA BB(pi) Local A2 -2. Bank of China Banks AAA BBB− Foreign A2 BBB+3. Bank of Communications Banks AA BB Foreign Baa2 -4. China Construction Bank Banks AAA BBB− Foreign A2 -5. China Development Bank Banks AAA BBB+ Local/Foreign A2 A−6. China Everbright Bank Co.
Ltd.Banks BBB+ B(pi) Local Ba1 -
7. China Merchants Bank Co.Ltd.
Banks AA BB(pi) Local Ba1 -
8. China Minsheng BankingCorp. Ltd.
Banks A+ B(pi) Local - -
9. CITIC Industrial Bank Banks A - - Baa3 -10. Guangdong Development
Bank Co. Ltd.Banks BB+ CCC(pi) Local B1 -
11. Hua Xia Bank Co. Ltd. Banks A− B(pi) Local - -12. Industrial & Commercial
Bank of ChinaBanks AAA BB+ Foreign A2 BBB+
13. Shanghai PudongDevelopment Bank Co.Ltd.
Banks AA− BB(pi) Local Ba1 -
14. Shenzhen DevelopmentBank Co. Ltd.
Banks BBB+ B(pi) Local Ba3 -
Listed companies of various By Xinhua-industries Far East15. Baoshan Iron & Steel Co.
Ltd.viiiMaterial AA−(pi) BBB Foreign - -
16. China Mobile (HK) Ltd.ix Telecommu- AA+(pi) BBB+ Local/Foreign A3 A−
nications17. China Petroleum &
Chemical Corp.cEnergy AA+(pi) BBB Foreign - -
18. CNOOC Ltd.b Energy AAA(pi) BBB+ Local/Foreign A2 BBB+19. Huaneng Power
International Inc.dUtilities AAA(pi) BBB+ Local/Foreign - BBB+
Sources:
China Chengxin International Credit Rating Co., Ltd. (CCXI), retrieved from http://www.ccxi.com.cn/pdf/ccxi/2004bank.pdf, July31, 2004.
Fitch Ratings Ltd. (Fitch), retrieved from http://www.fitchratings.com/, July 31, 2004Moody’s Investors Service (Moody’s), retrieved from http://www.moodys.com/cust/default.asp, July 31, 2004.Standard and Poor’s Ratings Services (S&P’s), retrieved from http://www2.standardandpoors.com, July 31, 2004.Xinhua Far East China Ratings (Xinhua-Far East), retrieved from http://www.xfnn.com/dl/Ratings Results.pdf, July 31, 2004.
credit ratings from S&P’s because they cross-list on the NYSE, LSE and/or SEHK in additionto listing on the Shanghai Stock Exchange. Interestingly, both of them receive just the cutoffpoint of investment-grade ratings, that is, BBB and BBB+ ratings from S&P’s and Fitch. Incontrast, Xinhua-Far East gives these listed companies their top ratings of AA+ and AAA.Table 2 indicates the scales of long-term issuer ratings of both local and international ratingagencies, and they are very similar. The notations used by Xinhua-Far East and CCXI arealmost the same as those used by S&P’s and Fitch.
13. Credit ratings in China 203
Referring to Figure 1, which is based on EIU (2003), the PBOC and the newly establishedCBRC are the dual regulators of China’s banking industry. Under the administration andregulation of the PBOC and the CBRC, there are three policy banks, four state-ownedcommercial banks (the Big Four), ten smaller second-tier commercial banks, one privatelyowned bank7, more than 70 foreign and joint-venture banks, and various investment banks(EIU, 2003).
Referring to Table 3, CCXI gave its top rating “AAA” to the China Development Bank(one of three policy banks) and the Big Four: the Agriculture Bank of China, the Bank ofChina, the China Construction Bank, and the Industrial and Commercial Bank of China. Incontrast, S&P’s assigned BBB and speculative-grade ratings to these five banks, and Moody’soffered A2 ratings. Fitch gave A− and BBB+ to the policy bank and two of the Big Fourbanks, respectively. The Guangdong Development Bank Co. Ltd. is the only bank thatreceived a speculative-grade rating from the local rating agency. All of the other banks inthe sample obtained investment-grade ratings from CCXI. In contrast, excluding the policybank and the Big Four, the rest of the banks obtained speculative-grade ratings from S&P’s,and Baa or below ratings from Moody’s. In sum, the local ratings on the sample issuers appearto be significantly higher than the international ratings even though the rating scales of thelocal and international agencies are similar.
6. SIGNIFICANT ISSUES
Based on the review and discussions in the previous sections, the problems with credit ratingsin China that are discussed next are the main reasons why both domestic investors andinternational analysts give little weight to the credit ratings assigned by China’s credit ratingagencies. In addition, the regulatory environment can be more supportive and provides morecoordination and standardization of regulations among regulatory bodies. These significantissues are elaborated and discussed below.
6.1. Credibility, Objectivity and Independence
Credit agencies in China have been criticized for not being completely independent andnot being able to establish their own credibility (China Daily, 2001; and Harrison, 2003).Some analysts and institutional investors cast doubt on the creditability and objectivity ofrating work in China and they give little credence to the credit ratings given by domesticrating agencies (Harrison, 2003; Kennedy, 2003; and Baglole, 2004). S&P’s (2003) states that,“although there are over a dozen local credit rating agencies with the number constantly increasing, noneof them has been able to establish a recognized domestic benchmarking standard”.
6.2. Indicator of Default Risk
Individual investors in China may be confused with the concept of credit spread becausethey have difficulties in relating default risk, credit spread, and credit ratings. For instance,examining the domestic corporate bond issues from January 2001 to August 2003, Kennedy(2003) demonstrates that the credit spreads of AAA bonds with similar maturities vary widely,and that the credit spreads of long-term bonds are not significantly higher than those ofshort-term bonds. It appears that China’s credit ratings do not accurately represent the levelof default risk of bonds for setting interest rates or prices, and are unable to lessen theinformation asymmetry between bond investors and issuers.
204 Winnie P. H. Poon
6.3. Supportive Regulatory Environment
The regulatory environment for the bond and credit rating markets can be more encouragingand supportive. For example, regardless of the level of default risk, there is a ceiling imposedby the State Council on the interest rate of a corporate bond: that is, it cannot be morethan forty percent above the savings deposit rate for the same maturity (Harrison, 2003;and Hong Kong Securities, 2004). In addition, to prevent from possible repayment defaults,China has been very cautious in developing its bond market. In fact, the financial authoritieshave imposed strict annual quotas on corporate bond issues (China Daily, 1998b). In the pastfew years, the Chinese government has approved very few bond issue applications, mainlyfrom large, state-owned enterprises (Kennedy, 2003). Fewer corporate bond issues implythe need for fewer bond ratings. Imposing a strict quota on annual bond issues indirectlyjeopardizes the growth of the credit rating industry.
6.4. Coordination and Standardization of Regulations Among Regulatory Bodies
The coordination and standardization of regulations among regulatory bodies under theState Council can be improved. For example, the PBOC, CSRC, CIRC, and CBRC haveseparate lists of approved credit rating agencies and their own criteria for accrediting thoseagencies. Although the names of the agencies on their lists overlap, there is no single list ofnationally-recognized credit rating agencies across all regulatory bodies. In addition, insiderslike the Chief Executive Officer of China Chengxin International Credit Rating Co., Ltd.frankly point out the key problems in the rating industry in China—“the rating system is notstandardized, the business scope is narrow, the law is outdated, the information is not available and theresults of credit ratings are not fully used” (China Daily, 2001).
7. CONCLUSIONS
Like the bond market in China, China’s credit rating industry is still in its formative stageand has many challenges and obstacles to overcome. None of the local credit rating agencieshave been able to establish their own domestic and international credibility. The top threeglobal credit rating agencies, S&P’s, Moody’s and Fitch, have already approached the nascentcredit rating industry in their own ways. However, to date, domestic bonds in China donot require international credit ratings, and regulatory bodies officially recognize no foreignratings. This study also indicates that local ratings on the sample issuers appear to be higherthan the international ratings, even though the rating scales of the two groups are similar.
Fewer government constraints on the bond market and the rating industry would behelpful because the current ones may hamper growth and development. For example, thefirm interest rate ceiling and strict annual bond quota may not be necessary. The regulatorybodies should provide more independence, encourage more objectivity, and promote theimportance of credibility to the local rating agencies. The government should provide amore enabling and supportive regulatory framework instead of having more independentregulatory bodies or separate sets of rules. More coordination among the regulatory bodiesunder the State Council and more standardization of regulations on the rating industry areneeded. For example, a common list of nationally-recognized credit rating agencies and aset of standardized accreditation criteria should be used by all regulatory bodies under theState Council. They should also be announced and available to the public. In addition, to
13. Credit ratings in China 205
promote healthy competition and improve the quality of credit ratings, well-qualified andexperienced foreign credit rating agencies should not be excluded from the common list.
The government statistics should be readily available to rating agencies and the issuersshould be more transparent, especially for unsolicited ratings, because they rely heavily onpublicly available information and financial reports. After all, reliability of the underlyingdata is very important. Different from most developed bond markets, individual investorsrather than institutional investors dominate the investor base in China. A credit cultureshould be cultivated among these less sophisticated investors. In addition, the governmentshould facilitate the establishment of a larger and more diversified institutional-investor basein using bond ratings from approved rating agencies. For example, fund managers, insurancecompanies, and non-bank financial institutions should be required to invest in only highlyrated bonds, provided that the ratings are credible and there is no rating inflation.
In conclusion, to develop a well-functioning bond market in China, it will be criticalto have a well-developed, independent, and credible rating industry which will lessen theinformation asymmetry between bond issuers and investors, and facilitate setting bond pricesand interest rates.
ENDNOTES
1. The currency used in China is called “Renminbi” or RMB in short. The exchange rate as at September 27,2004 of RMB8.28/USD is used throughout this paper.
2. Although the regulation did not say that enterprises “must” obtain credit ratings, the underlying intentionwas to make having a credit rating compulsory for bond issuers (Kennedy, 2004).
3. The original list of PBOC-approved credit rating agencies is in Chinese and is available from the author uponrequest.
4. S&P’s rating with a “pi” subscript is based on publicly available information about the issuer. It relies uponless comprehensive information than do solicited interactive ratings and does not indicate in-depth meetingswith an issuer’s management (S&P’s, 2004).
5. Chinese companies are not required to adopt international accounting standards unless they are listed as “B”shares on the Shanghai and Shenzhen Stock Exchanges, which are mainly for foreign investors to purchase,or on overseas stock exchanges, such as listing as “H” shares on the Stock Exchange of Hong Kong, Ltd. or“N” shares on the New York Stock Exchange.
6. The Association of Credit Rating Agencies in Asia (ACRAA) was established in September 2001 with thesupport of the Asian Development Bank (ADB), and attempts to promote the harmonization of rating standardsand practices in Asia (ADBI, 2004; and XFN, 2004).
7. According to the EIU (2003), China Minsheng Bank is the only private bank in China. It was established in1995 and is mainly owned by New Hope Corp., China’s largest privately owned conglomerate.
viii. Listed on the Shanghai Stock Exchange as A share in China.ix. Listed on the Stock Exchange of Hong Kong Limited in Hong Kong, and the New York Stock Exchange in
the United States.c. Listed on the Shanghai Stock Exchange as A share in China, the Stock Exchange of Hong Kong Limited in
Hong Kong, the New York Stock Exchange in the United States, and the London Stock Exchange in theUnited Kingdom.
d. Listed on the Shanghai Stock Exchange as A share in China, the Stock Exchange of Hong Kong Limited inHong Kong, and the New York Stock Exchange in the United States.
(pi). unsolicited ratings mainly based on public information. All ratings are as at July 31, 2004.
REFERENCES
Asian Development Bank Institute (ADBI), Role of credit agencies in development, ADBI e-newsline, June 9, 2004.[Online] Available: http://www.adbi.org/e-newsline/040609.html.
Baglole, J., Chinese Credit Ratings: A Huge Leap of Faith, Far Eastern Economic Review, January 8, 2004, 39–42.ChinaBond.com.cn (ChinaBond), retrieved from http://www.chinabond.com.cn/chinabond/zqzs/index.jsp, July 7,
2004 (in Chinese).
206 Winnie P. H. Poon
China Chengxin Credit Management Co., Ltd. (CCX), retrieved from http://www.ccx.com.cn, July 6, 2004.China Chengxin International Credit Rating Co., Ltd. (CCXI), retrieved from http://www.ccxi.com.cn, July 6, 2004.China Daily, China—Nation’s First Credit Rating JV Established, September 14, 1998a. [Online] Available:
http://www.lexisnexis.com/universe.China Daily, China—Rating Agencies Expect Boost from Expanded Bond Market, September 21, 1998b. [Online]
Available: http://www.lexisnexis.com/universe.China Daily, Credit Rating System Growing, November 3, 2001. [Online] Available:
http://www.lexisnexis.com/universe.China Lianhe Credit Rating Co., Ltd. (Lianhe), retrieved from http://www.lianheratings.com.cn, July 6, 2004 (in
Chinese).Dagong Global Credit Rating Co., Ltd. (Dagong), retrieved from http://www.dagongcredit.com and
http://218.30.101.58/dagong/english, July 6, 2004.Economist Intelligence Unit, The Economist (EIU), China’s Financial System 2003–4, China Hand, 2003.Fitch Ratings Ltd. (Fitch), Fitch Ratings Announces Divestment of China Chengxin International Credit Rating
Co., Press Release (Latest CDO/CDx Headlines), July 19, 2004.Flannery, R., Xinhua Shares the Wealth, Forbes Magazine, February 9, 2004, 21. [Online] Available:
http://www.forbes.com/global.Harrison, M., Asia-Pacific Securities Markets, Fourth Edition, 2003, Sweet & Maxwell Asia, 237–280.Hong Kong Securities, China Focus: Hot Bonds, Evolution of the Hong Kong Bond Market, May/June 2004, 24–27.Kennedy, S., China’s Credit Rating Agencies Struggle for Relevance. The China Business Review, November-
December 2003, 36–40.Kennedy, S., China’s Languishing Credit-Rating Industry: Canary in the Mine? Presented at the 56th Annual
Meeting of the Association for Asian Studies, San Diego, California, March 4–7, 2004.Lunsford, P., Credit Ratings in China Can Be Mere Guesswork, CollectionIndustry.com, January 9, 2004. [Online]
Available: http://www.hkccma.com/forum creditingguess.htm.Moody’s Corporation (Moody’s), Moody’s and Dagong Credit Rating, China, Form Cooperative Agreement,
Shareholder Relations—News Release, July 30, 1999.People’s Bank of China (PBOC), Announcement of PBOC-Approved Credit Rating Agencies of Corporate Bonds,
December 16, 1997, retrieved from China InfoBank Database, June 29, 2004 (in Chinese).PR Newswire, Xinhua Financial Network Announces an Equity Investment in Shanghai Far East Credit Rating
Co., Ltd., June 25, 2003. [Online] Available: http://www.lexisnexis.com/universe.Shanghai Far East Credit Rating Co., Ltd. (SFE), retrieved from http://www.fareast-cr.com, July 6, 2004.SinoCast China Business Daily News (SinoCast), Moody Settles down in Beijing, April 9, 2003, 1, retrieved from
ProQuest On-line Database, October 16, 2003.Standard and Poor’s Ratings Services (S&P’s), Corporate Governance in China, Country Governance Study, November
2003.Standard and Poor’s Ratings Services (S&P’s), S&P Long-Term Issuer Credit Ratings Definitions, retrieved
from http://www2.standardandpoors.com/NASApp/cs/ContentServer?pagename=sp/sp article/ArticleTemplate&c=sp article&cid=1021558138770, July 31, 2004.
State Council in China (State Council), Regulations on the Management of Corporate Bonds, August 2, 1993,retrieved from China InfoBank Database, July 7, 2003 (in Chinese).
The Economist, Bush Telegraph, May 24, 2003, 69–70.Xinhua News Agency (Xinhua), Moody’s Signs Co-operative Agreement with Chinese Rating Agency, July 30,
1999. [Online] Available: http://www.lexisnexis.com/universe.Xinhua News Agency (Xinhua), Banking Expert on Problems with Treasury Bond Mark, September 11, 2003.
[Online] Available: http://www.lexisnexis.com/universe.Xinhua Finance Network (XFN), retrieved from http://www.xfn.com, July 6, 2004.
14. FINANCE AND DEVELOPMENT: GRANGER-CAUSALITY TESTSFOR PREWAR AND POSTWAR U.S.A., U.K., AND JAPAN
MASANORI AMANO
1. INTRODUCTION
In every country, the pursuit of determinants of growth and development has been at thecenter of interests of policymakers and research workers. However, the empirical search forthe determinants of growth had been surprisingly few until the earlier work of Kormendiand Meguire (1986) and Barro (1991) appeared. Their work and many succeeding ones tryto regress per capita income or its growth rate on monetary and fiscal conditions, investment,and the stock of human capital, etc., of the countries in question to get close correlationsbetween them. Hence the name of growth regressions is used.1 In fact, after those two orthree studies were brought to the attention of economists, many papers along similar linesmushroomed rapidly. One school of those growth regressions mentions various economicand institutional factors that explain and ‘cause’ growth and development, not specificallylimiting themselves to the financial and monetary variables. Another school of growth regres-sions focuses on financial variables as regressors, and considers if the growth of per capitaoutput was caused by the development of financial institutions (FIs) or the causal chain is theother way around. The former causal direction is what their results suggest and conformsto the prediction of seminal work of Gurley and Shaw (1955, 1960). They argue that thedevelopment of FIs increases saving flow by more diverse offering of saving instruments byFIs, raise investment volumes with enriched menus of loan packages and with risk reductionthrough the economy of scale and risk-pooling, and also enhances the quality of invest-ment by specialized screening techniques of the FIs. In other words, the development ofFIs precedes and helps the development of the real side of the economies through thosechannels. I call this causal and time ordering the ‘Gurley-Shaw (GS) hypothesis’, although

208 Masanori Amano
this terminology is not an established one. The previously mentioned studies use regressionanalysis.
There is another group that deals with the finance-development relationship, using timeseries analysis, particularly the Granger-causality concept. The work in this group is generallythought to better suit the examination of causality but, in contrast to the regression analysisdealing with finance-development nexus, the direction of causation they derived is not clear-cut. In other words, time series analysts differ in their results concerning whether the GShypothesis holds or not.
In this chapter, I first survey the existing work that uses single-equation regression to dealwith the determinants of growth and development of many countries in general (group one),and then the work which uses time series analysis, focusing on the existence and directions ofcausality between financial development and the development of economic activity (grouptwo).
The next section, Section 2, is a survey of the work belonging to group one and group twoaccording to the criterion described above. Section 3 is our own analysis using the conceptof Granger-causality that will examine if the GS hypothesis holds in the prewar and postwardevelopment processes of the U.S.A., U.K., and Japan. Section 4 contains a summary andfurther remarks, which is followed by descriptions of the data that are used in this chapter.2
2. REGRESSION ANALYSIS OF GROWTH AND DEVELOPMENT
The concept and phenomenon of growth and development has occupied keen interests ofmany economists of the past (Reynolds 1977; Adelman 1974). In this section I review theempirical work of growth and development, putting aside the historical approach that usesgrowth accounting (Denison 1967; Abramovitz 1979). I classified the papers to be reviewedinto group one and group two. The former consists of the traditional (single-equation)regression analysis, and includes (a) what is called ‘growth regression,’ whose explanatoryvariables, monetary as well as non-monetary, range widely, and (b) the analysis that focuseson the finance-growth nexus and the direction of causation between finance and growth.Group two is time series analysis, which, limiting the relevant variables to a small number,is mainly concerned with causal relationships between financial and economic development(or growth), using Granger-causality.
2.1. Cross-Country Growth Regression (Group One)
Kormendi and Meguire (1986) is the earlier paper of growth regression (see also Wallich1969). It is a wonder that in the postwar period the empirical work dealing with growth anddevelopment had not been abundant until the mid-eighties, compared to its sophisticatedmathematical counterparts.
Kormendi and Meguire (1986) relate the growth rates of their sample countries (an averagerate for each country) to variables such as initial per capita income, the population growthrate, variability of output growth, money supply growth and its variability, the growth ofgovernment spending and of exports, and the rate of inflation. Their two results that conformto theory and recent experiences are that higher variability of money supply reduces growthand that higher investment-output ratio enhances the growth rate. Revine and Renelt (1992)offer rather surprising observations, which are backed up by their careful empirical work, thatthe partial correlations between the growth and investment-output ratio and between growth
14. Finance and development 209
and exports-output ratio are robust, independent of other explanatory variables, while therelationships between growth, on the one hand, and monetary variability and fiscal/monetarypolicy variables, on the other, are not so; they also note that, generally, growth regression isnot so robust as to be useful for policymaking.
Barro (1991) too is regarded as an earlier seminal work. He showed, for the period1960–1985 and for 98 countries, that the following variables help raise the growth of percapita income: higher initial human capital, the lower initial level of per capita income(Gerschenkron 1962), lower government spending-output ratio, higher political stability, andsmaller market distortions. In more recent work, Barro (1997) shows higher inflation tendsto lower growth, but an economy with more democratic society and/or more independentcentral banking is likely to achieve higher growth.
Fischer (1991 1993) is based on the similar framework to the above papers, using data from32 developing countries for around 1960 through 1990. He derives the conclusions, amongothers, that the following conditions make for higher economic growth: stable macroeco-nomic environments, suitable economic policy, a low rate of inflation and a small budgetdeficit (both through higher capital accumulation and productivity growth), and also a smallforeign exchange markets distortion (measured by high black market exchange premiums,through its adverse effect on capital formation).
As was noted earlier, group one (growth regression) includes a subgroup that is concernedwith whether economic development, typically measured by higher per capita income orits higher growth, was correlated with preceding financial development. Pagano (1993) andLevine (1997) provide useful surveys of this topic, Pagano concisely, while Levine extensively.They develop their analytical background along the line of Gurley and Shaw (1955, 1960)which is summarized in Section 1 of this chapter. FIs (financial institutions) can raise thequantity and quality of financial flows of the economy through their specialized roles incapital markets and risk pooling.
The earliest regression analyses on this line are King and Levine (1993a, 1993b). Theyshowed the financial development, as measured, e.g., by bank lending and deposits, was infact correlated with growth and development, as indexed, e.g., by per capita income growthand technical progress. Presumably because of a criticism of Mankiw’s (1995) review ongrowth regression, which implies that regression analysis after all cannot claim that statisticallysignificant explanatory variables are causal factors of the explained (left-hand) variable, thesubsequent work came to put more efforts in showing the causal nature of regressions. Theseefforts include Rajan and Jingales (1998), Levine, Loayza, and Beck (2000), and Beck, Levine,and Loayza (2000). To establish that financial development caused higher economic growthand not the other way round, the first paper tries to exclude the possibilities of reversecausality. The second paper employs the recently developed dynamic panel regression inaddition to more conventional cross-section instrumental variable techniques. The thirdpaper uses the same method as the second and exhibits the role of financial development notonly in causing higher per capita income but also in encouraging higher total productivitygrowth. Benhabib and Spiegel (2000) went on, using similar methods to the last two papers, toshow that financial development leads to higher human capital accumulation. In view of thosepapers, therefore, time series analysis, which would be more appropriate to extract causalrelationships, will have its own role in examining the causality between financial developmentand the growth of total factor productivity (and also human capital accumulation).
210 Masanori Amano
Levine and Zervos (1998) counters the criticisms that are often raised against the workon the finance-development nexus, which implies that most of the work picks up indirectfinance, neglecting direct financial routes such as those through bond and equity markets,by counting in financial flows via direct routes. However, if all the financial routes areincluded, the finance-development nexus would be almost self-evident (more financial flowleads to more rapid development and capital formation). Rather, it will be analytically moreconvenient and reasonable to limit oneself to indirect financial routes, particularly for theeconomies in a developing (emerging) stage, because in those economies, direct finance is ina primitive stage and indirect routes are dominant compared to other routes (Patrick 1966).
In stark contrast to the papers reviewed above, Atje and Jovanovic (1993), using analyticalframeworks of Greenwood and Jovanovic (1993) and Mankiw, Romer, and Weil (1992), andbased on the OLS, show that stock market development, but not banking development, issignificantly related to the per capita income level and its growth rate. This result is surprisingand at variance with the vast literature on the finance-development nexus. Their empiricalresults seem worth taking note but may have something to do with the rather weak robustnessproperty of growth regression in general (Levine and Renelt 1992).
My viewpoint of growth regression is that it is not a strong guide for detecting thecausality from one of indexes of financial development to one of indexes measuring economicdevelopment, even after controlling for the multiplicity of distinctness of the economies inquestion. To end this section I would like to cite the following sentences from Mankiw’s(1995) extensive review on growth regressions:
‘Policymakers who want to promote growth would not go far wrong ignoring most ofthe vast literature reporting growth regressions (p. 308).’ ‘Relying on estimates from cross-country regressions (· · ·) will likely lead to haphazard policy, which is surely worse than nopolicy at all (p. 309).’
2.2. Finance and Development: Views from Time Series Analysis
This section deals with the work using time series analysis (TSA), particularly Granger-causality, for detecting causal connections between financial development and higher income(or higher growth). ‘Granger-causality’ seems to be too specific (narrow) to call it TSA, butactually it is almost all that has been used for analyzing causality within TSA.
Jung (1986) is probably the first paper (at least one of the first ones) of the field. Hechooses 56 countries of which 19 are developed countries, and uses M1 money multipliers(M1/base money) and the Marshallian k2 (M2/nominal GDP) as financial developmentindicators. The economic development indicators are per capita real GDP or its growthrate. Conducting the Granger-causality tests, which are a variant of the F test, he showsthat the case in which financial development causally leads economic development is moreoften than the other way round, and, as a result, the GS hypothesis is moderately supported.Patrick (1966) calls the above first causal order ‘the supply-leading pattern,’ while the secondcausal order (i.e. the reverse order) ‘the demand-leading pattern.’3 Patrick suggests that in theearly stage of development, ‘the supply-leading pattern typically prevails, while in the laterstage, ‘the demand-leading pattern’ is dominant. Jung calls Patrick’s observation ‘Patrick’shypothesis,’ and maintains that his Granger-causality tests suggest Patrick’s hypothesis holdsin a mild form. His tests for Patrick’s hypothesis consist of showing that, in developingcountries, the supply-leading pattern is observed more often, while in developed countries,
14. Finance and development 211
the opposite pattern is observed in more times; in other words, his tests are not conductedfor two periods of the same countries. Hence his conclusion, which is actually based onweak evidence, should be viewed with some reservation. In the next section I will test forPatrick’s hypothesis as well as the GS hypothesis for two periods of the same length in theeconomic development of the U.S.A., U.K., and Japan.
Wachtel and Rousseau (1995) and Rousseau and Wachtel (1998) stand out among similarwork in showing that the GS hypothesis holds with statistically significant manner. Theformer deals with longer time periods (about 80 years vs. 60 years) while the latter coversmore countries (the former includes the U.S., U.K., and Canada; the latter adds Norway andSweden). In both papers they showed in terms of Granger causality that the GS hypothesisis relevant, and rejected the opposite causal order which was supported by J. Robinson(1952) and Lucas (1988) (the ‘Robinson-Lucas hypothesis’). One reason for them to havebeen able to show the hypothesis in a definite way may be that they classify the financialinstitutions finely, such as commercial banks, deposit banks, insurance companies, creditcooperatives, pension funds, etc., and then compile asset values for each or the subset of theabove classification to use as financial development indicators.
Demetriades and Hussein (1996) and Neusser and Kugler (1998) share a common featurethat both papers show that the GS hypothesis does not hold in a clear way. The formeruses growth rates of financial and development indexes, as Rousseau and Wachtel (1998) do.Generally, taking growth rates leads to some loss of information possessed by level variables(Hafer and Kutan 1997). However, this procedure would not be the reason for the ambiguityof their results (cf. Roussau and Wachtel 1998). It might be due to their small sample size(38 years on average) or the data quality. In any case, it will be an intriguing subject forfurther inquiry. Neusser and Kugler (1998) choose OECD 13 countries for 1960 through1990. Their financial development index is FIs’ GDP (value added), while the economicdevelopment index is manufacturing industry’s GDP or total factor productivity.
Both papers (one by Demetriades et al. and another by Neusser et al.) make a sharp contrastto Rousseau and Wachtel’s because the former’s Granger causality tests show, depending onthe countries, either the GS hypothesis holds or the Robinson-Lucas hypothesis holds, orthe causation is bidirectional.
Regarding the different statistical results of the various papers in this group, one can note,among them, differences in the choice of indexes of financial and economic development,choice of countries examined, choice of time periods, and the degrees of (dis)aggregation ofFIs. It may be safe at this point to note that, as far as TSA (Granger-causality) is concerned,the challenge has just been started and, therefore, only a small part of facts has been broughtto light so far. In view of the majority of opinions that TSA is a more suitable tool forexamining causality, one may have to be content to confirm the need for further efforts tomake appropriate choices concerning the items mentioned above.
In the next section, I apply Granger-causality tests for two periods before and after WorldWar II of the U.S.A., U.K., and Japan to see if the GS hypothesis holds, hence if Patrick’shypothesis holds for the two periods as a whole.
3. FINANCE AND DEVELOPMENT: CAUSALITY IN THE U.S.A., U.K., AND JAPAN
I choose two periods for each country. Those are 1874–1920 and 1953–1999 for the U.S.A.and U.K., while 1894–1940 and 1954–2000 for Japan. The number of years included is 47
212 Masanori Amano
in each period. The choice of periods is a result of a compromise between some histori-cal consideration and data availability. Although the former two countries started ‘moderneconomic growth’, around 1840 in the U.S.A. and 1775 in the U.K. according to Kuznets(1971), it is only after 1870 that (qualitatively reliable) financial data are available (until nowfor the author). I also excluded the period 1921–1952 because the normal economic activitywas sizably marred by post World War I recession and the Great Depression in the first twocountries. For Japan I excluded the war period and postwar reconstruction period, when itseconomy was taken far off the normal track.4
As the financial development indicators, I will use deposits of commercial banks (bdyi ),claims of commercial banks on private sectors (bcyi, excluding the banks’ security holdings,but including bill discountings), the money multiplier for money supply M2 (n2i = M2/ basemoney of each country), and Marshallian k2 (k2i = M2/nominal GDP of each country),where the first two variables are divided by nominal GDP to normalize the numeratorsby market size. Letter i attached to each variable is a country index: i = a for the U.S.A.,i = b for the U.K., and i = j for Japan. As an index measuring economic development,I use per capita real GDP, qpoi. All variables are the levels and are not growth rates ordifferences.6 The VAR (vector autoregression) system I consider has variables qpoi, one offinancial development index, and base money/nominal GDP ratio (bmyi ). The last variableis included to equip the system with the basic monetary trend (force) (see Rousseau andWachtel 1998; the data used and their sources are described in an appendix). In deriving theoptimal lag number of the VAR, the SBIC or the AIC criterion was not useful, because theydecrease monotonically as the lag number increases. Hence I use the lag number which isdesignated by Engle-Granger (tau) cointegration tests.5 It turned out to be 3. Also, I omit aconstant and a time trend in our three-variable VAR. They are not needed in cointegrationtests, and our VAR yields essentially similar results on the causality to the case where aconstant and a trend are present. The first equation of our VAR system then is written as
qpoit =3∑
k=1
akqpoit−k +3∑
k=1
bkxit−k +3∑
k=3
c kbmyit−k (1)
where xi is one of the financial development indexes of country i (i = a , b , j ). ak , bk, andc k are constants to be estimated.
Before conducting the causality tests, it is in order to examine if the three variableshas a cointegrating relationship. It is a long-run equilibrium relationship; only when thisrelationship obtains in the long-run, have the causality tests their meaning. If the threevariables have a cointegrating relation, when one of them is regressed on the other two, theregression residual (i.e. the estimated error term) follows a stationary process (see, e.g., Enders1995). But before checking it, I describe the Granger-causality test in outline. Applying theOLS to the above equation for a single period in one of the three countries, one derivesthe unrestricted sum of squared residuals, S1. Then, dropping the second term in (1) andapplying the OLS again, one obtains the restricted sum of squared residuals S0. The F valuefor this case is
F = (S0 − S1)/
p
S1/
(T − m · p ), (2)
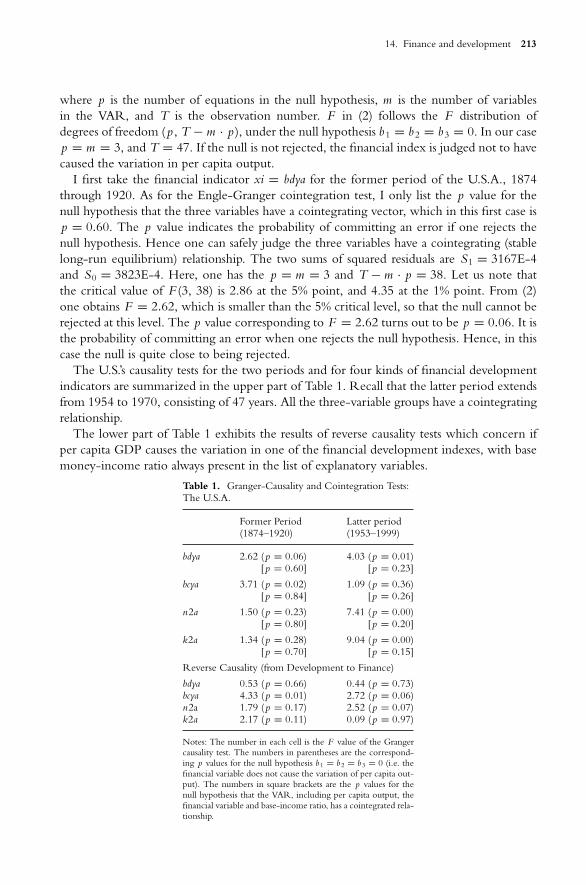
14. Finance and development 213
where p is the number of equations in the null hypothesis, m is the number of variablesin the VAR, and T is the observation number. F in (2) follows the F distribution ofdegrees of freedom (p , T − m · p ), under the null hypothesis b1 = b2 = b3 = 0. In our casep = m = 3, and T = 47. If the null is not rejected, the financial index is judged not to havecaused the variation in per capita output.
I first take the financial indicator xi = bdya for the former period of the U.S.A., 1874through 1920. As for the Engle-Granger cointegration test, I only list the p value for thenull hypothesis that the three variables have a cointegrating vector, which in this first case isp = 0.60. The p value indicates the probability of committing an error if one rejects thenull hypothesis. Hence one can safely judge the three variables have a cointegrating (stablelong-run equilibrium) relationship. The two sums of squared residuals are S1 = 3167E-4and S0 = 3823E-4. Here, one has the p = m = 3 and T − m · p = 38. Let us note thatthe critical value of F (3, 38) is 2.86 at the 5% point, and 4.35 at the 1% point. From (2)one obtains F = 2.62, which is smaller than the 5% critical level, so that the null cannot berejected at this level. The p value corresponding to F = 2.62 turns out to be p = 0.06. It isthe probability of committing an error when one rejects the null hypothesis. Hence, in thiscase the null is quite close to being rejected.
The U.S.’s causality tests for the two periods and for four kinds of financial developmentindicators are summarized in the upper part of Table 1. Recall that the latter period extendsfrom 1954 to 1970, consisting of 47 years. All the three-variable groups have a cointegratingrelationship.
The lower part of Table 1 exhibits the results of reverse causality tests which concern ifper capita GDP causes the variation in one of the financial development indexes, with basemoney-income ratio always present in the list of explanatory variables.
Table 1. Granger-Causality and Cointegration Tests:The U.S.A.
Former Period Latter period(1874–1920) (1953–1999)
bdya 2.62 (p = 0.06) 4.03 (p = 0.01)[p = 0.60] [p = 0.23]
bcya 3.71 (p = 0.02) 1.09 (p = 0.36)[p = 0.84] [p = 0.26]
n2a 1.50 (p = 0.23) 7.41 (p = 0.00)[p = 0.80] [p = 0.20]
k2a 1.34 (p = 0.28) 9.04 (p = 0.00)[p = 0.70] [p = 0.15]
Reverse Causality (from Development to Finance)
bdya 0.53 (p = 0.66) 0.44 (p = 0.73)bcya 4.33 (p = 0.01) 2.72 (p = 0.06)n2a 1.79 (p = 0.17) 2.52 (p = 0.07)k2a 2.17 (p = 0.11) 0.09 (p = 0.97)
Notes: The number in each cell is the F value of the Grangercausality test. The numbers in parentheses are the correspond-ing p values for the null hypothesis b1 = b2 = b3 = 0 (i.e. thefinancial variable does not cause the variation of per capita out-put). The numbers in square brackets are the p values for thenull hypothesis that the VAR, including per capita output, thefinancial variable and base-income ratio, has a cointegrated rela-tionship.
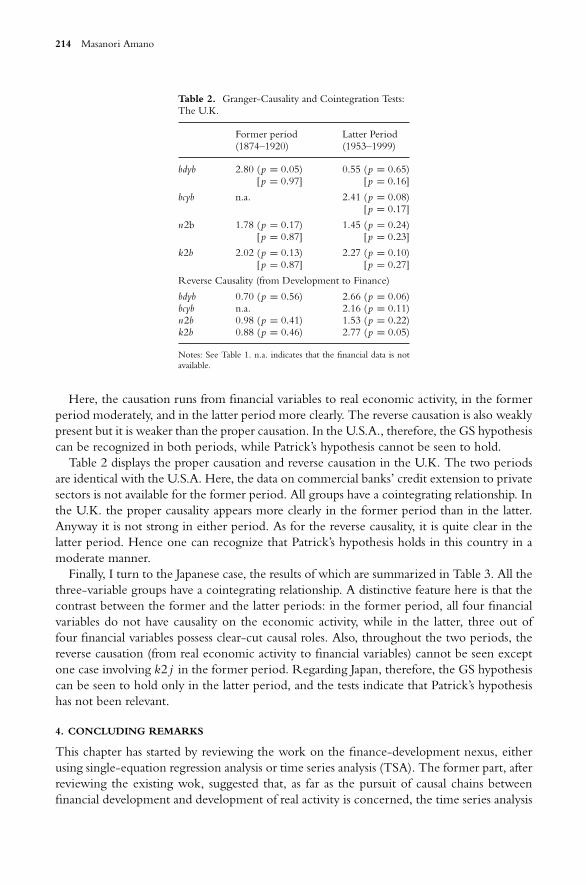
214 Masanori Amano
Table 2. Granger-Causality and Cointegration Tests:The U.K.
Former period Latter Period(1874–1920) (1953–1999)
bdyb 2.80 (p = 0.05) 0.55 (p = 0.65)[p = 0.97] [p = 0.16]
bcyb n.a. 2.41 (p = 0.08)[p = 0.17]
n2b 1.78 (p = 0.17) 1.45 (p = 0.24)[p = 0.87] [p = 0.23]
k2b 2.02 (p = 0.13) 2.27 (p = 0.10)[p = 0.87] [p = 0.27]
Reverse Causality (from Development to Finance)
bdyb 0.70 (p = 0.56) 2.66 (p = 0.06)bcyb n.a. 2.16 (p = 0.11)n2b 0.98 (p = 0.41) 1.53 (p = 0.22)k2b 0.88 (p = 0.46) 2.77 (p = 0.05)
Notes: See Table 1. n.a. indicates that the financial data is notavailable.
Here, the causation runs from financial variables to real economic activity, in the formerperiod moderately, and in the latter period more clearly. The reverse causation is also weaklypresent but it is weaker than the proper causation. In the U.S.A., therefore, the GS hypothesiscan be recognized in both periods, while Patrick’s hypothesis cannot be seen to hold.
Table 2 displays the proper causation and reverse causation in the U.K. The two periodsare identical with the U.S.A. Here, the data on commercial banks’ credit extension to privatesectors is not available for the former period. All groups have a cointegrating relationship. Inthe U.K. the proper causality appears more clearly in the former period than in the latter.Anyway it is not strong in either period. As for the reverse causality, it is quite clear in thelatter period. Hence one can recognize that Patrick’s hypothesis holds in this country in amoderate manner.
Finally, I turn to the Japanese case, the results of which are summarized in Table 3. All thethree-variable groups have a cointegrating relationship. A distinctive feature here is that thecontrast between the former and the latter periods: in the former period, all four financialvariables do not have causality on the economic activity, while in the latter, three out offour financial variables possess clear-cut causal roles. Also, throughout the two periods, thereverse causation (from real economic activity to financial variables) cannot be seen exceptone case involving k2 j in the former period. Regarding Japan, therefore, the GS hypothesiscan be seen to hold only in the latter period, and the tests indicate that Patrick’s hypothesishas not been relevant.
4. CONCLUDING REMARKS
This chapter has started by reviewing the work on the finance-development nexus, eitherusing single-equation regression analysis or time series analysis (TSA). The former part, afterreviewing the existing wok, suggested that, as far as the pursuit of causal chains betweenfinancial development and development of real activity is concerned, the time series analysis
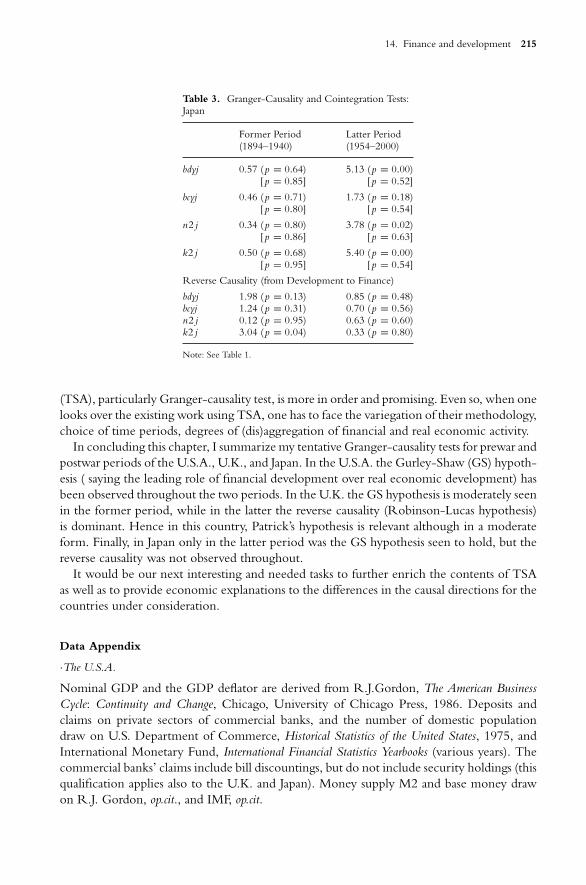
14. Finance and development 215
Table 3. Granger-Causality and Cointegration Tests:Japan
Former Period Latter Period(1894–1940) (1954–2000)
bdyj 0.57 (p = 0.64) 5.13 (p = 0.00)[p = 0.85] [p = 0.52]
bcyj 0.46 (p = 0.71) 1.73 (p = 0.18)[p = 0.80] [p = 0.54]
n2 j 0.34 (p = 0.80) 3.78 (p = 0.02)[p = 0.86] [p = 0.63]
k2 j 0.50 (p = 0.68) 5.40 (p = 0.00)[p = 0.95] [p = 0.54]
Reverse Causality (from Development to Finance)
bdyj 1.98 (p = 0.13) 0.85 (p = 0.48)bcyj 1.24 (p = 0.31) 0.70 (p = 0.56)n2 j 0.12 (p = 0.95) 0.63 (p = 0.60)k2 j 3.04 (p = 0.04) 0.33 (p = 0.80)
Note: See Table 1.
(TSA), particularly Granger-causality test, is more in order and promising. Even so, when onelooks over the existing work using TSA, one has to face the variegation of their methodology,choice of time periods, degrees of (dis)aggregation of financial and real economic activity.
In concluding this chapter, I summarize my tentative Granger-causality tests for prewar andpostwar periods of the U.S.A., U.K., and Japan. In the U.S.A. the Gurley-Shaw (GS) hypoth-esis ( saying the leading role of financial development over real economic development) hasbeen observed throughout the two periods. In the U.K. the GS hypothesis is moderately seenin the former period, while in the latter the reverse causality (Robinson-Lucas hypothesis)is dominant. Hence in this country, Patrick’s hypothesis is relevant although in a moderateform. Finally, in Japan only in the latter period was the GS hypothesis seen to hold, but thereverse causality was not observed throughout.
It would be our next interesting and needed tasks to further enrich the contents of TSAas well as to provide economic explanations to the differences in the causal directions for thecountries under consideration.
Data Appendix
·The U.S.A.
Nominal GDP and the GDP deflator are derived from R.J.Gordon, The American BusinessCycle: Continuity and Change, Chicago, University of Chicago Press, 1986. Deposits andclaims on private sectors of commercial banks, and the number of domestic populationdraw on U.S. Department of Commerce, Historical Statistics of the United States, 1975, andInternational Monetary Fund, International Financial Statistics Yearbooks (various years). Thecommercial banks’ claims include bill discountings, but do not include security holdings (thisqualification applies also to the U.K. and Japan). Money supply M2 and base money drawon R.J. Gordon, op.cit., and IMF, op.cit.
216 Masanori Amano
·The U.K.
Nominal GDP, M2 (U.K.’s M3), and base money draw on B.R. Mitchell, British HistoricalStatistics, Cambridge University Press, 1988, and IMF, op.cit. Deposits and claims on privatesectors of commercial banks, and the GDP deflator are derived from F. Capie and A. Webber,A Monetary History of the United Kingdom, 1870–1982, Vol. 1, 1985, and IMF, op.cit. Thenumber of population is derived from B.R. Mitchel, op.cit. and IMF, op.cit.
·Japan
Commercial banks’ claims on private sectors and deposits, and also the GDP deflator arederived from Japan Statistical Association, The Historical Statistics of Japan, Vol. 3, 1988, andthe Bank of Japan, Economic Statistics Annuals. M2 and base money draw on S. Fujino, MoneySupply in Japan, Keisoshobo, 1994, and the Bank of Japan, op.cit.
Nominal GDP is taken from K. Ohkawa et al., Long-Term Economic Statistics 1: NationalIncome, Toyokeizai-shinposha, 1974, and the Economic Planning Agency, National IncomeAccounting Annuals. The population is derived from M. Umemura et al., Long-Term EconomicStatistics 2: Labor Force, Toyokeizai- shinposha, 1988 and Toyokeizai Economic Statistics Annuals,Toyokeizai- shinposha.
ENDNOTES
1. The growth rates are the collection of the average of each country for some interval of years. Each group (vector)of explanatory variables is taken from each of sample countries. See Quah (1993) and Demetriades and Hussein(1996) for more details and some critiques of this procedure.
Along with the work mentioned above, Wallich (1969) can claim to be a pioneer of the field.2. Section 2 and part of Section 3 are based on and extend my previous discussion in Amano (2004).3. Patrick (1966) calls the second ‘the demand-following pattern.’ However, since ‘supply leading’ and ‘demand
following’ refer to the same situation, the second would better be called ‘demand-leading.’4. Patrick (1984) divides the Japanese financial development into four stages: (i) 1868-ca 1910, (ii) ca 1910–1936,
(iii) 1937–1952, and (iv) 1952- the1970s. Particularly, he underlines the bordering year 1945.5. In this case (of level variables), one does not need to incorporate the error correction mechanisms (see, e.g.,
Enders 1995). If I suppose the growth rate of qpoi or real GDP as a development index, the financial index wouldhave to be a flow variable, i.e., the growth rate or the difference of the indexes in the text. In any case, when Iput the growth of qpoi on the left-hand side, and the level on the right, the causality relations vanish in most ofthe cases.
6. The software package I used in this chapter is TSP, Version 4–5.
REFERENCES
Abramovitz, M., Rapid Growth Potential and Its Realization: The Experience of Capitalist Economies in thePostwar Period, in Malinvaud, E. (ed.), Economic Growth and Resources, Vol. 1, London, Macmillan, 1979.
Adelman, I., Theories of Economic Growth and Development, 2nd ed., Stanford, Stanford University Press, 1974.Amano, M., The Gurley-Shaw Hypothesis, Growth Regressions, and Granger-Causality, Chiba Journal of Economics,
Vol.19, 2004 (in press).Atje, R., Jovanovic, B., Stock Markets and Development, European Economic Review, Vol. 37, 1993, 632–640.Barro, R.J., Economic Growth in a Cross-Section of Countries, Quarterly Journal of Economics, Vol. 106, 1991,
407–443.——–, Determinants of Economic Growth: A Cross-Country Empirical Study, Cambridge, Mass., MIT Press, 1997.Beck, T., Levine, R., Loayza, N., Finance and Sources of Growth, Journal of Financial Economics, Vol. 58, 2000,
261–300.Benhabib, J., Spiegel, M.M., The Role of Financial Development in Growth and Investment, Journal of Economic
Growth, Vol. 5, 2000, 341–360.Demetriades, P.O., Hussein, K.A., Does Financial Development Cause Economic Growth? Time Series Evidence
from 16 Countries, Journal of Development Economics, Vol. 51, 1996, 387–411.
14. Finance and development 217
Denison, E.F., Why Growth Rates Differ, Washington, Brookings Institution, 1967.Ender, W., Applied Econometric Time Series, New York, J. Wiley, 1995.Fischer, S., Growth, Macroeconomics, and Development, in Blanchard, O.J., Fischer, S. (eds.), NBER Macroeconomics
Annual 1991, Cambridge, Mass., Cambridge University Press.——–, The Role of Macroeconomic Factors in Growth, Journal of Monetary Economics, Vol. 32, 1993, 485–512.Gerschenkron, A., Economic Backwardness in Historical Perspective, Cambridge, Mass., Harvard University Press, 1962.Greenwood, J., Jovanovic, B., Financial Development, Growth, and the Distribution of Income, Journal of Political
Economy, Vol. 98, 1990, 1076–1107.Gurley, J.G., Shaw, E.S., Financial Aspects of Economic Development, American Economic Review, Vol. 45, 1955,
515–538.——–, Money in a Theory of Finance, Washington, D.C., Brookings Institution, 1960.Hafer, R.W., Kutan, A.M., More Evidence on the Money-Output Relationship, Economic Inquiry, Vol. 35, 1997,
157–176.Jung, W.S., Financial Development and Economic Growth: International Evidence, Economic development and Cultural
Change, Vol. 34, 1986, 333–346.King, R.G., Levine, R., Finance and Growth: Schumpeter Might Be Right,Quarterly Journal of Economics, Vol. 108,
1993a, 717–737.——–, Finance, Entrepreneurship, and Growth: Theory and Evidence, Journal of Monetary Economics, Vol. 32, 1993b,
513–542.Kormendi, R.C., Meguire, P.G., Macroeconomic Determinants of Growth: Cross-Country Evidence, Journal of
Monetary Economics, Vol.16, 1985, 141–163.Kuznets, S., Economic Growth of Nations: Total Output and Production Structure, Cambridge, Mass., Harvard University
Press, 1971.Levine, R., Financial Development and Economic Growth: Views and Agenda, Journal of Economic Literature, Vol. 35,
1997, 688–726.Levine, R., Loayza, N., Beck, T., Financial Intermediation and Growth: Causality and Causes, Journal of Monetary
Economics, Vol. 46, 2000, 31–77.Levine, R., Renelt, D., A Sensitivity Analysis of Cross-Country Regressions, American Economic Review, Vol. 82,
1992, 942–963.Levine, R., Zervos, S., Stock Markets, Banks, and Economic Growth, American Economic Review, Vol. 88, 1998,
537–558.Lucas, R.E., Jr., On the Mechanics of Economic development, Journal of Monetary Economics, Vol. 22, 1988, 3–42.Mankiw, N.G., The Growth of Nations, Brooking Papers on Economic Activity, No. 1, 1995, 275–326.Mankiw, N.G., Romer, D., Weil, D., A Contribution to the Empirics of Economic Growth, Quarterly Journal of
Economics, Vol. 107, 1992, 407–437.Neusser, K., Kugler, M., Manufacturing Growth and Financial Development: Evidence from OECD Countries,
Review of Economic and Statistics, Vol. 80, 1998, 638–646.Pagano, M., Financial Markets and Growth: An Overview, European Economic Review, Vol. 37, 1993, 613–622.Patrick, H., Financial Development and Economic Growth in Underdeveloped Countries, Economic Development
and Cultural Change, Vol. 14, 1966, 174–189.——–, Japanese Financial Development in Historical Perspective, 1868–1980, in Ranis, G. et al. (eds.), Comparative
Development Perspectives, Co., Westview Press, 1984.Quah, D., Empirical Cross-Section Dynamics in Economic Growth, European Economic Review, Vol. 37, 1993,
426–434.Rajan, R.G., Zingale, L., Financial Dependence and Growth, American Economic Review, Vol. 88, 1998, 559–586.Reynolds, L.G., Development Theory in Classical Economics, in Ballasa, B., Nelson, R. (eds.), Economic Progress,
Private Values, and Public Policy: Essays in Honor of William Fellner, Amsterdam, North-Holland, 1977.Robinson, J., The Generalization of the General Theory, in her The Rate of Interest and Other Essays, London,
Macmillan, 1952.Rousseau, P., Wachtel, P., Financial Intermediation and Economic Performance: Historical Evidence from Five
Industrial Countries, Journal of Money, Credit, and Banking, Vol. 30, 1998, 651–678.Wachtel, P., Rousseau, P., Financial Intermediation and Economic Growth: A Historical Comparison of the United
States, United Kingdom, and Canada, in Bordo, M.D., Sylla, R. (eds.), Anglo-American Financial Systems: Insti-tutions and Markets in the Twentieth Century, New York, R. Irwin, 1995.
Wallich, H.C., Money and Growth: A Cross-Section Analysis, Journal of Money, Credit, and Banking, Vol. 1, 1969,281–302.
INDEX
Advanced Internal Rating Based Approach(IRB), 18
Approved deposit taking institutions (ADI), 46Asia 11, 145Australia, 45, 145Australian Prudential Regulation Authority
(APRA), 46
Bank for International Settlements (BIS), 1Banking reforms, 153Basel I, 2, 38Basel II, 3, 5, 33, 38Basel Committee on Banking Supervision, 1Bond markets, 77, 92, 93, 98, 196Brady bonds, 109, 113BOO (Build, Own, Operate) approach, 130BOT (Build, Own, Transfer) approach, 131
Capital games, 17Capital markets, 60, 134, 156, 161Capital market reforms, 152, 156Capital requirements, loans, 18China, 193China Chengxin Credit Management Co. Ltd.,
200China Liahne Credit Rating Co., Ltd., 201Collateral, 166Contingent value rights (CVR), 138Convertible preferred stocks, 140Corruption, 175Covered bonds, 24Credit ratings, 155, 193, 198Credit spreads, 109Crises (Indonesia), 177
Dagong Global Credit Rating Co., Ltd., 200Default risk, 203
Depositor protection, 46Developing countries, 9Diversification, 11, 13, 134
Economic development, 145, 147, 162, 169, 210Equity, 20Exchange rate reforms, 151
Financial reform, 80, 151Fragility of financial system, 10Free trade areas, 149
GATT, 148Global survey, 3, 10Globalization, 14, 77, 79, 81, 83, 88, 145, 161Goals, 12Government intervention, 25Grameen Foundation, USA, 161, 169Grameen Bank, 162Granger-Causality tests, 207
International Monetary Fund (IMF), 179Indonesia, 175Infrastructure financing, 130Investor protection, 71
Japan, 26, 77, 80, 207
Large, Complex, Financial Organizations(LCFOs), 1
Loss redistribution, 49
Microfinance, 162Models, 35
New Basel Capital Accord, see Basel IINew Zealand, 45
220 Index
OECD, 33, 45, 145
Privatization, 66, 149Procyclicality, 10Project contracts, 132Project bonds, 136, 137Project stocks, 137Project finance, 129Project stocks, 137Public-Private-Partnership (PPT), 131
Real sectors of the economy, 145Regulatory arbitrage, 18Regulatory framework (China), 194, 204Restructuring loans, 25Retained interest, 23Risk-based capital, 4Rule of Law, 185
Securitization, 22, 165Shanghai Fare East Credit Rating Co., Ltd., 199SHARE of India, 161Special purpose entities (SPE), 24Stock markets, 59, 66, 71, 77, 87, 92, 95, 97, 100Subordinated debt, 166
The 1988 Basel Capital Accord, See Basel ITrust preferred securities, 20
United Kingdom, 207United States of America, 25, 207
Variable interest entities, see Special purposeentities
Xinhau Financial Network (XFN) of XinhauFinance, 199