Embed Size (px)
Citation preview
CAPITAL MARKETS
62 EEI 2018 FINANCIAL REVIEW
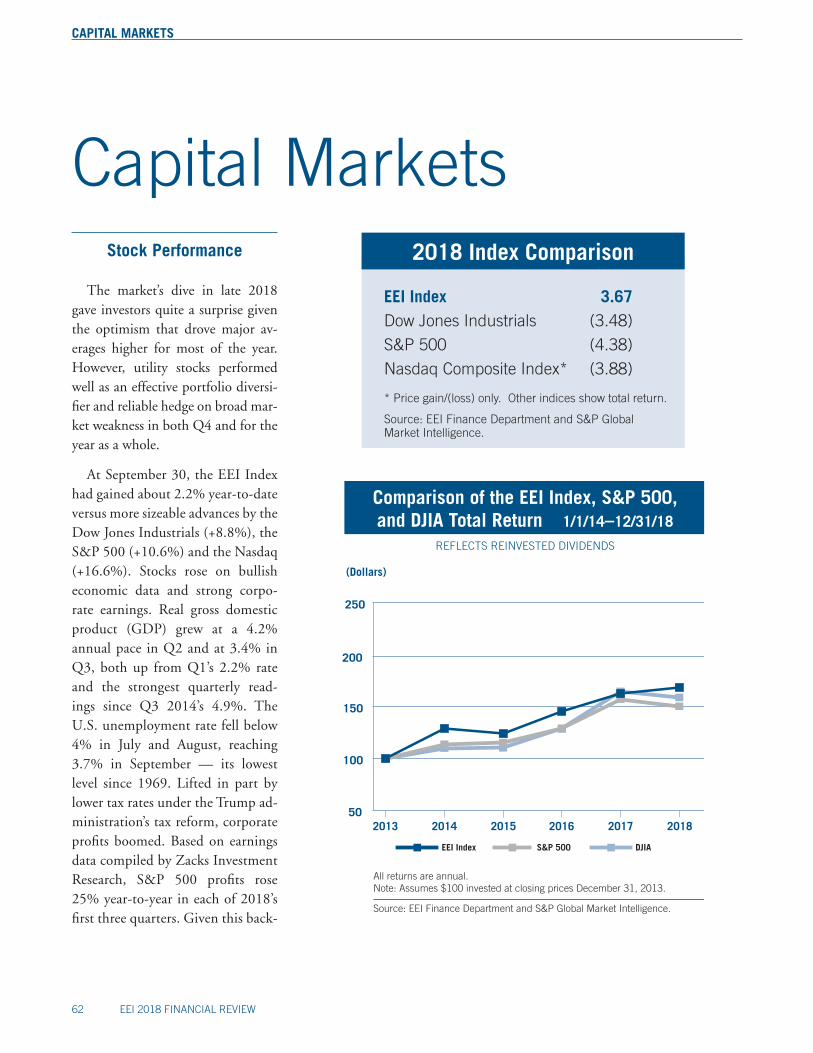
Comparison of the EEI Index, S&P 500,and DJIA Total Return 1/1/14–12/31/18
REFLECTS REINVESTED DIVIDENDS
All returns are annual.Note: Assumes $100 invested at closing prices December 31, 2013.
Source: EEI Finance Department and S&P Global Market Intelligence.
(Dollars)
DJIAS&P 500EEI Index
2016 2017 20182013 2014 201550
100
150
200
250
Capital MarketsStock Performance
The market’s dive in late 2018 gave investors quite a surprise given the optimism that drove major av-erages higher for most of the year. However, utility stocks performed well as an effective portfolio diversi-fier and reliable hedge on broad mar-ket weakness in both Q4 and for the year as a whole.
At September 30, the EEI Index had gained about 2.2% year-to-date versus more sizeable advances by the Dow Jones Industrials (+8.8%), the S&P 500 (+10.6%) and the Nasdaq (+16.6%). Stocks rose on bullish economic data and strong corpo-rate earnings. Real gross domestic product (GDP) grew at a 4.2% annual pace in Q2 and at 3.4% in Q3, both up from Q1’s 2.2% rate and the strongest quarterly read-ings since Q3 2014’s 4.9%. The U.S. unemployment rate fell below 4% in July and August, reaching 3.7% in September — its lowest level since 1969. Lifted in part by lower tax rates under the Trump ad-ministration’s tax reform, corporate profits boomed. Based on earnings data compiled by Zacks Investment Research, S&P 500 profits rose 25% year-to-year in each of 2018’s first three quarters. Given this back-
2018 Index Comparison
* Price gain/(loss) only. Other indices show total return.
Source: EEI Finance Department and S&P Global Market Intelligence.
EEI Index 3.67Dow Jones Industrials (3.48)
S&P 500 (4.38)
Nasdaq Composite Index* (3.88)
CAPITAL MARKETS
EEI 2018 FINANCIAL REVIEW 63
drop, it’s not surprising that utilities lagged the major averages.
The broad market had surged 40% since Trump’s 2016 election win and may have been primed for a correction. An excuse was given by emerging trade war tensions with China, disappointing global eco-nomic data late in the year (with a
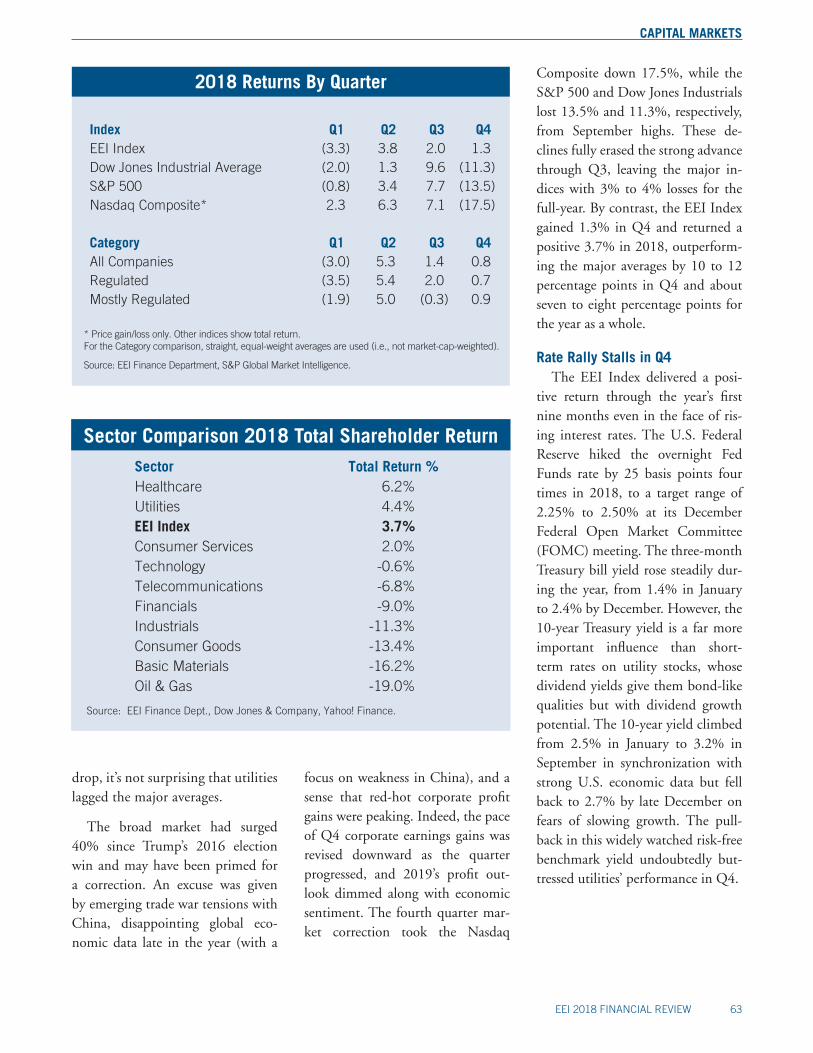
Index Q1 Q2 Q3 Q4EEI Index (3.3) 3.8 2.0 1.3Dow Jones Industrial Average (2.0) 1.3 9.6 (11.3)S&P 500 (0.8) 3.4 7.7 (13.5)Nasdaq Composite* 2.3 6.3 7.1 (17.5)
Category Q1 Q2 Q3 Q4All Companies (3.0) 5.3 1.4 0.8Regulated (3.5) 5.4 2.0 0.7Mostly Regulated (1.9) 5.0 (0.3) 0.9
2018 Returns By Quarter
* Price gain/loss only. Other indices show total return.For the Category comparison, straight, equal-weight averages are used (i.e., not market-cap-weighted).
Source: EEI Finance Department, S&P Global Market Intelligence.
Sector Comparison 2018 Total Shareholder Return
Sector Total Return %Healthcare 6.2%Utilities 4.4%EEI Index 3.7%Consumer Services 2.0%Technology -0.6%Telecommunications -6.8%Financials -9.0%Industrials -11.3%Consumer Goods -13.4%Basic Materials -16.2%Oil & Gas -19.0%
Source: EEI Finance Dept., Dow Jones & Company, Yahoo! Finance.
focus on weakness in China), and a sense that red-hot corporate profit gains were peaking. Indeed, the pace of Q4 corporate earnings gains was revised downward as the quarter progressed, and 2019’s profit out-look dimmed along with economic sentiment. The fourth quarter mar-ket correction took the Nasdaq
Composite down 17.5%, while the S&P 500 and Dow Jones Industrials lost 13.5% and 11.3%, respectively, from September highs. These de-clines fully erased the strong advance through Q3, leaving the major in-dices with 3% to 4% losses for the full-year. By contrast, the EEI Index gained 1.3% in Q4 and returned a positive 3.7% in 2018, outperform-ing the major averages by 10 to 12 percentage points in Q4 and about seven to eight percentage points for the year as a whole.
Rate Rally Stalls in Q4The EEI Index delivered a posi-
tive return through the year’s first nine months even in the face of ris-ing interest rates. The U.S. Federal Reserve hiked the overnight Fed Funds rate by 25 basis points four times in 2018, to a target range of 2.25% to 2.50% at its December Federal Open Market Committee (FOMC) meeting. The three-month Treasury bill yield rose steadily dur-ing the year, from 1.4% in January to 2.4% by December. However, the 10-year Treasury yield is a far more important influence than short-term rates on utility stocks, whose dividend yields give them bond-like qualities but with dividend growth potential. The 10-year yield climbed from 2.5% in January to 3.2% in September in synchronization with strong U.S. economic data but fell back to 2.7% by late December on fears of slowing growth. The pull-back in this widely watched risk-free benchmark yield undoubtedly but-tressed utilities’ performance in Q4.

CAPITAL MARKETS
64 EEI 2018 FINANCIAL REVIEW
50
75
100
125
150
175
200
225
20182017201620152014
Comparative Category Total Annual Returns 2014–2018
U.S. INVESTOR-OWNED ELECTRIC UTILITIES, VALUE OF $100 INVESTED AT CLOSE ON 12/31/2013
EEI Index
Regulated
Mostly Regulated
Diversified
(Dollars)
- For the Category Comparison, straight, equal-weight averages are used (i.e., not market-cap-weighted).- Cumulative Return assumes $100 invested at closing prices on December 31, 2013.
Source: EEI Finance Dept., S&P Global Market Intelligence.
2014 2015 2016 2017 2018 EEI Index Annual Return (%) 27.63 (2.05) 22.21 11.56 4.28 EEI Index Cumulative Return ($) 127.63 125.01 152.77 170.43 177.73
Regulated EEI Index Annual Return 28.92 (0.67) 21.16 11.66 4.55 Regulated EEI Index Cumulative Return 128.92 128.05 155.15 173.24 181.11
Mostly Regulated EEI Index Annual Return 27.46 (3.67) 24.57 11.32 3.62 Mostly Regulated EEI Index Cumulative Return 127.46 122.78 152.94 170.26 176.42
Diversified EEI Index Annual Return 6.61 (14.43) 25.59 – –Diversified EEI Index Cumulative Return 106.61 91.23 114.57 – –
CAPITAL MARKETS
EEI 2018 FINANCIAL REVIEW 65
Power Demand Rises 3% in 2018Short-term changes in power de-
mand that impact utilities’ revenue generally result from fluctuations in weather. These rarely shift long-term utility stock trends since the ef-fect is small and transitory. But they can slightly boost or detract from quarterly earnings and may, in some cases, illuminate tightening supply trends in power markets with po-tential for new generation build and rate base growth.
A hot summer across much of the U.S. powered electricity demand higher in 2018. Electric output grew by 4.2% in Q3 and by 3.1% for the full-year, reaching a record high that marginally surpassed 2007’s total output. The gain was largely due to weather, as weather-adjusted output was flat year-to-year. National Oceanic and Atmospheric Administration (NOAA) data shows nationwide cooling degree days — a measure of air conditioning de-
2018 Category Comparison Category
EEI Index 4.28 Regulated 4.55 Mostly Regulated 3.62
Return (%)
* Returns shown here are unweighted averages of constituent company returns. The EEI Index return shown in the 2018 Index Comparison table is cap-weighted.
Source: EEI Finance Department, S&P Global Market Intelligence, and company annual reports.
mand — were 14% higher in Q3 2018 than their 10-year average, and 17% higher versus the same quarter last year. California’s statewide aver-age temperature in July surpassed the previous record set in 1931 and the Energy Information Administration (EIA) reports that record-high tem-peratures in the western U.S. drove peak wholesale electricity prices in July to their highest level since 2008. Eastern seaboard temperatures were hot as well; cooling degree days were 45% above the 10-year average in New England and 30% higher in the mid-Atlantic region.
However, electricity demand has been flat in recent years due to energy efficiency measures and the slow ero-sion in industrial demand from the changing structure of the U.S. econo-my. Nationwide demand fell 2.0% in 2017, the largest year-to-year decline since the 2009 recession year. The temporary lift from 2018’s weather
is unlikely to alter the slow demand-growth outlook facing the industry.
Steady FundamentalsThere was little change in the in-
dustry’s generally good business fun-damentals in 2018.
Demand growth during the key summer cooling season helped pow-er electric utility industry earnings up about 10% year-to-year in Q3. Wall Street analysts also reported that many utility managements in Q4 affirmed and/or slightly raised 2018 earnings guidance along with their capex and rate base growth out-looks for the next several years.
Most utilities have exited unregu-lated operations and are now seeking earnings growth from regulated rate base investment programs. Most are targeting earnings per share growth rates in the mid-single digits, along with similar dividend growth targets. Investment programs include new renewables generation and new gas-
CAPITAL MARKETS
66 EEI 2018 FINANCIAL REVIEW
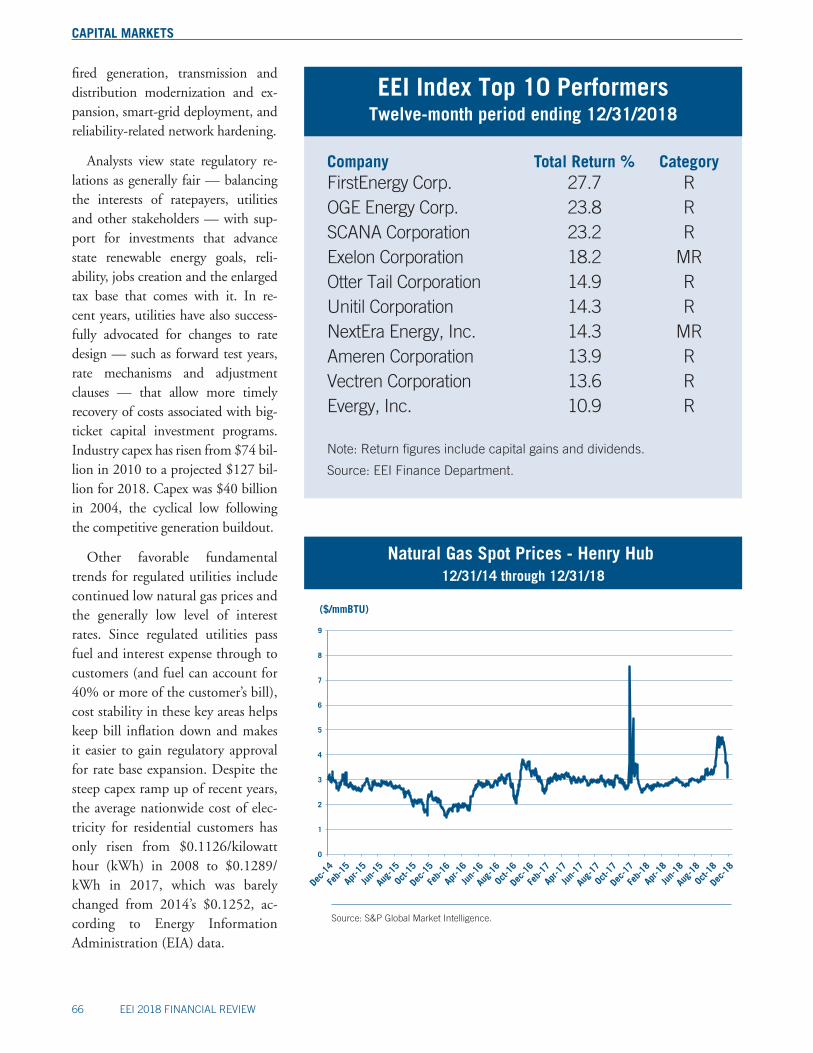
EEI Index Top 10 PerformersTwelve-month period ending 12/31/2018
Company Total Return % CategoryFirstEnergy Corp. 27.7 ROGE Energy Corp. 23.8 RSCANA Corporation 23.2 RExelon Corporation 18.2 MROtter Tail Corporation 14.9 RUnitil Corporation 14.3 RNextEra Energy, Inc. 14.3 MRAmeren Corporation 13.9 RVectren Corporation 13.6 REvergy, Inc. 10.9 R
Note: Return figures include capital gains and dividends.
Source: EEI Finance Department.
fired generation, transmission and distribution modernization and ex-pansion, smart-grid deployment, and reliability-related network hardening.
Analysts view state regulatory re-lations as generally fair — balancing the interests of ratepayers, utilities and other stakeholders — with sup-port for investments that advance state renewable energy goals, reli-ability, jobs creation and the enlarged tax base that comes with it. In re-cent years, utilities have also success-fully advocated for changes to rate design — such as forward test years, rate mechanisms and adjustment clauses — that allow more timely recovery of costs associated with big-ticket capital investment programs. Industry capex has risen from $74 bil-lion in 2010 to a projected $127 bil-lion for 2018. Capex was $40 billion in 2004, the cyclical low following the competitive generation buildout.
Other favorable fundamental trends for regulated utilities include continued low natural gas prices and the generally low level of interest rates. Since regulated utilities pass fuel and interest expense through to customers (and fuel can account for 40% or more of the customer’s bill), cost stability in these key areas helps keep bill inflation down and makes it easier to gain regulatory approval for rate base expansion. Despite the steep capex ramp up of recent years, the average nationwide cost of elec-tricity for residential customers has only risen from $0.1126/kilowatt hour (kWh) in 2008 to $0.1289/kWh in 2017, which was barely changed from 2014’s $0.1252, ac-cording to Energy Information Administration (EIA) data.
Natural Gas Spot Prices - Henry Hub 12/31/14 through 12/31/18
($/mmBTU)
Source: S&P Global Market Intelligence.
0
1
2
3
4
5
6
7
8
9
Dec-
14Fe
b-15
Apr-1
5Ju
n-15
Aug-
15Oc
t-15
Feb-
16
Dec-
15
Apr-1
6Ju
n-16
Aug-
16Oc
t-16
Dec-
16Fe
b-17
Apr-1
7Ju
n-17
Aug-
17Oc
t-17
Dec-
17Fe
b-18
Apr-1
8Ju
n-18
Aug-
18Oc
t-18
Dec-
18

CAPITAL MARKETS
EEI 2018 FINANCIAL REVIEW 67
Historically Elevated ValuationsBy year-end 2018, Wall Street
analysts were unanimous in observ-ing that the industry’s stock valua-tions seemed high whether measured in absolute price/earnings (PE) ra-tios, PEs relative to the S&P 500, or dividend/earnings yields relative to interest rates. By year-end 2018, all metrics were near the top of their range in recent years. The industry’s PE on 2019 earnings is roughly 19, more than the S&P 500’s and al-most double the electric utility in-dustry’s 10 to 12 PE multiple in the late 1990s. Of course, the 10-year Treasury yield was about 6% in the late 1990s, also about double today’s sub-3% level.
NYMEX Natural Gas Futures February 2019 through December 2022
Source: S&P Global Market Intelligence.
($/mmBTU)
1
2
3
4
5
6
12/31/1712/31/18 12/31/16 12/31/15 12/31/14
Feb 2
019
May 2
019
Aug 2
019
Nov 2
019
Feb 2
020
May 2
020
Aug 2
020
Nov 2
020
Feb 2
021
May 2
021
Aug 2
021
Nov 2
021
Feb 2
022
May 2
022
Aug 2
022
Nov 2
022
Low interest rates are no doubt partly responsible for today’s seem-ingly lofty valuations. But industry fundamentals are too. Utilities of-fer investors the appealing package of mid-single-digit earnings growth and a 3% dividend yield with divi-dend growth potential, all generated by investment programs that have fairly high predictability, relatively low execution risk and support from state regulators. S&P 500 earnings by contrast are more cyclical and far more subject to the whims of the economic cycle.
It’s hard to predict with any cer-tainty the long-run impact of electric vehicle adoption, energy efficiency measures, energy storage innovation, smart-grid transformation, rising
demand for renewable power, along with the public’s need for reliable power around the clock. But it’s likely that the industry will maintain a key role in transforming and modernizing the nation’s power network into a true 21st century grid. And much of the nation’s aging baseload generation in-frastructure will require replacement in the decades ahead, which could extend the visible horizon for utility capex and rate base growth.
Rising Interest Rates Seen as Main Risk
Utility stock moves are caused more by shifts in macroeconomic data and fast-changing investor sentiment than changes in fundamental outlooks — except when company-specific events impact individual utilities.
Merger and acquisition (M&A) activity is one company-specific theme. Industry consolidation has been a structural trend for many years; the universe of U.S. inves-tor-owned electric utilities tracked by EEI has fallen to 42 at year-end 2018 from 83 at the start of 2000. Dominion announced in early January 2018 that it would seek to buy neighboring utility SCANA. In April 2018, CenterPoint Energy an-nounced a bid for Vectren — a deal the companies said was motivated by synergistic growth opportuni-ties in natural gas distribution. Both utilities were among the top-ten per-formers in the EEI Index in 2018. Several other smaller utilities in the Regulated category also made the top-ten list; these may have received some price support from speculation over potential M&A activity.
CAPITAL MARKETS
68 EEI 2018 FINANCIAL REVIEW
Market Capitalization at December 31, 2018 (in $MM)U.S. INVESTOR-OWNED ELECTRIC UTILITIES
Company Name Ticker Market Cap. % of Total
NextEra Energy, Inc. NEE 82,234 11.24%
Duke Energy Corporation DUK 61,532 8.41%
Dominion Energy, Inc. D 46,728 6.39%
Southern Company SO 44,930 6.14%
Exelon Corporation EXC 43,657 5.97%
American Electric Power Company, Inc. AEP 36,846 5.04%
Sempra Energy SRE 29,638 4.05%
Public Service Enterprise Group Inc. PEG 26,233 3.59%
Xcel Energy Inc. XEL 25,128 3.44%
Consolidated Edison, Inc. ED 23,787 3.25%
WEC Energy Group, Inc. WEC 21,852 2.99%
Eversource Energy ES 20,641 2.82%
DTE Energy Company DTE 20,075 2.75%
PPL Corporation PPL 19,937 2.73%
FirstEnergy Corp. FE 18,888 2.58%
Edison International EIX 18,507 2.53%
Ameren Corporation AEE 15,923 2.18%
Entergy Corporation ETR 15,579 2.13%
AVANGRID, Inc. AGR 15,502 2.12%
Evergy, Inc. EVRG 15,248 2.09%
CMS Energy Corporation CMS 14,026 1.92%
Company Name Ticker Market Cap. % of Total
PG&E Corporation PCG 12,279 1.68%
CenterPoint Energy, Inc. CNP 12,183 1.67%
Alliant Energy Corporation LNT 9,937 1.36%
Pinnacle West Capital Corporation PNW 9,555 1.31%
NiSource Inc. NI 9,225 1.26%
OGE Energy Corp. OGE 7,826 1.07%
SCANA Corporation SCG 6,833 0.93%
Vectren Corporation VVC 5,982 0.82%
IDACORP, Inc. IDA 4,693 0.64%
MDU Resources Group, Inc. MDU 4,673 0.64%
Portland General Electric Company POR 4,092 0.56%
Hawaiian Electric Industries, Inc. HE 3,987 0.55%
ALLETE, Inc. ALE 3,918 0.54%
Black Hills Corporation BKH 3,350 0.46%
PNM Resources, Inc. PNM 3,282 0.45%
NorthWestern Corporation NWE 2,991 0.41%
Avista Corporation AVA 2,790 0.38%
MGE Energy, Inc. MGEE 2,079 0.28%
El Paso Electric Company EE 2,032 0.28%
Otter Tail Corporation OTTR 1,967 0.27%
Unitil Corporation UTL 751 0.10%
Total Industry 731,313 100%Source: EEI Finance Department and S&P Global Market Intelligence.
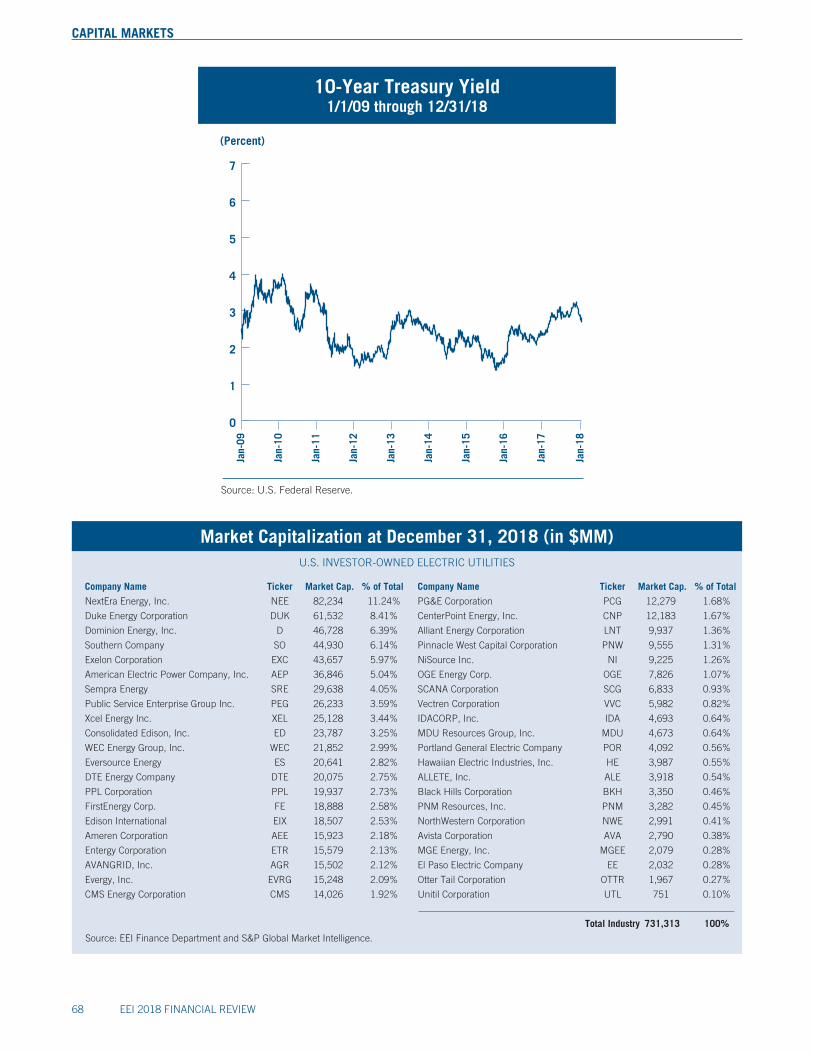
Source: U.S. Federal Reserve.
10-Year Treasury Yield1/1/09 through 12/31/18
0
1
2
3
4
5
6
7
(Percent)
Jan-
09
Jan-
10
Jan-
11
Jan-
12
Jan-
13
Jan-
14
Jan-
15
Jan-
16
Jan-
17
Jan-
18
CAPITAL MARKETS
EEI 2018 FINANCIAL REVIEW 69
200
250
300
350
400
450
500
550
600
650
($ Billions)
2010 2011 2012 2013 2014 2015 2016 2017
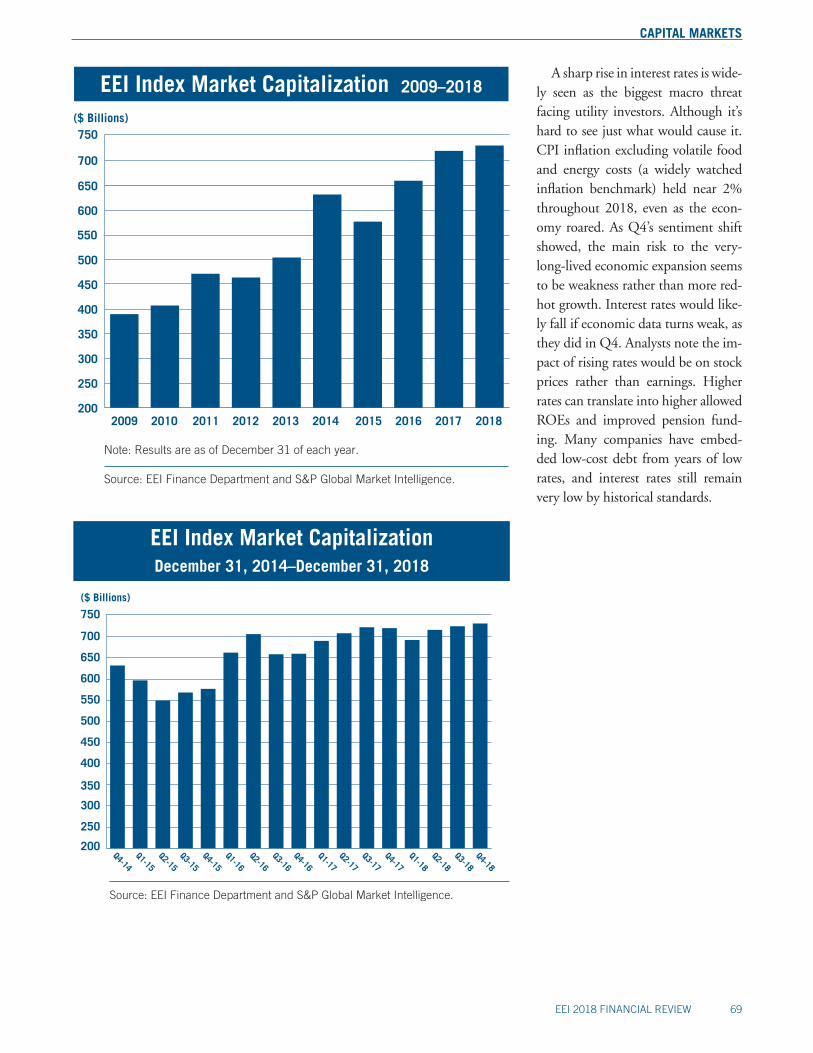
EEI Index Market Capitalization 2009–2018
Note: Results are as of December 31 of each year.
Source: EEI Finance Department and S&P Global Market Intelligence.
2009
700
750
2018
EEI Index Market CapitalizationDecember 31, 2014–December 31, 2018
Source: EEI Finance Department and S&P Global Market Intelligence.
($ Billions)
Q2-17Q3-17
Q1-17Q4-14
Q1-15Q2-15
Q3-15Q4-15
Q4-18Q2-16
Q3-16Q1-16
Q4-16Q2-18
Q3-18Q1-18
Q4-17
200
250
300
350
400
450
500
550
600
650
700
750
A sharp rise in interest rates is wide-ly seen as the biggest macro threat facing utility investors. Although it’s hard to see just what would cause it. CPI inflation excluding volatile food and energy costs (a widely watched inflation benchmark) held near 2% throughout 2018, even as the econ-omy roared. As Q4’s sentiment shift showed, the main risk to the very-long-lived economic expansion seems to be weakness rather than more red-hot growth. Interest rates would like-ly fall if economic data turns weak, as they did in Q4. Analysts note the im-pact of rising rates would be on stock prices rather than earnings. Higher rates can translate into higher allowed ROEs and improved pension fund-ing. Many companies have embed-ded low-cost debt from years of low rates, and interest rates still remain very low by historical standards.
CAPITAL MARKETS
70 EEI 2018 FINANCIAL REVIEW
-30
-20
-10
0
10
20
30
40
50
60
70
80
Note: Data presents the number of occurrences and includes each event, even if multiple actions occurred for a single company.
Source: Fitch Ratings, Moody’s, and Standard & Poor’s.
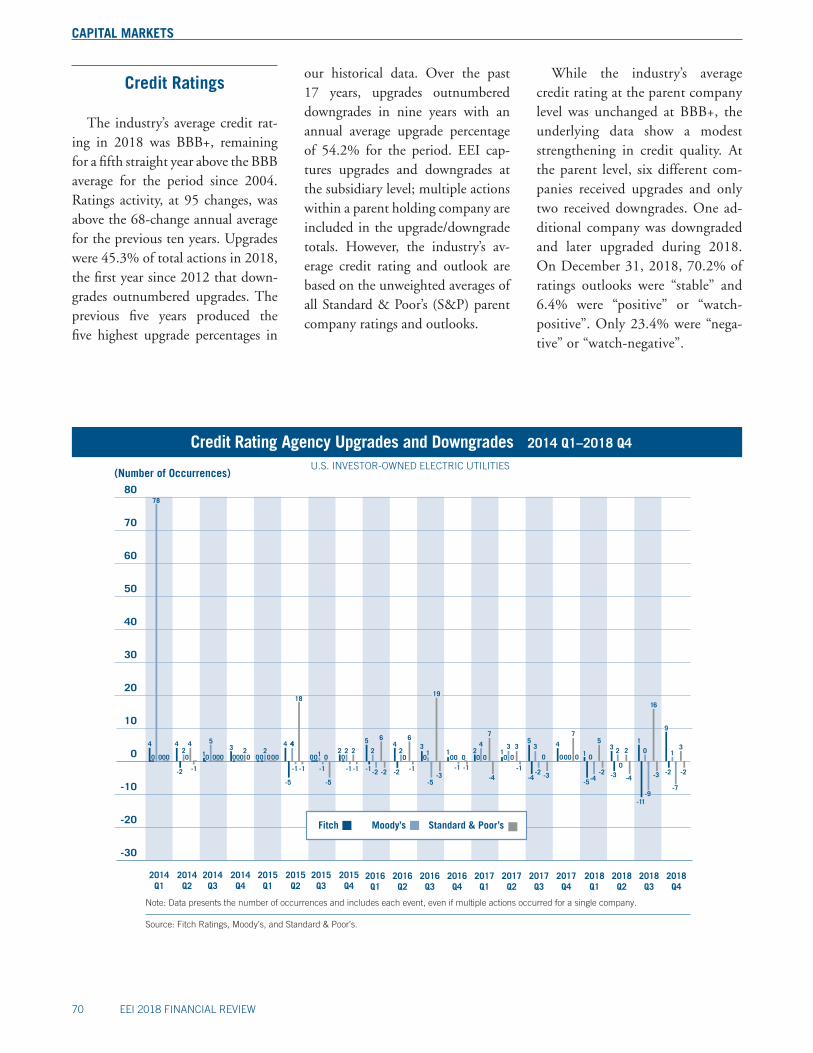
Credit Rating Agency Upgrades and Downgrades 2014 Q1–2018 Q4
(Number of Occurrences)
2014Q1
2014Q2
2014Q3
2014Q4
2015Q1
2015Q2
2015Q3
2015Q4
2016Q1
2016Q2
2016Q3
2016Q4
2017Q1
2017Q2
2017Q3
2017Q4
2018Q1
2018Q2
2018Q3
2018Q4
U.S. INVESTOR-OWNED ELECTRIC UTILITIES
-1
0
4
78
20
-2
4 4 4 44
-5 -5
-1 -1 -1 -1
5
01 12 20
3000 000 00 0 00 00 00
202
-1
200
18
5 5
-1-2
2
6
-2
1
-5-4
0
5
-2
3
-30
2 2
-4
1
-11-9
0
16
-3
9
-2
-7
13
-2
4 4 4
02 2
6 7 7
-1-2 -2
3 3 3 3
0
-5
1
-3 -3-4 -4
1 10 0 0
-10 0 0 0 00 0 0 0
-1 -1
19
our historical data. Over the past 17 years, upgrades outnumbered downgrades in nine years with an annual average upgrade percentage of 54.2% for the period. EEI cap-tures upgrades and downgrades at the subsidiary level; multiple actions within a parent holding company are included in the upgrade/downgrade totals. However, the industry’s av-erage credit rating and outlook are based on the unweighted averages of all Standard & Poor’s (S&P) parent company ratings and outlooks.
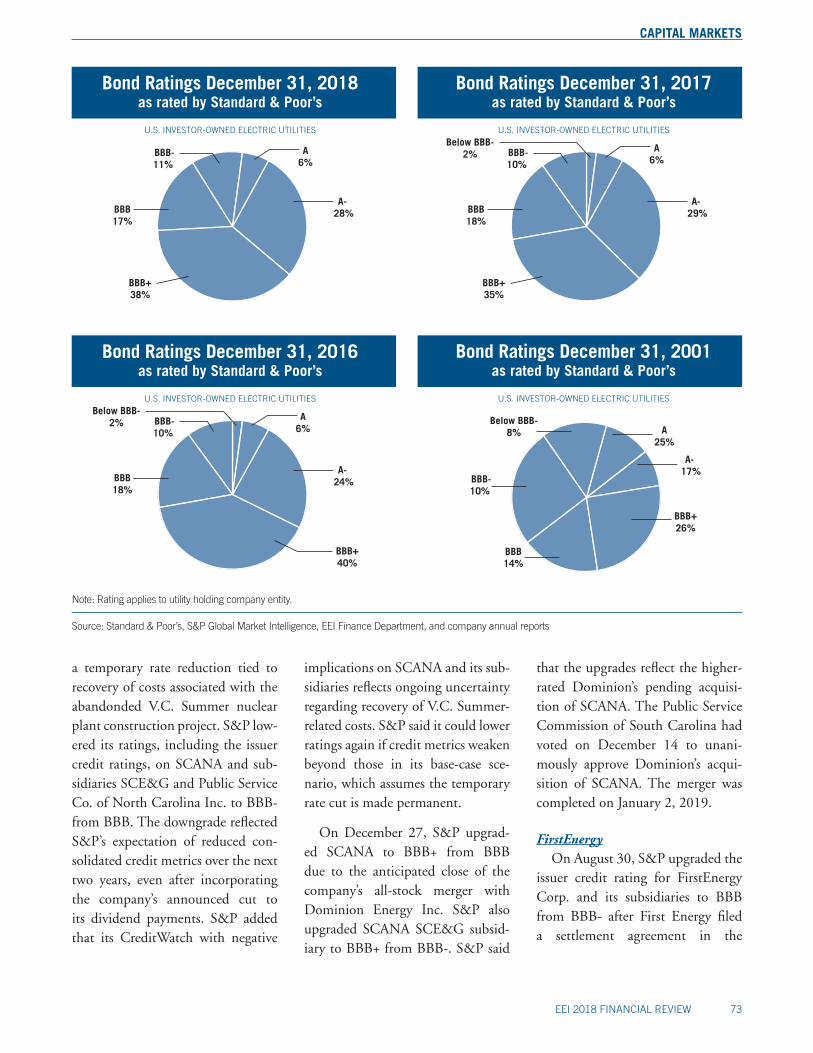
While the industry’s average credit rating at the parent company level was unchanged at BBB+, the underlying data show a modest strengthening in credit quality. At the parent level, six different com-panies received upgrades and only two received downgrades. One ad-ditional company was downgraded and later upgraded during 2018. On December 31, 2018, 70.2% of ratings outlooks were “stable” and 6.4% were “positive” or “watch-positive”. Only 23.4% were “nega-tive” or “watch-negative”.
Credit Ratings
The industry’s average credit rat-ing in 2018 was BBB+, remaining for a fifth straight year above the BBB average for the period since 2004. Ratings activity, at 95 changes, was above the 68-change annual average for the previous ten years. Upgrades were 45.3% of total actions in 2018, the first year since 2012 that down-grades outnumbered upgrades. The previous five years produced the five highest upgrade percentages in
CAPITAL MARKETS
EEI 2018 FINANCIAL REVIEW 71
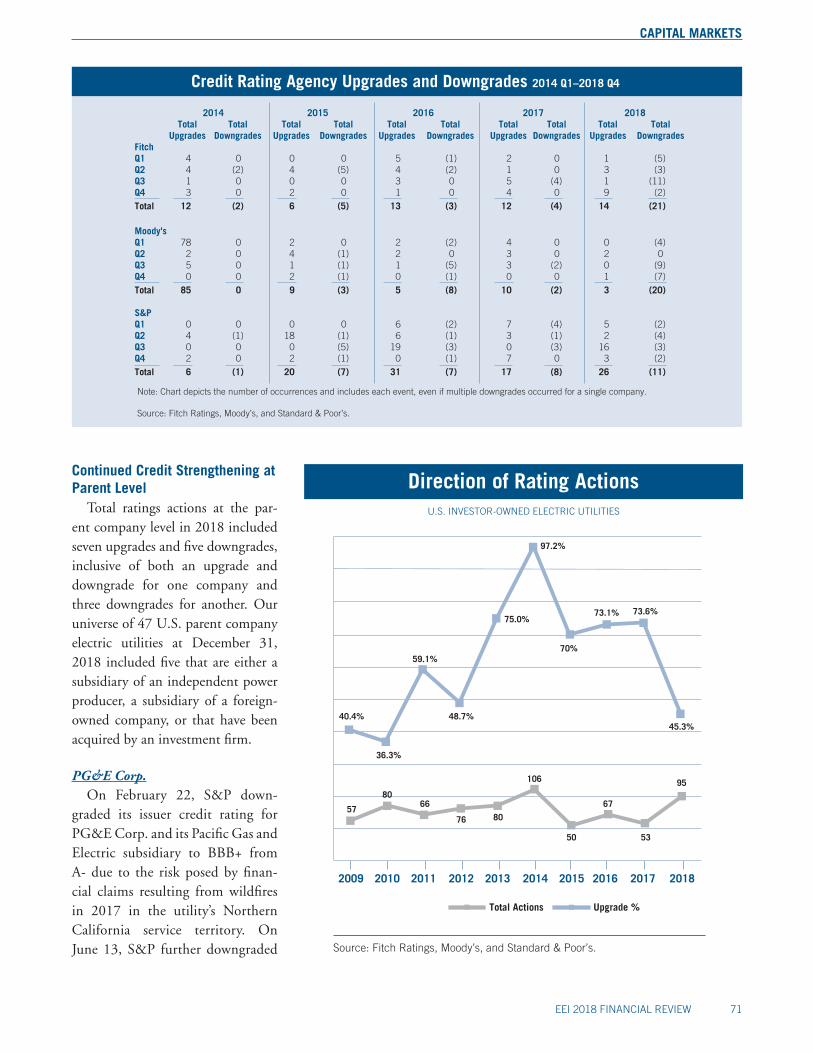
Total Actions Upgrade %
Direction of Rating Actions
Source: Fitch Ratings, Moody’s, and Standard & Poor’s.
U.S. INVESTOR-OWNED ELECTRIC UTILITIES
2015 20162009 2010 2011 2012
59.1%
75.0%
97.2%
70%
48.7%40.4%45.3%
36.3%
2013 2014
66
76 80
50 53
57
95106
80
73.1% 73.6%
67
20182017
Continued Credit Strengthening at Parent Level
Total ratings actions at the par-ent company level in 2018 included seven upgrades and five downgrades, inclusive of both an upgrade and downgrade for one company and three downgrades for another. Our universe of 47 U.S. parent company electric utilities at December 31, 2018 included five that are either a subsidiary of an independent power producer, a subsidiary of a foreign-owned company, or that have been acquired by an investment firm.
PG&E Corp.On February 22, S&P down-
graded its issuer credit rating for PG&E Corp. and its Pacific Gas and Electric subsidiary to BBB+ from A- due to the risk posed by finan-cial claims resulting from wildfires in 2017 in the utility’s Northern California service territory. On June 13, S&P further downgraded
Note: Chart depicts the number of occurrences and includes each event, even if multiple downgrades occurred for a single company.
Source: Fitch Ratings, Moody’s, and Standard & Poor’s.
2014 2015 2016 2017 2018 Total Total Total Total Total Total Total Total Total Total Upgrades Downgrades Upgrades Downgrades Upgrades Downgrades Upgrades Downgrades Upgrades DowngradesFitch Q1 4 0 0 0 5 (1) 2 0 1 (5)Q2 4 (2) 4 (5) 4 (2) 1 0 3 (3)Q3 1 0 0 0 3 0 5 (4) 1 (11)Q4 3 0 2 0 1 0 4 0 9 (2)Total 12 (2) 6 (5) 13 (3) 12 (4) 14 (21)
Moody's Q1 78 0 2 0 2 (2) 4 0 0 (4)Q2 2 0 4 (1) 2 0 3 0 2 0 Q3 5 0 1 (1) 1 (5) 3 (2) 0 (9) Q4 0 0 2 (1) 0 (1) 0 0 1 (7)Total 85 0 9 (3) 5 (8) 10 (2) 3 (20)
S&P Q1 0 0 0 0 6 (2) 7 (4) 5 (2)Q2 4 (1) 18 (1) 6 (1) 3 (1) 2 (4)Q3 0 0 0 (5) 19 (3) 0 (3) 16 (3)Q4 2 0 2 (1) 0 (1) 7 0 3 (2)Total 6 (1) 20 (7) 31 (7) 17 (8) 26 (11)
Credit Rating Agency Upgrades and Downgrades 2014 Q1–2018 Q4
CAPITAL MARKETS
72 EEI 2018 FINANCIAL REVIEW
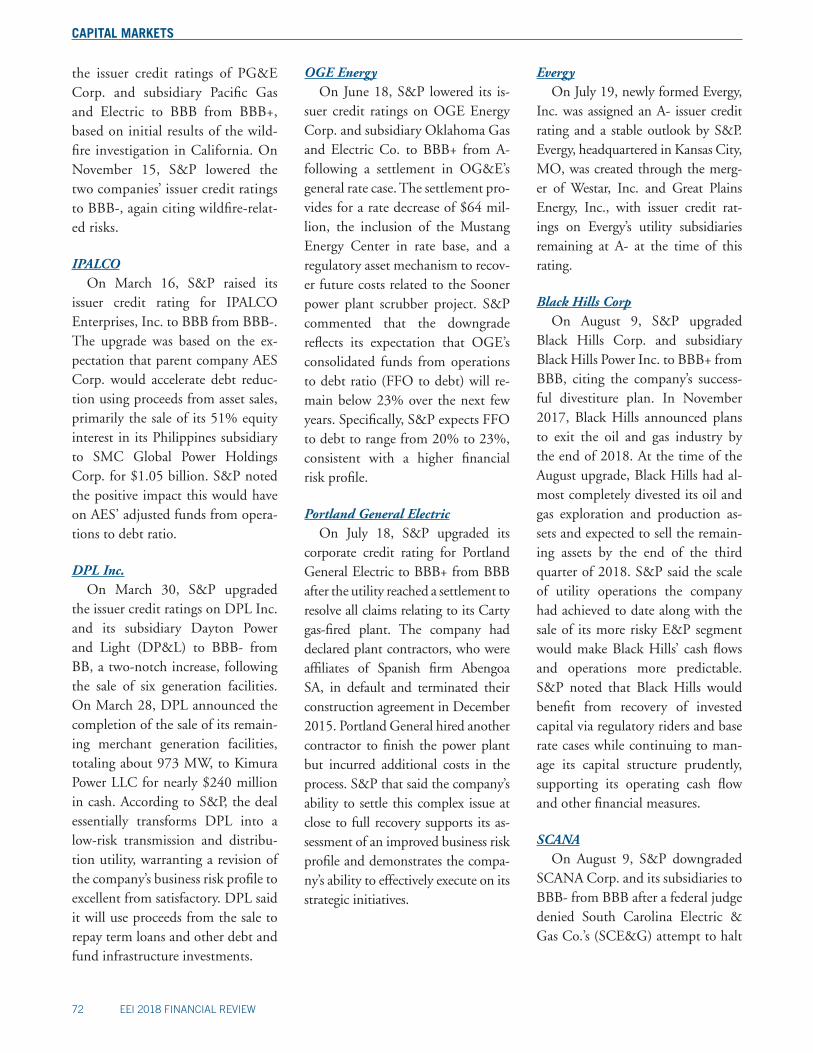
the issuer credit ratings of PG&E Corp. and subsidiary Pacific Gas and Electric to BBB from BBB+, based on initial results of the wild-fire investigation in California. On November 15, S&P lowered the two companies’ issuer credit ratings to BBB-, again citing wildfire-relat-ed risks.
IPALCOOn March 16, S&P raised its
issuer credit rating for IPALCO Enterprises, Inc. to BBB from BBB-. The upgrade was based on the ex-pectation that parent company AES Corp. would accelerate debt reduc-tion using proceeds from asset sales, primarily the sale of its 51% equity interest in its Philippines subsidiary to SMC Global Power Holdings Corp. for $1.05 billion. S&P noted the positive impact this would have on AES’ adjusted funds from opera-tions to debt ratio.
DPL Inc.On March 30, S&P upgraded
the issuer credit ratings on DPL Inc. and its subsidiary Dayton Power and Light (DP&L) to BBB- from BB, a two-notch increase, following the sale of six generation facilities. On March 28, DPL announced the completion of the sale of its remain-ing merchant generation facilities, totaling about 973 MW, to Kimura Power LLC for nearly $240 million in cash. According to S&P, the deal essentially transforms DPL into a low-risk transmission and distribu-tion utility, warranting a revision of the company’s business risk profile to excellent from satisfactory. DPL said it will use proceeds from the sale to repay term loans and other debt and fund infrastructure investments.
OGE EnergyOn June 18, S&P lowered its is-
suer credit ratings on OGE Energy Corp. and subsidiary Oklahoma Gas and Electric Co. to BBB+ from A- following a settlement in OG&E’s general rate case. The settlement pro-vides for a rate decrease of $64 mil-lion, the inclusion of the Mustang Energy Center in rate base, and a regulatory asset mechanism to recov-er future costs related to the Sooner power plant scrubber project. S&P commented that the downgrade reflects its expectation that OGE’s consolidated funds from operations to debt ratio (FFO to debt) will re-main below 23% over the next few years. Specifically, S&P expects FFO to debt to range from 20% to 23%, consistent with a higher financial risk profile.
Portland General ElectricOn July 18, S&P upgraded its
corporate credit rating for Portland General Electric to BBB+ from BBB after the utility reached a settlement to resolve all claims relating to its Carty gas-fired plant. The company had declared plant contractors, who were affiliates of Spanish firm Abengoa SA, in default and terminated their construction agreement in December 2015. Portland General hired another contractor to finish the power plant but incurred additional costs in the process. S&P that said the company’s ability to settle this complex issue at close to full recovery supports its as-sessment of an improved business risk profile and demonstrates the compa-ny’s ability to effectively execute on its strategic initiatives.
EvergyOn July 19, newly formed Evergy,
Inc. was assigned an A- issuer credit rating and a stable outlook by S&P. Evergy, headquartered in Kansas City, MO, was created through the merg-er of Westar, Inc. and Great Plains Energy, Inc., with issuer credit rat-ings on Evergy’s utility subsidiaries remaining at A- at the time of this rating.
Black Hills CorpOn August 9, S&P upgraded
Black Hills Corp. and subsidiary Black Hills Power Inc. to BBB+ from BBB, citing the company’s success-ful divestiture plan. In November 2017, Black Hills announced plans to exit the oil and gas industry by the end of 2018. At the time of the August upgrade, Black Hills had al-most completely divested its oil and gas exploration and production as-sets and expected to sell the remain-ing assets by the end of the third quarter of 2018. S&P said the scale of utility operations the company had achieved to date along with the sale of its more risky E&P segment would make Black Hills’ cash flows and operations more predictable. S&P noted that Black Hills would benefit from recovery of invested capital via regulatory riders and base rate cases while continuing to man-age its capital structure prudently, supporting its operating cash flow and other financial measures.
SCANAOn August 9, S&P downgraded
SCANA Corp. and its subsidiaries to BBB- from BBB after a federal judge denied South Carolina Electric & Gas Co.’s (SCE&G) attempt to halt
CAPITAL MARKETS
EEI 2018 FINANCIAL REVIEW 73
a temporary rate reduction tied to recovery of costs associated with the abandonded V.C. Summer nuclear plant construction project. S&P low-ered its ratings, including the issuer credit ratings, on SCANA and sub-sidiaries SCE&G and Public Service Co. of North Carolina Inc. to BBB- from BBB. The downgrade reflected S&P’s expectation of reduced con-solidated credit metrics over the next two years, even after incorporating the company’s announced cut to its dividend payments. S&P added that its CreditWatch with negative
implications on SCANA and its sub-sidiaries reflects ongoing uncertainty regarding recovery of V.C. Summer-related costs. S&P said it could lower ratings again if credit metrics weaken beyond those in its base-case sce-nario, which assumes the temporary rate cut is made permanent.
On December 27, S&P upgrad-ed SCANA to BBB+ from BBB due to the anticipated close of the company’s all-stock merger with Dominion Energy Inc. S&P also upgraded SCANA SCE&G subsid-iary to BBB+ from BBB-. S&P said
that the upgrades reflect the higher-rated Dominion’s pending acquisi-tion of SCANA. The Public Service Commission of South Carolina had voted on December 14 to unani-mously approve Dominion’s acqui-sition of SCANA. The merger was completed on January 2, 2019.
FirstEnergyOn August 30, S&P upgraded the
issuer credit rating for FirstEnergy Corp. and its subsidiaries to BBB from BBB- after First Energy filed a settlement agreement in the
Bond Ratings December 31, 2001as rated by Standard & Poor’s
U.S. INVESTOR-OWNED ELECTRIC UTILITIES
A25%
Below BBB-8%
BBB-10%
BBB14%
A- 17%
BBB+26%
Note: Rating applies to utility holding company entity.
Source: Standard & Poor’s, S&P Global Market Intelligence, EEI Finance Department, and company annual reports
Bond Ratings December 31, 2017as rated by Standard & Poor’s
U.S. INVESTOR-OWNED ELECTRIC UTILITIES
A6%
Below BBB-2% BBB-
10%
BBB18%
BBB+35%
A- 29%
Bond Ratings December 31, 2016as rated by Standard & Poor’s
U.S. INVESTOR-OWNED ELECTRIC UTILITIES
A6%
Below BBB-2% BBB-
10%
BBB18%
A- 24%
BBB+40%
Bond Ratings December 31, 2018as rated by Standard & Poor’s
U.S. INVESTOR-OWNED ELECTRIC UTILITIES
A6%
BBB-11%
BBB17%
BBB+38%
A- 28%
CAPITAL MARKETS
74 EEI 2018 FINANCIAL REVIEW
Source: Fitch Ratings, Moody’s, Standard & Poor’s, S&P Global Market Intelligence, and EEI Finance Department.
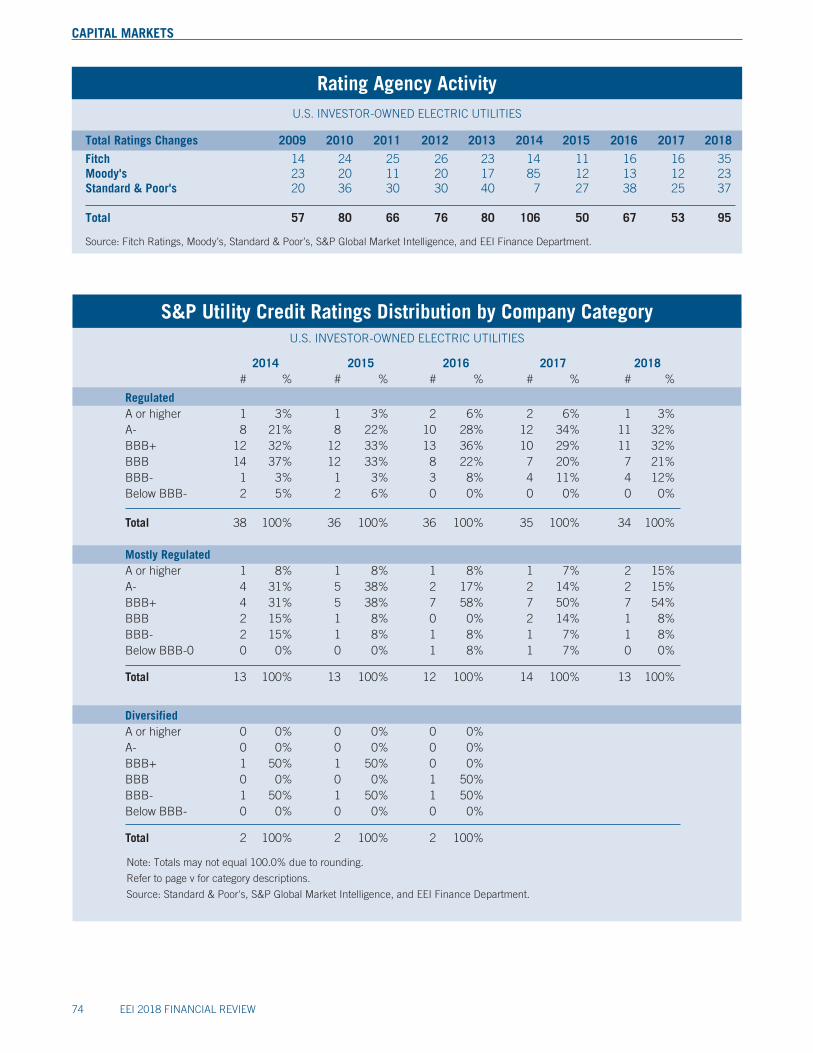
Total Ratings Changes 2009 2010 2011 2012 2013 2014 2015 2016 2017 2018
Fitch 14 24 25 26 23 14 11 16 16 35Moody's 23 20 11 20 17 85 12 13 12 23Standard & Poor's 20 36 30 30 40 7 27 38 25 37
Total 57 80 66 76 80 106 50 67 53 95
U.S. INVESTOR-OWNED ELECTRIC UTILITIES
Rating Agency Activity
S&P Utility Credit Ratings Distribution by Company CategoryU.S. INVESTOR-OWNED ELECTRIC UTILITIES
Note: Totals may not equal 100.0% due to rounding.
Refer to page v for category descriptions.
Source: Standard & Poor's, S&P Global Market Intelligence, and EEI Finance Department.
2014 2015 2016 2017 2018 # % # % # % # % # %
RegulatedA or higher 1 3% 1 3% 2 6% 2 6% 1 3%A- 8 21% 8 22% 10 28% 12 34% 11 32%BBB+ 12 32% 12 33% 13 36% 10 29% 11 32%BBB 14 37% 12 33% 8 22% 7 20% 7 21%BBB- 1 3% 1 3% 3 8% 4 11% 4 12%Below BBB- 2 5% 2 6% 0 0% 0 0% 0 0%
Total 38 100% 36 100% 36 100% 35 100% 34 100%
Mostly RegulatedA or higher 1 8% 1 8% 1 8% 1 7% 2 15%A- 4 31% 5 38% 2 17% 2 14% 2 15%BBB+ 4 31% 5 38% 7 58% 7 50% 7 54%BBB 2 15% 1 8% 0 0% 2 14% 1 8%BBB- 2 15% 1 8% 1 8% 1 7% 1 8%Below BBB-0 0 0% 0 0% 1 8% 1 7% 0 0%
Total 13 100% 13 100% 12 100% 14 100% 13 100%
DiversifiedA or higher 0 0% 0 0% 0 0%A- 0 0% 0 0% 0 0%BBB+ 1 50% 1 50% 0 0%BBB 0 0% 0 0% 1 50%BBB- 1 50% 1 50% 1 50%Below BBB- 0 0% 0 0% 0 0%
Total 2 100% 2 100% 2 100%
CAPITAL MARKETS
EEI 2018 FINANCIAL REVIEW 75
Chapter 11 bankruptcy proceed-ings of FirstEnergy Solutions Corp. The ratings agency said the settle-ment agreement was in line with its base case expectations. S&P also noted FirstEnergy’s stable outlook, which reflected an expectation that the bankruptcy court would approve the settlement and that FirstEnergy would focus on growing its regulated businesses.
Increased Actions by Fitch and Moody’s
Fitch and Moody’s each increased the number of ratings actions in 2018 after three years of relatively low activity. Fitch issued 14 up-grades and 21 downgrades com-pared to 12 and four, respectively, in 2017. The 35 total actions in 2018 compared to 16 in both 2017 and 2016, 11 in 2015 and 14 in 2014. Two prominent developments con-tributed to the increased downgrade activity in 2018: 1) the regulatory uncertainty surrounding wildfire-related cost recovery in California and 2) execution risk associated with the construction of Southern Company’s Vogtle 3 and 4 nuclear units. Successful mergers were cited in three of Fitch’s 2018 upgrades.
Moody’s issued three upgrades and 20 downgrades in 2018 compared to ten upgrades and two downgrades in 2017, five upgrades and 8 down-grades in 2016, and nine upgrades and three downgrades in 2015.
Ratings by Company CategoryThe table S&P Utility Credit
Rating Distribution by Company Category presents the distribution of credit ratings over time by com-pany category (Regulated, Mostly
Regulated and Diversified) for the investor-owned electric utilities. The Diversified category was elimi-nated in 2017 due to its dwindling number of companies. Ratings are based on S&P’s long-term issuer
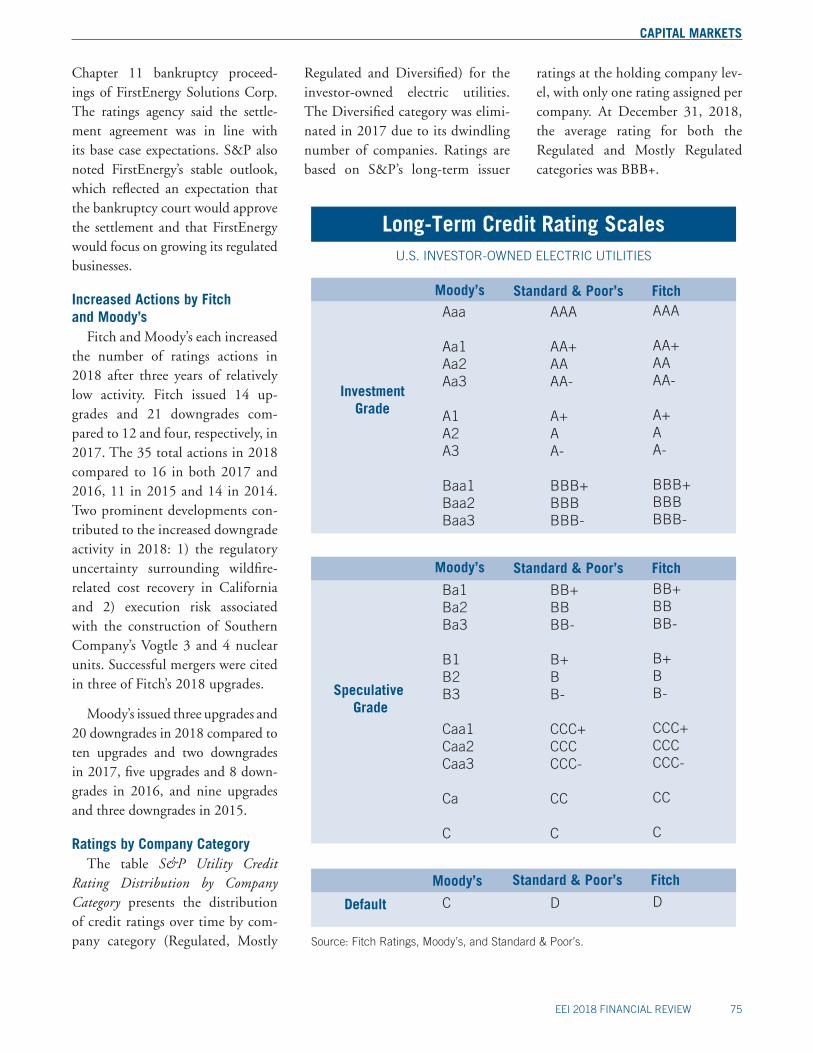
Long-Term Credit Rating ScalesU.S. INVESTOR-OWNED ELECTRIC UTILITIES
Investment Grade
Moody’s Standard & Poor’s FitchAaa
Aa1Aa2Aa3
A1A2A3
Baa1Baa2Baa3
Ba1Ba2Ba3
B1B2B3
Caa1Caa2Caa3
Ca
C
C
Source: Fitch Ratings, Moody’s, and Standard & Poor’s.
Speculative Grade
Default
AAA
AA+AAAA-
A+AA-
BBB+BBBBBB-
BB+BBBB-
B+BB-
CCC+CCCCCC-
CC
C
D
AAA
AA+AAAA-
A+AA-
BBB+BBBBBB-
BB+BBBB-
B+BB-
CCC+CCCCCC-
CC
C
D
Moody’s Standard & Poor’s Fitch
Moody’s Standard & Poor’s Fitch
ratings at the holding company lev-el, with only one rating assigned per company. At December 31, 2018, the average rating for both the Regulated and Mostly Regulated categories was BBB+.